do statistics perform the economy. (didier)
DESCRIPTION
Do Statistics Perform the Economy.TRANSCRIPT
1
Chapter 6 Do Statistics “Perform” the Economy? Emmanuel Didier Version: 7 January 2005 As demonstrated in the other chapters in this book, economics does not simply come down to the observation of economic facts. Quite the opposite, in fact: often it has an effect on the latter; it is the theory itself that produces them. How does this so often observed effect operate? Many authors have given it a name, imported from the pragmatic, Anglo-Saxon theory of language: performativity. Whereas theory is supposed to simply account for the object, it is said to “perform” it. It seems to me, however, that the seduction obviously exerted by this vocabulary is equaled by the problems it raises. While we have indeed been given many examples of that “performativity,” still and all, there is something reminiscent of magic about the idea that a theory is able to influence the facts it supposedly simply describes or explains. It is truly difficult to imagine that we can describe or explain something and transform it at the same time. Moreover, everyday experience teaches us that no matter what we say about an object set before our eyes, even if we yell, whisper, wheedle or give orders, that object will not change by mere dint of our utterances, or else that would be pure magic. While that “performative” link between theory and facts has often been observed, the fact remains: we find it hard to get a clear conception of it. Conversely, short of this mysterious performing, we find plenty of other intermediaries making the link between theory and its objects. For example, we find sheets of paper containing prices (as seen for example in MacKenzie’s chapter), or experimental settings, laboratories and platforms (as seen in Muniesa and Callon’s chapter), or even cyborg fish and quotas (Holm’s chapter), etc. And, in the middle of this whole crowd of intermediaries, there is one that economists use very often, but to which they paradoxically pay little attention, and that is, statistics. Indeed, the concrete form in which the economy itself enters theory is often a statistical series, and similarly, when we want to measure any particular effect (including the effect of theory) on the economy, we often use statistics. Whereas these are by far not always the best mediation between theory and facts, they often are. So before wondering whether the relations between theory and facts takes the form of performing, we may look at the role of statistics in that relationship. In this case, the question turns into: can it be economic statistics that perform their object? Perhaps it is the descriptor (statistics) of that other descriptor (that is, theory), which performs its object? The hypothesis is worth testing.1
1 For a broader insight into social studies of statistics and especially into their role as social actors, see for
example Desrosières (1998), Gigerenzer (1989), or Porter (1995).
2
To do so, we will take the example of the first economic surveys that made use of statistics.2 These were the agricultural statistics produced by the administration of the United States during the first half of the twentieth century. They are the ancestors of present-day random surveys and polls. What makes this example interesting is, clearly, its resistance: if statistics can have effects on fields and crops, when observing it, i.e. on nature, then the argument will be even more convincing than if it had been applied to human beings, who are far more easily influenced than wheat or corn. Furthermore, there is the idea that by looking at one of the earliest instances, the conclusions drawn will remain valid for the later developments in the method; that is, for just about all contemporary economic surveys. Our question, then, is as follows: did the first statistics aimed at describing the agricultural markets “perform” those markets? To Have Effects is Not to Perform In the period between the two world wars, a villain lurked in the USA. He hardly did any harm in the cities, but he preyed constantly on farmers, who were isolated in the middle of their fields and swallowed his line: “You know, mister farmer, he said, yields have been fantastic this year. I just got back from nearby Oklahoma, and I can tell you that I never saw as much corn in the fields. And in fact, prices have dropped catastrophically. But since I’m on your side, I’ll buy yours one cent above the going rate, which is 12 cents a bushel this year.” And they clinched the deal, to the satisfaction of both parties. Until the day when the farmer went to town or had a visit from a city cousin, who said to him: “Well, I guess things are going well this year, with corn at 25 cents a bushel.”3
That loathed character was the speculator, who not only misled farmers and got rich by lying, but committed a much worse offense, according to the Federal administration: he distorted the whole market. By playing on the asymmetric information caused by farmers’ isolation and his own connections, he made it imperfect (on the point of building “perfect” markets, see Garcia’s chapter in this volume). That is why the administration decided to intervene. The potion it developed to destroy the disease of speculation was statistics. First it began to determine the total yield of the main cereals, expressed in bushels, for the year, then to predict the amounts of farm produce that would be on sale at a given date t, and at the end of the harvest period. Later, those series were enriched and accompanied by increasing amounts of
2 This example is withdrawn from my forthcoming book, to be published in French (Didier 2006), where
I show the whole array of interrelations between on the one hand, the theories of statistical sampling and
on the other hand, first agricultural practices, and second unemployment, two seminal objects of
statistical surveys.
3 One bushel = 35.3 liters. It is a measure of capacity for solids. The American bushel differs from the
British bushel, of course.
3
data.4 To combat what it viewed as the ravages of speculation, the administration produced growing more and more statistics. To achieve this end, an agency was set up and put in charge of the job. It was called “Bureau of Agricultural Economics,” what is now the NASS, the “National Agricultural Statistical Service.” Within this agency, one division was specially in charge of statistics, but we are hard put to say which one, simply because it changed names frequently. In 1917 it was called the “Bureau of Crop Estimates”; in 1921 it became the “Division of Crop Estimates”; in 1922 it was called the “Division of Markets and Crop Estimates”; at the end of the period we are studying, it was called the “Division of Crop and Livestock Estimates” (Taylor 1952). To avoid this litany, we will call it “the Division” from now on. The statistics we will be looking at were produced by the Division. How was this remedy supposed to work? According to Leon M. Estabrook (1915, p. 8), who was a very important head of the Division, during the First World War and several years after because of all the technical and technological innovations that took place under his mandate, “the disinterested reports of the Government tend to prevent the circulation of false or misleading reports by speculators who are interested in controlling or manipulating prices.” By making public an objective measurement of farm produce, the administration enormously complicated the job of speculators, who might perhaps be able to continue manipulating demand (which mostly depended on them) but had much more trouble manipulating supply. The administration felt that the most effective weapon against distortion of the markets would be objectivity. Informing the public of the true figures for the national agricultural production would be the most efficient way of purifying and perfecting the markets. But is the relationship between objective figures and pure markets as mechanical as all that? Would objectivity automatically frighten speculators, would it be enough to make them recoil and run away? That was not what the administration, or the farmers themselves, thought. For the government’s action to be effective it would have to be continued by the work of other actors. Let us see how the figures took part in economic relations. First of all, here is how the figures would be useful to farmers, according to the Division:
Farmers are benefited by the Government crop reports both directly and indirectly; directly by being kept informed of crop prospects and prices outside of their own immediate districts, and indirectly, because the disinterested reports of the Government tend to prevent the circulation of false or misleading reports by speculators who are interested in controlling or manipulating prices. (Estabrook 1915, p. 9)
4 In 1933 the Division prided itself on publishing 65,000 estimates and forecasts yearly! (USDA 1933, p.
12)
4
The figures allowed the farmers to keep informed on crop prospects and prices. How could farmers have possibly not known that information before? “Prices in [the farmers’] own local market are influenced, as a rule, more by the condition of the whole crop throughout the State or the United States, and even in foreign countries, than they are by local conditions.” (Estabrook 1915, p. 10) Since prices depended on overall production rather than local conditions, farmers might be too isolated to be informed of those factors. The Division then served as a “center of calculation,” centralizing large amounts of scattered data and transforming them into relevant information for each farmer. Estabrook adds: “In a sense the Bureau of Crop Estimates is a form of farmers’ cooperation.” (1915, p. 9) The figures therefore kept farmers informed of the overall state of crops. But that information only served, if we dare say, to keep farmers informed. Indeed, it did not seem to affect speculation directly. The figures only combated its misdeeds indirectly. How? According to the Division, because its figures made it difficult to circulate other figures: “false information” published by speculators in order to distort the market, “such information as interested speculators and dealers might choose to publish in the newspapers, which might or might not be correct.” (Estabrook 1915, p. 11) The speculators were more organized than the farmers, and above all, they were in a position to “take advantage of fluctuations in market prices,” so that they could publish false figures to manipulate prices. But inasmuch as the Division published “disinterested” figures, it put an end to, or at least prevented the circulation of those fallacious reports.5 The opponents that the administration’s figures were fighting, then, were not men but other figures. But how did they battle? How, concretely, did farmers use the Division’s reports? Figures alone did not seem able to market farm produce any better, in the sense that they were not directly useful to farmers when they sold their produce, because of the complexity of the distribution circuit. The crops were taken from the farm by a haulage contractor, who brought them to a cooperative (the shipper) which did the selling. It was the cooperative, then, that used the government figures, but not necessarily to bargain with purchasers, since there were set market prices and it had no choice but to accept them. The only thing the cooperative could choose was the date on which it would sell, and that was where statistics were useful, for the market price depended on the season (in winter supply is low, so prices are high, whereas in summer, after harvesting, there is plentiful supply, so prices are low) and on expectations as to crop size (prices were higher when large crops were expected and lower in the opposite case).
5 The speculator is a character who has a story of his own. Cronon (1991, p. 127) even dates the existence
of speculators back to around 1850. According to him, they appear at the same time as “cornering”, a
technique that developed during the nineteenth century in the Chicago grain market. To corner a market
is to purchase future contracts on a particular crop and at the same time to buy the entire crop that is
actually put on the market. So that to fulfill his own engagement, the person who has sell the futures is
obliged to buy some grain, virtually at any price, from the same man who has tricked him into the deal.

5
To do a good selling at the right time, the shipper needs a full range of information as to the present and prospective supply situation. This does not cost much money because most of this information can be obtained free from governmental sources. But it does take time. It is a full-time job for any man to digest, analyze and interpret this information. A farmer who did this job well would have no time left for any other work.” (Miller and Shepherd 1933, pp. 76-77)
The figures therefore served to furnish indications to the cooperatives, the only ones with time enough to process the information so as to decide when was the best time to sell. This was how the administration’s objective figures cut speculation short and purified the market. Does that mean they “performed” the economy? They definitely had an effect on the economy, and on speculators in particular, for one thing, since they had a harder time circulating their “false reports” and secondly on the cooperatives when they sold farm produce. Through these two intermediaries, statistics then contributed to shaping crop prices (which were then more favorable to producers) and over and beyond that, although we have not uncovered any indication of this, they probably also influenced farmers’ decisions as to how much of each crop to plant (when they saw that a crop had good chances of bringing in a high price they must have been tempted to grow more of it). So statistics certainly did have effects on farming. But is that any reason to talk about “performativity”? Of course, MacKenzie would argue, because it is exactly a case of what he calls “effective performativity,” so long as statistics have changed something in the course of farming; and it may even be a case of “Barnesian performativity” (but one must admit that this remains to be demonstrated), to the extent that figures were aimed at building a purified market and, indeed, purified the market. But it seems to me that to do so either weakens the term or portrays a rather classical process in an unnecessarily complex fashion. The process we have witnessed here, thanks to a few statisticians, is simply a long causal chain, starting at one point (farming) and acting, step by step, until it finally returns to its point of departure. If statistics did influence farming it is, firstly, because they described it, in the most conventional way, without changing anything, and secondly, because the description acted on all the other actors, in this case the cooperatives and the speculators, who in turn acted on other actors, and so on until the action returned to its starting point, farming. What we witness here is neither a previously unknown relationship between a means of description and the object described, nor anything truly surprising. The surprise is simply due to the fact that we were able to follow its effects for long enough to see how they end up returning to their origin in farming. And even so, we say “their origin in farming” but that is not exactly true, since if Figure 6.1 is correct, farming described on date t only changes at date t+1, at the following harvest, once farmers were able to observe the effects on the market and to react to them. Description, as such, therefore does not change what it describes since it is not that which was described, strictly speaking, that changed. What changes something, in fine, is the long detour. In this case “effective performativity” is a name given to a classical causal chain that ends up acting on a specific object (that is what was initially described) but does not designate any singular process, any specific mechanism.
6
To put it another way, in the words “effective performativity,” the important one is not “performativity” but, indeed, “effective.” What we have discovered is only that statistical description can have an effect on the realities that it is describing. Statistics are an actor, amongst thousands of others, in the world of agriculture. They do not have this lightness, this “in the air” characteristic that they may have claim to have. Statistics have, like farmers, mud on their boots, and they act on the state of the farms. This is the great discovery that the word “performativity” has allowed us to make. But why call this effect “performative” rather than simply “having an effect”? It seems to me that, at this point, the argument is not clear.
Nevertheless, if we are to built on this notion, it seems to me that we must
keep in mind this most crucial and important idea of performativity: it points to cases where describing is a specific process, a specific kind of transformation of the object described. Once we first have noticed the similarities between descriptions and facts that allow them both equally to act one on the other, we must go one step further and try to find in what way it is possible that description and theories regain a new specificity, a new specific way of acting on facts, a sense were the very meaning of “acting,” and conversely of “describing” would be intertwined and renewed. Statistics do not act like any other entity; they do act, but in a specific way, and this is what we must now find. If “performing” is to be anything more than a simple shortcut in a classical causal chain, we should be able to see the specificity of statistics in the act of changing something at the same time as they describe it. So we are going to dig deeper into the surveys done by the U.S. agricultural statisticians in the inter-war period, to scrutinize the way they go about describing, and consider whether that description itself might be called a “performation” of its object.
What is the Action of Describing ? - Three Examples of Statistical Surveys Agricultural surveys in the USA during the inter-war period were huge machines that had to centralize, in Washington DC, data coming from places as far apart as Arctic Alaska and tropical Florida, transmitted by actors thousands of miles apart and living in different time zones. All those data had to converge on the capital as of a set deadline, and in a form allowing for comparison between them. It took an enormous amount of energy, then, to collect such information, scattered over such a huge area, within a limited period of time.
The organization designed to accomplish this was state-based. In each state there was a government worker,6 whom we will call the Statistician, whose job it was to extract the information from the fields and to put it into a form compatible with the demands made by Washington, where the findings from the different states were
6 In the smaller East-coast states, a single statistician was in charge of several states. There were therefore
41 Statisticians in all.

7
aggregated. We have no room here to give a complete description of the long statistical chain reaching from a small Arizona ranch painfully growing a few tomatoes down to the publication of the final results for the entire country, put together in the capital. Although every link in that long chain was absolutely necessary to the final aggregation, the whole would be much too long. We will therefore confine ourselves to three zooms, on three points exemplifying the operation of collecting and formulating information, which will enable us to determine whether they simultaneously occasioned a transformation of farming.
1. Birth of a Survey In the late 1920s, Verne H. Church, then Michigan’s Statistician, noticed that one crop, overlooked in his agency’s surveys, actually was very important in his state. That crop was… pickles. True, the very name of the vegetable made it laughable; true, it is not a particularly noble food, but still and all, is that any reason to ignore it? Were the poor pickles so ridiculous that they weren’t even worth counting? That was what the Division suggested, since it never mentioned them, but Michigan’s farmers seemed to disagree, since they went on growing them. Church ended up siding with the farmers and resolved to give them numerical recognition. Listen to him telling how a creature gains statistical existence:
During my early travels I also noted the large number of towns and villages, particularly in the central and northern parts of the state, that had a pickle-station. I began making inquiries of managers of plants which maintained one or more offices within the state. Some of them supplied me with acreage and production data on cucumbers for pickles; others referred me to their head offices in other states. I wrote to a few of the larger ones and obtained the data I asked for, but there were many lesser companies and I needed a circular letter and questionnaires, for which I had no printing facilities. Michigan produces the bulk of the nation’s salt requirements, and I happened to meet a salesman for one of the salt companies in the course of my travels who supplied me with a complete list of pickle manufacturers. I prepared a circular letter together with the questions concerning needed data, sent them to Washington, and asked that 50 or 60 copies be mimeographed. The reply I received from Washington was to the effect that the crop was considered too minor to bother with. This embarrassed me considerably as I had promised the firms contacted that I would supply them with a report of my findings. I immediately wrote to Washington again, outlined what I had done, the promises I had made, and stated that I had already collected 25, 000 acres. I pointed out that, unless the survey was completed, I had wasted considerable time; and I dropped the hint that I would like to know how many acres were required to give a crop recognition. I then concluded the letter with: “Please forward the letters and blanks as previously requested.”
8
They arrived within a few days and within a short time the survey was completed. I showed that the state raised 40, 000 acres for pickles that year, more than any other state, more than all other states combined, as determined the following year from a Nation-wide survey instituted by the Washington office. (Church 1943, p. 12)
Church begins by emphasizing the fact that a Statistician’s job is to go out in the field to pick up information. During his travels he noticed that pickles seemed to be a major crop although the Division took no notice of them. He then sought to obtain legitimacy for a new creature, the countable pickle; he wanted to prove that that entity was worth existing. The demonstration went through three phases: first he made a preliminary investigation, then he turned to Washington, and last, he did the actual survey. During the preliminary investigation described in the first paragraph he contacted his state’s pickles in every possible fashion: by observing towns and villages, writing letters to plant managers, making an unexpected acquaintance (his travels enabled him to make providential encounters; luck, or something of the sort, therefore seemed to play a major role in his work). Each of his contacts reflected some “pickleness” in one form or another: “acreage and production data,” “complete list of pickle manufacturers,” etc. This showed that there was something worth investigating, but that thing showed up in very dissimilar forms, making it impossible to count.
During that period, Michigan hardly existed at all. Since Church was looking for people who could send him pickles in any form, he sought out definite locations, factories or salt salesmen, anything that concentrated information about pickles. Consequently, he hardly cared whether the informers were in his state or not. As soon as they mentioned pickles he was interested. Michigan did subsist, however, since Church continued to see “towns and villages… of the state,” to look for managers who maintained “one or more offices within the state,” and when the “head office” was “in other states” that was worth mentioning, negatively that is, for Michigan’s borders were still a reference. We do not hear much about the state of Michigan, because Church was simply collecting worthy informers, but it existed as the borders of a whole that did or did not contain those points. The geographical picture drawn by this account (see Figure 6.2) was that of a set containing objects whose nature varied enormously.
The second part of Church’s investigation is recounted in the second paragraph. It contains, for one thing, the points mentioned above, especially the “companies,” and for another, Washington. What goes on in Washington? Why turn to that particular place? Because there was a mimeographing machine there. Now, the words “printing facilities” are followed by the words “crop,” “survey” and “acres,” in particular. The fact of being able to produce identical questionnaires led to a change of vocabulary, moving from the diversity of field work to statistics and their stable categories. In Washington, questionnaires could be printed, all identical and in large numbers, making it possible to establish statistics. Identical reproduction was therefore the first step, so to speak, after which we may speak of statistics. But Washington and the Statistician disagreed. Church and Washington clashed over the issue of costs. According to Washington, mimeographing cost too much and
9
was not worthwhile, whereas Church pointed out that it would be even more costly not to complete the job. To solve the conflict, Church showed that he could already do some counting, using the set drawn above, and this gave him arguments to advance in the conflict, by stating that he had “already 25,000 acres” of pickles in Michigan and that the crop was therefore an important one. He therefore needed the mimeographed copies so as to be more than approximate, to “complete the survey,” which is to say to erase the “already” in the expression “already 25,000 acres.” Washington, then, was the place where surveys were standardized, in the simplest of ways, thanks to the mimeograph machine. But that standardization had a price, and it took some bargaining to show that the advantages were greater than the cost: that is, for the State to appear. The state (of Michigan) only came on the scene, then, inasmuch as it was worthy of attention, and this evaluation caused a dispute. The last step that brought countable-pickles into the public eye was a brief one, for Church then did the actual survey. Since that was the first time it was done, it consisted of changing the various pieces of information, all different in size and shape, into stable and standardized responses on questionnaires. This brought the state as such into the limelight, since it planted 40,000 acres of pickles. //suppress figure 6.2// My quotation from Church shows the genealogy of an agricultural survey; that is, how a crop was definitively transformed into statistics. Three phases may be seen. The first involved travels, which sorted out the important and unimportant elements, the second involved expertise, in this case a discussion with Washington leading to standardization, and the third the concrete achievement of the survey of which little is said here. During these three phases, innumerable entities, including pickle producers, letters, a list of manufacturers, the mimeographing machine in Washington DC, etc. were put together in that peculiar way described by Church, which consists of listing informers so that they will all fill in a same questionnaire. One feels how every word in this sentence was the outcome of an inventive effort. For Church, “to list” is evocative of the chance encounter with the right person in a train, “informer” suggests contacting people in distant places and winning their trust, “questionnaire” has to do with writing that introductory letter and developing relevant questions, “the same” refers to the discussion with Washington D.C., and so on. The building of this new statistical object therefore means isolating repetitions (listings, questionnaires, etc.) in what appeared initially as immensely diverse. The way he constructed a whole out of these elements enabled him to ooze out, to give birth to a new kind of pickle, the Michigan Pickle, which is a countable plant with a spatial location, as opposed to other pickles, which have many attributes, but not those. The survey itself therefore did not leave agriculture totally unchanged, it gave the initial pickle an additional quality, that of being repeatable, in other words countable. But to understand how it did that, we must go into greater detail about the part Church describes least, the survey itself, and the interactions between the Statistician and the respondents. 2. Questioning
10
One of the first difficulties encountered by pre-World-War-Two agricultural surveys resided in the reluctance of most farmers to give information to investigators, for they rarely understood why federal agents should be allowed to interfere in their business. This reluctance was so strong that the Division decided to get around it by drawing up a list of people who would serve as informers, the same from one survey to another. That way people would only have to be persuaded once and for all of the need to respond, after which they would entertain a stable, trusting relationship with the Division. They received the questionnaires by mail, filled them in and sent them back to their state Statistician before the deadline. To thank them for their efforts, they also received a monthly newsletter entitled Crops and Markets, which informed them on the prospects for the farm market, as well as Christmas greetings: in short, they were the Division’s darlings. We will refer to them as the Correspondents, rather than respondents (a rather anachronistic designation, in point of fact), to emphasize the lasting relation between the bureau of statistics and its informers, as well as the fact that the ties between them were essentially postal. To understand how the Division questioned its Correspondents, let us take a look at the broader case of crop surveys, the only ones extant at first, and which have remained the largest (and most strategic). All of the questionnaires certainly did not fall into that group, for there were also surveys on cattle-raising, or on homestead finances. But for the sake of clarity, I prefer to concentrate on one emblematic case rather than dealing with numerous different examples. In the crop surveys, then, the questions put to correspondents pertained to the acreage cultivated and the yield per acre. By multiplying one by the other, the volume of production could be calculated (if the yield per acre, expressed in volume, is multiplied by the number of acres cultivated, we have the volume produced). The question was how to formulate the questions so that they would be properly understood by Correspondents. To estimate the acreage cultivated, the Division first encountered what we would venture to call an anthropological difficulty. Indeed, according to a number of studies it claimed to have conducted on people in general, it had reached the conclusion that it is hard to give estimates in absolute figures, whereas it is easier to give percentages (Becker 1928). In other words, when asked to say how many acres of wheat he had planted (the acre being the current farming unit at the time), the Correspondent tended to give a rather imprecise answer, whereas when asked to compare his observations to others, he was more precise. This led the Division to ask its Correspondents what percentage of the acreage they had planted with a given cereal the previous year had been devoted to the same crop this year. For example, the Correspondent was supposed to say things like: 80 percent of the land planted in wheat last year was planted in wheat this year. So by the very formulation of its questions, the Division helped its correspondents to be objective, to give the best possible responses. This of course demanded that it find a method for transforming those percentages of variation into absolute figures (which it did, using the census). But this system enabled it to obtain a good estimate of the acreage devoted to each crop each year. What about the yield per acre? How did the Division go about estimating it? It used a variable we would find surprising nowadays, called the condition of growth of plants. That condition functioned as an indicator of per-acre productivity. For example, if the weather had been very fair throughout the growing season and farmers had sufficient reserves to be able to water their crops properly, an acre may be said to
11
have produced under favorable conditions and to have given a full yield. In the opposite case its condition was bad and so was the yield. The condition therefore indicated the productivity of the land. Like the acre, and in accordance with the above-mentioned studies, it too had to be expressed as a percentage of variation, but as opposed to acreage, the condition of the present year was not compared to the past year. The condition was defined as a percentage of the “normal” condition of growth of a crop. This notion of a “normal condition” was highly problematic, and elicited numerous justifications, explanations and criticisms, although it actually was in use. Let us dwell for a moment on its definition, as found on the questionnaires sent to the Correspondents.
1 - The condition of the crops on the date indicated for mailing the schedule is not a comparison with a condition at any former period, but with a normal condition of growth and vitality such as would be expected at this time in a crop starting out under favorable condition and not subjected afterwards to unfavorable weather, insects pests or other injurious agencies. If condition is asked for any crop that has already been harvested, give condition at time of harvest. 2 - In estimating condition of crops in comparison with a normal condition of growth and vitality giving promise of full yield per acre, 100 is the basis ; if nine-tenth of a (normal) yield per acre are indicated by the present condition, the answer should be filled in as 90 ; if one-tenth, or 10 per cent, more than a normal yield per acre is indicated, the answer should be reported as 110, etc.7
The normal condition, then, was the condition of growth of a plant that had not been affected by any unfavorable external factor; it was the condition of growth in which it had not been subjected to any insect pests, in which the weather had been good and the farmer had given it the best possible care, so that it had reached its full yield. If the Correspondents observed such conditions, that is, if the plants had not suffered any aggression, they were to report a condition of 100 percent. The normal condition, then, was one in which the plant had developed without encountering any particular fortune or misfortune. As opposed to acreage, the condition of growth was not compared to the past but to some timeless norm, then. This represented an additional difficulty, since Correspondents had to be persuaded to resist the reflex consisting of considering exceptional years as the norm (as they tended to do, since their exceptional nature made them memorable), but it had the advantage of simplifying the work of the Division for the transition from percentage to absolute value (which, again, was done using the last census, and a method called the “par”). Be this as it may, questions about condition and acreage differed as to the type of norm to which Correspondents were asked to compare them, but they shared the fact of being formulated in terms of percentages. This type of questioning thereby enabled the Division and its informers to produce
7 RG 83, entry 75, December 1923 schedule, US National Archives.
12
high-quality estimates. The information sent by the Correspondents to the Division contained two percentages, then: one for the acreage planted as compared to the past year’s acreage, and the other the condition of growth as compared to the normal condition (see Figure 6.3).
In conclusion, we would stress the fact that both of these pieces of information are the outcome of a great many composite elements. What elements? There is, for instance, the “theory” according to which Correspondents estimate percentages more accurately than absolute figures; the mountains of letters thanks to which the Division maintained a trusting relationship with its Correspondents; the strange norm known as the “normal condition” of growth of crops. Before the survey, all of those elements were separate, with no necessary relationship between them. Thanks to the survey, the list of Correspondents was drawn up, the Division wrote its instructions and sent them the questionnaire; the Correspondent did his own investigation and translated his findings into figures. So that in the end, all of those elements, taken together, were transformed into a single little percentage, put on the questionnaire. The survey collected all of the abovementioned elements and composed them into a single little figure written by the Correspondent in the proper box. That figure therefore summarized and contained that multitude of elements, statistically. Therefore, surveying is not only a problem of isolating repetitions, as we have seen previously, but also of composing a great lot of diverse elements. But in itself, the percentage in a box was still only a tiny element, applying to a ridiculously small piece of land. It then had to be made available for aggregation at a higher level, and that is why the Correspondents had to mail their questionnaires to their state Statistician, who received a number of them. Let us see what the latter did with them. 3. Adding Up The state Statistician’s job had at least two complementary aspects. First of all, he had to pace up and down his state, as we have already seen Church do; that is, to travel around it and measure it. In his travels he might discover new crops (a very rare occurrence), but above all he had to meet farmers to try to put them on the list of Correspondents, and at the same time build up his own intimate, personal knowledge of farming in his state. Before harnessing himself to the second part of his job, which entailed processing the questionnaires so as to send the main information to Washington, that intimate expertise enabled him to assess the quality of the answers he was processing and if necessary to “rectify” any answers that seemed absolutely improbable. Following that rectification, he calculated averages for each county and district, then sent them to Washington. We will now zoom in on that part of the statistician’s work that may seem the least interesting, the most mechanical; that is, the calculation of averages. A priori, there is nothing more mechanical than an average: all one has to do is add up the findings and divide the sum by their number.8 Everyone knows that. But concretely, is it so easy
8 Take n individuals i who each report the figure Yi. The average of these reported figures is:
13
to do? Has the reader already tried to take a hundred or so loose sheets of paper (that is just about how many questionnaires the Statistician received for each farm district), retain only one of the many columns on it and add up the figures in that column without ever repeating or overlooking any entry? Well, it is not that easy. It was in fact so difficult that the Statisticians originally had the habit of copying the columns of figures onto a single sheet before adding them up. But there again, what a waste of time, and above all, what a source of errors! There is nothing that puts you to sleep more easily than copying a hundred or so whole numbers, most of which are between 70 and 110; nothing easier than to forget one, or to put another one down twice, not to speak of some other less foreseeable risks such as an office door opened unexpectedly, causing a tremendous breeze that sends a whole pile of questionnaires flying, so you have to start all over again. Even if the equation is simple, calculating the average for a good hundred questionnaires is anything but self-evident, concretely speaking. For that reason, a very ingenious technique was developed to solve all those problems. As Church tells us:
I quickly learned that the unusual arrangement of the questions and spaces for answers at the bottom was to facilitate the “shingling” for adding. […] The schedules were sorted by crop-reporting districts and “shingled,” one district at a time, without reference to counties within the districts. […] A blank schedule was placed at the bottom on which the number of reports, sums and averages for each item were entered. (Church 1943, p. 6)
The aggregation of answers into an average began with the material sorting of questionnaires (“schedules”) by districts. The statistician did not begin by doing adding, but by organizing the questionnaires by means of the invention called “shingling.” To understand shingling, it must be said that most questionnaires had a strange shape. They were long and narrow, like a strip of paper, and the boxes in which correspondents had to write their data were at the very bottom, all lined up, with the questions just above the little boxes for the answers (see Figure 6.4). Shingling consisted of taking all of the questionnaires from a district and having them overlap, shingle-like, horizontally, so that only the figures were visible. A blank schedule was placed below the last questionnaire. Then, using a long wooden ruler that looked something like a skirt-hanger (except that it was over 30 inches long) the Statistician solidly pegged the whole lot of schedules together. Thanks to this shingling device, a large number of questionnaires could be held together in a very stable fashion (see Figure 6.5).
M =1n
Yii=1
n
∑.
14
The calculations could then be done directly, without having to copy the schedules, and with no risk of overlooking or repeating any items.9 The sums and the number of Correspondents having answered the question were recorded directly in the boxes of the blank questionnaire placed under the others. It was very easy, then, to calculate the average: one had just to divide one figure by the other. The first step in calculating, then, involved putting the questionnaires in order, concretely. They had first to be grouped by geographic units, then placed along a stick which arranged them in that very peculiar way, after which the calculation simply finished the aggregation by replacing that cumbersome bunch of schedules by a single figure, and the Statistician was assured that it definitely contained each and every questionnaire, once and only once for each of them. Calculating the average, then, was an operation consisting, firstly, of stabilizing scattered elements, finding a certain lasting relationship between them, and on the basis of that relationship, evidencing a new feature for the initial elements. Before shingling, the questionnaires spoke about their vicinity; once they were all put together in that special shingling relationship they began speaking, for a long time, about their district (the average for their district). Thus, slowly but surely, some elements of the state were jelling, so to speak. By then, shingling had already produced districts. 4. Conclusion: Statistics Characterize as they Describe We have just followed three phases by which the survey describes agriculture, we have seen how the survey is born, how Correspondents are questioned, and how averages are calculated. In themselves, these three steps are far from sufficient to produce the ultimate figures. We have left a great deal of the Statisticians’ work unmentioned, and above all, we have not said a word about what goes on in the central offices in Washington, which would require a whole paper in itself. Yet all of those phases, those about which we have said nothing as well as those we have described, are equally necessary to produce figures that are valid for U.S. agriculture as a whole. Overall figures are produced by a multitude of small steps, all as spectacular (or as unspectacular) as those we have just studied. These three steps have at least shown us that description does not leave its object unchanged. In the first example the statistician began by collecting information of all sorts on pickles: here addresses of manufacturers, there figures on crop acreage, elsewhere yields per acre. By dint of a hard-fought struggle he managed to add another item to the list: a mimeographed questionnaire. From then on a definite relationship was established between all of those elements (they were all information needed to fill in the questionnaire), thanks to which a new characteristic appeared: the total amount of pickles in Michigan on date t. The initial elements had been fitted together in a singular fashion, and from that peculiar set a new feature of the pickle was
9 I was shown the thing by Richard Allen who is nowadays Deputy Administrator for Programs and
Products at the NASS, today’s name of the Division. His office contains not only some rare archives, but
also a little museum of the most inventive objects in the history of agricultural statistics.
15
extracted: the “sameness” of all the – initially – different pickles, which equates to the fact that it could be exhaustively counted. Without the statistician’s descriptive activity pickles would not have had that property. It truly was description that evidenced it, and therefore changed pickles, to some extent. Let us skip the second example, to which we will return very shortly, and go on to the third, when the Statistician returned to his office and found himself with a collection of questionnaires and a stick. The schedules were then pegged together (that was their specific relation during that phase), so that the questionnaire was now not only linked to the vicinity of the particular Correspondent who had filled it in, but came to be definitely linked to the entire County from which it was taken. Once attached to all the other questionnaires in the specific way described above, its “part of a county” attribute was actualized, whereas until then it was simply a “piece of information about a district,” which is not the same thing. Before pegging, the Statistician had no proper way of moving from a particular area to a whole county; after pegging, the sum could be calculated, making the shift possible. The original elements were therefore articulated in a peculiar way, and through that articulation, which is nothing but a description, a new property of the whole comes into being, appears. It seems to us that these examples clearly show that the tool normally used to describe reality does have an effect on that reality, in fine. The three slightly different actions of extracting repetitions, composing elements and stabilizing compositions, can all three be summarized in a single one: the production of new properties such as the “Michigan pickle,” the normal condition or the County average. Rather than observing its object from afar, the way an astronaut observes the Earth, statistics takes hold of it and transforms it, produces it afresh, to grasp it according to a process that definitely resembles the mechanism discovered by Austin: when the mayor of a town says “I pronounce you man and wife” to a solemnly clad couple he is not describing the situation as much as accomplishing an act by which the attribution “married couple” is produced. The statistical transformations described here seem rather minute, especially in comparison with a commitment such as marriage. Is it as important for pickles to be countable as it is for a couple of lovebirds to be married? Does having a norm really change something for the condition? Does belonging to a county really affect questionnaires? No, they do not seem to be; they are apparently only small differences. But these transformations are not isolated: they are part of a series of articulations occurring all along the statistical survey which, we must remember, was much more extensive than the three examples we have discussed. Throughout the survey that brought Arizona dust to the federal buildings in Washington DC, those little changes were aggregated, and that was what ended up making one big transformation. This is best illustrated by the fact that before farming statistics, the only complete counting process extant in the USA was the census, such a tremendous operation that it could only be conducted once every five years.10 The statistics we are studying here, on the other hand, produced a country that could be totally counted (the total production
10 The population census was done every ten years, but from 1920 on there was an additional agricultural
census at the midpoint (Anderson 1988).
16
of the main cereal crops and the main livestock bred) more than once a year. This change of pace, with its essential economic consequences, is far from negligible. Statistics transformed all of U.S. agriculture, making it countable several times a year, which was not the case previously. In our opinion a transformation affecting the whole of that gigantic nation is important, perhaps as important as the thousands of marriages celebrated there every year. So farming was no longer the same once it had been “formulated” by statistics (we should say “counted” by statistics), and in that sense, one might say that statistical description seem to be “performative.” But is this formulation the best ? Does it hold ?
Performing or Expressing?
The notion of “performativity” had the advantage of enabling us to reverse the usual view according to which statistical description is a simple elaboration based on facts, a consequence of them, showing us that to the contrary, it may also affect the facts which it supposedly simply reports, according to the usual viewpoint. Statistics may be constructed explicitly to change the economy in which they participate, and they also have that more unnoticed property of characterizing the objects they seize. But having confirmed this refreshing, exciting virtue, shouldn’t we stop for a moment to take another look at its meaning and further consequences? For it is a fact that the notion of “performativity” also carries other implicit meanings that must be brought to light so that we will not be disappointed before reaching our goal. Having tickled our palate with the most exquisite game, is performativity serving us some poison for dessert? Has it slipped some rotten ingredient into the dish? In addition to the effects of the descriptor, it raises two related problems, in particular. The first has to do with the role played by language. Indeed, the notion of performativity comes from studies focusing primarily on language. Now, while statistics are also language, the examples given above clearly show that they are definitely not only language, and no doubt not primarily language. Doesn’t the fact of applying an essentially language-related notion to an activity of a different nature entail some difficulties? The second problem has to do with its relation to pure creation of reality, comparable to the near-magic effect of baptism or marriage, where it is the words “I baptize you” or “I pronounce you man and wife” that create a new status for the individuals involved (even if those words need a set of “conditions of felicity” to be effective, as already said at length previously, for example in MacKenzie’s chapter, it is still the words, and not the conditions, that create a new situation). Thus, the question is: can that creative power of language be extended to statistics? Following a discussion of these two problems, we will take stock, so to speak, of performativity and draw up a list of elements on the debit and credit sides. If the former win out, we will have to wonder whether another concept would not be more appropriate than performativity for elucidating the effects of statistics. 1. Is Language the only factor at work in Statistical Descriptions?
17
According to Austin, performativity is an effect of language on the reality it describes. When sociologists of science extended the notion to their objects, the parallel was acceptable inasmuch as theory replaced language, and the economy stood in the stead of any reality. The language of theory was thus supposed to act on economic facts. But are we sure that theory is clearly language and language only? Further, while language is definitely a constituent part of it to say the least, is it, or something else, the active component? This is a real question, for if it is not language that acts within theory, then we would have to go back to wondering whether the term “performativity” appropriately designates the effects of theory. We will not venture to answer the question of whether the theoretical language of economics is capable of shaping economic facts themselves, on its own strength, but let’s first make the obvious clear, what we certainly do know is that the language of statistics, all by itself, is unable to control the objective facts it is supposed to report. For example, the instructions on the questionnaire pertaining to the growing condition and the normal condition, all by themselves, hardly enabled statisticians to prevent rain from falling, to make the sun shine or stop pests from attacking wheat in the fields. In no case could the “condition” such as described in the questionnaire control the real conditions of growth of plants; in other words, have effects on the sun or the rain! We would commit the same error as those poor early twentieth century statisticians who were so ignorant about and scornful of witch doctors, if we imagined them with the same hypothetical powers! No, no, it is impossible. Language, all by itself, cannot have given them control over the facts it describes, and above all, not over the weather, or else it is purely and simply doing magic. Advocates of performativity, no doubt noting the oddities that the opposite position would entail, have refined the arguments, limiting the list of facts susceptible of being changed by theoretical language to some much less “physical” and “external” elements than insect pests, rain or fair weather. They restrict it to “social” facts sufficiently close to humans and their consciousness for language to affect them directly. Some objects susceptible of being performed were, for instance, the “legitimacy” of an actor, an instrument or a commodity, or the way an item is priced.11 The mechanism involved might be that by dint of theorization, those things had finally been universally acknowledged, meaning that the arguments advanced by economic theory had ended up changing the legitimacy of the derivative products because they were able to change the actors’ perception of them. This kind of argument seems more acceptable than the previous one. It is easier to show that language affects “humanoid” facts (if the reader pardons the expression), that is, close to human-made things and to human consciousness, than other, completely “natural” facts. The same is true in statistics. For instance, the instructions on the questionnaire, explaining what a “normal condition” is, certainly affected the way Correspondents reported them. That was in fact why they were written and continued to be put on the questionnaires: their aim was to clarify the difference between an optimal condition and a normal condition (which is less good), and they really did increase the percentages
11 These two examples are taken from MacKenzie and Millo (2003, pp. 107-137).
18
reported by Correspondents. As a rule, instructions represent another archetype of “illocutionary” acts as identified by Austin. In statistics, as elsewhere, the simple fact of formulating them has effects on human behavior (irrespective of whether people follow them or try to take their distances from them). The problem raised by restricting the effects of performing to human representations alone is that it tends to transform the latter too easily into lies and sly tricks. And this is exactly the furrow that Daniel Miller – who attacked Callon when the latter came up with his Laws of the Markets, and who is so caustically criticized by Holm in his chapter in this volume - has ploughed.12
Miller writes in his paper concluding his discussion with Callon: “The premise of my paper on virtualism is that we live in a period of history where we can see the increasing ability of certain powerful discourses, including that of economists, to realize themselves as models in the world through their increasing control over that world. That is their increasing ability to be performative” (Miller 2005, p. 2). This citation shows clearly that Miller is not against “performativity” in itself, quite on the contrary. Why? Because he can understand it as a motto for his “priest” model (later in his paper, Miller compares economists to priests) which can be summarized like this: “powerful discourses” of economists and economics can “control the world” (at this point, “the world” is reduced to its representations), and “realize” themselves in the “world” (which, this time, is the real and material one). These discourses are initially lies, but they have the power of coming to be true, by manipulating and controlling the action of people. In other words, once he asserts, firstly, that language will never change things themselves, and secondly that it may, on the other hand, influence the way people relate to those things (the way they report, describe or comment on them – Miller speaks about “faith”), he almost unavoidably concludes that representations can be manipulated, initially betraying things which remain stable and then, through faith, make people change the world according to this lie. Consequently, statistics (if Miller had taken them into account), through the influence they exert, would be accused of creating a deceitful hiatus between humans and things and then changing the world according to their models. Performativity, then, would be almost necessarily fraudulent, which is certainly terribly restrictive for a theory of the production of knowledge. This critique of a fundamental lie of statistics comes not only from scholars; actors themselves, too, may formulate it (and the actors who formulate it are not always the poor or the orphans). For example, speculators accused the statisticians of asking their questions in terms of “normal condition” rather than of “optimal condition,” since that formulation would tend to have them underestimate the crop condition, which is to say to have them underestimate the final output, which is good for growers (again: lower production means higher prices). The charge, then, was that the formulation of the question put a bias on the figures in the sole interest of one of the parties involved, independently of the amounts really produced.
12 For a brief presentation of Miller’s position on performativity, see Miller (1998 & 2003)
19
Yet when our statisticians wrote up their instructions, they were not so much intent on manipulating their Correspondents as in having them participate, in turn, in the production of “normalcy” itself, that new property of the condition. If the questionnaire influenced the Correspondents, it was to get the latter to participate to the best of their ability, and with the whole statistical apparatus, in the production of that important entity, the norm, with which erratic conditions might be compared. The statistical survey did not confine itself to influencing the Correspondents, it also acted on the condition itself. It was the Condition itself that acquired a new attribute, not the behavior of Correspondents. However, it did so through two procedures, which differ from the model of the witch doctor, or of the priest (according to Miller). Firstly, instead of trying to control the condition, the statistic characterized it, which is very different. It made no attempt to have more or less rain fall; it showed that there definitely was a characteristic of the condition which was the “normal condition.” These two activities, controlling and characterizing, were so different that the characteristic uncovered by the statistic actually had the property of not being controllable. The best proof of this is that Correspondents might mistakenly report their condition, and that the Statistician, before doing any calculations, had to “edit” the answers; that is, he had to rectify or eliminate those that were insufficiently consistent with the intimate knowledge of the area he had gleaned during his travels. If Correspondents could make mistakes, then the normal condition did not depend on their say, on their answer alone. To the contrary, in order for the characteristic “normal condition” to be properly produced, it had to have the opposite property of resisting the possible errors of Correspondents. The language of the instructions, in statistics, therefore performed some behavior in respondents, so as to have them participate in the production of the characteristics studied, which is different from controlling them. One of the main differences between controlling and characterizing is that Statisticians did not know in advance what the outcome of this characterization would be: in other words, it escaped them. A good example of this is the average condition, calculated by the Statistician. Before doing all the operations, he did not know what that average would be, since he had to calculate it. He only discovered it at the end of his efforts. He therefore did not control what that average would be since he had to calculate it to make it exist. Yet by calculating it he definitely characterized it, since he was able to say something like “this month the condition was 78 percent of the normal condition,” which is certainly a characterization. Statisticians were often surprised by the things they characterized, and this prevented them from controlling them. Secondly, although it seemed clear that the instructions (and therefore language) were necessary to the evidencing of that absolutely essential characteristic of the “normal condition” of growth, it was just as obvious that they were not sufficient. Indeed, the normal condition was a characteristic of the condition, which, like every other variable, only appeared at the end of a process comparable to the one narrated by Church for his pickles. That is, all sorts of information had to be gathered about the condition, then a questionnaire, ultimately mimeographed, had to be constructed, after which all of the information contained in the questionnaire had to be assembled, etc. Next, to construct the condition and the normal condition, averages had to be calculated, first for counties, then for states. As we have seen, this phase demanded
20
some very special questionnaires, with empty boxes for the answers on the bottom, under the designation of the crop involved, and it also required the famous shingling stick thanks to which the figures could be added up. In short, we need not list them all, clearly a great many things – and not only language – are needed to make that normal condition appear, and to give it consistency. For while it is clear that instructions are language, it is harder to say that about the little boxes at the bottom of a piece of paper, and harder still for a simple stick, paper or a mimeographing machine. To give body to the normal condition, which is one characteristic of the growing condition of plants, language was needed, but necessarily attended by all sorts of other statistical tools which, taken together, uncovered the characteristics of the objects they described. Language is therefore by far not the only element acting on the object of the description. Many other elements participate, and that is in fact what gives the condition and the normal condition their solid, natural, “objective” quality. Statistical objects are characterized by a whole set of elements, within which language has a place, but which is not by any means the only component. We therefore view performativity as one effect of statistics, primarily because the latter work with instructions, which are archetypal illocutionary acts. However, this effect itself seems to be only one element in the much broader whole through which statistics characterize their objects. Performativity is only one contributive element in characterization. Now, to take the part for the whole, metonymically, seems out of place here because the problem of the manipulation of actors would inevitably arise then. Indeed, by saying that statistics “perform,” there is a risk that we infer that they are a language controlling actors rather than things, which would make them deceitful and moreover, would not conform with what we have observed. As soon as you say “performativity,” you can be sure that a Miller will come out, even though you would prefer him not to, because of the linguistic ancestry of the notion. The role of language in the effects of statistics therefore raises this problem which makes a first dent in the idea that statistics may “perform” their object. We shall now see that performativity raises a second problem for statistics.
2. Is Statistical Description a Creation?
Another error to which the use of “performativity” gives rise is less apparent in this book than in earlier work on the notion. The notion of “performativity” pushes authors wrongly to take what is a mere transformation for a pure creation. For example, speaking about economic performativity, and explaining the position of Callon, MacKenzie wrote with Millo: “Economics does not describe an existing external ‘economy,’ but brings that economy into being: economics performs the economy, creating the phenomena it describes.” (2003, p. 108). According to MacKenzie and Millo, theory clearly comes first, as if it were coming out of thin air, and creates the economy, which supposedly was simply elucidated by theory. In this way of thinking, theory would come first detached from any reality, and by its action could confer existence on those facts it finds admissible. Again, I will not ask whether this implicit assumption is true for economics, but will ask whether it is true for statistics. While the latter do produce some characteristics of the object to which they are applied, can we go as far as saying that, as suggested by discussions such as MacKenzie and Millo (2003) of the performativity of economics, it creates those objects?
21
As such, the idea seems quite improbable. One can hardly see how statistics, by waving some magic wand, would suddenly turn the world topsy-turvy and create it in their image. The examples given above look much more like ongoing processes, gradual developments rather than sudden creations. We have never witnessed that kind of wand-waving magic in statistics. Nor in economics, actually: as described in all the papers of this book, the mechanism is in fact much more subtle; it progresses much less suddenly, and the creation of facts is diluted over time and the writers resort to expressions such as “little by little,” “gradually,” “as it goes along” to describe performing. Here is another quotation from MacKenzie and Millo (2003, p. 137):
Black, Scholes, and Merton’s model did not describe an already existing world: when first formulated, its assumptions were quite unrealistic, and empirical prices differed systematically from the model. Gradually, though, the financial markets changed in a way that fitted the model.
The authors seem to have difficulty asserting that the theory or the model, when “first formulated,” could suddenly transform financial markets. The idea that a mere theory, all by itself and all of a sudden, could move such huge mountains as the interests of banks, the goods exchanged on the stock markets, or the practices of brokers, would sound terribly implausible. Rome cannot be changed in a day. That is why the process is diluted over time, and the theory is only said to act gradually. So the world does not arise, like Athena, fully armed and shouting cries of victory, but rather, it came, little by little, to conform to economic theories. Being less sudden, the phenomenon becomes more plausible. MacKenzie and Millo seem to be saying: all right, the whole financial market was not drastically changed overnight by the new theory, but rather, changes occurred slowly but surely, as they usually do. What goes on during that period of time? The question is worth asking, since there is a possibility that what took place during it was not exactly a creation, but simply a gradual transformation of the facts, which would look much more like the statistical transformations observed by us. This is where we have to separate the two MacKenzies. There is the one who stands here in his chapter in this book, and which explains very plausibly how changes occur; but there was a previous one, who is far from standing alone,13 who deserves the attack that follows.
For this latter group of writers, whom we might call the soft constructivists, what goes on in the process at work during the timespan they grant to performing is that the actors, one after the other, become convinced of the interest of Black, Scholes and Merton’s new theory (note that at the beginning the theory is false, as emphasized by
13 In particular, in France, the whole history of polling suffers from this weakness. Champagne (1990)
and Blondiaux (1998) both argue that polling creates public opinion, because people believe more and
more in polls and, one after another, act according to their (expensive) advices.
22
MacKenzie and Millo themselves; one wonders, then, why the actors still find it interesting?). The actors then begin to act in accordance with it, as if the world corresponded to the assumptions of the theory (wrongly so, at the outset, remember). But when a sufficient number of actors are convinced, their efforts are finally successful and they make the world itself conform, in turn, to what was initially a simple ideal and has become a theory (here again, we are not far from Miller’s reasoning). For the theory of Black, Scholes and Merton to function, a great many actors had to model their behavior after that theory, and their number had to transform the world, which ended up adopting the theory as its own rule of conduct. Now it takes time to convert the masses: it takes a whole lot of individual conversions, which necessarily proceed slowly, over time. And that is where the “little by little” designates a series of conversions, each of which is immediate (and in fact equally difficult to understand: why and how each individual is persuaded is never explained) but spread over time. That “gradually,” then, is by no means a slow transformation of the state of things, but it is, according to the soft constructivists, a series of mental conversions, all equally sudden, leading to another sudden break, at which point, all of a sudden, the world itself begins to correspond to the prerequisites of the theory. Now, for one thing, MacKenzie and Millo’s need to transit by the awareness of actors to account for the creation of an economy raises a serious problem for performativity. It means that it is not at just theory that performs, but to the contrary, in the most classical fashion, it is people who, through their work, transform the world (aside from the specific fact that one does not see what their motives are here). This would mean that there is no great need to introduce the term “performativity.” But secondly, if performativity were the outcome of a series of conversions, it has not said anything about the transformation of things. It continues to point to radical conversions (the actors are or are not convinced by the theory; there is no other alternative); it designates an aggregation of those breaks, but each one is still a long way from the processes observed in the case of statistics. In fact, the statistical operations we have tracked down are never creations of that sort. Firstly, each one demands a number of prerequisites, elements which exist prior to the description – maybe those prerequisites are the “conditions of felicity” the sociological analysis of which Bourdieu used to criticize Austin, and which MacKenzie presents in his chapter in this volume. When we see Church counting pickles, we first see him collecting information about his object. When the farmer fills in his questionnaire, he too has already done his own observing. Lastly, when we see the Statistician calculate the average, his very first act is to assemble the questionnaires and the shingling stick. A number of elements of farming are put together before the statistical operation, then. Next, statistical description involves handling those elements so as to discover the relations between them which we have sufficiently stressed above: there is a particular way of attaching the questionnaires together, or again, the observed condition expressed as a percentage of the normal condition, etc. The relationship obtained is original, usually peculiar to statistics, but it is nothing more (but nothing less, either) than a relationship between prerequisite elements. Those elements unquestionably preceded statistics and were its precondition: there can be no statistics without elements of farming to measure statistically.
23
But of course, if statistical manipulations presuppose the existence of several
objects prior to their description, it is to transform those objects by establishing relations between them, thereby actualizing some of their previously non-existent characteristics. This is why the word “preconditions” does not fit perfectly for our argument: the problem is not only one of a stable mould (the conditions) that would shape the iron in fusion (the theory, the model, or the statistics); but the problem is in fact which elements will be used by the statistician, how precisely he or she will use this resources and what specific relations he or she will find between them. It is unquestionable that things exist prior to the description, but those things look much more like a set of resources for action than like an unchanging and determining condition. Whence I conclude that “performativity” is either very demanding or very lazy. It is very demanding since it contends that the facts performed are created out of thin air. But while it is unclear how a pure creation is possible in general, it is entirely clear that this is not what is observed in the case of statistics. Statistical descriptions in no way create the farming elements they describe; they transform them. In the first instance we have a series of sudden, quite unaccountable mental conversions, and in the second, an ongoing process with gradual little modifications of the relations between things. From another viewpoint, “performativity” might be seen as very lazy since it only requires conditions, and nothing more, the transformations under scrutiny taking place sort of automatically once the conditions are there. So if statistics have the property of acting on the object they describe, the way they go about it does not make for full-fledged “performing.” This remark therefore makes a second dent in the idea that statistics perform. If so, is there any reason to retain the term? Do its defects exceed its advantages?
3. Rather than “Perform,” let us say “Express” There are two main reasons why the descriptive activity of statistics may be said to “perform”: firstly because they transform the object of the description as they describe it; and secondly because they act on Correspondents through the use of language in their many instructions. But these shared points do not eliminate its incompatitibilities: firstly, “performativity” does not specify, at all, the kind of action that theory or description might exert on its objects; secondly while statistics transforms their object they do not create it, and thirdly, statistical description does not act through language alone, but by the means of thousands of other kinds of intermediaries. These three arguments lead us to the conclusion that “performativity” is not the most appropriate word. It remains a simple stopgap. Instead, I would argue that the process that give existence to some unsuspected characteristics corresponds to what has often been called expressing. This word is not to be understood here in its day-to-day sense when we say that a person who gives free rein to his instincts or to his unconscious is “expressing himself,” nor is it to be understood in the sense when something is there, hidden inside something else, and comes to be expressed in the outside, i.e. simply revealed or communicated (both may nonetheless be peculiar, extremely restrictive instances subsumed in the meaning that I elaborate below).
24
The way in which I use the term ”express” draws on a long philosophical tradition,
in which one encounters Leibniz, and in which Spinoza played a crucial role, as shown by Deleuze whom I will follow here (Deleuze 1968). According to Deleuze’s modern reading of Spinoza, “expressing” takes place when various elements (at least two) are gathered in a particular way, and this particular relation evidences a new feature of the whole composed by that coming together. The best way of illustrating this is to return to the earlier example of the shingling process: when the Statistician returns to his office, he finds a collection of questionnaires and a stick. The schedules are then pegged together, so that the questionnaire is now not only linked to the vicinity of the particular Correspondent who filled it in, but comes to be linked to the entire County of which it is a part. Once attached to all the other questionnaires in the specific way described above, its “part of a county” attribute is expressed, whereas until then it was simply a “piece of information about a district,” which is not the same thing. Before pegging, the Statistician had no proper way of moving from a particular area to a whole county; after pegging, the sum could be calculated, making the shift possible. The original elements were therefore articulated in a peculiar way, and through that articulation, which is nothing but a description, a new property of the whole comes into being. Similarly, the countable pickle is the expression of the set of elements collected by Church to bring it into being; the percentage written on a questionnaire is the expression of the investigations conducted by the Correspondent. At each step, statistics express some characteristics of the elements initially involved in it. Each time, the expression gives birth to a characteristic that becomes existent. Expression, in this strong sense, can also be illustrated by an enological comparison, in which the types of vine stocks and the qualities of the soil express themselves together in the wine. For example, the peculiar, singular relation developed by a mixture of Tannat and Cabernet vines in an encounter with the turbulent soils of the foothills of the Hautes-Pyrénées is expressed in the countrified, robust taste of Madiran wines. That taste was not present nor in those particular vine stocks, nor in those foothills, but it is the specific encounter that brought that new, delicious characteristic into the state of existence. In statistics, we would say that expression is at work in each of the many phases which gradually, taken together, lead to the construction of a figure about the whole of U.S. agriculture. The word “expression” thus enables us to give a very adequate account of the type of transformation operated by statistics on their objects: statistics express certain characteristics of their objects. Thus, expression is definitely an action exerted on the elements participating in the process, since the characteristics brought to light were not in those elements before they were expressed statistically. Before Church championed pickles, they were not exhaustively counted; in other words, that property had not been expressed. And that expression is far from just happening, as Church constantly reminds us in his emphasis on the difficulties he encountered along the way. To come to count pickles, he had to have that first piece of luck by which he met the right person on a train, then he had to get the main producers to support him and accept to answer his questions, to convince Washington that the effort was worth while, etc. Expression means doing something, making some previously nonexistent properties stand out, and the important word here is doing/making, for expression does something to, makes something of the objects expressed.
25
But if expression is an action, that does not make it a creation. When speaking of expression we are not referring to a process in which an entity (statistics for example) would have the demiurgic power to bring another entity, such as the agricultural economy, into existence all by itself, by dint of its own strength and resources. No, the notion of “expression” emphasizes the fact that this revitalization comes from an arrangement of at least two elements and that it is this arrangement, constituting what is expressed, which is new and surprising. Expression is what oozes from at least two elements when we find a way to put them together, rather than a sudden occurrence following an explosion produced by the waving of some magic wand. In other words, one advantage of the former over the latter is that it is ternary where the other is simply binary. For the fact is that creation only links the creature to the creator, and performation tends to simplify the relation to theory and practice alone, whereas expression requires initial elements (at least two), to begin with, then a way of putting them together, and thirdly the outcome of that arrangement. Church did not “create” the countable pickle; he put together a number of elements (the list of which ended only when he received the mimeographed questionnaire), he assembled all those elements (in this case he had respondents fill in the appropriate boxes on the questionnaire) and the result of the arrangement was the pickle’s new characteristic: it was countable. It is inasmuch as expression is the outcome of the unprecedented arrangement of initial elements that we may say that it is not creation, but is nonetheless a transformation and a revitalization.14 With “meaningful articulation,” Latour (1999, p. 187) proposed a concept very close to our “expression.” In effect, one might say that Church articulated pickles, lists of salt producers and many other entities to produce a countable pickle. But the advantage of “expression” over “articulation” is twofold. First, the former notion has also a history in aesthetics; therefore, when we say that statistics “express” something, we clearly hear the creative (not creationist) aspect of the activity, we hear that it invents something. Second, when we say that statistics “express” something, we not only say that it is a game of Meccano, of putting pieces together, but we also say that the pieces are slightly changed, slightly different at the end of the story from at the beginning . Those points are so clear that when Latour explains what he means by “articulation,” he himself cannot avoid using the notion of “expression.” He says that articulation is “also a change in the very matter of expression” (emphasis in original). It is in general very difficult to speak about the type of action here under scrutiny without referring to the idea of “expression.” Maybe, one reason for this is that the notion of “expression” is tolerant: it is not very particular about the nature of the elements that may be expressed. More specifically, it does not care whether or not those elements are linguistic, any more than whether or not it is human beings who express themselves. The series of examples discussed above certainly constitute adequate proof of that: the elements involved in the
14 Expression does not eliminate any conceivable creation, however; it becomes a threshold in the extent
to which a particular arrangement triggers surprise and possible further developments. See for example
Massumi (2001).

26
process of expression ranged from wine to the wheat field and included the Correspondents themselves, the instructions and shingling sticks. Since expression is primarily an assemblage, there is in fact no need for either language or human beings to be central to it. They definitely tend to partake of it, since there are few totally non-linguistic moments, and those that are outside human grasp are of little interest to us, but language and speaking beings do not occupy any pre-eminent place.
To complete my argument, I have to say what is so specific with statistical expression. My answer is that statistics do not express just any characteristic, in fact, but usually reproducible elements.15 One thinks, for instance, of the questionnaires or introductory letters which may be easily mimeographed (what is expressed then is the similarity of the receivers), the little identical boxes at the bottom of the questionnaires (if we look at the line of boxes, it is the resemblance of observations about different crops that is expressed, if we look at the columns of boxes, during the shingling operation, it is the similarity of farms within the County that is expressed) or again, the names written identically one under the other in a list, a roll of Correspondents. Rather often, the objects in the statistical chain are expressed as reproducible characteristics. The advantage for statistics is that being able to add similar units together facilitates counting. Statistical expression therefore tends to produce distinct but identical items; it produces, with some difficulty, similarity within diversity. We must be wary of generalizing too rapidly, however. There are many cases in which statistical expression seems to be singular – qualitative, if I dare say so. This is so, for instance, of the “normal condition,” which cannot be reiterated (there is one and only one normal condition). It is also true of the pickle, which cannot exist if it does not receive one exclusive definition. The reproducibility of statistical expressions is therefore reduced to a mere resemblance between these inasmuch as there are many exceptions. How can replicable elements be articulated with singular ones? Let me answer by stressing the fact that the non-replicable elements are expressed by statistics in view of the reproducible elements. Statistics does seem always to need repetition, but sometimes it cannot obtain this without a detour, without the intermediary of singular, unique elements that enable it to uncover reproducible elements. Thus, statistics seem to express, sometimes in unexpected ways, the replicable characteristics of the objects it studies. It seems to us, then, that the vocabulary of expression definitely indicates a certain type of action exerted by statistics on its objects, but does not suggest – and it would be an error to do so – that such action may be a pure and simple creation, nor that it is primarily linguistic. For this reason we suggest saying, for example, that statistics express U.S. farming or again, that the United States as a whole is one expression of statistics, rather than asserting that statistics perform the U.S. or that the United States as a whole have been performed by statistics.
15 This point comes from Tarde (1890).
27
Conclusion: Statistics have Effects on or Express the Economy but do not Perform it What conclusion can we draw, in fine? Having traveled this long path that took us back into the 1920s, made us pace Michigan up and down to see pickles grow, enter farmhouses to watch Correspondents fill out their questionnaires, follow those questionnaires to the capitals of every state of the Union to see how they were aggregated with all the others. In short, having tracked down statistics in the making, can we answer our first question: do statistics perform the economy they describe? I think I have a response, a two-part one. For one thing, it is clear, as “performativity” claims, that statistics have effects on the world in which they are established. First of all, the farming statistics we have examined here were actually explicitly created for precisely that purpose: that is, to help the administration purify the markets. But there is no difference between this effect of statistics and any other effect. Statistics are produced, and like any other solid entity, they have effects on their surroundings. It just so happens that these effects are so powerful that they manage to return to their starting point. That is, having influenced a number of actors they gradually end up influencing farmers themselves and their crops. This is certainly a surprising, amusing circular effect, but it is not very original as a process, and therefore need not be given any special name. There is no reason all of a sudden to claim that “statistics perform… ” instead of the more natural, classical: “statistics have effects… ” or “statistics influence…,” or again, “statistics make, or do…” Secondly, statistics also have direct effects on the object they describe, the relation of statistics to what they describe is also peculiar and is also a certain type of action, that is worth analyzing, even though it seems to escape the scope of what is usually called “performation.” At the very moment they do their describing, they also transform what they describe. How do they do that? My answer is that they characterize the repetitive modalities of their object. Firstly, they characterize what is described; in other words, by arranging a series of elements taken in farming in a singular fashion, they bring out characteristics of those elements that they did not have previously. Statistics produce certain properties of the objects they study. But secondly, this production is far from being purely linguistic, even if language definitely may play a role here. To the contrary, many material objects, as well as weather conditions, all of which are both physical and constituent of statistics, are a part of this process of production. In other words, language is not the only way in which statistics characterize their objects. Third and lastly, this production is not a creation but a transformation, a recycling. Statistics seize hold of already-constituted elements and take possession of them, but they do not create them out of thin air. Statistics transform their object as they describe it, then. Does that mean we may speak of “performing”? We should refrain from doing so, for the concept suggests that the process is purely linguistic and hints at a pure and simple creation of the object of the description, both of which features are contradicted in the case of statistics. For this reason I prefer the notion of expression, which accounts perfectly for the three
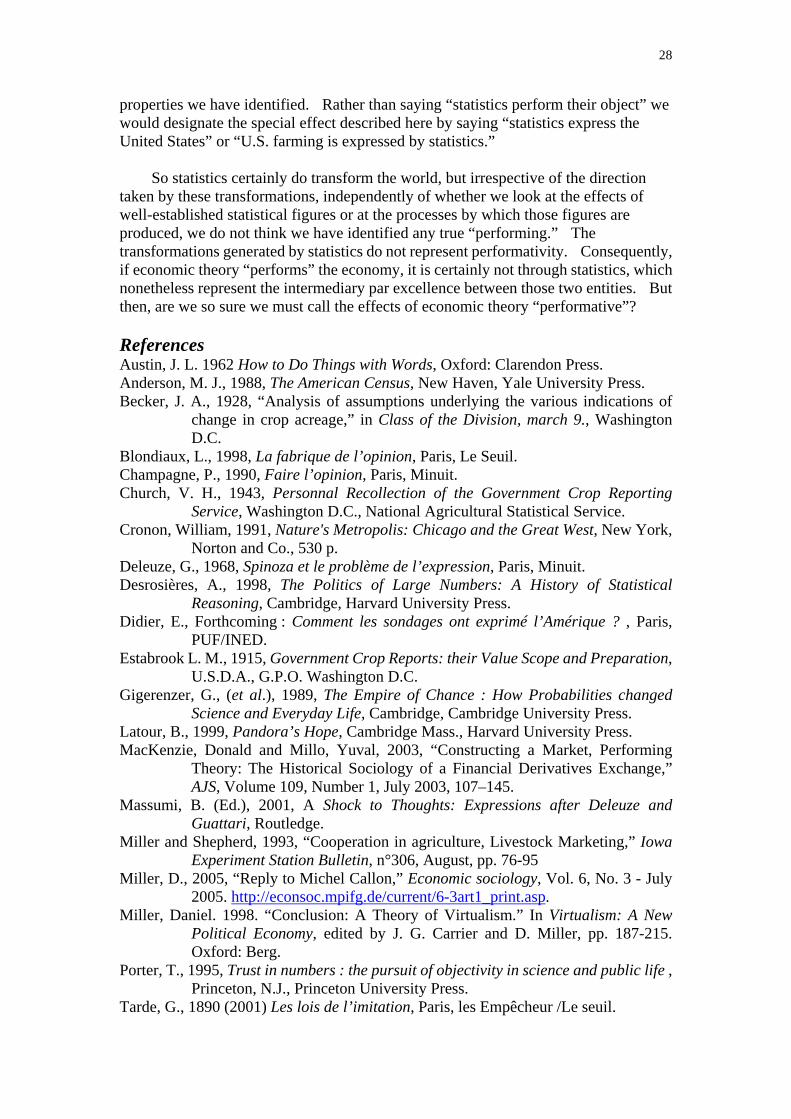
28
properties we have identified. Rather than saying “statistics perform their object” we would designate the special effect described here by saying “statistics express the United States” or “U.S. farming is expressed by statistics.” So statistics certainly do transform the world, but irrespective of the direction taken by these transformations, independently of whether we look at the effects of well-established statistical figures or at the processes by which those figures are produced, we do not think we have identified any true “performing.” The transformations generated by statistics do not represent performativity. Consequently, if economic theory “performs” the economy, it is certainly not through statistics, which nonetheless represent the intermediary par excellence between those two entities. But then, are we so sure we must call the effects of economic theory “performative”? References Austin, J. L. 1962 How to Do Things with Words, Oxford: Clarendon Press. Anderson, M. J., 1988, The American Census, New Haven, Yale University Press. Becker, J. A., 1928, “Analysis of assumptions underlying the various indications of
change in crop acreage,” in Class of the Division, march 9., Washington D.C.
Blondiaux, L., 1998, La fabrique de l’opinion, Paris, Le Seuil. Champagne, P., 1990, Faire l’opinion, Paris, Minuit. Church, V. H., 1943, Personnal Recollection of the Government Crop Reporting
Service, Washington D.C., National Agricultural Statistical Service. Cronon, William, 1991, Nature's Metropolis: Chicago and the Great West, New York,
Norton and Co., 530 p. Deleuze, G., 1968, Spinoza et le problème de l’expression, Paris, Minuit. Desrosières, A., 1998, The Politics of Large Numbers: A History of Statistical
Reasoning, Cambridge, Harvard University Press. Didier, E., Forthcoming : Comment les sondages ont exprimé l’Amérique ? , Paris,
PUF/INED. Estabrook L. M., 1915, Government Crop Reports: their Value Scope and Preparation,
U.S.D.A., G.P.O. Washington D.C. Gigerenzer, G., (et al.), 1989, The Empire of Chance : How Probabilities changed
Science and Everyday Life, Cambridge, Cambridge University Press. Latour, B., 1999, Pandora’s Hope, Cambridge Mass., Harvard University Press. MacKenzie, Donald and Millo, Yuval, 2003, “Constructing a Market, Performing
Theory: The Historical Sociology of a Financial Derivatives Exchange,” AJS, Volume 109, Number 1, July 2003, 107–145.
Massumi, B. (Ed.), 2001, A Shock to Thoughts: Expressions after Deleuze and Guattari, Routledge.
Miller and Shepherd, 1993, “Cooperation in agriculture, Livestock Marketing,” Iowa Experiment Station Bulletin, n°306, August, pp. 76-95
Miller, D., 2005, “Reply to Michel Callon,” Economic sociology, Vol. 6, No. 3 - July 2005. http://econsoc.mpifg.de/current/6-3art1_print.asp.
Miller, Daniel. 1998. “Conclusion: A Theory of Virtualism.” In Virtualism: A New Political Economy, edited by J. G. Carrier and D. Miller, pp. 187-215. Oxford: Berg.
Porter, T., 1995, Trust in numbers : the pursuit of objectivity in science and public life , Princeton, N.J., Princeton University Press.
Tarde, G., 1890 (2001) Les lois de l’imitation, Paris, les Empêcheur /Le seuil.

29
Taylor, Henry C. et Taylor, Anne D., 1952, The Story of Agricultural Economics in the US, 1840-1932, Ames, Iowa State College Press.
U.S.D.A., 1933, The Crop and Livestock Reporting Service in the United States, Washington D. C., Government Printing Office, p.12.
30
Figure 6.1. The process of statistics is simply a long causal chain, starting at one point (farming) and acting, step by step, until it finally returns to its point of departure. However, farming described on date t only changes at date t+1, at the following harvest, once farmers were able to observe the effects on the market and to react to them. Description, as such, therefore does not change what it describes.
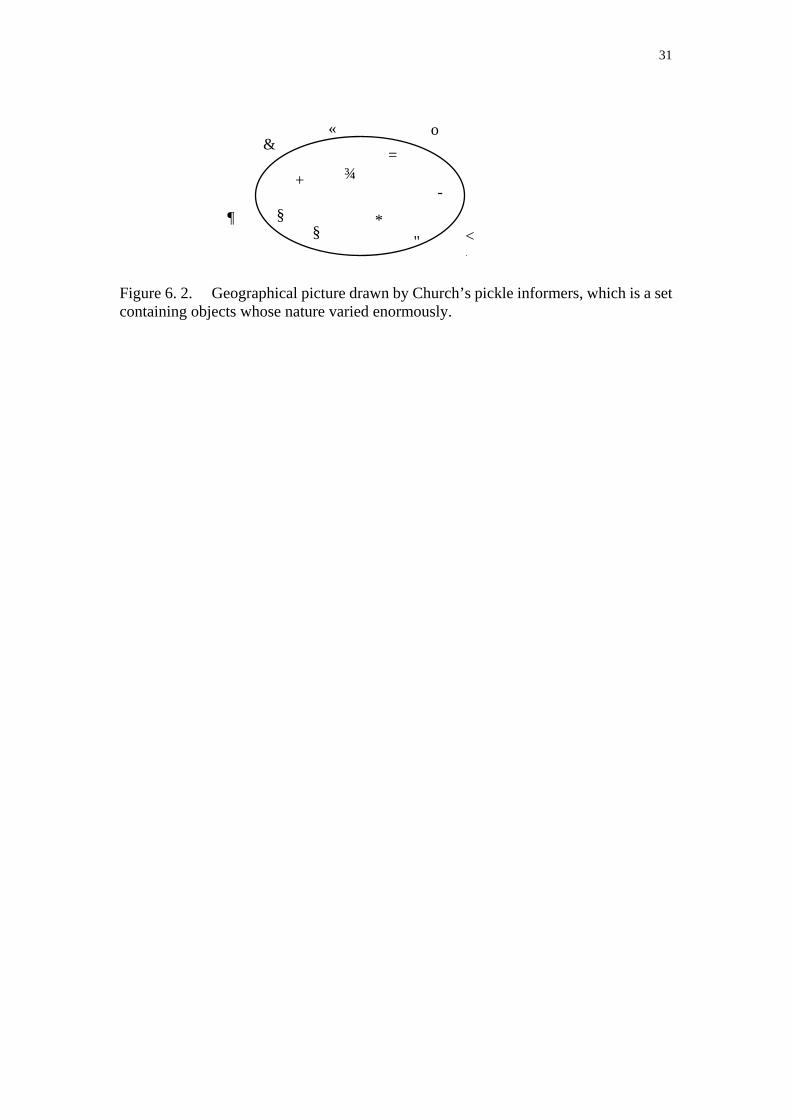
31
+
*
-
=o
&
" <§§
¾
«
¶
Figure 6. 2. Geographical picture drawn by Church’s pickle informers, which is a set containing objects whose nature varied enormously.
32
Figure 6.3. A Correspondent filling in a questionnaire. The picture shows us that this activity demands that the farmer sit down at a clean and orderly living room table, put on his reading glasses and concentrate on what he is doing. (National Agricultural Statistical Service, no date.)

33
Figure 6.4. A sample questionnaire. This one has to do with livestock, but the form is exactly the same as for cereals. Note that the boxes to be filled in form a strip all along the bottom of the questionnaire (U.S. National Archives, RG 83, Entry 75, Schedules).
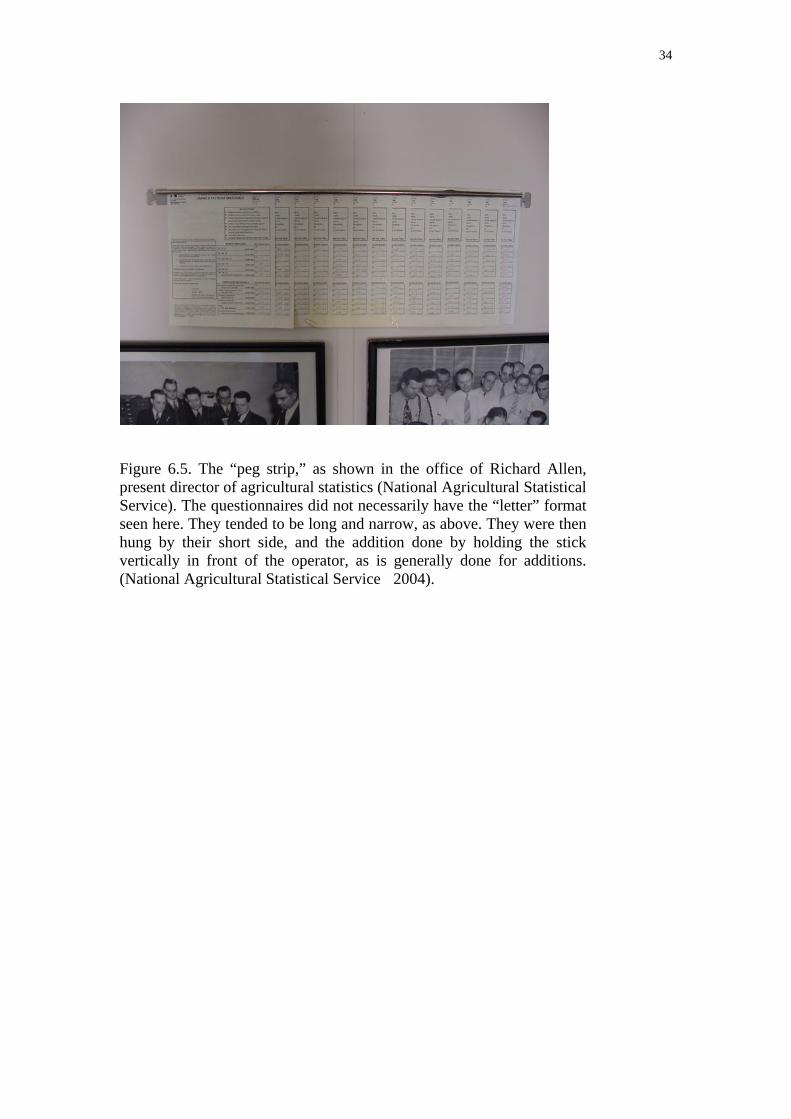
34
Figure 6.5. The “peg strip,” as shown in the office of Richard Allen, present director of agricultural statistics (National Agricultural Statistical Service). The questionnaires did not necessarily have the “letter” format seen here. They tended to be long and narrow, as above. They were then hung by their short side, and the addition done by holding the stick vertically in front of the operator, as is generally done for additions. (National Agricultural Statistical Service 2004).