dociimfn t flstimf li 001 122 - eric · dociimfn t flstimf. ed 024 414. ... average indexing time,...
TRANSCRIPT

DOCIIMFN T flStIMFED 024 414
By-Lufkin, Richard C.Determination and Analysis of Some Parameters Affecting the Subject Indexing Process.Massachusetts Inst. of Tech., Cambridge. Electronic Systems Lab.Spans Agency-Department of Defense. Washington, D.C. Advanced Research Projects Agency.; National Science
Foundation, Washington, D.C.Report No-ESL-R-364Pub Date Sep 68Grant- MIT-DSR-P-70054; NSFC-472 (Part)Note- 55p.EDRS Price MF-$0.25 NC-T.2.85Descriptors-Cataloging. Classification, *Indexing, *Performance Factors, *Statistical Analysts, *Task Analysis
Identifiers- *Information Transfer Experiment, Intrex
This report describes a quantitative study of subject-indexing as it is beingperformed by catalogers who are developing an augmented catalog as part ofProject Intrex. Learning curves for the average time taken to index technical
documents on a per-page basis were derived for a group of indexers. The averageindexing times per page were also calculated and compared under several criteriapertaining to the nature of the documents. (Author)
LI 001 122
-c-

September,1968
4 001122 tYtt,
Nov 0REPORT ESL-R-364 'JedM.I.T. PROJECT DSR 70054Research Grant NSFC-472 (Part)
DETERMINATION AND ANALYSISOF SOME PARAMETERS AFFECTING
THE SUBJECT INDEXING PROCESS
Richard C. Lufkin
Electronic Systems Laboratory
MASSACHUSETTS INSTITUTE OF
Department of Electrical Engineering
owe%
DEC 1 0 68
Y OF
Project Intrex Group
TECHNOLOGY, CAMBRIDGE, MASSACHUSETTS 02139
September, 1968 Report ESL-R-364
DETERMINATION AND ANALYSIS OF SOME PARAMETERSAFFECTING THE SUBJECT INDEXING PROCESS
by
Richard C. Lufkin
U.S. DEPARTMENT OF HEALTH, EDUCATION & WELFARE
OFFICE OF EDUCATION
THIS DOCUMENT HAS BEEN REPRODUCED EXACTLY AS RECEIVED FROM THE
PERSON OR ORGANIZMION ORIGINATING IT. POINTS OF VIEW OR OPINIONS
STATED DO NOT NECESSARILY REPRESENT OFFICIAL OFFICE OF EDUCATION
POSITION OR POLICY.
The work described in this document was performed as part of Proj-ect Intrex under Research Grant NSFC-472 (Part) awarded to theMassachusetts Institute of Technology by the National Science Founda-tion and the Advanced Research Projects Agency of the Departmentof Defense. This grant is designated as M. I. T. DSR Project No.70054.
Electronic Systems LaboratoryDepartment of Electrical EngineeringMassachusetts Institute of Technology
Cambridge, Massachusetts 02139

LI 001 122
ERRATA SHEET
Electronic Systems LaboratoryMassachusetts Institute of Technology
Cambridge, Massachusetts 02139
for
Report ESL-R-364September, 1968
"Determination and Analysis ofSome Parameters Affecting the Subject Indexing Process"
byRichard C. Lufkin
Page 19, Figure 9:
Change the label of the horizontal axis of Fig. 9
from: "Months of Intrex Experience"
to: "Document Length, Pages"
Ai ts.,y
Pft
sY/,-4
t 1,

FOREWORD
Except for editorial changes, this report is the thesis submitted byMr. Richard C. Lufkin to the Electrical Engineering Department,Massachusetts Institute of Technology, in partial fulfillment of therequirements for the degree of Bachelor of Science. A few altera-tions in the original wording have been made throughout the text inan effort to enhance clarity, and several pages have been refor-matted; otherwise the manuscript remains as submitted.
J. F. ReintjesProfassor of Electrical Engineering
iii

ABSTRACT
This report describes a quantitative study of subject-indexing as itis being performed by catalogers who are developing an augmentedcatalog as part of Project Intrex. Learning curves for the averagetime taken to index technical documents on a per-page basis werederived for a group of indexers. The average indexing times perpage were also calculated and compared under several criteria per-taining to the nature of the documents.
v

ACKNOWLEDGMENT
I wish to thank Mr. Alan Benenfeld for his patience and time as he
directed me into the rigors of documentation.
I wish to express my appreciation to Professor J. Francis Reintjes
for his incisive commentaries and the demands for excellence which
he imposes.
I also wish to thank Miss Leslie Smith for her assistance in punched-
card preparation, Mr. Francis Heile for his help in computer-
program preparation, and Mr. Steven Morrow for his assistance andsteady hand in graphical presentations.
vi

CONTENTS
INTRODUCTION
II SUBJECT INDEXING
III PARAMETERS STUDIED
IV DATA ACQUISITION AND PROCESSING
V RESULTS
VI CONC LUSION
BIBLIOGRAPHY
PPENDICES
A. Figures and Data Tabulations 13
B. Summary of Personal Data by Code Number 41
C. Sample Recording Form 43
D. Listing of Files from which Data wereGathered 44
E. Computer Program 45
F. A Note on Statistics 46
page 1
2
3
5
8
11
12
vii

LIST OF FIGURES
1. Composite Learning Curves of the Catalogers page 14
2. Time History of the Average Number of Subject TermsAssigned per page 14
3. Learning Curve and Other Time History Curves for15Indexer 1
4. Learning Curve and Other Time History Curves for15Indexer 2
5. Learning Curve and Other Time History Curves forindexer 7
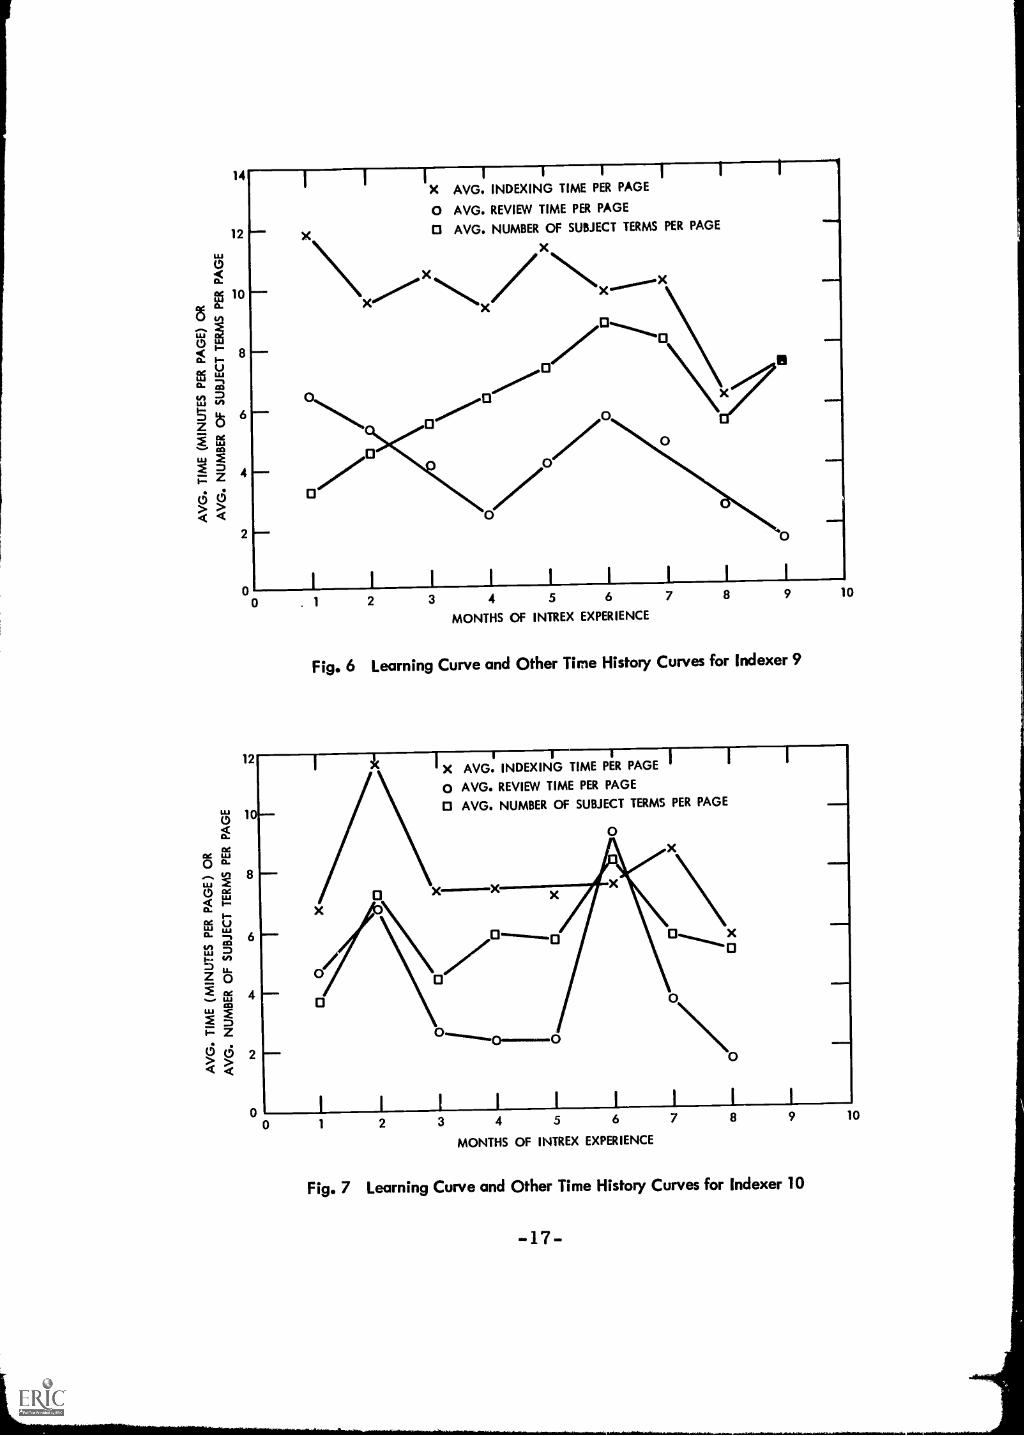
6. Learning Curve and Other Time History Curves forIndexer 9
7. Learning Curve and Other Time History Curves forIndexer 10
8. Learning Curve and Other Time History Curves forIndexer 13
9. Subject Indexing Time, Review Time, and Number ofSubject Terms, per page, versus Document Length
viii
16
17
17
18
19

LIST OF TABLES
1. Learning Curve Data for All Indexers page 20
2. Learning Curve Data for All Student Indexers 20
3. Learning Curve Data for All Librarian Indexers 21
4. Time History Data of the Mean per page Number ofSubject Terms Assigned by All Indexers 22
5. Learning Curve Data of Individual Indexers 23
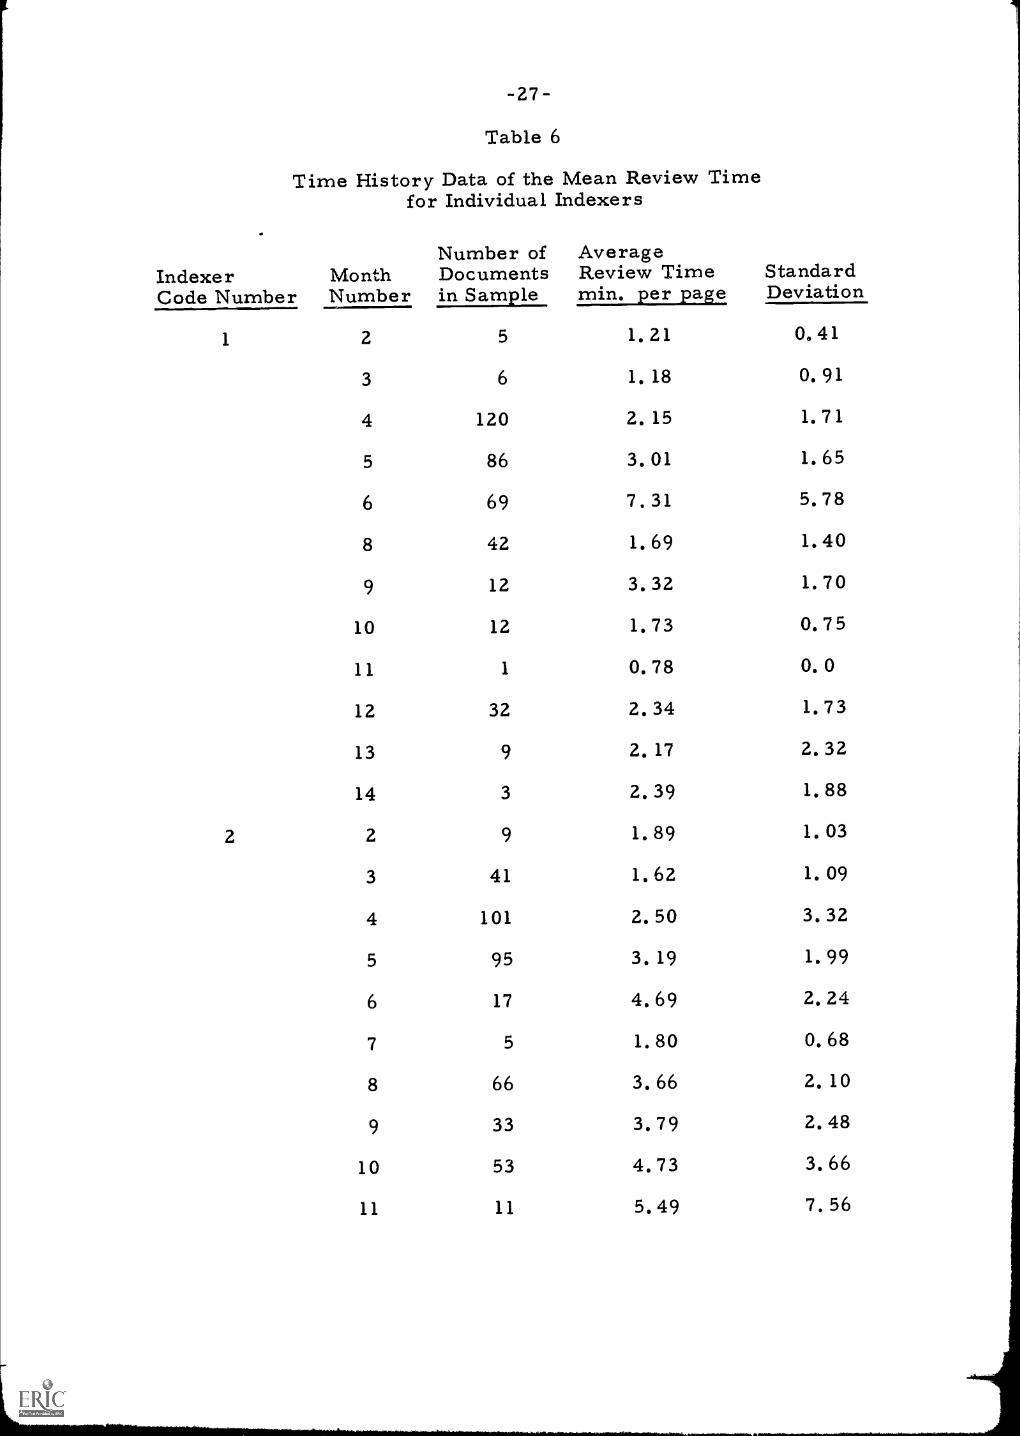
6. Time History Data of the Mean Review Time forIndividual Indexers 27
7. Time History Data of the Mean per page Number ofSubject Terms Assigned by Individual Indexers 31
8. Average Indexing Time, per page, versus DocumentLength, for All Experienced Indexers 35
9. Average Review Time, per page, versus DocumentLength, for All Experienced Indexers 36
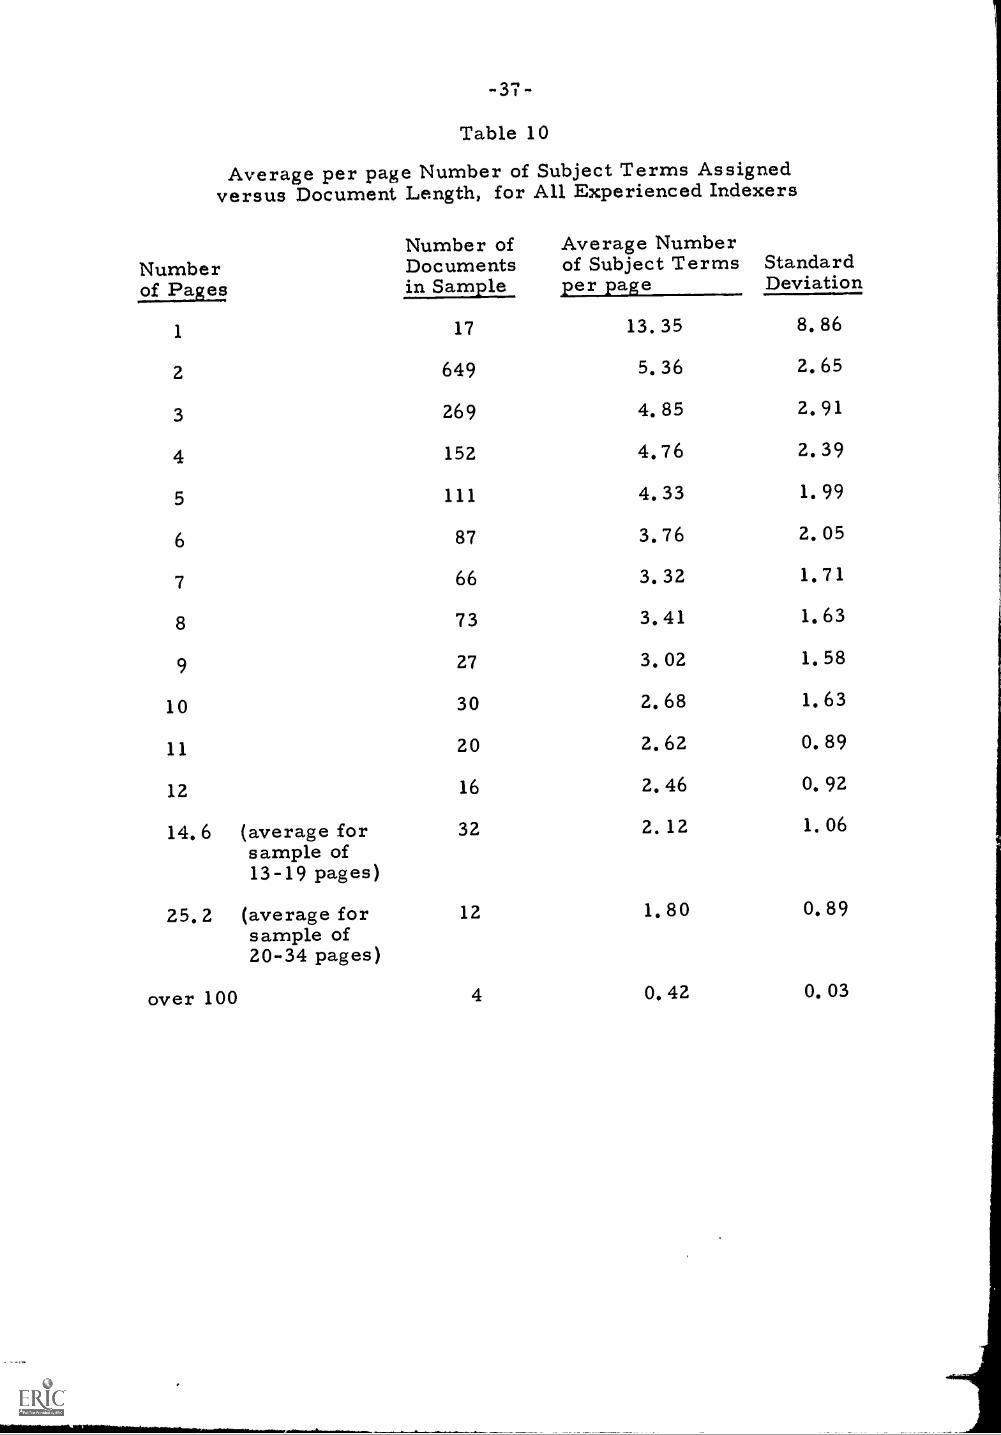
10. Average per page Number of Subject Terms Assignedversus Document Length, for All Experienced Indexers 37
11. Average per page Indexing Time of Documents Grouped38
12. Average per page Number of Assigned Subject Termsfor Documents Grouped by Format 38
by Format
13. Average per page Indexing Time of Documents Groupedby the Author's Level of Approach 39
14. Average per page Indexing Time of Documents Grouped39by Subject Area
15. Average per page Indexing Time of Documents Grouped40by Author's Purpose
ix

I. INTRODUCTION
The objective of this research is to study the effects of (1) in-
dexer experience over time and (2) document-related characteristics
on the subject-indexing process for the data base of the Project Intrex
augmented catalog. A major feature of this experimental catalog is
in-depth subject indexing of documents. This indexing is the most
time-consuming and intellectually demanding task in the creation of
catalog records for documents selected for the Intrex data base. The
thought processes involved in indexing have yet to be understood.
Consequently, qualitative and quantitative measurements of the intel-
lectual indexing task are very difficult. This report studies the way
the time to index individual documents for the Intrex data base varies
over time. The assumption that indexers exhibit a learning period is
tested. In particular, learning curves for the individual indexers are
derived to show the cumulative effect of indexing experience on docu-
ment indexing time. The assumption that document-related parameters
have an effect on the indexing time also is studied.
-1

II. SUBJECT INDEXING
The Intrex cataloging function is divided into two areas,descriptive cataloging and subject cataloging. Subject indexing formsthe major part of subject cataloging in terms of time consumed.
The subject indexing of a document consists of the creation ofa set of subject terms, each generally a combination of phrases, whichrepresent the subject concepts discussed in the document. Terms areprimarily based upon the text of a document, that is, upon the author'sown words. These text-based expressions may be restructured by theindexer to provide an intensive and complete representation of a con-cept. A relevance weight is attached to each term as a means of indi-cating the extent to which the concept represented by the term isdiscussed in the document.
There are five steps in the indexing process:
1. Scanning the document to get an idea of its coverage2. Identifying those concepts in the document which are
to be indexed3. Formulating an appropriately structured subject
term to represent the concept (words and phrasesnot appearing in a document may be used)
4. Weighting the subject term5. Recording the final decision
Ideally, in order to achieve consistency in concept selection,term structuring, and term weighting, the indexing operation shouldbe performed identically by all indexers. In an effort to achieve thisideal, a review of the initial indexing is performed by another indexer.The reviewer checks the initial indexing for overall coverage, com-pleteness, redundancy, accuracy, and the like, and makes corrections.
Indexing is a technique learned only through experience. Newindexers go through a training period during which their work is re-viewed intensively until a satisfactory level of performance is reached.With part-time student indexers, the procedure is to assign each stu-dent to a professional librarian who provides on-the-job guidance forthe student. He also receives a few brief formal training sessions.
2-
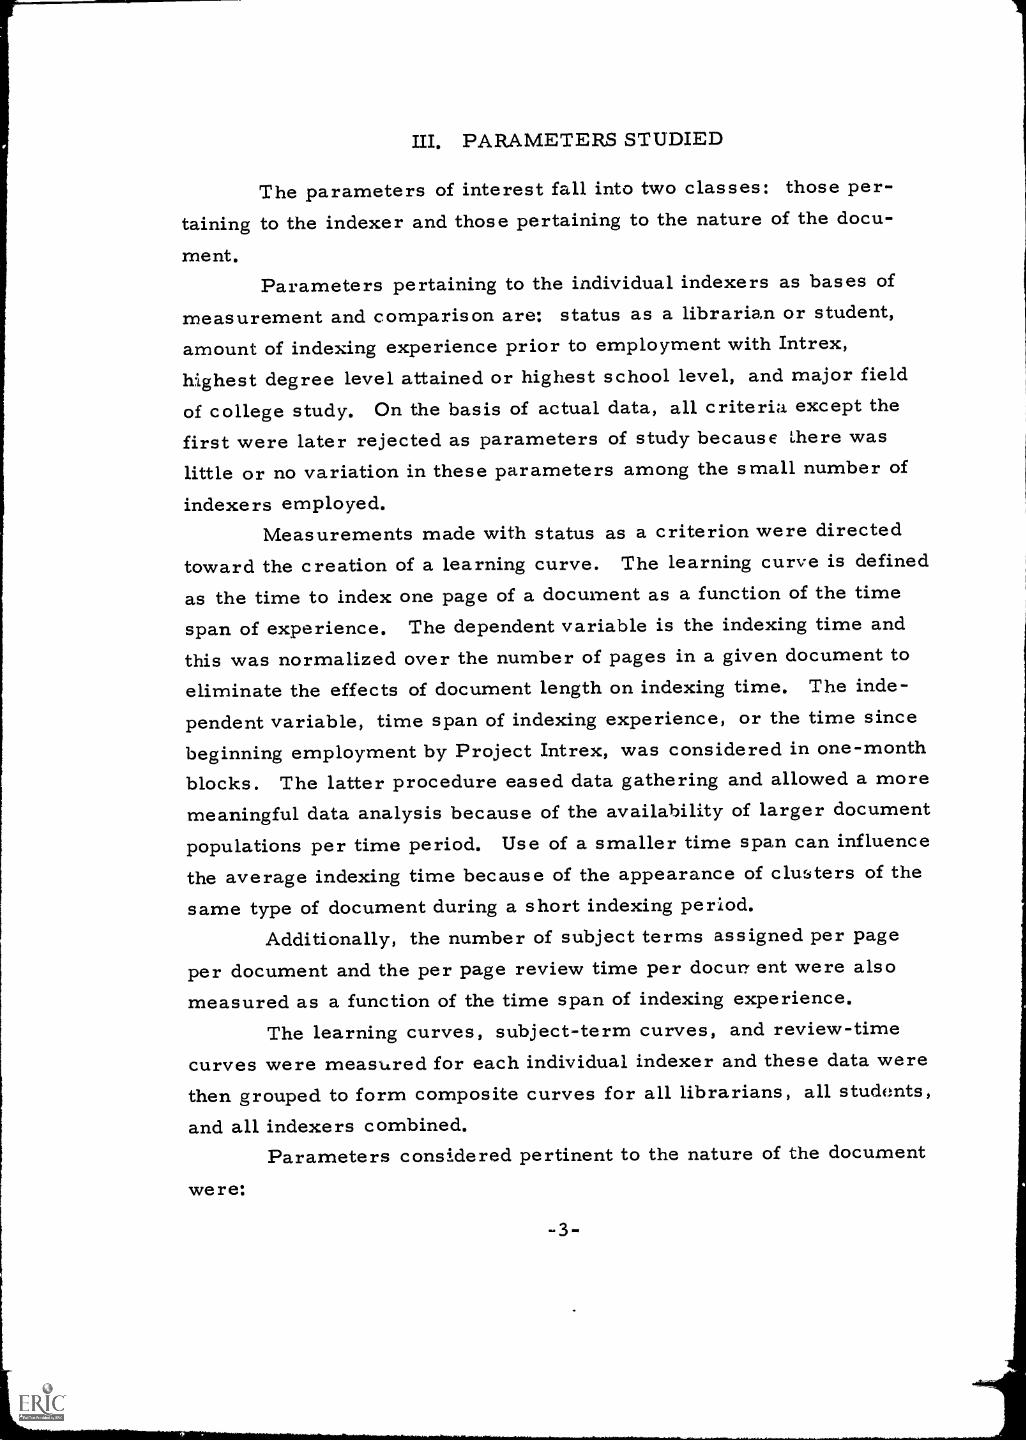
III. PARAMETERS STUDIED
The parameters of interest fall into two classes: those per-taining to the indexer and those pertaining to the nature of the docu-
ment.Parameters pertaining to the individual indexers as bases of
measurement and comparison are: status as a librarian or student,amount of indexing experience prior to employment with Intrex,highest degree level attained or highest school level, and major fieldof college study. On the basis of actual data, all criteria except thefirst were later rejected as parameters of study because Ihere waslittle or no variation in these parameters among the small number ofindexers employed.
Measurements made with status as a criterion were directedtoward the creation of a learning curve. The learning curve is defined
as the time to index one page of a document as a function of the time
span of experience. The dependent variable is the indexing time andthis was normalized over the number of pages in a given document toeliminate the effects of document length on indexing time. The inde-pendent variable, time span of indexing experience, or the time sincebeginning employment by Project Intrex, was considered in one-monthblocks. The latter procedure eased data gathering and allowed a moremeaningful data analysis because of the availability of larger documentpopulations per time period. Use of a smaller time span can influencethe average indexing time because of the appearance of clusters of thesame type of document during a short indexing period.
Additionally, the number of subject terms assigned per pageper document and the per page review time per docurr ent were alsomeasured as a function of the time span of indexing experience.
The learning curves, subject-term curves, and review-timecurves were measured for each individual indexer and these data werethen grouped to form composite curves for all librarians, all studonts,and all indexers combined.
Parameters considered pertinent to the nature of the document
were:

I. Number of pages2. Document format (arrangement of information
within the document)3. Author's purpose in writing the document
4. Level of approach (academic level of the author'sintended audience)
5. Subject area for which the document was selected
Language of the document was considered but rejected as a parameter
due to the very small number of foreign-language documents in the
data base.The above criteria were selected to test the assumption that
document-related parameters will significantly affect the indexing time
per document page. The measurements which were made for each
document-related parameter are shown below.
Measurements Made for Each Document-Related Parameter
Parameter
Measurem enNumber ofPages
SubjectArea
Format Author'sPurpose
Level ofApproach
Indexingtime perpage
X X X X X
Reviewtime perpage
X
Number ofsubjectterms perpage
X X
Because this phase of the study was performed after establishing theexistence of learning curves, these variables werrs measured only forthose documents indexed by librarians after three months of employ-ment and by students after two months of employment. This plan
eliminated the initial learning experiences of indexers.

IV. DATA ACQUISITION AND PROCESSING
Personal data describing the indexer were obtained through
interviews, Specific information gathered was :
1. Name2. Intrex code number3. Professional status (librarian or student)
4. Month of initial employment by Project Intrex asan indexer
5. Degree status6. Educational background (field of college study)
7. Amount of indexing experience prior to employ-ment with Intrex
These data are summarized in Appendix B under the indexer's Intrex
code number.Document-related data were retrieved manually from computer
printouts of catalog records. Computer search-and-sort routineswere considered as a means of gathering the data, but this method was
rejected because of programming inexperience and cost of computer
time. Data were transferred to a specially developed recording form
(see Appendix C, with sample data), The total set of data acquired
from a catalog record is listed below in the order in which it is re-corded on the form shown in Appendix C.
1. Record number -- this is an assigned documentcontrol number
2. Subject area -- a code number signifying the data-base subject area for which the document wasselected
3. Number of pages4. Field 31 code -- a letter code specifying the docu-
ment format5. Field 65 code -- a letter code specifying the author's
purpose in writing the document
6. Field 66 code -- a number code specifying theauthor's level of approach (the academic level of theintended reader audience)
7. Number of index terms in field 73

-6-
8. Indexer -- the Intrex code number for the personwho created the set of subject index terms
9. Date indexed10. Month number -- number of the month in which the
document was indexed, month one being the in-dexer's initial month of employment
11. Subject indexing time -- number of minutes spentsubject cataloging
12. Special-- a code number used to designate docu-ments not describable within the recording limita-tions of the form
13. Reviewer -- the Intrex code number for the personwho reviewed the initial indexing
14. Review time -- number of minutes taken to reviewindexing
Under item 11 the only data recorded in the permanent cata-logmg file are the time spent on subject cataloging. Subject-indexingtime represents the majority of this time. Time to accomplish othersubject cataloging tasks was assumed to be constant for all documentsand short (on the orde:e of one or two minutes for a document). There-fore, in this report subject-cataloging time is considered to besubject-indexing time.
Data from approximately 2, 500 catalog recordsl were recordedon the special form. The indexing for these records had been per-formed in the period March 1967 to February 1968. The only criterionfor excluding a catalog record from this study was the absence of in-dexing terms on a record; this would be the case, for example, forrecords describing an entire journal title. Data were transferred topunched-cE.rd format on a standard eighty-column card to facilitatedata sorting and processing. All data referred to in the above list,with the exception of item 9, were punched. Card-column assignmentsare noted at the bottom of the recording form shown in Appendix C.
A short computer program, written in the Fortran IV language,compiled the statistics of interest. This program is listed in Appen-dix E. Using indexing time per document page, review time per docu-ment page, or the number of subject terms per document page, as the
1See Appendix D for a listing of files from which data were selected.A file is a group of ten catalog records.

relevant random variable, the program calculates the average andthe standard deviation for the variable for a11 cards in groups definedby delimiting cards. 2 The program also calculates the number ofrecords and the average number of pages for the documents repre-sented in the data groupings. Data sorting into groupings was donemechanically under the various classifications of data parameters, asfor example, a composite of all indexers by months or the categoriesrepresenting the different possible types of document format.
2A description of the statistical theory utilized in this analysis is givenin Appendix F.

V. RESULTS
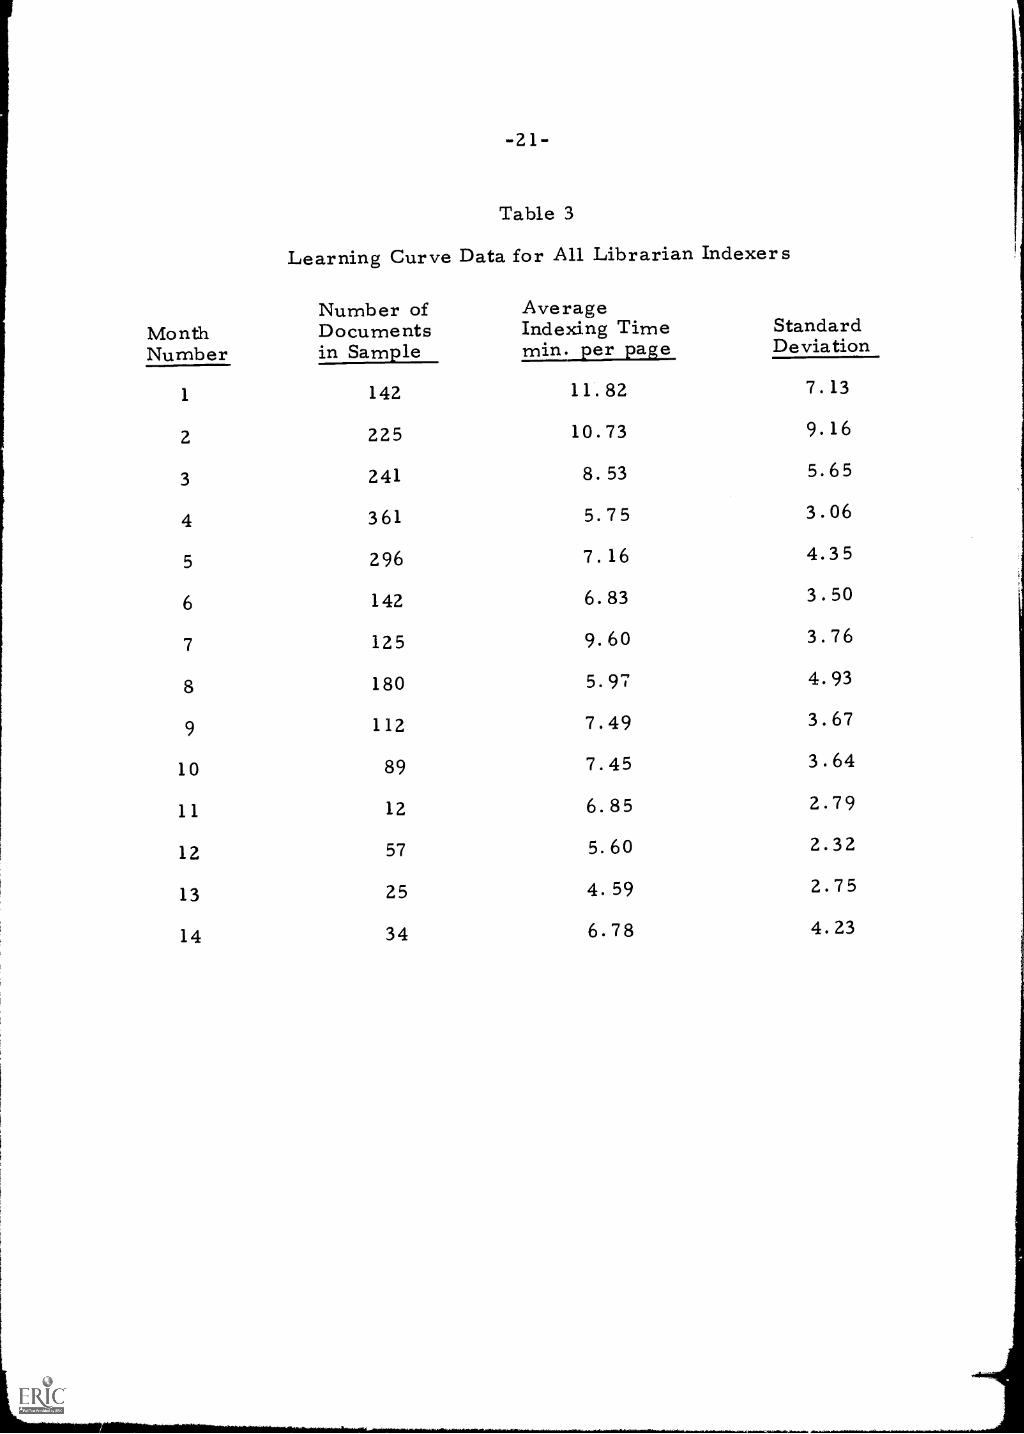
Figure 1 shows the cornpos.te learning curves which werederived from the study. There is a definite trend here in that, forthe librarians, an initial learning period seems to end after threemonths ; for the students the learning period ends after two months.The wide spread of mean values over time justifies our initial state-ment that a quantitative measure of the indexing process is very dif-ficult. The data for the points plotted on the composite learningcurves are listed in Tables 1, 2, and 3. From these tables, a trendof decreasing standard deviation over time can be seen to parallel theindicated learning curve trend. These trends indicate the timedevelopment of increasing consistency in average indexing time perpage.
Figure 2, which is a plot of the data in Table 4 of the averagenumber of subject terms chosen to describe a document as a functionof months of experience, shows little or no change in the number ofsubject terms selected over time. When this information is combinedwith the Fig. 1 data, we note that while the indexing Ulm: per pagedecreases, the number of terms generated per page remains constant;thus the number of terms created per minute increases. Since thenumber of indexers whose work is represented by a given month's datagrows smaller with an increase in month number (staff buildup wasgradual), data towards the higher experience numbers tend more t..)reflect the indexing characteristics of the two or three indexers am-ployed for the longest time.
Data for the individual indexers give an interesting insight intothe average individual indexing performances per document per month.These data, for the librarians only, are graphed in Figs. 3 through 8;corresponding data for all indexers are listed in Table.7' 5 through 7.One should avoid making too many generalization fror_i these datasince the standard deviation is of the same order of 'magnitude as the
*All figures and tables are located in Appendix A.
-8-

-9-
mean. In addition, careful analysis of the data should take cognizance
of the number of documents represented by any data point in order to
judge its significance. The graphs show, with few exceptions for any
one individual, that the indexing time per page, the number of subject
terms assigned per page, and the review time per page, follow the
same trends over time. Index time per page and review time per page
are derived from the similar processes of indexing and review ; both
of these time averages per page reflect the number of subject terms
selected per page. These variables could also be affected by sequences
of difficult-to-index documents.Comparisons of individual learning curve data show variations
in the learning experience for all indexers. The indexers represented
in Figs. 3 and 4, where initial pronounced learning curves are absent,
had the benefit of working on the initial pilot efforts in developing the
indexing method. Although there is no initial learning curve maximum
in Fig. 6, the presence of an initial learning period is still suggested
from the upward swing of the subject term curve from initially low
values and from the decrease of the initially pronounced review time
per page.Data pertaining to the document-related parameters is pre-
sented in Fig. 9 and in Tables 8 through 15. In Fig. 9, indexing time
per page, review time per page, and number of subject terms per
page, all show a consistent decrease with increasing number of docu-
ment pages The standard deviations for these variables also show a
decreasing trend. The large change in the times for a one- and two-
page document reflects two factors which are nearly independent of
document length: the time to complete the other cataloging tasks asso-
ciated with subject cataloging time, and the time for the indexers'
initial familiarization with the document.The approximate ratio of review time per page to indexing time
per page, as a function of document length, is 0.7 for one-page docu-
ments, 0. 5-0. 6 for two - and three-page documents , and 0. 3-0. 4 for
documents of four or more pages.Data reduction under the classification by format, shown in
Table 11, confirms the assumption that document related parameters
affect the time to index. For example, the percentage differential of

-10-
indexing time per page between a letters-journal article and a standardjournal article is about 27 percent, whereas the differential should beabout 14 percent if one considers only the different average-number-of-pages criterion. Thus, letter-type articles are more difficult toindex than regular-type articles. Similarly, conference-proceedingsarticles are much easier to index than letters-journal articles, about45 percent less time being spent per page; in this case, the two typesof articles have about the same average number of pages, and usingthis as a criterion, there should be no differential in indexing time.Conference proceedings articles seem to be the easiest to index amongthe three major categories, since in comparison with articles from astandard journal there is a 25 percent shorter time to index per page,whereas an 11 percent greater time is predicted on a number-of-pagesbasis. Similar conclusions apply to Table 12, which shows the averagenumber of subject terms per page for documents classified again byformat.

VI. CONCLUSION
This analysis verifies the assumption that the subject-indexingprocess exhibits a learning period. This period seems to span threemonths for librarians and two months for students. During this initiallearning period, the students also have a lower average time to indexdocuments on a per-page basis. Indexing time appears to level off atsix to eight minutes per page for an experienced worker. The ratherlarge spread in the data emphasizes the very subjective nature of thework. Indexers who show the most consistency in indexing time overtheir months of association with Intrex also have the lowest averagevalues of per page indexing time.
Analysis of data pertaining to the document-related parameterstells us that indexing time, review time, and number of subject terms,per page, are all dependent on and become more consistent with in-creasing document length. There are also observable differentials ofindexing time per page among documents falling into different formatcategories. These differentials give us some insight into the effectsof different types of documents on the subject indexing process.

BIBLIOGRAPHY
1. Benenfeld, A. R. , Generation and Encoding of the ProjectIntrex Augmented Catalog Data Base, Electronic Systems Lab-oratory Report ESL-R-360, Massachusetts Institute of Tech-nology, Cambridge, Mass. , August, 1968, and also a paperpresented at the 6th Annual Clinic on Library Applications ofData Processing, University of Illinois, May 7, 1968.
2. Benenfeld, A. R. , Gurley, E. J. , and Rust, J. E. , CatalogingManual, Electronic Systems Laboratory Technical Memoran-dum ESL-TM-303, Massachusetts Institute of Technology,Camb.,idge, Mass. , February, 1967.
3. Overhage, Carl F. J. , and Harmon, R. J. , (eds. ) IntrexReport of a Planning Conference on Information TransferExperiments, M. I. T. Press, Cambridge, Mass. , 1965.
4. Project Intrex, Semiannual Activity Reports (PR-4, 15 Septem-ber 1967; and PR-5, 15 March 1968) Massachusetts Institute ofTechnology, Cambridge, Mass.
5. Stuntz, S. C. , Inputting Process to an Au mented Librar Cata-log, an Efficiency Study, B.S. Thesis, Department of ElectricalEngineering, Massachusetts Institute of Technology, Cambridge,Mass. , June, 1967.

APPENDIX A
DEures and Data Tabulations

12 10 8 6 4 2 0o
12
34
56
78
9
8 6 4 2 0
MO
NT
HS
OF
I N
TR
EX
EX
PE
RIE
NC
E
Fig
. 1C
ompo
site
Lea
rnin
g C
urve
s of
the
Cat
alog
ers
01
23
45
67
8
MO
NT
HS
OF
I N
TR
EX
EX
PE
RIE
NC
E
910
1112
Fig
. 2T
ime
His
tory
of t
he A
vera
ge N
umbe
r of
Sub
ject
Ter
ms
Ass
igne
dpe
r pa
ge
1314

10 8 6 4 2
10 4 2 00
12
34
56
78
910
1112
1314
MO
NT
HS
OF
INT
RE
X E
XP
ER
IEN
CE
X
X A
VG
. IN
DE
XIN
G T
IME
PE
R P
AG
E
0 A
VG
. RE
VIE
W T
IME
PE
R P
AG
E
EI A
VG
. NU
MB
ER
OF
SU
BJE
CT
TE
RM
S P
ER
PA
GE
X.1
1111
4
0--0
-0e0
0.00
.
01
2
OP-
.
11
34
56
78
MO
NT
HS
OF
INN
EX
EX
PE
RIE
NC
E
910
1112
Fig
. 3Le
arni
ng C
urve
and
Oth
er T
ime
His
tory
Cur
ves
for
Inde
xer
1
X A
VG
. IN
DE
XIN
G T
IME
PE
R P
AG
E
0 A
VG
. RE
VIE
W T
IME
PE
R P
AG
E
0 A
VG
. NU
MB
ER
OF
SU
BJE
CT
TE
RM
S P
ER
PA
GE
1314 11
Fig
. 4Le
arni
ng C
urve
and
Oth
er T
ime
His
tory
Cur
ves
for
Inde
xer
2

22
18
16
14
12
10
0
X AVG. INDEXING TIME PER PAGE
0 AVG. REVIEW TIME PER PAGE
o AVG. NUMBER OF SUBJECT TERMS PER PAGE
=1111
x
1 1 1 1
6 7 8 9
MONTHS OF INTREX EXPERIENCE
Fig. 5 Learning Curve and Other Time History Curves for Indexer 7
-16 -
I10
14
12
10
8
6
4
2
0
x AVG. INDEXING TIME PER PAGE
0 AVG. REVIEW TIME PER PAGE
X 13 AVG. NUMBER OF SUBJECT TERMS PER PAGE
X\ /
0
12
1 2 3 4 5 6
MONTHS OF INTREX EXPERIENCE
7 8 9
Fig. 6 Learning Curve and Other Time History Curves for Indexer 9
10
10
8
6
4
2
0
1 I II X AVG. INDEXING TIME PER PAGE I
0 AVG. REVIEW TIME PER PAGE
0 AVG. NUMBER OF SUBJECT TERMS PER PAGE
0
0 1 2 3 4 5 6 7 8 9 10
MONTHS OF INTREX EXPERIENCE
Fig. 7 Learning Curve and Other Time History Curves for Indexer 10
- 1 -

22
20
18
16
14
12
10
8
6
4
2
0
X AVG. INDEXING TIME PER PAGE
0 AVG. REVIEW TIME PER PAGE
0 AVG. NUMBER OF SUBJECT TERMS
PER PAGE
x
_
_
-
11
_
---
-
0 1 2 3 4 5 6
MONTHS OF INTREX EXPERIENCE
Fig. 8 Learning Curve and Other Time History Curves for Indexer 13
-18-

14 12 10 8 6 4 2 o o1
11
11
11
11
1
X A
VG
. IN
DE
XIN
G T
IME
PE
R P
AG
EO
AV
G. R
EV
IEW
TIM
E P
ER
PA
GE
O A
VG
. NU
MB
ER
OF
SU
BJE
CT
TE
RM
S P
ER
PA
GE
X
xx
x
x
x13
"00
O0
"....
"00
0-...
0".*
ZZ
In
1
000 2
34
56
78
910
1112
14.6
25.2
MO
NT
HS
OF
INT
RE
X E
XP
ER
IEN
CE
Fig
. 9S
ubje
ct In
dexi
ng T
ime,
Rev
iew
Tim
e, a
nd N
umbe
rof
Sub
ject
Ter
ms,
per
page
, ver
sus
Doc
umen
t Len
gth

-20-
Table 1
Learning Curve Data for All Indexers
MonthNumber
Number ofDocumentsin Sample
AverageIndexing Timemin. per page
StandardDeviation
1 308 11.09 8.69
2 380 9. 86 8.64
3 317 7.98 5.32
4 399 5.75 2.96
5 308 7.13 4.34
Table 2
Learning Curve Data for All Student Indexers
MonthNumber
Number ofDocumentsin Sample
AverageIndexing Timemin. per page
StandardDeviation
1 166 10.40 9. 90
2 155 8.66 7.78
3 76 5.76 2.84
4 38 5.76 2.38
5 12 6.43 4.01
-21-
Table 3
MonthNumber
Learning Curve Data for All Librarian Indexers
Number of AverageDocuments Indexing Time Standardin Sample min:_aer alp_ Deviation
1 142 11.82 7.13
2 225 10.73 9.16
3 241 8.53 5.65
4 361 5.75 3.06
5 296 7.16 4.35
6 142 6.83 3.50
7 125 9.60 3.76
8 180 5.97 4.93
9 112 7.49 3.67
10 89 7.45 3.64
11 12 6.85 2.79
12 57 5.60 2.32
13 25 4.59 2.75
14 34 6.78 4.23

-22-
Table 4
Time History Data of the Mean per page Number ofSubject Terms Assigned by All Indexers
MonthNumber
Number ofDocumentsin Sample
Average Numberof Subject Termser a.pp_ie_
StandardDeviation
1 308 5.34 3.48
2 380 4.97 3.02
3 317 4.24 2.57
4 399 4.39 2.25
5 308 4.82 3.27
6 142 5.12 3.02
7 125 6.25 2.73
8 180 4.28 2.70
9 112 5.57 3.81
10 89 4.16 2.12
11 12 5.95 4.26
12 57 3.69 2.24
13 25 2.69 1.72
14 34 4.01 2.68

-23-
Table 5
Learning Curve Data of Individual Indexers
IndexerCode Number
MonthNumber
Number ofDocumentsin Sample
AverageIndexing Timemin. per page
StandardDeviation
1
2
1
2
3
4
5
6
8
9
10
11
12
13
14
1
2
3
4
5
6
7
8
9
16
49
16
120
86
69
42
12
12
1
32
9
3
6
41
60
101
95
17
5
66
33
7.25
4.50
4.44
4.62
4.21
5.66
3.79
6.99
7.58
3.44
4.84
3.42
4.22
3.94
4.77
4.86
4.55
6.18
4.74
3.75
4.78
5.68
3.40
3.85
1.50
2.25
2.16
2.54
2.46
3.81
2.54
0.0
2.06
1.74
1.17
1.52
2.55
3.31
2.34
2.45
2.68
0.75
6.11
2.66

-2 4 -
Table 5 (Contd. )
IndexerCode Number
MonthNumber
Number ofDocumentsin Sample
AverageIndexing Timealit page Standard
Deviation
2 10 53 8.10 4.07
11 11 7.74 2.38
12 25 6.57 2.28
13 16 5.24 2.99
14 31 7.03 4.34
7 1 49 14.71 5.98
2 47 20.36 12.07
3 44 12.10 4.86
4 25 8.94 2,40
5 31 12.56 4.18
6 23 8.16 4.11
7 50 10.52 3.41
8 38 10.36 3.67
9 40 9.15 4.43
10 24 6,03 2.68
9 1 30 11.90 6.72
2 35 9.56 4.50
3 48 10.44 5.53
4 35 9.35 3.86
5 44 11.34 5.36
6 26 9.84 3.31
7 31 10.02 2.94
8 16 6.33 1.90

-25
Table 5 (Contd. )
IndexerCode Number
MonthNumber
Number ofDocumentsin Sample
AverageIndexing Timex12in page
StandardDeviation
9 9 27 7.39 2.02
10 1 30 6.80 2.67
2 34 11.68 4.47
3 36 7.44 3.70
4 38 7.55 2.94
5 33 7.13 2.97
6 7 7.57 3.62
7 39 8.69 4.23
8 18 5.81 1.91
13 1 11 23.42 5.81
2 19 16.23 7.52
3 37 10.49 7.32
4 42 5.38 1.38
5 7 6.63 1.28
14 1 4 6.45 0.36
30 1 31 13.01 19.08
2 72 10.75 10.02
3 30 6.58 3.28
4 19 4.34 1.33
32 1 13 9.05 5.63
2 2 4.40 2.26
33 1 10 10.90 4.11
2 34 9.92 5.07

-26-
Table 5 (Contd. )
IndexerCode Number
MonthNumber
Number ofDocumentsin Sample
AverageIndexing Timemin. per page
StandardDeviation
33 3 24 5.95 1.29
34 1 11 16.92 5.81
35 1 16 9,50 4.07
2 15 6.96 2.09
3 5 6.70 2.60
4 19 7.23 3.12
5 12 6.34 4.17
36 1 14 8.29 3.45
37 1 14 5.38 2.72
2 8 3.66 0.97
39 1 9 5.07 2.20
2 24 4.27 2.25
3 17 4.83 1.91
40 1 23 12.34 3.04
41 1 2 7.06 1.94
42 1 2 7.00 3.00
43 1 2 4.94 2.06
44 1 2 7.50 5.00
45 1 8 5,30 3.67
46 1 5 6.25 0.82
-27 -
Table 6
Time History Data of the Mean Review Timefor Individual Indexers
IndexerCode Number
MonthNumber
Number ofDocumentsin Sample
AverageReview Timemin. per page
StandardDeviation
1
2
2
3
4
5
6
8
9
10
11
12
13
14
2
3
4
5
6
7
8
9
10
11
5
6
120
86
69
42
12
12
1
32
9
3
9
41
101
95
17
5
66
33
53
11
1. 21
1. 18
2. 15
3. 01
7. 31
1. 69
3. 32
1. 73
O. 78
2. 34
2, 17
2. 39
1. 89
1. 62
2. 50
3. 19
4. 69
1. 80
3. 66
3. 79
4.73
5. 49
0, 41
0. 91
1. 71
1. 65
5.78
1. 40
1. 70
0.75
O. 0
1. 73
2. 32
1. 88
1. 03
1. 09
3. 32
1. 99
2. 24
O. 68
2. 10
2. 48
3. 66
7. 56

-28-
Table 6 (Contd. )
IndexerCode Number
MonthNumber
Number ofDocumentsin Sam 21.e
AverageReview Timemin. per page
StandardDeviation
2 12 25 2.83 1.43
13 16 2.44 1.66
14 31 3.01 2,10
7 1 49 3.79 2.95
2 47 3.61 3.98
3 44 6. 99 5.77
4 25 5.59 1.68
5 31 3.64 2.78
6 23 1.99 1.37
7 50 4.07 3.26
8 38 4.59 4.25
9 40 3.68 3.70
10 26 1.07 0.77
9 1 30 6.51 4.37
2 35 5.41 2.85
3 48 4.10 3.11
4 35 2.50 1.81
5 44 4.11 4.27
6 26 5.69 5.28
7 31 4.84 3.54
8 16 2.71 1.60
9 27 2.90 1.97

-29-
Table 6 (Contd. )
IndexerCode Number
MonthNumber
Number ofDocumentsin Sample
AverageReview Timemin. per page
StandardDeviation
10 1 30 4.65 3.01
2 34 6.81 3.72
3 36 2.70 1.99
4 38 2.39 1.99
5 33 2.35 1.42
6 7 9.17 4.44
7 39 3.60 2.90
8 18 1.66 1.34
13 1 11 8.51 5.04
2 19 3.88 2.56
3 37 2.60 2.58
4 42 2.34 2.04
5 7 4.00 1.80
14 1 4 1.87 0.36
30 1 31 4.85 3.03
2 72 4.18 2.44
3 30 2.77 1.93
4 19 2.85 2.05
32 1 15 4.76 3.12
33 1 10 2.94 1.25
2 34 3.34 1.69
3 24 3.98 1.16

-30-
Table 6 (Contd. )
IndexerCode Number
MonthNumber
Number ofDocumentsin Sample
AverageReview Timemin. per page
StandardDeviation
34 1 11 5. 04 1. 37
35 1 16 3. 27 1. 41
2 15 2. 15 0. 97
3 5 4. 40 1. 32
4 19 3. 76 1. 39
5 12 5. 66 1. 53
36 1 14 4. 99 2. 44
37 1 14 4. 36 5. 84
2 8 1. 12 O. 75
39 1 9 3. 40 1. 43
2 24 2. 26 1. 21
3 17 1. 81 1. 43
40 1 23 2. 37 1. 17
41 1 2 3. 37 0. 62
42 1 2 3. 33 0. 00
43 1 2 1. 68 0. 71
44 1 2 6. 00 2. 50
45 1 8 2. 86 2. 43
46 1 5 9. 40 3. 45

-31-
Table 7
Time History Data of the Mean per page Number of SubjectTerms Assigned by Individual Indexers
IndexerCode Number
MonthNumber
Number ofDocumentsin Sample
Average Numberof Subject Termsper page
StandardDeviation
1
2
1
2
3
4
5
6
8
9
10
11
12
13
14
1
2
3
4
5
6
7
8
9
16
49
16
120
86
69
42
12
12
1
32
9
3
6
41
60
101
95
17
5
66
33
2.19
2.20
2.30
3.73
2.95
3.98
1.91
3.89
3.09
2.33
2.75
2.31
3.44
2.46
3.23
3.20
3.88
4.02
4.05
3.67
4.57
4.12
0.62
0.97
0.92
1.62
1.29
1.80
1.11
2.36
1.19
0.0
1.58
2.10
0.10
0.81
1.55
1.71
1.55
1.36
1.33
0.77
3.02
1.78

-32-
Table 7 (Contd. )
IndexerCode Number
MonthNumber
Number ofDocumentsin Sample
Average Numberof Subject Termsper _page
StandardDeviation
2 10 53 4.84 2.23
11 11 6.64 4.08
12 25 4.89 2.38
13 16 2.89 1.42
14 31 4.07 2.81
7 1 49 9,55 4.47
2 47 6.56 2.80
3 44 4.64 2.33
4 25 4.81 2.48
5 31 7.63 4.39
6 23 3.91 1.68
7 50 5.64 2.12
8 38 5.38 1.91
9 40 6,03 1.48
10 26 3.20 1.53
9 1 30 3.31 1.46
2 35 4.79 2.12
3 48 5.51 3.26
4 35 6.14 2.56
5 44 7.29 5.03
6 26 8.79 3.57
7 31 8.06 3.09
8 16 5.47 2.04
9 27 7,51 5.78

-33-
Table 7 (Contd. )
IndexerCode Number
MonthNumber
Number ofDocumentsin Sample
Average Numberof Subject Termsarage Standard
Deviation
10 1 30 3.71 1.52
2 34 7.23 2.70
3 36 4.37 1.95
4 38 5.97 3.40
5 33 5.72 2.64
6 7 8.26 2.42
7 39 5.91 2.54
8 18 5.36 2.56
13 1 11 7.07 3.48
2 19 5.08 1.94
3 37 4.65 1.97
4 42 3.56 1.34
5 7 4.61 1.14
14 1 4 3.29 0.79
30 1 31 5.45 2.52
2 72 5.92 3.86
3 30 4.56 3.46
4 19 5.13 2.82
32 1 13 8.08 3.71
2 2 6.15 2.52
33 1 10 5.45 1. 99
2 34 6.44 2. 99
3 24 4.34 1.43

-34-
Table 7 (Contd. )
IndexerCode Number
MonthNumber
Number ofDocumentsin Sample
Average Numberof Subject Termsper page
StandardDeviation
34 1 11 4.88 2.04
35 1 16 6.82 2.66
2 15 6.80 4.47
3 5 5.53 1.88
4 19 5.54 2.68
5 12 5.55 3.38
36 1 14 4.05 1.14
37 1 14 3.88 1.68
2 8 2.69 1.14
39 1 9 2.92 1.05
2 24 2.13 1.07
3 17 1.85 0.53
40 1 23 4.53 1.57
41 1 2 4.12 0.87
42 1 2 6.00 1.33
43 1 2 3.26 1.53
44 1 2 4.75 2.25
45 1 8 1.70 0.85
46 1 5 3.50 0.84

-35-
Table 8
Average Indexing Time, per page, versus Document Length,for All Experienced Indexers
Numberof Pages
Number ofDocumentsin Sample
AverageIndexing Timemia_p_e_i_2_2_.a e
StandardDeviation
1 17 13. 00 7. 34
2 649 7. 24 3. 96
3 269 6. 92 4. 37
4 152 7. 04 3. 36
5 111 6. 78 3. 38
6 87 6. 16 3. 04
66 5. 77 2. 73
8 73 5. 06 2. 42
9 27 5.20 2. 49
10 30 3. 97 1. 84
11 20 4. 91 2. 08
12 16 3. 99 1. 81
14. 6 (average forsample of
32 3. 59 1. 32
13-19 pages)
25. 2 (average forsample of
12 3. 18 1. 42
20-34 pages )
over 100 4 0. 71 0. 03

-36-
Table 9
Average Review Time, per page, versus Document Length,for All Experienced Indexers
Numberof Pages
Number ofDocumentsin Sample
AverageReview Timemin, per page
StandardDeviation
1
2
3
26
910
445
10.42
4.45
3.99
7.13
3.71
3.14
4 237 3.59 2,59
5 169 2.98 2.12
6 125 2.39 1.63
7 97 1.95 1.16
8 97 1.81 1.30
9 58 2.03 1.49
10 56 1.78 1.33
11 37 1.45 1.02
12 28 1.78 1.08
14.6 (average forsample of
32 1.00 1.05
13-19 pages)
25.2 (average forsample of
12 0.91 0.64
20-34 pages)
over 100 4 0.13 0.02
-37-
Table 10
Average per page Number ofversus Document Length, for
Subject Terms AssignedAll Experienced Indexers
Numberof Pages
Number ofDocumentsin Sample
Average Numberof Subject Termsper page
StandardDeviation
1
2
3
4
17
649
269
152
13.35
5.36
4.85
4.76
8.86
2.65
2.91
2.39
5 111 4.33 1.99
6 87 3.76 2.05
7 66 3.32 1.71
8 73 3.41 1.63
9 27 3.02 1.58
10 30 2.68 1.63
11 20 2.62 0.89
12 16 2.46 0.92
14.6 (average forsample of
32 2.12 1.06
13-19 pages)
25.2 (average forsample of
12 1.80 0.89
20-34 pages)
over 100 4 0.42 0.03

-38-
Table 11
Average per page Indexing Time of DocumentsGrouped by Format
Number of AverageFormat Documents Indexing TimeCatego ly. in Sample min. per page
Textbook 4 0.71
Journal Article 605 6.83
Letters JournalArticle 344 9. 35
ConferenceProceedingsArticle 597 5.10
Abstract 1 13.00
Bibliography 1 0.97
Reference Book 4 2.18
Table 12
StandardDeviation
AverageNumberof Pages
0.30 282.75
4.00 6.34
4.11 2.55
2.56 2.86
0.0 1.00
0.0 34.00
0.62 11.25
Average per page Number of Assigned Subject Termsfor Documents Grouped by Format
FormatCategory
Textbook
Journal Article
Letters JournalArticle
ConferenceProceedingsArticle
Abstract
Bibliography
Reference Book
Number ofDocumentsin Sample
Average Numberof Subject Termsper_page
StandardDeviation
AverageNumberof Pages
4 0.18 0.14 282.75
605 4.35 2.54 6.34
344 6.58 3.64 2.55
597 4.03 2.24 2.86
1 9. 00 0. 0 1. 00
1 1.62 0.0 34.00
4 2.09 1.30 11.25

-39-
Table 13
Average per page Indexing Time of Documents Groupedby the Author's Level of Approach
Level of Number of Average AverageApproach Documents Indexing Time Standard NumberCategory in Sample min. per page Deviation of Pages
Professional inthe author'ssubject area 290 5.82 3.93 3.29
Graduate Student 1235 6.91 3.88 5.31
College Senior 22 6.51 3.28 5.59
Table 14
Average per page Indexing Time of Documents Groupedby Subject Area
Subject Number of Average AverageArea Documents Indexing Time Standard NumberCategory in Sample min. per page Deviation of Pages
Radio frequency,microwave, andoptical spectros -copy of liquidsand solids. 2375 7.98 6.09 5.21
High temperaturemetallurgy 116 5.93 3.09 2.32

-40-
Table 15
Average per page Indexing Time of Documents Groupedby Author's Purpose
Author's Number ofPurpose DocumentsCategory in Sample
AverageIndexing Timemin. per page
StandardDeviation
AverageNumberof Pages
Report on theoreti-cal research 355 6.79 4.23 5.33
Report on experi-mental research 504 6.74 3.62 3.17
Report on theoreti-cal and experimen-tal research 553 6.73 3.64 4.58
Report on adevelopment orapplication 74 6. 63 5.42 5.04
Critical review 12 6.88 5.65 7.00
Non-critical review 28 5.94 3.12 7.71
Critical comment 16 6.58 4.18 2.06
Non-criticalcomment 4 4.66 1.87 7.75
Textbook 3 0.57 0.22 303.00

APPENDIX B
Summary of Personal Data by Code Number
Status; Date of Employment by Project Intrex; Field of Study;
1 Librarian; February 1967; English Literature (B.A.), LibraryScience (M. L.S. ).
2 Librarian; February 1967; Fine Arts (B.A.), Library Science(B.A. ).
Librarian; May 1967; History (B.A.), Library Science(M. L. S . ).
9 Librarian; May 1967; Chemistry (B.S. ), Library Science(M. L.S. plus Advanced Certificate ).
10 Librarian; July 1967; Journalism (B.S.).
13 Librarian; November 1967; Secondary School Science Teaching(Certificate).
14 Student (Graduate); December 1967; Physics (B.S.).
30 Student (Senior); November 1967; Electrical Engineering.
32 Student (Senior); November 1967; Unknown.
33 Student (Junior); November 1967; Electrical Engineering.
34 Student (Junior); November 1967; Mechanical Engineering.
35 Student (Senior); November 1967; Physics.
36 Student (Junior); November 1967; Physics.c.-
37 Student (Junior); November 1967; Electrical Engineering$
39 Student (Freshman); December 1967; Undecided.
40 Student (Senior); March 1968; Physics.
41 Student (Sophomore); February 1968; Aeronautical and Astro-nautical Engineering.
42 Student (Junior); March 1968; Chemical Engineering.
43 Student (Senior); March 1968; Chemistry.
-41-

-42-
Status ; Date of Employment by Project Intrex; Field of Study;
44 Student (Senior); March 1968; Biology.
45 Student (Junior); March 1968; Electrical Engineering.
46 Student (Junior); March 1968; Mathematics.

a)
014 sV 4 Cal
E0 .43'n
(/) Z
rd
APPENDIX C
Sample Recording Form
4-4
b0,"4
a) u .r4+a X k a)0 a) #71 a) E0 ro .r4
C) 1-54E-1
2312 1 007 BB B 8 20 39 12-67 01 016 0 01 17
3730 1 005 BB T 8 13 02 1-68 12 035 0 01 15
2820 2 010 CC B 1 15 13 2-68 04 040 0 07 08
1472 1 023 DD ED 9 47 07 7-68 02 075 1 10 23
Card Column Assignments:
1-4 12-14 18-19 23-24 28 32-33 37-38 42-4.3 47-49 53 57-58 62.63
-43-

APPENDIX D
Listing of Files from which Data were Gathered
1 - 149 226 -230
162 232 - 246
166 248 - 255
174 259
181 269
187 270
193 272
206 273
213 275
216 276
218 285
219 290 - 294
223 296 - 309
224 316 - 336

APPENDIX E
Computer Program
6 SUMSQ= O.
M=0
N=0
SUM=0.
1 READ(5, 2) I, J
2 FORMAT (11X, 13, 47X, 12)*
IF (I) 3, 4, 4
4 N=N+1
M=M+1
X=FLOAT(J)/FLOAT(I)
SUMSQ=SUMSQ+X**2
SUM=SUM+X
GO TO 1
3 AVG=SUM/FLOAT(N)
AGV=FLOAT(M)/FLOAT(N)
VAR=SUMSQ/FLOAT(N)-AVG**2
WRITE(6, 5) N, AVG, VAR, AGV
5 FORMAT (5H N = , 14, 5X, 6HAVG = , F11. 6, 5X6HVAR =
F11. 6, F11. 6)
IF (J) 7, 6, 6
7 STOP
END
The independent parameter to be worked with (indexing time, reviewtime, or number of subject terms) is specified by putting its datalocation (card columns) in the read statement.
-45-

APPENDIX F
A Note on Statistics
Individual variables, indexing time, review time, or numberof subject terms per document page, are considered as independent,identically distributed, discrete random variables. Under these con-siderations, all data groupings are assumed to have a Gaussian proba-bility distribution, although this assumption does not hold up well forless than about ten sample values. The mean (average) and standarddeviation for all sample values in a data grouping were derived withthe aid of computer processing and calculated as the sample mean andsample standard deviation for data fulfilling the above criteria. The
formulations used were:
1Average = x.ni=1
(n n
7 1/2Standard Deviation = -1- E x.2 - -1- Z x.n 1 n 1
i= 1 1=1
where there are "n" documents represented in the data grouping andthe "X.'s" are the sample values themselves, as for example, time toindex divided by number of pages for a single record.
The standard deviation is a relative quantitative measure of thespread of the data about the mean. For a time Gaussian variable,some 68 percent of all sample points fall within the range of one stan-dard deviation on either side of the mean. Many standard deviationsin this study approach or exceed the associated mean values, tellingus that our data does not conform to Gaussian theory by specifying arange approaching or passing through zero. Under these conditions,the standard deviation is still a valid measure of data spread; how-ever, the data is somewhat skewed and percentages of data pointslying within some range of the mean becomes uncalculable. That is,
-46-

-47-
relative magnitudes of deviations are still a qualitative measure ofthe spread of data about the mean.
Of particular interest in this study is the meaning of the extent
of overlap of the standard deviations associated with different data
groupings. This is largely a qualitative judgement to be made on the
nature of the data groupings involved and the magnitude of the dif-ference in mean values and extent of overlap.