does greater subjective survival affect future health
TRANSCRIPT
Does greater subjective survival
affect future health behaviour
patterns of older English adults: analysis of ELSA?
Carol Jagger, Jean Adams, Elaine Stamp, Daniel Nettle, Eugene MG Milne

Unhealthy behaviours are costly
• Unhealthy behaviours are key determinants of morbidity and mortality
• Smoking, not engaging in regular physical activity, excess alcohol consumption alcohol and unhealthy diet infers 3.5 times higher risk of death over a 20-year period
• Costs to the UK health care system of these behaviours estimated to be £13.3bn per annum
• Worldwide, elimination of these 4 unhealthy behaviours could prevent – up to 80% of cardiovascular disease and type 2 diabetes – one third of cancers (WHO 2008-2013 Action Plan)

Unhealthy behaviours remain common
• 1/5 adults are current smokers
• 1/3 consume more than recommended levels of alcohol
• 2/3 do not meet physical activity recommendations
• 3/4 consume less than the recommended five 80g portions of fruit and vegetables per day
• WHY?????????

Rationale
• Previous work in this cohort (JECH 2014;68:818-825) showed subjective survival correlated well with actual survival BUT – Only in those 65 years of age and younger – Only higher income group
• Subjective survival could be assumed to be a measure of an individual’s assessment of their health risks
• Individuals may decide rationally not to engage in healthy behaviours, based on their assessment of the benefits – they weigh up the likely benefits of any particular health
promoting behaviour against their assessment of the health risks they are exposed to

Aims
• To assess whether greater subjective survival:
– is associated with healthier behaviours
– increases the probability of improved health behaviours
– decreases the probability of worsening health behaviours

Methods
• Data: – English Longitudinal Survey of Ageing (ELSA) – wave 1 (2002-03) and wave 5 (2010-11) – N=6242
• Subjective survival – “What are the chances [from 0-100] that you will live to be
x years or more?”. – Target age, x, varied with participants’ age, ranging from 1-
25 years older than current age – Due to response spikes at 25%, 50%, and 75%, responses
were grouped into tertiles for analysis: low (0-33% chance of survival), medium (33-66%), high (66-100%).

Measures
• Health behaviours (self-reported): – cigarette smoking (no/yes)
– physical activity level (moderate or high/low or sedentary)
– alcohol consumption (<1-2 times per week/more)
• Covariates: – Demographic (sex, age group, marital status)
– Health (IADL/ADL disability, self-rated health, depression)
– Socio-economic status (income)

Analysis
• Cross-sectional (wave 1): – Ordinal logistic regression models of each health behaviour
(outcome) by anticipated survival – Unadjusted – Adjusted for: sex, age group, marital status, IADL/ADL disability,
self-rated health, depression, income
• Longitudinal (waves 1 and 5): – Multinomial logistic regression of change in healthy behaviour
between waves 1 and 5 (outcome) by anticipated survival – Unadjusted – Adjusted for baseline health behaviour – Additionally adjusted for: sex, age group, marital status,
IADL/ADL disability, self-rated health, depression, income

Baseline health behaviour by subjective survival
Baseline
variable Level
All
participants,
N (%)
Health behaviours at wave 1 (%)
Non-
smoker
Alcohol
<twice/week
Mod-
high
activity
All
participants
-- 6128 5121
(83.6)
4311
(70.4)
4565
(74.6)
Anticipated
survival
(N=6051)
Low 761 (12.6) 613
(80.6)
566 (74.5) 446
(58.6)
Moderate 3101 (51.3) 2555
(82.4)
2186
(70.5)
2321
(75.0)
High 2189 (36.2) 1889
(86.3)
1503
(68.7)
1755
(80.2)
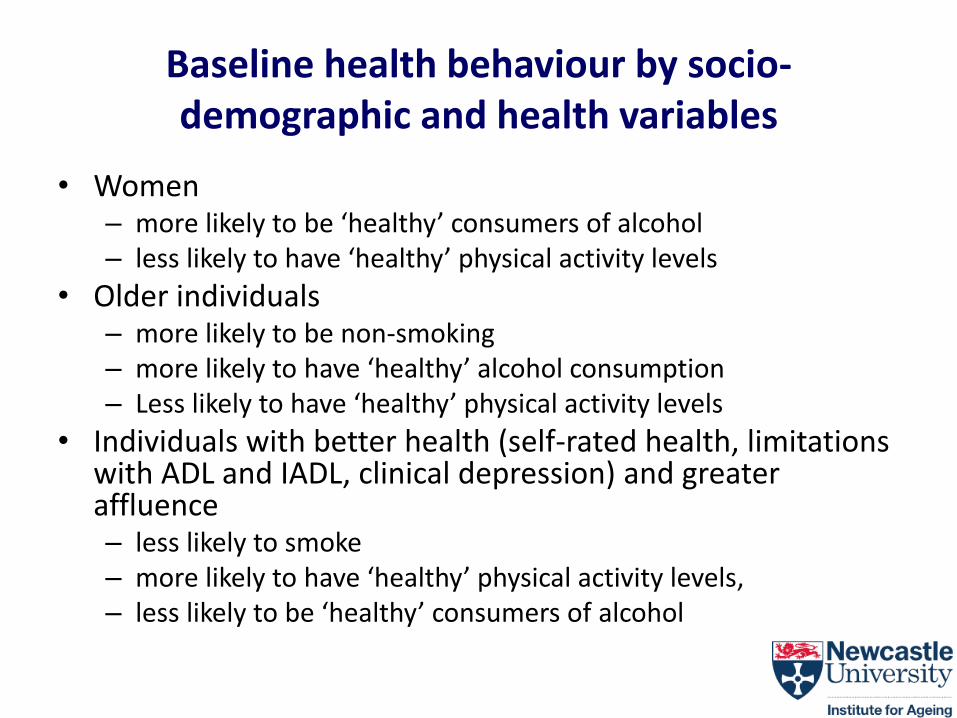
Baseline health behaviour by socio-demographic and health variables
• Women – more likely to be ‘healthy’ consumers of alcohol – less likely to have ‘healthy’ physical activity levels
• Older individuals – more likely to be non-smoking – more likely to have ‘healthy’ alcohol consumption – Less likely to have ‘healthy’ physical activity levels
• Individuals with better health (self-rated health, limitations with ADL and IADL, clinical depression) and greater affluence – less likely to smoke – more likely to have ‘healthy’ physical activity levels, – less likely to be ‘healthy’ consumers of alcohol
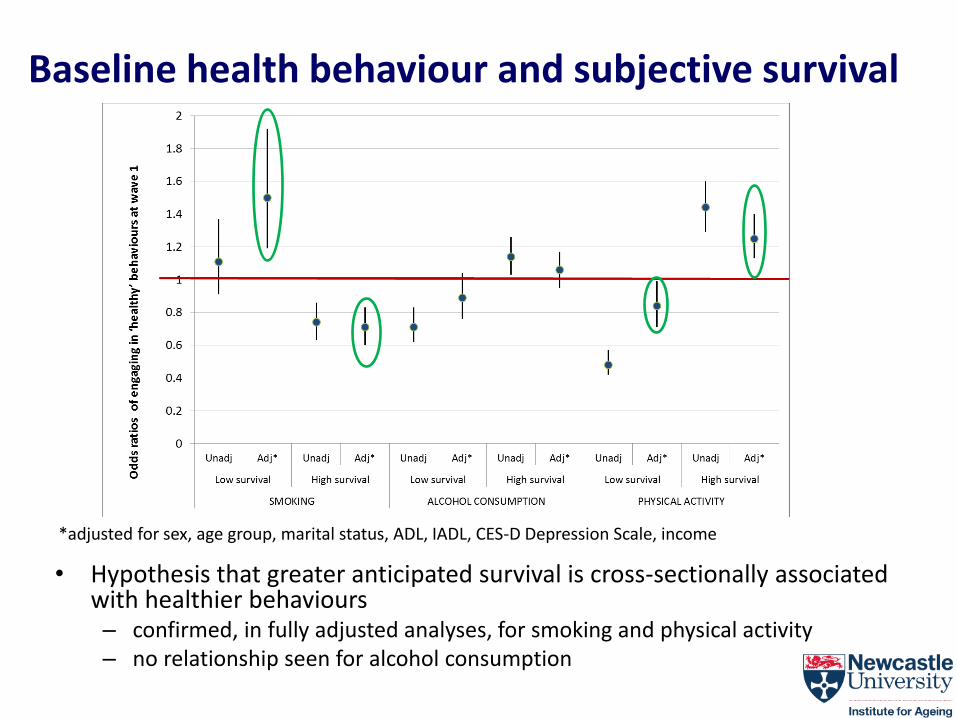
Baseline health behaviour and subjective survival
• Hypothesis that greater anticipated survival is cross-sectionally associated with healthier behaviours – confirmed, in fully adjusted analyses, for smoking and physical activity – no relationship seen for alcohol consumption
*adjusted for sex, age group, marital status, ADL, IADL, CES-D Depression Scale, income
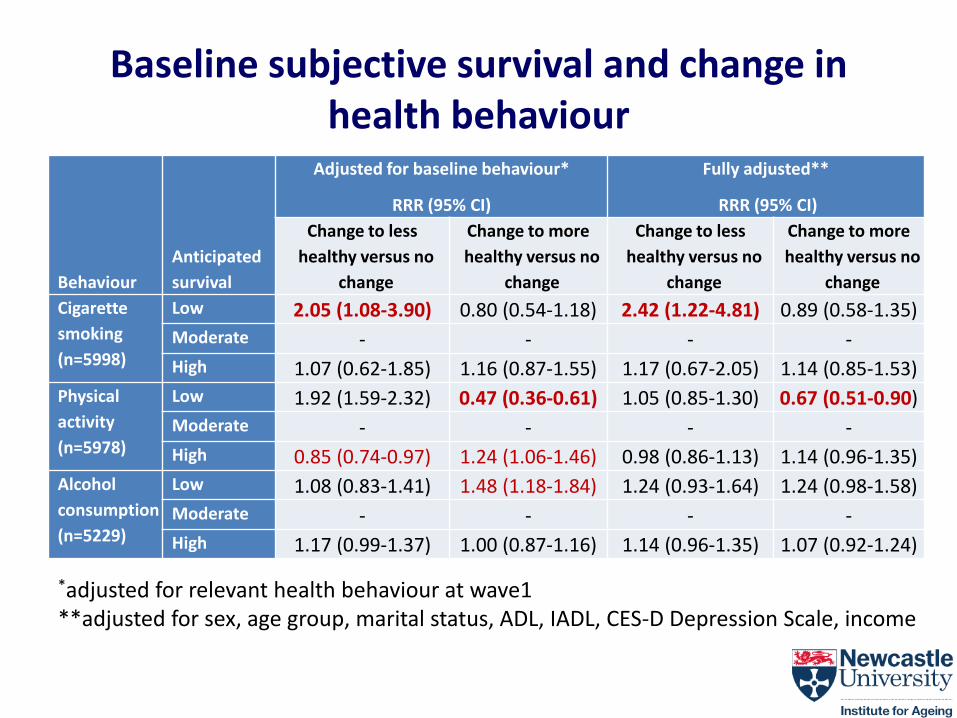
Baseline subjective survival and change in health behaviour
Behaviour
Anticipated
survival
Adjusted for baseline behaviour*
RRR (95% CI)
Fully adjusted**
RRR (95% CI)
Change to less
healthy versus no
change
Change to more
healthy versus no
change
Change to less
healthy versus no
change
Change to more
healthy versus no
change
Cigarette
smoking
(n=5998)
Low 2.05 (1.08-3.90) 0.80 (0.54-1.18) 2.42 (1.22-4.81) 0.89 (0.58-1.35)
Moderate - - - -
High 1.07 (0.62-1.85) 1.16 (0.87-1.55) 1.17 (0.67-2.05) 1.14 (0.85-1.53)
Physical
activity
(n=5978)
Low 1.92 (1.59-2.32) 0.47 (0.36-0.61) 1.05 (0.85-1.30) 0.67 (0.51-0.90)
Moderate - - - -
High 0.85 (0.74-0.97) 1.24 (1.06-1.46) 0.98 (0.86-1.13) 1.14 (0.96-1.35)
Alcohol
consumption
(n=5229)
Low 1.08 (0.83-1.41) 1.48 (1.18-1.84) 1.24 (0.93-1.64) 1.24 (0.98-1.58)
Moderate - - - -
High 1.17 (0.99-1.37) 1.00 (0.87-1.16) 1.14 (0.96-1.35) 1.07 (0.92-1.24)
*adjusted for relevant health behaviour at wave1 **adjusted for sex, age group, marital status, ADL, IADL, CES-D Depression Scale, income
Strengths • Data from a large, population-based cohort
study - increases representativeness and generalisability of findings
• Cross-sectional and longitudinal analyses with a wide range of potential confounding variables
Limitations • Some behaviour changes rare (particularly for smoking) - small
numbers especially older ages
• Health behaviours self-reported – bias likely to be consistent over time
– longitudinal analyses less susceptible to misclassification
• Variable target age for anticipated survival may mean like may not have been compared with like across participants. – Analyses repeated additionally controlling for the difference between
target age and age at data collection but no change in conclusions
• Anticipated survival may not be good measure of perceived uncontrollable threats to health – But it does correlate well with actual survival in this cohort

Conclusions 1
Aims
• To assess whether greater subjective survival is associated with healthier behaviours – Greater anticipated survival was cross-sectionally
associated with lower likelihood of smoking and higher physical activity levels, even after adjustment for confounders
– No relationship with alcohol consumption though suggestion that greater anticipated survival associated with HIGHER alcohol consumption
Conclusions 2
• To assess whether greater subjective survival increases the probability of improved health behaviours and/or decreases the probability of worsening health behaviours – Individuals with low anticipated survival were more likely
to take up a less healthy behaviour with regards to smoking and physical activity
• Individual assessments of uncontrollable threats to health (low survival probability) may be important determinants of change in some health behaviours, particularly smoking and physical activity
Acknowledgements
• British Medical Association Strutt and Harper Award
• AXA Research Fund

Does greater subjective survival
affect future health behaviour
patterns of older English adults: analysis of ELSA?
Carol Jagger ([email protected])
Jean Adams, Elaine Stamp, Daniel Nettle, Eugene MG Milne

Inequalities UK local areas 2006-2011
LE at birth DFLE at birth
2006-8 2009-11 2006-8 2009-11
Me
n
Mean 77.7 78.7 62.8 63.2
0.10 75.3 76.5 58.2 58.6
0.90 79.7 80.7 66.9 67.6
10-90% range 4.4 4.2 8.8 9.0
Wo
me
n
Mean 81.8 82.7 63.9 63.8
0.10 79.8 80.9 59.2 59.2
0.90 83.6 84.4 68.2 68.2
10-90% range 3.8 3.5 9.0 9.0
Inequalities in LE and DFLE in the UK are large
Differences in SES and health behaviours explain some of the variation

Baseline health behaviour and subjective survival
Cigarette smoking
OR (95% CI2)
Alcohol consumption
OR (95% CI)
Physical activity
OR (95% CI)
Anticipated
survival
Unadjusted Adjusted* Unadjusted Adjusted* Unadjusted Adjusted*
Low 1.0 1.0 1.0 1.0 1.0 1.0
Moderate 1.13
(0.92-1.38)
1.45
(1.15-1.83)
0.83
(0.68-1.02)
0.91
(0.73-1.14)
2.11
(1.79-2.50)
1.11
(0.91-1.36)
High 1.53
(1.23-1.90)
1.94
(1.50-2.50)
0.76
(0.62-0.94)
0.89
(0.70-1.13)
2.85
(2.39-3.41)
1.13
(0.91-1.41)
* Adjusted for age, sex, marital status, self-rated health, ADL/IADL, CES-D (Centre for Epidemiologic Studies Depression Scale), Index of Multiple Deprivation
• Hypothesis that greater anticipated survival is cross-sectionally associated with healthier behaviours – only confirmed, in fully adjusted analyses, for smoking – no relationship seen for alcohol consumption or physical activity.