domestic biogas projects and carbon revenue; a … · domestic biogas projects and carbon revenue;...
TRANSCRIPT
Domestic biogas and carbon revenue
1
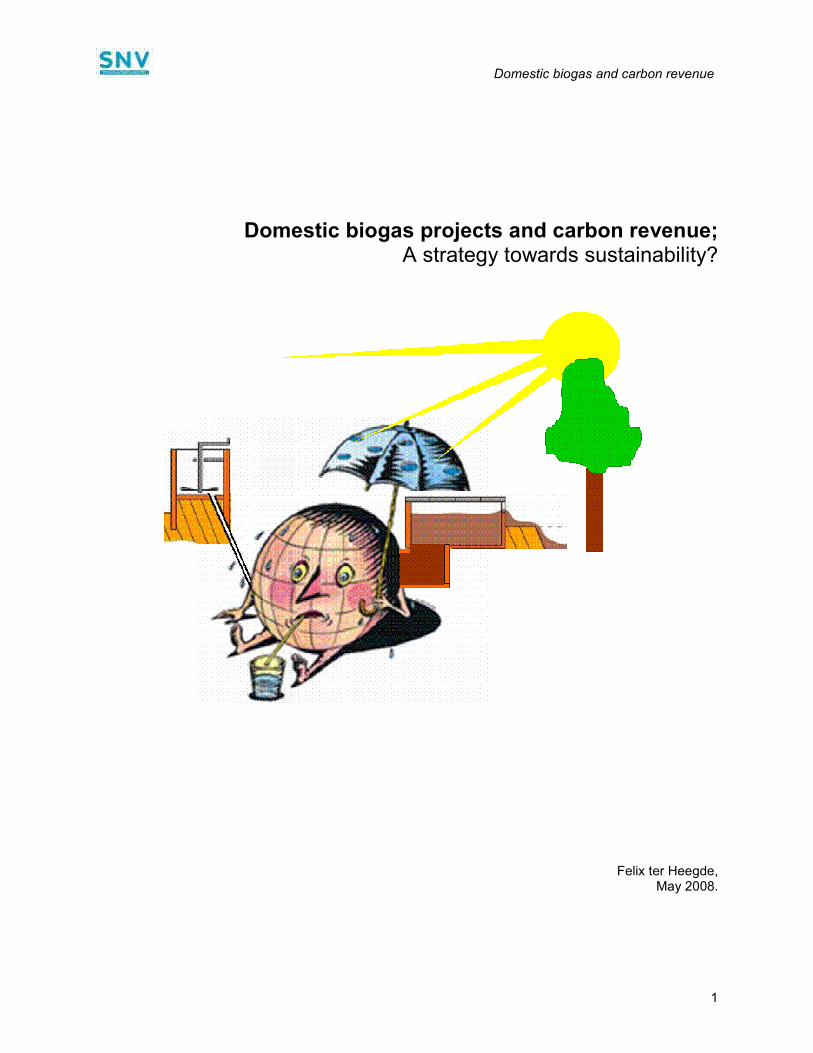
Domestic biogas projects and carbon revenue; A strategy towards sustainability?
Felix ter Heegde, May 2008.
Domestic biogas and carbon revenue
2
This paper explores the opportunities for large scale domestic biogas dissemination programmes to generate revenue from greenhouse gas reductions resulting from the operation of the biogas installations. Chapter 1 of this paper explains the origins of GHG reduction by domestic biogas installations. In chapter 2 the outline of compliance and voluntary based mechanisms for GHG reduction is addressed, and subsequently in some detail the specific methodologies available for domestic biogas are presented. In chapter 3, then, peculiarities of the presented methodologies are discussed, concluding with an assessment of the applicability of compliance-based versus voluntary-based methodologies for domestic biogas programmes. Chapter 4 discusses the value of carbon revenue for biogas dissemination programmes and the paper ends with some conclusions in chapter 5. Abstract. Domestic biogas installations principally reduce greenhouse gas (GHG) emissions in three ways: by changing the manure management modality; by substituting fossil fuels and non-renewable biomass for cooking (and to a smaller extent for lighting) with biogas, and; by substituting chemical fertilizer with bio-slurry. The actual reduction of greenhouse gas emissions by domestic biogas installations depends on the local situation, the size of the installation and the way the installation is operated, whereas the “claimable” GHG emission reduction depends on the applied carbon-accounting methodology. Emission reduction units, measured in CO2 equivalents, can be traded on the compliance market (in the framework of the Clean Development Mechanism) or the voluntary market. For both markets, specific methodologies for domestic biogas are available. Following an approved CDM methodology will produce certified emission reduction units (CERs) that are tradable on the compliance market. CERs thus are more attractive to potential buyers as compared with the emission reductions produced under a voluntary scheme (VERs). CDM procedures, however, are significantly more complicated, lengthy and expensive than (most of the) voluntary schemes. On the other hand, the absorption capacity of voluntary schemes may be limited, introducing a financial risk for larger projects. For both markets the uncertainties beyond the current commitment period hamper a longer-term financial planning that includes carbon revenue. The voluntary Gold Standard biodigester methodology seems –to some extent- an exception as its methodology and monitoring requirements meet –or even exceed- CDM standards but allows the project more flexibility in choosing baseline GHG reduction components and project size. For the compliance market there are to date only two examples of a domestic biogas projects that have been run through the entire carbon project cycle; in fact, there is no biogas programme registered under a currently valid CDM methodology. Also for the voluntary market the track record of domestic biogas is limited to a few (smaller) projects. The applicable methodologies all harbour their own uncertainties and formulation, management and monitoring of carbon-included projects require a significant effort. However, the global market for CERs as well as VERs looks promising and expertise on the combination of domestic biogas and GHG emission reduction is increasing. At the same time, the demand for renewable energy technology, including domestic biogas, is likely to grow. As carbon revenue can improve the financial, technical and programmatic sustainability of large-scale domestic biogas projects, the option deserves serious attention of project developers.
Domestic biogas and carbon revenue
3
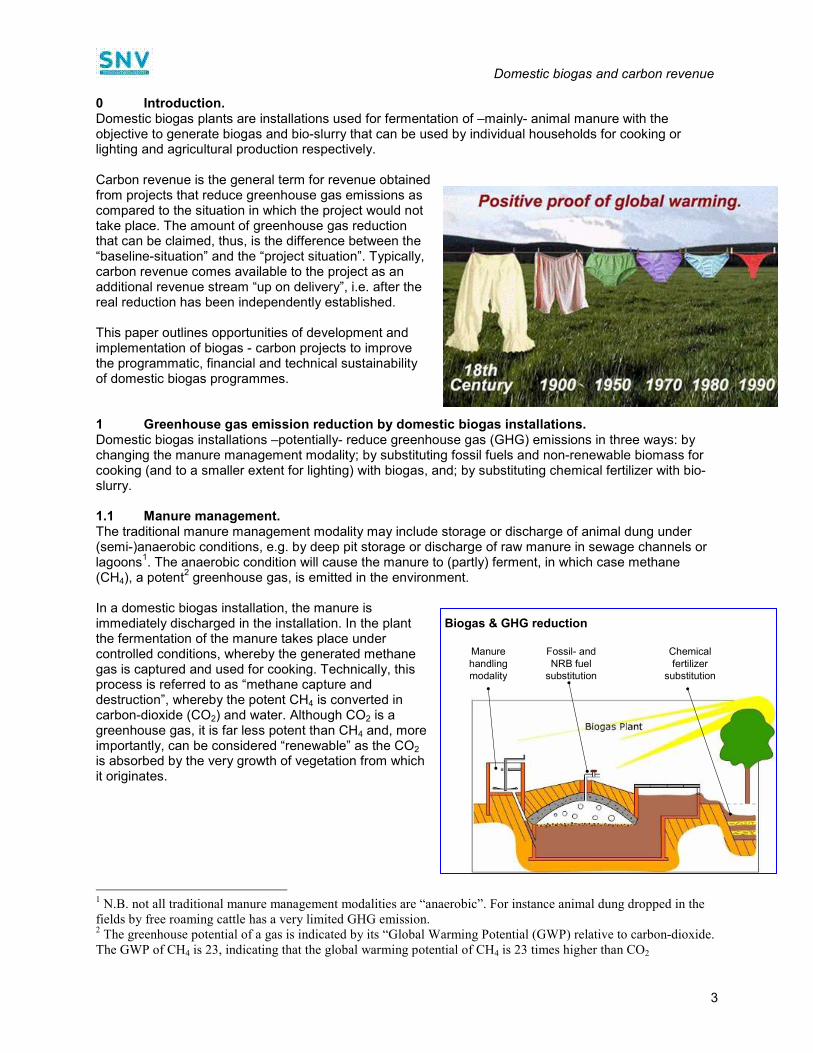
0 Introduction. Domestic biogas plants are installations used for fermentation of –mainly- animal manure with the objective to generate biogas and bio-slurry that can be used by individual households for cooking or lighting and agricultural production respectively. Carbon revenue is the general term for revenue obtained from projects that reduce greenhouse gas emissions as compared to the situation in which the project would not take place. The amount of greenhouse gas reduction that can be claimed, thus, is the difference between the “baseline-situation” and the “project situation”. Typically, carbon revenue comes available to the project as an additional revenue stream “up on delivery”, i.e. after the real reduction has been independently established. This paper outlines opportunities of development and implementation of biogas - carbon projects to improve the programmatic, financial and technical sustainability of domestic biogas programmes. 1 Greenhouse gas emission reduction by domestic biogas installations. Domestic biogas installations –potentially- reduce greenhouse gas (GHG) emissions in three ways: by changing the manure management modality; by substituting fossil fuels and non-renewable biomass for cooking (and to a smaller extent for lighting) with biogas, and; by substituting chemical fertilizer with bio-slurry. 1.1 Manure management. The traditional manure management modality may include storage or discharge of animal dung under (semi-)anaerobic conditions, e.g. by deep pit storage or discharge of raw manure in sewage channels or lagoons
1. The anaerobic condition will cause the manure to (partly) ferment, in which case methane
(CH4), a potent2 greenhouse gas, is emitted in the environment.
In a domestic biogas installation, the manure is immediately discharged in the installation. In the plant the fermentation of the manure takes place under controlled conditions, whereby the generated methane gas is captured and used for cooking. Technically, this process is referred to as “methane capture and destruction”, whereby the potent CH4 is converted in carbon-dioxide (CO2) and water. Although CO2 is a greenhouse gas, it is far less potent than CH4 and, more importantly, can be considered “renewable” as the CO2 is absorbed by the very growth of vegetation from which it originates.
1 N.B. not all traditional manure management modalities are “anaerobic”. For instance animal dung dropped in the
fields by free roaming cattle has a very limited GHG emission. 2 The greenhouse potential of a gas is indicated by its “Global Warming Potential (GWP) relative to carbon-dioxide.
The GWP of CH4 is 23, indicating that the global warming potential of CH4 is 23 times higher than CO2
Biogas & GHG reduction
Manure handling modality
Fossil- and NRB fuel
substitution
Chemical fertilizer
substitution
Domestic biogas and carbon revenue
4
1.2 Substitution of fossil fuel and non-renewable biomass. The domestic fuel mix of rural households in developing countries typically includes significant amounts of fossil fuel (kerosene, coal, LPG) and biomass (fuelwood, charcoal, dung cakes). The combustion of these traditional energy sources creates carbon-dioxide emissions (and to a lesser extent CH4 and Nitrous-oxide
3 (N2O), emissions).
Fossil fuels, by definition, are non-renewable sources of energy. Hence, the full amount of GHG emission resulting from combustion of these energy sources results in a net increase of GHG in the atmosphere. For biomass, however, the situation is less straight-forward. As far as the burned biomass is obtained from renewable sources (agricultural waste, dung-cakes) the produced carbon-dioxide is assumed to be absorbed by the vegetation from which they originate. Therefore, carbon-dioxide emissions from renewable biomass do not contribute to the net GHG concentration in the atmosphere
4. Biomass obtained
from non-renewable sources (referred to as “Non Renewable Biomass, NRB), however, do contribute to global warming. NRB includes e.g. fuelwood and charcoal whose harvest results in a reduction of forested area and therefore in a reduction of the carbon sink function of this area. To the extent that biogas replaces fossil fuels or non-renewable biomass, this substitution then results in a reduction of greenhouse gas emissions. 1.3 Chemical fertilizer substitution. Many developing countries face a net outflow of soil nutrients
5 and farmers apply chemical fertilizer to
maintain the fertility of their soil. Although chemical fertilizer use in developing countries often is erratic and scattered, typically fair amounts of chemical fertilizer is applied. Production as well as application of chemical fertilizer has a GHG aspect, mainly as a result of the high energy requirement (often sourced from fossil fuels) for chemical fertilizer production and the Nitrous oxide (N2O) emissions. The “by-product” of a biogas installation is “bio-slurry”. Bio-slurry is the digested dung that is discharged from the installation after the fermentation process. The fermentation process does not reduce the nutrient value (NPK-value) of the feeding material. In fact, when applied correctly, the fertilizing value of bio-slurry even surpasses that of raw manure
6. Therefore, bio-slurry is a good organic fertilizer that can
replace or reduce the application of chemical fertilizer7.
To the extent to which bio-slurry is actually replacing chemical fertilizer, GHG emissions are reduced. From an accountability point of view, however, this component of GHG emission reduction by domestic biogas installations may proof very cumbersome to substantiate. 1.4 GHG emission reduction potential of domestic biogas installations. The actual reduction of greenhouse gas emissions by domestic biogas installations depends on the local situation, the size of the installation and the way the installation is operated, whereas the “claimable” GHG emission reduction depends on the used methodology (see 2.1 and 2.2). However, results based on –tentative- calculations with data sets of biogas programmes in which SNV is involved and claimed reductions by other domestic biogas projects would indicate GHG emission reductions in a range of 1.7
8
to 5.99 tons CO2eq per installation per year. It has to be noted that the currently approved CDM – biogas
projects are working under methodologies that have since been withdrawn.
3 Nitrous-oxide has a GWP of 296. 4 CH4 and N2O emissions from burning renewable biomass, though, do contribute to global warming 5 Soil nutrients are generally referred to as NPK, Nitrogen, Phosphorus and Potassium, the main soil nutrients 6 In digested manure, a larger share of the organic nitrogen is converted to mineral nitrogen (NH4); the nutrient will
be easier and quicker available for the vegetation. 7 In addition to organic matter and macro-nutrients (NPK), bio-slurry contains micro-nutrients that are lacking in
chemical fertilizer. 8 Tentative calculations for Nepal, based on proposed methodology 1E (communication by Mr. Saroj Rai of BSP-
Nepal). 9 Current claim by Cambodia Biodigester Programme for the HIVOS Climate Fund voluntary market.
Domestic biogas and carbon revenue
5
2 Reducing global GHG emissions. In 1992, the United Nations Framework Convention on Climate Change (UNFCCC) was established to combat global warming. Subsequently, in 1997, the Kyoto Protocol (KP) was adopted to commit developed countries (annex 1 parties) to reduce their greenhouse gas emissions. This binding protocol eventually came into force in February 2006, following the ratification of Russia. The KP requires annex 1 countries to reduce their GHG emission to ~ 95% of their pre 1990-levels over the period from 2008 to 2012
10. The required GHG reduction, also know as the assigned amount units (AAUs), is measured in
tons of Carbon-dioxide equivalent11
. As global warming is a world-wide phenomenon; the geographical location of greenhouse gas emission reductions is irrelevant. Hence, the KP defined three “flexibility mechanisms” to achieve its emission targets economically: − The Emission Trading (ET) allows for annex 1 parties (industrialized countries) to acquire (buy, trade)
emission reduction units from other annex 1 parties. − Joint Implementation (JI) allows annex 1 parties to implement GHG emission reducing projects in
other annex 1 parties and count the resulting emission reduction for meeting their own KP target. − The Clean Development Mechanism (CDM) allows annex 1 parties to implement GHG emission
reducing projects in non-annex 1 parties (developing countries) in return for Certified Emission Reductions (CERs)
12 whereby host parties are assisted in achieving sustainable development
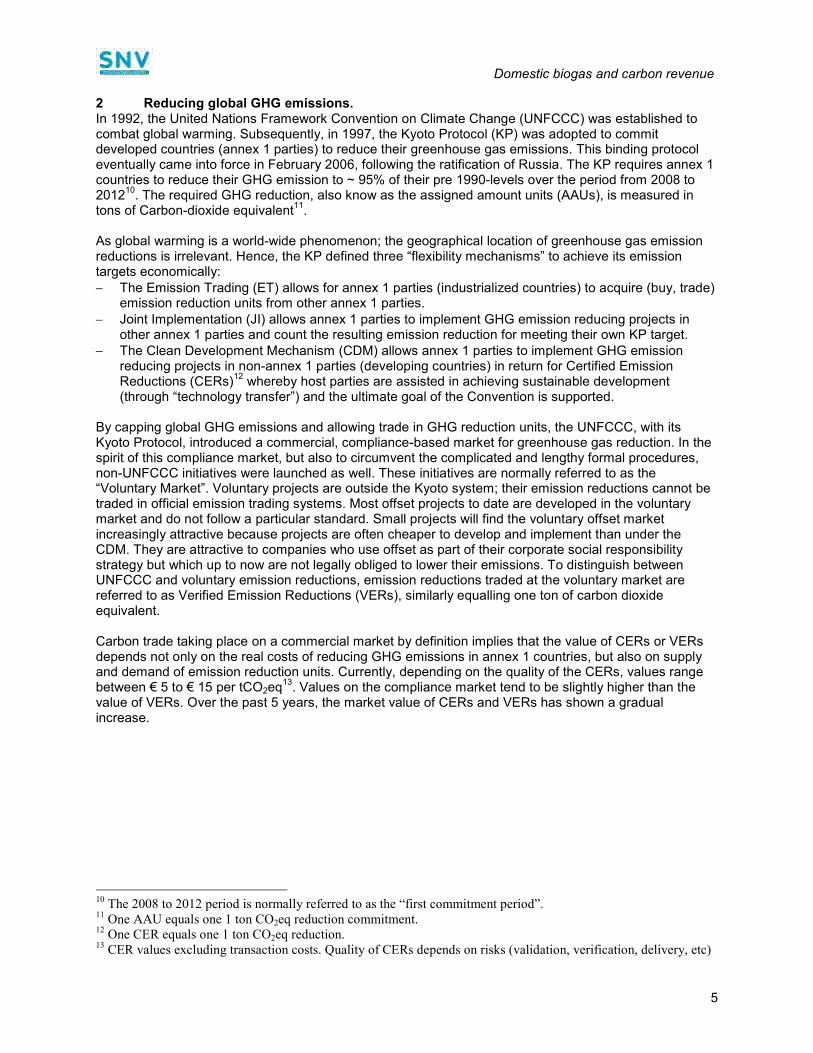
(through “technology transfer”) and the ultimate goal of the Convention is supported. By capping global GHG emissions and allowing trade in GHG reduction units, the UNFCCC, with its Kyoto Protocol, introduced a commercial, compliance-based market for greenhouse gas reduction. In the spirit of this compliance market, but also to circumvent the complicated and lengthy formal procedures, non-UNFCCC initiatives were launched as well. These initiatives are normally referred to as the “Voluntary Market”. Voluntary projects are outside the Kyoto system; their emission reductions cannot be traded in official emission trading systems. Most offset projects to date are developed in the voluntary market and do not follow a particular standard. Small projects will find the voluntary offset market increasingly attractive because projects are often cheaper to develop and implement than under the CDM. They are attractive to companies who use offset as part of their corporate social responsibility strategy but which up to now are not legally obliged to lower their emissions. To distinguish between UNFCCC and voluntary emission reductions, emission reductions traded at the voluntary market are referred to as Verified Emission Reductions (VERs), similarly equalling one ton of carbon dioxide equivalent. Carbon trade taking place on a commercial market by definition implies that the value of CERs or VERs depends not only on the real costs of reducing GHG emissions in annex 1 countries, but also on supply and demand of emission reduction units. Currently, depending on the quality of the CERs, values range between € 5 to € 15 per tCO2eq
13. Values on the compliance market tend to be slightly higher than the
value of VERs. Over the past 5 years, the market value of CERs and VERs has shown a gradual increase.
10 The 2008 to 2012 period is normally referred to as the “first commitment period”.
11 One AAU equals one 1 ton CO2eq reduction commitment.
12 One CER equals one 1 ton CO2eq reduction.
13 CER values excluding transaction costs. Quality of CERs depends on risks (validation, verification, delivery, etc)
Domestic biogas and carbon revenue
6
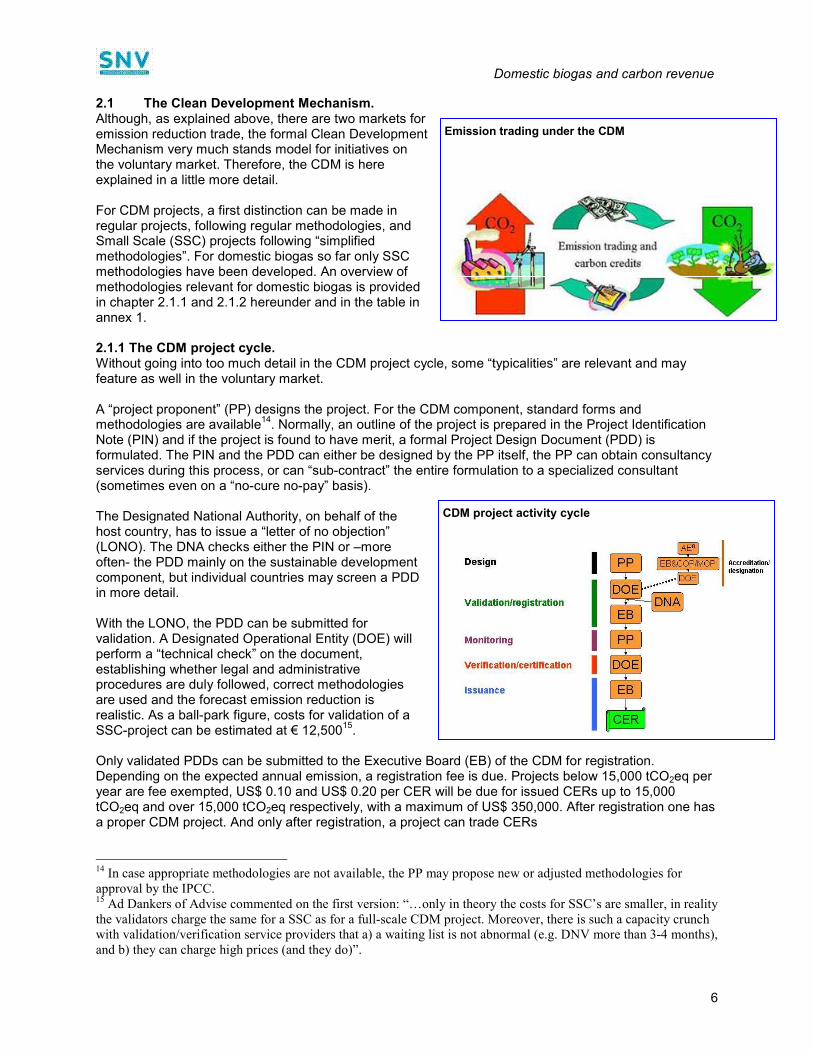
2.1 The Clean Development Mechanism. Although, as explained above, there are two markets for emission reduction trade, the formal Clean Development Mechanism very much stands model for initiatives on the voluntary market. Therefore, the CDM is here explained in a little more detail. For CDM projects, a first distinction can be made in regular projects, following regular methodologies, and Small Scale (SSC) projects following “simplified methodologies”. For domestic biogas so far only SSC methodologies have been developed. An overview of methodologies relevant for domestic biogas is provided in chapter 2.1.1 and 2.1.2 hereunder and in the table in annex 1. 2.1.1 The CDM project cycle. Without going into too much detail in the CDM project cycle, some “typicalities” are relevant and may feature as well in the voluntary market. A “project proponent” (PP) designs the project. For the CDM component, standard forms and methodologies are available
14. Normally, an outline of the project is prepared in the Project Identification
Note (PIN) and if the project is found to have merit, a formal Project Design Document (PDD) is formulated. The PIN and the PDD can either be designed by the PP itself, the PP can obtain consultancy services during this process, or can “sub-contract” the entire formulation to a specialized consultant (sometimes even on a “no-cure no-pay” basis). The Designated National Authority, on behalf of the host country, has to issue a “letter of no objection” (LONO). The DNA checks either the PIN or –more often- the PDD mainly on the sustainable development component, but individual countries may screen a PDD in more detail. With the LONO, the PDD can be submitted for validation. A Designated Operational Entity (DOE) will perform a “technical check” on the document, establishing whether legal and administrative procedures are duly followed, correct methodologies are used and the forecast emission reduction is realistic. As a ball-park figure, costs for validation of a SSC-project can be estimated at € 12,500
15.
Only validated PDDs can be submitted to the Executive Board (EB) of the CDM for registration. Depending on the expected annual emission, a registration fee is due. Projects below 15,000 tCO2eq per year are fee exempted, US$ 0.10 and US$ 0.20 per CER will be due for issued CERs up to 15,000 tCO2eq and over 15,000 tCO2eq respectively, with a maximum of US$ 350,000. After registration one has a proper CDM project. And only after registration, a project can trade CERs
14 In case appropriate methodologies are not available, the PP may propose new or adjusted methodologies for
approval by the IPCC. 15 Ad Dankers of Advise commented on the first version: “…only in theory the costs for SSC’s are smaller, in reality
the validators charge the same for a SSC as for a full-scale CDM project. Moreover, there is such a capacity crunch
with validation/verification service providers that a) a waiting list is not abnormal (e.g. DNV more than 3-4 months),
and b) they can charge high prices (and they do)”.
CDM project activity cycle
Emission trading under the CDM
Domestic biogas and carbon revenue
7
In the mean time the project-proper has started off, producing –as a by product- CERs. The PP will be responsible to monitor the project, according to the monitoring plan that is part of the PDD, making sure the forecast CERs are indeed generated. On set intervals, say annually, a project would like to sell those CERs. For that, the PP will contract a DOE to verify the amount of CERs generated over that period. The DOE will produce a verification report, stating the amount of CERs that can be claimed. Again as a ball-park figure, verification costs for a SSC-project may range from € 10,000 to € 15,000
16.
The EB, based on the verification report of the DOE, will then issue the CERs to the project. Only now the Project Proponent will be able to sell its CERs. For this, the PP may –possibly in an earlier stage- enter into an Emission Reduction Purchase Agreement (ERPA) with an interested / interesting buyer. Important features of the procedure include: − The market value of CERs increases with reducing risks. Hence, CERs have a significantly higher
value once a project is officially registered, compared with a project that can only show a PIN or PDD. − Typically, CER payment will only be “up on delivery”, lead time between verification and issuance can
easily be 6 months, and running through the first full cycle will take longer17
. − Accountability is key; validation and verification is done by independent, accredited firms. Contracting
these firms is costly. − Once a project enters into an ERPA, it commits to a performance obligation. Depending on the
contract, not being able to deliver may result in the project being fined. 2.1.2 Methodologies. When is comes to measuring emission reductions, two situations have to be taken into account: emissions without the intervention of the project (baseline) and emission after the intervention (project). The difference –as measured through monitoring- between the two defines the emission reduction that can be claimed by the project. For measuring the baseline and monitoring emissions, different methodologies have been developed. Under the CDM, only small scale methodologies have so far been developed for domestic biogas. Although these simplified methodologies are advantageous in terms of monitoring requirements, they put a limit to the number of individual biogas installations that can be brought under one project. The following small scale methodologies are currently available: AMS I.C. Thermal energy for the user with or without electricity. This category comprises renewable energy technologies that supply individual households or users with thermal energy that displace fossil fuels. Examples include solar thermal water heaters and dryers, solar cookers, energy derived from renewable biomass for water heating, space heating, or drying, and other technologies that provide thermal energy that displace fossil fuel
18. Biomass-based co-generating
systems that produce heat and electricity are included in this category. AMS I.C. limits the project size by the total thermal generation capacity, which shall not exceed 45 MWth. For a typical domestic biogas project
19, this would mean that up to 22,500 installations
20 could be bundled
in one small scale project. For domestic biogas, this methodology allows to claim GHG emission
16 Ad Dankers of Advise commented on the first version: “… reasonable costs are about €12,500 for the first year
and then € 10,000 for the years following as the verifier is by then familiar with the SSC project. Also for SSC’s one
can use one and the same validator/verifier and this might reduce initial verification costs as well”. 17 Increasingly, however, buyers are willing to pay “up-front” for future CER or VER delivery.
18 Note that biogas installations or biogas stoves are not specifically mentioned; they would be “implied” as “other
technologies that provide thermal energy that displace fossil fuel”. This implication could also be derived from
methodology AMS III.R. 19 Assuming the thermal performance of a biogas stove is about 2 kW. This is, however, still to be subject to debate.
20 The Hubei PDD even proposes to include 30,000 installations. The Hubei PDD has not been validated yet.
Domestic biogas and carbon revenue
8
reductions resulting from substitution of fossil fuels (see 1.2). AMS I.C does not foresee in the use of non-renewable biomass in the baseline situation. AMS I.E. Switch from non-renewable biomass for thermal applications by the user. This category comprises small thermal appliances that displace the use of non-renewable biomass by introducing new renewable energy end-user technologies. Examples of these end user technologies include biogas stoves and solar cookers. AMS I.E. is a recent methodology; approval of the EB was only granted on February the 1
st this year.
Although the current version of the methodology does not mention the limit of the project size, general procedures for small scale projects apply, implying that some 7,500 to 9000 domestic installation fit in one bundle
21. Peculiar is article 3 that states: “Project participants must be able to proof that NRB has been
used since 31 December 1989 using survey methods”. For domestic biogas, this methodology allows to claim GHG emission reductions resulting from substitution of non-renewable biomass only (see 1.2). The methodology specifies in outline how the fraction of non-renewable biomass can be established. AMS III.R Methane recovery in agricultural services at household / small farm level. This project category comprises recovery and destruction of methane from manure and wastes from agricultural activities that would be decaying anaerobically emitting methane to the atmosphere in the absence of the project activity. The category is limited to measures at individual households or small farms (e.g. installation of a domestic biogas digester). Methane recovery systems that achieve an annual emission reduction up to 5 tons of CO2eq per system are included in this category. Aggregated annual emission reductions of all systems included shall be less or equal to 60 kt CO2eq. This project category is only applicable in combination with methodology AMS I.C. It is not clear whether, in time, this methodology will be allowed to be used in combination with AMS I.E.
22 as well.
For domestic biogas, this methodology allows to claim GHG emission reductions resulting from changing the manure handling modality (see 1.1) Programme of Activities. Individual project activities can be brought under a Programme of Activities (PoA). Such PoA then can be registered as a single CDM project activity, provided that approved baseline and monitoring methodologies are used that, inter alia, define the appropriate boundary, avoid double counting and account for leakage, and ensure that the emission reductions are real, measurable and verifiable and additional to any that would occur in the absence of the project activity. A Programme of Activities has a maximum duration of 23 years. This procedure allows combining domestic biogas projects, using one single methodology, demarcated by time or location (e.g. subsequent projects or projects in different provinces / countries), in one “Programme of Activities” whereby: − Only a single registration is required; − Adding new domestic biogas projects under the same programme is simplified, making the individual
project size less critical;
21 Correspondence with Ivo Besselink: ”the general procedures for SSC will apply, which state 15 MW (or
equivalent amount) for type I project activities”. 22 Correspondence with Ivo Besselink clarified: “Using III.R in combination with both AMS I.C and I.E and III.R
will be allowed, only I.E in combination with III.R is not included, but a simple request for clarification will correct
this”.
Domestic biogas and carbon revenue
9
− Some of the requirements, like an Environmental Impact Study23
, can be arranged at programme level. As verification modalities will be determined at programme level openings for simplification may arise.
2.2 The voluntary market. Projects selling emission reductions on the voluntary market are not limited by UNFCCC- approved methodologies. Many buyers propose their own baseline, project and monitoring methodology. Examples in the domestic biogas sector include the VER-Normaal project in Vietnam and the VER-Hivos project in Cambodia (under preparation). VER-units, hence, are less standardized. Typically, but not necessarily, these voluntary schemes handle a smaller project size
24.
Buyers on the voluntary market may, however, also look for quality assurance; some organizations tackle this need by providing an independent quality standard for project implementation and monitoring
25. For
domestic biogas the Gold Standard (GS) developed a dedicated methodology. 2.2.1 GS Programme, baseline and monitoring methodology for small scale biodigester. This methodology is applicable to programmes of activities involving the implementation of biodigesters in households within the project’s boundaries. The project activity is implemented by a project coordinator who acts as the project participant. The individual households will not act as project participants. The consumption of biogas from the biodigesters replaces the consumption of fossil fuel and/or biomass. The GS biodigester methodology is not a “small scale” methodology, the number of bundled biogas installations under one project, hence, is not limited. The GS biodigester methodology includes GHG emission reductions resulting from a change in manure handling management and fossil fuel and NRB substitution (CO2 and CH4 only, N2O is excluded). The methodology specifies how the fraction of non-renewable biomass can be established. The high standards that the GS prescribes will have ramifications on formulation, monitoring and verification of the project. The flip-side of the extra effort required will be that the VER-value is likely to be higher. 2.2.2 Normaal – Vietnam The Dutch rural rock band Normaal released a new CD album called “Hier Normaal” for which a number of promotional tours were made. The transport and electricity use during these tours generated 250 ton CO2 eq. Because the music stars are aware of the threats of global warming, they wanted to compensate for the green house gasses emitted during these performances. To compensate these emissions, the emission reduction rights of a number biodigesters were purchased in 2007 in Vietnam for a period of 5 years. Conservatively, a biodigester in Vietnam reduces 2 ton CO2 eq per year: 1 ton via fuel substitution and 1 ton for manure management. So in 5 years time, 10 tons are compensated. Therefore a total number of 25 biodigesters are exclusively constructed for Normaal, against a price of 10 Euro per ton CO2 eq. The plants will not be used for any other carbon trade scheme for the coming 5 years. There was no authority involved to approve this agreement. As means of verification the band receives a photograph of each digester and the GPS coordinates via the programme.
23 Environmental Impact Assessments are NOT required under the CDM/SSC, but they often are imposed by the
Host Country. 24 Vietnam 25 biogas installations, Cambodia 5,000 biogas installations.
25 The document “Making sense of the voluntary carbon market: a comparison of carbon offset standards” provides
a thorough overview on voluntary carbon methodologies.
Domestic biogas and carbon revenue
10
2.2.3 Hivos Climate Fund - Cambodia In 2006 the National Biodigester Programme of Cambodia (NBP) conducted a CDM baseline study to determine the potential GHG mitigation after the dissemination of biodigesters. The study focussed on GHG emissions from different types of animal waste management systems (dry storage, slurry, and lagoon storage) and on emissions from burning fossil fuel and non-renewable biomass. Ex-ante GHG emission reduction resulted in 4.4 ton of CO2eq, following the IPCC guidelines, excluding N2O and a 77% NRB component. NBP negotiated hereafter with project developers / CER brokers on the start of a CDM project. Because of the high costs involved and uncertainty whether projected results could be reached, it was decided not to pursue CER sales. The Hivos Climate Fund offers a series of projects in developing countries that reduce GHG emissions to buyers in the Netherlands who want to compensate their emissions. Potential buyers may include individuals, organisations and companies. NBP, Hivos and the Cambodian Government are in the process to come to an agreement where by Hivos will buy the emission reductions for 5,000 plants over a 10 year period. The advantages for NBP are that little time and funds have to be invested in the preparation work -the CDM baseline study is largely sufficient- while the regular monitoring practices of the programme suffice for the VER monitoring. Under this agreement N2O is excluded in the calculation while all biomass is considered non-renewable. This because there is a significant difference between biomass production and consumption in Cambodia and therefore all biomass consumption reduction contributes to narrowing this gap. The price offered by the Hivos Climate Fund is competitive compared to what is commonly paid for CERs. 3 Notes to the methodologies. Methodologies and relevant documentation is written in Carbonese. Carbonese does not necessarily translate easily in English; understanding the full technical, operational, administrative and legal implications of articles may -at times- be beyond the capacity of the interested layman/women. Hereunder some general notes on the methodologies. 3.1 Pioneering. To date, no domestic biogas project has been validated and registered under currently valid CDM methodologies
26. To the author’s knowledge, this is true for the –recently approved- GS-biodigester
methodology as well. Although relevant methodologies get clearer and experience in going through the entire registration / verification process is mounting, embarking upon establishing a GHG emission reduction component in domestic biogas project will still require a fair amount of pioneering work, with all related risks. 3.2 Inclusion of chemical fertilizer substitution. As argued earlier, monitoring of the substitution of chemical fertilizer by bio-slurry may proof cumbersome. Anyhow, there is currently no small scale or voluntary methodology available that allows the inclusion of chemical fertilizer. 3.3 Inclusion of the manure handling component. The benefits of including the manure handling component in the carbon reduction methodology may vary significantly from country to country, depending on the type of livestock, the local practice of livestock keeping, manure storage and application. Preliminary calculations indicate that countries with a large share of free roaming cattle (e.g. some African countries) may have little to gain from this methodology while countries with a large and confined pig population, like Vietnam, China and Cambodia, can benefit a great deal. 3.4 Inclusion of non-renewable biomass in the baseline. Many of (potential) biogas households traditionally use a significant amount of biomass to provide in their cooking energy requirement. The CDM methodology I.C. does not allow inclusion of biomass in the
26 The Bagepali biogas programme in India and the Nepal biogas programme got registered under a methodology
that later was withdrawn
Domestic biogas and carbon revenue
11
baseline at all. With the CDM I.E. and the GS methodology for small scale biodigesters, non-renewable biomass consumption can be brought into account (this still means that dung cakes or agricultural waste are excluded all together). For fuelwood or charcoal, to be allowed in the baseline, the fraction of non-renewable fuelwood in the total amount of fuelwood has to be established. Both the CDM methodology I.E. and the GS methodology for small scale biodigesters include a methodology to establish this fraction. In both cases, comprehensive (GIS-based) data may proof necessary to show declining forests in a certain “catchment area”. In addition, AMS I.E. allows complementing survey results with indicators on: the time spent / distance travelled for gathering fuelwood; the price of fuelwood; trends in shifting from one type of biomass to another or other indicators. Please note that the definitions used for non-renewable biomass are strict and the determination of the NRB-fraction may be subject to a lot of discussion
27. Another note of caution seems due related to
leakage as a result of the reduction of NRB use (reduction of NRB by biogas households may result in increasing use of NRB by non-biogas households). 3.5 Suppressed and satisfied demand. For the domestic fuel consumption, the “GS biodigester” methodology offers the project proponent the option to choose defining the baseline consumption as the “satisfied demand situation”
28. This option
assumes that in the actual baseline situation, households do not have access to the required domestic energy against “comparable but better off” households; they suffer “suppressed demand”. If one chooses to do so, not only the energy level, but also the technology from the satisfied demand situation can be taken as the baseline. This seems to offer two important advantages: − A fossil fuel and corresponding technology, e.g. LPG and LPG stoves (Senegal) or coal and coal
stoves (Hubei, China), can be taken as the baseline, thus avoiding the (cumbersome) establishment of the NRB-fraction in the baseline biomass consumption.
− Replacing biomass for fossil fuel implicitly enters the full amount of energy consumption back in the baseline; for households with a large share of renewable biomass -like dung cake (Pakistan) or agricultural waste (Ethiopia)- in their baseline, this will significantly increase their potential greenhouse gas reduction.
3.6 Safeguarding additonality. The key notion in GHG emission reduction projects is –basically- that the claimed or forecast reduction would not have taken place in absence of the project. The financial aspect of the additionality principle, than, implies that carbon revenue improves the cash-flow of the project in such a manner that the programme becomes feasible. It is therefore critical that project documents clearly mention that the project anticipates additional carbon-revenue. Another aspect of the additionality principle, however, is a barrier analysis, reasoning additionality on imperfect markets. Depending on the socio-economic situation, the barrier analysis may override the financial additionality aspect. 3.7 Ex-ante list of biogas households. Although not mentioned in the methodologies themselves, regulation SSC 120 demands prospective biogas-owner lists to be submitted at validation, before they are actually constructed. Clearly, in market-driven biogas programmes this regulation would disqualify CDM methodologies. It should be possible, however, to start a biogas programme-proper and bundle the constructed installations for validation and registration without compromising the additionality principle
29.
27 However, the Hivos methodology proposed for the Cambodia biogas project agrees with all fuelwood used for
domestic cooking being non-renewable 28 Application of para 46 of Modalities and Procedures: “the baseline may include a scenario where the future
anthropogenic emissions by source are projected to rise above current levels, due to the specific circumstances of the
Host Party” may allow this for AMS I.C. and AMS I.E. as well, but this would need a adjustment of the
methodologies. 29 This does imply starting a programme without secured financing, putting all risks at the side of the project
proponent.
Domestic biogas and carbon revenue
12
3.8 Carbon project duration. The crediting period of carbon projects can be selected at 7 years, extendable twice, or at a single period of 10 years
30. Biogas programmes, or at least the contractual commitment to them, typically last 3 to 6
years. Carbon revenue and the corresponding monitoring and verification commitment, therefore, may overarch a standard phase of a biogas programme. The implication is that institutional and organizational arrangements have to be such that carbon commitments can also be met in absence of the programme-proper. 3.9 Combining CDM small scale methodologies. It is allowed to combine CDM-SSC –when appropriate- within one carbon project. For biogas programmes this implies that countries could opt for combining AMS I.C + AMS I.E + AMS III.R. In this way a project would be able to claim GHG emission reductions from fossil fuel reduction, NRB reduction and manure management change respectively. 3.10 Bringing separate projects under one “Programme of Activities”. To the author’s knowledge, there is no registered PoA yet. From the documentation, the administrative requirements for registration of a PoA seem significant but “doable” (in the sense that the requirements seem to be in the same order of magnitude and complexity as necessary for registration of a separate project). Advantages, if any, from registering a PoA, may include: − After the first registration, the PoA plus one project, adding a new country / project only requires
validation; registration follows automatically. As long as projects answer to the PoA’s eligibility criteria, they do not necessarily have to follow the exact same methodologies, but for each project only one methodology can be used.
− A PoA exempts the project to provide the list of biogas-owners in advance. − Standardization –to some extent- of CDM administration, monitoring and verification procedures. − Expanding national biogas projects may add new projects, either time-wise or geographically, under
the PoA. − For smaller countries / projects, the PoA may offer a cost-effective way of obtaining carbon revenue. − Possibly a centralized approach enables a steeper learning curve in building-up expertise in
formulation, administration and managing of the domestic biogas / carbon projects? − Possibly a better negotiation position in selling CERs, due to both larger amounts of credits available,
higher professionalism / expertise level on the carbon trade and centralization of this project component?
− Possibly economies of scale could work out in other fields as well, like subcontracting (parts of) EIAs, formulation, validation and verification.
There are disadvantages as well: − Clustering under a PoA is only allowed for projects using the same, single methodology; for biogas
programmes this implies that only one aspect of GHG emission reduction (fossil fuel substitution, nrb substitution or manure management change) can be claimed.
− If only one project under the PoA does not play by the rules this could have repercussions for the programme as a whole.
− There may be a political constraint for a PoA with more than one national domestic biogas programme when respective governments do not like to depend on a regional programme
30 Voluntary schemes may have different crediting periods; the Hivos Climate Fund proposes for the biodigester
programme in Cambodia a crediting period of 10 years.
Domestic biogas and carbon revenue
13
3.11 Voluntary or CDM. In general: − In terms of formulation and monitoring requirements, CDM methodologies and the GS-biodigester
methodology differ little. The post-validation procedure (registration, verification and issuance), however, might be shorter / simpler for the GS-biodigester methodology.
− Following an approved CDM methodology will likely produce CERs that are more attractive to potential (institutional) buyers as compared with the VERs produced under a voluntary scheme. Hence, CER-values may have a higher and more predictable value than VERs
31.
− Over a longer period, the absorption capacity of voluntary schemes may proof too small, introducing a significant financial risk for larger projects that depend on carbon revenue for their feasibility.
− CDM procedures are significantly more complicated, lengthy and expensive than voluntary schemes. − The value of the CERs is dependent on the commitment period. For the current commitment period,
2008 – 2012, regulations are set and CER values are –within some margin- established. CER values for the period after 2012 are uncertain; projects may have to take a considerable discount on CERs produced after the current commitment period if an up-front payment is requested. VER values might be less affected by the CDM commitment period.
− The voluntary GS biodigester methodology might be an exception regarding the above mentioned points.
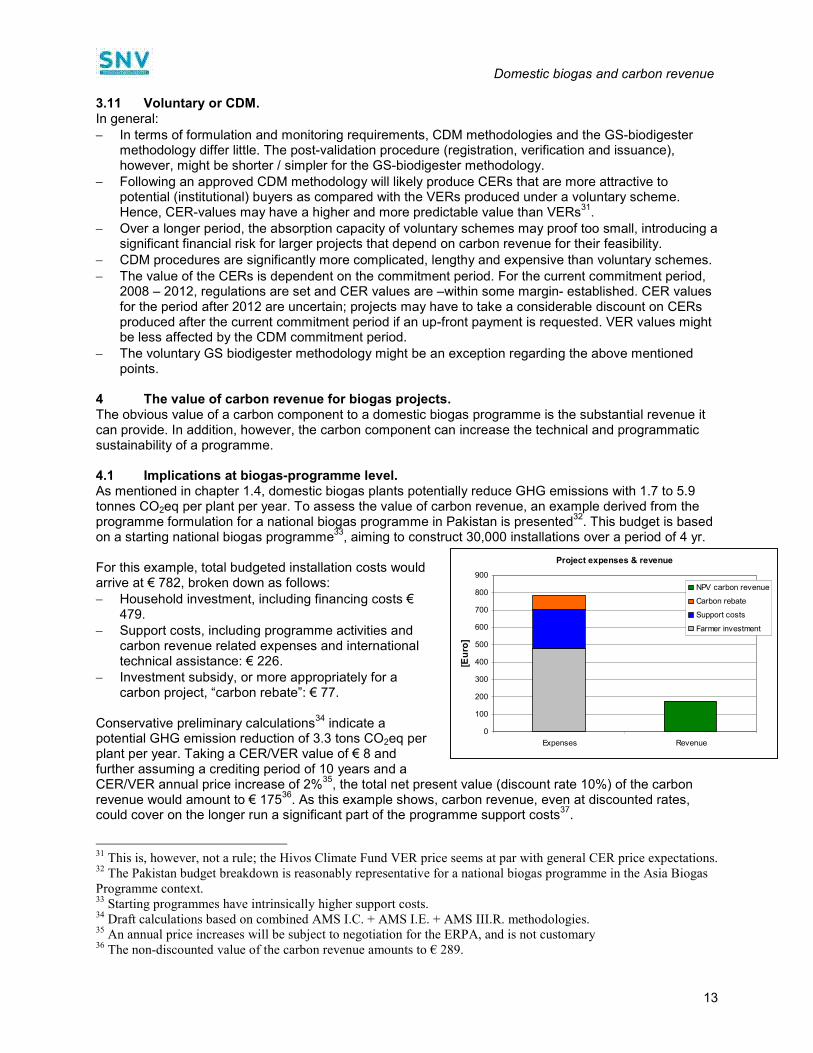
4 The value of carbon revenue for biogas projects. The obvious value of a carbon component to a domestic biogas programme is the substantial revenue it can provide. In addition, however, the carbon component can increase the technical and programmatic sustainability of a programme. 4.1 Implications at biogas-programme level. As mentioned in chapter 1.4, domestic biogas plants potentially reduce GHG emissions with 1.7 to 5.9 tonnes CO2eq per plant per year. To assess the value of carbon revenue, an example derived from the programme formulation for a national biogas programme in Pakistan is presented
32. This budget is based
on a starting national biogas programme33
, aiming to construct 30,000 installations over a period of 4 yr. For this example, total budgeted installation costs would arrive at € 782, broken down as follows: − Household investment, including financing costs €
479. − Support costs, including programme activities and
carbon revenue related expenses and international technical assistance: € 226.
− Investment subsidy, or more appropriately for a carbon project, “carbon rebate”: € 77.
Conservative preliminary calculations
34 indicate a
potential GHG emission reduction of 3.3 tons CO2eq per plant per year. Taking a CER/VER value of € 8 and further assuming a crediting period of 10 years and a CER/VER annual price increase of 2%
35, the total net present value (discount rate 10%) of the carbon
revenue would amount to € 17536
. As this example shows, carbon revenue, even at discounted rates, could cover on the longer run a significant part of the programme support costs
37.
31 This is, however, not a rule; the Hivos Climate Fund VER price seems at par with general CER price expectations.
32 The Pakistan budget breakdown is reasonably representative for a national biogas programme in the Asia Biogas
Programme context. 33 Starting programmes have intrinsically higher support costs.
34 Draft calculations based on combined AMS I.C. + AMS I.E. + AMS III.R. methodologies.
35 An annual price increases will be subject to negotiation for the ERPA, and is not customary
36 The non-discounted value of the carbon revenue amounts to € 289.
Project expenses & revenue
0
100
200
300
400
500
600
700
800
900
Expenses Revenue
[Euro]
NPV carbon revenue
Carbon rebate
Support costs
Farmer investment
Domestic biogas and carbon revenue
14
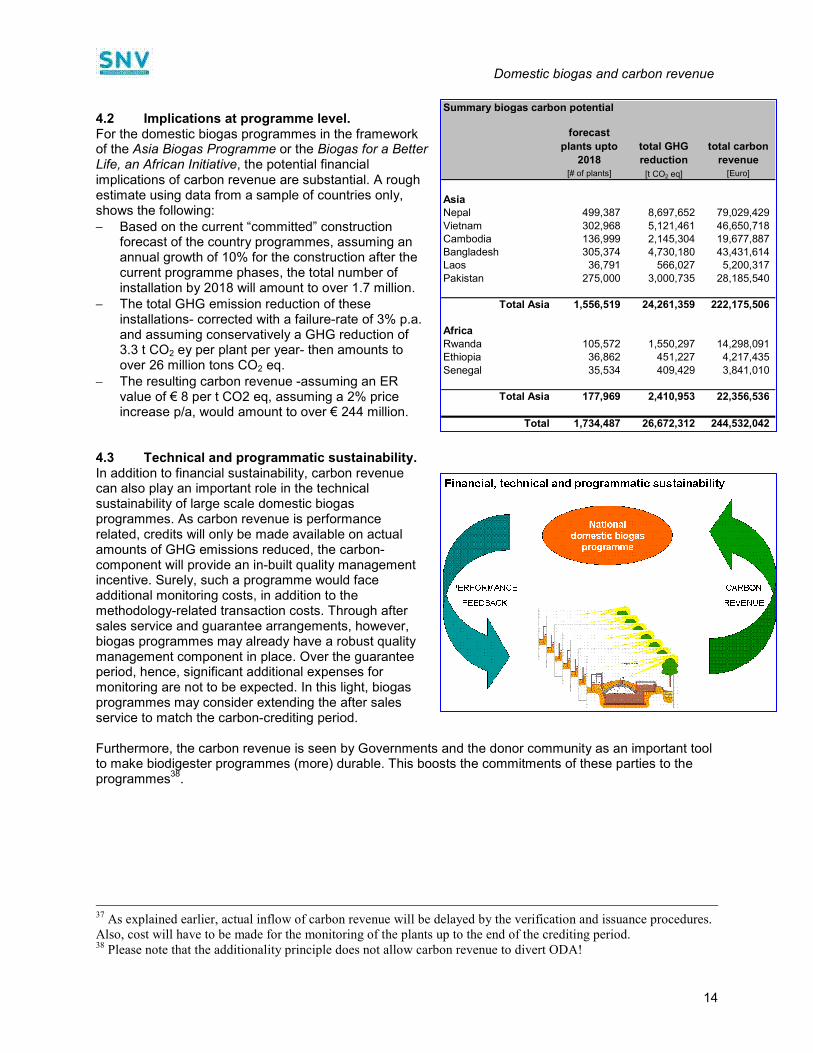
4.2 Implications at programme level. For the domestic biogas programmes in the framework of the Asia Biogas Programme or the Biogas for a Better Life, an African Initiative, the potential financial implications of carbon revenue are substantial. A rough estimate using data from a sample of countries only, shows the following: − Based on the current “committed” construction
forecast of the country programmes, assuming an annual growth of 10% for the construction after the current programme phases, the total number of installation by 2018 will amount to over 1.7 million.
− The total GHG emission reduction of these installations- corrected with a failure-rate of 3% p.a. and assuming conservatively a GHG reduction of 3.3 t CO2 ey per plant per year- then amounts to over 26 million tons CO2 eq.
− The resulting carbon revenue -assuming an ER value of € 8 per t CO2 eq, assuming a 2% price increase p/a, would amount to over € 244 million.
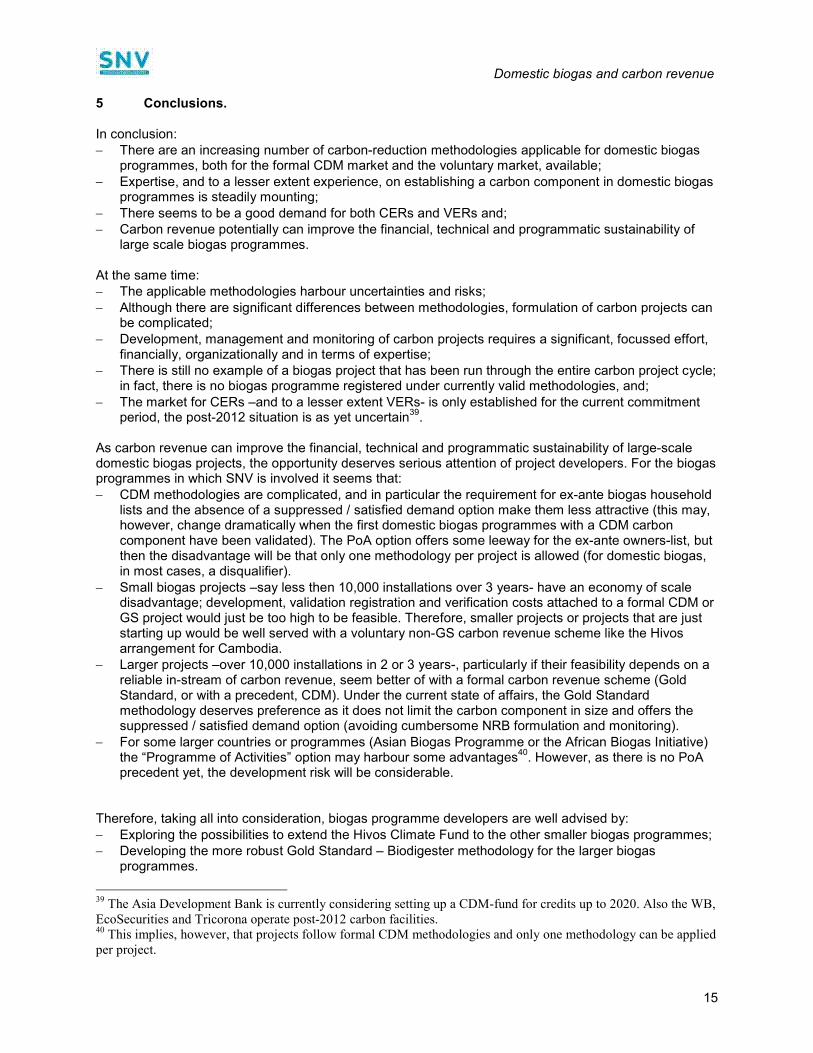
4.3 Technical and programmatic sustainability. In addition to financial sustainability, carbon revenue can also play an important role in the technical sustainability of large scale domestic biogas programmes. As carbon revenue is performance related, credits will only be made available on actual amounts of GHG emissions reduced, the carbon-component will provide an in-built quality management incentive. Surely, such a programme would face additional monitoring costs, in addition to the methodology-related transaction costs. Through after sales service and guarantee arrangements, however, biogas programmes may already have a robust quality management component in place. Over the guarantee period, hence, significant additional expenses for monitoring are not to be expected. In this light, biogas programmes may consider extending the after sales service to match the carbon-crediting period. Furthermore, the carbon revenue is seen by Governments and the donor community as an important tool to make biodigester programmes (more) durable. This boosts the commitments of these parties to the programmes
38.
37 As explained earlier, actual inflow of carbon revenue will be delayed by the verification and issuance procedures.
Also, cost will have to be made for the monitoring of the plants up to the end of the crediting period. 38 Please note that the additionality principle does not allow carbon revenue to divert ODA!
Summary biogas carbon potential
forecast
plants upto
2018
total GHG
reduction
total carbon
revenue
[# of plants] [t CO2 eq] [Euro]
Asia
Nepal 499,387 8,697,652 79,029,429
Vietnam 302,968 5,121,461 46,650,718 Cambodia 136,999 2,145,304 19,677,887 Bangladesh 305,374 4,730,180 43,431,614 Laos 36,791 566,027 5,200,317
Pakistan 275,000 3,000,735 28,185,540
Total Asia 1,556,519 24,261,359 222,175,506
Africa
Rwanda 105,572 1,550,297 14,298,091 Ethiopia 36,862 451,227 4,217,435
Senegal 35,534 409,429 3,841,010
Total Asia 177,969 2,410,953 22,356,536
Total 1,734,487 26,672,312 244,532,042
Domestic biogas and carbon revenue
15
5 Conclusions. In conclusion: − There are an increasing number of carbon-reduction methodologies applicable for domestic biogas
programmes, both for the formal CDM market and the voluntary market, available; − Expertise, and to a lesser extent experience, on establishing a carbon component in domestic biogas
programmes is steadily mounting; − There seems to be a good demand for both CERs and VERs and; − Carbon revenue potentially can improve the financial, technical and programmatic sustainability of
large scale biogas programmes. At the same time: − The applicable methodologies harbour uncertainties and risks; − Although there are significant differences between methodologies, formulation of carbon projects can
be complicated; − Development, management and monitoring of carbon projects requires a significant, focussed effort,
financially, organizationally and in terms of expertise; − There is still no example of a biogas project that has been run through the entire carbon project cycle;
in fact, there is no biogas programme registered under currently valid methodologies, and; − The market for CERs –and to a lesser extent VERs- is only established for the current commitment
period, the post-2012 situation is as yet uncertain39
. As carbon revenue can improve the financial, technical and programmatic sustainability of large-scale domestic biogas projects, the opportunity deserves serious attention of project developers. For the biogas programmes in which SNV is involved it seems that: − CDM methodologies are complicated, and in particular the requirement for ex-ante biogas household
lists and the absence of a suppressed / satisfied demand option make them less attractive (this may, however, change dramatically when the first domestic biogas programmes with a CDM carbon component have been validated). The PoA option offers some leeway for the ex-ante owners-list, but then the disadvantage will be that only one methodology per project is allowed (for domestic biogas, in most cases, a disqualifier).
− Small biogas projects –say less then 10,000 installations over 3 years- have an economy of scale disadvantage; development, validation registration and verification costs attached to a formal CDM or GS project would just be too high to be feasible. Therefore, smaller projects or projects that are just starting up would be well served with a voluntary non-GS carbon revenue scheme like the Hivos arrangement for Cambodia.
− Larger projects –over 10,000 installations in 2 or 3 years-, particularly if their feasibility depends on a reliable in-stream of carbon revenue, seem better of with a formal carbon revenue scheme (Gold Standard, or with a precedent, CDM). Under the current state of affairs, the Gold Standard methodology deserves preference as it does not limit the carbon component in size and offers the suppressed / satisfied demand option (avoiding cumbersome NRB formulation and monitoring).
− For some larger countries or programmes (Asian Biogas Programme or the African Biogas Initiative) the “Programme of Activities” option may harbour some advantages
40. However, as there is no PoA
precedent yet, the development risk will be considerable. Therefore, taking all into consideration, biogas programme developers are well advised by: − Exploring the possibilities to extend the Hivos Climate Fund to the other smaller biogas programmes; − Developing the more robust Gold Standard – Biodigester methodology for the larger biogas
programmes.
39 The Asia Development Bank is currently considering setting up a CDM-fund for credits up to 2020. Also the WB,
EcoSecurities and Tricorona operate post-2012 carbon facilities. 40 This implies, however, that projects follow formal CDM methodologies and only one methodology can be applied
per project.
Domestic biogas and carbon revenue
16
Developing –in particular the first- GS-Biodigester methodology will take a considerable amount of time and effort. However, an independently validated GS-methodology would reinforce the value of other VER schemes (like Hivos) and much of the work could –if prudent- be converted to CDM methodologies once they may become better applicable for domestic biogas. A final note is due; some countries with existing biogas programmes have been approached by larger carbon buyers (KfW, WB, ADB) for assistance in developing a formal CDM component to the biogas programme. Although this paper concludes that CDM methodologies are currently not the preferred option for domestic biogas, the support of these large buyers can make a difference. The methodology preference of this paper, therefore, should not result in terminating exploratory talks between parties, but rather make biogas programmes aware of the complications connected to the CDM methodologies.
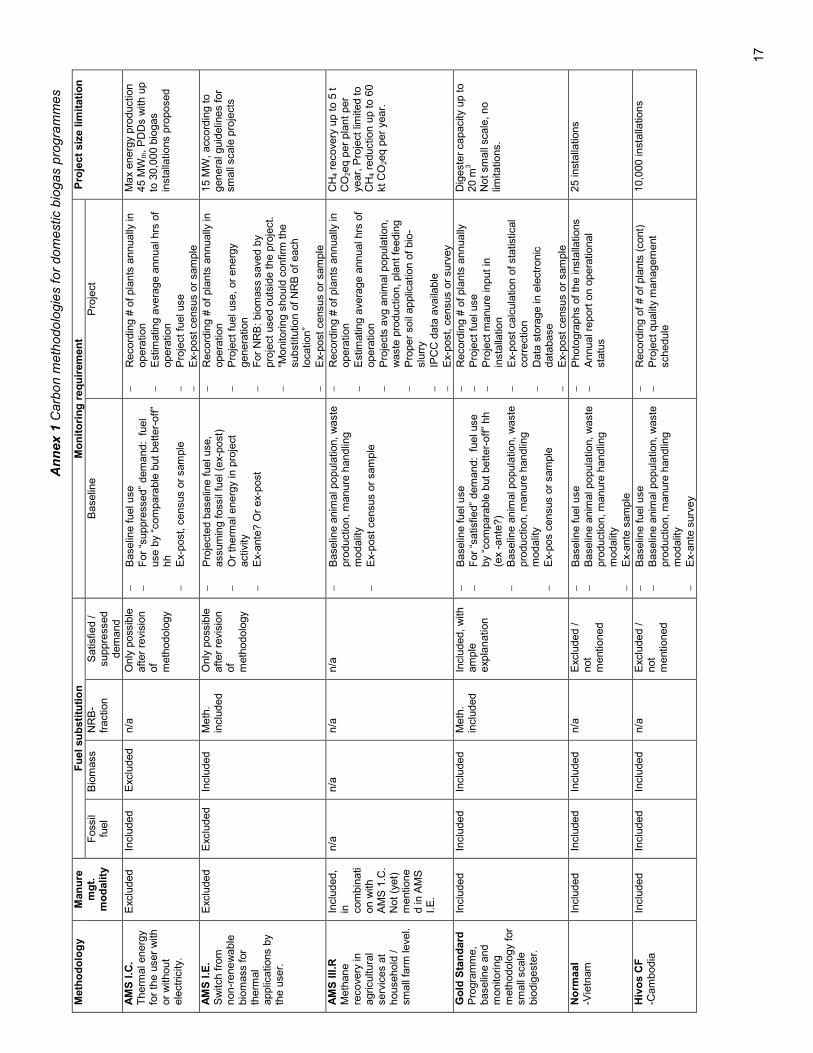
Annex 1 Carbon methodologies for domestic biogas programmes
17
Fuel substitution
Monitoring requirement
Methodology
Manure
mgt.
modality
Foss
il fu
el
Bio
mass
NR
B-
fractio
n
Satis
fied /
suppre
ssed
dem
and
Baselin
e
Pro
ject
Project size limitation
AMS I.C.
Therm
al e
nerg
y fo
r th
e u
ser
with
or
without
ele
ctr
icity.
Exc
luded
Inclu
ded
Exc
luded
n/a
O
nly
poss
ible
aft
er
revi
sio
n
of
meth
odolo
gy
−
Baselin
e f
uel u
se
−
For
“suppre
ssed”
dem
and: fuel
use b
y “c
om
para
ble
but better-
off
” hh
−
Ex-
post,
census o
r sam
ple
−
Record
ing #
of pla
nts
annually
in
opera
tion
−
Est
imating a
vera
ge a
nnual hrs
of
opera
tion
−
Pro
ject fu
el u
se
−
Ex-
post
census
or
sam
ple
Ma
x energ
y pro
duction
45 M
Wth, P
DD
s w
ith u
p
to 3
0,0
00 b
iogas
insta
llations p
roposed
AMS I.E.
Sw
itch fro
m
non-r
ene
wable
bio
mass
for
therm
al
applic
ations b
y th
e u
ser.
Exc
luded
Exc
luded
Inclu
ded
Meth
. in
clu
ded
Only
poss
ible
aft
er
revi
sio
n
of
meth
odolo
gy
−
Pro
jecte
d b
aselin
e f
uel u
se,
assum
ing foss
il fu
el (
ex-
post)
−
Or
therm
al e
nerg
y in
pro
ject
activi
ty
−
Ex-
ante
? O
r ex-
post
−
Record
ing #
of pla
nts
annually
in
opera
tion
−
Pro
ject fu
el u
se,
or
energ
y genera
tion
−
For
NR
B: bio
mass
save
d b
y pro
ject
used o
uts
ide t
he p
roje
ct.
−
“Monitoring s
hould
confirm
the
subst
itution o
f N
RB
of each
location”
−
Ex-
post
census
or
sam
ple
15 M
W, acc
ord
ing to
genera
l guid
elin
es for
small
scale
pro
ject
s
AMS III.R
Meth
ane
recove
ry in
agricultura
l serv
ices
at
household
/
small
farm
leve
l.
Inclu
ded,
in
com
bin
ati
on w
ith
AM
S 1
.C.
Not
(yet)
m
entione
d in A
MS
I.
E.
n/a
n/a
n/a
n/a
−
Baselin
e a
nim
al p
opula
tion,
waste
pro
duction, m
anure
handlin
g
modalit
y
−
Ex-
post
census
or
sam
ple
−
Record
ing #
of pla
nts
annually
in
opera
tion
−
Est
imating a
vera
ge a
nnual hrs
of
opera
tion
−
Pro
jects
avg
anim
al p
opula
tion,
waste
pro
duction, pla
nt fe
edin
g
−
Pro
per
soil
applic
ation o
f bio
-slu
rry
−
IPC
C d
ata
ava
ilable
−
Ex-
post,
census o
r surv
ey
CH
4 r
ecove
ry u
p t
o 5
t
CO
2eq p
er
pla
nt
per
year,
Pro
ject
lim
ited to
CH
4 r
eduction u
p t
o 6
0
kt C
O2eq p
er
year.
Gold Standard
Pro
gra
mm
e,
baselin
e a
nd
monito
ring
meth
odolo
gy
for
small
scale
bio
dig
este
r.
Inclu
ded
Inclu
ded
Inclu
ded
Meth
. in
clu
ded
Inclu
ded, w
ith
am
ple
exp
lan
ation
−
Baselin
e f
uel u
se
−
For
“satis
fied”
dem
and: fuel use
by
“com
para
ble
but better-
off
” hh
(ex
-ante
?)
−
Baselin
e a
nim
al p
opula
tion,
waste
pro
duction, m
anure
handlin
g
modalit
y −
Ex-
pos c
ensus o
r sam
ple
−
Record
ing #
of pla
nts
annually
−
Pro
ject fu
el u
se
−
Pro
ject m
anure
input
in
insta
llation
−
Ex-
post
calc
ula
tion o
f st
atis
tical
corr
ection
−
Data
sto
rage in e
lectr
onic
data
base
−
Ex-
post
census
or
sam
ple
Dig
este
r capacity
up to
20 m
3
Not
small
scale
, no
limita
tions.
Normaal
-Vie
tnam
Inclu
ded
Inclu
ded
Inclu
ded
n/a
E
xclu
ded /
not
mentioned
−
Baselin
e f
uel u
se
−
Baselin
e a
nim
al p
opula
tion,
waste
pro
duction, m
anure
handlin
g
modalit
y −
Ex-
ante
sam
ple
−
Photo
gra
phs o
f th
e insta
llations
−
Annual re
port
on o
pera
tional
sta
tus
25 inst
alla
tions
Hivos CF
-Cam
bodia
Inclu
ded
Inclu
ded
Inclu
ded
n/a
E
xclu
ded /
not
mentioned
−
Baselin
e f
uel u
se
−
Baselin
e a
nim
al p
opula
tion,
waste
pro
duction, m
anure
handlin
g
modalit
y −
Ex-
ante
surv
ey
−
Record
ing o
f # o
f pla
nts
(cont)
−
Pro
ject qualit
y m
anagem
ent
schedule
10,0
00 inst
alla
tions

18