dosimetry tools and techniques for imrt - the american
TRANSCRIPT

Dosimetry tools and techniques for IMRTDaniel A. Lowa�
Washington University, St. Louis, Missouri 63110
Jean M. MoranUniversity of Michigan, Ann Arbor, Michigan 48109
James F. DempseyViewray Incorporated, Cleveland, Ohio 44106
Lei DongM. D. Anderson Cancer Center, Houston, Texas 77013
Mark OldhamDuke University Medical Center, Durham, North Carolina 27710
�Received 25 January 2010; revised 4 October 2010; accepted for publication 4 October 2010;published 16 February 2011�
Intensity modulated radiation therapy �IMRT� poses a number of challenges for properly measuringcommissioning data and quality assurance �QA� radiation dose distributions. This report provides acomprehensive overview of how dosimeters, phantoms, and dose distribution analysis techniquesshould be used to support the commissioning and quality assurance requirements of an IMRTprogram. The proper applications of each dosimeter are described along with the limitations of eachsystem. Point detectors, arrays, film, and electronic portal imagers are discussed with respect totheir proper use, along with potential applications of 3D dosimetry. Regardless of the IMRT tech-nique utilized, some situations require the use of multiple detectors for the acquisition of accuratecommissioning data. The overall goal of this task group report is to provide a document that aidsthe physicist in the proper selection and use of the dosimetry tools available for IMRT QA and toprovide a resource for physicists that describes dosimetry measurement techniques for purposes ofIMRT commissioning and measurement-based characterization or verification of IMRT treatmentplans. This report is not intended to provide a comprehensive review of commissioning and QAprocedures for IMRT. Instead, this report focuses on the aspects of metrology, particularly thepractical aspects of measurements that are unique to IMRT. The metrology of IMRT concerns theapplication of measurement instruments and their suitability, calibration, and quality control ofmeasurements. Each of the dosimetry measurement tools has limitations that need to be consideredwhen incorporating them into a commissioning process or a comprehensive QA program. Forexample, routine quality assurance procedures require the use of robust field dosimetry systems.These often exhibit limitations with respect to spatial resolution or energy response and need tothemselves be commissioned against more established dosimeters. A chain of dosimeters, fromsecondary standards to field instruments, is established to assure the quantitative nature of the tests.This report is intended to describe the characteristics of the components of these systems; dosim-eters, phantoms, and dose evaluation algorithms. This work is the report of AAPM Task Group120. © 2011 American Association of Physicists in Medicine. �DOI: 10.1118/1.3514120�
Key words: radiation therapy, dosimetry, intensity modulated radiation therapy, quality assurance,metrology, radiotherapy
TABLE OF CONTENTS
I. DIFFERENCES IN DOSIMETRYREQUIREMENTS BETWEENCONVENTIONAL RADIATION THERAPY ANDIMRT. . . . . . . . . . . . . . . . . . . . . . . . . . . . . . . . . . . . . . 1314
I.A. Dose distribution complexity. . . . . . . . . . . . . . 1314I.B. Temporal nature of IMRT dose delivery and
its impact on absolute dosimetry. . . . . . . . . . . 1314I.C. Monitor units. . . . . . . . . . . . . . . . . . . . . . . . . . 1315I.D. Summary. . . . . . . . . . . . . . . . . . . . . . . . . . . . . . 1315
II. DOSIMETERS. . . . . . . . . . . . . . . . . . . . . . . . . . . . . . 1315
1313 Med. Phys. 38 „3…, March 2011 0094-2405/2011/38„3…
II.A. Point dosimeters. . . . . . . . . . . . . . . . . . . . . . . . 1315II.A.1. Ionization chambers. . . . . . . . . . . . . . . . . . . 1315II.A.2. Solid state dosimeters. . . . . . . . . . . . . . . . . 1317II.A.3. Electrometer and cable performance. . . . . . 1318II.A.4. Applications to IMRT. . . . . . . . . . . . . . . . . 1319II.A.5. Summary of recommendations. . . . . . . . . . 1320
II.B. Two-dimensional dosimetry. . . . . . . . . . . . . . . 1321II.B.1. Film. . . . . . . . . . . . . . . . . . . . . . . . . . . . . . . 1321II.B.2. Array detectors. . . . . . . . . . . . . . . . . . . . . . . 1324II.B.3. Computed radiography. . . . . . . . . . . . . . . . 1325
III. PHANTOMS. . . . . . . . . . . . . . . . . . . . . . . . . . . . . . . 1325III.A. Phantom types. . . . . . . . . . . . . . . . . . . . . . . . . . 1325
1313/1313/26/$30.00 © 2011 Am. Assoc. Phys. Med.
V
IBT
1314 Low et al.: IMRT dosimetry tools 1314
III.A.1. Phantom selection for IMRT. . . . . . . . . . . . 1325III.A.2. Geometric phantoms. . . . . . . . . . . . . . . . . . 1325III.A.3. Anthropomorphic phantoms. . . . . . . . . . . . 1326
III.B. Phantom materials. . . . . . . . . . . . . . . . . . . . . . 1326III.C. Phantom characterization. . . . . . . . . . . . . . . . . 1326
IV. DOSE DISTRIBUTION COMPARISONS ANDEVALUATIONS. . . . . . . . . . . . . . . . . . . . . . . . . . . . 1326
IV.A. Dose distribution registration. . . . . . . . . . . . . . 1326IV.B. Dose comparison tools. . . . . . . . . . . . . . . . . . . 1327
IV.B.1. Dose distribution overlays. . . . . . . . . . . . . . 1327IV.B.2. Dose-difference distributions. . . . . . . . . . . . 1327IV.B.3. Distance-to-agreement. . . . . . . . . . . . . . . . . 1328IV.B.4. Quantitative comparison tools. . . . . . . . . . . 1329
IV.C. Summary. . . . . . . . . . . . . . . . . . . . . . . . . . . . . . 1330V. ADDITIONAL SYSTEMS FOR QUALITY
ASSURANCE. . . . . . . . . . . . . . . . . . . . . . . . . . . . . . . 1330V.A. Electronic portal imaging devices. . . . . . . . . . 1330
V.A.1. Application to IMRT. . . . . . . . . . . . . . . . . . 1331V.A.2. Recommendations for use. . . . . . . . . . . . . . 1331
V.B. Three-dimensional detectors. . . . . . . . . . . . . . . 1331V.B.1. Polymerizing gels. . . . . . . . . . . . . . . . . . . . 1331V.B.2. Fricke and radiochromic gels and plastics.. 1332V.B.3. Readout techniques. . . . . . . . . . . . . . . . . . . 1332V.B.4. Recommendations for use. . . . . . . . . . . . . . 1332
I. SUMMARY. . . . . . . . . . . . . . . . . . . . . . . . . . . . . . . 1332
. DIFFERENCES IN DOSIMETRY REQUIREMENTSETWEEN CONVENTIONAL RADIATIONHERAPY AND IMRT
I.A. Dose distribution complexity
The complex three-dimensional �3D� shapes of intensitymodulated radiation therapy �IMRT� dose distributions andthe methods for IMRT dose delivery demand that the dosim-etry measurement techniques typically employed for conven-tional three-dimensional conformal radiation therapy�3DCRT�, including straightforward dynamic techniquessuch as conformal arc and dynamic wedge, be reviewed andadapted for the unique challenges posed by IMRT. The com-plex shape of the dose distribution leads to numerous regionscontaining steep dose gradients, even within target volumes.Understanding the limitations and use of dosimeters to mea-sure these dose distributions is critical to safe IMRT imple-mentation.
Conventional 3DCRT treatment planning typically utilizesa beam’s eye view approach. Validation of 3DCRT treatmentplans can be accomplished utilizing traditional dosimetrytechniques, such as scanning ionization chambers and moni-tor unit �MU� verification calculations, because these plansare composed of superpositions of relatively large, low flu-ence gradient, radiation segments. However, IMRT treat-ments involve the delivery of complex dose distributionshapes that place steep dose gradients near critical structuresin an optimized 3D configuration. The use of fluence modu-lation allows the radiation beam orientations to be decoupledfrom the tumor and critical structure geometries so that ra-diation beams can be aimed directly through critical struc-
Medical Physics, Vol. 38, No. 3, March 2011
tures and the fluence modulation optimization process willlimit the critical structure doses. Unlike 3DCRT, in IMRTportal images cannot be used to validate critical structureavoidance. The 3D complexity of the dose, along with thedecoupling of the beam geometry and the resulting dose,means that the quality assurance �QA� of IMRT dose distri-butions needs to concentrate more on the cumulative deliv-ered dose rather than on the QA of individual segments, aswell as checking the dose at multiple locations.
The dose gradients in the IMRT dose distributions areintended to match the patient’s target and normal organ ge-ometry. Not only are the relative gradient positions importantto validate, but the absolute positions also need to be veri-fied. The IMRT dose QA measurements need to explicitlyinclude a quantitative registration process for independentlyvalidating the spatial location of the dose gradients. Such aregistration process could involve the use of fixed landmarkson the phantom that are colocated with radiopaque markerssuch that alignment of the phantom to the linear acceleratorcoordinate system using the positioning lasers can be regis-tered with the alignment of the phantom in the treatmentplanning system.
I.B. Temporal nature of IMRT dose delivery and itsimpact on absolute dosimetry
In most 3DCRT procedures, the radiation beam is static,meaning that beam modifiers and the gantry, collimator, andcouch remain stationary during irradiation. Because the ra-diation beam is static, characterization of the radiation beamcan be conducted by scanning ionization chambers in waterphantoms, using interpolation when necessary to fill in thespaces between the measured points. The dosimetric accu-racy of ionization chambers allows for a quantitative mea-surement of the radiation beam. While it is impractical dur-ing 3DCRT planning system commissioning to measureevery clinically used beam configuration, the measurementof a subset of beams is sufficient.1 IMRT dose delivery isoften a dynamic process where the incident fluence shapeand intensity are varying during the treatment, so scan-baseddose measurements become impractical. Therefore, dosemeasurements of IMRT treatment plans are limited to inte-grating dosimetric techniques.
Absolute dosimeters are defined here as those whose re-sults, for absorbed dose to water, require no adjustment orrenormalization other than those done in accordance with theestablished dosimetry protocols �e.g., TG 51�. As an ex-ample, a small-volume ionization chamber is typically cross-calibrated, in the beam quality in question, against an ioniza-tion chamber with a NIST-traceable calibration. The cross-calibrated ionization chamber is then used to measureabsorbed dose �e.g., in Gy� without the need for any renor-malization �other than for temperature and pressure correc-tions�. Factors such as nonuniformity, energy dependence,and response instability exclude some dosimetry systemsfrom being used for absolute dosimetry. Recommendationsfor the specific use of dosimetry systems are provided in this
report.
1315 Low et al.: IMRT dosimetry tools 1315
I.C. Monitor units
Computational MU checks of 3DCRT treatment plans arethe standard of practice for MU validation. These MU checksoften use portal shape approximations to determine the re-quired photon radiation scatter parameters. In conventional3DCRT, these parameters change slowly with respect to thefield size and depth, and field-dependent approximationsyield MU calculations that are accurate to within a fewpercent.2,3 This accuracy is considered adequate by the radia-tion therapy community and is one method used to avoidcatastrophic clinical errors.
For IMRT dose delivery sequences, either dynamic orstatic, the dose at any given location within the target volumeis delivered by a fraction of the total segments in a field. Thenumber of MUs required to deliver the dose distribution willbe a strong function of a complex leaf delivery sequence andis therefore unpredictable based on only the target dose andpatient geometry. A qualified medical physicist can no longerjudge whether the number of MUs is correct based on pro-fessional knowledge and experience, so catastrophic errorsmay not be caught without an independent, quantitative vali-dation mechanism. Either direct dose measurements, con-ducted using phantoms, or independent dose calculation soft-ware, is required to validate the treatment planning output ona patient-specific basis. Independent dose calculation meth-ods �sometimes called monitor unit calculation methods�have been developed and are being used in many centers as acomponent of the patient-specific QA program.4–15 Dose cal-culation methods will continue to evolve and their role inpatient-specific QA is likely to expand. One limitation ofsuch independent dose calculation methods is that the deliv-erability of the IMRT plan is not validated on the actualtreatment device. For this reason, patient-specific validationis often conducted using direct dose distribution measure-ments in homogeneous solid media.
I.D. Summary
The greater need for dose-measurement-based validation,coupled with their greater dose distribution complexity andthe temporal nature of dose delivery, led to this review ofdose measurement systems for IMRT. In this report, we willdescribe the uses and pitfalls of the most relevant dosimetrysystems and highlight the unique influence of IMRT on theiruse. We will also provide recommendations for proper opera-tions of specific dosimeters.
There are also other task group reports that are relevant tothe subject of IMRT dosimetry. The Task Group 106 of theAAPM �Ref. 16� recently published a report entitled “Accel-erator beam data commissioning equipment and procedures:Report of the TG-106 of the Therapy Physics Committee ofthe AAPM” that provided recommendations for detector se-lection. The Task Group 119 �Ref. 17� of the AAPM pub-lished a report comparing different IMRT commissioning re-sults using a standard treatment plan dataset and Task Group142,18 the QA of medical linear accelerators, provides IMRT
QA recommendations.Medical Physics, Vol. 38, No. 3, March 2011
This report includes examples of commercial products.This should not be considered an endorsement by this taskgroup or the AAPM.
II. DOSIMETERS
II.A. Point dosimeters
II.A.1. Ionization chambers
Cylindrical ionization chambers are used for point-dosemeasurements in megavoltage photon radiation therapy be-cause of their excellent stability, linear response to absorbeddose, small directional dependence, beam-quality responseindependence, and traceability to a primary calibration stan-dard. High-spatial resolution is important for IMRTmeasurements.14,19–30 Table I lists some of the commerciallyavailable “small” volume ionization chambers and their de-sign characteristics according to the manufacturer’s litera-ture. All listed chambers are waterproof and designed withair-ventilation. All of these ionization chambers have cylin-drical symmetry, minimizing the sensitivity response varia-tion as a function of beam entry angle when the beam centralaxis is perpendicular to the chamber axis of symmetry. InTable I, the effective length is the length of the active volumealong the axis and the effective diameter is in the radialdirection perpendicular to the axis. Unfortunately, there havebeen a few published studies on the oblique-incidence re-sponse of cylindrical ionization chambers to megavoltagebeams. If the dose distribution verification measurements in-clude noncoplanar beams, the physicist should determine thesensitivity of the ionization chamber in such geometries.
II.A.1.a. Volume averaging. All ionization chambers ex-hibit some amount of volume averaging. This is due to thefact that the collected ions are created throughout the activechamber volume. Volume averaging will cause perturbationsin dose distribution measurements in regions with high cur-vature �large second-order spatial derivatives in the dose dis-tributions�. These typically occur in conjunction with regionsof steep dose gradients, so the effect of volume averaging istypically associated with beam penumbra regions. Bouchardand Seuntjens25 recently examined the perturbations in ion-ization chamber reference dosimetry for IMRT beams andprovided a methodology for correcting the chamber responseto account for nonuniform dose distributions. Monte Carlodose calculations were used to determine perturbation factorsfor cylindrical ionization chambers. Perturbation factors forrelatively large ionization chambers �Farmer, 6 mm in diam-eter, 23 mm length active volume� in individual static anddynamic IMRT fields were determined and found to exceed10% in some cases.25 The sensitivity �dose to the collectionair cavity per incident photon� was sharply peaked at theprojected ionization chamber cavity volume boundaries. Thenonuniform dose response, coupled with the heterogeneousphoton beam fluence, was responsible for the nonunity IMRTcorrection factor. They concluded that fluence-perturbationcorrection factors should be employed for IMRT dose mea-surements. A second conclusion was that one should assure
that the ionization chamber be placed in regions of relatively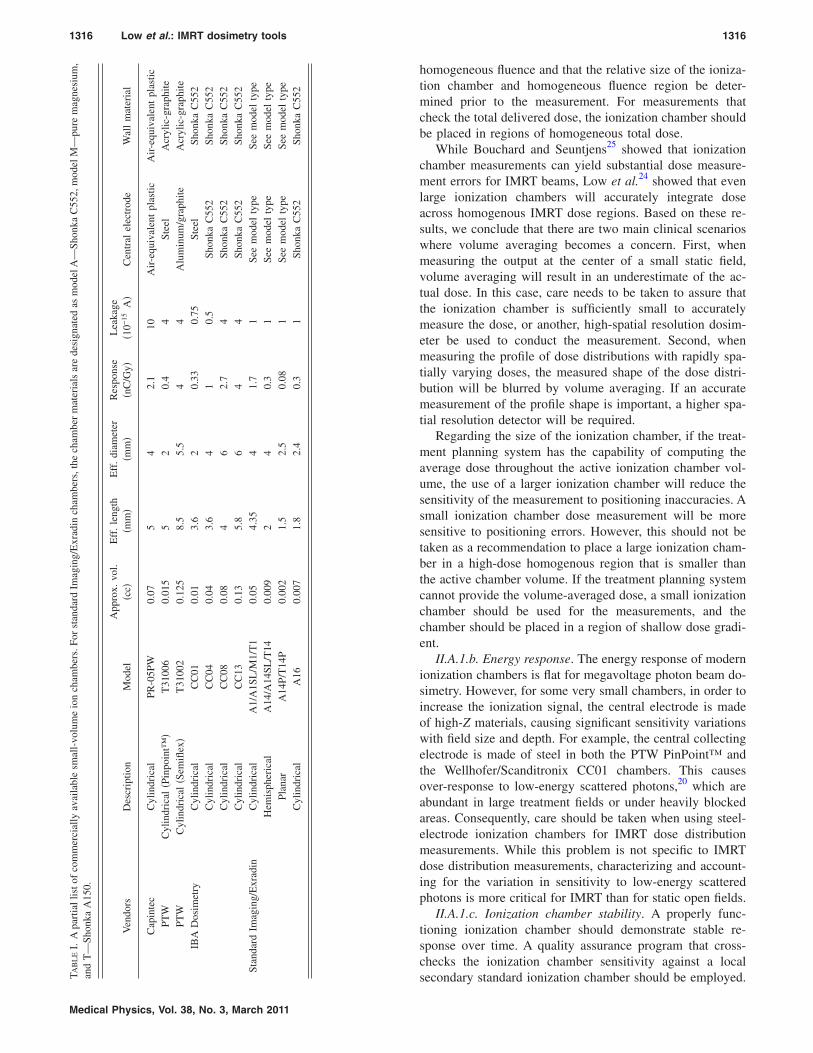
T a
1316 Low et al.: IMRT dosimetry tools 1316
Medical Physics, Vol. 38, No. 3, March 2011
homogeneous fluence and that the relative size of the ioniza-tion chamber and homogeneous fluence region be deter-mined prior to the measurement. For measurements thatcheck the total delivered dose, the ionization chamber shouldbe placed in regions of homogeneous total dose.
While Bouchard and Seuntjens25 showed that ionizationchamber measurements can yield substantial dose measure-ment errors for IMRT beams, Low et al.24 showed that evenlarge ionization chambers will accurately integrate doseacross homogenous IMRT dose regions. Based on these re-sults, we conclude that there are two main clinical scenarioswhere volume averaging becomes a concern. First, whenmeasuring the output at the center of a small static field,volume averaging will result in an underestimate of the ac-tual dose. In this case, care needs to be taken to assure thatthe ionization chamber is sufficiently small to accuratelymeasure the dose, or another, high-spatial resolution dosim-eter be used to conduct the measurement. Second, whenmeasuring the profile of dose distributions with rapidly spa-tially varying doses, the measured shape of the dose distri-bution will be blurred by volume averaging. If an accuratemeasurement of the profile shape is important, a higher spa-tial resolution detector will be required.
Regarding the size of the ionization chamber, if the treat-ment planning system has the capability of computing theaverage dose throughout the active ionization chamber vol-ume, the use of a larger ionization chamber will reduce thesensitivity of the measurement to positioning inaccuracies. Asmall ionization chamber dose measurement will be moresensitive to positioning errors. However, this should not betaken as a recommendation to place a large ionization cham-ber in a high-dose homogenous region that is smaller thanthe active chamber volume. If the treatment planning systemcannot provide the volume-averaged dose, a small ionizationchamber should be used for the measurements, and thechamber should be placed in a region of shallow dose gradi-ent.
II.A.1.b. Energy response. The energy response of modernionization chambers is flat for megavoltage photon beam do-simetry. However, for some very small chambers, in order toincrease the ionization signal, the central electrode is madeof high-Z materials, causing significant sensitivity variationswith field size and depth. For example, the central collectingelectrode is made of steel in both the PTW PinPoint™ andthe Wellhofer/Scanditronix CC01 chambers. This causesover-response to low-energy scattered photons,20 which areabundant in large treatment fields or under heavily blockedareas. Consequently, care should be taken when using steel-electrode ionization chambers for IMRT dose distributionmeasurements. While this problem is not specific to IMRTdose distribution measurements, characterizing and account-ing for the variation in sensitivity to low-energy scatteredphotons is more critical for IMRT than for static open fields.
II.A.1.c. Ionization chamber stability. A properly func-tioning ionization chamber should demonstrate stable re-sponse over time. A quality assurance program that cross-checks the ionization chamber sensitivity against a local
AB
LE
I.A
part
iall
isto
fco
mm
erci
ally
avai
labl
esm
all-
volu
me
ion
cham
bers
.For
stan
dard
Imag
ing/
Exr
adin
cham
bers
,the
cham
ber
mat
eria
lsar
ede
sign
ated
asm
odel
A—
Shon
kaC
552,
mod
elM
—pu
rem
agne
sium
,nd
T—
Shon
kaA
150.
Ven
dors
Des
crip
tion
Mod
elA
ppro
x.vo
l.�c
c�E
ff.
leng
th�m
m�
Eff
.di
amet
er�m
m�
Res
pons
e�n
C/G
y�L
eaka
ge�1
0−15
A�
Cen
tral
elec
trod
eW
all
mat
eria
l
Cap
inte
cC
ylin
dric
alPR
-05P
W0.
075
42.
110
Air
-equ
ival
ent
plas
ticA
ir-e
quiv
alen
tpl
astic
PTW
Cyl
indr
ical
�Pin
poin
t™�
T31
006
0.01
55
20.
44
Stee
lA
cryl
ic-g
raph
itePT
WC
ylin
dric
al�S
emifl
ex�
T31
002
0.12
58.
55.
54
4A
lum
inum
/gra
phite
Acr
ylic
-gra
phite
IBA
Dos
imet
ryC
ylin
dric
alC
C01
0.01
3.6
20.
330.
75St
eel
Shon
kaC
552
Cyl
indr
ical
CC
040.
043.
64
10.
5Sh
onka
C55
2Sh
onka
C55
2C
ylin
dric
alC
C08
0.08
46
2.7
4Sh
onka
C55
2Sh
onka
C55
2C
ylin
dric
alC
C13
0.13
5.8
64
4Sh
onka
C55
2Sh
onka
C55
2St
anda
rdIm
agin
g/E
xrad
inC
ylin
dric
alA
1/A
1SL
/M1/
T1
0.05
4.35
41.
71
See
mod
elty
peSe
em
odel
type
Hem
isph
eric
alA
14/A
14SL
/T14
0.00
92
40.
31
See
mod
elty
peSe
em
odel
type
Plan
arA
14P/
T14
P0.
002
1.5
2.5
0.08
1Se
em
odel
type
See
mod
elty
peC
ylin
dric
alA
160.
007
1.8
2.4
0.3
1Sh
onka
C55
2Sh
onka
C55
2
secondary standard ionization chamber should be employed.
1317 Low et al.: IMRT dosimetry tools 1317
The frequency of this check should be determined by theclinic but should be no less frequent than the calibration ofthe local secondary standard.
II.A.1.d. Stem effect. Irradiating a portion of the ionizationchamber stem �cable or holder� can induce leakage current,and this will perturb the collected charge. Because the signalfrom a small-volume ionization chamber is much weakerthan in a large-volume ion chamber, the relative stem effectmay be more significant. The stem effect for small ionizationchambers has not been well studied in the current literature.The impact of this effect on IMRT dose measurements, es-pecially in low-dose regions, has not been quantified.
II.A.1.e. Acceptance testing. New ionization chambersneed to be tested for appropriate performance. These testsshould be performed before a calibration is obtained for thechamber. The following suggested tests are adapted fromHumphries and Purdy:31
�1� Perpendicular radiographs are taken to verify that thechamber is mechanically sound, comparing with me-chanical design drafts if possible.
�2� Leakage current should be measured to ensure that thechamber has a sufficiently low background and that anyguard electrodes are performing properly. A bias voltageof 300–350 V should yield at most �1–5��10−14 A af-ter a few minutes from turn on or irradiation.
�3� Stem effect should be quantified by irradiating the ion-ization chamber at orientations that include and excludethe guarded portions of the chamber.2 If the guard elec-trodes are properly working, there should be a negligibledifference in readings.
�4� Microphonics �currents generated by mechanically flex-ing the cables� should be tested in the chamber as wellas the cables and connectors that will be used with theionization chamber. The system should be placed understress that is similar to any scanning motion and flexingthat can exist during phantom measurements. Triaxialcables with a Teflon dielectric are preferred.
�5� Radiation equilibration time should be measured. Aproperly working ionization chamber should provide re-producible measurements after at most two readings ofapproximately 200 cGy each.
�6� Atmospheric communication should be tested by check-ing that the chamber obeys ideal gas law scaling of sen-sitivity by mildly changing the temperature of the sys-tem. Severe temperature changes can causecondensation inside the chamber or possible thermaldamage �cracking of plastics�.
�7� Polarity effects should be determined to be small
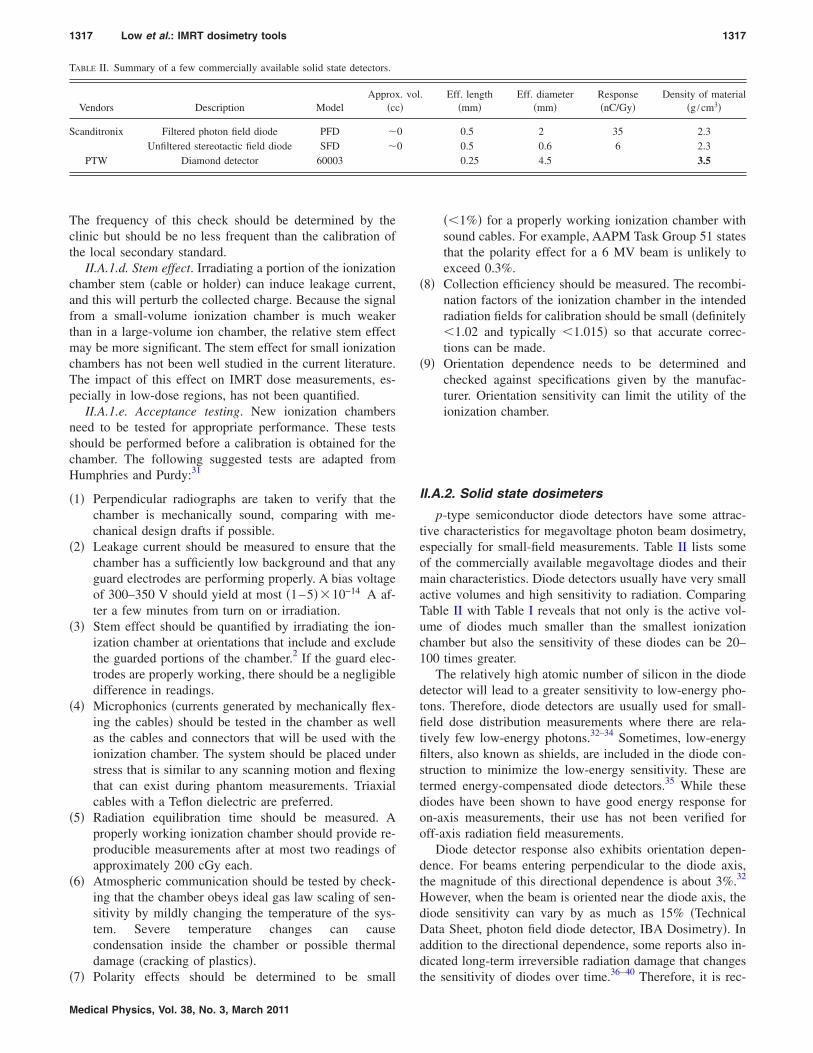
TABLE II. Summary of a few commercially available solid state detectors.
Vendors Description ModelApprox
�cc
Scanditronix Filtered photon field diode PFD �Unfiltered stereotactic field diode SFD �
PTW Diamond detector 60003
Medical Physics, Vol. 38, No. 3, March 2011
��1%� for a properly working ionization chamber withsound cables. For example, AAPM Task Group 51 statesthat the polarity effect for a 6 MV beam is unlikely toexceed 0.3%.
�8� Collection efficiency should be measured. The recombi-nation factors of the ionization chamber in the intendedradiation fields for calibration should be small �definitely�1.02 and typically �1.015� so that accurate correc-tions can be made.
�9� Orientation dependence needs to be determined andchecked against specifications given by the manufac-turer. Orientation sensitivity can limit the utility of theionization chamber.
II.A.2. Solid state dosimeters
p-type semiconductor diode detectors have some attrac-tive characteristics for megavoltage photon beam dosimetry,especially for small-field measurements. Table II lists someof the commercially available megavoltage diodes and theirmain characteristics. Diode detectors usually have very smallactive volumes and high sensitivity to radiation. ComparingTable II with Table I reveals that not only is the active vol-ume of diodes much smaller than the smallest ionizationchamber but also the sensitivity of these diodes can be 20–100 times greater.
The relatively high atomic number of silicon in the diodedetector will lead to a greater sensitivity to low-energy pho-tons. Therefore, diode detectors are usually used for small-field dose distribution measurements where there are rela-tively few low-energy photons.32–34 Sometimes, low-energyfilters, also known as shields, are included in the diode con-struction to minimize the low-energy sensitivity. These aretermed energy-compensated diode detectors.35 While thesediodes have been shown to have good energy response foron-axis measurements, their use has not been verified foroff-axis radiation field measurements.
Diode detector response also exhibits orientation depen-dence. For beams entering perpendicular to the diode axis,the magnitude of this directional dependence is about 3%.32
However, when the beam is oriented near the diode axis, thediode sensitivity can vary by as much as 15% �TechnicalData Sheet, photon field diode detector, IBA Dosimetry�. Inaddition to the directional dependence, some reports also in-dicated long-term irreversible radiation damage that changesthe sensitivity of diodes over time.36–40 Therefore, it is rec-
. Eff. length�mm�
Eff. diameter�mm�
Response�nC/Gy�
Density of material�g /cm3�
0.5 2 35 2.30.5 0.6 6 2.30.25 4.5 3.5
. vol�
00
1318 Low et al.: IMRT dosimetry tools 1318
ommended that diodes be used only for relative dose mea-surements and that care should be taken when selecting di-ode orientation.
In contrast to silicon diode detectors, diamond detectorsare almost soft-tissue equivalent in terms of atomic compo-sition �although they have a physical density much greaterthan water at 3.5 g cm−3�, exhibit a small directional depen-dence, have good mechanical stability, and high radiationhardness21,35,41–43 �lack of radiation sensitivity variation dueto irradiation�. Similar to silicon diodes, diamond detectorsalso exhibit high radiation sensitivity. Bucciolini et al.21
demonstrated that diamond detectors can produce clinicallyidentical results as p-type silicon diodes for small treatmentfields. However, dose-rate dependence may affect the abilityof using diamond detectors for scanning or for measurementsof IMRT dose distributions.21
Recently, chemical vapor deposition �CVD� diodes havebeen investigated for radiation therapy dosimetry.44–54 A Eu-ropean Integrated Project �IP� called MAESTRO �Methodsand Advanced Equipment for Simulation and Treatment inRadiation Oncology, http://www.maestro-research.org/index.htm� is developing a range of new tools for providingdose measurements and the group is concentrating on IMRTdose validation. One of their development efforts is to exam-ine diamond detectors as quantitative radiation dosimeters.
Another type of small-field dosimeter that has been usedin IMRT is the thermoluminescence dosimeter �TLD�.55–68
TLD dosimetry has been used since the 1970s to quantifymegavoltage x-ray dosimetry.69–73 A TLD is an integratingdosimeter, which is usually small in size, often in the form ofa cubical or cylindrical chip, and has a nearly tissue-equivalent atomic composition �Z=8.1� and a typical physi-cal density of 2.6 g cm−3. Typical TLDs can exhibit nonlin-ear integrated dose response, which must be evaluated beforeuse,74 along with some energy response variations. The en-ergy response variation is sufficiently large to require that thesensitivity calibration should be conducted using the samemegavoltage beam energy as the experiment. TLD imple-mentation is labor intensive, so it is typically employedwhere ionization chamber measurements are impractical, forexample, in multiple anthropomorphic phantom dose mea-surements. To achieve dose measurement precision on theorder of 2%–3%, a TLD implementation program requires arigorous annealing and response measurement protocol, androutine QA of the TLD reader and annealing oven tempera-ture control.75
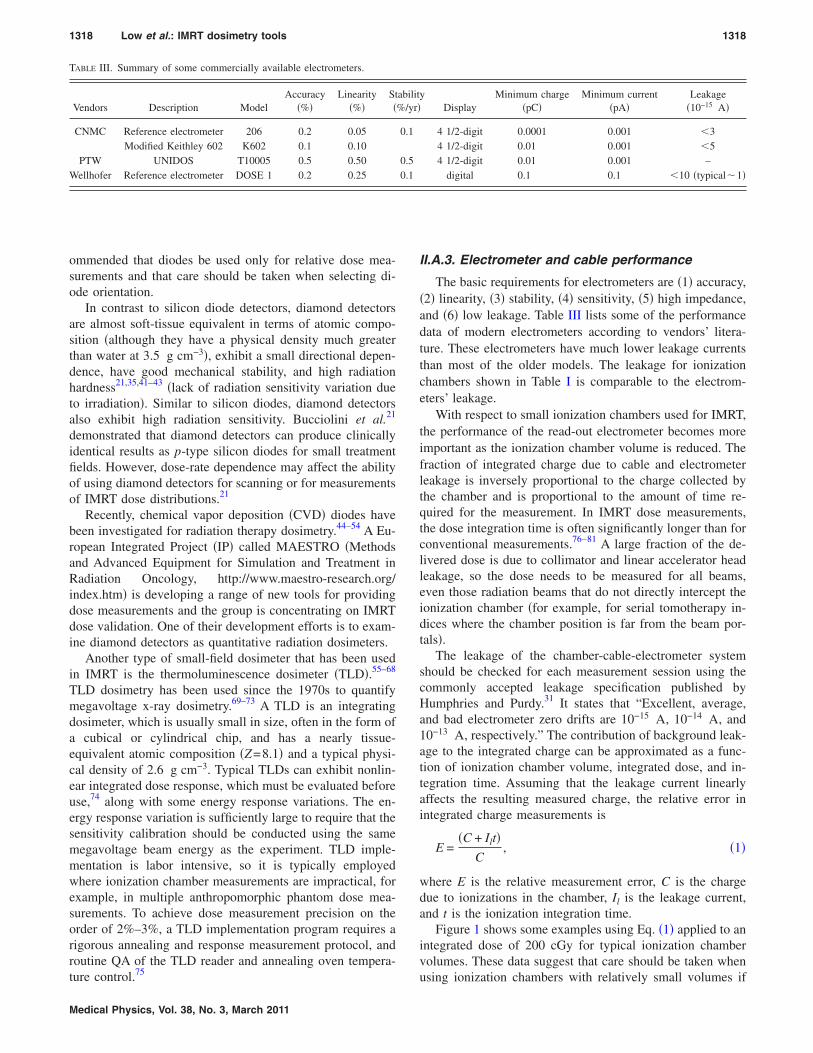
TABLE III. Summary of some commercially available electrometers.
Vendors Description ModelAccuracy
�%�Linearity
�%�St�
CNMC Reference electrometer 206 0.2 0.05Modified Keithley 602 K602 0.1 0.10
PTW UNIDOS T10005 0.5 0.50Wellhofer Reference electrometer DOSE 1 0.2 0.25
Medical Physics, Vol. 38, No. 3, March 2011
II.A.3. Electrometer and cable performance
The basic requirements for electrometers are �1� accuracy,�2� linearity, �3� stability, �4� sensitivity, �5� high impedance,and �6� low leakage. Table III lists some of the performancedata of modern electrometers according to vendors’ litera-ture. These electrometers have much lower leakage currentsthan most of the older models. The leakage for ionizationchambers shown in Table I is comparable to the electrom-eters’ leakage.
With respect to small ionization chambers used for IMRT,the performance of the read-out electrometer becomes moreimportant as the ionization chamber volume is reduced. Thefraction of integrated charge due to cable and electrometerleakage is inversely proportional to the charge collected bythe chamber and is proportional to the amount of time re-quired for the measurement. In IMRT dose measurements,the dose integration time is often significantly longer than forconventional measurements.76–81 A large fraction of the de-livered dose is due to collimator and linear accelerator headleakage, so the dose needs to be measured for all beams,even those radiation beams that do not directly intercept theionization chamber �for example, for serial tomotherapy in-dices where the chamber position is far from the beam por-tals�.
The leakage of the chamber-cable-electrometer systemshould be checked for each measurement session using thecommonly accepted leakage specification published byHumphries and Purdy.31 It states that “Excellent, average,and bad electrometer zero drifts are 10−15 A, 10−14 A, and10−13 A, respectively.” The contribution of background leak-age to the integrated charge can be approximated as a func-tion of ionization chamber volume, integrated dose, and in-tegration time. Assuming that the leakage current linearlyaffects the resulting measured charge, the relative error inintegrated charge measurements is
E =�C + Ilt�
C, �1�
where E is the relative measurement error, C is the chargedue to ionizations in the chamber, Il is the leakage current,and t is the ionization integration time.
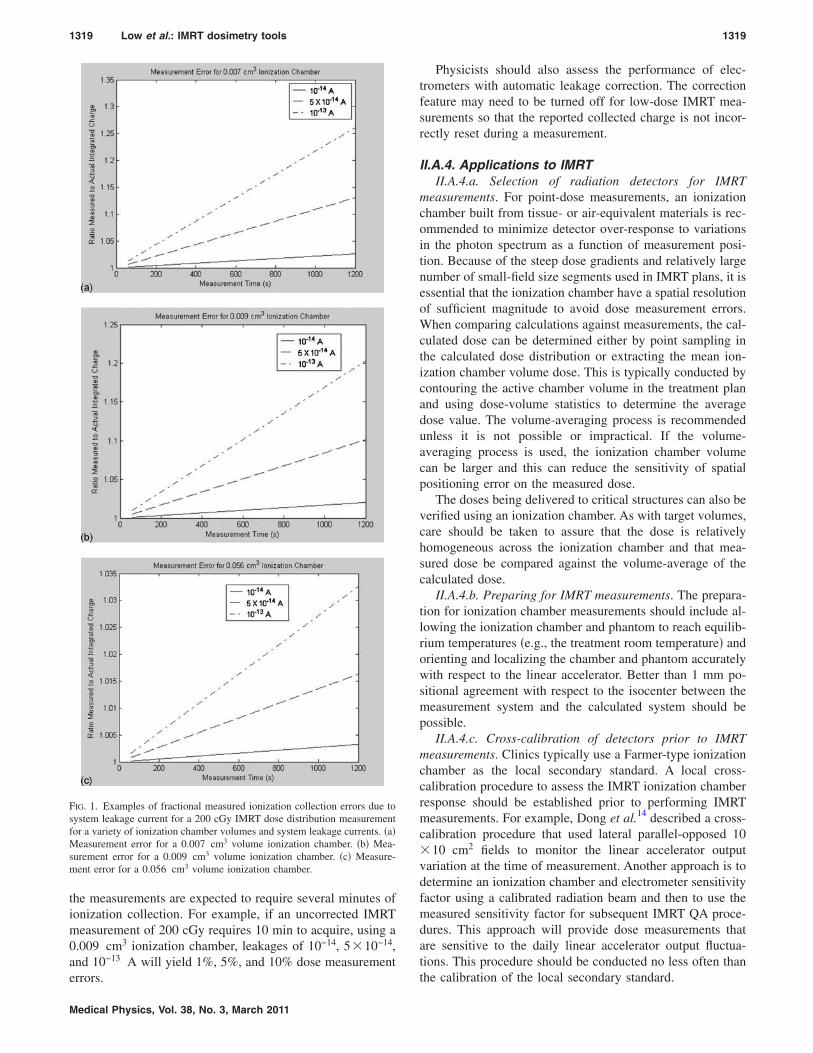
Figure 1 shows some examples using Eq. �1� applied to anintegrated dose of 200 cGy for typical ionization chambervolumes. These data suggest that care should be taken when
yDisplay
Minimum charge�pC�
Minimum current�pA�
Leakage�10−15 A�
4 1/2-digit 0.0001 0.001 �34 1/2-digit 0.01 0.001 �54 1/2-digit 0.01 0.001 –
digital 0.1 0.1 �10 �typical�1�
abilit%/yr�
0.1
0.50.1
using ionization chambers with relatively small volumes if
1319 Low et al.: IMRT dosimetry tools 1319
the measurements are expected to require several minutes ofionization collection. For example, if an uncorrected IMRTmeasurement of 200 cGy requires 10 min to acquire, using a0.009 cm3 ionization chamber, leakages of 10−14, 5�10−14,and 10−13 A will yield 1%, 5%, and 10% dose measurement
FIG. 1. Examples of fractional measured ionization collection errors due tosystem leakage current for a 200 cGy IMRT dose distribution measurementfor a variety of ionization chamber volumes and system leakage currents. �a�Measurement error for a 0.007 cm3 volume ionization chamber. �b� Mea-surement error for a 0.009 cm3 volume ionization chamber. �c� Measure-ment error for a 0.056 cm3 volume ionization chamber.
errors.
Medical Physics, Vol. 38, No. 3, March 2011
Physicists should also assess the performance of elec-trometers with automatic leakage correction. The correctionfeature may need to be turned off for low-dose IMRT mea-surements so that the reported collected charge is not incor-rectly reset during a measurement.
II.A.4. Applications to IMRTII.A.4.a. Selection of radiation detectors for IMRT
measurements. For point-dose measurements, an ionizationchamber built from tissue- or air-equivalent materials is rec-ommended to minimize detector over-response to variationsin the photon spectrum as a function of measurement posi-tion. Because of the steep dose gradients and relatively largenumber of small-field size segments used in IMRT plans, it isessential that the ionization chamber have a spatial resolutionof sufficient magnitude to avoid dose measurement errors.When comparing calculations against measurements, the cal-culated dose can be determined either by point sampling inthe calculated dose distribution or extracting the mean ion-ization chamber volume dose. This is typically conducted bycontouring the active chamber volume in the treatment planand using dose-volume statistics to determine the averagedose value. The volume-averaging process is recommendedunless it is not possible or impractical. If the volume-averaging process is used, the ionization chamber volumecan be larger and this can reduce the sensitivity of spatialpositioning error on the measured dose.
The doses being delivered to critical structures can also beverified using an ionization chamber. As with target volumes,care should be taken to assure that the dose is relativelyhomogeneous across the ionization chamber and that mea-sured dose be compared against the volume-average of thecalculated dose.
II.A.4.b. Preparing for IMRT measurements. The prepara-tion for ionization chamber measurements should include al-lowing the ionization chamber and phantom to reach equilib-rium temperatures �e.g., the treatment room temperature� andorienting and localizing the chamber and phantom accuratelywith respect to the linear accelerator. Better than 1 mm po-sitional agreement with respect to the isocenter between themeasurement system and the calculated system should bepossible.
II.A.4.c. Cross-calibration of detectors prior to IMRTmeasurements. Clinics typically use a Farmer-type ionizationchamber as the local secondary standard. A local cross-calibration procedure to assess the IMRT ionization chamberresponse should be established prior to performing IMRTmeasurements. For example, Dong et al.14 described a cross-calibration procedure that used lateral parallel-opposed 10�10 cm2 fields to monitor the linear accelerator outputvariation at the time of measurement. Another approach is todetermine an ionization chamber and electrometer sensitivityfactor using a calibrated radiation beam and then to use themeasured sensitivity factor for subsequent IMRT QA proce-dures. This approach will provide dose measurements thatare sensitive to the daily linear accelerator output fluctua-tions. This procedure should be conducted no less often than
the calibration of the local secondary standard.
1320 Low et al.: IMRT dosimetry tools 1320
II.A.4.d. Output factor measurements. Dose measurementerrors can occur if small-field output measurements are con-ducted with large-volume ionization chambers. Small-volume ionization chamber measurements without volume-averaging corrections should be used for field sizes between2�2 and 5�5 cm2 such that the field sizes are 1.5 cmwider than the effective length of the ionization chamber.Correction techniques, such as the deconvolution method,have been used to obtain accurate relative output measure-ments using small-volume ionization chambermeasurements,22,82–84 but they are not in widespread use. Forlarger field sizes, standard-volume ion chambers can be used.Alternatively, radiographic or radiochromic film or diodescan be used to determine the output factors for very small-field sizes.85–89
II.A.4.e. Profile and central axis depth-dosemeasurements. IMRT treatment planning systems requireprofile and depth-dose measurements as input for modelingand verification. Photon beam profiles have steep dose gra-dients and, consequently, the spatial resolution of the mea-suring detector can profoundly affect the measured profileaccuracy. Even small-volume ionization chambers will arti-ficially broaden the measured penumbra shape due to volumeaveraging.16,20 Using the ionization-chamber measured pen-umbra in the treatment planning system modeling processmay cause errors in subsequent IMRT dose calculations andMLC leaf sequences.90,91 High-spatial resolution measure-ment systems �effective resolution �1 mm�, such as radio-graphic and radiochromic film coupled with quantitative filmdensitometers, or scanning diodes, will provide sufficientlyaccurate measurements of the penumbra shape for treatmentplanning system dose modeling.
Aside from radiochromic film, the high-spatial resolutiondetector systems have non-water-equivalent energy response.The measurements using these systems will be more accurateif they are confined to relative measurements where the beamenergy spectrum does not vary significantly within the mea-sured distribution. The photon energy spectrum changes suf-ficiently with respect to depth for central axis depth doses,for example, so that the energy response of the non-water-equivalent detectors can cause measurement errors. There arealso ionization chambers that have non-water-equivalent re-sponse. An example is the steel-electrode PinPoint ionizationchamber �Table I� dose response reported by Martens et al.20
While this ionization chamber provided excellent profilemeasurements, the steel electrode caused energy responsevariations that made the chamber unsuitable for output factormeasurements or depth-dose measurements. Recently, Ago-stinelli et al.92 reported the energy response for a new ver-sion of the PinPoint ionization chamber with an aluminumelectrode. When a polarity correction measurement wasused, the ionization chamber response varied less than 0.5%for field sizes from 2�2 to 40�40 cm2. It is incumbent onthe physicist to conduct the sensitometric measurements atdepths and field geometries that most closely match the pro-file measurement conditions so that differences in the photon
spectrum yield insignificant sensitivity differences.Medical Physics, Vol. 38, No. 3, March 2011
II.A.5. Summary of recommendations
�1� Ionization chambers
�a� Ionization chambers should be used:
�i� In homogeneous dose regions�ii� To verify monitor unit outputs�iii� To verify critical structure doses.
�b� Ionization chambers should not be used:
�i� To measure beam profiles that will be em-ployed to model the IMRT beam penumbra.
�ii� When the leakage current will yield an inte-grated charge of �5% of the expectedradiation-induced charge. Leakage currentcorrections should be applied if the expecteduncorrected error is �2%.
�c� Chamber selection
�i� A cylindrical ionization chamber should beused.
�ii� The size of the ionization chamber should beappropriate for the task
�1� For measuring output factors: The radia-tion field should be 1.5 cm wider thanthe effective length of the ionizationchamber.
�2� For IMRT dose measurements: The ion-ization chamber size should be smallenough to limit the dose heterogeneityacross the chamber active volume to10% and 5% if the measurements arebeing compared against volume-averaged and point doses, respectively.
�iii� The ionization chamber electrode should befabricated out of low-Z materials �e.g., alu-minum�. When high-Z electrodes are used,the chamber should be cross-calibrated inconditions that minimize photon spectral dif-ferences �e.g., the same depth and minimiz-ing field size differences�.
�d� Measurement protocols
�i� When ionization chambers are used to vali-date single-point IMRT absolute doses:
�1� The ionization chamber should beplaced in a region of the dose distribu-tion where the expected dose heteroge-neity is less than 10% or 5% across theionization chamber and the expecteddose heterogeneity is less than 10%within 2 mm from the intended ioniza-
tion chamber position, if the measure-
1321 Low et al.: IMRT dosimetry tools 1321
ments are being compared againstvolume-averaged or point doses, respec-tively.
�2� While point-dose comparisons are pos-sible with all treatment planning sys-tems, the measured dose should be com-pared to the calculated doses that havebeen averaged throughout the activeionization chamber active volume. Thisis typically done by computing the doseusing a CT scan with the ionizationchamber in place, contouring the ioniza-tion chamber volume, and querying thetreatment planning system dose statis-tics for the mean dose. This system canalso be used to identify the expecteddose heterogeneity.
�2� Diode detectors �single-point detectors�
�a� Diode detectors should be used:
�i� For measuring relative dose distributions,particularly for measuring MLC penumbrasused in beam modeling in a treatment plan-ning system
�ii� For providing dose measurement pointssupplemental to ionization chambermeasurements
�b� Diode detectors should not be used:
�i� To measure absolute doses�ii� As the sole measurement device for measur-
ing beam profiles that will be employed tomodel the IMRT beam penumbra. This isdue to the potential for over-response in thelow-dose regions outside the field bound-aries. Other detectors with little energy re-sponse variations should be compared todiode-measured profiles to assure that the di-ode profile provides accurate out-of-fieldresults.
�c� Diode selection
�i� Use unshielded diode detectors�ii� Diode detectors designed for in vivo dosim-
etry should not be used for in-phantommeasurements.
�d� Measurement protocols
�i� Diode response varies with orientation, sothe relative orientation of the diode to theradiation beam should be carefullyconsidered.
�3� Thermoluminescent dosimeters �chips�
�a� TLD detectors should be used:
Medical Physics, Vol. 38, No. 3, March 2011
�i� When the phantom geometry will not allowionization chamber measurements.
�ii� When multiple simultaneous point measure-ments are desired.
�b� TLD detectors should not be used:
�i� To measure absolute doses if the overallmeasurement precision needs to be betterthan 3%
�c� TLD selection
�i� Low-atomic number TLDs �e.g., LiF� shouldbe used.
�d� Measurement protocols
�i� A strict annealing and calibration protocolshould be adopted that provides relative re-sponse factors for individual chips.
�ii� Care should be taken to assure that the useraccurately knows the TLD positions with re-spect to the linear accelerator.
II.B. Two-dimensional dosimetry
While point dosimetry allows for absolute IMRT dose dis-tribution validation at individual points, thorough validationand quality assessment of IMRT dose distributions requireshigher dimensional measurements. The current commercialoptions for two-dimensional �2D� dosimetry are radiographicfilm, radiochromic film, computed radiography, diode arrays,and ionization chamber arrays.
II.B.1. FilmII.B.1.a. Silver halide film. This section describes the rela-
tive 2D radiographic film dosimetry techniques for IMRTvalidation and quality assurance. A report from the AmericanAssociation of Physicists in Medicine �AAPM� Task Group69 on radiographic film for megavoltage beam dosimetrycomprehensively addressed all aspects of radiographic filmdosimetry and we refer the reader to this document for amore detailed discussion.93
Although radiographic film has been demonstrated to becapable of effectively validating 2D IMRT dose distributionsin phantoms, there are many important considerations andpotential pitfalls in using this technique. These include varia-tions in film sensitivity caused by film batch, processor con-ditions, variations in photon beam spectrum throughout themeasured dose distribution, and densitometry artifacts. Ofthese variables, the one that has the greatest potential forcausing dosimetry errors is the variation in optical density�OD� with film processor developer temperature �TG 69 andBogucki et al.94�.
When considering the trade-off between experimentalcomplexity and labor and the information obtained, radio-graphic film provides an attractive measurement technique.Radiographic film dosimetry is convenient to employ be-
cause high quality, automated film-processing equipment is
1322 Low et al.: IMRT dosimetry tools 1322
still available in most clinical settings. In general, whenmatched with the appropriate densitometer, film is an excel-lent tool for 2D dose mapping due to its extremely high-spatial resolution with grain sizes typically having dimen-sions on the order of microns.
II.B.1.b. Radiochromic film. Unlike radiographic film, ra-diochromic film is nearly tissue-equivalent and does not re-quire a processor for generating the optical density responseto ionizing radiation. An AAPM Task Group �TG 55� �Ref.95� reported on the use of radiochromic film for dosimetrymeasurements. Until recently, most of the experience usingradiochromic film was based on Gafchromic MD-55 and HS,which were relatively insensitive to radiation.86,87,96–103 Thedose sensitivity was too low for the film to be practical forroutine clinical IMRT measurements. Recently, a high-sensitivity radiochromic film �Gafchromic EBT� was intro-duced that has OD sensitivity similar to the radiographicKodak EDR-2 film.104–112 The current fabrication process forEBT film places the radiation sensitive layer within the sub-strate in such a way that the measured OD can be a strongfunction of the film orientation.113 Laser densitometers arenot recommended for use with the film because the crystal-line structure for this type of film has changed from that ofprevious films, causing polarization artifacts and lead to asteep orientation dependence of OD response.114 Initial in-vestigation of fluorescent lamp-based flatbed scanners withthe new film yielded promising results.84,115 Published worksindicate that there are three significant artifacts that can limitthe accuracy of Gafchromic EBT read out on flatbedscanners.113,114,116 The first effect is a film rotation effect thatdepends on the orientation of the film on a flatbed scannerbed. The second involves scanner uniformity, and the thirddepends on the temperature of the scanner bed while scan-ning. In spite of these limitations, radiochromic film is theonly available alternative for high-spatial resolution 2D dosemeasurements for clinics that have not retained or installedradiographic film processors.
Potential users of EBT film should be aware that clinicalimplementation of radiochromic film poses additional chal-lenges that differ from radiographic film. The current formu-lation of EBT film utilizes a hydroscopic emulsion thatcauses variation in sensitivity immediately after the films arecut, typically done to place them in a phantom or to preparefor a sensitometric measurement. Some cutting techniquescause more shearing that leads to greater film edge artifacts,so the user should develop a cutting technique that mini-mizes shearing.
At typical dose levels, the pixel-to-pixel measurementnoise is greater than other dosimetry techniques in radiationtherapy. For data used in the measurement of beam profilesor output factors, the dose to the film can be increased suchthat the noise is relatively small. When radiochromic film isused to measure clinical IMRT dose distributions in low-doseregions, or to characterize low-dose features such as penum-brae tails, the pixel-to-pixel noise may limit the measurementprecision. Methods such as pixel averaging can be used toreduce the noise, but caution should be taken to assure that
these methods do not introduce errors in the measured doses.Medical Physics, Vol. 38, No. 3, March 2011
As with other film methods, all films within an experimentshould be consistently handled, for example, storage condi-tions, time between irradiation and scanning, and orientationin the scanner. The sensitivity to humidity has not yet beenquantified and may be a significant cause of optical densityvariations.
The manufacturer recently developed a new formulationand markets it as EBT-2. The manufacturer claims thatEBT-2 has improved properties over the previous film, butthe user should verify its dosimetric properties prior to use.
II.B.1.c. Densitometry. After processing, films need to bescanned to measure their response. Transmission-based opti-cal scanners are required for good quantitative results. Whenproperly calibrated and characterized, commercially avail-able 2D optical densitometers allow for the study of the steepdose gradients found in IMRT dose distributions. For thepurposes of this report, we divide the scanner designs intotwo classes. Confocal point-source scanners translate a pointsource over the film, typically by translating a collimatedbeam of light in concert with a confocal detector �singlesource focused to a detector such that measurements aremade point-by-point�. This type of scanner typically has thepoorest spatial resolution with beam spot sizes between 0.25and 0.8 mm in diameter. Sample spacing for these devicescan be typically adjusted between a fraction of the spot sizeand several centimeters. Higher-dimensional scanners em-ploy linear or area arrays of detectors and a light source.Commercially available 2D scanners typically have pixel di-mensions that are defined by the light source and detectorgeometry. These devices have a much higher spatial reso-lution with pixel dimensions between 0.34 and 0.042 mm.The detectable OD for these devices typically ranges be-tween 0 OD and an upper limit of between 2.5 and 4.0 OD,depending on the light source and detector technology. Mea-surements should be limited to the OD dynamic range speci-fied by the scanner manufacture to ensure reliable results.
Before using a scanning system for film densitometry, theresponse, spatial integrity, susceptibility to image artifacts,and quality assurance protocol of the scanner should bechecked according to the recommendations of the AAPMTG69. It is important to establish a protocol of operation sothat results are measured consistently, for example, assuringthat the scanner reaches steady-state operating conditions.
II.B.1.d. Application to IMRT. Radiographic film. Silverhalide based radiographic films, often referred to as radio-graphic films �although all dosimetry films are, in fact, radio-graphic�, have been widely used for validation of therelative dosimetry of IMRT treatment phantomplans.56,65,68,90,106,117–127 In principle, such measurements al-low for the verification of the appropriate shape and registra-tion of the IMRT dose distribution in a selected two-dimensional plane �film plane�. Appropriate selection of theorientation and locations of the film planes is important toassure that the measured dose is useful for the desired QAfunction.
The most important quantity to consider when selecting atype of film for dosimetry is the dependence of OD on the
absorbed ionizing radiation dose, often called the sensitomet-
1323 Low et al.: IMRT dosimetry tools 1323
ric or characteristic curve. There are numerous commercialmanufacturers of radiographic films, including Agfa, CEA,DuPont, Fuji, Kodak, and Konica. These companies make awide range of films for different applications. Currently inthe United States, the majority of clinical film dosimetry isperformed with two films from a single manufacturer: KodakXV2 and EDR2 film. These films differ mainly in the shapeof their characteristic curves and the speed of the films. Inorder to measure an IMRT dose distribution without perturb-ing the clinical delivery process, a film is required to accu-rately measure doses up to the maximum delivered dose. Fordose measurements of individual fields, either Kodak XV2 orEDR2 film is useful. For composite dose measurements ofentire IMRT dose distributions, EDR2 film is most appropri-ate because it is the only film type with a characteristic curvethat maintains a useful sensitometric slope up to and beyond500 cGy.121,127–129 Zhu et al.129 showed that the sensitometriccurve maintains a slope until 600 cGy, but the net OD at thatpoint was 3, which can cause densitometry artifacts for somescanners. In order to allow the OD of EDR2 film to stabilize,the film should be processed at least 1 h after irradiation.130
Radiochromic film. Because of its nearly tissue-equivalentcharacteristics and well-matched dose response, radiochro-mic film can be used to acquire accurate relative dose distri-bution measurements.95,105,131–134 For IMRT commissioning,radiochromic film can be used to acquire beam profiles thatwill be used for modeling beam penumbra.99,133 It can alsobe used to measure relative output factors for very smallfields100,133,135–137 and can be used to measure phantom-based IMRT dose distributions, for example, dose distribu-tion measurements that will be used to verify the treatmentplanning system’s programming of the linear accelerator de-livery parameters �“monitor unit outputs”�.
Although radiochromic film has a nearly linear OD de-pendence, accurate dose measurements still require acustom-measured sensitometric curve.99 This is typicallyconducted by cutting up a piece of radiochromic film intorelatively small pieces �approximately 3�3 cm2� and irra-diating each piece to a different dose. Even though EBT filmis nearly tissue-equivalent, the calibration beam should be ofthe same energy as the measurement energy. In order to al-low the OD response of the film to stabilize, the film shouldnot be scanned less than 1 h after irradiation.99
II.B.1.e. Summary of recommendations.
�1� Film
�a� Radiographic film
�i� Radiographic film should be used:
�1� For relative IMRT dose distributionmeasurements
�2� To measure beam profiles that will beemployed to model the IMRT beampenumbra
�3� For measuring relative output factors ofsmall fields
�ii� Radiographic film should not be used:
Medical Physics, Vol. 38, No. 3, March 2011
�1� For absolute dose measurements�2� To verify monitor unit outputs
�iii� Film selection
�1� Two commercial radiographic films aremost commonly used, Kodak EDR2 andXV2. The selection of film should bebased on the expected maximum dose inthe film plane.
�2� XV2 should not be used to measuredoses greater than 100 cGy.
�3� EDR2 should not be used to measuredoses greater than 500 cGy.
�iv� Measurement protocols
�1� A sensitometric curve should be mea-sured for each radiographic film experi-ment.
�2� The sensitometric curve films should beselected from the same batch as themeasurement films.
�3� The sensitometric curve films should beprocessed at the same time as the mea-surement films.
�4� The recommendations of AAPM TaskGroup 69 should be observed for radio-graphic film and densitometry.
�5� Handle film carefully with clean handsor light cotton gloves.
�6� Bending, stretching, or scratching filmsshould be avoided.
�7� For EDR-2, wait at least 1 h after irra-diation before processing.
�b� Radiochromic film
�i� Radiochromic film should be used:
�1� For measuring relative dose distribu-tions
�2� For measuring dose distributions thatwill be used to model the IMRT beampenumbra
�3� For measuring relative output factors ofsmall fields
�4� When a radiographic film processor isnot available
�ii� Radiochromic film should not be used:
�1� For absolute dose measurements�2� To verify monitor unit outputs
�iii� Film selection
�1� EBT-2 is the only film commerciallyavailable with appropriate sensitivity
�iv� Measurement protocols

1324 Low et al.: IMRT dosimetry tools 1324
�1� A sensitometric curve should be mea-sured for each radiochromic film experi-ment.
�2� The sensitometric curve films should beselected from the same batch as themeasurement films.
�3� The optical density distribution shouldbe measured no sooner than 1 h afterirradiation
�4� The sensitometric curve and measure-ment films should be irradiated on thesame day
�5� The sensitometric curve and measure-ment films should be scanned on thesame day
�6� The orientation of the sensitometric andmeasurement films during scanningneeds to be consistent with respect tothe original orientation.
�7� Handle film carefully with clean handsor light cotton gloves.
�8� Bending, stretching, or scratching filmsshould be avoided.
II.B.2. Array detectors
Array detectors calibrated to yield multiple cumulativereadings of absorbed dose across a 2D plane represent a re-cent and popular new addition to the tools available for rou-tine clinical IMRT QA.106,138–141 They offer the potential forincreased efficiency because, after cross-calibration, they canbe used to provide a large number of dose measurements in asingle irradiation �per beam�, with the results available im-mediately after delivery. The immediacy of the results repre-sents an attractive feature for IMRT QA as it facilitates effi-cient diagnosis of common sources of error and estimation oftheir magnitude. Examples include errors in leaf calibrationand inaccurate penumbral and small-field output factor mod-eling by the treatment planning system. Correlating measure-ment discrepancies that lie along the trajectory of a leaf paircan be used to diagnose leaf-positioning errors. Existing ar-ray detectors have low spatial resolution �typically�7 mm�, which limits their role to routine QA of a precom-missioned IMRT technique. Initial commissioning should beperformed with a higher resolution system �e.g., film� to en-able more thorough evaluation of the fine dose distributionstructure. A further limitation to array detectors is that al-though each beam can be independently verified, no knowl-edge is obtained about the composite 3D dose distribution,resulting from the superposition of all beams. If errors aredetermined in individual beams, the accumulation of all er-rors in the 3D distribution is unknown. Significant discrep-ancies at this stage can be investigated with planar measure-ments in 3D phantoms �Sec. II B 1�. Despite theselimitations, 2D planar detector arrays have achieved wide-spread clinical acceptance due to their convenience and effi-ciency.
Medical Physics, Vol. 38, No. 3, March 2011
II.B.2.a. Description. Until recently, the only commer-cially available two-dimensional diode array detector utilizedn-type diode technology.138,140,141 This device is called theMapcheck �Sun Nuclear, Melbourne, FL� �Fig. 2�. TheMapcheck contains an array of 445 variably spaced diodesover an area of 22�22 cm2. The diode spacings are 7.07and 14.14 mm in the central 10�10 cm2 and the outer re-gions, respectively. The diode plane has an effective build-updepth of 2 cm and a backscattering thickness of 2.3 cm. Thephysical cross section of each diode is 0.8 mm2. The dioderesponse is linear with dose up to saturation at �2.8 Gy. A2% sensitivity variation has been observed when the instan-taneous dose rate is varied by a factor of 3.140 Uncertaintiesarising from these variations can be minimized by standard-izing the SSD and repetition rates for IMRT QA.138,140
The Mapcheck is calibrated through a straightforwardprocess provided by the manufacturer. A relative detectorcalibration is conducted first using a series of irradiations ofa static field. The detector is rotated or translated betweenirradiations in a manufacturer-defined sequence. This identi-fies the relative calibration of each detector. The second stepcalibrates the Mapcheck device for absolute dosimetry byirradiating the device to a known dose at the central axis. Therelative calibration is highly stable, and publications indicatethat it is stable for 6 months.106,138,140 The system calibrationvaries with temperature at �0.5% / °C.140
Ionization chamber array detectors are also under devel-opment in academic and commercial institutions.142–144 Re-cently, Poppe et al.145,146 reported on two commercial ioniza-tion chamber arrays. These have been designed andfabricated by PTW-Freiburg. Version 1 and the modelseven29 cover an area of 27�27 cm2. Version 1 has 256detectors �16�16� and model seven29 has 729 �27�27�ionization chambers, both arrayed in a square pattern. Ver-sion 1 utilizes 8�8 mm2 cross-sectional chambers with 8mm water-equivalent material between adjacent chambers toisolate each chamber relative to secondary electron flux per-turbations from neighboring chambers. The model seven29utilizes 5�5 mm2 cross-sectional chambers with 5 mmwater-equivalent material between adjacent chambers. Thechambers for both version 1 and model seven29 have 5 mmair-filled height. The short- and long-term �4 months� repro-ducibility was found to be 0.2% and 1%, respectively. Thelinearity was excellent, being less than 0.4% from doses of 2
FIG. 2. Example of a matrix detector.
1325 Low et al.: IMRT dosimetry tools 1325
to 500 MU. The measured output factors showed excellentagreement with conventional ionization chambermeasurements.145,146 Both arrays responded as expected withrespect to spatial resolution.
II.B.2.b. Application to IMRT. The Mapcheck device isused to verify the absolute and relative dose distribution on abeam-by-beam basis. The device is leveled on the couch andirradiated at normal incidence with the gantry oriented withthe central axis pointing downward. Typically, additionalbuild-up material is placed on the device so that the effectivemeasurement plane is 5 cm or deeper. For large IMRT fields,it may be necessary to reduce the SSD to maintain the fieldwithin the 22 cm2 active area with an equivalent reductionin the SSD used in the phantom treatment plan or multiplemeasurements may be required with the device at differentpositions. Software interpolation of the measured dose pointsgenerates a 2D contour map of IMRT dose distribution at themeasurement depth. The user can then import the calculateddose distribution corresponding to the same beam and depthfor comparison and analysis.
The 2D ionization chamber arrays have detector spacingof 1�1 cm2, so they may not provide sufficiently high-spatial resolution to provide isodose distributions, but eachdetector point may provide a quantitative dose measurement.Depending on the dose analysis tool employed, even withsuch a relatively coarse spacing, the detector array may pro-vide a quantitative method for evaluating IMRT dose distri-butions. Further investigation is warranted to determine thelimitations of these arrays for IMRT QA.
II.B.2.c. Recommendations for use.
�1� Useful for efficient routine QA of a precommissionedIMRT technique. Initial commissioning should be per-formed with a system with higher spatial resolution�e.g., film�.
�2� For calibration and all measurements with the device,the linear accelerator dose repetition rate should be thesame as for the clinical treatment.
�3� The device calibration should be checked monthly, or asspecified by the manufacturer or published literature.
�4� Careful consideration should be given to the develop-ment of pass/fail acceptance criteria for the evaluation ofthe results from an array detector. For example, AAPMTask Group 119 �Ref. 17� demonstrated pass rates of�90% of the evaluated points when using 3 mm/3%distance-to-agreement �DTA� and dose-difference crite-ria, respectively, when reporting institution’s planar di-ode detector measurement QA results. Each physicistshould determine acceptance criteria that are appropriatefor the treatment site, the treatment objectives, and theclinic’s policies.
II.B.3. Computed radiography
Computed radiography �CR� has been available for morethan 20 years,147 but is gaining interest in radiation oncologyas a dosimeter because of the removal of film processors
from radiation oncology departments. CR uses a storageMedical Physics, Vol. 38, No. 3, March 2011
phosphor to temporarily record a radiographic image. Thestorage phosphors use barium, which causes the phosphors toover-respond to low-energy photons. Also, while the systemsare used for radiology, their use as quantitative dosimetersstill has the following challenges: Response stability, readeroptical scatter, sensitivity to room light exposure, and direc-tional response variations.148 CR techniques have been suc-cessfully used for megavoltage beam relative dosimetry byemploying low-energy filters, but care should be taken if CRis used for IMRT QA because the photon spectrum varieswidely across IMRT fields. CR techniques have been suc-cessfully used for relative dosimetry of single and composite�axial plane� megavoltage beam IMRT using low-energy fil-ters for field sizes less than 15�15 cm2.148
III. PHANTOMS
III.A. Phantom types
III.A.1. Phantom selection for IMRT
Verification processes for IMRT vary significantly in theirphantom requirements, with the appropriate phantom deter-mined by the purpose of the measurement. Phantoms aretypically constructed using either water or water-equivalentplastic.65,68,149–152 Open water phantoms can be used whenthe beam is perpendicular to the phantom surface, and wheregreat flexibility in detector positioning is desired. With theproper procedures and design, water-equivalent plastic phan-toms can support multiple detectors, radiographic film, andrapid and efficient setup reproducibility. Such phantoms canalso include the substitution or addition of heterogeneousmaterials.65,150 To conduct an overall evaluation of an IMRTdelivery system, anthropomorphic phantoms are useful inconjunction with other phantoms.
III.A.2. Geometric phantoms
Simple geometric phantoms that can accommodate ion-ization chambers and film are used for measuring single-point and planar doses.65,150 Cubic phantoms, comprised ofslabs, are easy and accurate to set up and allow for measure-ments at multiple depths. The slabs can be water equivalentor built with materials having relative electron densities rep-resenting specific anatomical tissues. Setup accuracy is im-proved if the phantom is scribed with setup lines whose po-sitions are accurately known with respect to the dosimeters.The use of fiducial marks on the film should be consideredfor registration of the film with respect to the phantom. Forexample, a NOMOS phantom was modified to accommodateTLDs and multiple ionization chamber positions by usingdifferent spacers of water-equivalent material.65 The use ofthe phantom was also extended from a head-and-neck geom-etry to a prostate geometry by construction of an outer shellto fit over the rectangular phantom. Rectangular phantomsare useful for measuring single field or composite dose dis-tributions.
Cylindrical phantoms have a convenient geometry for co-planar composite IMRT delivery verification, while allowing
153
for multiple ionization chamber positions. A novel cylin-
1326 Low et al.: IMRT dosimetry tools 1326
drical phantom that places radiographic film in a spiral slotand an ionization chamber at the phantom center was devel-oped for tomotherapy verification.68,151 The advantage of thisphantom is that it samples the volumetric dose distributionwith a single film, although film dosimetry analysis softwarevendors have not provided software that interpolates the cal-culated dose distributions to the coordinates of the measuredfilm. Another cylindrical water-equivalent phantom is pro-vided by Tomotherapy, Inc., for the quality assurance of To-motherapy treatments.154 There are also slab phantoms thatare machined to accept commercial ionization chambers.
III.A.3. Anthropomorphic phantoms
Anthropomorphic phantoms are fabricated in the shape ofa human and, consequently, they can be more difficult or atleast more time consuming to accurately set up and alignwith respect to the linear accelerator. The preparation andaccurate placement of film can be more difficult than withgeometric phantoms. The preparation of films involves cut-ting film to match the shape of the external phantom shapeand sealing the phantom around the film with light-tight tapeif light-sensitive films are used. In spite of the added diffi-culty, anthropomorphic phantoms have been effectively usedfor limited measurements to evaluate the process of patienttreatment planning and delivery and to identify treatmentplanning or dose delivery problems that are not evident insimple homogeneous geometric phantoms.59,155–157 Thephantom setup typically parallels a human simulation andirradiation. For example, a CT simulation of the phantomshould be conducted using radiopaque and visible fiducialmarkers, and when possible, the phantom position should beindependently verified, for example using an electronic por-tal imaging device �EPID� or film at the treatment unit beforedelivery.
While anthropomorphic phantoms are good for assessingthe overall IMRT planning and delivery process, many com-mercial phantoms are composed of thick transverse slices,which limit the flexibility in film and point-dosimeter place-ment. Another problem is that causes of dose distributiondiscrepancies are difficult to isolate using an anthropomor-phic phantom. Therefore, additional measurements usinggeometric phantoms may also be required to aid in the inter-pretation of any discrepancies between measurements andcalculations.
III.B. Phantom materials
Phantoms should be made of a water-equivalent or knownelectron-density material so that the treatment planning sys-tem can accurately calculate dose to the phantom. A largenumber of such phantoms of different shapes made of water-equivalent materials are commercially available. When non-water-equivalent materials such as PMMA and polystyreneare used, validation of the dose distribution calculation algo-rithm should be conducted before clinical use.
Additional considerations are required when radiographicfilm is used. Optical and UV light will expose the film, so the
phantom must be light tight and internally opaque to preventMedical Physics, Vol. 38, No. 3, March 2011
exposure by Čerenkov radiation. Radiographic film measure-ments are typically made in homogeneous phantoms. It isbest to use a light-tight compression film phantom, althoughpaper packaged �ready-pack� film use is acceptable without alight-tight phantom as long as the packaging is carefullyvented or adjusted to prevent trapped air bubbles and the filmpackage is compressed. The use of phantoms with Pb orother high atomic number materials is notrecommended.158,159
III.C. Phantom characterization
The dimensions of a phantom should be verified prior tofirst use. IMRT treatment plan validations necessarily requirethe CT simulation of the phantom. These imaging datashould also be used to inspect the construction of the phan-tom. Particular attention should be paid to flaws in the phan-tom material such as voids. Dosimeter positions should beidentified on the CT scan study. This is especially importantfor anthropomorphic phantoms, where the dosimeter posi-tions should be localized either by visualizing the dosimetervoids or with radiopaque dummy markers put in place of thedosimeters. For all phantoms, delineation of larger dosim-eters, such as ionization chambers, is necessary to computethe volume-averaged dose. This can be done by imaging thephantom and contouring the detector volume in the treatmentplanning system as a structure of interest.
IV. DOSE DISTRIBUTION COMPARISONS ANDEVALUATIONS
This section describes published dose distribution com-parison algorithms, their use, and their limitations when ap-plied to IMRT. The measurements of complex dose distribu-tions described in this report are of little value unless theycan be quantitatively compared against calculated dose dis-tributions. The value of quantitative dose distribution com-parisons was first identified during the photon and electrontreatment planning consortia of the 1990s. They developed aseries of tools for comparing the 3D dose distributions pro-duce by treatment planning systems and the 2D measureddose distributions �typically interpolated from water phan-tom data�.160
With IMRT, the need for quantitative, efficient dose dis-tribution comparison tools is even greater. IMRT requiresaccurate multidimensional validation by quantitative com-parison between measurement and calculation.
IV.A. Dose distribution registration
Dose distribution comparisons are useful only if the twodistributions have been accurately coregistered. Treatmentplanning systems calculate dose in 3D and will often exporta planar dose distribution for comparison against measure-ment. To accurately compare calculated and measured dosedistributions, the dose distribution positions should be pre-sented in a common coordinate system.
The dose measurement phantom will have a method for
alignment with respect to the linear accelerator. That system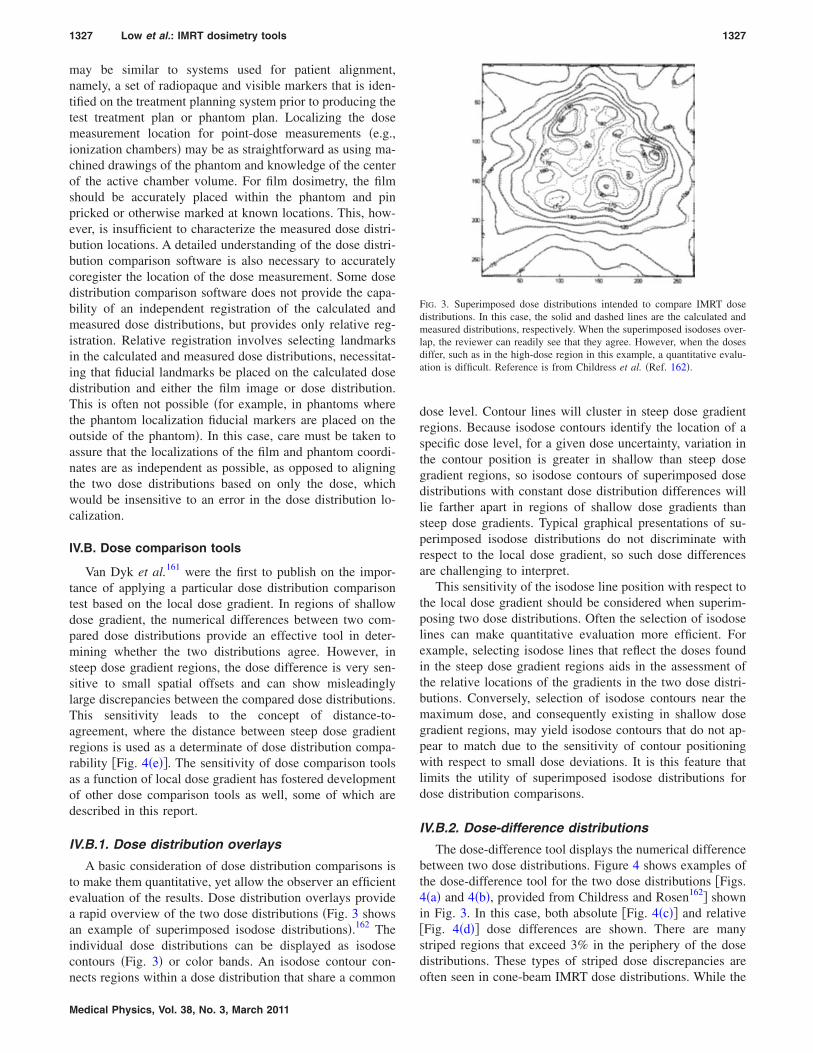
1327 Low et al.: IMRT dosimetry tools 1327
may be similar to systems used for patient alignment,namely, a set of radiopaque and visible markers that is iden-tified on the treatment planning system prior to producing thetest treatment plan or phantom plan. Localizing the dosemeasurement location for point-dose measurements �e.g.,ionization chambers� may be as straightforward as using ma-chined drawings of the phantom and knowledge of the centerof the active chamber volume. For film dosimetry, the filmshould be accurately placed within the phantom and pinpricked or otherwise marked at known locations. This, how-ever, is insufficient to characterize the measured dose distri-bution locations. A detailed understanding of the dose distri-bution comparison software is also necessary to accuratelycoregister the location of the dose measurement. Some dosedistribution comparison software does not provide the capa-bility of an independent registration of the calculated andmeasured dose distributions, but provides only relative reg-istration. Relative registration involves selecting landmarksin the calculated and measured dose distributions, necessitat-ing that fiducial landmarks be placed on the calculated dosedistribution and either the film image or dose distribution.This is often not possible �for example, in phantoms wherethe phantom localization fiducial markers are placed on theoutside of the phantom�. In this case, care must be taken toassure that the localizations of the film and phantom coordi-nates are as independent as possible, as opposed to aligningthe two dose distributions based on only the dose, whichwould be insensitive to an error in the dose distribution lo-calization.
IV.B. Dose comparison tools
Van Dyk et al.161 were the first to publish on the impor-tance of applying a particular dose distribution comparisontest based on the local dose gradient. In regions of shallowdose gradient, the numerical differences between two com-pared dose distributions provide an effective tool in deter-mining whether the two distributions agree. However, insteep dose gradient regions, the dose difference is very sen-sitive to small spatial offsets and can show misleadinglylarge discrepancies between the compared dose distributions.This sensitivity leads to the concept of distance-to-agreement, where the distance between steep dose gradientregions is used as a determinate of dose distribution compa-rability �Fig. 4�e��. The sensitivity of dose comparison toolsas a function of local dose gradient has fostered developmentof other dose comparison tools as well, some of which aredescribed in this report.
IV.B.1. Dose distribution overlays
A basic consideration of dose distribution comparisons isto make them quantitative, yet allow the observer an efficientevaluation of the results. Dose distribution overlays providea rapid overview of the two dose distributions �Fig. 3 showsan example of superimposed isodose distributions�.162 Theindividual dose distributions can be displayed as isodosecontours �Fig. 3� or color bands. An isodose contour con-
nects regions within a dose distribution that share a commonMedical Physics, Vol. 38, No. 3, March 2011
dose level. Contour lines will cluster in steep dose gradientregions. Because isodose contours identify the location of aspecific dose level, for a given dose uncertainty, variation inthe contour position is greater in shallow than steep dosegradient regions, so isodose contours of superimposed dosedistributions with constant dose distribution differences willlie farther apart in regions of shallow dose gradients thansteep dose gradients. Typical graphical presentations of su-perimposed isodose distributions do not discriminate withrespect to the local dose gradient, so such dose differencesare challenging to interpret.
This sensitivity of the isodose line position with respect tothe local dose gradient should be considered when superim-posing two dose distributions. Often the selection of isodoselines can make quantitative evaluation more efficient. Forexample, selecting isodose lines that reflect the doses foundin the steep dose gradient regions aids in the assessment ofthe relative locations of the gradients in the two dose distri-butions. Conversely, selection of isodose contours near themaximum dose, and consequently existing in shallow dosegradient regions, may yield isodose contours that do not ap-pear to match due to the sensitivity of contour positioningwith respect to small dose deviations. It is this feature thatlimits the utility of superimposed isodose distributions fordose distribution comparisons.
IV.B.2. Dose-difference distributions
The dose-difference tool displays the numerical differencebetween two dose distributions. Figure 4 shows examples ofthe dose-difference tool for the two dose distributions �Figs.4�a� and 4�b�, provided from Childress and Rosen162� shownin Fig. 3. In this case, both absolute �Fig. 4�c�� and relative�Fig. 4�d�� dose differences are shown. There are manystriped regions that exceed 3% in the periphery of the dosedistributions. These types of striped dose discrepancies areoften seen in cone-beam IMRT dose distributions. While the
FIG. 3. Superimposed dose distributions intended to compare IMRT dosedistributions. In this case, the solid and dashed lines are the calculated andmeasured distributions, respectively. When the superimposed isodoses over-lap, the reviewer can readily see that they agree. However, when the dosesdiffer, such as in the high-dose region in this example, a quantitative evalu-ation is difficult. Reference is from Childress et al. �Ref. 162�.
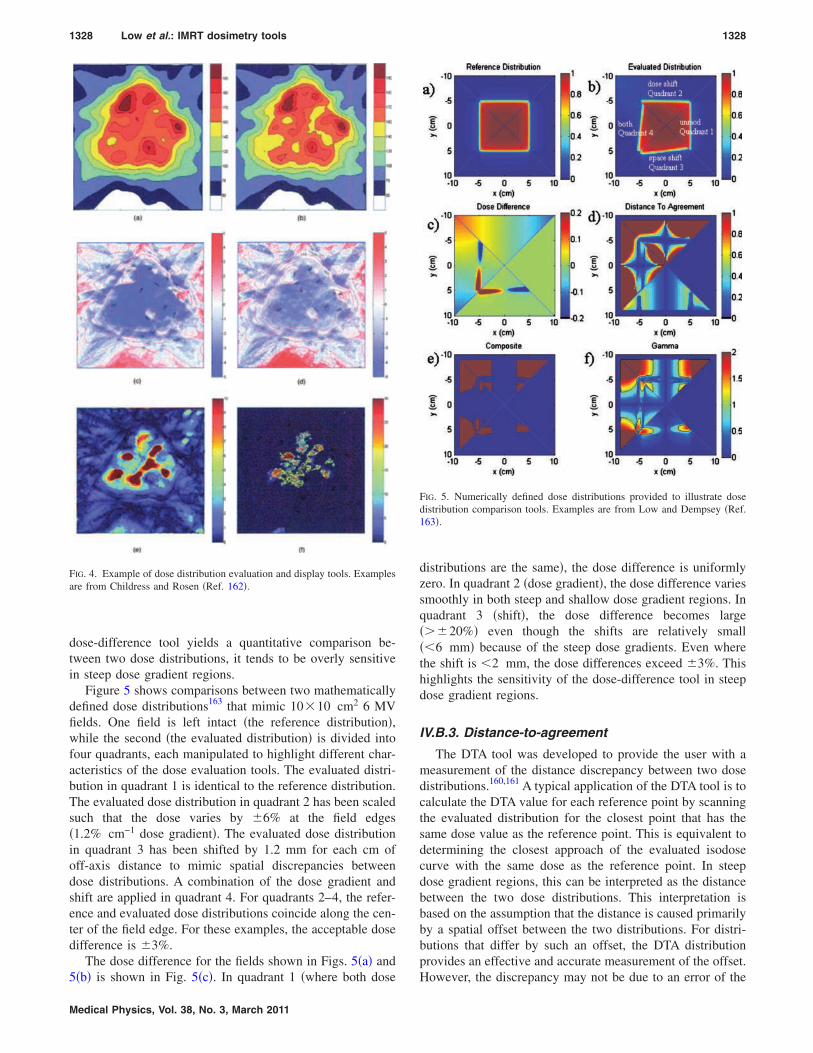
1328 Low et al.: IMRT dosimetry tools 1328
dose-difference tool yields a quantitative comparison be-tween two dose distributions, it tends to be overly sensitivein steep dose gradient regions.
Figure 5 shows comparisons between two mathematicallydefined dose distributions163 that mimic 10�10 cm2 6 MVfields. One field is left intact �the reference distribution�,while the second �the evaluated distribution� is divided intofour quadrants, each manipulated to highlight different char-acteristics of the dose evaluation tools. The evaluated distri-bution in quadrant 1 is identical to the reference distribution.The evaluated dose distribution in quadrant 2 has been scaledsuch that the dose varies by �6% at the field edges�1.2% cm−1 dose gradient�. The evaluated dose distributionin quadrant 3 has been shifted by 1.2 mm for each cm ofoff-axis distance to mimic spatial discrepancies betweendose distributions. A combination of the dose gradient andshift are applied in quadrant 4. For quadrants 2–4, the refer-ence and evaluated dose distributions coincide along the cen-ter of the field edge. For these examples, the acceptable dosedifference is �3%.
The dose difference for the fields shown in Figs. 5�a� and5�b� is shown in Fig. 5�c�. In quadrant 1 �where both dose
FIG. 4. Example of dose distribution evaluation and display tools. Examplesare from Childress and Rosen �Ref. 162�.
Medical Physics, Vol. 38, No. 3, March 2011
distributions are the same�, the dose difference is uniformlyzero. In quadrant 2 �dose gradient�, the dose difference variessmoothly in both steep and shallow dose gradient regions. Inquadrant 3 �shift�, the dose difference becomes large���20%� even though the shifts are relatively small��6 mm� because of the steep dose gradients. Even wherethe shift is �2 mm, the dose differences exceed �3%. Thishighlights the sensitivity of the dose-difference tool in steepdose gradient regions.
IV.B.3. Distance-to-agreement
The DTA tool was developed to provide the user with ameasurement of the distance discrepancy between two dosedistributions.160,161 A typical application of the DTA tool is tocalculate the DTA value for each reference point by scanningthe evaluated distribution for the closest point that has thesame dose value as the reference point. This is equivalent todetermining the closest approach of the evaluated isodosecurve with the same dose as the reference point. In steepdose gradient regions, this can be interpreted as the distancebetween the two dose distributions. This interpretation isbased on the assumption that the distance is caused primarilyby a spatial offset between the two distributions. For distri-butions that differ by such an offset, the DTA distributionprovides an effective and accurate measurement of the offset.
FIG. 5. Numerically defined dose distributions provided to illustrate dosedistribution comparison tools. Examples are from Low and Dempsey �Ref.163�.
However, the discrepancy may not be due to an error of the
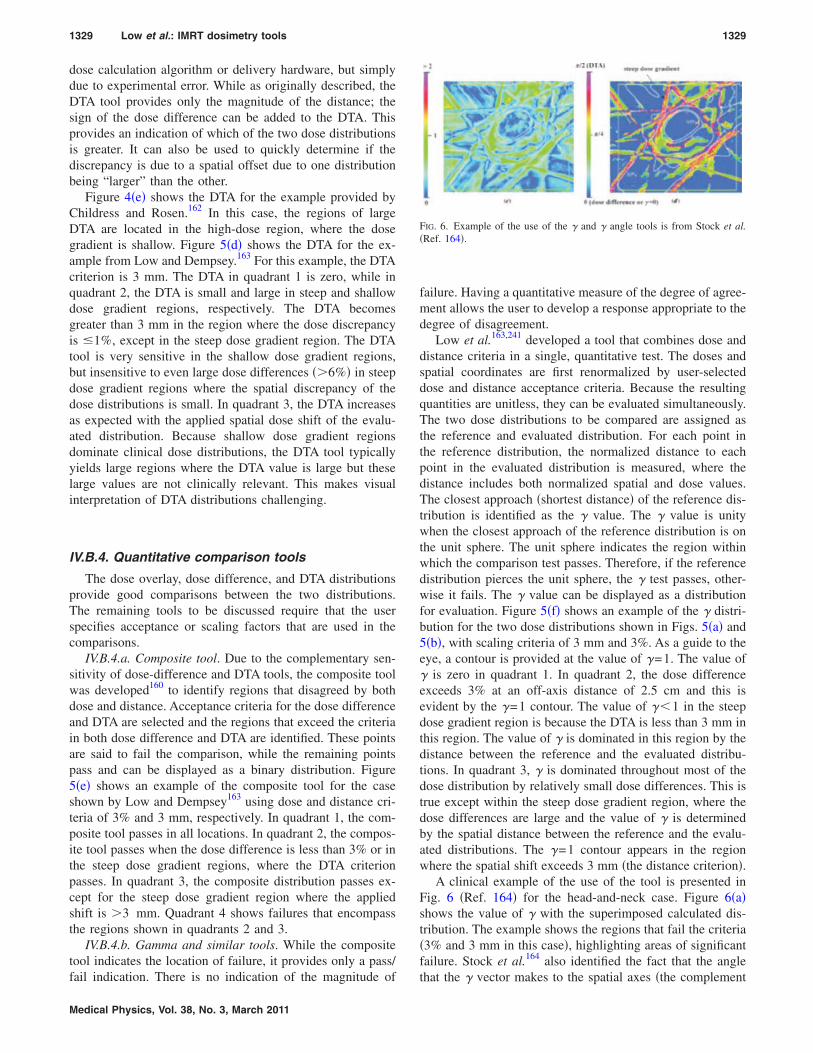
1329 Low et al.: IMRT dosimetry tools 1329
dose calculation algorithm or delivery hardware, but simplydue to experimental error. While as originally described, theDTA tool provides only the magnitude of the distance; thesign of the dose difference can be added to the DTA. Thisprovides an indication of which of the two dose distributionsis greater. It can also be used to quickly determine if thediscrepancy is due to a spatial offset due to one distributionbeing “larger” than the other.
Figure 4�e� shows the DTA for the example provided byChildress and Rosen.162 In this case, the regions of largeDTA are located in the high-dose region, where the dosegradient is shallow. Figure 5�d� shows the DTA for the ex-ample from Low and Dempsey.163 For this example, the DTAcriterion is 3 mm. The DTA in quadrant 1 is zero, while inquadrant 2, the DTA is small and large in steep and shallowdose gradient regions, respectively. The DTA becomesgreater than 3 mm in the region where the dose discrepancyis �1%, except in the steep dose gradient region. The DTAtool is very sensitive in the shallow dose gradient regions,but insensitive to even large dose differences ��6%� in steepdose gradient regions where the spatial discrepancy of thedose distributions is small. In quadrant 3, the DTA increasesas expected with the applied spatial dose shift of the evalu-ated distribution. Because shallow dose gradient regionsdominate clinical dose distributions, the DTA tool typicallyyields large regions where the DTA value is large but theselarge values are not clinically relevant. This makes visualinterpretation of DTA distributions challenging.
IV.B.4. Quantitative comparison tools
The dose overlay, dose difference, and DTA distributionsprovide good comparisons between the two distributions.The remaining tools to be discussed require that the userspecifies acceptance or scaling factors that are used in thecomparisons.
IV.B.4.a. Composite tool. Due to the complementary sen-sitivity of dose-difference and DTA tools, the composite toolwas developed160 to identify regions that disagreed by bothdose and distance. Acceptance criteria for the dose differenceand DTA are selected and the regions that exceed the criteriain both dose difference and DTA are identified. These pointsare said to fail the comparison, while the remaining pointspass and can be displayed as a binary distribution. Figure5�e� shows an example of the composite tool for the caseshown by Low and Dempsey163 using dose and distance cri-teria of 3% and 3 mm, respectively. In quadrant 1, the com-posite tool passes in all locations. In quadrant 2, the compos-ite tool passes when the dose difference is less than 3% or inthe steep dose gradient regions, where the DTA criterionpasses. In quadrant 3, the composite distribution passes ex-cept for the steep dose gradient region where the appliedshift is �3 mm. Quadrant 4 shows failures that encompassthe regions shown in quadrants 2 and 3.
IV.B.4.b. Gamma and similar tools. While the compositetool indicates the location of failure, it provides only a pass/fail indication. There is no indication of the magnitude of
Medical Physics, Vol. 38, No. 3, March 2011
failure. Having a quantitative measure of the degree of agree-ment allows the user to develop a response appropriate to thedegree of disagreement.
Low et al.163,241 developed a tool that combines dose anddistance criteria in a single, quantitative test. The doses andspatial coordinates are first renormalized by user-selecteddose and distance acceptance criteria. Because the resultingquantities are unitless, they can be evaluated simultaneously.The two dose distributions to be compared are assigned asthe reference and evaluated distribution. For each point inthe reference distribution, the normalized distance to eachpoint in the evaluated distribution is measured, where thedistance includes both normalized spatial and dose values.The closest approach �shortest distance� of the reference dis-tribution is identified as the � value. The � value is unitywhen the closest approach of the reference distribution is onthe unit sphere. The unit sphere indicates the region withinwhich the comparison test passes. Therefore, if the referencedistribution pierces the unit sphere, the � test passes, other-wise it fails. The � value can be displayed as a distributionfor evaluation. Figure 5�f� shows an example of the � distri-bution for the two dose distributions shown in Figs. 5�a� and5�b�, with scaling criteria of 3 mm and 3%. As a guide to theeye, a contour is provided at the value of �=1. The value of� is zero in quadrant 1. In quadrant 2, the dose differenceexceeds 3% at an off-axis distance of 2.5 cm and this isevident by the �=1 contour. The value of ��1 in the steepdose gradient region is because the DTA is less than 3 mm inthis region. The value of � is dominated in this region by thedistance between the reference and the evaluated distribu-tions. In quadrant 3, � is dominated throughout most of thedose distribution by relatively small dose differences. This istrue except within the steep dose gradient region, where thedose differences are large and the value of � is determinedby the spatial distance between the reference and the evalu-ated distributions. The �=1 contour appears in the regionwhere the spatial shift exceeds 3 mm �the distance criterion�.
A clinical example of the use of the tool is presented inFig. 6 �Ref. 164� for the head-and-neck case. Figure 6�a�shows the value of � with the superimposed calculated dis-tribution. The example shows the regions that fail the criteria�3% and 3 mm in this case�, highlighting areas of significantfailure. Stock et al.164 also identified the fact that the angle
FIG. 6. Example of the use of the � and � angle tools is from Stock et al.�Ref. 164�.
that the � vector makes to the spatial axes �the complement
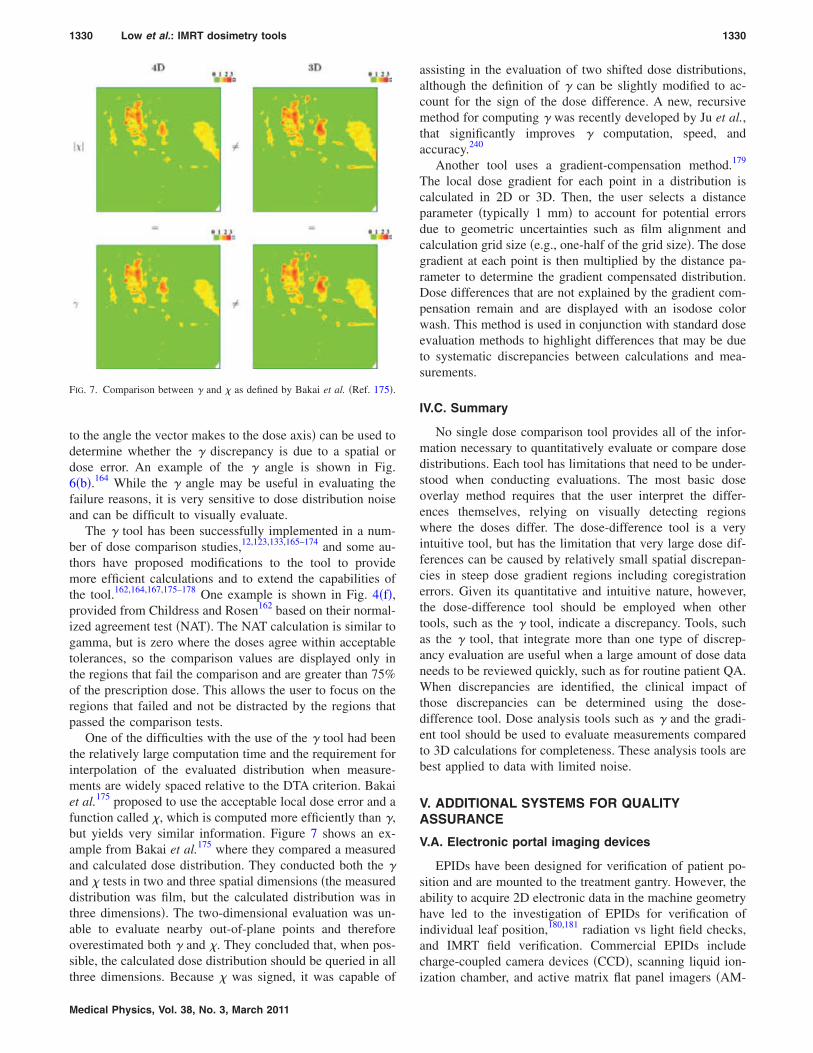
1330 Low et al.: IMRT dosimetry tools 1330
to the angle the vector makes to the dose axis� can be used todetermine whether the � discrepancy is due to a spatial ordose error. An example of the � angle is shown in Fig.6�b�.164 While the � angle may be useful in evaluating thefailure reasons, it is very sensitive to dose distribution noiseand can be difficult to visually evaluate.
The � tool has been successfully implemented in a num-ber of dose comparison studies,12,123,133,165–174 and some au-thors have proposed modifications to the tool to providemore efficient calculations and to extend the capabilities ofthe tool.162,164,167,175–178 One example is shown in Fig. 4�f�,provided from Childress and Rosen162 based on their normal-ized agreement test �NAT�. The NAT calculation is similar togamma, but is zero where the doses agree within acceptabletolerances, so the comparison values are displayed only inthe regions that fail the comparison and are greater than 75%of the prescription dose. This allows the user to focus on theregions that failed and not be distracted by the regions thatpassed the comparison tests.
One of the difficulties with the use of the � tool had beenthe relatively large computation time and the requirement forinterpolation of the evaluated distribution when measure-ments are widely spaced relative to the DTA criterion. Bakaiet al.175 proposed to use the acceptable local dose error and afunction called �, which is computed more efficiently than �,but yields very similar information. Figure 7 shows an ex-ample from Bakai et al.175 where they compared a measuredand calculated dose distribution. They conducted both the �and � tests in two and three spatial dimensions �the measureddistribution was film, but the calculated distribution was inthree dimensions�. The two-dimensional evaluation was un-able to evaluate nearby out-of-plane points and thereforeoverestimated both � and �. They concluded that, when pos-sible, the calculated dose distribution should be queried in allthree dimensions. Because � was signed, it was capable of
FIG. 7. Comparison between � and � as defined by Bakai et al. �Ref. 175�.
Medical Physics, Vol. 38, No. 3, March 2011
assisting in the evaluation of two shifted dose distributions,although the definition of � can be slightly modified to ac-count for the sign of the dose difference. A new, recursivemethod for computing � was recently developed by Ju et al.,that significantly improves � computation, speed, andaccuracy.240
Another tool uses a gradient-compensation method.179
The local dose gradient for each point in a distribution iscalculated in 2D or 3D. Then, the user selects a distanceparameter �typically 1 mm� to account for potential errorsdue to geometric uncertainties such as film alignment andcalculation grid size �e.g., one-half of the grid size�. The dosegradient at each point is then multiplied by the distance pa-rameter to determine the gradient compensated distribution.Dose differences that are not explained by the gradient com-pensation remain and are displayed with an isodose colorwash. This method is used in conjunction with standard doseevaluation methods to highlight differences that may be dueto systematic discrepancies between calculations and mea-surements.
IV.C. Summary
No single dose comparison tool provides all of the infor-mation necessary to quantitatively evaluate or compare dosedistributions. Each tool has limitations that need to be under-stood when conducting evaluations. The most basic doseoverlay method requires that the user interpret the differ-ences themselves, relying on visually detecting regionswhere the doses differ. The dose-difference tool is a veryintuitive tool, but has the limitation that very large dose dif-ferences can be caused by relatively small spatial discrepan-cies in steep dose gradient regions including coregistrationerrors. Given its quantitative and intuitive nature, however,the dose-difference tool should be employed when othertools, such as the � tool, indicate a discrepancy. Tools, suchas the � tool, that integrate more than one type of discrep-ancy evaluation are useful when a large amount of dose dataneeds to be reviewed quickly, such as for routine patient QA.When discrepancies are identified, the clinical impact ofthose discrepancies can be determined using the dose-difference tool. Dose analysis tools such as � and the gradi-ent tool should be used to evaluate measurements comparedto 3D calculations for completeness. These analysis tools arebest applied to data with limited noise.
V. ADDITIONAL SYSTEMS FOR QUALITYASSURANCE
V.A. Electronic portal imaging devices
EPIDs have been designed for verification of patient po-sition and are mounted to the treatment gantry. However, theability to acquire 2D electronic data in the machine geometryhave led to the investigation of EPIDs for verification ofindividual leaf position,180,181 radiation vs light field checks,and IMRT field verification. Commercial EPIDs includecharge-coupled camera devices �CCD�, scanning liquid ion-
ization chamber, and active matrix flat panel imagers �AM-
1331 Low et al.: IMRT dosimetry tools 1331
FPIs�. Recent investigations have focused primarily on ap-plications with AMFPIs. van Elmpt et al.182 reviewed thedifferent approaches for using EPIDs for radiation therapydosimetry applications. The primary investigations havebeen for EPID systems incorporating a scintillator where in-direct detectors are used.183–186 Corrections are made to asystem that has been optimized for imaging. Additional in-vestigations have been conducted for prototype and systemsmodified from a commercial configuration where there is noscintillator above the detector and measurements are made ina direct detection mode.187–190
V.A.1. Application to IMRT
EPIDs offer the potential to save time when compared tofilm dosimetry. They offer a finer spatial resolution than ar-ray devices. However, the application of EPIDs to IMRT islimited to measurements of individual fields and EPIDs can-not be placed in a solid water stack. For all of the EPIDsystems, a number of corrections must be applied to convertthe resulting signal into fluence or dose in the detector.
EPIDs have been used for pretreatment and transit dosim-etry applications. In the pretreatment configuration, the ex-pected response of the EPID is typically determined at theplane of the detector as a portal dose image.183–186 The re-sponse of the EPID is then converted to dose and comparedto the predicted dose image. Quantitative dosimetric mea-surements for IMRT fields have also been made with systemsusing a direct detection mode.187,190 For clinical dosimetryapplications, the system needs to be validated against refer-ence dosimeters of appropriate accuracy and resolution. Theother application of EPIDs is for transit dosimetry wheremeasurements are made during a patient’s treatment andused to evaluate the accuracy of the delivery considering thepatient’s geometry.191–193 The use of EPIDs for transit dosim-etry continues to be an important research topic with thepotential for providing important real-time information aboutthe accuracy of the delivery of IMRT treatments.
V.A.2. Recommendations for use
Once an IMRT program has been started with ion cham-ber and film measurements, it may be appropriate to use anEPID for individual IMRT field verification measurements ifa reliable method of operation has been developed. TheEPID response must be characterized for a range of situa-tions �e.g., dose, dose rate, field size, and leaf speed�. Oncethe system is characterized, a number of corrections must bemade to the system depending on the type of system and thecomposition of the detector. The presence of a fluorescentscreen leads to an over-response of the detectors to lowdoses. To calculate a portal dose prediction or portal doseimage for AMFPI systems, pencil beam,185 convolution,183 orMonte Carlo194 techniques have been used to approximate ormodel the interactions in the EPID including the effect of thefluorescent layer.
Some centers are utilizing commercial systems for IMRTdosimetry. When establishing a QA program with an EPID,
the sensitivity of the system and the appropriate action levelsMedical Physics, Vol. 38, No. 3, March 2011
and criteria for evaluation must be set.195 Further develop-ment of EPIDs for individual IMRT field verification and forpatient transit dosimetry is expected to continue.191–193,196–200
Exciting developments include reconstruction of three-dimensional dose distributions.201
V.B. Three-dimensional detectors
Truly comprehensive dosimetric verification of IMRT re-quires a dosimetry system with full capability in 3D. Tradi-tional 2D verification techniques �e.g., film�, and the morerecent 2D array detectors discussed above, present at best apartial sampling of the whole distribution. Partial samplingmay be adequate as a routine check for an IMRT programthat has extensive prior validation. In the general case, how-ever, and in particular for the commissioning of a new IMRTtechnique, an extensive 3D dosimetry technique is highlydesirable. The criticality of this issue is exemplified by arecent report from the Radiological Physics Center �RPC�,202
which revealed that between 2001–2009, more than 350 in-stitutions failed to pass the head-and-neck IMRT credential-ing phantom test on the first attempt, despite generous crite-ria �7% dose difference and 4 mm distance-to-agreement�.The RPC criteria were applied to TLD measurements at sixpoints inside the simulated planning-target-volume �PTV�and GAFCHROMIC® film measurement in a single axialplane through PTV and organ-at-risk. The question arises—what percentage of institutions would have failed if a morecomprehensive 3D measurement had been feasible ratherthan measurements restricted to the central film plane andTLD points? This question can only be adequately answeredif the measurement is a comprehensive verification in 3D andpresents a compelling argument for the need for a clinical 3Ddosimetry system. A relatively new technology with the ca-pacity to address this need and provide high-resolution, ac-curate 3D dosimetry has emerged under the initial name of“gel-dosimetry.” In this report, we will use the term “3Ddosimetry” to reflect the fact that some new 3D dosimetersare no longer gel-based.
A goal of 3D dosimetry has been formulated in theresolution-time-accuracy-precision �RTAP� criteria.203 TheRTAP ideal functionality incorporates a spatial resolution of1 mm3, short read-out time of �1 h, accuracy within 3% oftrue value, and a noise level within 1%. Several dosimetrysystems are approaching this goal, and the field of 3D do-simetry continues to accelerate in innovation and promise.Recently, new 3D dosimetry materials have been proposedwith striking performance characteristics.204,205 The threeprincipal categories of 3D dosimeters are polyacrylamide�PAG� gels,206 Fricke gels,204 and radiochromic plastics,205
and the two main methods of dose-readout are magneticresonance �MR� imaging207,208 and optical-computed-tomography �optical-CT�.203,204,209 Other readout techniquesare under evaluation, including x-ray-CT and ultrasound, butare not discussed further here as they are more preliminary.
V.B.1. Polymerizing gels
The original PAG gel206 consisted of bis �3%�, acrylamide
�3%�, nitrogen, and gelatin �5%� by weight. Newer formula-
1332 Low et al.: IMRT dosimetry tools 1332
tions are more radiation sensitive210 and can be made underconditions of normal oxygenation.210 PAGs utilize themechanism of radiation-induced polymerization of mono-mers, where small monomer molecules join together underthe influence of ionizing radiation.211 The resultant polymermicroparticles are fixed in the gelatin lattice, yielding astable impression of the dose. Below saturation, regions ofthe gel exposed to ionizing radiation exhibit polymerizationin proportion to the dose, and the polymerization affects boththe MR relaxivity of water protons and also the optical scat-tering power of the gel. High resolution 3D maps of dosehave been achieved both by MR scanning and optical-CTscanning �Sec. V B 3�. Initial applications to IMRT verifica-tion have been promising.64,210,212–217
V.B.2. Fricke and radiochromic gels and plastics
The first gel dosimeter arose from the work ofGore et al.,218 who proposed that the well established liquidFricke dosimeter219,220 could be gelated and probed bynuclear magnetic resonance imaging �MRI� rather than theconventional spectrophotometry. The addition of a stabiliz-ing gelatin matrix to the aqueous Fricke solution created thefirst gel dosimeter, where 3D MRI images of the T1 relax-ation parameter showed the relaxation rate 1 /T1 proportionalto the absorbed dose. A limitation of gelatin Fricke dosim-eters is that the radiation-induced ferric ions diffuse throughthe gel matrix, leading to degradation and eventual loss ofthe recorded dose distribution with time.221,222 The practicalimplication is that Fricke gel dosimeters must be scannedwithin 2 h postirradiation, presenting logistical difficulties ina clinical setting. Most Fricke gel dosimetry has utilized MRas the readout method; however, Kelly et al.204 introducedxylenol-orange dye to create a Fricke gel compatible withoptical-CT imaging. Recently, a promising new radiochromicmaterial, PRESAGE,223 has been introduced and detailedstudies of the basic dosimetric properties have confirmed itspromise for 3D dosimetry.224 Principal advantages includerelative insensitivity of dose response to atmospheric expo-sure and to the nature of radiochromic optical contrast that islight absorbing rather than light-scattering �peak OD changeis at �633 nm�. The absorptive nature of the contrast ismore amenable to accurate dose read-out by optical-computed-tomography optical-CT.225–227
V.B.3. Readout techniques
To date, most gel dosimetry has utilized MR scanning,which can yield excellent results, provided sufficient care istaken to characterize the MR scanner and implement appro-priate sequence protocols.64,207,228–230 In particular, attentionis required to minimize uncertainties that originate from thetechnical challenges of controlling magnetic field uniformityand gradients with sufficient precision, avoiding MRI se-quences that cause excessive temperature increase associatedwith RF energy deposited in the gel during MR imaging.228
For MR measurements requiring high accuracy and high-spatial resolution, long imaging times �several hours� may be
required to achieve the low uncertainty and high spatial res-Medical Physics, Vol. 38, No. 3, March 2011
olution associated with standard dosimeters. An alternativereadout technique, optical-CT,166,203,204,209,227,231–235 has beenproposed for imaging PAG gels; an approach analogous tofirst-generation x-ray CT. In optical-CT the x-ray source isreplaced by a visible laser and the x-ray detector replacedwith a light-sensitive photodiode. Resonstructed images ofoptical attenuation coefficients are proportional to dose andcan be converted to dose maps using a calibration curve. Thehigh proportion of scatter in PAGs restricts optical-CT toslow first-generation scanning-laser configurations. Muchfaster broad-beam and cone-beam configurations have beendeveloped for radiochronic gels and plastics, where the scat-ter component is much less.232,237 For these approaches cor-rections may be necessary for spectral warping238 and re-sidual scatter.232,239
V.B.4. Recommendations for use
The 3D dosimetry techniques described here are still inthe developmental stage and should be embarked upon withthat understanding in mind. Commercial support for thesetechniques, while expanding, is still limited. At present, theonly commercially available system is the BANG gel systemfrom MGS Research. This polymer-gel/optical-CT readoutsystem has been shown to be effective166,217,236 and is avail-able as a remote dosimetry service by the gel manufacturer.Detailed specifications on the accuracy of system perfor-mance of the remote system are not available at present.There are other dosimetry materials and readout techniquesthat can be employed. Each has strengths, but also areaswhere care must be taken to get adequate results. If MRscanning is to be used, the performance and sequences of theMR scanning system should be investigated first. Similarly,the performance characteristics of optical-CT systems needto be thoroughly evaluated prior to use. For all present 3Dmaterials, it is important that the dose calibration curve isgenerated from the same batch and undergoes the same ther-mal and temporal histories as the experimental dosimeter.
VI. SUMMARY
This report provides information to the physicist regard-ing the proper applications of different dosimeters, phan-toms, and analysis techniques for IMRT dose distributions.The detectors and phantoms used in commissioning an IMRTprogram are frequently not the same systems used for pre-treatment quality assurance applications. This report alsoprovides guidance on the potential pitfalls by highlightingareas where certain systems are inappropriate for use. Whenestablishing a new IMRT program, this information shouldbe used in conjunction with other guidance documents onIMRT.
a�Present address: UCLA, Los Angeles, CA 90024. Electronic mail:[email protected]
1B. Fraass, K. Doppke, M. Hunt, G. Kutcher, G. Starkschall, R. Stern, andJ. Van Dyke, “American Association of Physicists in Medicine RadiationTherapy Committee Task Group 53: Quality assurance for clinical radio-therapy treatment planning,” Med. Phys. 25, 1773–1829 �1998�.
2F. M. Khan, The Physics of Radiation Therapy, 3rd ed. �Lippincott Wil-
liams & Wilkins, Philadelphia, 2003�.
1333 Low et al.: IMRT dosimetry tools 1333
3G. J. Kutcher et al., “Comprehensive QA for radiation oncology: Reportof AAPM Radiation Therapy Committee Task Group 40,” Med. Phys. 21,581–618 �1994�.
4J. Zhu, F. F. Yin, and J. H. Kim, “Point dose verification for intensitymodulated radiosurgery using Clarkson’s method,” Med. Phys. 30, 2218–2221 �2003�.
5A. Boyer, L. Xing, C. M. Ma, B. Curran, R. Hill, A. Kania, and A. Bleier,“Theoretical considerations of monitor unit calculations for intensitymodulated beam treatment planning,” Med. Phys. 26, 187–195 �1999�.
6Z. Chen, L. Xing, and R. Nath, “Independent monitor unit calculation forintensity modulated radiotherapy using the MIMiC multileaf collimator,”Med. Phys. 29, 2041–2051 �2002�.
7J. H. Kung, G. T. Chen, and F. K. Kuchnir, “A monitor unit verificationcalculation in intensity modulated radiotherapy as a dosimetry qualityassurance,” Med. Phys. 27, 2226–2230 �2000�.
8J. S. Tsai, M. J. Engler, and J. Liu, “Quasi-independent monitor unitcalculation for intensity modulated sequential tomotherapy,” J. Appl.Clin. Med. Phys. 3, 135–153 �2002�.
9L. Xing, Y. Chen, G. Luxton, J. G. Li, and A. L. Boyer, “Monitor unitcalculation for an intensity modulated photon field by a simple scatter-summation algorithm,” Phys. Med. Biol. 45, N1–N7 �2000�.
10X. Chen, N. J. Yue, W. Chen, C. B. Saw, D. E. Heron, D. Stefanik, R.Antemann, and M. S. Huq, “A dose verification method using a monitorunit matrix for dynamic IMRT on Varian linear accelerators,” Phys. Med.Biol. 50, 5641–5652 �2005�.
11J. M. Galvin, G. Ezzell, A. Eisbrauch, C. Yu, B. Butler, Y. Xiao, I. Rosen,J. Rosenman, M. Sharpe, L. Xing, P. Xia, T. Lomax, D. A. Low, and J.Palta, “Implementing IMRT in clinical practice: A joint document of theAmerican Society for Therapeutic Radiology and Oncology and theAmerican Association of Physicists in Medicine,” Int. J. Radiat. Oncol.,Biol., Phys. 58, 1616–1634 �2004�.
12Y. Yang, L. Xing, J. G. Li, J. Palta, Y. Chen, G. Luxton, and A. Boyer,“Independent dosimetric calculation with inclusion of head scatter andMLC transmission for IMRT,” Med. Phys. 30, 2937–2947 �2003�.
13G. A. Ezzell, J. M. Galvin, D. Low, J. R. Palta, I. Rosen, M. B. Sharpe, P.Xia, Y. Xiao, L. Xing, and C. X. Yu, “Guidance document on delivery,treatment planning, and clinical implementation of IMRT: Report of theIMRT Subcommittee of the AAPM Radiation Therapy Committee,” Med.Phys. 30, 2089–2115 �2003�.
14L. Dong, J. Antolak, M. Salehpour, K. Forster, L. O’Neill, R. Kendall,and I. Rosen, “Patient-specific point dose measurement for IMRT monitorunit verification,” Int. J. Radiat. Oncol., Biol., Phys. 56, 867–877 �2003�.
15D. A. Low, “Quality assurance of intensity-modulated radiotherapy,”Semin. Radiat. Oncol. 12, 219–228 �2002�.
16I. J. Das, C. W. Cheng, R. J. Watts, A. Ahnesjo, J. Gibbons, X. A. Li, J.Lowenstein, R. K. Mitra, W. E. Simon, and T. C. Zhu, “Accelerator beamdata commissioning equipment and procedures: Report of the TG-106 ofthe Therapy Physics Committee of the AAPM,” Med. Phys. 35, 4186–4215 �2008�.
17G. A. Ezzell, J. W. Burmeister, N. Dogan, T. J. LoSasso, J. G. Mechala-kos, D. Mihailidis, A. Molineu, J. R. Palta, C. R. Ramsey, B. J. Salter, J.Shi, P. Xia, N. J. Yue, and Y. Xiao, “IMRT commissioning: Multipleinstitution planning and dosimetry comparisons, a report from AAPMTask Group 119,” Med. Phys. 36, 5359–5373 �2009�.
18E. E. Klein, J. Hanley, J. Bayouth, F. F. Yin, W. Simon, S. Dresser, C.Serago, F. Aguirre, L. Ma, B. Arjomandy, C. Liu, C. Sandin, and T.Holmes, “Task Group 142 report: Quality assurance of medical accelera-tors,” Med. Phys. 36, 4197–4212 �2009�.
19D. A. Low, S. Mutic, J. F. Dempsey, R. L. Gerber, W. R. Bosch, C. A.Perez, and J. A. Purdy, “Quantitative dosimetric verification of an IMRTplanning and delivery system,” Radiother. Oncol. 49, 305–316 �1998�.
20C. Martens, C. De Wagter, and W. De Neve, “The value of the PinPointion chamber for characterization of small field segments used in intensity-modulated radiotherapy,” Phys. Med. Biol. 45, 2519–2530 �2000�.
21M. Bucciolini, F. B. Buonamici, S. Mazzocchi, C. De Angelis, S. Onori,and G. A. Cirrone, “Diamond detector versus silicon diode and ion cham-ber in photon beams of different energy and field size,” Med. Phys. 30,2149–2154 �2003�.
22W. U. Laub and T. Wong, “The volume effect of detectors in the dosim-etry of small fields used in IMRT,” Med. Phys. 30, 341–347 �2003�.
23L. B. Leybovich, A. Sethi, and N. Dogan, “Comparison of ionizationchambers of various volumes for IMRT absolute dose verification,” Med.
Phys. 30, 119–123 �2003�.Medical Physics, Vol. 38, No. 3, March 2011
24D. A. Low, P. Parikh, J. F. Dempsey, S. Wahab, and S. Huq, “Ionizationchamber volume averaging effects in dynamic intensity modulated radia-tion therapy beams,” Med. Phys. 30, 1706–1711 �2003�.
25H. Bouchard and J. Seuntjens, “Ionization chamber-based reference do-simetry of intensity modulated radiation beams,” Med. Phys. 31, 2454–2465 �2004�.
26R. Capote, F. Sanchez-Doblado, A. Leal, J. I. Lagares, R. Arrans, and G.H. Hartmann, “An EGSnrc Monte Carlo study of the microionizationchamber for reference dosimetry of narrow irregular IMRT beamlets,”Med. Phys. 31, 2416–2422 �2004�.
27K. A. Paskalev, J. P. Seuntjens, H. J. Patrocinio, and E. B. Podgorsak,“Physical aspects of dynamic stereotactic radiosurgery with very smallphoton beams �1.5 and 3 mm in diameter�,” Med. Phys. 30, 111–118�2003�.
28F. Sánchez-Doblado, P. Andreo, R. Capote, A. Leal, M. Perucha, R. Ar-ráns, L. Núñez, E. Mainegra, J. I. Lagares, and E. Carrasco, “Ionizationchamber dosimetry of small photon fields: A Monte Carlo study onstopping-power ratios for radiosurgery and IMRT beams,” Phys. Med.Biol. 48, 2081–2099 �2003�.
29F. Sánchez-Doblado, R. Capote, A. Leal, J. V. Roselló, J. I. Lagares, R.Arráns, and G. H. Hartmann, “Microionization chamber for referencedosimetry in IMRT verification: Clinical implications on OAR dosimetricerrors,” Phys. Med. Biol. 50, 959–970 �2005�.
30F. Sánchez-Doblado, R. Capote, J. V. Roselló, A. Leal, J. I. Lagares, R.Arráns, and G. H. Hartmann, “Micro ionization chamber dosimetry inIMRT verification: Clinical implications of dosimetric errors in the PTV,”Radiother. Oncol. 75, 342–348 �2005�.
31L. J. Humphries and J. A. Purdy, in Advances in Radiation OncologyPhysics Dosimetry, Treatment Planning, and Brachytherapy, AAPMMonograph Vol. 19, edited by J. A. Purdy �AAPM, 1992�.
32M. Westermark, J. Arndt, B. Nilsson, and A. Brahme, “Comparative do-simetry in narrow high-energy photon beams,” Phys. Med. Biol. 45, 685–702 �2000�.
33P. D. Higgins, P. Alaei, B. J. Gerbi, and K. E. Dusenbery, “In vivo diodedosimetry for routine quality assurance in IMRT,” Med. Phys. 30, 3118–3123 �2003�.
34I. Griessbach, M. Lapp, J. Bohsung, G. Gademann, and D. Harder, “Do-simetric characteristics of a new unshielded silicon diode and its applica-tion in clinical photon and electron beams,” Med. Phys. 32, 3750–3754�2005�.
35C. McKerracher and D. I. Thwaites, “Assessment of new small-field de-tectors against standard-field detectors for practical stereotactic beam dataacquisition,” Phys. Med. Biol. 44, 2143–2160 �1999�.
36C. Li, L. S. Lamel, and D. Tom, “A patient dose verification programusing diode detectors,” Med. Dosim. 20, 209–214 �1995�.
37T. Wolff, S. Carter, K. A. Langmack, N. I. Twyman, and P. P. Dendy,“Characterization and use of a commercial n-type diode system,” Br. J.Radiol. 71, 1168–1177 �1998�.
38X. R. Zhu, “Entrance dose measurements for in-vivo diode dosimetry:Comparison of correction factors for two types of commercial silicondiode detectors,” J. Appl. Clin. Med. Phys. 1, 100–107 �2000�.
39G. Rikner and E. Grusell, “General specifications for silicon semiconduc-tors for use in radiation dosimetry,” Phys. Med. Biol. 32, 1109–1117�1987�.
40B. Nilsson, B. I. Ruden, and B. Sorcini, “Characteristics of silicon diodesas patient dosimeters in external radiation therapy,” Radiother. Oncol. 11,279–288 �1988�.
41S. N. Rustgi, “Evaluation of the dosimetric characteristics of a diamonddetector for photon beam measurements,” Med. Phys. 22, 567–570�1995�.
42S. N. Rustgi and D. M. Frye, “Dosimetric characterization of radiosurgi-cal beams with a diamond detector,” Med. Phys. 22, 2117–2121 �1995�.
43C. De Angelis, S. Onori, M. Pacilio, G. A. Cirrone, G. Cuttone, L. Raf-faele, M. Bucciolini, and S. Mazzocchi, “An investigation of the operat-ing characteristics of two PTW diamond detectors in photon and electronbeams,” Med. Phys. 29, 248–254 �2002�.
44M. Benabdesselam, B. Serrano, P. Iacconi, F. Wrobel, D. Lapraz, J. Her-ault, and J. E. Butler, “Thermoluminescence properties of CVD diamondfor clinical dosimetry use,” Radiat. Prot. Dosim. 120, 87–90 �2006�.
45C. De Angelis, M. Bucciolini, M. Casati, I. Lovik, M. Bruzzi, S. Lago-marsino, S. Sciortino, and S. Onori, “Improvements in CVD diamondproperties for radiotherapy dosimetry,” Radiat. Prot. Dosim. 120, 38–42
�2006�.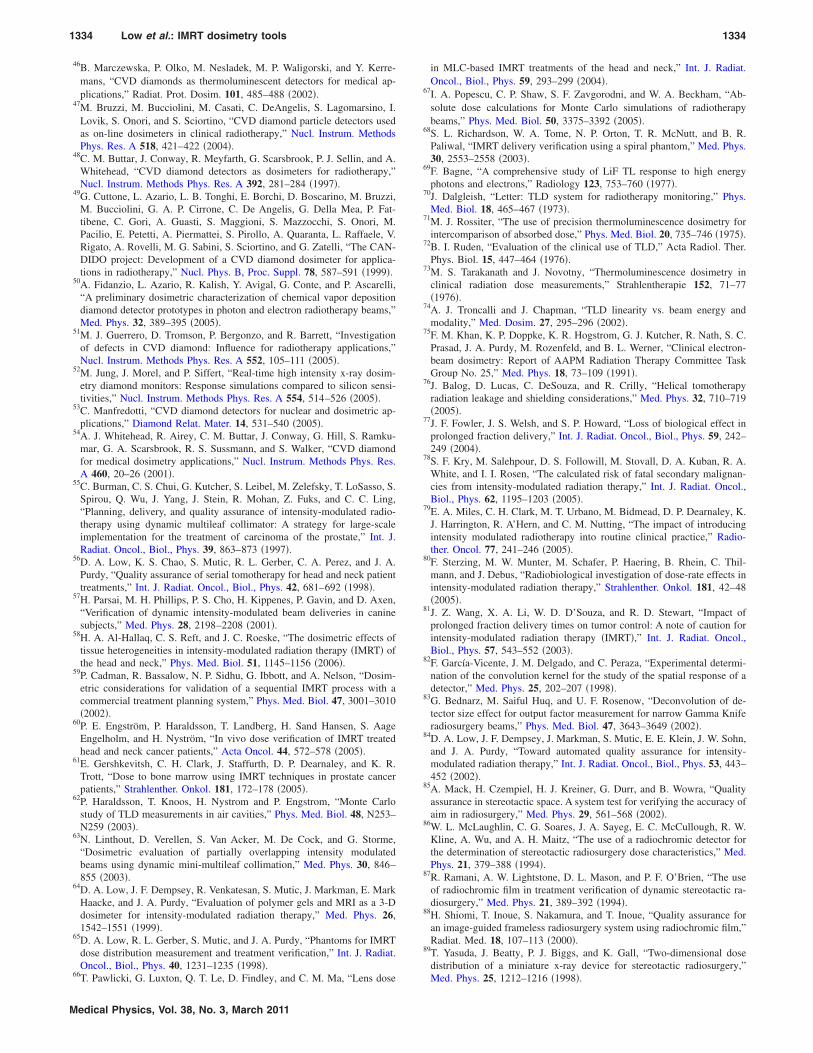
1334 Low et al.: IMRT dosimetry tools 1334
46B. Marczewska, P. Olko, M. Nesladek, M. P. Waligorski, and Y. Kerre-mans, “CVD diamonds as thermoluminescent detectors for medical ap-plications,” Radiat. Prot. Dosim. 101, 485–488 �2002�.
47M. Bruzzi, M. Bucciolini, M. Casati, C. DeAngelis, S. Lagomarsino, I.Lovik, S. Onori, and S. Sciortino, “CVD diamond particle detectors usedas on-line dosimeters in clinical radiotherapy,” Nucl. Instrum. MethodsPhys. Res. A 518, 421–422 �2004�.
48C. M. Buttar, J. Conway, R. Meyfarth, G. Scarsbrook, P. J. Sellin, and A.Whitehead, “CVD diamond detectors as dosimeters for radiotherapy,”Nucl. Instrum. Methods Phys. Res. A 392, 281–284 �1997�.
49G. Cuttone, L. Azario, L. B. Tonghi, E. Borchi, D. Boscarino, M. Bruzzi,M. Bucciolini, G. A. P. Cirrone, C. De Angelis, G. Della Mea, P. Fat-tibene, C. Gori, A. Guasti, S. Maggioni, S. Mazzocchi, S. Onori, M.Pacilio, E. Petetti, A. Piermattei, S. Pirollo, A. Quaranta, L. Raffaele, V.Rigato, A. Rovelli, M. G. Sabini, S. Sciortino, and G. Zatelli, “The CAN-DIDO project: Development of a CVD diamond dosimeter for applica-tions in radiotherapy,” Nucl. Phys. B, Proc. Suppl. 78, 587–591 �1999�.
50A. Fidanzio, L. Azario, R. Kalish, Y. Avigal, G. Conte, and P. Ascarelli,“A preliminary dosimetric characterization of chemical vapor depositiondiamond detector prototypes in photon and electron radiotherapy beams,”Med. Phys. 32, 389–395 �2005�.
51M. J. Guerrero, D. Tromson, P. Bergonzo, and R. Barrett, “Investigationof defects in CVD diamond: Influence for radiotherapy applications,”Nucl. Instrum. Methods Phys. Res. A 552, 105–111 �2005�.
52M. Jung, J. Morel, and P. Siffert, “Real-time high intensity x-ray dosim-etry diamond monitors: Response simulations compared to silicon sensi-tivities,” Nucl. Instrum. Methods Phys. Res. A 554, 514–526 �2005�.
53C. Manfredotti, “CVD diamond detectors for nuclear and dosimetric ap-plications,” Diamond Relat. Mater. 14, 531–540 �2005�.
54A. J. Whitehead, R. Airey, C. M. Buttar, J. Conway, G. Hill, S. Ramku-mar, G. A. Scarsbrook, R. S. Sussmann, and S. Walker, “CVD diamondfor medical dosimetry applications,” Nucl. Instrum. Methods Phys. Res.A 460, 20–26 �2001�.
55C. Burman, C. S. Chui, G. Kutcher, S. Leibel, M. Zelefsky, T. LoSasso, S.Spirou, Q. Wu, J. Yang, J. Stein, R. Mohan, Z. Fuks, and C. C. Ling,“Planning, delivery, and quality assurance of intensity-modulated radio-therapy using dynamic multileaf collimator: A strategy for large-scaleimplementation for the treatment of carcinoma of the prostate,” Int. J.Radiat. Oncol., Biol., Phys. 39, 863–873 �1997�.
56D. A. Low, K. S. Chao, S. Mutic, R. L. Gerber, C. A. Perez, and J. A.Purdy, “Quality assurance of serial tomotherapy for head and neck patienttreatments,” Int. J. Radiat. Oncol., Biol., Phys. 42, 681–692 �1998�.
57H. Parsai, M. H. Phillips, P. S. Cho, H. Kippenes, P. Gavin, and D. Axen,“Verification of dynamic intensity-modulated beam deliveries in caninesubjects,” Med. Phys. 28, 2198–2208 �2001�.
58H. A. Al-Hallaq, C. S. Reft, and J. C. Roeske, “The dosimetric effects oftissue heterogeneities in intensity-modulated radiation therapy �IMRT� ofthe head and neck,” Phys. Med. Biol. 51, 1145–1156 �2006�.
59P. Cadman, R. Bassalow, N. P. Sidhu, G. Ibbott, and A. Nelson, “Dosim-etric considerations for validation of a sequential IMRT process with acommercial treatment planning system,” Phys. Med. Biol. 47, 3001–3010�2002�.
60P. E. Engström, P. Haraldsson, T. Landberg, H. Sand Hansen, S. AageEngelholm, and H. Nyström, “In vivo dose verification of IMRT treatedhead and neck cancer patients,” Acta Oncol. 44, 572–578 �2005�.
61E. Gershkevitsh, C. H. Clark, J. Staffurth, D. P. Dearnaley, and K. R.Trott, “Dose to bone marrow using IMRT techniques in prostate cancerpatients,” Strahlenther. Onkol. 181, 172–178 �2005�.
62P. Haraldsson, T. Knoos, H. Nystrom and P. Engstrom, “Monte Carlostudy of TLD measurements in air cavities,” Phys. Med. Biol. 48, N253–N259 �2003�.
63N. Linthout, D. Verellen, S. Van Acker, M. De Cock, and G. Storme,“Dosimetric evaluation of partially overlapping intensity modulatedbeams using dynamic mini-multileaf collimation,” Med. Phys. 30, 846–855 �2003�.
64D. A. Low, J. F. Dempsey, R. Venkatesan, S. Mutic, J. Markman, E. MarkHaacke, and J. A. Purdy, “Evaluation of polymer gels and MRI as a 3-Ddosimeter for intensity-modulated radiation therapy,” Med. Phys. 26,1542–1551 �1999�.
65D. A. Low, R. L. Gerber, S. Mutic, and J. A. Purdy, “Phantoms for IMRTdose distribution measurement and treatment verification,” Int. J. Radiat.Oncol., Biol., Phys. 40, 1231–1235 �1998�.
66
T. Pawlicki, G. Luxton, Q. T. Le, D. Findley, and C. M. Ma, “Lens doseMedical Physics, Vol. 38, No. 3, March 2011
in MLC-based IMRT treatments of the head and neck,” Int. J. Radiat.Oncol., Biol., Phys. 59, 293–299 �2004�.
67I. A. Popescu, C. P. Shaw, S. F. Zavgorodni, and W. A. Beckham, “Ab-solute dose calculations for Monte Carlo simulations of radiotherapybeams,” Phys. Med. Biol. 50, 3375–3392 �2005�.
68S. L. Richardson, W. A. Tome, N. P. Orton, T. R. McNutt, and B. R.Paliwal, “IMRT delivery verification using a spiral phantom,” Med. Phys.30, 2553–2558 �2003�.
69F. Bagne, “A comprehensive study of LiF TL response to high energyphotons and electrons,” Radiology 123, 753–760 �1977�.
70J. Dalgleish, “Letter: TLD system for radiotherapy monitoring,” Phys.Med. Biol. 18, 465–467 �1973�.
71M. J. Rossiter, “The use of precision thermoluminescence dosimetry forintercomparison of absorbed dose,” Phys. Med. Biol. 20, 735–746 �1975�.
72B. I. Ruden, “Evaluation of the clinical use of TLD,” Acta Radiol. Ther.Phys. Biol. 15, 447–464 �1976�.
73M. S. Tarakanath and J. Novotny, “Thermoluminescence dosimetry inclinical radiation dose measurements,” Strahlentherapie 152, 71–77�1976�.
74A. J. Troncalli and J. Chapman, “TLD linearity vs. beam energy andmodality,” Med. Dosim. 27, 295–296 �2002�.
75F. M. Khan, K. P. Doppke, K. R. Hogstrom, G. J. Kutcher, R. Nath, S. C.Prasad, J. A. Purdy, M. Rozenfeld, and B. L. Werner, “Clinical electron-beam dosimetry: Report of AAPM Radiation Therapy Committee TaskGroup No. 25,” Med. Phys. 18, 73–109 �1991�.
76J. Balog, D. Lucas, C. DeSouza, and R. Crilly, “Helical tomotherapyradiation leakage and shielding considerations,” Med. Phys. 32, 710–719�2005�.
77J. F. Fowler, J. S. Welsh, and S. P. Howard, “Loss of biological effect inprolonged fraction delivery,” Int. J. Radiat. Oncol., Biol., Phys. 59, 242–249 �2004�.
78S. F. Kry, M. Salehpour, D. S. Followill, M. Stovall, D. A. Kuban, R. A.White, and I. I. Rosen, “The calculated risk of fatal secondary malignan-cies from intensity-modulated radiation therapy,” Int. J. Radiat. Oncol.,Biol., Phys. 62, 1195–1203 �2005�.
79E. A. Miles, C. H. Clark, M. T. Urbano, M. Bidmead, D. P. Dearnaley, K.J. Harrington, R. A’Hern, and C. M. Nutting, “The impact of introducingintensity modulated radiotherapy into routine clinical practice,” Radio-ther. Oncol. 77, 241–246 �2005�.
80F. Sterzing, M. W. Munter, M. Schafer, P. Haering, B. Rhein, C. Thil-mann, and J. Debus, “Radiobiological investigation of dose-rate effects inintensity-modulated radiation therapy,” Strahlenther. Onkol. 181, 42–48�2005�.
81J. Z. Wang, X. A. Li, W. D. D’Souza, and R. D. Stewart, “Impact ofprolonged fraction delivery times on tumor control: A note of caution forintensity-modulated radiation therapy �IMRT�,” Int. J. Radiat. Oncol.,Biol., Phys. 57, 543–552 �2003�.
82F. García-Vicente, J. M. Delgado, and C. Peraza, “Experimental determi-nation of the convolution kernel for the study of the spatial response of adetector,” Med. Phys. 25, 202–207 �1998�.
83G. Bednarz, M. Saiful Huq, and U. F. Rosenow, “Deconvolution of de-tector size effect for output factor measurement for narrow Gamma Kniferadiosurgery beams,” Phys. Med. Biol. 47, 3643–3649 �2002�.
84D. A. Low, J. F. Dempsey, J. Markman, S. Mutic, E. E. Klein, J. W. Sohn,and J. A. Purdy, “Toward automated quality assurance for intensity-modulated radiation therapy,” Int. J. Radiat. Oncol., Biol., Phys. 53, 443–452 �2002�.
85A. Mack, H. Czempiel, H. J. Kreiner, G. Durr, and B. Wowra, “Qualityassurance in stereotactic space. A system test for verifying the accuracy ofaim in radiosurgery,” Med. Phys. 29, 561–568 �2002�.
86W. L. McLaughlin, C. G. Soares, J. A. Sayeg, E. C. McCullough, R. W.Kline, A. Wu, and A. H. Maitz, “The use of a radiochromic detector forthe determination of stereotactic radiosurgery dose characteristics,” Med.Phys. 21, 379–388 �1994�.
87R. Ramani, A. W. Lightstone, D. L. Mason, and P. F. O’Brien, “The useof radiochromic film in treatment verification of dynamic stereotactic ra-diosurgery,” Med. Phys. 21, 389–392 �1994�.
88H. Shiomi, T. Inoue, S. Nakamura, and T. Inoue, “Quality assurance foran image-guided frameless radiosurgery system using radiochromic film,”Radiat. Med. 18, 107–113 �2000�.
89T. Yasuda, J. Beatty, P. J. Biggs, and K. Gall, “Two-dimensional dosedistribution of a miniature x-ray device for stereotactic radiosurgery,”
Med. Phys. 25, 1212–1216 �1998�.
1335 Low et al.: IMRT dosimetry tools 1335
90M. R. Arnfield, K. Otto, V. R. Aroumougame, and R. D. Alkins, “The useof film dosimetry of the penumbra region to improve the accuracy ofintensity modulated radiotherapy,” Med. Phys. 32, 12–18 �2005�.
91J. C. L. Chow, B. Wettlaufer, and R. Q. Jiang, “Dosimetric effects on thepenumbra region of irregular multi-leaf collimated fields,” Phys. Med.Biol. 51, N31–N38 �2006�.
92S. Agostinelli, S. Garelli, M. Piergentili, and F. Foppiano, “Response tohigh-energy photons of PTW31014 PinPoint ion chamber with a centralaluminum electrode,” Med. Phys. 35, 3293–3301 �2008�.
93S. Pai, I. J. Das, J. F. Dempsey, K. L. Lam, T. J. Losasso, A. J. Olch, J. R.Palta, L. E. Reinstein, D. Ritt, and E. E. Wilcox, “TG-69: Radiographicfilm for megavoltage beam dosimetry,” Med. Phys. 34, 2228–2258�2007�.
94T. M. Bogucki, W. R. Murphy, C. W. Baker, S. S. Piazza, and A. G. Haus,“Processor quality control in laser imaging systems,” Med. Phys. 24,581–584 �1997�.
95A. Niroomand-Rad, C. R. Blackwell, B. M. Coursey, K. P. Gall, J. M.Galvin, W. L. McLaughlin, A. S. Meigooni, R. Nath, J. E. Rodgers, andC. G. Soares, “Radiochromic film dosimetry: Recommendations ofAAPM Radiation Therapy Committee Task Group 55. American Associa-tion of Physicists in Medicine,” Med. Phys. 25, 2093–2115 �1998�.
96M. J. Butson, T. Cheung, and P. K. Yu, “Spatial resolution of a stackedradiochromic film dosimeter,” Radiother. Oncol. 61, 211–213 �2001�.
97M. J. Butson, J. N. Mathur, and P. E. Metcalfe, “Radiochromic film as aradiotherapy surface-dose detector,” Phys. Med. Biol. 41, 1073–1078�1996�.
98T. Cheung, M. J. Butso, and P. K. Yu, “Use of multiple layers of Gafchro-mic film to increase sensitivity,” Phys. Med. Biol. 46, N235–N240�2001�.
99J. F. Dempsey, D. A. Low, S. Mutic, J. Markman, A. S. Kirov, G. H.Nussbaum, and J. F. Williamson, “Validation of a precision radiochromicfilm dosimetry system for quantitative two-dimensional imaging of acuteexposure dose distributions,” Med. Phys. 27, 2462–2475 �2000�.
100P. O. Kellermann, A. Ertl, and E. Gornik, “A new method of readout inradiochromic film dosimetry,” Phys. Med. Biol. 43, 2251–2263 �1998�.
101L. E. Reinstein and G. R. Gluckman, “Comparison of dose response ofradiochromic film measured with He-Ne laser, broadband, and filteredlight densitometers,” Med. Phys. 24, 1531–1533 �1997�.
102L. E. Reinstein, G. R. Gluckman, and H. I. Amols, “Predicting opticaldensitometer response as a function of light source characteristics forradiochromic film dosimetry,” Med. Phys. 24, 1935–1942 �1997�.
103L. E. Reinstein, G. R. Gluckman, and A. G. Meek, “A rapid colour sta-bilization technique for radiochromic film dosimetry,” Phys. Med. Biol.43, 2703–2708 �1998�.
104M. J. Butson, T. Cheung, and P. K. Yu, “Absorption spectra variations ofEBT radiochromic film from radiation exposure,” Phys. Med. Biol. 50,N135–N140 �2005�.
105S. A. Dini, R. A. Koona, J. R. Ashburn, and A. S. Meigoonia, “Dosim-etric evaluation of GAFCHROMIC XR type T and XR type R films,” J.Appl. Clin. Med. Phys. 6, 114–134 �2005�.
106T. Wiezorek, N. Banz, M. Schwedas, M. Scheithauer, H. Salz, D. Georg,and T. G. Wendt, “Dosimetric quality assurance for intensity-modulatedradiotherapy feasibility study for a filmless approach,” Strahlenther.Onkol. 181, 468–474 �2005�.
107S. T. Chiu-Tsao, Y. Ho, R. Shankar, L. Wang, and L. B. Harrison, “Energydependence of response of new high sensitivity radiochromic films formegavoltage and kilovoltage radiation energies,” Med. Phys. 32, 3350–3354 �2005�.
108T. Cheung, M. J. Butson, and P. K. Yu, “Experimental energy responseverification of XR type T radiochromic film,” Phys. Med. Biol. 49, N371–N376 �2004�.
109M. J. Butson, P. K. Yu, T. Cheung, and P. Metcalfe, “High sensitivityradiochromic film dose comparisons,” Phys. Med. Biol. 47, N291–N295�2002�.
110M. J. Butson, P. K. Yu, T. Cheung, and D. Inwood, “Polarization effectson a high-sensitivity radiochromic film,” Phys. Med. Biol. 48, N207–N211 �2003�.
111T. Cheung, M. J. Butson, and P. K. Yu, “Post-irradiation colouration ofGafchromic EBT radiochromic film,” Phys. Med. Biol. 50, N281–N285�2005�.
112M. J. Butson, T. Cheung, and P. K. Yu, “Visible absorption properties ofradiation exposed XR type-T radiochromic film,” Phys. Med. Biol. 49,
N347–N351 �2004�.Medical Physics, Vol. 38, No. 3, March 2011
113B. D. Lynch, J. Kozelka, M. K. Ranade, J. G. Li, W. E. Simon, and J. F.Dempsey, “Important considerations for radiochromic film dosimetrywith flatbed CCD scanners and EBT GAFCHROMIC film,” Med. Phys.33, 4551–4556 �2006�.
114C. G. Soares, “New developments in radiochromic film dosimetry,” Ra-diat. Prot. Dosim. 120, 100–106 �2006�.
115M. Bazioglou and J. Kalef-Ezra, “Dosimetry with radiochromic films: Adocument scanner technique, neutron response, applications,” Appl. Ra-diat. Isot. 55, 339–345 �2001�.
116L. Paelinck, W. De Neve, and C. De Wagter, “Precautions and strategiesin using a commercial flatbed scanner for radiochromic film dosimetry,”Phys. Med. Biol. 52, 231–242 �2007�.
117J. E. Bayouth, D. Wendt, and S. M. Morrill, “MLC quality assurancetechniques for IMRT applications,” Med. Phys. 30, 743–750 �2003�.
118M. Bucciolini, F. B. Buonamici, and M. Casati, “Verification of IMRTfields by film dosimetry,” Med. Phys. 31, 161–168 �2004�.
119N. L. Childress, L. Dong, and I. I. Rosen, “Rapid radiographic film cali-bration for IMRT verification using automated MLC fields,” Med. Phys.29, 2384–2390 �2002�.
120S. Gillis, C. De Wagter, J. Bohsung, B. Perrin, P. Williams, and B. J.Mijnheer, “An inter-centre quality assurance network for IMRT verifica-tion: Results of the ESTRO QUASIMODO project,” Radiother. Oncol.76, 340–353 �2005�.
121A. J. Olch, “Dosimetric performance of an enhanced dose range radio-graphic film for intensity-modulated radiation therapy quality assurance,”Med. Phys. 29, 2159–2168 �2002�.
122P. Tangboonduangjit, I. Wu, M. Butson, A. Rosenfeld, and P. Metcalfe,“Intensity modulated radiation therapy: Film verification of planar dosemaps,” Australas. Phys. Eng. Sci. Med. 26, 194–199 �2003�.
123P. Winkler, B. Zurl, H. Guss, P. Kindl, and G. Stuecklschweiger, “Perfor-mance analysis of a film dosimetric quality assurance procedure for IMRTwith regard to the employment of quantitative evaluation methods,” Phys.Med. Biol. 50, 643–654 �2005�.
124L. Xing and J. G. Li, “Computer verification of fluence map for intensitymodulated radiation therapy,” Med. Phys. 27, 2084–2092 �2000�.
125Y. Yan, N. Papanikolaou, X. Weng, J. Penagaricano, and V. Ratanathar-athorn, “Fast radiographic film calibration procedure for helical tomo-therapy intensity modulated radiation therapy dose verification,” Med.Phys. 32, 1566–1570 �2005�.
126Y. Yang and L. Xing, “Using the volumetric effect of a finite-sized detec-tor for routine quality assurance of multileaf collimator leaf positioning,”Med. Phys. 30, 433–441 �2003�.
127X. R. Zhu, P. A. Jursinic, D. F. Grimm, F. Lopez, J. J. Rownd, and M. T.Gillin, “Evaluation of Kodak EDR2 film for dose verification of intensitymodulated radiation therapy delivered by a static multileaf collimator,”Med. Phys. 29, 1687–1692 �2002�.
128J. Esthappan, S. Mutic, W. B. Harms, J. F. Dempsey, and D. A. Low,“Dosimetry of therapeutic photon beams using an extended dose rangefilm,” Med. Phys. 29, 2438–2445 �2002�.
129X. R. Zhu, S. Yoo, P. A. Jursinic, D. F. Grimm, F. Lopez, J. J. Rownd, andM. T. Gillin, “Characteristics of sensitometric curves of radiographicfilms,” Med. Phys. 30, 912–919 �2003�.
130N. L. Childress and I. I. Rosen, “Effect of processing time delay on thedose response of Kodak EDR2 film,” Med. Phys. 31, 2284–2288 �2004�.
131E. Y. Hirata, C. Cunningham, J. A. Micka, H. Keller, M. W. Kissick, andL. A. DeWerd, “Low dose fraction behavior of high sensitivity radiochro-mic film,” Med. Phys. 32, 1054–1060 �2005�.
132A. Mack, G. Mack, D. Weltz, S. G. Scheib, H. D. Bottcher, and V. Seifert,“High precision film dosimetry with GAFCHROMIC films for qualityassurance especially when using small fields,” Med. Phys. 30, 2399–2409�2003�.
133J. W. Sohn, J. F. Dempsey, T. S. Suh, and D. A. Low, “Analysis ofvarious beamlet sizes for IMRT with 6 MV photons,” Med. Phys. 30,2432–2439 �2003�.
134O. A. Zeidan, J. G. Li, D. A. Low, and J. F. Dempsey, “Comparison ofsmall photon beams measured using radiochromic and silver-halide filmsin solid water phantoms,” Med. Phys. 31, 2730–2737 �2004�.
135M. A. Bazioglou, J. Kalef-Ezra, and C. Kappas, “Comparison of dosim-etric techniques for the assessment of basic dosimetric data of stereotacticfields,” Phys. Med. Biol. 17, 123–128 �2001�.
136P. Francescon, S. Cora, P. Scalchi, and F. Colombo, “Use of GAFCHRO-MIC�TM� film MD-55 and of a new microparallel-plate chamber in the
dosimetry of small fields,” Phys. Med. Biol. 13, 91–99 �1997�.
1336 Low et al.: IMRT dosimetry tools 1336
137A. Somigliana, G. M. Cattaneo, C. Fiorino, S. Borelli, A. del Vecchio, G.Zonca, E. Pignoli, G. Loi, R. Calandrino, and R. Marchesini, “Dosimetryof Gamma Knife and linac-based radiosurgery using radiochromic anddiode detectors,” Phys. Med. Biol. 44, 887–897 �1999�.
138P. A. Jursinic and B. E. Nelms, “A 2-D diode array and analysis softwarefor verification of intensity modulated radiation therapy delivery,” Med.Phys. 30, 870–879 �2003�.
139K. M. Langen, S. L. Meeks, D. O. Poole, T. H. Wagner, T. R. Willoughby,O. A. Zeidan, P. A. Kupelian, K. J. Ruchala, and G. H. Olivera, “Evalu-ation of a diode array for QA measurements on a helical tomotherapyunit,” Med. Phys. 32, 3424–3430 �2005�.
140D. Letourneau, M. Gulam, D. Yan, M. Oldham, and J. W. Wong, “Evalu-ation of a 2D diode array for IMRT quality assurance,” Radiother. Oncol.70, 199–206 �2004�.
141J. G. Li, J. F. Dempsey, L. Ding, C. Liu, and J. R. Palta, “Validation ofdynamic MLC-controller log files using a two-dimensional diode array,”Med. Phys. 30, 799–805 �2003�.
142S. Amerio, A. Boriano, F. Bourhaleb, R. Cirio, M. Donetti, A. Fidanzio,E. Garelli, S. Giordanengo, E. Madon, F. Marchetto, U. Nastasi, C.Peroni, A. Piermattei, C. J. Sanz Freire, A. Sardo, and E. Trevisiol, “Do-simetric characterization of a large area pixel-segmented ionization cham-ber,” Med. Phys. 31, 414–420 �2004�.
143J. Pardo, L. Franco, F. Gomez, A. Iglesias, A. Pazos, J. Pena, R. Lobato,J. Mosquera, M. Pombar, and J. Sendon, “Development and operation ofa pixel segmented liquid-filled linear array for radiotherapy quality assur-ance,” Phys. Med. Biol. 50, 1703–1716 �2005�.
144E. Spezi, A. L. Angelini, F. Romani, and A. Ferri, “Characterization of a2D ion chamber array for the verification of radiotherapy treatments,”Phys. Med. Biol. 50, 3361–3373 �2005�.
145B. Poppe, A. Blechschmnidt, A. Djouguela, R. Kollhoff, A. Rubach, K.C. Willborn, and D. Harder, “Two-dimensional ionization chamber arraysfor IMRT plan verification,” Med. Phys. 33, 1005–1015 �2006�.
146B. Poppe, P. Mehran, R. Kollhoff, and A. Rubach, “Use of a two-dimensional ionization chamber array for quality assurance in medicallinear accelerators,” Z. Med. Phys. 13, 115–122 �2003�.
147M. Sonoda, M. Takano, J. Miyahara, and H. Kato, “Computed radiogra-phy utilizing scanning laser stimulated luminescence,” Radiology 148,833–838 �1983�.
148A. J. Olch, “Evaluation of a computed radiography system for megavolt-age photon beam dosimetry,” Med. Phys. 32, 2987–2999 �2005�.
149M. A. Bazioglou, K. Theodorou, C. Kappas, and J. Kalef-Ezra, “A mul-tipurpose head phantom for stereotactic radiotherapy,” Phys. Med. Biol.18, 121–127 �2002�.
150C. M. Ma, S. B. Jiang, T. Pawlicki, Y. Chen, J. S. Li, J. Deng, and A. L.Boyer, “A quality assurance phantom for IMRT dose verification,” Phys.Med. Biol. 48, 561–572 �2003�.
151B. Paliwal, W. Tome, S. Richardson, and T. R. Makie, “A spiral phantomfor IMRT and tomotherapy treatment delivery verification,” Med. Phys.27, 2503–2507 �2000�.
152A. Palm and T. LoSasso, “Influence of phantom material and phantomsize on radiographic film response in therapy photon beams,” Med. Phys.32, 2434–2442 �2005�.
153L. Xing, B. Curran, R. Hill, T. Holmes, L. Ma, K. M. Forster, and A. L.Boyer, “Dosimetric verification of a commercial inverse treatment plan-ning system,” Phys. Med. Biol. 44, 463–478 �1999�.
154J. Balog, T. Holmes, and R. Vaden, “A helical tomotherapy dynamicquality assurance,” Med. Phys. 33, 3939–3950 �2006�.
155M. A. MacKenzie, M. Lachaine, B. Murray, B. G. Fallone, D. Robinson,and G. C. Field, “Dosimetric verification of inverse planned step andshoot multileaf collimator fields from a commercial treatment planningsystem,” J. Appl. Clin. Med. Phys. 3, 97–109 �2002�.
156J. S. Tsai, D. E. Wazer, M. N. Ling, J. K. Wu, M. Fagundes, T. DiPetrillo,B. Kramer, M. Koistinen, and M. J. Engler, “Dosimetric verification ofthe dynamic intensity-modulated radiation therapy of 92 patients,” Int. J.Radiat. Oncol., Biol., Phys. 40, 1213–1230 �1998�.
157D. Verellen, N. Linthout, D. van den Berge, A. Bel, and G. Storme,“Initial experience with intensity-modulated conformal radiation therapyfor treatment of the head and neck region,” Int. J. Radiat. Oncol., Biol.,Phys. 39, 99–114 �1997�.
158S. E. Burch, K. J. Kearfott, J. H. Trueblood, W. C. Sheils, J. I. Yeo, andC. K. Wang, “A new approach to film dosimetry for high energy photonbeams: Lateral scatter filtering,” Med. Phys. 24, 775–783 �1997�.
159
I. J. Yeo, A. Beiki-Ardakani, Y. B. Cho, M. Heydarian, T. Zhang, and M.Medical Physics, Vol. 38, No. 3, March 2011
Islam, “EDR2 film dosimetry for IMRT verification using low-energyphoton filters,” Med. Phys. 31, 1960–1963 �2004�.
160W. B. Harms, Sr., D. A. Low, J. W. Wong, and J. A. Purdy, “A softwaretool for the quantitative evaluation of 3D dose calculation algorithms,”Med. Phys. 25, 1830–1836 �1998�.
161J. Van Dyk, R. B. Barnett, J. E. Cygler, and P. C. Shragge, “Commission-ing and quality assurance of treatment planning computers,” Int. J. Radiat.Oncol., Biol., Phys. 26, 261–273 �1993�.
162N. L. Childress and I. I. Rosen, “The design and testing of novel clinicalparameters for dose comparison,” Int. J. Radiat. Oncol., Biol., Phys. 56,1464–1479 �2003�.
163D. A. Low and J. F. Dempsey, “Evaluation of the gamma dose distribu-tion comparison method,” Med. Phys. 30, 2455–2464 �2003�.
164M. Stock, B. Kroupa, and D. Georg, “Interpretation and evaluation of thegamma index and the gamma index angle for the verification of IMRThybrid plans,” Phys. Med. Biol. 50, 399–411 �2005�.
165G. J. Budgell, B. A. Perrin, J. H. L. Mott, J. Fairfoul, and R. I. Mackay,“Quantitative analysis of patient-specific dosimetric IMRT verification,”Phys. Med. Biol. 50, 103–119 �2005�.
166K. T. S. Islam, J. F. Dempsey, M. K. Ranade, M. J. Maryanski, and D. A.Low, “Initial evaluation of commercial optical CT-based 3D gel dosim-eter,” Med. Phys. 30, 2159–2168 �2003�.
167H. S. Jin, H. Chung, C. Liu, J. Palta, T. S. Suh, and S. Y. Kim, “A noveldose uncertainty model and its application for dose verification,” Med.Phys. 32, 1747–1756 �2005�.
168G. Nicolini, A. Fogliata, and L. Cozzi, “IMRT with the sliding window:Comparison of the static and dynamic methods. Dosimetric and spectralanalysis,” Radiother. Oncol. 75, 112–119 �2005�.
169K. Nygaard, O. H. Odland, Y. Kvinnsland, B. Nygaard, J. Heggdal, and L.P. Muren, “Measurements and treatment planning calculations of electrondose distributions below bolus edges,” Radiother. Oncol. 74, 217–220�2005�.
170N. Sakthi, P. Keall, I. Mihaylov, Q. W. Wu, Y. Wu, J. F. Williamson, R.Schmidt-Ullrich, and J. V. Siebers, “Monte Carlo-based dosimetry ofhead-and-neck patients treated with SIB-IMRT,” Int. J. Radiat. Oncol.,Biol., Phys. 64, 968–977 �2006�.
171P. Sandilos, A. Angelopoulos, P. Baras, K. Dardoufas, P. Karaiskos, P.Kipouros, M. Kozicki, J. M. Rosiak, L. Sakelliou, I. Seimenis, and L.Vlahos, “Dose verification in clinical IMRT prostate incidents,” Int. J.Radiat. Oncol., Biol., Phys. 59, 1540–1547 �2004�.
172J. Seco, E. Adams, M. Bidmead, M. Partridge, and F. Verhaegen, “Head-and-neck IMRT treatments assessed with a Monte Carlo dose calculationengine,” Phys. Med. Biol. 50, 817–830 �2005�.
173S. D. Thomas, M. Mackenzie, G. C. Field, A. M. Syme, and B. G. Fal-lone, “Patient specific treatment verifications for helical tomotherapytreatment plans,” Med. Phys. 32, 3793–3800 �2005�.
174S. Vedam, A. Docef, M. Fix, M. Murphy, and P. Keall, “Dosimetricimpact of geometric errors due to respiratory motion prediction on dy-namic multileaf collimator-based four-dimensional radiation delivery,”Med. Phys. 32, 1607–1620 �2005�.
175A. Bakai, M. Alber, and F. Nusslin, “A revision of the gamma-evaluationconcept for the comparison of dose distributions,” Phys. Med. Biol. 48,3543–3553 �2003�.
176A. Hudson, G. Fallone, and C. Field, “A software tool to quantitativelycompare dose distributions,” Med. Phys. 30, 1952–1952 �2003�.
177S. B. Jiang, G. C. Sharp, T. Neicu, R. I. Berbeco, S. Flampouri, and T.Bortfeld, “On dose distribution comparison,” Phys. Med. Biol. 51, 759–776 �2006�.
178T. Depuydt, A. Van Esch, and D. P. Huyskens, “A quantitative evaluationof IMRT dose distributions: Refinement and clinical assessment of thegamma evaluation,” Radiother. Oncol. 62, 309–319 �2002�.
179J. M. Moran, J. Radawski, and B. A. Fraass, “A dose gradient analysistool for IMRT QA,” J. Appl. Clin. Med. Phys. 6, 62–73 �2005�.
180G. J. Budgell, Q. Zhang, R. J. Trouncer, and R. I. Mackay, “ImprovingIMRT quality control efficiency using an amorphous silicon electronicportal imager,” Med. Phys. 32, 3267–3278 �2005�.
181J. Chang, C. H. Obcemea, J. Sillanpaa, J. Mechalakos, and C. Burman,“Use of EPID for leaf position accuracy QA of dynamic multi-leaf colli-mator �DMLC� treatment,” Med. Phys. 31, 2091–2096 �2004�.
182W. van Elmpt, L. McDermott, S. Nijsten, M. Wendling, P. Lambin, and B.Mijnheer, “A literature review of electronic portal imaging for radio-therapy dosimetry,” Radiother. Oncol. 88, 289–309 �2008�.
183
B. M. McCurdy, K. Luchka, and S. Pistorius, “Dosimetric investigation
1337 Low et al.: IMRT dosimetry tools 1337
and portal dose image prediction using an amorphous silicon electronicportal imaging device,” Med. Phys. 28, 911–924 �2001�.
184B. M. McCurdy and S. Pistorius, “A two-step algorithm for predictingportal dose images in arbitrary detectors,” Med. Phys. 27, 2109–2116�2000�.
185A. Van Esch, T. Depuydt, and D. P. Huyskens, “The use of an aSi-basedEPID for routine absolute dosimetric pre-treatment verification of dy-namic IMRT fields,” Radiother. Oncol. 71, 223–234 �2004�.
186K. Chytyk and B. M. McCurdy, “Comprehensive fluence model for ab-solute portal dose image prediction,” Med. Phys. 36, 1389–1398 �2009�.
187Y. Chen, J. M. Moran, D. A. Roberts, Y. El-Mohri, L. E. Antonuk, and B.A. Fraass, “Performance of a direct-detection active matrix flat paneldosimeter �AMFPD� for IMRT measurements,” Med. Phys. 34, 4911–4922 �2007�.
188Y. El-Mohri, L. E. Antonuk, J. Yorkston, K. W. Jee, M. Maolinbay, K. L.Lam, and J. H. Siewerdsen, “Relative dosimetry using active matrix flat-panel imager �AMFPI� technology,” Med. Phys. 26, 1530–1541 �1999�.
189J. M. Moran, D. A. Roberts, T. S. Nurushev, L. E. Antonuk, Y. El-Mohri,and B. A. Fraass, “An active matrix flat panel dosimeter �AMFPD� forin-phantom dosimetric measurements,” Med. Phys. 32, 466–472 �2005�.
190M. Sabet, F. W. Menk, and P. B. Greer, “Evaluation of an a-Si EPID indirect detection configuration as a water-equivalent dosimeter for transitdosimetry,” Med. Phys. 37, 1459–1467 �2010�.
191L. N. McDermott, M. Wendling, J. J. Sonke, M. van Herk, and B. J.Mijnheer, “Replacing pretreatment verification with in vivo EPID dosim-etry for prostate IMRT,” Int. J. Radiat. Oncol., Biol., Phys. 67, 1568–1577 �2007�.
192L. N. McDermott, M. Wendling, B. van Asselen, J. Stroom, J. J. Sonke,M. van Herk, and B. J. Mijnheer, “Clinical experience with EPID dosim-etry for prostate IMRT pre-treatment dose verification,” Med. Phys. 33,3921–3930 �2006�.
193M. Wendling, R. J. Louwe, L. N. McDermott, J. J. Sonke, M. van Herk,and B. J. Mijnheer, “Accurate two-dimensional IMRT verification using aback-projection EPID dosimetry method,” Med. Phys. 33, 259–273�2006�.
194J. V. Siebers, J. O. Kim, L. Ko, P. J. Keall, and R. Mohan, “Monte Carlocomputation of dosimetric amorphous silicon electronic portal images,”Med. Phys. 31, 2135–2146 �2004�.
195R. M. Howell, I. P. Smith, and C. S. Jarrio, “Establishing action levels forEPID-based QA for IMRT,” J. Appl. Clin. Med. Phys. 9, 2721 �2008�.
196M. D’Andrea, G. Laccarino, S. Carpino, L. Strigari, and M. Benassi,“Primary photon fluence extraction from portal images acquired with anamorphous silicon flat panel detector: Experimental determination of ascatter filter,” J. Exp. Clin. Cancer Res. 26, 125–132 �2007�.
197A. F. Monti and G. Frigerio, “Dosimetric verification of 6 and 18 MVintensity modulated photon beams using a dedicated fluoroscopic elec-tronic portal imaging device �EPID�,” Radiother. Oncol. 81, 88–96�2006�.
198C. Talamonti, M. Casati, and M. Bucciolini, “Pretreatment verification ofIMRT absolute dose distributions using a commercial a-Si EPID,” Med.Phys. 33, 4367–4378 �2006�.
199M. van Zijtveld, M. L. Dirkx, H. C. de Boer, and B. J. Heijmen, “3D dosereconstruction for clinical evaluation of IMRT pretreatment verificationwith an EPID,” Radiother. Oncol. 82, 201–207 �2007�.
200P. Winkler, A. Hefner, and D. Georg, “Dose-response characteristics of anamorphous silicon EPID,” Med. Phys. 32, 3095–3105 �2005�.
201W. van Elmpt, S. Petit, D. De Ruysscher, P. Lambin, and A. Dekker, “3Ddose delivery verification using repeated cone-beam imaging and EPIDdosimetry for stereotactic body radiotherapy of non-small cell lung can-cer,” Radiother. Oncol. 94, 188–194 �2010�.
202G. S. Ibbott, “QA in radiation therapy: The RPC perspective,” J. Phys.:Conf. Ser. 250, 012001 �2010�.
203M. Oldham, J. H. Siewerdsen, A. Shetty, and D. A. Jaffray, “High reso-lution gel-dosimetry by optical-CT and MR scanning,” Med. Phys. 28,1436–1445 �2001�.
204R. G. Kelly, K. J. Jordan, and J. J. Battista, “Optical CT reconstruction of3D dose distributions using the ferrous-benzoic-xylenol �FBX� gel dosim-eter,” Med. Phys. 25, 1741–1750 �1998�.
205P. Guo, J. Adamovics, and M. Oldham, “Characterization of a new radio-chromic three-dimensional dosimeter,” Med. Phys. 33, 1338–1345�2006�.
206M. J. Maryanski, J. C. Gore, R. P. Kennan, and R. J. Schulz, “NMR
relaxation enhancement in gels polymerized and cross-linked by ionizingMedical Physics, Vol. 38, No. 3, March 2011
radiation: A new approach to 3D dosimetry by MRI,” Magn. Reson. Im-aging 11, 253–258 �1993�.
207I. C. Baustert, M. Oldham, T. A. Smith, C. Hayes, S. Webb, and M. O.Leach, “Optimized MR imaging for polyacrylamide gel dosimetry,” Phys.Med. Biol. 45, 847–858 �2000�.
208Y. De Deene, “How to scan polymer gels with MRI,” J. Phys.: Conf. Ser.250, 012015 �2010�.
209J. C. Gore, M. Ranade, M. J. Maryanski, and R. J. Schulz, “Radiationdose distributions in three dimensions from tomographic optical densityscanning of polymer gels: I. Development of an optical scanner,” Phys.Med. Biol. 41, 2695–2704 �1996�.
210C. Baldock, Y. De Deene, S. Doran, G. Ibbott, A. Jirasek, M. Lepage, K.B. McAuley, M. Oldham, and L. J. Schreimer“Topical Review: Polymergel dosimetry,” Phys. Med. Biol. 55, R1–R63 �2010�.
211M. Lepage, A. K. Whittaker, L. Rintoul, S. A. Back, and C. Baldock,“Modelling of post-irradiation events in polymer gel dosimeters,” Phys.Med. Biol. 46, 2827–2839 �2001�.
212A. Ertl, A. Berg, M. Zehetmayer, and P. Frigo, “High-resolution doseprofile studies based on MR imaging with polymer BANG�TM� gels instereotactic radiation techniques,” Magn. Reson. Imaging 18, 343–349�2000�.
213G. S. Ibbott, M. J. Maryanski, P. Eastman, S. D. Holcomb, Y. Zhang, R.G. Avison, M. Sanders, and J. C. Gore, “Three-dimensional visualizationand measurement of conformal dose distributions using magnetic reso-nance imaging of BANG polymer gel dosimeters,” Int. J. Radiat. Oncol.,Biol., Phys. 38, 1097–1103 �1997�.
214M. Oldham, G. R. Gluckman, and L. H. Kim, “3D verification of a pros-tate IMRT treatment by polymer gel-dosimetry and optical-CT scanning,”J. Phys.: Conf. Ser. 3, 293–296 �2004�.
215S. G. Scheib and S. Gianolini, “Three-dimensional dose verification usingBANG gel: A clinical example,” J. Neurosurg. 97, 582–587 �2002�.
216K. Vergote, Y. De Deene, F. Claus, W. De Gersem, B. Van Duyse, L.Paelinck, E. Achten, W. De Neve, and C. De Wagter, “Application ofmonomer/polymer gel dosimetry to study the effects of tissue inhomoge-neities on intensity-modulated radiation therapy �IMRT� dose distribu-tions,” Radiother. Oncol. 67, 119–128 �2003�.
217Y. Xu, C. S. Wuu, and M. J. Maryanski, “Performance of a commercialoptical CT scanner and polymer gel dosimeters for 3-D dose verification,”Med. Phys. 31, 3024–3033 �2004�.
218J. C. Gore, Y. S. Kang, and R. J. Schulz, “Measurement of radiation dosedistributions by nuclear magnetic resonance �NMR� imaging,” Phys.Med. Biol. 29, 1189–1197 �1984�.
219H. Fricke and E. J. Hart, in Radiation Dosimetry, edited by F. H. Attixand W. C. Roesch �Academic Press, New York, 1966�, Vol. 2.
220H. Fricke and E. L. Hart, “The chemical action of roentgen rays on diluteferrosulphate solutions as a measure of dose,” Am. J. Roentgenol., Ra-dium Ther. Nucl. Med. 18, 430–432 �1927�.
221B. J. Balcom, T. J. Lees, A. R. Sharp, N. S. Kulkarni, and G. S. Wagner,“Diffusion in Fe�II/III� radiation dosimetry gels measured by magneticresonance imaging,” Phys. Med. Biol. 40, 1665–1676 �1995�.
222C. Baldock, P. J. Harris, A. R. Piercy, and B. Healy, “Experimental de-termination of the diffusion coefficient in two-dimensions in ferrous sul-phate gels using the finite element method,” Australas. Phys. Eng. Sci.Med. 24, 19–30 �2001�.
223J. Adamovics and M. J. Maryanski, “Characterisation of PRESAGETM: Anew 3-D radiochromic solid polymer dosimeter for ionising radiation,”Radiat. Prot. Dosim. 120, 107–112 �2006�.
224H. S.Sakhalkar, J. Adamovics, G. Ibbott, and M. Oldham, “A comprehen-sive evaluation of the PRESAGE optical-CT 3D dosimetry system,” Med.Phys. 36, 71–82 �2009�.
225M. Oldham, “Optical-CT scanning of polymer gels,” J. Phys.: Conf. Ser.3, 122–135 �2004�.
226M. Oldham and L. Kim, “A study of geometrical and reconstruction ar-tifacts in 3D gel-dosimetry utilizing optical-CT,” Med. Phys. 30, 1426�2003�.
227M. Oldham and L. Kim, “Optical-CT gel-dosimetry. II: Optical artifactsand geometrical distortion,” Med. Phys. 31, 1093–1104 �2004�.
228Y. De Deene and C. De Wagter, “Artefacts in multi-echo T2 imaging forhigh-precision gel dosimetry: III. Effects of temperature drift during scan-ning,” Phys. Med. Biol. 46, 2697–2711 �2001�.
229Y. De Deene, C. De Wagter, W. De Neve, and E. Achten, “Artefacts inmulti-echo T2 imaging for high-precision gel dosimetry: I. Analysis and
compensation of eddy currents,” Phys. Med. Biol. 45, 1807–1823 �2000�.
1338 Low et al.: IMRT dosimetry tools 1338
230Y. De Deene, C. De Wagter, W. De Neve, and E. Achten, “Artefacts inmulti-echo T2 imaging for high-precision gel dosimetry: II. Analysis ofB1-field inhomogeneity,” Phys. Med. Biol. 45, 1825–1839 �2000�.
231M. A. Bero, W. B. Gilboy, and P. M. Glover, “An optical method forthree-dimensional dosimetry,” J. Radiol. Prot. 20, 287–294 �2000�.
232S. J. Doran, K. K. Koerkamp, M. A. Bero, P. Jenneson, E. J. Morton, andW. B. Gilboy, “A CCD-based optical CT scanner for high-resolution 3Dimaging of radiation dose distributions: Equipment specifications, opticalsimulations and preliminary results,” Phys. Med. Biol. 46, 3191–3213�2001�.
233M. J. Maryañski, Y. Z. Zastavker, and J. C. Gore, “Radiation dose distri-butions in three dimensions from tomographic optical density scanning ofpolymer gels: II. Optical properties of the BANG polymer gel,” Phys.Med. Biol. 41, 2705–2717 �1996�.
234M. Oldham, J. H. Siewerdsen, S. Kumar, J. Wong, and D. A. Jaffray,“Optical-CT gel-dosimetry I: Basic investigations,” Med. Phys. 30, 623–634 �2003�.
235Y. Xu, C. S. Wuu, and M. J. Maryanski, “Determining optimal gel sen-
sitivity in optical CT scanning of gel dosimeters,” Med. Phys. 30, 2257–Medical Physics, Vol. 38, No. 3, March 2011
2263 �2003�.236C. S. Wuu and Y. Xu, “Three-dimensional dose verification for intensity
modulated radiation therapy using optical CT based polymer gel dosim-etry,” Med. Phys. 33, 1412–1419 �2006�.
237T. Olding, O. Holmes, and L. J. Schreiner, “Cone-beam optical computedtomography for gel dosimetry I: Scanner characterizations,” Phys. Med.Biol. 55, 2819–2840 �2010�.
238A. Thomas, M. Pierquet, and M. Oldham, “Achieving accurate radiochro-mic optical-CT imaging which using a polychromatic light source,” J.Phys.: Conf. Ser. 250, 012045 �2010�.
239K. Jordan, J. Snir, and J. Battista, “Multiple slot array collimator to mini-mize stray light in optical cone-beam CT,” J. Phys.: Conf. Ser. 250,012062 �2010�.
240T. Ju, T. Simpson, J. Deasy, and D. Low, “Geometric interpretation of the� distribution comparison technique: Interpolation free calculations,”Med. Phys. 35, 879–887 �2008�.
241D. A. Low, W. B. Harms, S. Mutic, and J. A. Purdy, “A technique for thequantitative evaluation of dose distributions,” Med. Phys. 25, 656–661
�1998�.