download 942.53 kb
TRANSCRIPT
Climate-Related Disasters in Asia and the Pacific
Vinod Thomas, Jose Ramon G. Albert, and Rosa T. Perez
No. 358 | July 2013
ADB Economics Working Paper Series
Climate-Related Disasters in Asia and the PacificThe frequency of intense natural disasters resulting from floods and storms as well as droughts and heat waves has been on the rise in the Asia and Pacific region. At the same time, the climate in the region is observed to be changing. Three disaster risk factors—rising population exposure, greater population vulnerability, and increasing climate-related hazards—are found to be associated with the increased frequency of intense natural disasters in the region.
About the Asian Development BankADB’s vision is an Asia and Pacific region free of poverty. Its mission is to help its developing member countries reduce poverty and improve the quality of life of their people. Despite the region’s many successes, it remains home to two-thirds of the world’s poor: 1.7 billion people who live on less than $2 a day, with 828 million struggling on less than $1.25 a day. ADB is committed to reducing poverty through inclusive economic growth, environmentally sustainable growth, and regional integration. Based in Manila, ADB is owned by 67 members, including 48 from the region. Its main instruments for helping its developing member countries are policy dialogue, loans, equity investments, guarantees, grants, and technical assistance.
Asian Development Bank6 ADB Avenue, Mandaluyong City1550 Metro Manila, Philippineswww.adb.org/economics
Printed on recycled paper Printed in the Philippines

ADB Economics Working Paper Series
Climate-Related Disasters in Asia and the Pacific Vinod Thomas, Jose Ramon G. Albert, and Rosa T. Perez
No. 358 July 2013
Vinod Thomas is Director-General of Independent Evaluation at the Asian Development Bank, Jose Ramon G. Albert is Secretary General of the Philippine National Statistical Coordination Board, and Rosa T. Perez is Senior Research Fellow of the Manila Observatory. The authors are grateful to the Centre for Research on the Epidemiology of Disasters and to the Manila Observatory for collaboration and data support; Cameron Hepburn and Hina Choksy for a peer review and revision of the paper; Ramon Lopez, Debarati Guha-Sapir, Geoffrey Ducanes, and P.V. Srinivasan for their close collaboration and inputs; Robert Brakenridge, Philip Keefer, Kelly Levin, and Eric Neumayer for their detailed suggestions; and Ken Chomitz, Walter Kolkma, Valerie Reppelin-Hill, Alan Rodger, Suphachol Suphachalasasai, Eva Terberger, Vankina B. Tulasidhar, Tomoo Ueda, and Anbumozhi Venkatachalam for comments; and Ruth Francisco provided valuable assistance.
Asian Development Bank 6 ADB Avenue, Mandaluyong City 1550 Metro Manila, Philippines www.adb.org © 2013 by Asian Development Bank July 2013 ISSN 1655-5252 Publication Stock No. WPS135852 The views expressed in this paper are those of the author and do not necessarily reflect the views and policies of the Asian Development Bank (ADB) or its Board of Governors or the governments they represent. ADB does not guarantee the accuracy of the data included in this publication and accepts no responsibility for any consequence of their use. By making any designation of or reference to a particular territory or geographic area, or by using the term “country” in this document, ADB does not intend to make any judgments as to the legal or other status of any territory or area. Note: In this publication, “$” refers to US dollars.
The ADB Economics Working Paper Series is a forum for stimulating discussion and eliciting
feedback on ongoing and recently completed research and policy studies undertaken by the
Asian Development Bank (ADB) staff, consultants, or resource persons. The series deals with
key economic and development problems, particularly those facing the Asia and Pacific region;
as well as conceptual, analytical, or methodological issues relating to project/program
economic analysis, and statistical data and measurement. The series aims to enhance the
knowledge on Asia’s development and policy challenges; strengthen analytical rigor and quality
of ADB’s country partnership strategies, and its subregional and country operations; and
improve the quality and availability of statistical data and development indicators for monitoring
development effectiveness.
The ADB Economics Working Paper Series is a quick-disseminating, informal publication
whose titles could subsequently be revised for publication as articles in professional journals or
chapters in books. The series is maintained by the Economics and Research Department.
Printed on recycled paper
CONTENTS
ABSTRACT v I. INTRODUCTION 1 II. FRAMEWORK 2
A. Disaster Risk and Climate Change 2 B. Extreme Temperatures and Precipitation 4 C. Hazards, Exposure, and Vulnerability 6
III. NATURAL DISASTER CLASSIFICATIONS AND TRENDS 7
A. Frequency of Natural Disasters 8 B. Damage from Natural Disasters 9
IV. ECONOMETRIC ANALYSIS OF DISASTER RISK FACTORS 10
A. Data and Methods 10 B. Results 14
IV. CLIMATE TRENDS AND PATTERNS IN THE PHILIPPINES 20
A. Tropical Cyclones and Typhoons 21 B. Historical Temperatures 21 C. Historical Rainfall Patterns 23 D. Projected Changes in Temperature and Rainfall 23
VI. POLICY IMPLICATIONS 24 APPENDIX TABLES 28 REFERENCES 32

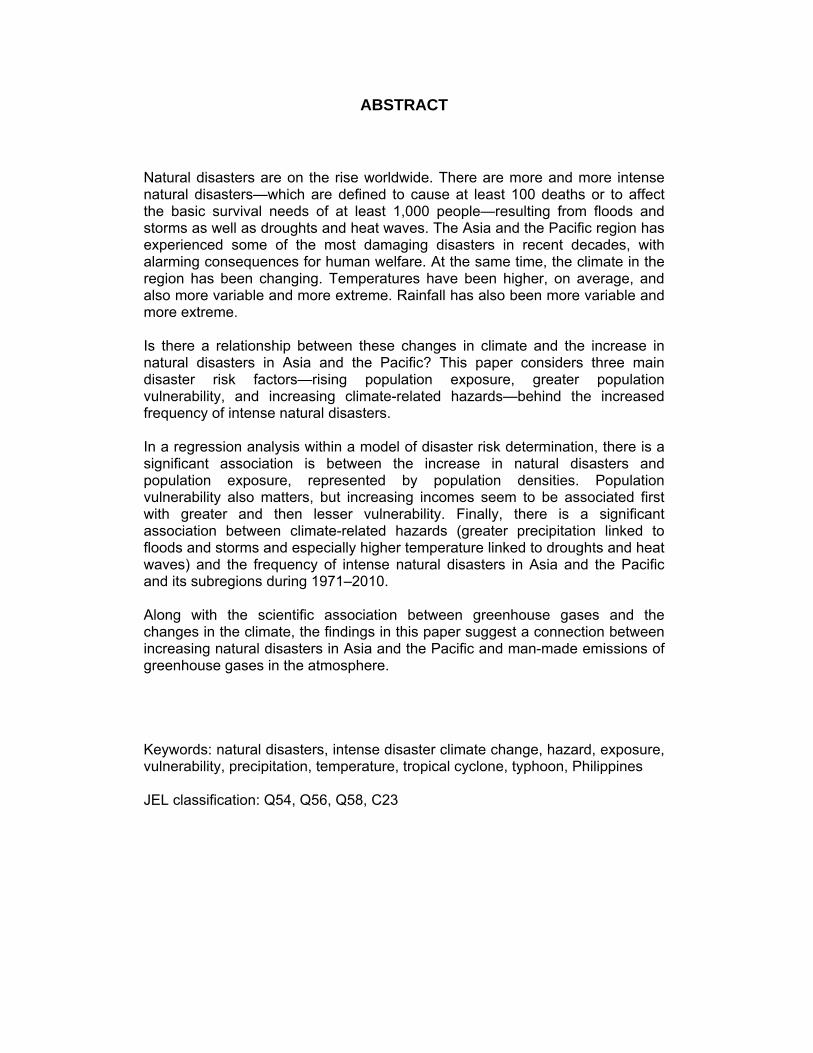
ABSTRACT
Natural disasters are on the rise worldwide. There are more and more intense natural disasters—which are defined to cause at least 100 deaths or to affect the basic survival needs of at least 1,000 people—resulting from floods and storms as well as droughts and heat waves. The Asia and the Pacific region has experienced some of the most damaging disasters in recent decades, with alarming consequences for human welfare. At the same time, the climate in the region has been changing. Temperatures have been higher, on average, and also more variable and more extreme. Rainfall has also been more variable and more extreme. Is there a relationship between these changes in climate and the increase in natural disasters in Asia and the Pacific? This paper considers three main disaster risk factors—rising population exposure, greater population vulnerability, and increasing climate-related hazards—behind the increased frequency of intense natural disasters. In a regression analysis within a model of disaster risk determination, there is a significant association is between the increase in natural disasters and population exposure, represented by population densities. Population vulnerability also matters, but increasing incomes seem to be associated first with greater and then lesser vulnerability. Finally, there is a significant association between climate-related hazards (greater precipitation linked to floods and storms and especially higher temperature linked to droughts and heat waves) and the frequency of intense natural disasters in Asia and the Pacific and its subregions during 1971–2010. Along with the scientific association between greenhouse gases and the changes in the climate, the findings in this paper suggest a connection between increasing natural disasters in Asia and the Pacific and man-made emissions of greenhouse gases in the atmosphere. Keywords: natural disasters, intense disaster climate change, hazard, exposure, vulnerability, precipitation, temperature, tropical cyclone, typhoon, Philippines JEL classification: Q54, Q56, Q58, C23


I. INTRODUCTION
The rising frequency of intense natural disasters, which are defined as those causing at least 100 deaths or affecting the basic survival needs (e.g., food, water, shelter, and sanitation) of at least 1,000 people—motivates this paper. Recent floods and storms in Australia, India, Indonesia, Pakistan, the Philippines, and Thailand have wreaked havoc. Some have also shaken up regional and global economies—the great floods of 2011 in Thailand cost the economy an estimated $45.5 billion (over 13% of gross domestic product [GDP]) in losses and damages (World Bank 2012a). These disasters are threatening to erode the otherwise striking progress in poverty reduction of recent decades in Asia and the Pacific.
It is hydrometeorological (e.g., floods, storms) and climatological disasters (e.g.,
droughts), rather than the geophysical disasters (e.g., earthquakes and volcanic eruptions), that have been trending upwards in recent decades. This pattern suggests, but obviously does not prove, a possible connection with man-made climate change. This possible connection has received widespread attention (Grinsted, Moore, and Jevrejeva 2013). Some research suggests that there is a relationship (United Nations International Strategy for Disaster Reduction [UNISDR] 2011, World Bank 2010). Others have taken the view (Economist Intelligence Unit [EIU] 2012) that only the damage costs—and not the climate hazards themselves—are rising, largely because of increasing populations and higher infrastructure costs, rather than because of climate change.
This paper is written in the context of development in Asia and the Pacific,1 where
natural disasters play a visible role in hindering and slowing socioeconomic progress (Maplecroft 2012, Independent Evaluation Group [IEG] 2006, World Bank 2011). Disaster management involves a number of socioeconomic and climatic factors. Within this broad context, the paper examines the apparent contribution of climate factors to disaster trends.
This paper does not reexamine the causal chain from greenhouse emissions to
atmospheric concentrations, to changes in climate variables such as temperature and precipitation. There is a great deal of research on the science of climate change (Hansen and Sato 2012; Huber and Knutti 2012; Knutson et al. 2010; and Trenberth 2011), and we do not seek to replicate or extend it. Rather, the paper commences with the observed changes in climatic variables in Asia and the Pacific, and then explores whether there is a statistical relationship between these changes in climate variables and the frequency of intense natural disasters.
There are other limitations as well. A large body of research has been conducted on
disaster management (Intergovernmental Panel on Climate Change [IPCC] 2012, IEG World Bank 2006). But disaster management is not our focus. Nor does the paper examine the impact of simultaneous disasters or their cumulative effects, such as floods in the Philippines or tsunamis in Japan, or the broader impact of disasters in other places, such as the fires in the Russian Federation in 2010 that pushed up international wheat prices.
The paper is structured as follows. Section II sets out a framework for analysis, based on
the IPCC’s disaster risk framework, focusing on the key idea that natural disaster risk is affected by hazards, exposure to those hazards, and vulnerability to their effects. Section III presents an overview of natural disaster data and trends globally, and in Asia and the Pacific. It notes that the overall trend of increasing disasters is largely due to greater frequency of intense
1 In this paper, Asia and the Pacific comprises all the economies of Asia, Australia, and the Pacific island nations.

2 І ADB Economics Working Paper Series No. 358
hydrometeorological events (floods and storms), rather than geophysical events. Section IV uses the disaster risk framework presented in Section II to examine how the risks of intense climate-related disasters in Asia and the Pacific might be connected to demographic factors, socioeconomic and environmental degradation, and climate anomalies. Section V complements the regional review with a description of the likely impact of climate and disasters in the Philippines. The final section presents some implications.
II. FRAMEWORK
A great deal of work has gone before in understanding natural disasters and the contributors to the risk of their occurrence. We bring together elements of the literature and experience that shed light on the disaster phenomenon, with special attention to the role climate might be playing. A. Disaster Risk and Climate Change Figure 1 illustrates the framework used in this paper for examining climate-related disaster risks. Three conceptual links would need to be established to show a relationship between human greenhouse gas (GHG) emissions and natural disasters. First, it would need to be established that GHG emissions (and hence increased atmospheric concentrations) affect climate variables such as average temperature and precipitation. Second, it must be established that there is a relationship between average temperatures and precipitation and the emergence of climate-related hazards. Third, it must be established that an increase in climate-related hazards aggravates natural disasters, either in their frequency or severity.
The first and second of these links are shown by the two solid arrows in Figure 1. The
third link could be established by teasing out the different contributions of the three elements of natural disaster risk shown in the “exposure–vulnerability–hazard” model of the IPCC (2007 and 2012). This model shows that population exposure and vulnerability together can turn a natural hazard into a natural disaster.2 Disaster risk is defined as the expected value of losses (deaths, injuries, property, and others) that a hazard might cause.3 Disaster risk is therefore a function of the three elements: (i) the hazard itself; (ii) the population exposed to the hazard; and (iii) the community’s ability to withstand its impact (vulnerability).
Are observed increases in temperature and precipitation the result of human activities,
particularly the emissions of GHGs? A great deal of scientific research addresses this question, and this paper does not provide any new evidence; instead we provide a brief review of the existing literature. Humans are emitting GHGs into the Earth’s atmosphere at a substantial and increasing rate—currently over 30 billion tons of carbon dioxide (CO2) per annum are emitted (United States [US] Environmental Protection Agency 2010), along with a range of other GHGs, the most important of which are methane (CH4) and nitrous oxide (NO2).
2 IPCC (2012) defines exposure as the presence of people, livelihoods, environmental services and resources,
infrastructure, or economic, social, or cultural assets in places that could be adversely affected. It defines vulnerability as the propensity or predisposition to be adversely affected.
3 Disaster risk, according to the United Nations International Strategy for Disaster Reduction, refers to “potential disaster losses, in lives, health status, livelihoods, assets and services, which could occur to a particular community or a society over some specified future time period.” See http://www.unisdr.org/we/inform/terminology

Climate-Related Disasters in Asia and the Pacific І 3
Figure 1: Greenhouse Gases, Climate, and Disaster Risk
Source: Adaptation of Figure SPM.1 in Intergovernmental Governmental Panel on Climate Change (2012).
As a result of these emissions, GHG concentrations in the atmosphere have also been
rising consistently, as indicated by annual mean atmospheric CO2 emissions data measured by the Scripps CO2 Program at the Mauna Loa Observatory in Hawaii (Figure 2).
Figure 2: Carbon Dioxide (CO2) Atmospheric Concentrations (ppm) Mauna Loa Observatory (1971–2010)
ppm = parts per million.
Source: CO2 stock data from the Carbon Dioxide Information Analysis Center.
Increased concentrations of GHGs in the atmosphere would be expected to trap more
heat on Earth and lead to a gradual increase in global average temperatures. The IPCC (2007) concluded that observed temperature increases of 0.76 degrees celcius (°C) over the last 150
IntenseClimate-related
Hazards
GreenhouseGases
Temperature Precipitation
“climate change”
DisasterRisk
Exposure Vulnerability
200
300
400
500
1970 1980 1990 2000 2010

4 І ADB Economics Working Paper Series No. 358
years could not be attributed solely to natural variability; human-induced GHG emissions are a key driver of temperature increases.4
Finally, as average temperatures rise, average rainfall would be expected to increase.
Precipitation is a local phenomenon, however, and is highly variable both spatially and temporally. The IPCC (2007) notes that overall, “long-term trends [in precipitation] have not been observed” in some regions, while at the same time there have been “statistically significant trends in the number of heavy [or extreme] precipitation events” in other regions, especially over the second half of the 20th century. B. Extreme Temperatures and Precipitation To connect GHG emissions with natural disasters, it is not enough to show that the increase in concentrations of GHGs in the Earth’s atmosphere has led to increased temperature or precipitation. A relationship between GHGs and climate-related hazards—extreme temperatures and precipitation—is required. Do GHG emissions also lead to increased climate hazards in the form of extreme precipitation and temperatures?
A special report of the IPCC (2012) was rightly cautious in its conclusions about the
relationship between climate change and extreme events, stating that “long-term trends in economic disaster losses adjusted for wealth and population increases have not been attributed to climate change, but a role for climate change has not been excluded." While there is yet to be any evidence of any long-term relationship between GHGs and average precipitation, however, a recent worldwide review of global rainfall data by Westra, Alexander, and Zwiers (2012), concludes that “rainfall extremes are increasing on average globally.” Their study indicates that this trend is strongly related with rising global atmospheric temperature. Specifically, they found that “there is a 7% increase in extreme rainfall intensity for every degree [centigrade] increase in global atmospheric temperature.” Other research has found that the increased occurrence of extreme precipitation is causally related to anthropogenic GHG emissions (O'Gorman and Schneider 2009, Min et al. 2011).5 Extreme precipitation has also been causally linked to changes in global temperature (Lenderink and van Meijgaard 2010, Trenberth 2011).6
Research in the area of climate-related disasters can be controversial. Very recently,
Sander et al. (2013) argued that there is a relationship between climate change and thunderstorms in the US, although they note that final attribution is not possible. The hypothesized causal mechanism is that increased temperatures lead to increased humidity, greater thunderstorm variability, and hence, greater losses. However, Pielke (2013) observes that humidity has not increased over the relevant period (1973–1999) in the area where most US thunderstorm activity and damage has occurred.
4 Section 9 of the IPCC’s 4th Assessment Report on the “Physical Science Basis” discusses various Bayesian
statistical methods of analysis, such as “optimal fingerprinting”, for detecting the effects of GHG emissions. Earlier efforts were made to detect GHG-induced climate change statistically (Hasselmann et al. 1993, Hegerl et al. 1996).
5 More generally, the impacts of climate change, and how human factors influence these impacts, have also been discussed in Schreider, Smith, and Jakeman (2000); Haines et al. (2006); McGranahan, Balk, and Anderson (2007); Kundzewicz et al. (2008); and the World Bank (2010, 2012b).
6 An example of the natural variability of the climate system is the fluctuation of sea surface temperatures in the tropical eastern Pacific, called the El Niño–Southern Oscillation (ENSO). The extremes of the ENSO pattern—El Niño (warming) and La Niña (cooling)—cause extreme weather (such as floods and droughts) in many world regions. The warm phase typically accompanies high air surface pressure in the western Pacific. Through ENSO, oceans store and release heat, and therefore also influence measured global surface temperatures.

Climate-Related Disasters in Asia and the Pacific І 5
Past research has estimated the impact of climate change on the probability of particular hazards, such as the 2003 European heat wave (Stott, Stone, and Allen 2004), the 2010 Moscow heat wave (Rahmstorf and Coumou 2011), and droughts in the Mediterranean areas (Hoerling et al. 2012). Stott, Stone, and Allen (2004) found that it is very likely that human influence has at least doubled the risk of a heat wave exceeding a mean summer temperature threshold magnitude which is below the temperature recorded during the 2003 European heat wave. Similarly, Rahmstorf and Coumou (2011) found that human-induced climate change would be expected to have increased the likelihood of the 2010 Moscow heat wave.
Hoerling et al. (2012) found that half the magnitude of increased wintertime droughts in
the Mediterranean can be attributed to anthropogenic GHG and aerosol forcing. Pall et al. (2011) also estimated the contribution of GHG emissions to flood risks in England and Wales, where they found that human-induced emissions in the 20th century increased the risk of floods by more than 20% in nine out of ten cases and, by more than 90% in two out of three cases. The findings of this climate research point to the same conclusion: the overall frequency of various extreme events will continue to rise.
Data for Asia and the Pacific also present certain trends. Temperature anomalies during
the months when these intense disasters occur are increasing. Precipitation deviations from normal during the months when these events occur also appear to change in distribution across decades (Figure 3), with tests for homogeneity of variance indicating highly significant heterogeneity. Average monthly temperature anomalies recorded during climatological disasters (droughts) in Asia and the Pacific appear to have shifted distribution over the last few decades (see Figure 3a).
Figure 3: Distribution of Mean Temperature Anomalies and Average Deviations from
Normal during Months of Hydrometeorological Disasters in Asia and the Pacific
Source: Result of merging hydrometeorological disaster data from EM-DAT with monthly temperature anomalies from the Climate Research Unit’s HADCRUT3 database (2012), and monthly precipitation data from the Global Precipitation Climatology Centre (2011).
0
2
4
6
8
−4 −2 0 2 4 −4 −2 0 2 4 −4 −2 0 2 4 −4 −2 0 2 4
1971–1980 1981–1990 1991–2000 2001–2010
Freq
uenc
y
0
2
4
6
8
0 200 400 600 0 200 400 600 0 0200 400 600 200 400 600
1971–1980 1981–1990 1991–2000 2001–2010
Freq
uenc
y
(a) Average Monthly Temperature Anomalies
(b) Average Monthly Precipitation Deviations from Normal

6 І ADB Economics Working Paper Series No. 358
Overall, there is a growing suggestion of a connection between human GHG emissions and the increase in extreme temperatures and precipitation, or “climate-related” hazards. However, this evidence does not necessarily imply that there is a causal connection between climate change and an increase in natural disasters. In order to examine this issue in the Asia and Pacific context, this paper returns to the framework in Figure 1 to disentangle the effects of increases in hazard from increases in exposure and vulnerability. C. Hazards, Exposure, and Vulnerability The framework outlined in Figure 1 is particularly helpful in identifying the separate drivers of natural disaster risk in a mutually exclusive and multiplicative fashion. For instance, a climate-related hazard, such as heavy rain or drought, might not create a natural disaster if people are not exposed (e.g., are not present in the area) where the hazard strikes. A moderate storm in a densely populated city may pose greater risk than an intense storm in a remote farm area. And there is no disaster if all the people exposed can immediately bounce back or use backup systems to return to business as usual. We consider each of these three elements of disaster risk—vulnerability, exposure, and hazards—in turn.
The concept of “vulnerability” to a hazard has several dimensions, including economic,
social, cultural, environmental, and psychological.7 Vulnerability is a function of wealth and other demographic and socioeconomic factors. The poor, who often have less adaptive capacity, are frequently more vulnerable to climate-related hazards (Kim 2012, Carter et al. 2007). As an Australian folk song has it: “Bare legged Kate, when the floods come down, it's the poor on the creeks are the ones who drown.” The poor are more vulnerable due to lack of information, skills, technology, infrastructure, and social capital. Flash floods commonly cause more fatalities in poorer communities than those better off. And when people living in risk-prone areas depend on their livelihoods on activities directly affected by such hazards, it can amplify the disaster risk and damage (IEG World Bank 2006).
Exposure is a more straightforward notion. It covers both the direct effects (e.g., property
damage or death) and the indirect effects (e.g., increase in food prices) from a hazard. Exposure is increasing as more and more people in Asia and the Pacific locate themselves in hazardous areas such as booming megacities, on deltas, or along coastlines and rivers (UNISDR 2012, Kim 2012). Entire new settlements may be built in harm’s way, where even basic infrastructure is lacking, and disaster management may not seem urgent until the next lethal event occurs.
Vulnerability and exposure are distinct concepts. People may be exposed to disasters
because they reside in hazard-prone areas, but with high adaptive capacity they may have low vulnerability. Conversely, others may not reside in hazard-prone areas, but may still be vulnerable to the direct or indirect effect (e.g., on prices) of a particular event. The concepts of vulnerability and exposure (to a lesser extent) are also related to concepts of climate resilience and adaptive capacity. Resilience refers to the ability of people to bounce back to pre-disaster conditions after a disaster. Adaptive capacity refers to the maintenance of certain structures and functions despite disturbances caused by a disaster. Both resilience and adaptive capacity help people to plan for, cope with, resist, and recover from disaster losses.
7 There are varying models and frameworks of vulnerability (see Cutter et al. 2009). While these dimensions can
be contextual, there are also common elements across time, space, and scale. See Kelly and Adger 2000, Turner II et al. 2003, Thomalla et al. 2006, Füssel and Klein 2006, Smith and Wandel 2006, O’Brien et al. 2007, and Internal Disaster Monitoring Centre 2009.

Climate-Related Disasters in Asia and the Pacific І 7
Finally, without a natural hazard in the first place, there would be no natural disaster.8 Natural hazards include climate-related hazards, namely extreme precipitation (causing storms and floods) and extreme temperatures (and thus droughts, wildfires, or heat waves). Basic atmospheric physics suggests that there is a connection between these two hazards. If the temperature rises, the moisture-holding capacity of the atmosphere increases, which can indeed result in increased water content in the atmosphere, and may lead to increased precipitation.
As noted above, there are data and growing analytical evidence to support both the
existence of the climate-related hazards of higher temperatures and precipitation, and their connection with GHG emissions. Given the increase in climate-related hazards, exposure and vulnerability, the observed increase in natural disasters would be expected. The key challenge is determining the relative contributions of the three drivers, which this paper attempts in Section IV. Prior to that, in Section III we review data and trends concerning natural disasters.
III. NATURAL DISASTER CLASSIFICATIONS AND TRENDS
Reports indicate a significant rise in the frequency of natural disasters over the past 2 decades (Jennings 2011, Guha-Sapir 2011, Munich Re 2012, Hoeppe 2007, and IEG World Bank 2006). Many of these reports use disaster information sourced from the Emergency Event Database (EM-DAT) of the Centre for Research on the Epidemiology of Disasters (CRED), which is widely considered the most comprehensive, publicly available database on natural disasters.9
The EM-DAT classifies natural disasters into five disaster subgroups: a. geophysical (earthquakes, volcanoes, and dry mass movements), b. meteorological (storms), c. hydrological (floods and wet mass movements), d. climatological (extreme temperature changes, such as drought and wildfire), and e. biological (epidemics, insect infestations, and animal stampedes). In this paper, climate-related disasters comprise meteorological, hydrological, and
climatological subgroups. Improved disaster reporting arising out of better information and communications
technology can affect data on disaster events and their costs. A more extreme view (Kirschenbaum 2004) even suggests that some of the increase in events results from the widespread establishment of disaster management agencies, which dramatize mere incidents into full-fledged disasters.
Jennings (2011) and Thomas (2011) examined the trends in the frequency of natural
disasters as reported in EM-DAT and suggest that even after the figures on the frequency of disasters are adjusted for reporting biases, and rising population, the rise in the frequency of natural disasters is notable.
8 Disasters are conventionally categorized as either natural or man-made. For instance, insurance determines
whether a disaster is an “act of God or man.” Strictly speaking, however, all disasters can be associated with human actions or inaction to some degree. For instance, if humans take wise or effective action in confronting known hazards, hazards need not develop into disasters.
9 CRED defines disaster as “a situation or event which overwhelms local capacity, necessitating a request to a national or international level for external assistance; an unforeseen and often sudden event that causes great damage, destruction and human suffering.”
8 І ADB Economics Working Paper Series No. 358
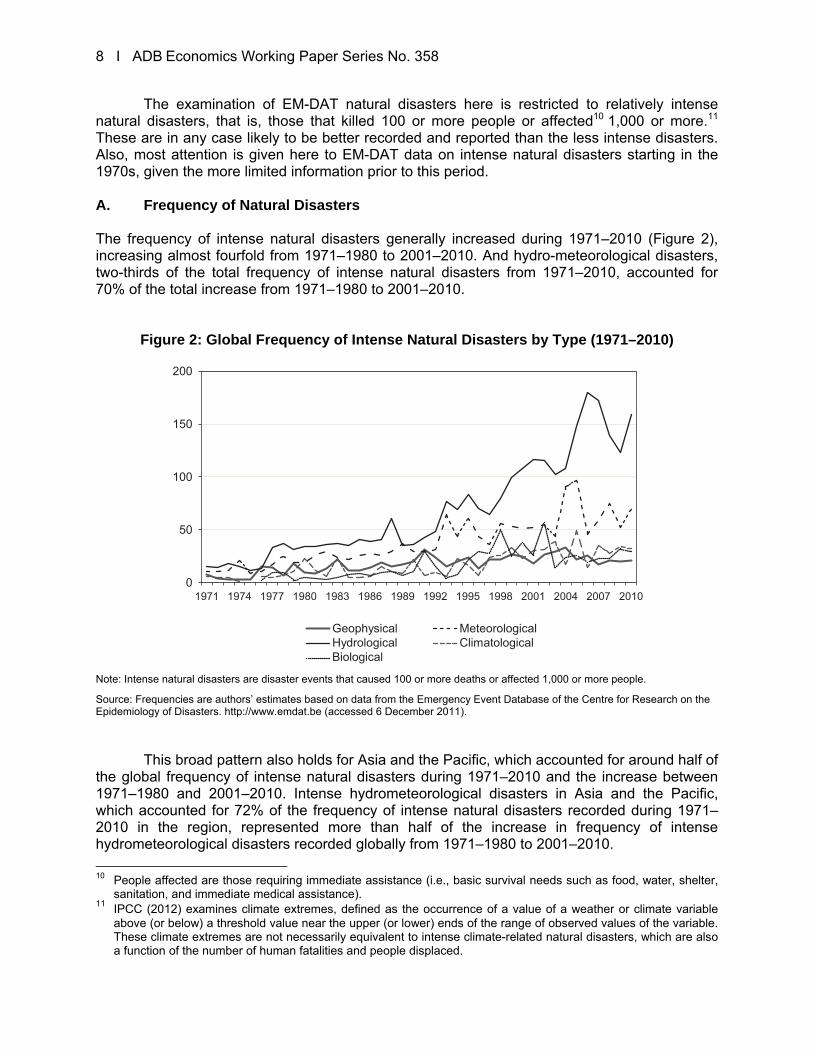
The examination of EM-DAT natural disasters here is restricted to relatively intense natural disasters, that is, those that killed 100 or more people or affected10 1,000 or more.11 These are in any case likely to be better recorded and reported than the less intense disasters. Also, most attention is given here to EM-DAT data on intense natural disasters starting in the 1970s, given the more limited information prior to this period. A. Frequency of Natural Disasters The frequency of intense natural disasters generally increased during 1971–2010 (Figure 2), increasing almost fourfold from 1971–1980 to 2001–2010. And hydro-meteorological disasters, two-thirds of the total frequency of intense natural disasters from 1971–2010, accounted for 70% of the total increase from 1971–1980 to 2001–2010.
Figure 2: Global Frequency of Intense Natural Disasters by Type (1971–2010)
Note: Intense natural disasters are disaster events that caused 100 or more deaths or affected 1,000 or more people.
Source: Frequencies are authors’ estimates based on data from the Emergency Event Database of the Centre for Research on the Epidemiology of Disasters. http://www.emdat.be (accessed 6 December 2011).
This broad pattern also holds for Asia and the Pacific, which accounted for around half of
the global frequency of intense natural disasters during 1971–2010 and the increase between 1971–1980 and 2001–2010. Intense hydrometeorological disasters in Asia and the Pacific, which accounted for 72% of the frequency of intense natural disasters recorded during 1971–2010 in the region, represented more than half of the increase in frequency of intense hydrometeorological disasters recorded globally from 1971–1980 to 2001–2010.
10 People affected are those requiring immediate assistance (i.e., basic survival needs such as food, water, shelter,
sanitation, and immediate medical assistance). 11 IPCC (2012) examines climate extremes, defined as the occurrence of a value of a weather or climate variable
above (or below) a threshold value near the upper (or lower) ends of the range of observed values of the variable. These climate extremes are not necessarily equivalent to intense climate-related natural disasters, which are also a function of the number of human fatalities and people displaced.
0
50
100
150
200
1971 1974 1977 1980 1983 1986 1989 1992 1995 1998 2001 2004 2007 2010
GeophysicalHydrologicalBiological
MeteorologicalClimatological
Climate-Related Disasters in Asia and the Pacific І 9
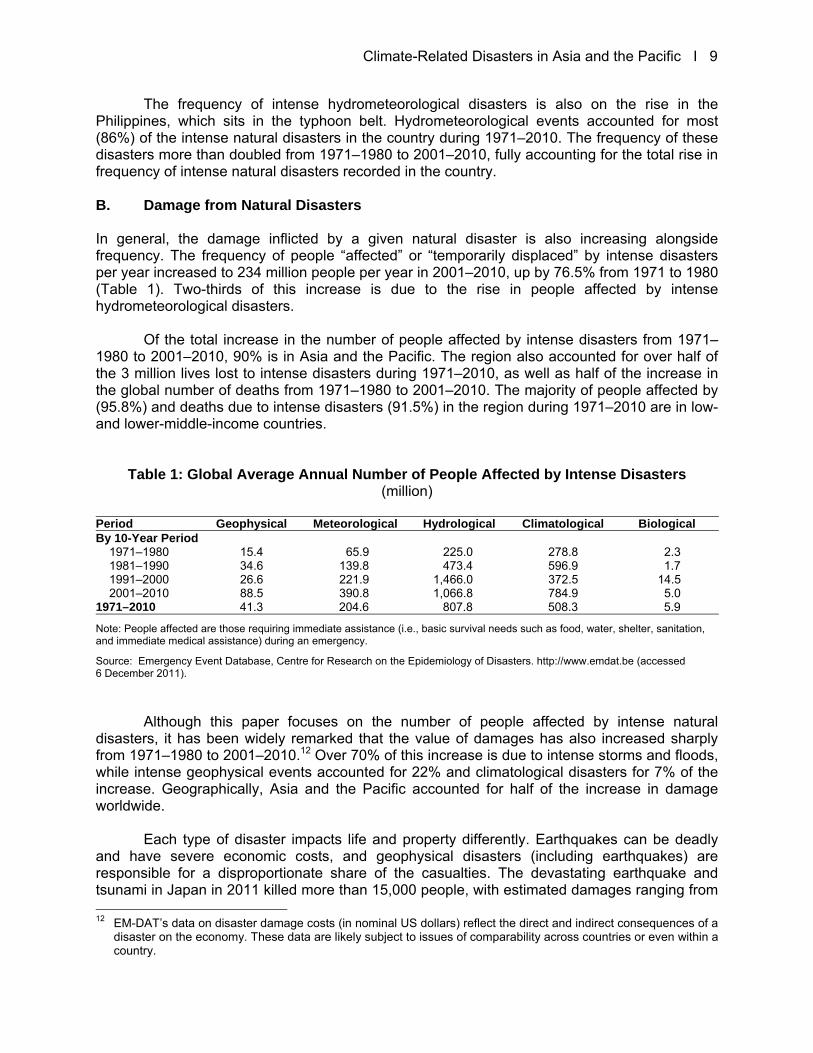
The frequency of intense hydrometeorological disasters is also on the rise in the Philippines, which sits in the typhoon belt. Hydrometeorological events accounted for most (86%) of the intense natural disasters in the country during 1971–2010. The frequency of these disasters more than doubled from 1971–1980 to 2001–2010, fully accounting for the total rise in frequency of intense natural disasters recorded in the country. B. Damage from Natural Disasters In general, the damage inflicted by a given natural disaster is also increasing alongside frequency. The frequency of people “affected” or “temporarily displaced” by intense disasters per year increased to 234 million people per year in 2001–2010, up by 76.5% from 1971 to 1980 (Table 1). Two-thirds of this increase is due to the rise in people affected by intense hydrometeorological disasters.
Of the total increase in the number of people affected by intense disasters from 1971–1980 to 2001–2010, 90% is in Asia and the Pacific. The region also accounted for over half of the 3 million lives lost to intense disasters during 1971–2010, as well as half of the increase in the global number of deaths from 1971–1980 to 2001–2010. The majority of people affected by (95.8%) and deaths due to intense disasters (91.5%) in the region during 1971–2010 are in low- and lower-middle-income countries.
Table 1: Global Average Annual Number of People Affected by Intense Disasters (million)
Period Geophysical Meteorological Hydrological Climatological BiologicalBy 10-Year Period 1971–1980 15.4 65.9 225.0 278.8 2.3 1981–1990 34.6 139.8 473.4 596.9 1.7 1991–2000 26.6 221.9 1,466.0 372.5 14.5 2001–2010 88.5 390.8 1,066.8 784.9 5.0 1971–2010 41.3 204.6 807.8 508.3 5.9
Note: People affected are those requiring immediate assistance (i.e., basic survival needs such as food, water, shelter, sanitation, and immediate medical assistance) during an emergency.
Source: Emergency Event Database, Centre for Research on the Epidemiology of Disasters. http://www.emdat.be (accessed 6 December 2011).
Although this paper focuses on the number of people affected by intense natural
disasters, it has been widely remarked that the value of damages has also increased sharply from 1971–1980 to 2001–2010.12 Over 70% of this increase is due to intense storms and floods, while intense geophysical events accounted for 22% and climatological disasters for 7% of the increase. Geographically, Asia and the Pacific accounted for half of the increase in damage worldwide.
Each type of disaster impacts life and property differently. Earthquakes can be deadly
and have severe economic costs, and geophysical disasters (including earthquakes) are responsible for a disproportionate share of the casualties. The devastating earthquake and tsunami in Japan in 2011 killed more than 15,000 people, with estimated damages ranging from 12 EM-DAT’s data on disaster damage costs (in nominal US dollars) reflect the direct and indirect consequences of a
disaster on the economy. These data are likely subject to issues of comparability across countries or even within a country.

10 І ADB Economics Working Paper Series No. 358
$122 billion to $235 billion, or 2.5%–4.0% of GDP (Thomas 2011). Floods, which may accompany storms, can damage infrastructure, displace people, and hurt livelihoods; but floods are commonly less deadly and more amenable to forecasting than earthquakes. In consequence, adaptation to floods can go beyond mere disaster relief to disaster prevention.
IV. ECONOMETRIC ANALYSIS OF DISASTER RISK FACTORS
We now examine the role played by the three principal elements of natural disaster risk. We define disaster risk as the expected impact, in number of deaths or people affected (i.e., requiring immediate assistance with basic survival needs such as food, water, shelter, sanitation, or medical assistance) during an emergency, of natural disasters in a given future period. There are other definitions. For instance, much research defines disaster risk as the probable level of damages in US dollars, based on historical data. However, measuring the impact of natural disaster in monetary terms involves a number of data issues, chiefly regarding accuracy, because of the lack of standards for comparable estimation across economies or across disasters within an economy.
The frequency of intense climate-related disasters is higher in Asia and the Pacific than
other regions (World Bank 2010, IFRC 2010). Similarly, the magnitude of intense, climate-related disasters is also highest in Asia and the Pacific. According to EM-DAT data, Bangladesh, the People’s Republic of China, India, Myanmar, the Philippines, and Viet Nam are at exceptional risk (see Figures 11 and 12 in Thomas, Albert, and Perez 2012). A. Data and Methods This paper uses the framework in Figure 1 to identify the role of population exposure, vulnerability, and climate-related hazards in explaining the rising frequency of intense climate-related disasters in Asia and the Pacific.13 The dependent variables in the analysis, and , are the annual frequencies of intense hydrometeorological and climatological natural disasters that killed 100 or more people or affected 1,000 or more in country in year , respectively. Data are obtained for 1970–2010 from EM-DAT.
13 Only natural disaster observations reported in EM-DAT with information on either the number of people affected or
killed are counted; those with missing information on both indicators are not counted. EM-DAT provides information on the total number of people affected or killed per disaster only. As such, for observations involving multi-year disasters or disasters that occur in a country and last for over a year, we use the information on total number of people affected or killed per disaster as follows: a disaster that affected 2,000 people in 2 years (1995–1996) is considered as an intense disaster in both years. Meanwhile, if the disaster affected only a total of 1,500 people, it is considered an intense disaster in 1995, but not in 1996. Finally, for years with no disaster observations reported in EM-DAT, the number of disasters is set to zero. Data accessed from the EM-DAT website (http://www.emdat.be/) in December 2011.

Climate-Related Disasters in Asia and the Pacific І 11
As both dependent variables are count variables, two count models—the negative binomial model and Poisson regression model—were employed on an annual panel of data from 56 economies14 in Asia and the Pacific, covering 1971–2010. The Poisson model was employed for climatological natural disasters, , because the necessary equidispersion assumption was satisfied (i.e., the mean of the count variable is equal to its variance). For hydrometeorological natural disasters, , likelihood ratio tests indicated overdispersion,15 so the negative binomial regression was more appropriate. 16 Specifically, we estimated the following equations with random and country fixed-effects17:
| , , , exp exp (1)
| , , , , exp (2)
The explanatory variables , , , , are: a. population exposure ) or the degree to which people are in harm’s way; b. vulnerability ) or the population’s capability to address the problem; and c. the climate-related hazard, specifically water-related anomalies or deviation from
the mean ) and temperature anomalies or deviation from the mean ) in a given year. While equation (2) incorporates temperature as an independent variable, equation (1) does not, reflecting the assumption that temperature is more directly related to climatological disasters than hydrometeorological disasters.
The regression also includes total population per country in the relevant year as a
control variable. Even though population density is already included as an independent variable, this may not pick up the possibility that frequency of natural disasters surpassing the “intense” reporting threshold (i.e., at least 100 deaths or at least 1,000 people affected due to a
14 A summary of the descriptive statistics for the variables used in the regressions is provided in Appendix Table 1.
Economies in the sample include (East Asia, seven economies) Hong Kong, China; Democratic People’s Republic of Korea; Japan; Macao, China; Mongolia; People’s Republic of China; and the Republic of Korea; (South Asia, eight economies) Afghanistan, Bangladesh, Bhutan, India, Iran, Nepal, Pakistan, and Sri Lanka; (Southeast Asia, 11 economies) Brunei Darussalam, Cambodia, Indonesia, the Lao People’s Democratic Republic, Malaysia, Myanmar, the Philippines, Singapore, Thailand, Timor-Leste, and Viet Nam; (Central Asia, 22 economies) Armenia, Azerbaijan, Bahrain, Cyprus, Georgia, Iraq, Israel, Jordan, Kazakhstan, Kuwait, the Kyrgyz Republic, Lebanon, Occupied Palestinian Territory, Oman, Qatar, Saudi Arabia, Syrian Arab Republic, Tajikistan, Turkmenistan, United Arab Emirates, Uzbekistan, Yemen; (the Pacific Asia, eight economies) Australia, Fiji, Kiribati, New Caledonia, New Zealand, Papua New Guinea, Solomon Islands, and Vanuatu.
15 In our dataset, the Likelihood ratio (LR) tests reject the hypothesis that coefficient of dispersion ( ) is equal to zero (Ho: = 0) at 1% level of significance in all specifications involving intense hydrometeorological disasters (see bottom row of Table 2), but not in those that involve climatological disasters.
16 The standard negative binomial regression is derived from the Poisson model by adding an independently distributed error term (ε). It allows the mean to differ from the variance of the count variable such that variability of
is assumed to be equal to the mean: | | 1 | where | exp and is a measure of dispersion. When is not significantly greater from zero (i.e., no
overdispersion), the negative binomial model reduces to the Poisson model. The negative binomial regression model is more efficient when is significantly different from zero (i.e., the count outcome data is over dispersed).
17 Fixed-effects negative binomial panel regression models can be estimated as either unconditional (all parameters estimated) or as conditional (the estimation is conditional on the value of a sufficient statistic for one or more parameters). However, the conditional fixed effects model is not a true fixed effects model because it does not control for unchanging covariates or the variables that are possibly predictive of the outcome under study (Allison and Waterman 2002). Hence, this paper uses an unconditional fixed effects negative binomial regression. For a more detailed discussion on the negative binomial panel regression model see Hilbe (2011), Baum (2006), or Hamilton (1994).

12 І ADB Economics Working Paper Series No. 358
natural disaster) would be higher when the overall population increases. The term ( ) represents the error from unobserved heterogeneity.
Population exposure ( ), is measured by the logarithm of population density (people
per square kilometer) per country. 18 This follows studies such as Birkmann (2007) and Taubenbock et al. (2008), which suggest population density as a demographic vulnerability measure. However, this is only a proxy for the actual population exposed to any given natural hazard in a particular country. One limitation of using national population density is that it does not account for distribution of people within the country. For instance, a country with densely populated coastal areas might have low national density because of the presence of large uninhabited areas in some of the countries, such as deserts, rain forests, and so on. Thus, for instance, national population density will mute the effect of internal migration and urbanization trends observed over the period in most of the countries studied. In future research, one might consider supplementing a national population density measure with the ratio of urban to rural populations or rates of growth of urban population. As shown in Figure 3a, population density has steadily increased in the past 4 decades.
Figure 3: Average Population Density and Real Income per Capita in Asia and the Pacific (1971–2010)
(a) Population Density (b) GDP per Capita (people per km2) (constant 2000 $)
km2 = square kilometer.
Note: Figures show data for 40 countries with complete time-series data only.
Source: Population Density and GDP per capita data are from the World Bank’s World Development Indicators (WDI) Online accessed 14 January 2012 (http://databank.worldbank.org).
On vulnerability ( ), cross-country experience suggests a split in the degree to which
people are affected depending on incomes broadly and poverty specifically (Kellenberg and Mobarak 2008, Kahn 2005). Initially, we use the national logarithm of real income per capita as proxy for economic vulnerability. We also report results when we add the square of the national logarithm of real income per capita to capture the expected nonlinear, inverted-U relationship between natural disasters and average income. This allows for the possibility that as income per capita initially increases, greater economic activity and associated environmental degradation make the population more vulnerable to natural disasters (i.e., likely to be killed or affected). After reaching a certain level of development, as income per capita grows further, the
18 Population density in natural logarithm has greater explanatory power (i.e., explains more variance) than its level.
60
80
100
120
140
1970 1980 1990 2000 20102,000
4,000
6,000
8,000
10,000
1970 1980 1990 2000 2010
Climate-Related Disasters in Asia and the Pacific І 13
economies and individuals are more capable of investing in disaster mitigation measures, and hence the risk of being “affected” declines.
We also consider the use of poverty incidence as a proxy for economic vulnerability.
However, since poverty statistics are not generated frequently enough across countries, we can only approximate vulnerability by a low poverty incidence dummy variable that is set to “1” if the average poverty head count ratio or the proportion of people living below $1.25 purchasing power parity (PPP) a day for all the years with available data is below or a certain threshold. Otherwise, the vulnerability dummy variable takes a “0” value. However, the country fixed-effects model cannot efficiently estimate the effect of a time-invariant variable, such as this low poverty incidence dummy, on panel data.
For the water-related climate hazard, we employ data on annual average precipitation
deviation ( ) from the Global Precipitation Climatology Center (GPCC 2011). This variable is in some ways a closer measure of “climate change” than of “climate hazard.” Returning to Figure 1, an ideal analytical approach would be to use a more direct measure of frequency and intensity of the water-related hazard in this regression, and then separately tease out the relationship between climate change and the prevalence of climate hazards. The analytical approach in this paper effectively combines both steps into one, by directly exploring the explanatory power of the “climate change” variables on natural disaster risk. This is convenient, however, and is a standard climate indicator and it has the merit of being measured and monitored regularly.
For the temperature-related climate hazard, we similarly employ data on annual
average surface temperature anomalies or HADCRUT3 ( ) from the Met Office Hadley Centre and the Climate Research Unit at the University of East Anglia. Again, as per the earlier discussion, ideally a more direct measure of frequency and intensity of the heat-related hazard would have been employed, and then the relationship between this variable and the climate change variable explored separately. Again, the analytical approach here combines these two steps into one.
Average annual precipitation deviation (and temperature anomaly) is defined as the
average of the difference between the annual average rainfall (temperature) and the 30-year (1961–1990) average annual rainfall (temperature) in the same station in a country per year. Historical monthly data on precipitation deviations and temperature anomalies are available on a grid box basis. To generate the annual average precipitation deviation and temperature anomalies data for each country based on these datasets, minimum and maximum grid values by country available at the Food and Agriculture Office of the United Nations were used.
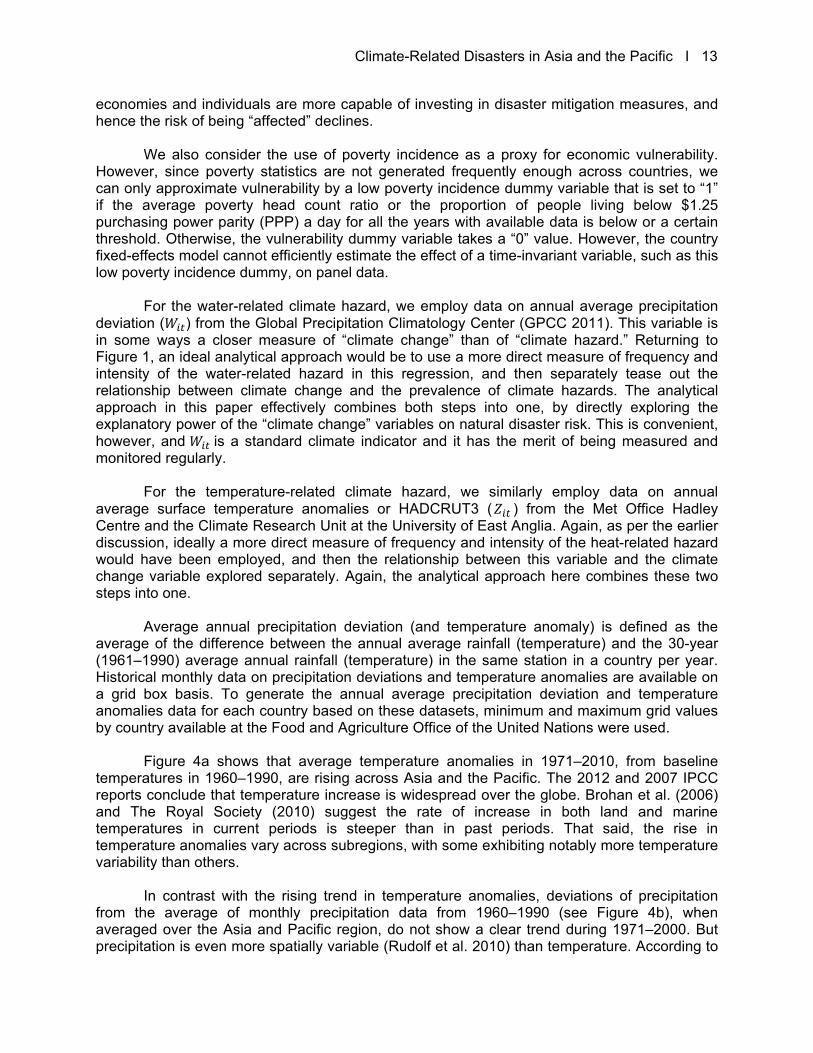
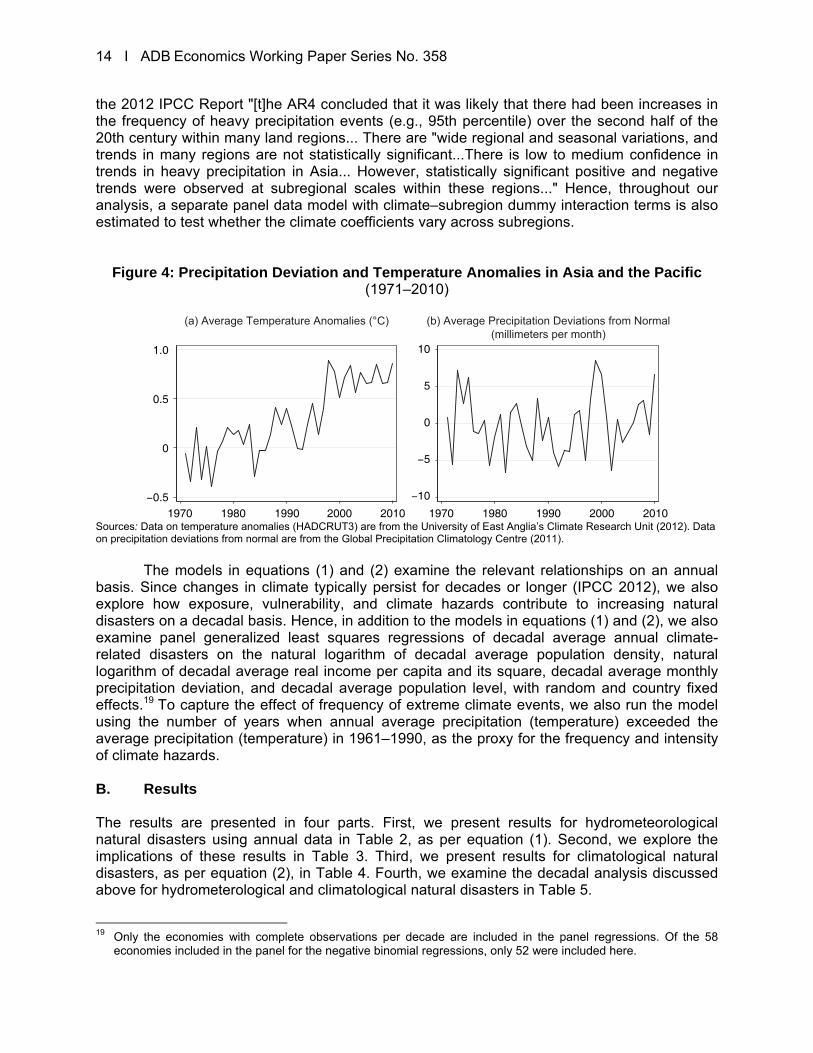
Figure 4a shows that average temperature anomalies in 1971–2010, from baseline
temperatures in 1960–1990, are rising across Asia and the Pacific. The 2012 and 2007 IPCC reports conclude that temperature increase is widespread over the globe. Brohan et al. (2006) and The Royal Society (2010) suggest the rate of increase in both land and marine temperatures in current periods is steeper than in past periods. That said, the rise in temperature anomalies vary across subregions, with some exhibiting notably more temperature variability than others.
In contrast with the rising trend in temperature anomalies, deviations of precipitation
from the average of monthly precipitation data from 1960–1990 (see Figure 4b), when averaged over the Asia and Pacific region, do not show a clear trend during 1971–2000. But precipitation is even more spatially variable (Rudolf et al. 2010) than temperature. According to
14 І ADB Economics Working Paper Series No. 358
the 2012 IPCC Report "[t]he AR4 concluded that it was likely that there had been increases in the frequency of heavy precipitation events (e.g., 95th percentile) over the second half of the 20th century within many land regions... There are "wide regional and seasonal variations, and trends in many regions are not statistically significant...There is low to medium confidence in trends in heavy precipitation in Asia... However, statistically significant positive and negative trends were observed at subregional scales within these regions..." Hence, throughout our analysis, a separate panel data model with climate–subregion dummy interaction terms is also estimated to test whether the climate coefficients vary across subregions.
Figure 4: Precipitation Deviation and Temperature Anomalies in Asia and the Pacific (1971–2010)
Sources: Data on temperature anomalies (HADCRUT3) are from the University of East Anglia’s Climate Research Unit (2012). Data on precipitation deviations from normal are from the Global Precipitation Climatology Centre (2011).
The models in equations (1) and (2) examine the relevant relationships on an annual
basis. Since changes in climate typically persist for decades or longer (IPCC 2012), we also explore how exposure, vulnerability, and climate hazards contribute to increasing natural disasters on a decadal basis. Hence, in addition to the models in equations (1) and (2), we also examine panel generalized least squares regressions of decadal average annual climate-related disasters on the natural logarithm of decadal average population density, natural logarithm of decadal average real income per capita and its square, decadal average monthly precipitation deviation, and decadal average population level, with random and country fixed effects.19 To capture the effect of frequency of extreme climate events, we also run the model using the number of years when annual average precipitation (temperature) exceeded the average precipitation (temperature) in 1961–1990, as the proxy for the frequency and intensity of climate hazards.
B. Results The results are presented in four parts. First, we present results for hydrometeorological natural disasters using annual data in Table 2, as per equation (1). Second, we explore the implications of these results in Table 3. Third, we present results for climatological natural disasters, as per equation (2), in Table 4. Fourth, we examine the decadal analysis discussed above for hydrometerological and climatological natural disasters in Table 5.
19 Only the economies with complete observations per decade are included in the panel regressions. Of the 58
economies included in the panel for the negative binomial regressions, only 52 were included here.
−10
−5
0
5
10
1970 1980 1990 2000 2010−0.5
0
0.5
1.0
1970 1980 1990 2000 2010
(a) Average Temperature Anomalies (°C) (b) Average Precipitation Deviations from Normal(millimeters per month)

Climate-Related Disasters in Asia and the Pacific І 15
Table 2 shows the results for the model in equation (1) with random and country-fixed effects, unpacking the drivers of hydrometeorological (storms, floods, etc.) natural disasters for Asia and the Pacific in the past 4 decades, using annual data. Results of generalized Hausmann specification tests (Hausman and Taylor 1981), as well as the strongly significant estimates for most country dummies, suggest the use of country fixed-effects, instead of random effects. These results confirm that there are country-specific factors (such as governance, quality of institutions) that are not related to primary risk factors, but contribute to the rise in intense climate-related disasters in the region.
We find a statistically significant relationship between the frequency of intense
hydrometeorological natural disasters and two of the three drivers—exposure and climate hazards. The relationship between disasters and exposure is strong. The relationship between natural disasters and climate hazards is statistically significant but less strong. We do not find significance in the relationship between natural disasters and the vulnerability variable.
Table 2: Determinants of the Frequency of Intense Hydrometeorological Disasters
in Asia and the Pacific Dependent Variable: Frequency of Intense Hydrometeorological Disasters (1971–2010)
Explanatory Variables
Random effects Country-fixed effects
(1) (2) (3) (4)Exposure Ln(population density) 0.2366 0.2409 1.1928*** 1.2429*** [0.148] [0.149] [0.255] [0.258] Vulnerability Ln(GDP per capita, constant 2000 $) 0.9213 0.9525 1.9222 1.9601 [1.460] [1.462] [1.242] [1.242] Square of Ln(GDP per capita, constant 2000 $) –0.0758 –0.0776 –0.1101 –0.1121 [0.100] [0.100] [0.086] [0.086] Climate hazard Average precipitation deviation 0.0111*** 0.0114*** 0.0062*** 0.0037*** [0.002] [0.002] [0.002] [0.001] Average precipitation deviation x East Asia –0.0086** 0.0074*** [0.004] [0.002] Average precipitation deviation x South Asia 0.0054 0.0127*** [0.004] [0.002] Average precipitation deviation x Central Asia 0.0497*** 0.0995*** [0.016] [0.026] Average precipitation deviation x Pacific –0.0021 –0.0014 [0.005] [0.005] Population (in million) 0.0023*** 0.0023*** –0.0002 –0.0003 [0.001] [0.001] [0.001] [0.001] Observations 1,685 1,685 1,685 1,685 Number of economies 58 58 58 58 Pseudo R-squared 0.099 0.100 0.369 0.372 Alpha 1.631 1.622 0.049 0.046 LR test of alpha=0 (Chi-bar, ) 691.9 679.7 9.032 8.180
Notes: *** significant at 1%. Figures are negative binomial panel regression results. An intercept term and country dummies are included but not reported here. The coefficient of ‘Average Precipitation Deviation’ in specifications (2) and (4) represents the coefficient for Southeast Asia― the reference subregion (omitted dummy). Robust country-cluster z statistics in brackets.
Source: Authors’ calculations.

16 І ADB Economics Working Paper Series No. 358
Exposure, proxied by population density, is a strongly significant driver of hydrometeorological natural disasters, both statistically and economically. Specifically, a 1% increase in population density is associated with a 1.2% increase in the frequency of intense hydrometeorological disasters (see columns 3 and 4 in Table 2). This suggests that all else equal, economies that are more densely populated are more likely to incur over 100 deaths or have over 1,000 people affected when a storm or flood hits.
Coefficients for vulnerability are not statistically significant. When vulnerability is proxied
by average income level, although we observe the hypothesized nonlinear inverted-U relationship between income and the frequency of intense disasters, the coefficients are not statistically significant. When vulnerability is proxied by a low poverty dummy, the coefficient estimates are not robust to changes in sample time periods (such as 1980–2010 or 1990–2010), or the use of different threshold levels for poverty head count ratio (such as 25% or 35%20).
Finally, the climate hazard variables are a significant determinant of the rise in the
frequency of intense disasters as well. Holding other variables constant, a unit increase in the annual average precipitation deviation from the 30-year average baseline rainfall (1960–1990) is associated with around a 0.6% increase in the frequency of intense hydrometeorological disasters across the economies in the region.
The relationship between frequency of intense hydrometeorological disasters and
average precipitation deviation remains positive and strongly significant when climate–subregion interaction terms are used (columns 2 and 4). The coefficient for average precipitation deviation varies across subregions. For example, results in column 4 suggest that a unit increase in the annual average precipitation deviation is associated with a 0.4% average increase in frequency of intense hydrometeorological disasters in Southeast Asia; 1.1% in East Asia (i.e., multiplying the sum of 0.0037 and 0.0074 by 100%); 1.6% in South Asia; 10.3% in Central Asia; and 0.2% in the Pacific. Except for the Pacific, all the coefficient estimates for the climate–subregion interaction terms are significantly different from zero. The coefficient estimates for average precipitation deviation remain positive and strongly significant when a time trend variable is included to control for other factors that affect the frequency of intense disasters and that are not directly observable but are highly correlated with time (e.g., location of population). The coefficient of the time trend variable is significant and positive across specifications (see Appendix Table 3).
In Table 3, we illustrate what this might mean for Asian and Pacific countries. Using the
coefficient estimates for average precipitation in the specification with the highest pseudo R-squared (column 4 in Table 2), we estimate the increase in the frequency of intense hydrometeorological disasters from the 2001–2010 levels for Indonesia, the Philippines, and Thailand under three scenarios. We use the observed increase in average precipitation deviation from 1991–2000 to 2001–2010 (8.33 millimeters [mm] per month) among economies in Southeast Asia21 for setting the possible increase in the average precipitation deviation under three scenarios: Scenario 1 (low increase) represents an increase in the deviation by 4 mm per month; Scenario 2 (moderate increase) by 8 mm per month; and Scenario 3 (high increase) by 12 mm per month. 20 For example, if the poverty threshold level is set to 35%, the coefficient of the low poverty incidence dummy is
negative but not significantly different from zero (see Appendix Table 2). 21 This is based on the average precipitation deviation of eight economies in Southeast Asia with complete
observations from 1991 to 2010: Brunei Darussalam, Indonesia, the Lao People’s Democratic Republic, Malaysia, the Philippines, Singapore, Thailand, and Viet Nam.

Climate-Related Disasters in Asia and the Pacific І 17
Table 3: Estimated Changes in the Frequency of Intense Hydrometeorological Disasters Associated with an Increase in Average Precipitation Deviations
Country
Average Frequency of
Hydro-meteorological
Disasters (2001–2010)
Average Precipitation
Deviation (millimeters per
month, 2001–2010)
Scenario 1: Low Increase
(dW = 4)
Scenario 2: Moderate Increase
(dW = 8)
Scenario 3:High Increase
(dW = 12)
Estimated Increase in the Average Annual Frequency of Intense Hydrometeorological
Disasters Associated with an Increase in Average Precipitation Deviation · )
Indonesia 6.00 9.92 0.09 0.18 0.27 Philippines 11.80 10.84 0.18 0.35 0.53 Thailand 3.60 1.14 0.05 0.11 0.16
Notes: Estimates are computed using the estimated coefficient of ‘Average precipitation deviation’ for the reference subregion (Southeast Asia) in Table 2 column (4), that is, = 0.0037.
Source: Authors’ calculations.
The estimates suggest that, holding other things constant, average precipitation
deviation increases by another 8 mm per month (moderate scenario), as experienced in Southeast Asia in the last decade, could be associated with an increase in the average frequency of hydrometeorological disasters in Indonesia by an average of around 0.18 per year from an average of 6 a year in 2001–2010. This is equivalent to an additional hydrometeorological disaster in Indonesia every 6 years. Meanwhile, the same would be associated with an increase of around 0.35 disaster a year, or an additional disaster every 3 years in the Philippines; and around 0.11 disasters a year in Thailand, or an additional disaster every 9 years. If the increase in average precipitation hits 12 mm per month (high scenario), greater increases in the frequency of intense hydrometeorological disasters can be expected: 1 disaster every 4 years in Indonesia, every 2 years in the Philippines, and every 6 years in Thailand.
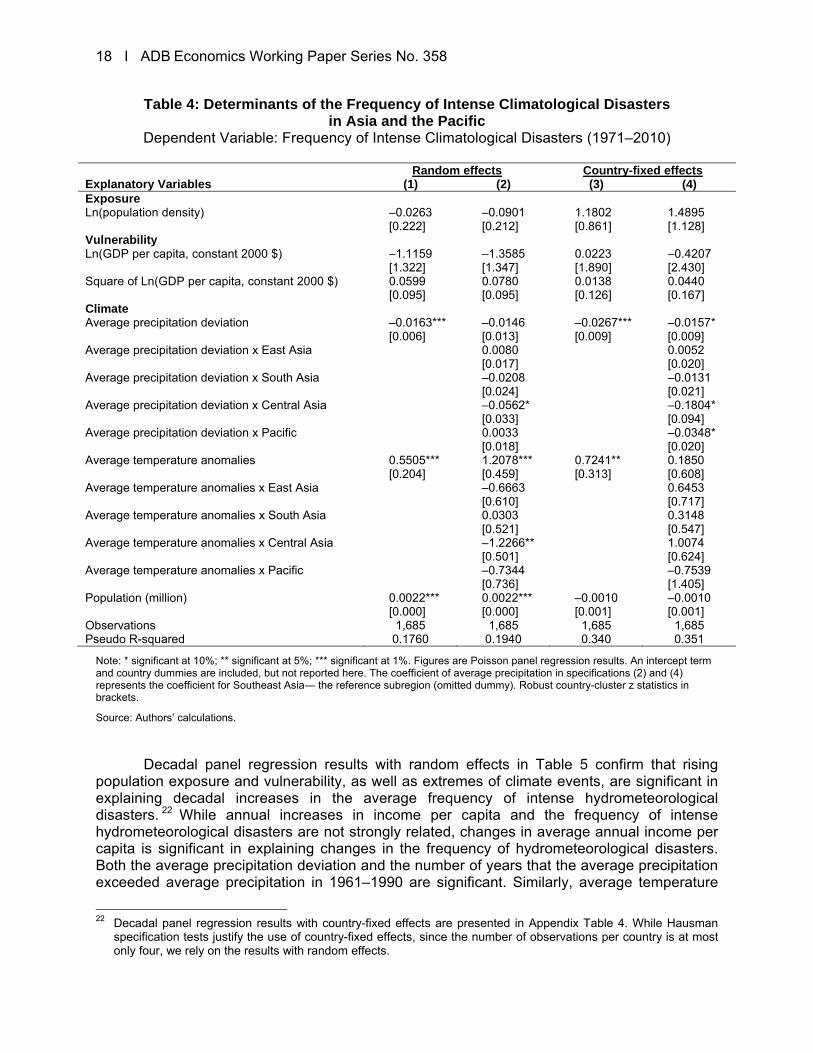
Table 4 confirms a negative relationship between average precipitation deviation and
intense climatological disasters, and a positive relationship between temperature anomalies. The coefficients of these two climate variables are significant with both random and country fixed-effects. However, the coefficients for both precipitation deviation and temperature anomalies are statistically insignificant after including climate–subregion interaction terms in the regression. Except for Central Asia, no significant variation in the effect of average precipitation deviation on climatological disasters across subregions was detected. None of the coefficients of exposure and vulnerability variables is significant. Overall, the statistical fit of the estimated regressions turns out to be weak for climatological disasters.
18 І ADB Economics Working Paper Series No. 358
Table 4: Determinants of the Frequency of Intense Climatological Disasters in Asia and the Pacific
Dependent Variable: Frequency of Intense Climatological Disasters (1971–2010) Random effects Country-fixed effects
Explanatory Variables (1) (2) (3) (4)Exposure Ln(population density) –0.0263 –0.0901 1.1802 1.4895
[0.222] [0.212] [0.861] [1.128] Vulnerability Ln(GDP per capita, constant 2000 $) –1.1159 –1.3585 0.0223 –0.4207
[1.322] [1.347] [1.890] [2.430] Square of Ln(GDP per capita, constant 2000 $) 0.0599 0.0780 0.0138 0.0440
[0.095] [0.095] [0.126] [0.167] Climate Average precipitation deviation –0.0163*** –0.0146 –0.0267*** –0.0157*
[0.006] [0.013] [0.009] [0.009] Average precipitation deviation x East Asia 0.0080 0.0052
[0.017] [0.020] Average precipitation deviation x South Asia –0.0208 –0.0131
[0.024] [0.021] Average precipitation deviation x Central Asia –0.0562* –0.1804*
[0.033] [0.094] Average precipitation deviation x Pacific 0.0033 –0.0348*
[0.018] [0.020] Average temperature anomalies 0.5505*** 1.2078*** 0.7241** 0.1850
[0.204] [0.459] [0.313] [0.608] Average temperature anomalies x East Asia –0.6663 0.6453
[0.610] [0.717] Average temperature anomalies x South Asia 0.0303 0.3148
[0.521] [0.547] Average temperature anomalies x Central Asia –1.2266** 1.0074
[0.501] [0.624] Average temperature anomalies x Pacific –0.7344 –0.7539
[0.736] [1.405] Population (million) 0.0022*** 0.0022*** –0.0010 –0.0010
[0.000] [0.000] [0.001] [0.001] Observations 1,685 1,685 1,685 1,685 Pseudo R-squared 0.1760 0.1940 0.340 0.351
Note: * significant at 10%; ** significant at 5%; *** significant at 1%. Figures are Poisson panel regression results. An intercept term and country dummies are included, but not reported here. The coefficient of average precipitation in specifications (2) and (4) represents the coefficient for Southeast Asia― the reference subregion (omitted dummy). Robust country-cluster z statistics in brackets.
Source: Authors’ calculations.
Decadal panel regression results with random effects in Table 5 confirm that rising
population exposure and vulnerability, as well as extremes of climate events, are significant in explaining decadal increases in the average frequency of intense hydrometeorological disasters. 22 While annual increases in income per capita and the frequency of intense hydrometeorological disasters are not strongly related, changes in average annual income per capita is significant in explaining changes in the frequency of hydrometeorological disasters. Both the average precipitation deviation and the number of years that the average precipitation exceeded average precipitation in 1961–1990 are significant. Similarly, average temperature
22 Decadal panel regression results with country-fixed effects are presented in Appendix Table 4. While Hausman
specification tests justify the use of country-fixed effects, since the number of observations per country is at most only four, we rely on the results with random effects.

Climate-Related Disasters in Asia and the Pacific І 19
anomalies and the frequency of temperature anomalies exceeding the 30-year average temperature are both significant in explaining decadal increases in the average frequency of intense climatological disasters but not population density nor income. This suggests that both the intensity and frequency of the hazards are associated with the frequency of climate-related disasters.
Table 5: Determinants of the Frequency of Intense Hydrometeorological Disasters in Asia and the Pacific
Dependent Variable: Average Frequency of Intense Hydrometeorological/Climatological Disasters, by Decade (1971–2010)
Explanatory Variables (1) (2) (3) (4) Hydrometeorological ClimatologicalExposure Ln(population density) 0.1781* 0.2183** –0.0060 –0.0076 [0.096] [0.108] [0.013] [0.013] Vulnerability Ln(GDP per capita, constant 2000 $) 5.6830*** 5.5177*** –0.0293 –0.0321 [2.134] [2.091] [0.135] [0.137] Square of Ln(GDP per capita, constant 2000 $) –0.3530*** –0.3422*** 0.0015 0.0016 [0.131] [0.128] [0.009] [0.009] Climate Average precipitation deviation 0.0480** –0.0005 [0.024] [0.002] Average temperature anomalies 0.0718* [0.039] No. of years per decade that average precipitation deviation exceeds 1961–1990 average
0.1280*
0.0028
[0.069] [0.009] No. of years per decade with average temperature deviation exceeds 1961–1990 average
0.0121***
[0.005] Population (in million) 0.0091*** 0.0090*** 0.0008*** 0.0008*** [0.002] [0.002] [0.000] [0.000] Observations 156 156 156 156 R-squared 0.5288 0.5297 0.5111 0.5137 No. of countries 52 52 52 52
Notes: * significant at 10%; ** significant at 5%; *** significant at 1%. Low Poverty Incidence Dummy = 1, if economy has less than 35% of its population living below the $1.25/day purchasing power parity poverty line. Figures are generalized least squares panel regression results with random effects. An intercept term is included but not reported here. Robust statistics in brackets.
Source: Authors’ calculations. Our results suggest that the three factors—rising population exposure, population
vulnerability, and changing climate—may play a role in explaining the rising frequency of intense climate-related disasters in Asia and the Pacific. While climatological disasters are clearly associated with changing temperature, hydrometeorological disasters are most clearly associated with rising exposure.
Jennings (2011) developed a similar analysis on EM-DAT disaster data starting in the
1980s, but for all types of natural disasters with factors identified including population exposure, vulnerability, as well as other factors that affect their reporting (such as press freedom in a country). While this study similarly points to the significance of exposure and vulnerability indicators in disaster data, it also includes an acknowledgement of the likely
20 І ADB Economics Working Paper Series No. 358
effects of weather or climate change shocks, which IPCC (2012) suggests is indicative of the changing climate.
The panel regressions employed here have limitations. The panel data used in the
regressions are unbalanced since data for climate and vulnerability indicators are not available for some years in some countries for the period under study. Also, population exposure and vulnerability may not be fully exogenous. If the regressors are not strongly exogenous, then maximum likelihood estimator will produce inconsistent estimates, which would imply that one cannot rely on the coefficient estimates to compute the marginal effects. Nonetheless, while the frequency of disasters may affect the population exposed to disasters and their income, its direct effect on the exposure and vulnerability indicators in this paper is expected to be limited.
Although the structural model made use of the Figure 1 framework, it was constrained
by data availability. For example, while variables such as land use (see Brath, Montanari, and Moretti 2006), the actual number of people living in the hazard-prone areas, or the share of these figures to the total population would be of keen interest, these are neither regularly generated nor readily available. Furthermore, the analysis employed annual data because control variables, such as population density and population, are available only on an annual basis.
V. CLIMATE TRENDS AND PATTERNS IN THE PHILIPPINES
To complement the review of the rise in intense disasters in Asia and the Pacific in the previous sections, this section presents more detailed climate data from the Philippines, where it is the behavior and intensity of extreme hydrometeorological events and not the frequency, that is rising.
An archipelago of 7,100 islands with a vast number of low-lying areas and steep inland terrain, the Philippines is a global hotspot for hydrometeorological disasters. The United Nations University Institute for Environment and Human Security ranked it third in the world on disaster risk in 2011. Within Asia and the Pacific, the Philippines experienced the fourth highest frequency (98) of intense hydrological disasters during 1971–2010, topped only by Indonesia (124), India (167), and the PRC (172), all of which have much larger land areas. But the Philippines experienced the highest frequency (218) of intense meteorological disasters in the region during the same time. The Philippines has one of the longest coastlines in the world (32,400 km), with its eastern seaboard on the Pacific, the ocean basin with the highest annual frequency of tropical cyclones north of the equator.23
The typical path of cyclones has also shifted southward, tropical cyclones of weaker
intensity now have very intense associated rains, while the frequency of hot days and warm nights is increasing. Climate models suggest that the increasing trend in the frequency of hot days will continue.
23 Tropical cyclones are atmospheric low pressure systems generated in the tropical and subtropical regions. They
range from north of the equator and west of 180°E.
Climate-Related Disasters in Asia and the Pacific І 21
A. Tropical Cyclones and Typhoons The use of radars and satellites for detection of cyclones began in the early 1970s (Knutson et al. 2010 and Landsea et al. 2006), so cyclone data are not perfectly comparable over time. That said, the Philippine government’s meteorological office—the Philippine Atmospheric, Geophysical and Astronomical Services Administration (PAGASA)—suggests that from 1951 to 2010, the frequency of tropical cyclones affecting the country did not increase. An average of 19 to 20 tropical cyclones hit the country per year during the following 30-year rolling periods: 1951–1980, 1961–1990, 1971–2000, and 1981–2010. During 1971–2010, about six extreme typhoons with maximum sustained winds of greater than 150 km per hour affected the Philippines.24 No significant trend is observed in the frequency of extreme typhoons (PAGASA 2011).
The Manila Observatory (2011), which also tracks weather events, concludes that there
were no clear trends in the annual frequency of tropical cyclones, typhoons, and extreme typhoons during 1945–2010. Annual frequency has been highly variable (between 9 and 26), but with no clear long-term trend. The share of typhoons to tropical cyclones also varied between 42% and 90%, but again, with no clear long-term trend.
To begin, gain strength, and determine their path, tropical cyclones depend on specific,
local, atmospheric circulation patterns and oceanic and atmospheric variables. Damage is caused by high winds and heavy rains. Even though no increase in the frequency of tropical cyclones and extreme typhoons in the Philippines is discernible, evidence exists that the nature of these hazards is changing, both in warmer temperatures and heavier rainfall.
B. Historical Temperatures As in many parts of the world, temperatures have risen in the Philippines (Figure 5), with annual means rising by 0.65°C during 1951–2005, or an average of 0.0108°C per year increase. The rate of increase in the 30 years (0.0164°C per year) is faster, notwithstanding the global slowdown in warming over the last decade. Years recording significantly higher temperatures are more concentrated after 1995 (see black bars in Figure 5).
24 A typhoon is a tropical cyclone in the northwestern part of the Pacific Ocean that has 10-minute sustained wind
speeds near its center of at least 33 miles per second.

22 І ADB Economics Working Paper Series No. 358
Figure 5: Annual Mean Surface Temperature Anomalies in the Philippines: 1951–2005
Note: Temperature anomalies here represent departures from average temperature during 1960–1990. The black (grey) bars indicate negative (positive) anomalies or periods with temperature lower (higher) than the normal value or the average temperature during 1960–1990. The straight trend line indicates that temperature is getting increasingly warmer. The grey fitted line shows the increasing variability in annual mean temperature.
Sources: Manila Observatory with data obtained by Philippine Atmospheric, Geophysical and Astronomical Services Administration (PAGASA) from 28 PAGASA observation stations across the country.
The increase in the mean surface air temperature is due, at least in part, to differential
changes in the daily maximum and minimum temperatures, resulting in a narrowing of the daily temperature range. Figure 6 shows that the frequency of hot days (defined as days with maximum temperature greater than 30°C) is increasing and cool days (defined as days with minimum temperature less than 18°C) decreasing.
Figure 6: Frequency of Hot Days and Cool Days in the Philippines (1950–2010)
Note: Annual frequency of occurrence days per station calculated from data taken at 28 observation stations. The black line shows the annual frequency of days per station. The grey line shows the 11-year running mean.
Source: Manila Observatory with data obtained from Philippine Atmospheric, Geophysical and Astronomical Services Administration.
–0.8
–0.6
–0.4
–0.2
0
0.2
0.4
0.6
0.8
1.0
1951 1961 1971 1981 1991 2001
Tem
pera
ture
Ano
mal
ies
�C
200
225
250
275
300
1950 1960 1970 1980 1990 2000 2010
Number of Days with Maximum Temperatureof ≥ 30°C
0
4
8
12
16
1950 1960 1970 1980 1990 2000 2010
Number of Days with Minimum Temperatureof < 18°C
Climate-Related Disasters in Asia and the Pacific І 23
C. Historical Rainfall Patterns
Trenberth (2011, 2005) explains that when temperature increases (as has been observed), the capacity of air to hold water increases by about 7% per 1°C warming. This leads to increased moisture in the atmosphere for storms, whether individual thunderstorms, extra tropical rain, snow storms, or tropical cyclones, to produce more intense precipitation events. Such events are widely observed, even where total precipitation is decreasing. Usually, when it rains it pours, increasing the risk of flooding.
Consistent with observed temperature increases, an increase in the frequency of more extreme rainfall events (with 350-mm rainfall or higher) in the latter part of the 20th century was observed. From 1903 to 2005, important wet periods were observed in the early to mid-1970s and the late 1990s, and relatively dry periods in the mid-1960s and mid-1990s (Kubota and Chan 2009). However, no clear trends are observed in annual total rainfall, in part due to the significant inter-decade variation caused by persistent changes in atmospheric circulation patterns.
From 2001 to 2008, the 24-hour rainfall intensity (the amount of rainfall over a 24-hour
period), appeared to increase in most parts of the country relative to the 1971–2000 baseline values. But not all of these increases are statistically significant (PAGASA 2011). There is evidence of a statistically significant increase in rainfall intensity in the cities of Baguio in the northern Philippines, and Tacloban and Iloilo further south in the Visayas. And the frequency of extreme daily rainfall in most parts of the country is also, generally, trending higher.25 Positive trends are significant only in the cities of Calapan, Laoag, Iloilo, and Tacloban; for the island of Palawan, the reverse trend is significant.
The typical paths of tropical cyclones per decade have been changing too. A 30-year
running average of the frequency of tropical cyclones passing over the Philippines (PAGASA 2011) indicates that there was a slight increase in the Visayas during 1971–2000 compared with 1951–1980 and 1960–1990. Anglo (2005) also showed that the tropical cyclone pathway has shifted southward towards the central Philippines. D. Projected Changes in Temperature and Rainfall In its Special Report on Emission Scenarios (IPCC 2000), the IPCC outlined various expected GHG changes for projecting future climate conditions with climate models. These GHG scenarios, used extensively in the IPCC’s third and fourth assessment reports (IPCC 2001, 2007), were based on the established relationship between the atmospheric concentration of GHGs and changes in the climate, especially temperature. These scenarios can roughly be categorized into four: two that pertain to the focus of development, or (A) economic or (B) environmental; multiplied by two that describe the homogeneity or heterogeneity of economies, or (1) greater globalization versus (2) more intense regional uniqueness. GHG emissions vary across these four scenarios—emissions are high for the A2 scenario (economic, intense regional uniqueness), low for B1 (environmental, greater globalization), and medium for A1B (midway between economic and environmental focus, with greater globalization).
Figure 7 illustrates the results of the Manila Observatory research on projected
temperature in the Philippines using the medium, A1B scenario. Average temperature is
25 Extreme daily rainfall refers to the upper part of a probability distribution, usually known as the tail, which governs
both the magnitude and the frequency.

24 І ADB Economics Working Paper Series No. 358
projected to increase by 0.8°C–2.2°C by 2020 and 2050, respectively over the entire country for the A1B IPCC scenario, compared to the 1961–1990 average. There is a noticeable shift of more frequent days having 28°C in 2020 and 29°C in 2050 compared to the baseline, with considerable regional variation. In particular, the regions of Mindanao and Southern Visayas are expected to be considerably warmer in 2020 and 2050 compared with Luzon, with the largest increase in temperature expected on the Zamboanga Peninsula in southern Mindanao.
Also, using temperature projections in the medium-range scenario (A1B), the frequency
of hot days, with a maximum temperature of 30°C or higher, generally increases over the Philippines.
Figure 7: Projected Temperature, Philippines (2020 and 2050)
Note: Baseline refers to 1960–1990 temperature values.
Source: Manila Observatory. 2012. Temperature Projections for the Philippines. Unpublished report.
Precipitation changes are expected to be more variable. Whereas climate models
project temperature increases practically everywhere as GHG concentration increases, IPCC (2007) indicates that globally, precipitation will increase in some regions and decrease in others. Precipitation may increase in high-latitude regions and decrease in the tropics, according to the global climate model results.
The Manila Observatory (2011) reports that by 2020 there will be an increase or no
change in average rainfall in Luzon, and a decrease in average rainfall in most other parts of the country. By 2050, it is expected that the Visayas and Mindanao will be drier than normal. For extreme precipitation in the Philippines, the frequency of days with heavy precipitation (greater than 200 mm, for example) is expected to increase significantly by 2020 and 2050 amid global warming.
VI. POLICY IMPLICATIONS
Hazards of nature have always been with us. Some regions, such as Asia and the Pacific, and countries, such as the Philippines, have been systematically affected more than others by the disasters these hazards cause. There has been progress in technology and preparedness that
2,000
1,500
1,00
500
0
Freq
uenc
y
18 19 20 21 22 23 24 25 26 27 28 29 30 31 32 33 34
Annual Mean Temperature (°C)
Baseline 2020s 2050s

Climate-Related Disasters in Asia and the Pacific І 25
has helped to reduce casualties. Yet, growing exposure, greater vulnerability, and greater frequency of extreme hazards have contributed to greater destruction and damage from disasters in recent decades.
Climate change turns out to be relevant to the findings of this paper and this discussion.
The extent to which human emissions of greenhouse gases are causing changes in the climate has been examined by scientists for over 150 years, since Fourier in 1824 and Tyndall in 1864. Atmospheric CO2 concentrations have recently surpassed 400 parts per million (ppm) and are set to reach 450 ppm in less than a quarter of a century, given current increases of over 2 ppm a year. Many scientists consider 450 ppm to be dangerous, given the implications for the increase in mean near-surface air temperature and its related impacts on climate-related disasters
Indeed, recent observations connect rising GHG emissions to increased atmospheric
concentrations, and then to changes in climate variables (such as temperature and precipitation). Given this body of scientific knowledge, the findings in this paper lead to the suggestion that there is a link between increasing natural disasters in Asia and the Pacific and man-made emissions of greenhouse gases in the atmosphere. In these circumstances, this paper’s findings lead to three sets of implications for Asia and the Pacific—which has led the world in economic growth and poverty reduction in the last 50 years.
First, disaster prevention, which is seldom emphasized as much as disaster response,
needs to feature as an integral part of development strategies. Data presented in this paper draw attention to an unmistakable increase in the worldwide frequency of hydrometeorological and climatological disasters in recent decades. By chronicling the rising frequency of hydrometeorological events globally in Asia and the Pacific and in the Philippines, this paper draws attention to the risk these growing disasters pose for development.
Hydrometeorological disaster risk is seen to vary enormously across subregions and
from country to country. It is taking a heavier toll on more densely populated, poorer, and more environmentally degraded areas. The recent trends in disasters suggest that if they continue, the growing threat of natural disasters could soon prove to be a game changer in development plans and policies.
High population exposure and worsening climate trends related to natural disasters in
Asia and the Pacific loom over the region’s economic success and strategic importance in the global economy. The region’s population continues to rise relative to the global total, and its economy helps drive global economic growth. Yet, global manufacturing has moved to some very hazard-prone and ill-prepared areas. The Thailand floods of 2011 and their huge impact on the supply of computer hard drives and auto parts is one example.
Second, climate action needs to be added as a crucial dimension in disaster prevention.
Climate mitigation—reducing greenhouse gases in the atmosphere—is also essential to confronting the rising trend in climate-related disasters. Focusing on hydrometeorological and climatological events, the paper suggests that some impacts of man-made climate change are occurring. Even as the detailed temporal and spatial distribution of temperature and precipitation associated with these events is becoming more variable and extreme, some trends are also emerging. The data and analysis presented here add a global and local complement to other analysis suggesting a link between climate change and changes in the pattern of natural disasters.

26 І ADB Economics Working Paper Series No. 358
An association, no matter how strong, does not necessarily show causality. In that spirit, an individual disaster, such as the Pakistan floods of 2010 or the Thailand floods of 2011, cannot necessarily be attributed to climate change triggered by rising GHGs. These events and their event-to-event differences have always been part of our environment. But we know that GHG emissions are increasing GHG atmospheric concentrations, and that this is increasing temperatures and changing our climate. While there remain great uncertainties in the precise impacts, this paper adds to the expectation that these changes may be resulting in more intense floods, storms, and droughts.
In the Philippines, it is not the frequency, but the intensity of relatively more extreme events that is on the rise. The path of cyclones has changed, tropical cyclones of weaker intensity now have very intense associated rains, and the frequency of hot days and warm nights is increasing. And climate models suggest that the increasing trend in the frequency of hot days will continue.
Third, climate adaptation, relating to people’s exposure and vulnerability to the risks (for
example, through policies influencing their location), could help ameliorate disaster impacts. Analysis in the paper suggests that, in addition to nature, there is also a human hand in both explaining and responding to disasters. Natural disasters are, almost by definition, considered to be acts of nature. However, if humans knowingly live in dangerous locations and fail to take preventative measures, then nature cannot be entirely blamed for the harm suffered. By and large, countries have tended to view disaster risk management as a cost rather than as investment needed for saving lives and livelihoods, reducing disaster threats to critical infrastructure, and promoting sustainable development.
Typically, disaster response is just that—reaction in relief and reconstruction, with
inadequate thought to proactive response and prevention. Some estimates point to the high payoff of disaster prevention (Hallegatte 2012, World Bank 2010), but rigorous evaluation of the net benefits might help spur policy action. But there may be a danger that we are “mopping the floor when the tap is still running.” Given rising population exposure, ongoing limitations in adaptive capacity, and anthropogenic climate change, it is straightforward to make a case for prevention, preparedness, and planning in the face of these disaster risks.
There is a need to address both “proximal” and “distal” causes of disasters. Inadequate
preparation and response are “proximal” causes, such as levee failures along the Indus River in Pakistan in 2010 and the Kosi River in India in 2008. This paper has focused on the “distal” causes, including increased population exposure, changing climate, and greater vulnerability. To take the example of the 2010 Indus floods again, the “distal” causes included the meteorological circumstances of the rainfall in the upstream Indus, which were causally linked to unusual circulation patterns that also caused extreme drought and fires in the Russian Republic earlier that year (Lau and Kim 2012).
One implication is that strong economic and social returns may be derived from
investments in better understanding of shifting climate patterns, including hazard mapping and other risk assessment systems, as well as better location decisions for households and businesses and stronger environmental protection. But these trends are also telling us that adaptation must be accompanied by mitigation. Climate change mitigation, such as accelerating plans for energy efficiency, clean energy, forest protection, and reforestation, are needed urgently.
Climate-Related Disasters in Asia and the Pacific І 27
There is need to acknowledge the complexity of understanding natural disasters in the context of a changing climate and rapidly growing populations and economies (Ward et al. 2012, Hepburn and Ward 2011). Within that understanding, the paper points to new trends in climate-related disasters across Asia and the Pacific. The emerging phenomenon should be a serious concern for governments, the development community, and all societies. With the rise in GHG emissions and man-made climate change figuring prominently in the new trend, climate adaptation and mitigation need to become an integral part of natural disaster strategies and our approach to development.

28 І ADB Economics Working Paper Series No. 358
APPENDIX TABLES
Appendix Table 1: Descriptive Statistics (1971–2010)
Variable Obs. Mean Std. Dev. Min. Max.Frequency of Intense hydrometeorological disasters 1,685 1.11 2.48 0.00 25.00 Frequency of Intense climatological disasters 1,685 0.11 0.42 0.00 6.00 Population density (people per square km) 1,685 622.62 2,171.06 1.12 19,416.29 Population (million) 1,685 71.44 217.56 0.05 1,337.83 GDP per capita (constant 2000 $) 1,685 6,579.37 9,707.36 122.09 61,374.75 Low Poverty Incidence Dummy (1 if economy has less than 35% of its population living below the $1.25/day PPP poverty line; 0 otherwise) 2,240 0.77 0.42 0.00 1.00 Average precipitation deviation (mm/month)
∑ / where represents the average precipitation in station in year , is the average precipitation for 1960–1990, and is the total number of stations in country . 1,685 –0.77 14.88 –95.44 74.88 East Asia 1,685 0.09 5.67 –39.44 46.96 South Asia 1,685 –0.04 3.85 –29.48 26.23 Southeast Asia 1,685 0.18 8.88 –55.78 60.65 Central Asia 1,685 –0.13 2.55 –14.05 12.96 Pacific 1,685 –0.86 9.43 –95.44 74.88 Average Temperature Anomalies ∑ /
where represents the average temperature in station in year , is the average temperature for 1960–1990, and is the total number of stations in country 1,685 0.32 0.50 –1.42 2.41 East Asia 1,685 0.04 0.22 –1.02 2.41 South Asia 1,685 0.05 0.23 –1.17 1.74 Southeast Asia 1,685 0.04 0.16 –0.50 1.14 Central Asia 1,685 0.16 0.43 –1.42 2.22 Pacific 1,685 0.03 0.12 –0.60 1.19
GDP = gross domestic product, Max. = maximum value, Min. = minimum value, Obs. = number of observations, PPP= purchasing power parity, Std. Dev.= standard deviation.
Sources: Data on number of intense climate-related disasters based on natural disaster observations reported on Emergency Event Database (EM-DAT) Centre for Research on the Epidemiology of Disasters accessed 6 December 2011 (http://www.emdat.be); Population, Population Density, and GDP per capita are from the World Bank’s World Development Indicator’s Online accessed 14 January 2012 (http://databank.worldbank.org); Low Poverty Incidence Dummy is based on average head count ratio as compiled at the World Bank’s PovCalNet and World Development Indicators Online accessed 1 February 2012 (http://databank.worldbank.org); Average Precipitation Deviation is from Global Precipitation Climatology Center (GPCC 2011) accessed 28 December 2011 (http://www.gpcc.dwd.de); Average Temperature Anomalies is from Met Office Hadley Centre and the Climate Research Unit at the University of East Anglia accessed 28 December 2011 (http://www.cru.uea.ac.uk/cru/data/temperature).

Climate-Related Disasters in Asia and the Pacific І 29
Appendix Table 2: Negative Binomial Regression Results with Low Poverty Dummy and Random Effects
Dependent Variable: Frequency of Intense Hydrometeorological Disasters (1971–2010) Explanatory Variables (1) (2) Exposure Ln(population density) 1.8008*** 0.2515* [0.331] [0.138] Vulnerability Low poverty incidence dummy 3.9497*** –0.6324 [0.731] [0.431] Climate Average precipitation deviation 0.0064*** 0.0140***
[0.002] [0.002] Average precipitation deviation x East Asia –0.0130***
[0.005] Average precipitation deviation x South Asia 0.0024
[0.004] Average precipitation deviation x Central Asia 0.0403**
[0.017] Average precipitation deviation x Pacific –0.0068
[0.004] Population (in million) 0.0013 0.0024*** [0.002] [0.001] Observations 2,240 2,240 Pseudo R-squared 0.0906 0.0918 Alpha 2.175 2.159 LR test of alpha=0 (Chi-bar, ) 1,044 1,022
Notes: ** significant at 5%; *** significant at 1%. Low Poverty Incidence Dummy = 1, if economy has less than 35% of its population living below the $1.25/day purchasing power parity poverty line. Figures are negative binomial panel regression results. An intercept term and country dummies are included but not reported here. The coefficient of ‘Average Precipitation Deviation’ in specifications (2) and (4) represents the coefficient for Southeast Asia― the reference subregion (omitted dummy).Robust country-cluster z statistics in brackets.
Source: Authors’ calculations.

30 І ADB Economics Working Paper Series No. 358
Appendix Table 3: Negative Binomial Regression Results with Time Trend Dependent Variable: Frequency of Intense Hydrometeorological Disasters (1971–2010)
Random effects Country-fixed effects
Explanatory Variables (1) (2) (3) (1)
Exposure
Ln(Population Density) 0.2356 0.2394 –0.2923 –0.2756
[0.146] [0.147] [0.911] [0.922]
Vulnerability
Ln(GDP per capita, constant 2000 $) 0.7779 0.8172 2.4264* 2.4773**
[1.468] [1.468] [1.243] [1.243]
Square of Ln(GDP per capita, constant 2000 $) –0.0675 –0.0697 –0.1688* –0.1724*
[0.100] [0.100] [0.094] [0.094]
Climate
Average Precipitation Deviation 0.0099*** 0.0087*** 0.0059*** 0.0034***
[0.002] [0.002] [0.002] [0.001]
Average Precipitation Deviation x East Asia -0.0050 0.0074***
[0.004] [0.002]
Average Precipitation Deviation x South Asia 0.0086** 0.0131***
[0.004] [0.002]
Average Precipitation Deviation x Central Asia 0.0576*** 0.1015***
[0.016] [0.026]
Average Precipitation Deviation x Pacific 0.0010 –0.0010
[0.005] [0.005]
Population (in million) 0.0022*** 0.0022*** –0.0003 –0.0005
[0.001] [0.001] [0.001] [0.001]
Year 0.0180** 0.0186** 0.0379* 0.0388*
[0.007] [0.007] [0.022] [0.022]
Observations 1,685 1,685 1,685 1,685
Pseudo R-squared 0.103 0.105 0.371 0.374
Notes: * significant at 10%; ** significant at 5%; *** significant at 1%. Figures are negative binomial panel regression results. An intercept term and country dummies are included but not reported here. The coefficient of ‘Average Precipitation Deviation’ in specifications (2) and (4) represents the coefficient for Southeast Asia― the reference subregion (omitted dummy). Robust country-cluster z statistics in brackets.
Source: Authors’ calculations.

Climate-Related Disasters in Asia and the Pacific І 31
Appendix Table 4: Generalized Least Squares Regression Results with Country-Fixed Effects
Dependent Variable: Average Frequency of Intense Hydrometeorological/Climatological Disasters, by Decade (1971–2010)
Hydromet Climatological
Explanatory Variables (1) (2) (3) (4)Exposure ln(population density) 0.2823 0.4217 –0.0199 –0.0235 [0.394] [0.469] [0.065] [0.070] Vulnerability Ln(GDP per capita, constant 2000 $) 5.5140*** 5.3617*** 0.2439 0.3256 [1.875] [1.902] [0.269] [0.262] Square of Ln(GDP per capita, constant 2000 $) –0.3026*** –0.2938*** –0.0099 –0.0139 [0.104] [0.105] [0.016] [0.016] Climate Average precipitation deviation 0.0346* –0.0064** [0.020] [0.003] Average temperature anomalies 0.0808 [0.056] Number of years per decade that average precipitation deviation exceeds 1961-1990 average
0.0788 –0.0188**
[0.059] [0.009] Number of years per decade with average temperature deviation exceeds 1961-1990 average
0.0052
[0.008] Population (million) 0.0133** 0.0131** 0.0013* 0.0013* [0.005] [0.005] [0.001] [0.001] Observations 156 156 156 156 R-squared 0.676 0.670 0.294 0.286 Number of countries 52 52 52 52
Notes: *significant at 10%; ** significant at 5%; *** significant at 1%. Low Poverty Incidence Dummy = 1 if economy has less than 35% of its population living below the $1.25/day purchasing power parity poverty line. Figures are generalized least squares panel regression results with country-fixed effects. An intercept term is included but not reported here. Robust statistics in brackets.
Source: Authors’ calculations.

REFERENCES Allison, P. D., and R.P. Waterman. 2002. Fixed-effects Negative Binomial Regression Models.
Sociological Methodology 32(1): 247–265. Anglo, E. G. 2005. Decadal Change in Tropical Cyclone Activity in the Western Pacific. Manila
Observatory. http://www.observatory.ph/cgibin/publications/pub_details.py?p=94 (last accessed 15 August 2012).
Baum, C. F. 2006. An Introduction to Modern Econometrics Using Stata. College Station, TX:
Stata Press. Birkmann, J. 2007. Risk and Vulnerability Indicators at Different Scales: Applicability,
Usefulness and Policy Implications. Environmental Hazards 7(1): 20–31. Bradshaw, C. J. A., N. S. Sodhi, K. S.-H. Peh, and B. W. Brook. 2007. Global Evidence that
Deforestation Amplifies Flood Risk and Severity in the Developing World. Global Change Biology 3:2379–2395.
Brath, A., A. Montanari, and G. Moretti. 2006. Assessing the Effect on Food Frequency of Land
Use Change via Hydrological Simulation (with uncertainty). Journal of Hydrology 324(1–4): 141–153. http://dx.doi.org/10.1016/j.jhydrol.2005.10.001 (last accessed 15 December 2011).
Brohan, P., J. Kennedy, I. Harris, S. Tett, and P. Jones. 2006. Uncertainty Estimates in
Regional and Global Observed Temperature Changes: A New Dataset from 1850. Journal of Geophysical Research 111 (D12106): http://mason.gmu.edu/~bklinger/ CLIM690/brohanetal06.pdf (last accessed 15 December 2011).
Carter, R., P. D. Little, T. Mogues and W. Negatu. 2007. Poverty Traps and Natural Disasters in
Ethiopia and Honduras. World Development 35(5): 835–856. Chomitz, K. 2011. Climate Change and the World Bank Group: Climate Adaptation. IEG
Evaluation Approach Paper. Washington, DC. Cutter, S., C. Emrich, J. Webb, and D. Morath. 2009. Social Vulnerability to Climate Variability
Hazards: A Review of the Literature. Oxfam America Technical Report. http://adapt.oxfamamerica.org (last accessed 15 July 2012).
Enders, W. 2004. Applied Econometric Time Series. New York: John Wiley. Economist Intelligence Unit (EIU). 2012. Counting the Cost of Calamities. The Economist.
14 Jan. http://www.economist.com/node/21542755 (last accessed 15 July 2012). EM-DAT: The OFDA/CRED International Disaster Database. 2011. Université Catholique de
Louvain, Brussels (Belgium). http://www.emdat.be (last accessed 15 September 2012). Füssel, H.-M., and R.J.T. Klein, 2006: Climate Change Vulnerability Assessments: An Evolution
of Conceptual Thinking. Climatic Change. 75(3): 301–329.

Climate-Related Disasters in Asia and the Pacific І 33
Global Precipitation Climatology Centre. 2011. GPCC full data reanalysis version 6. ftp://ftp -anon.dwd.de/pub/data/gpcc/html/fulldata_v6_download.html (last accessed 15 July 2012).
Grinsted, A., J. C. Moore, and S. Jevrejeva. 2013. Projected Atlantic Hurricane Surge Threat
from Rising Temperatures. Proceedings of the National Academy of Sciences. www.pnas.org/cgi/doi/10.1073/pnas.1209980110.
Guha-Sapir, D. 2011. Disasters in Numbers 2010. Powerpoint Presentation. 24 January.
Geneva. http://cred.be/sites/default/files/Disaster_numbers_presentation_2010.pdf (last accessed 13 August 2012).
Haines A., R. S. Kovats, D. Campbell-Lendrum, and C. Corvalan. 2006. Climate Change and
Human Health: Impacts, Vulnerability, and Mitigation. The Lancet 367(9528): 2101–2109.
Hallegatte, S. 2012. A Cost Effective Solution to Reduce Disaster Losses in Developing
Countries: Hydrometeorological Services, Early Warning, and Evacuation. World Bank Policy Research Working Paper No. 6058.
Hamilton, J. 1994. Time Series Analysis. New Jersey: Princeton University Press. Hansen, J., L. Nazarenko, R. Ruedy, M. Sato, J. Willis, A. Del Genio, D. Koch, A. Lacis, K. Lo,
S. Menon, T. Novakov, J. Perlwitz, G. Russell, G. A. Schmidt, and N. Tausnev. 2005. Earth's Energy Imbalance: Confirmation and Implications. Science 308(5727): 1431-1435.
Hansen, J., and M. Sato. 2012. Paleoclimate Implications for Human-made Climate Change. In
A. Berger, F. Mesinger, and D. Sijacki, eds. Climate Change. Vienna: Springer. Hansen, J., M. Sato, and R. Ruedy. 2012. Perception of Climate Change. Proceedings of the
National Academy of Sciences (PNAS), 6 August. http://www.pnas.org/content/ early/2012/07/30/1205276109.full.pdf+html (last accessed 15 August 2012).
Hasselmann, K., R. Sausen, E. Maier-Reimer, and R. Voss. 1993. On the Cold Start Problem in
Transient Simulations with Coupled Atmosphereocean Models. Climate Dynamics 9: 53–61.
Hausman, J. A., and W. E. Taylor. 1981. A Generalized Specification Test. Economics Letters
8(3): 239–245. Hegerl, G. C., H. von Storch, K. Hasselmann, B. D. Santer, U. Cubasch, and P. D. Jones. 1996.
Detecting Greenhouse-gas-induced Climate Change with an Optimal Fingerprint Method. Journal of Climate 9(10): 2281–2306.
Hepburn, C., and J. Ward. 2011. Self-interested Low-carbon Growth in G-20. Global Journal of
Emerging Market Economies 3(2): 195–222. Hilbe, J. 2011. Negative Binomial Regression. Second Edition. New York: Cambridge University
Press.
34 І ADB Economics Working Paper Series No. 358
Hoeppe, P. 2007. Trends of Natural Disasters – The Role of Global Warming. http://www.oecd.org/dataoecd/26/10/38155568.pdf (last accessed 15 December 2011).
Hoerling, M., J. Eischeid, J. Perlwitz, X. Quan, T. Zhang, and P. Pegion. 2012. On the Increased
Frequency of Mediterranean Drought. Journal of Climate 25:2146–2161. doi: http://dx.doi.org/10.1175/JCLI-D-11-00296.1
Huber, M., and R. Knutti. 2012. Anthropogenic and Natural Warming Inferred from Changes in
Earth’s Energy Balance. Nature Geoscience 5:31–36. http://dx.doi.org/10.1038/ ngeo1327 (last accessed 15 December 2011).
Independent Evaluation Group (IEG) World Bank. 2006. Hazards of Nature, Risks to
Development: An IEG Evaluation of World Bank Assistance for Natural Disasters. Washington, DC: World Bank Independent Evaluation Group. http://www.worldbank.org/ieg/naturaldisasters/docs/natural_disasters_evaluation.pdf (last accessed 8 August 2012).
Intergovernmental Panel on Climate Change (IPCC). 2000. Special Report on Emissions Scenarios (SRES). Cambridge: Cambridge University Press. http://www.ipcc.ch/ipccreports/sres/emission/index.htm (last accessed 20 September 2012).
———. 2001. Climate Change 2001: Synthesis Report. Contribution of Working Groups I, II and
III to the Third Assessment Report of the Intergovernmental Panel on Climate Change. Watson, R. T., and Core Writing Team, eds. Cambridge: Cambridge University Press. http://www.ipcc.ch/ipccreports/tar/vol4/english/index.htm (last accessed 8 August 2012).
———. 2007. Climate Change 2007: Synthesis Report. Contribution of Working Groups I, II and
III to the Fourth Assessment Report of the Intergovernmental Panel on Climate Change. Core Writing Team, R. K. Pachauri, and A. Reisinger, eds. Geneva, Switzerland: IPCC. http://www.ipcc.ch/publications_and_data/publications_ipcc_fourth_assessment_report_synthesis_report.htm (last accessed 8 August 2012).
———. 2012. Managing the Risks of Extreme Events and Disasters to Advance Climate
Change Adaptation. A Special Report of the Intergovernmental Panel on Climate Change. In C. B. Field, V. Barros, T. F. Stocker, D. Qin, D. J. Dokken, K. L. Ebi, M.D. Mastrandrea, K. J. Mach, G.-K. Plattner, S. K. Allen, M. Tignor, and P. M. Midgley, eds. Cambridge: Cambridge University Press. http://ipcc-wg2.gov/SREX/ (last accessed 8 August 2012).
Internal Displacement Monitoring Centre. 2009. Monitoring Disaster Displacement in the
Context of Climate Change. http://www.unhcr.org/refworld/docid/4ab9cd4e2.html (accessed 13 August 2012).
International Federation of Red Cross and Red Crescent Societies (IFRC). 2010. World
Disasters Report 2010: Focus on Urban Risk. D. McClean, ed. Switzerland: IFRC www.ifrc.org/Global/Publications/disasters/WDR/WDR2010-full.pdf (last accessed 8 August 2012).

Climate-Related Disasters in Asia and the Pacific І 35
Jennings, S. 2011. Time’s Bitter Flood: Trends in the Number of Reported Natural Disasters. Oxfam GB Research Report. http://policy-practice.oxfam.org.uk/publications/times -bitter-flood-trends-in-the-number-of-reported-natural-disasters-133491 (last accessed 20 October 2012).
Kahn, M. E. 2005. The Death Toll from Natural Disasters: The Role of Income, Geography, and
Institutions. The Review of Economics and Statistics 87(2): 271–284. Kellenberg, D. K., and A. M. Mobarak. 2008. Does Rising Income Increase or Decrease
Damage Risk from Natural Disasters? Journal of Urban Economics 63(3): 788–802. Kelly, P. M., and W. N. Adger. 2000. Theory and Practice in Assessing Vulnerability of Climate
Change and Facilitating Adaptation. Climatic Change 47(4): 325–352. Kim, N. 2012. How Much More Exposed are the Poor to Natural Disasters? Global and Regional
Measurement. Disasters 36(2): 195–211. Kirschenbaum, A. 2004. Chaos, Organization, and Disaster Management. New York: Marcel
Dekker, Inc. Knutson, T. R., J. L. McBride, J. Chan, K. Emanuel, G. Holland, C. Landsea, I. Held, J. Kossin,
A. Srivastava, and M. Sugi. 2010. Tropical Cyclones and Climate Change. Nature Geoscience 3:157–163. http://www.nature.com/ngeo/journal/v3/n3/abs/ngeo779.html (last accessed 8 August 2012).
Kubota, H., and Chan, J. C. L. 2009. Interdecadal Variability of Tropical Cyclone Landfall in the
Philippines from 1902 to 2005. Geophysical Research Letters 36 (L12802). doi:10.1029/2009GL038108
Kundzewicz, Z. W., L. J. Mata, N. W. Arnell, P. Doll, B. Jimenez, K. Miller, T. Oki, Z. Sen, and I.
Shiklomanov. 2008. The Implications of Projected Climate Change for Freshwater Resources and their Management. Hydrological Sciences Journal 53(1): 3–10.
Landsea, C., B. Harper, K. Hoarau, and J. Knaff. 2006. Can We Detect Trends in Extreme
Tropical Cyclones? Science 313: 452–454. http://www.sciencemag.org/content/ 313/5786/452 (last accessed 8 August 2012).
Lau, W. K. M., and Kim K.-M. 2012. The 2010 Pakistan Flood and Russian Heat Wave:
Teleconnection of Hydrometeorological Extremes. Journal of Hydrometeorology 13:392–403.
Lenderink, G., and E. van Meijgaard. 2010. Linking Increases in Hourly Precipitation Extremes
to Atmospheric Temperature and Moisture Changes. Environment Research Letters 5(2). http://iopscience.iop.org/1748-9326/5/2/025208/ (last accessed 15 December 2011).
Manila Observatory. 2011. Technical Primer on Climate Change in the Philippines.
Congressional Commission on Science & Technology and Engineering (COMSTE) Conference on Engineering Resilience, Confronting Risk Beyond Adaptation. 15–16 March 2010. Held at Sofitel, Philippine Plaza Manila. http://www.bar.gov.ph/ climatechange/materials/primer.pdf (last accessed 8 August 2012).

36 І ADB Economics Working Paper Series No. 358
———. 2012. Temperature Projections for the Philippines. Unpublished report. Maplecroft. 2012. Natural Hazards Risk Atlas. Bath: Maplecroft. McGranahan G., D. Balk, and B. Anderson. 2007. The Rising Tide: Assessing the Risks of
Climate Change and Human Settlements in Low Elevation Coastal Zones. Environment and Urbanization. 19(1): 17–37.
Min, S.-K., X. Zhang, F. Zwiers, and G. Hegerl. 2011. Human Contribution to More Intense
Precipitation Extremes. Nature. 470:378–381 http://www.nature.com/nature/journal/ v470/n7334/full/nature09763.html (last accessed 8 August 2012).
Munich Re. 2012. 2011 Natural Catastrophe Year in Review. Powerpoint Presentation.
4 January. http://www.iii.org/assets/docs/ppt/MunichRe-010412.ppt (last accessed 8 August 2012).
O'Brien, K. S. Eriksen, L. P. Nygaard, and A. Schjolden. 2007. Why Different Interpretations of
Vulnerability Matter in Climate Change Discourses. Climate Policy 7(1): 73–88. O’Gorman, P. A., and T. Schneider. 2009. The Physical Basis for Increases in Precipitation
Extremes in Simulations of 21st-century Climate Change. Proceedings of the National Academy of Sciences 106(35): 14773–14777. http://www.pnas.org/content/ 106/35/14773.short (last accessed 8 August 2012).
Philippine Atmospheric, Geophysical and Astronomical Services Administration. (PAGASA)
2011. Climate Change in the Philippines. http://kidlat.pagasa.dost.gov.ph /cab/climate_change/main.html (last accessed 8 August 2012).
Pall P., T. Aina, D. A. Stone, P. A. Stott, T. Nozawa, A. G. Hilberts, D. Lohmann, M. R. Allen.
2011. Anthropogenic Greenhouse Gas Contribution to Flood Risk in England and Wales in Autumn 2000. Nature 470(7334): 382–5.
Pielke, R. 2012. I Am “Roughly” 18 Feet Tall: A Critique of Grinsted et al. 2012.
http://rogerpielkejr.blogspot.co.uk/2012/11/i-am-roughly-18-feet-tall-critque-of.html (last accessed 13 May 2013).
———. 2013. Fool Me Once: Munich Re's Thunderstorm Claims
http://rogerpielkejr.blogspot.co.uk/2013/04/fool-me-once-munich-res-thunderstorm.html?spref=tw&m=1
Rahmstorf, S., and D. Coumou. 2011. Increase of Extreme Events in a Warming World.
Proceedings of National Academy of Sciences of the United States of America. 108(44): 17905–17909.
Rudolf, B., A. Becker, U. Schneider, A. Meyer-Christoffer, and M. Ziese. 2010. GPCC Status
Report. http://www.dwd.de/bvbw/generator/DWDWWW/Content/Oeffentlichkeit/KU/ KU4/KU42/en/Reports__Publications/GPCC__status__report__2010,templateId=raw,property=publicationFile.pdf/GPCC_status_report_2010.pdf (last accessed 15 December 2011).
Climate-Related Disasters in Asia and the Pacific І 37
Sander, J., J. F. Eichner, E. Faust, and M. Steuer. 2013. Rising Variability in Thunderstorm-related US Losses as a Reflection of Changes in Large-scale Thunderstorm Forcing. Weather, Climate and Society. http://dx.doi.org/10.1175/WCAS-D-12-00023.1
Schreider, S. Y., D. I. Smith, and A. J. Jakeman. 2000. Climate Change Impacts on Urban
Flooding. Climatic Change 47(1–2): 91–115. Scripps CO2 Program. 2012. Scripps CO2 Data. Mauna Loa Observatory, Hawaii.
http://co2now.org/Current-CO2/CO2-Now/scripps-co2-data-mauna-loa-observatory.html (last accessed 8 August 2012).
Smith B., and J. Wandel. 2006. Adaptation, Adaptive Capacity and Vulnerability. Global
Environmental Change 16(3): 282–292. Stott, P., D. Stone, and M. Allen. 2004. Human Contribution to the European Heatwave of 2003.
Nature. 432:610–614. http://www.nature.com/nature/journal/v432/n7017/abs/ nature03089.html (last accessed 15 December 2011).
Taubenbock, H., J. Post, A. Roth, K. Zosseder, G. Strunz, and S. Dech. 2008. Conceptual
Vulnerability and Risk Framework as Outline to Identify Capabilities of Remote Sensing. Natural Hazards and Earth System Sciences 8:409–420. www.nat-hazards-earth-syst -sci.net/8/409/2008/ (last accessed 9 August 2012).
The Royal Society. 2010. Climate Change: A Summary of the Science.
http://royalsociety.org/uploadedFiles/Royal_Society_Content/policy/publications/2010/4294972962.pdf (last accessed 8 August 2012).
Thomalla, F., T. Downing, E. Spanger-Siegfried, G. Y. Han, and J. Rockstrom. 2006. Reducing
Hazard Vulnerability: Towards a Common Approach between Disaster Risk Reduction and Climate Adaptation. Disasters 30(1): 39–48.
Thomas, V. 2011. Disasters, Climate, and Growth. Independent Evaluation Group (IEG)
Working Paper. World Bank. Thomas, V., J. R. Albert, and R. Perez. 2012. Examination of Intense Climate-related Disasters
in Asia-Pacific. Discussion Paper 2012–16. Philippine Institute for Development Studies. http://dirp4.pids.gov.ph/ris/dps/pidsdps1216.pdf (last accessed 9 August 2012).
Trenberth, K. E. 2005. The Impact of Climate Change and Variability on Heavy Precipitation,
Floods, and Droughts. In M. G. Anderson, ed. Encyclopedia of Hydrological Sciences. John Wiley & Sons, Ltd. http://acacia.ucar.edu/cas/Trenberth/EHShsa211.pdf (last accessed 9 August 2012).
———. 2011. Changes in Precipitation with Climate Change. Climate Change Research
47:123–138. Turner II, B. L., R. E. Kasperson, P. A. Matsone, J. J. McCarthy, R. W. Corell, L. Christensene,
N. Eckley, J. X. Kasperson, A. Luerse, M. L. Martello, C. Polskya, A. Pulsiphera, and A. Schiller. 2003. A Framework for Vulnerability Analysis in Sustainability Science. Proceedings of the National Academy of Sciences 100(14): 8074–79.
38 І ADB Economics Working Paper Series No. 358
United Nations International Strategy for Disaster Reduction [UNISDR] – Asia and Pacific. 2011. At the Crossroads: Climate Change Adaptation and Disaster Risk Reduction in Asia and the Pacific. http://www.unisdr.org/files/21414_21414apregionalmappingdrrcca1.pdf (last accessed 9 August 2012).
———. 2012. Reducing Vulnerability and Exposure to Disasters: Asia-Pacific Disaster Report
2012. http://www.unisdr.org/files/29288_apdr2012finallowres.pdf (last accessed 5 January 2013).
United Nations University-Institute for Environment and Human Security [UNU-IEHS]. 2012. UN
World Risk Report 2012: Environmental Degradation and Disasters. Berlin: Alliance Development Works. http://www.ehs.unu.edu/file/get/10487.pdf
Ward, J., S. Baptist, P. Gradwell, M. Krahe, C. Hepburn, D. Anthoff, and C. Hope. 2012. Self-
interested Low-carbon Growth in Brazil, [the People’s Republic of] China, and India. Global Journal of Emerging Market Economies 4(3): 291–318.
Westra, S., L. V. Alexander, and F. W. Zwiers. 2012. Global Increasing Trends in Annual
Maximum Daily Precipitation. Journal of Climate. http://dx.doi.org/10.1175/JCLI-D-12 -00502.1
World Bank. 2010. Natural Hazards, UnNatural Disasters: The Economics of Effective
Prevention. http://www.gfdrr.org/gfdrr/nhud-home (last accessed 15 December 2011). ———. 2011. World Development Indicators. http://databank.worldbank.org (last accessed
15 December 2011). ———. 2012a. Thai Flood 2011: Rapid Assessment for Resilient Recovery and Reconstruction
Planning. http://www.gfdrr.org/gfdrr/sites/gfdrr.org/files/publication/Thai_Flood_2011 _2.pdf (last accessed 29 July 2011).
———. 2012b. Turn Down the Heat: Why a 4oC Warmer World Must be Avoided.
http://climatechange.worldbank.org/sites/default/files/Turn_Down_the_heat_Why_a_4 _degree_centrigrade_warmer_world_must_be_avoided.pdf (last accessed 17 March 2013).

Climate-Related Disasters in Asia and the Pacific
Vinod Thomas, Jose Ramon G. Albert, and Rosa T. Perez
No. 358 | July 2013
ADB Economics Working Paper Series
Climate-Related Disasters in Asia and the PacificThe frequency of intense natural disasters resulting from floods and storms as well as droughts and heat waves has been on the rise in the Asia and Pacific region. At the same time, the climate in the region is observed to be changing. Three disaster risk factors—rising population exposure, greater population vulnerability, and increasing climate-related hazards—are found to be associated with the increased frequency of intense natural disasters in the region.
About the Asian Development BankADB’s vision is an Asia and Pacific region free of poverty. Its mission is to help its developing member countries reduce poverty and improve the quality of life of their people. Despite the region’s many successes, it remains home to two-thirds of the world’s poor: 1.7 billion people who live on less than $2 a day, with 828 million struggling on less than $1.25 a day. ADB is committed to reducing poverty through inclusive economic growth, environmentally sustainable growth, and regional integration. Based in Manila, ADB is owned by 67 members, including 48 from the region. Its main instruments for helping its developing member countries are policy dialogue, loans, equity investments, guarantees, grants, and technical assistance.
Asian Development Bank6 ADB Avenue, Mandaluyong City1550 Metro Manila, Philippineswww.adb.org/economics
Printed on recycled paper Printed in the Philippines