download the press release (.pdf 534.17 kb)
TRANSCRIPT
Press Release 17.02.2015 1/18
Press release
17.02.2015
2014 results
Another year of solid performances
Consolidated revenue
€10,038 million, up 4.5% on a comparable basis
Luxury Activities: €6,759 million, up 4.9% on a comparable basis
Recurring operating income
€1,664 million, up 3% on a comparable basis
Operating margin of 16.6%
Luxury Activities: €1,666 million, up 5.3% on a comparable basis
Financial position
Net debt of 2.2x EBITDA
Proposed dividend of €4 per share, up 7%
- Sustained, consistent revenue growth throughout the year
- Solid advance in Luxury sales, driven by the directly operated network in mature
markets
o New management team in place at Gucci
o Continued strong sales growth at Bottega Veneta
o Yves Saint Laurent revenue doubled over past three years
- Puma sales recovery confirmed
- Sharp increase in free cash flow from operations
- Robust financial position.
François-Henri Pinault, Kering's Chairman and Chief Executive Officer, commented:
"The dynamic sales growth and increase in operating income of the Group's Luxury activities
confirm the relevance of our multi-brand model and demonstrate our ability to unlock the
potential of each our brands, exploit their complementarity, and nurture their development.
The transformations carried out in 2014 from both an organisational and operational
standpoint have allowed us to step up our responsiveness, and achieve a greater degree of
integration and specialisation of our activities. The Group's unique characteristics, as
expressed in its strategic vision and management culture, are a key asset to deliver organic
growth, our number one priority in 2015, in a macroeconomic and currency environment
which remains unsettled. I am confident in the Group's ability to achieve sustainable
profitable growth while focusing in the shorter term on our brands’ cash flow generation.”

Press Release 17.02.2015 2/18
Key financial indicators
(in € million) 2014
2013
Change (1)
Revenue 10,037.5 9,655.7 +4.0%
Recurring operating income 1,664.0 1,751.2 -5.0%
as a % of revenue 16.6% 18.1% -1.6 pts
Recurring operating income – Luxury
Recurring operating income – Sport & Lifestyle
Net income, Group share
Recurring net income, Group share*
1,665.6
137.5
528.9
1,177.4
1,683.7
200.4
49.6
1,231.3
-1.1%
-31.4%
+966.3%
-4.4%
(1)
Reported change.
* Recurring net income, Group share: net income, Group share, from continuing operations, excluding non-recurring
items.
Consolidated revenue from continuing operations amounted €10,038 million in 2014, up 4%
as reported and 4.5% based on a comparable scope and exchange rates. The Group's balance in
terms of brand portfolio, geographic presence and distribution channels makes it more resilient to
changes in the economic environment despite a difficult global context and the unsettled market
conditions that have prevailed for several quarters now. Revenue generated outside the eurozone
accounted for 79% of sales in 2014. Revenue growth was sustained in mature markets at 3.8%
based on comparable data, driven by Japan and North America. Emerging markets were up 5.6%
on a comparable basis, and accounted for 38% of the Group’s total sales.
Kering’s recurring operating income amounted €1,664 million in 2014, up 3.0% on 2013 at
comparable exchange rates, and down 5% on a reported basis. The Group's recurring
operating margin came out at 16.6%, while gross margin for 2014 amounted €6,296 million, up
€255 million or 4.2% on the previous year as reported.
At €1,991 million, EBITDA was 2.6% lower than in 2013, and the EBITDA margin inched down by
1.4 percentage points to 19.8% in 2014 from 21.2% the previous year.
Adjusted from non-recurring items net of tax, net income, Group share from continuing
operations totalled €1,177 million.
Earnings per share from continuing operations came to €8.00 in 2014, compared with €6.93
for the previous year. Excluding non-recurring items, earnings per share from continuing
operations amounted to €9.35, down 4.4% on the 2013 figure. Earnings per share stood at
€4.20 in 2014 versus €0.39 for the previous year.
Press Release 17.02.2015 3/18
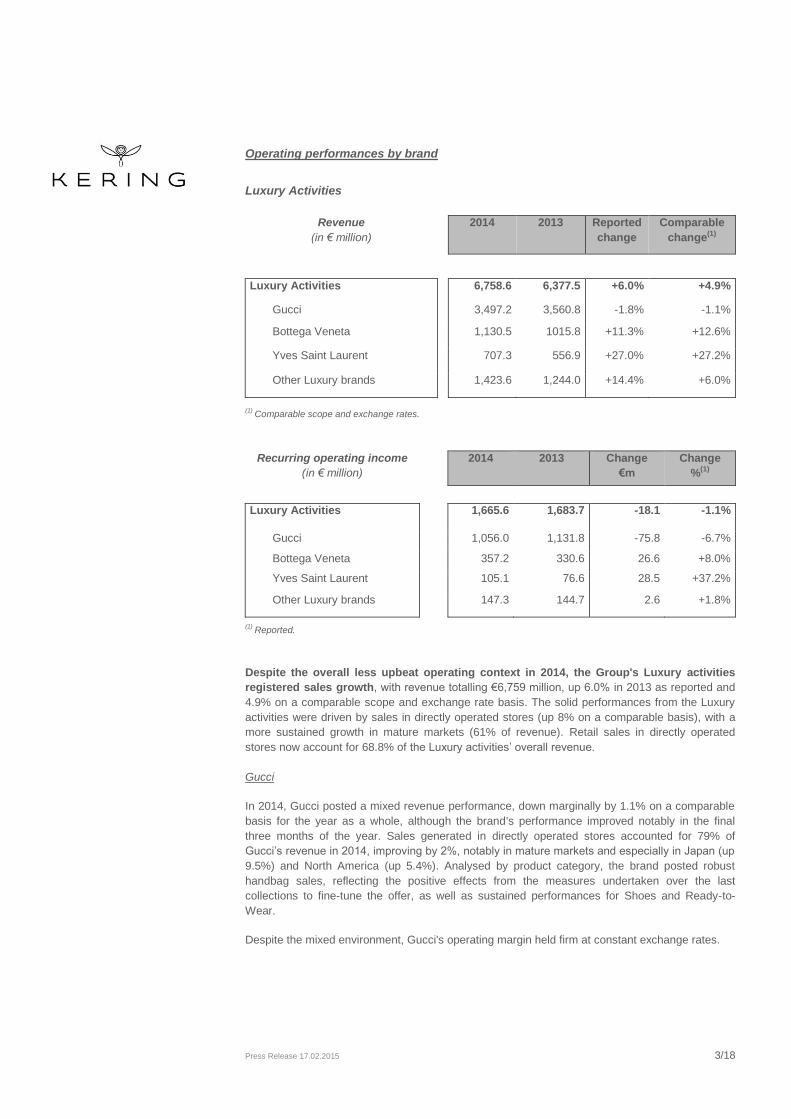
Operating performances by brand
Luxury Activities
Revenue
(in € million)
2014 2013 Reported
change
Comparable
change(1)
Luxury Activities 6,758.6 6,377.5 +6.0% +4.9%
Gucci 3,497.2 3,560.8 -1.8% -1.1%
Bottega Veneta 1,130.5 1015.8 +11.3% +12.6%
Yves Saint Laurent 707.3 556.9 +27.0% +27.2%
Other Luxury brands 1,423.6 1,244.0 +14.4% +6.0%
(1)
Comparable scope and exchange rates.
Recurring operating income
(in € million)
2014 2013 Change
€m
Change
%(1)
Luxury Activities 1,665.6 1,683.7 -18.1 -1.1%
Gucci 1,056.0 1,131.8 -75.8 -6.7%
Bottega Veneta 357.2 330.6 26.6 +8.0%
Yves Saint Laurent 105.1 76.6 28.5 +37.2%
Other Luxury brands 147.3 144.7 2.6 +1.8%
(1) Reported.
Despite the overall less upbeat operating context in 2014, the Group's Luxury activities
registered sales growth, with revenue totalling €6,759 million, up 6.0% in 2013 as reported and
4.9% on a comparable scope and exchange rate basis. The solid performances from the Luxury
activities were driven by sales in directly operated stores (up 8% on a comparable basis), with a
more sustained growth in mature markets (61% of revenue). Retail sales in directly operated
stores now account for 68.8% of the Luxury activities’ overall revenue.
Gucci
In 2014, Gucci posted a mixed revenue performance, down marginally by 1.1% on a comparable
basis for the year as a whole, although the brand's performance improved notably in the final
three months of the year. Sales generated in directly operated stores accounted for 79% of
Gucci’s revenue in 2014, improving by 2%, notably in mature markets and especially in Japan (up
9.5%) and North America (up 5.4%). Analysed by product category, the brand posted robust
handbag sales, reflecting the positive effects from the measures undertaken over the last
collections to fine-tune the offer, as well as sustained performances for Shoes and Ready-to-
Wear.
Despite the mixed environment, Gucci's operating margin held firm at constant exchange rates.

Press Release 17.02.2015 4/18
Bottega Veneta
In 2014, Bottega Veneta registered a new strong increase of its sales, up 12.6% at comparable
exchange rates. The brand's revenue as reported has more than doubled since 2010. Bottega
Veneta’s directly operated stores accounted for 80% of the brand’s total sales in 2014. Revenue
growth for directly operated stores was once again extremely solid during the year, at 10.8% on a
comparable basis. Leather Goods remain the brand's core business, recording extremely robust
year-on-year sales growth of 14.3%. As in 2013, Bottega Veneta's sales growth was evenly
balanced between its historical and emerging markets, which recorded respective revenue
increases of 13.9% and 10.9% at comparable exchange rates.
Bottega Veneta reported recurring operating income up 8.0% for 2014 and maintained its
operating margin at a very high level.
Yves Saint Laurent
Building on the brand’s outstanding sales growth in 2013 and the brand's return to the forefront of
the industry, Yves Saint Laurent reported another surge in sales in 2014, with revenue up 27.0%
year on year as reported and 27.2% based on comparable exchange rates. This performance
testifies to the brand's renewed appeal and its major contribution to the growth of the Group's
results. Yves Saint Laurent revenue doubled in three years, driven by its successful market
repositioning. Propelled by strong sales in directly operated stores, which soared 40.3% at
constant exchange rates, all main product categories and geographic areas reported solid growth.
Yves Saint Laurent ended 2014 with recurring operating income up 37.2% year on year and a
recurring operating margin of 14.9%.
Other Luxury brands
Total revenue generated by Other Luxury brands in 2014 was up 14.4% year on year as reported
and 6.0% on a comparable Group structure and exchange rate basis. The main growth drivers
were the Couture and Leather Goods brands, which posted an overall revenue rise of around 9%
based on comparable data. The Timepieces and Jewellery brands felt the impact of tougher
market conditions, with the Timepieces category particularly affected.
Sales by the wholesale network were up 2.1% versus 2013 on a comparable basis. Wholesale
was once again the main distribution channel for Other Luxury brands, accounting for 55.2% of
sales, reflecting the differing stages of development of the Couture and Leather Goods brands as
well as the specific distribution characteristics for Timepieces and Jewellery. Retail sales in
directly operated stores advanced 12.6% based on comparable data, led by the strong
performance of Couture and Leather Goods brands. Sales growth in 2014 was stronger in
emerging markets than in mature markets (11.7% versus 3.9% on a comparable basis).
Recurring operating income for Other Luxury brands climbed 1.8% to €147 million, while the
recurring operating margin came out at 10.3%.

Press Release 17.02.2015 5/18
Sport & Lifestyle Activities
Revenue
(in € million)
2014 2013 Reported
change
Comparable
change(1)
Sport & Lifestyle Activities 3,245.1 3,247.0 -0.1% +3.5%
Puma 2,990.2 3,001.9 -0.4% +3.4%
Other Sport & Lifestyle brands 254.9 245.1 +4.0% +4.7%
(1) Comparable scope and exchange rates.
Recurring operating income
(in € million)
2014 2013 Change
€m
Change
%(1)
Sport & Lifestyle Activities
137.5 200.4 -62.9 -31.4%
Puma
128.0 191.9 -63.9 -33.3%
Other Sport & Lifestyle brands
9.5 8.5 1.0 +11.8%
(1)
Reported.
Despite ongoing fierce competitive pressure and a volatile and unsettled economic environment in
certain regions, the Sport & Lifestyle activities reported solid 3.5% revenue growth in 2014
based on comparable exchange rates, with sales remaining virtually stable on a reported
basis. This period-on-period improvement was attributable to the measures undertaken for all
brands.
Puma
2014 was a pivotal year for Puma, during which the brand accelerated the implementation of its
strategy and action plan. Consequently, Puma’s revenue was up 3.4% on a comparable basis,
due in particular to revenue growth picking up in the second half of the year (up 6.3%). Wholesale
sales – which represented 78.7% of the brand's total revenue – rose by 3.3% on a comparable
basis. Revenue generated by Puma’s directly operated stores climbed 3.9% in 2014 on a
comparable basis, with all of the brand’s main regions recording increases. Footwear remained
Puma’s largest product category, representing 42.9% of sales, with business picking up in the last
three months of the year (up 4.7%). Sales of Apparel and Accessories posted sustained
comparable-basis growth of 7.7% and 9.3% respectively, reflecting the successful partnership
with London-based Arsenal Football Club as well as the positive effects of the football World Cup.
The change in Puma’s recurring operating income reflects the brand's relaunch initiatives as well
as negative currency effects.
Other Sport & Lifestyle brands
Against a backdrop of ongoing tough market conditions in 2014 for Surfwear and Action Sports,
Volcom and Electric recorded revenue growth of 4.0% year on year as reported and 4.7% based
on constant exchange rates, reaping the benefits of the strategic repositioning launched in 2013.
Volcom and Electric’s combined recurring operating income increased in 2014, as did the
recurring operating margin which came out at 3.7%.

Press Release 17.02.2015 6/18
Financial performance
In 2014, the cost of net debt came out at €151 million, 13% lower than in 2013. This year-on-
year decrease was primarily due to a reduction in Kering's average cost of borrowing, particularly
thanks to much lower interest rates on the Group's bond debt.
Due to the tax effect of a number of non-recurring operating income items recorded during the
year, Kering's effective tax rate rose significantly in 2014 to 24%, with the recurring tax rate
standing at 18.3%.
In 2014, other non-recurring operating income and expenses represented a net expense of
€112 million and primarily included the net gain on the disposal of a property complex and asset
impairment losses and restructuring costs for the Luxury activities.
The Group reported a €479 million net loss from discontinued operations during the year. Of
this amount, €355 million related to Redcats, which primarily included the cost of financing the
guarantees to be granted to the employees affected by the modernisation measures put in place
at La Redoute and Relais Colis. This financing amounted to €200 million and was used by Kering
to set up a trust guaranteeing the application of the employee measures approved in a majority
collective agreement signed with the relevant trade unions. The net loss also includes a provision
recorded to cover certain vendor warranties granted in connection with the sale as well as
impairment losses recognised against the residual assets of these companies and an expense
recognised with regard to the transfer of Redcats UK's pension fund assets to an insurer in
December 2014. The impacts of the sale of residual assets of Redcats, Diam and Movitex are
also included in this caption.
Cash flows and financial position
In 2014, the Group's free cash flow from operations came to just under €1,078 million, up
25.8% compared to 2013. Generating free cash flow from operations is a key financial objective
for all of the Group's brands.
As of December 31, 2014, Kering had a very sound financial structure:
(in € million) 2014 2013
Capital employed 15,628 14,823
Net assets held for sale 24.6 (184)
Total equity 11,262 11,196
Net debt 4,391 3,443
The Group's net debt totalled €4,391 million as of December 31, 2014, representing a 27.5%
increase compared with the previous year-end.
2014 2013
Gearing (net debt/equity) 39% 30.8%
Solvency ratio (net debt/EBITDA) 2.21 1.68

Press Release 17.02.2015 7/18
Dividend
At its February 16, 2015 meeting, the Board decided that, at the Annual General Meeting to be
held to approve the financial statements for the year ended December 31, 2014, it will ask
shareholders to approve a €4.00 per-share cash dividend for 2014.
An interim dividend in the amount of €1.50 per share was paid on 26 January, 2015 pursuant to a
decision by the Board of Directors on 8 December, 2014.
This recommended dividend reflects Kering's goal of maintaining well-balanced payout ratios
bearing in mind, on the one hand, changes in net income from continuing operations (excluding
non-recurring items) attributable to owners of the parent and, on the other hand, the amount of
available cash flow.
Outlook
Positioned in structurally high-growth markets, Kering has very solid fundamentals and a portfolio
of powerful brands with strong potential.
2015 will see the continuation of Puma’s relaunch plan as well as the rollout of dedicated action
plans for each of the Luxury activities' brands, focusing – as in 2014 – on achieving profitable
organic growth.
In an economic environment that remains unsettled, recent currency trends, should they continue,
could have a positive impact on sales but mixed effects on Group results. Against this backdrop,
Kering intends to pursue its strategy of rigorously managing and allocating its resources, with a
view to optimising its operating performance. Going forward, a particular focus for the Group will
be its brands' cash-flow generation.
---
At its meeting on 16 February, 2015, the Board of Directors, under the chairmanship of François-
Henri Pinault, approved the audited consolidated financial statements for 2014.

Press Release 17.02.2015 8/18
PRESENTATION
A live videocast (Real and Windows Media Player formats) of the presentation of the 2014
Annual Results as well as the presentation slides and 2014 financial report (pdf) will be available
at 9:00am Paris time on www.kering.com.
A replay will be available later in the day.
You will also be able to listen to the conference live or in replay by dialling:
French
Live conference:
+33 (0)1 70 77 09 22
Replay dial-in details:
+33 (0)1 72 00 15 01
Replay passcode: 291783#
English
Live conference:
+44 (0)203 367 94 56
Replay dial-in details:
+44 (0)203 367 94 60
Replay passcode: 291784#
The replay will be available until 17 March, 2015.
The 2014 financial report report will be available at www.kering.com.
About Kering
A world leader in apparel and accessories, Kering develops an ensemble of powerful Luxury and Sport &
Lifestyle brands: Gucci, Bottega Veneta, Saint Laurent, Alexander McQueen, Balenciaga, Brioni, Christopher
Kane, McQ, Stella McCartney, Tomas Maier, Sergio Rossi, Boucheron, Dodo, Girard-Perregaux, JeanRichard,
Pomellato, Qeelin, Ulysse Nardin, Puma, Volcom, Cobra, Electric and Tretorn. By ‘empowering imagination’ in
the fullest sense, Kering encourages its brands to reach their potential, in the most sustainable manner.
Present in more than 120 countries, the Group generated revenues of €10 billion in 2014 and had more than
37,000 employees at year end. The Kering (previously PPR) share is listed on Euronext Paris
(FR 0000121485, KER.PA, KER.FP).
Contacts
Press
Hélène Saint-Raymond +33 (0)1 45 64 61 20 [email protected]
Floriane Geroudet +33 (0)1 45 64 66 00 [email protected]
Analysts/investors
Claire Roblet + 33 (0)1 45 64 61 49 [email protected]
Edouard Crowley + 33 (0)1 45 64 63 28 [email protected]
Website: www.kering.com

Press Release 17.02.2015 9/18
31 DECEMBER, 2014
CONSOLIDATED FINANCIAL STATEMENTS AND ADDITIONAL
INFORMATION
Contents page
Highlights and subsequent events 10
Consolidated income statement 12
Consolidated statement of financial position 13
Consolidated statement of cash flows 14
Breakdown of revenue 15
Breakdown of recurring operating income 17
Main definitions 18

Press Release 17.02.2015 10/18
2014 highlights
Kering reorganises its Luxury activities to accelerate the growth of its brands
In April 2014, Kering announced the creation of two new divisions – “Luxury – Couture & Leather
Goods” and “Luxury – Watches & Jewellery” – both reporting to François-Henri Pinault, the
Group’s Chairman and CEO. To foster the continuing expansion of Kering's Luxury business
resulting from both its organic growth and the acquisitions carried out in 2012 and 2013, the
Group has put in place a more specialised oversight structure for the business. The underlying
aim of this reorganisation is to strengthen the Group's monitoring processes and more specifically
focus on the expertise that it provides to its brands in order to accelerate their growth. The
autonomy of each of Kering's brands will be fully respected in the reorganisation and the brands
will remain under the operational responsibility of their respective CEOs.
In the second half of 2014, the new CEOs took up their roles in the new divisions and Marco
Bizzarri, CEO of the Luxury – Couture & Leather Goods division since April 2014, was appointed
CEO of Gucci further to Patrizio di Marco's departure at the end of December 2014.
Finalisation of the sale of Redcats
On June 3, 2014, Kering announced that it had closed the sale of La Redoute and Relais Colis to
Nathalie Balla, Chairman and CEO of La Redoute, and Eric Courteille, Chief Administrative
Officer of Redcats, in accordance with the conditions specified in the sale agreement and in
keeping with all the commitments made within the framework of the disposal process.
On December 3, 2014, Kering sold its stake in Diam to the Prenant group and announced that it
had signed an agreement for the sale of Movitex, which was completed in January 2015. This
agreement marks the end of the disposal process for Redcats.
The results of Redcats' activities during the year represented a €355 million loss which was
recorded under "Net income (loss) from discontinued operations". This amount includes mainly
the cost of financing the social guarantees to be granted to the employees concerned by the
modernisation measures at La Redoute and Relais Colis for €200 million. It also includes a
provision for vendor warranties given in connection with the sale.
Acquisition of Ulysse Nardin
On November 19, 2014, Kering announced that it had finalised the acquisition of 100% of Ulysse
Nardin. The brand will join Kering's "Luxury – Watches & Jewellery" division. Founded in 1846 by
Ulysse Nardin with its roots in the nautical world, the eponymous watchmaking house was taken
over and re-launched in 1983 by Rolf W. Schnyder who transformed it into a highly profitable
business with a strong financial structure. The company has a very strong brand identity based on
its historical expertise in marine chronometres and ultra-complex timepieces.
Ulysse Nardin is consolidated in the Group's financial statements with effect from 1 November.
The provisional purchase price accounting for this acquisition was still in progress at end-
December 2014.
Other highlights
In the first six months of 2014, Kering redeemed the remaining €550.1 million of the bond that
was issued in 2009 and matured in April 2014. The bond was originally issued in two tranches
representing an aggregate €800 million, of which €249.9 million was redeemed in 2011. Also
during this period, the Group redeemed the €150 million bond issued in June 2009 and maturing
in June 2014. To extend the maturity of its debt, Kering carried out a bond issue in second-half
2014 involving €500 million worth of seven-year bonds paying interest of 1.375%.

Press Release 17.02.2015 11/18
Subsequent events
Product partnership with Safilo
In September 2014, Kering announced its plan to invest in a dedicated entity specialised in luxury,
high-end and sport Eyewear managed by a skilled team of experienced professionals under the
direction of Roberto Vedovotto. This innovative management model for the Group's Eyewear
business will allow it to leverage the full potential of its brands in this category.
As part of this strategic move, Kering and Safilo agreed to further their partnership and intend to
terminate the current Gucci licence agreement two years in advance, i.e., by December 31, 2016.
On January 12, 2015, Kering announced that it had signed this agreement, which covers the
product development, manufacturing and supply of Gucci Eyewear products. The agreement will
be effective as of fourth-quarter 2015 in order to ensure a seamless transition for Gucci's Eyewear
business. The first of three €90 million indemnity payments was paid to Safilo at this date. The
subsequent payments are due in December 2016 and September 2018.
Sale of Movitex
On 15 January, 2015, Kering sold the assets of the Moxitex group to its management team. The
sale followed the recapitalisation of the company in accordance with the tentative agreement
signed on 3 December, 2014.

Press Release 17.02.2015 12/18
Consolidated income statement
(in € millions) 2014 2013
CONTINUING OPERATIONS
Revenue 10,037.5 9,655.7
Cost of sales (3,741.7) (3,615.2)
Gross margin 6,295.8 6,040.5
Payroll expenses (1,545.2) (1,515.5)
Other recurring operating income and expenses (3,086.6) (2,773.8)
Recurring operating income 1,664.0 1,751.2
Other non-recurring operating income and expenses (112.1) (440.7)
Operating income 1,551.9 1,310.5
Finance costs, net (197.4) (210.5)
Income before tax 1,354.5 1,100.0
Corporate income tax (325.6) (236.9)
Share in earnings (losses) of associates (0.8) 1.6
Net income from continuing operations 1,028.1 864.7
o/w attributable to owners of the parent 1,007.7 872.5
o/w attributable to non-controlling interests 20.4 (7.8)
DISCONTINUED OPERATIONS
Net income (loss) from discontinued operations (478.8) (824.7)
o/w attributable to owners of the parent (478.8) (822.9)
o/w attributable to non-controlling interests (1.8)
Net income of consolidated companies 549.3 40.0
Net income attributable to owners of the parent 528.9 49.6
Net income attributable to non-controlling interests 20.4 (9.6)
Net income attributable to owners of the parent 528.9 49.6
Earnings per share (in €) 4.20 0.39
Fully diluted earnings per share (in €) 4.20 0.39
Net income from continuing operations attributable to owners of the parent
1,007.7 872.5
Earnings per share (in €) 8.00 6.93
Fully diluted earnings per share (in €) 8.00 6.92
Net income from continuing operations (excluding non-recurring items), Group share
1,177.4 1,231.3
Earnings per share (in €) 9.35 9.78
Fully diluted earnings per share (in €) 9.35 9.77

Press Release 17.02.2015 13/18
Consolidated statement of financial position
ASSETS
(in € millions) Dec. 31, 2014 Dec. 31, 2013
Goodwill 4,039.9 3,770.1
Brands and other intangible assets 10,748.1 10,702.8
Property, plant and equipment 1,887.2 1,676.9
Investments in associates 23.2 17.3
Non-current financial assets 400.0 316.8
Deferred tax assets 758.0 649.9
Other non-current assets 36.2 30.1
Non-current assets 17,892.6 17,163.9
Inventories 2,234.7 1,805.5
Trade receivables 1,030.0 949.9
Current tax receivables 138.4 119.1
Other current financial assets 106.3 107.7
Other current assets 673.5 523.4
Cash and cash equivalents 1,089.9 1,419.2
Current assets 5,272.8 4,924.8
Assets classified as held for sale 88.5 722.1
Total assets 23,253.9 22,810.8
EQUITY AND LIABILITIES
(in € millions) Dec. 31, 2014 Dec. 31, 2013
Share capital 505.1 504.9
Capital reserves 2,427.4 2,424.3
Treasury shares (3.4) (10.4)
Translation adjustments (52.9) (115.3)
Remeasurement of financial instruments (86.9) 69.8
Other reserves 7,844.8 7,713.3
Equity attributable to owners of the parent 10,634.1 10,586.6
Non-controlling interests 628.2 609.3
Total equity 11,262.3 11,195.9
Non-current borrowings 3,192.2 3,132.4
Other non-current financial liabilities 2.8 0.7
Provisions for pensions and other post-employment benefits 111.9 92.8
Other provisions 49.3 113.2
Deferred tax liabilities 2,791.8 2,810.2
Non-current liabilities 6,148.0 6,149.3
Current borrowings 2,288.4 1,737.4
Other current financial liabilities 346.8 213.2
Trade payables 982.8 766.1
Provisions for pensions and other post-employment benefits 7.2 7.2
Other provisions 225.6 152.7
Current tax liabilities 277.9 310.1
Other current liabilities 1,651.0 1,372.3
Current liabilities 5,779.7 4,559.0
Liabilities associated with assets classified as held for sale 63.9 906.6
Total equity and liabilities 23,253.9 22,810.8

Press Release 17.02.2015 14/18
Consolidated statement of cash flows
(in € millions) 2014 2013
Net income from continuing operations 1,028.1 864.7
Net recurring charges to depreciation, amortisation and provisions on non-current operating assets
326.7 292.1
Other non-cash income and expenses (95.0) 387.8
Cash flow from operating activities 1,259.8 1,544.6
Interest paid/received 218.8 119.0
Dividends received (0.3)
Net income tax payable 365.7 320.1
Cash flow from operating activities before tax, dividends and interest
1,844.3 1,983.4
Change in working capital requirement (160.3) (75.0)
Corporate income tax paid (422.7) (387.2)
Net cash from operating activities 1,261.3 1,521.2
Purchases of property, plant and equipment and intangible assets
(551.4) (674.9)
Proceeds from disposals of property, plant and equipment and intangible assets
367.9 10.3
Acquisitions of subsidiaries, net of cash acquired (593.8) (342.1)
Proceeds from disposals of subsidiaries and associates, net of cash transferred
3.6 23.6
Purchases of other financial assets (144.1) (57.9)
Proceeds from sales of other financial assets 9.9 5.1
Interest and dividends received 5.3 70.0
Net cash used in investing activities (902.6) (965.9)
Increase/decrease in share capital and other transactions with owners
3.2 (84.3)
Treasury share transactions (8.5) (39.0)
Dividends paid to owners of the parent company (473.2) (471.2)
Dividends paid to non-controlling interests (24.4) (26.0)
Bond issues 862.7 938.9
Bond redemptions (948.1) (740.0)
Increase/decrease in other borrowings 546.7 (308.2)
Interest paid and equivalent (233.4) (185.6)
Net cash used in financing activities (275.0) (915.4)
Net cash used in discontinued operations (442.7) (443.4)
Impact of exchange rate variations (73.2) 66.0
Net increase (decrease) in cash and cash equivalents (432.2) (737.5)
Cash and cash equivalents at beginning of year 1,237.6 1,975.1
Cash and cash equivalents at end of year 805.4 1,237.6

Press Release 17.02.2015 15/18
Breakdown of revenue
(in € million)
Full-year 2014
Full-year 2013
Reported change
Comparable change
(1)
Q4 2014 Q4 2013 Reported change
Comparable change
(1)
Luxury Activities 6,758.6 6,377.5 +6.0% +4.9% 1,909.1 1,749.6 +9.1% +4.3%
Gucci
3,497.2 3,560.8 -1.8% -1.1% 969.9 941.2 +3.0% -0.5%
Bottega Veneta
1,130.5 1,015.8 +11.3% +12.6% 318.8 290.9 +9.6% +6.8%
Yves Saint Laurent
707.3 556.9 +27.0% +27.2% 208.9 162.3 +28.7% +25.3%
Other Luxury brands
1,423.6 1,244.0 +14.4% +6.0% 411.5 355.2 +15.9% +5.4%
Sport & Lifestyle Activities 3,245.1 3,247.0 -0.1% +3.5% 824.3 763.9 +7.9% +6.4%
Puma
2,990.2 3,001.9 -0.4% +3.4% 756.3 703.2 +7.6% +6.5%
Other Sport & Lifestyle brands
254.9 245.1 +4.0% +4.7% 68.0 60.7 +12.0% +6.3%
Corporate and other
33.8 31.2 +8.3% N/A 8.4 8.4 +0.0% N/A
KERING - Continuing activities
10,037.5 9,655.7 +4.0% +4.5% 2,741.8 2,521.9 +8.7% +4.9%
(1) On a comparable Group structure and exchange rate basis.
Press Release 17.02.2015 16/18
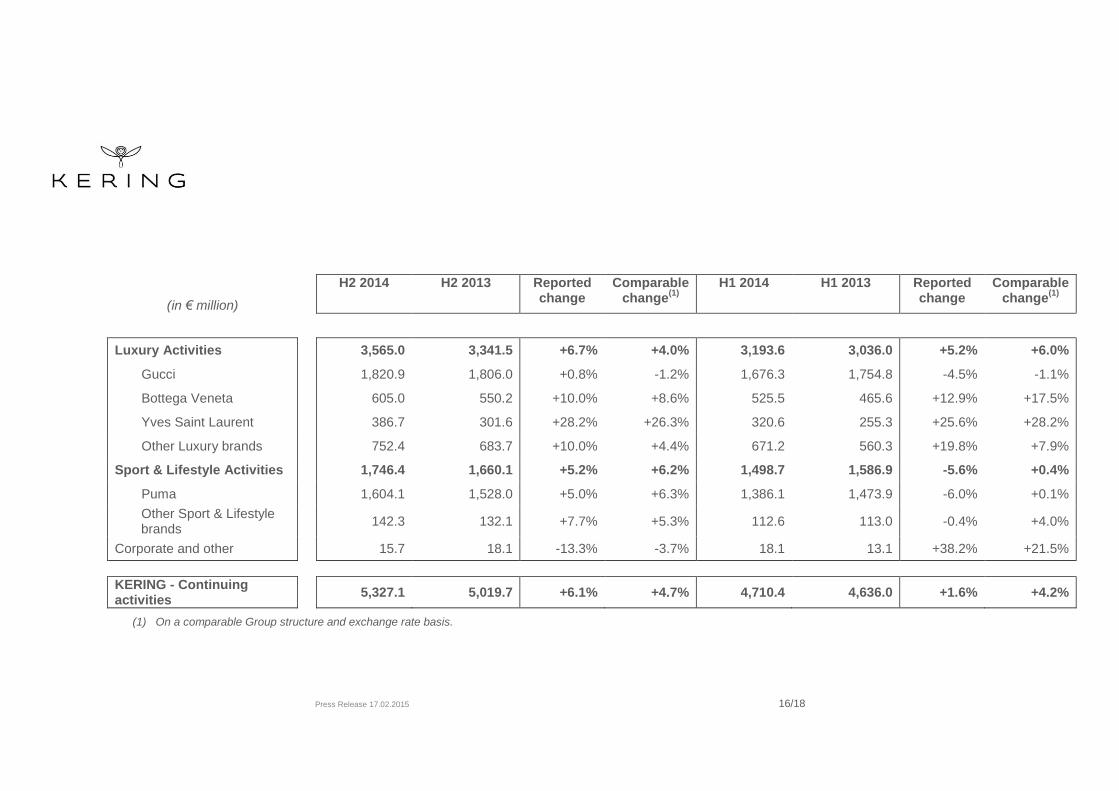
(in € million)
H2 2014 H2 2013 Reported change
Comparable change
(1)
H1 2014 H1 2013 Reported change
Comparable change
(1)
Luxury Activities 3,565.0 3,341.5 +6.7% +4.0% 3,193.6 3,036.0 +5.2% +6.0%
Gucci
1,820.9 1,806.0 +0.8% -1.2% 1,676.3 1,754.8 -4.5% -1.1%
Bottega Veneta
605.0 550.2 +10.0% +8.6% 525.5 465.6 +12.9% +17.5%
Yves Saint Laurent
386.7 301.6 +28.2% +26.3% 320.6 255.3 +25.6% +28.2%
Other Luxury brands
752.4 683.7 +10.0% +4.4% 671.2 560.3 +19.8% +7.9%
Sport & Lifestyle Activities 1,746.4 1,660.1 +5.2% +6.2% 1,498.7 1,586.9 -5.6% +0.4%
Puma
1,604.1 1,528.0 +5.0% +6.3% 1,386.1 1,473.9 -6.0% +0.1%
Other Sport & Lifestyle brands
142.3 132.1 +7.7% +5.3% 112.6 113.0 -0.4% +4.0%
Corporate and other
15.7 18.1 -13.3% -3.7% 18.1 13.1 +38.2% +21.5%
KERING - Continuing activities
5,327.1 5,019.7 +6.1% +4.7% 4,710.4 4,636.0 +1.6% +4.2%
(1) On a comparable Group structure and exchange rate basis.

Press Release 17.02.2015 17/18
Breakdown of recurring operating income
€m 2014 2013
Change
€m
Change
%(1)
Luxury Activities
1,665.6 1,683.7 -18.1 -1.1%
Gucci
1056.0 1,131.8 -75.8 -6.7%
Bottega Veneta
357.2 330.6 +26.6 +8.0%
Yves Saint Laurent
105.1 76.6 +28.5 +37.2%
Other brands
147.3 144.7 +2.6 +1.8%
Sport & Lifestyle Activities
137.5 200.4 -62.9 -31.4%
Puma
128.0 191.9 -63.9 -33.3%
Other brands
9.5 8.5 +1.0 +11.8%
Corporate and other
(139.1) (132.9) -6.2 -4.7%
Recurring operating income
1,664.0 1,751.2 -87.2 -5.0%
(1) Reported.

Press Release 17.02.2015 18/18
Main definitions
IFRS 5 – Non-current assets held for sale and discontinued operations
In accordance with IFRS 5 – Non-current Assets Held for Sale and Discontinued Operations, the Group has presented certain activities as “Non-current assets held for sale and discontinued operations”. The net income or loss from these activities is shown on a separate line of the income statement, “Net income (loss) from discontinued operations”, and is restated in the statement of cash flows and income statement for all reported periods. Assets and liabilities relating to assets held for sale and discontinued operations are presented on separate lines in the Group's statement of financial position, without restatement for previous periods. Definition of “reported” and “comparable” revenue
The Group’s “reported” revenue corresponds to published revenue. The Group also uses "comparable" data to measure organic growth. “Comparable” revenue is 2013 revenue restated for the impact of changes in Group structure in 2013 or 2014, and for translation differences relating to foreign subsidiaries’ revenue in 2013. Definition of recurring operating income
The Group's total operating income includes all revenues and expenses directly related to Group activities, whether these revenues and expenses are recurring or arise from non-recurring decisions or transactions. Other non-recurring operating income and expenses consists of items, which by their nature, amount or frequency, could distort the assessment of Group entities' operating performance. Other non-recurring operating income and expenses include impairment of goodwill and other intangible assets, gains or losses on disposals of property, plant and equipment and intangible assets, restructuring costs and costs relating to employee adaptation measures. Consequently, Kering monitors its operating performance using "Recurring operating income", defined as the difference between total operating income and other non-recurring operating income and expenses (see Notes 8 and 9 to the consolidated financial statements). Recurring operating income is an intermediate line item intended to facilitate the understanding of the entity's operating performance and which can be used as a way to estimate recurring performance. This indicator is presented in a manner that is consistent and stable over the long-term in order to ensure the continuity and relevance of financial information. Definition of EBITDA
The Group uses EBITDA to monitor its operating performance. This financial indicator corresponds to recurring operating income plus net charges to depreciation, amortisation and provisions on non-current operating assets recognised in recurring operating income. Definition of free cash flow from operations and available cash flow
The Group also uses an intermediate line item, “Free cash flow from operations”, to monitor its financial performance. This financial indicator measures net operating cash flow less net operating investments (defined as purchases and sales of property, plant and equipment and intangible assets). "Available cash flow" corresponds to free cash flow from operations plus interest and dividends received less interest paid and equivalent. Definition of net debt
As defined by CNC recommendation No. 2009-R.03 of July 2, 2009, net debt comprises gross borrowings, including accrued interest, less net cash. Net debt includes fair value hedging instruments recorded in the statement of financial position relating to bank borrowings and bonds whose interest rate risk is fully or partly hedged as part of a fair value relationship (see Note 32 to the consolidated financial statements). The financing of customer loans by fully-consolidated consumer credit businesses is presented in borrowings. Group net debt excludes the financing of customer loans by consumer credit businesses.