
Clean ProfitsPricing Carbon and Embracing the Economic Potential of Cap and Trade
About the Ontario Chamber of CommerceFor more than a century, the Ontario Chamber of Commerce (OCC) has been the independent, non-partisan voice of Ontario business. Our mission is to support economic growth in Ontario by defending business priorities at Queen’s Park on behalf of our network’s diverse 60,000 members.
From innovative SMEs to established multi-national corporations and industry associations, the OCC is committed to working with our members to improve business competitiveness across all sectors. We represent local chambers of commerce and boards of trade in over 135 communities across Ontario, steering public policy conversations provincially and within local communities. Through our focused programs and services, we enable companies to grow at home and in export markets.
The OCC provides exclusive support, networking opportunities, and access to innovative insight and analysis for our members. Through our export programs, we have approved over 1,300 applications, and companies have reported results of over $250 million in export sales.
The OCC is Ontario’s business advocate.
To learn more visit occ.ca or follow us @OntarioCofC
Clean Profits: Pricing Carbon and Embracing the Economic Potential of Cap and TradeAuthor: Scott BoutilierISBN Print: 978-1-928052-23-4ISBN PDF: 978-1-928052-24-1©2015 Ontario Chamber of Commerce
Clean ProfitsPricing Carbon and Embracing the Economic Potential of Cap and Trade
Table of ContentsA Letter from the Ontario Chamber of Commerce of Commerce
Summary of Recommendations
Introduction
What is Cap and Trade?
Ontario’s Cap and Trade System—What do we know?
What we’ve heard: Top Concerns for Business
Conclusion
Works Cited
i
1
2
3
5
8
21
22

CLEAN PROFITS | i
A LETTER FROM THE ONTARIO CHAMBER OF COMMERCEThe Government of Ontario’s decision to develop and implement a province-wide cap and trade system comes at an important time in the global climate change landscape. After a period of relative inaction, a number of national and sub-national jurisdictions have moved ahead recently with strategies to reduce their greenhouse gas (GHG) emissions. According to the International Carbon Action Partnership, there are currently 17 emissions trading systems in operation worldwide and an additional 15 in various stages of development—a rapid increase from just four in 2010. Ontario’s business community supports action to address climate change. If designed correctly, the government’s proposed cap and trade system could present some significant opportunities for Ontario. Over the past few months, the Ontario Chamber of Commerce has been working with its members and the broader business community, many of whom have practical experience in other jurisdictions that currently employ carbon pricing policies, to identify their top concerns regarding Ontario’s proposed cap and trade system. In this report, we have translated these concerns into a set of recommendations for government. Underlying these recommendations is a common message: to design an effective cap and trade system, businesses need to be part of the solution. Among our top recommendations are for government the direct the cap and trade proceeds in a way that helps businesses in the transition to a lower-carbon economy, and to ensure that the structural realities of Ontario’s economy are reflected in the design of the system. As of yet, few details of the cap and trade system have been released publicly. Without knowing how the system will impact their bottom line, businesses looking to grow and invest in Ontario face a difficult decision-making environment. The business community understands that the design of a cap and trade system takes time, but it is important that the government make an effort to minimize this uncertainty. I urge the province to continue working with all members of the business community as we develop a strategy that achieves the government’s environmental goals while fostering positive economic outcomes.
Sincerely,
Allan O’Dette,President & CEO, Ontario Chamber of Commerce
ONTARIO CHAMBER OF COMMERCE | 1
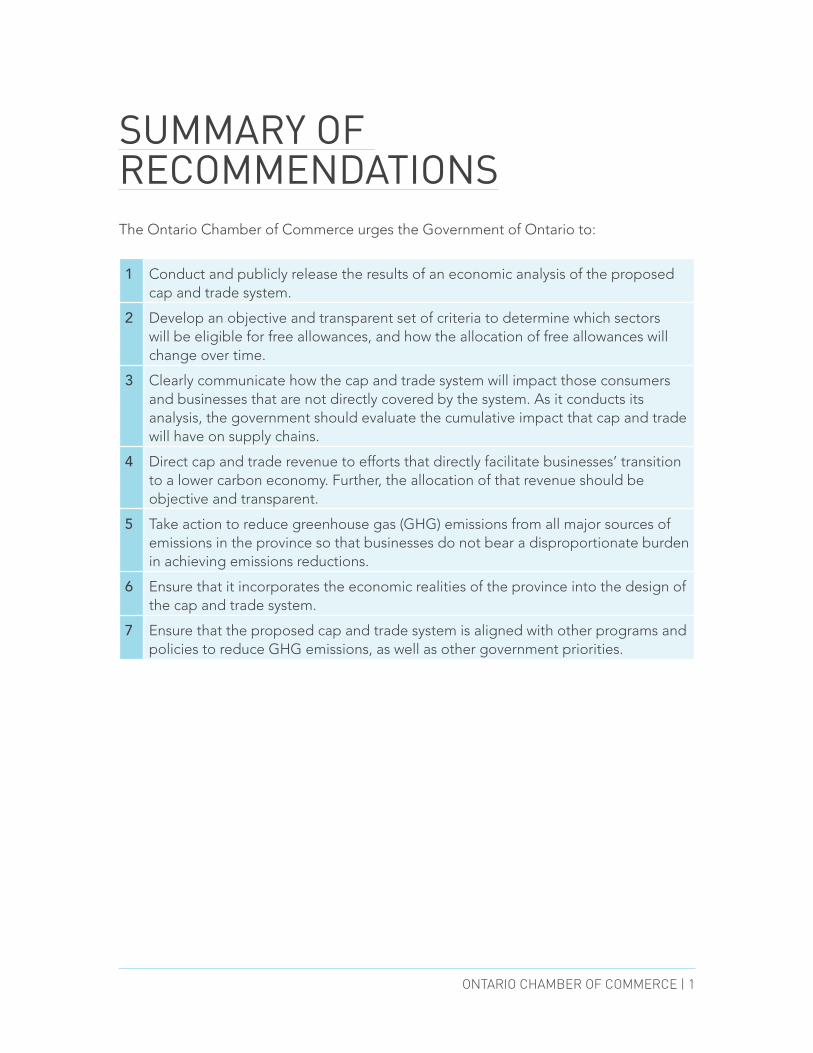
SUMMARY OF RECOMMENDATIONSThe Ontario Chamber of Commerce urges the Government of Ontario to:
1 Conduct and publicly release the results of an economic analysis of the proposed cap and trade system.
2 Develop an objective and transparent set of criteria to determine which sectors will be eligible for free allowances, and how the allocation of free allowances will change over time.
3 Clearly communicate how the cap and trade system will impact those consumers and businesses that are not directly covered by the system. As it conducts its analysis, the government should evaluate the cumulative impact that cap and trade will have on supply chains.
4 Direct cap and trade revenue to efforts that directly facilitate businesses’ transition to a lower carbon economy. Further, the allocation of that revenue should be objective and transparent.
5 Take action to reduce greenhouse gas (GHG) emissions from all major sources of emissions in the province so that businesses do not bear a disproportionate burden in achieving emissions reductions.
6 Ensure that it incorporates the economic realities of the province into the design of the cap and trade system.
7 Ensure that the proposed cap and trade system is aligned with other programs and policies to reduce GHG emissions, as well as other government priorities.
CLEAN PROFITS | 2
INTRODUCTIONIn April 2015, the Government of Ontario announced that it will implement a cap and trade system as part of its overall strategy to address climate change. This approach allows the government to set a limit on the total level of greenhouse gas emissions (GHGs) produced by entities covered by the cap and trade system. Further, these entities will be able to purchase and trade the ability to emit GHGs.
The decision to implement a cap and trade system in Ontario follows the global trend that has seen the widespread use of carbon pricing to reduce GHG emissions.
Ontario’s business community supports action to fight climate change. According to the latest report of the International Panel on Climate Change (IPCC), “human influence on the climate system is clear”, and “warming of the climate system is unequivocal” (IPCC 2014, pg. 2). Effective action to fight climate change requires coordinated efforts at all levels of government—local, sub-national, national, and international—and across all emitters.
Among strategies to reduce GHG emissions, businesses prefer market-based approaches that put a price on carbon, such as a carbon tax or a cap and trade system. In contrast to a strict regulatory approach (like government-mandated emissions standards), carbon-pricing policies can offer maximum flexibility for emitters to comply. Put simply, in a market-based system, government provides a price signal which emitters can respond to in a manner of their choosing. According to the Ecofiscal Commission, “carbon pricing’s big advantage is that it can drive a given amount of emissions reductions at lower cost than alternative policies” (2015, pg. 25).
However, to ensure that emitters are afforded the flexibility to achieve emissions reductions at the lowest cost, the system must be designed correctly.
So far, the design details of Ontario’s proposed cap and trade system have been unclear. In the context of a growing cumulative burden facing the business community, and a quickly approaching start date for the system, many businesses are concerned about this lack of clarity.
In this report, the Ontario Chamber of Commerce (OCC) seeks to identify the top concerns of Ontario’s business community regarding the proposed cap and trade system, and makes a series of recommendations on how to address these concerns.
The OCC is committed to working with the Government of Ontario to design a system that meets the government’s environmental goals while fostering positive economic outcomes. Ultimately, the goal of the cap and trade system, and Ontario’s climate change strategy more broadly, should be to help Ontarians transition to a more carbon-efficient economy.
ONTARIO CHAMBER OF COMMERCE | 3
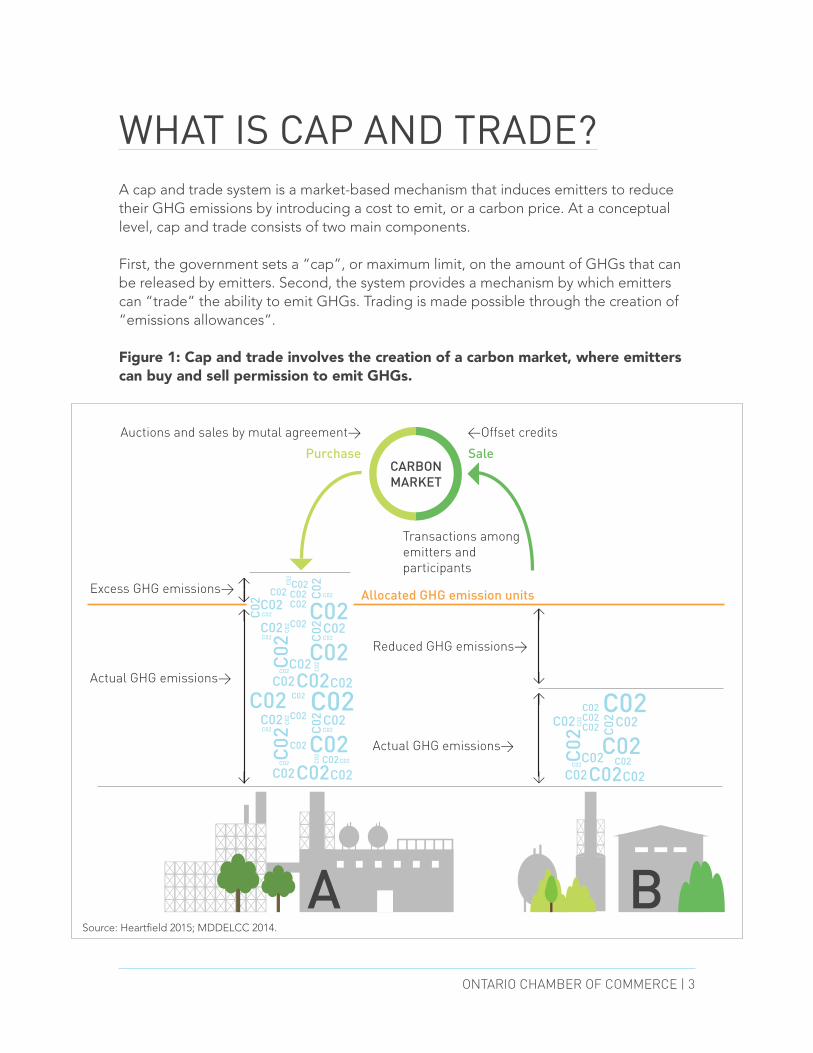
WHAT IS CAP AND TRADE?A cap and trade system is a market-based mechanism that induces emitters to reduce their GHG emissions by introducing a cost to emit, or a carbon price. At a conceptual level, cap and trade consists of two main components.
First, the government sets a “cap”, or maximum limit, on the amount of GHGs that can be released by emitters. Second, the system provides a mechanism by which emitters can “trade” the ability to emit GHGs. Trading is made possible through the creation of “emissions allowances”.
Figure 1: Cap and trade involves the creation of a carbon market, where emitters can buy and sell permission to emit GHGs.
A B
Reduced GHG emissions>
Actual GHG emissions>
Excess GHG emissions> Allocated GHG emission units
Actual GHG emissions>
Purchase SaleCARBON MARKET
Transactions among emitters and participants
<Offset creditsAuctions and sales by mutal agreement>
Source: Heartfield 2015; MDDELCC 2014.
CLEAN PROFITS | 4
Who does cap and trade apply to? Facilities that emit more GHGs than a specified threshold are required to participate in the cap and trade system. These facilities are “covered” or “captured” by the system. The emissions threshold is set by government; for example, the systems in Quebec and California cover facilities that emit over 25,000 tonnes of CO2 equivalent (a measure of GHGs) per year (Ontario has not yet announced its threshold). However, non-covered entities, or those that do not exceed the emissions threshold, can be impacted by a cap and trade system through increased costs being passed along from covered facilities.
What is an emissions allowance? An emissions allowance acts as a permit to emit. One emissions allowance is equivalent to one metric tonne of CO2 equivalent (CO2e), meaning that an emitter in possession of one emissions allowance has permission to emit one tonne of CO2e into the atmosphere (MDDELCC 2014).
How are emissions allowances allocated? Emissions allowances can only be issued by government and are typically allocated in two ways: for free or by auction. For a variety of reasons, allowances may be distributed to certain emitters for free, thus reducing the cost of compliance for those emitters. Allowances that are not distributed for free are allocated through auctions. These auctions are the primary mechanism by which revenue is generated (Ibid).
How does trading work? Under the system, government makes available a number of emissions allowances equal to the cap. Once allowances are distributed, emitters have the option to buy or sell them based on their needs. At the end of each compliance period, emitters must hold a number of emissions allowances equal to the amount of GHG emissions that they have produced during that period. For example, as shown in Figure 1, if an emitter takes action to reduce its GHG emissions (Emitter B), it can sell its excess emissions allowances to other emitters (Emitter A). The supply and demand of allowances in the carbon market generates the carbon price, or the cost to emit for covered emitters (Ibid).
This section describes cap and trade at a basic level. In practice, the design of cap and trade systems is much more complicated, as there are a number of design parameters that need to be determined. In the next section, this report provides a summary of what we currently know and don’t know about Ontario’s proposed system.
ONTARIO CHAMBER OF COMMERCE | 5
ONTARIO’S CAP AND TRADE SYSTEM—WHAT DO WE KNOW?Although the preceding section explains the basic premise of a cap and trade system, a number of design parameters must be considered prior to the effective implementation of such a system. Few precise details of the proposed cap and trade system have been revealed publicly.
For businesses in Ontario, the system’s design details will be crucial to understanding its impact. The longer these design details remain unknown, the more uncertainty the government creates for the business community.
The Government of Ontario is moving ahead with an ambitious timeline. The cap and trade system is expected to be a component of a broader climate change strategy to achieve its 2020 GHG emissions target. To successfully meet this timeline for implementation of the system, a number of details need to be finalized quickly.
Design Details
As the government revealed in its April 2015 announcement, Ontario intends to join the Western Climate Initiative (WCI) and eventually link with the cap and trade systems currently operating in Quebec and California (Government of Ontario 2015a).
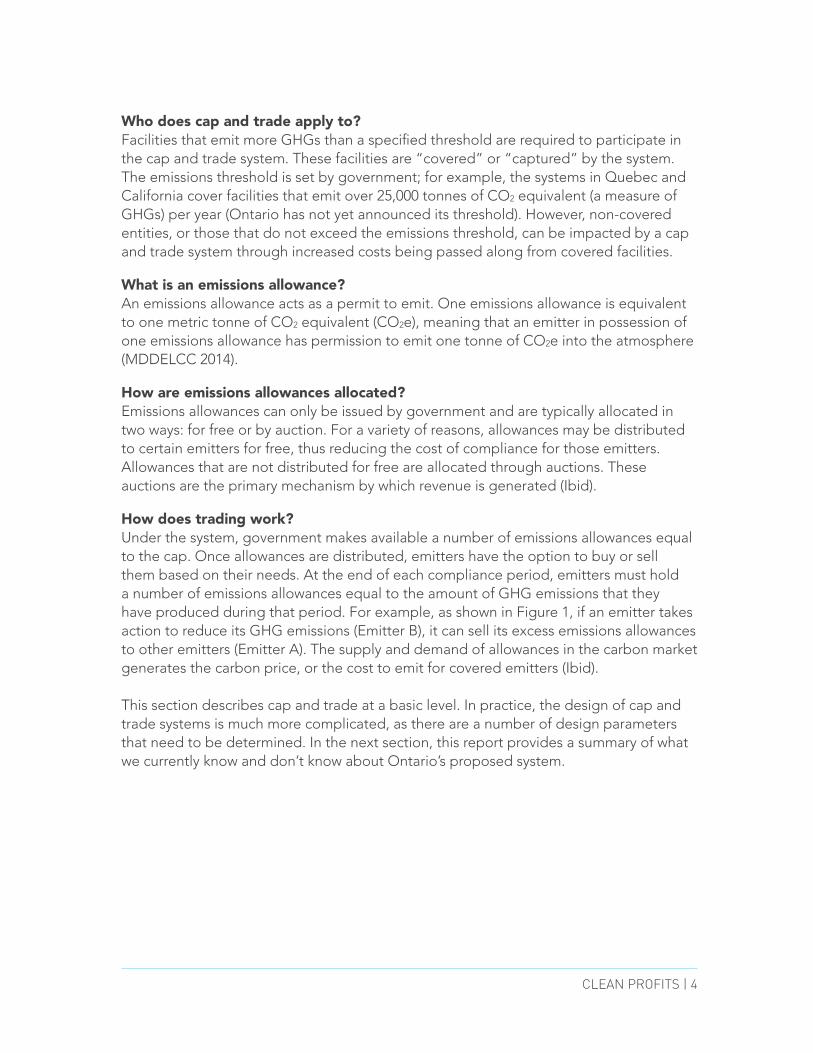
For those who are familiar with carbon pricing systems, this announcement provides some indication of how Ontario’s system could be designed. For example, as seen in Table 1, both existing WCI cap and trade systems directly cover facilities that emit greater than 25,000 tonnes of GHG emissions (measured as CO2 equivalent) per year. In addition, both systems have broad coverage, covering threshold emitters, fuel distributers, and consumers of fuel. It is reasonable to expect that Ontario would adopt similar features in its own cap and trade system.
CLEAN PROFITS | 6
Table 1: Design parameters of existing Western Climate Initiative (WCI) cap and trade systems
Design parameter Quebec California
2015 Cap (2020 target) 65.3 million tonnes CO2e (20 percent below 1990 levels)
395.4 million tonnes CO2e (achieve 1990 levels)
Emissions threshold >25,000 tonnes CO2e
Sectors covered Electricity, industry, fuel distribution
Proportion of emissions covered
~85 percent
Offsets Can be used to fulfil up to 8 percent of compliance obligation
Total revenue generated $548 million (May 2015) $2.2 billion (June 2015)
CaP anD traDe ProCeeDs
In both Quebec and California, emitters can purchase emissions allowances from the government through quarterly auctions. These auctions have accumulated significant proceeds (also referred to as funds or revenue). The proper allocation of the proceeds generated through the Ontario cap and trade system will be critical to its effectiveness as a GHG-reducing policy.
In its April 2015 announcement, the Government of Ontario indicated that auction revenue generated through its cap and trade system would be recycled back into the economy for projects that further reduce GHG emissions and help businesses remain competitive (i.e. energy efficient housing and appliances, expansion of public transportation) (Government of Ontario 2015a).
offsets
In most cap and trade systems, covered emitters are allowed to purchase offset credits to make up a certain proportion of their emissions allowances. Offset credits represent emissions reductions achieved through actions external to activities regulated under the cap and trade system. Both Quebec and California allow emitters to use offsets (provided they comply with pre-approved protocols) to fulfil up to eight percent of their compliance obligation.
In September 2015, the Government of Ontario announced that it would collaborate with Quebec to develop a common set of offset protocols, making it easier for offsets to be bought and sold in both jurisdictions (Government of Ontario 2015b).
ONTARIO CHAMBER OF COMMERCE | 7
aDministration
Western Climate Initiative, Inc. (WCI, Inc.) is a non-profit corporation that currently offers administrative and technical services to Quebec and California to support their respective cap and trade systems. Earlier this year, Ontario appointed two officials to the board of WCI, Inc., as the Province intends to use the corporation’s platform for auctioning and tracking allowances (MOECC 2015b). Simply put, Ontario will use the expertise and administrative resources of WCI, Inc. in the administration of its own cap and trade system.
So, while certain high-level details about Ontario’s cap and trade system have been announced, few specific details have been released. Indeed, much of what individuals in the business community seem to know about the system has been inferred or assumed based on the design of systems in other jurisdictions.
As businesses look to invest in Ontario, understanding what the regulatory and cost environment will look like in five to ten years is critical information. In the context of a growing cumulative burden, understanding how the cap and trade will or will not add to their potential costs in Ontario will be especially important.
With the rising cost of doing business in mind, there are a number of outstanding concerns that the business community has about the incoming cap and trade system. These are outlined in the next section of this report.
CLEAN PROFITS | 8
WHAT WE’VE HEARD: TOP CONCERNS FOR BUSINESSThe OCC has been working with its members and the broader business community to understand how Ontario businesses view the government’s proposed cap and trade system.
For some businesses, by encouraging the shift to a lower-carbon economy, the cap and trade system presents an opportunity. Indeed, as global momentum slowly shifts towards the adoption of carbon pricing policies, some sectors could gain an advantage if Ontario acts early to be a trend setter.
What is also evident, however, is that this reaction is not uniform; the opportunities and risks presented by cap and trade vary considerably by sector, and even among businesses within the same sector. Despite the opportunities presented by cap and trade, there are many businesses that remain concerned about the costs.
In this section of the report, we identify the concerns of Ontario’s business community that are common across sector and business size. Further, we provide the provincial government with a series of recommendations that, if adopted, will at least partially address these concerns. These concerns and recommendations are not all encompassing, but do speak to some of the most common issues voiced by Ontario businesses.
ConCern 1: the CaP anD traDe system CoulD negatively imPaCt the ComPetitive Position of many ontario businesses
In the context of a growing cumulative burden, businesses in Ontario need to understand how the proposed cap and trade system might impact them.
For businesses, different design parameters will greatly affect their investment and planning decisions. For government, knowledge of these impacts will be crucial as it designs a system to facilitate an effective transition to a lower-carbon economy.
In the absence of key design features, businesses in Ontario are worried about the potential negative impact that a new cap and trade system could have on their competitiveness. This is the result of several factors.
First, as described earlier in this report, businesses are dealing with a growing cumulative burden that is increasing the cost of doing business in the province. For many, a new cap and trade system could be yet another contributor to this growing burden.
!
ONTARIO CHAMBER OF COMMERCE | 9
Second, an Ontario-specific cap and trade system could contribute to a further fragmentation of the regulatory environment across the country. It is true that the government is designing the cap and trade system to link with systems in Quebec and California, which reduces this impact slightly. Outside of Quebec, however, the other provinces have either a different form of carbon pricing or no carbon pricing policy whatsoever. For businesses operating in multiple provinces, fragmentation further increases the cost of doing business.
Finally, Ontario is moving out-of-step with its major North American competitors. For example, competitors for manufacturing investment in North America—like the Southern U.S.—have demonstrated little appetite for moving ahead with carbon pricing policies. With a new cap and trade system, some businesses are worried that it will be more difficult to attract investment relative to these other jurisdictions.
If left unaddressed, weakened competitiveness could lead to both poor economic and environmental outcomes. For those sectors that are most exposed to a price on carbon, the new cap and trade system could impact their production and investment decisions.
As a first step, the Government of Ontario must conduct and publicly release the results of an economic analysis of the proposed cap and trade system. The analysis should demonstrate both the costs and benefits of the proposed system for Ontario’s economy, with a focus on the impact of the system on GDP, investment, employment, and consumer spending. To help businesses and consumers understand where impacts of the proposed system are most likely to materialize, the analysis should also investigate these variables on a sector-by-sector basis.
In addition, increased operating costs could lead to a shift in production to other jurisdictions with less costly climate change policies, or an absence of climate change policies. In this case, the GHG emissions that would have been regulated in Ontario are simply relocated to another jurisdiction. This phenomenon is commonly referred to as “carbon leakage” (IETA 2015c).
To reduce the possibility of carbon leakage, other jurisdictions have incorporated ways to accommodate competitiveness concerns into the design of their cap and trade systems. For example, many jurisdictions offer free allowances to “energy-intensive and trade-exposed” (EITE) sectors. These are sectors that are likely to be particularly impacted by a carbon price; they consume a significant amount of carbon-intensive energy (“energy intensive”) and face global competition from jurisdictions without similar requirements (“trade exposed”) (CARB 2009; Heartfield 2015).
CLEAN PROFITS | 10
The experience of the cement sector in British Columbia (B.C.) following the introduction of the carbon tax demonstrates the consequences of failing to plan for the possibility of leakage. In all jurisdictions that have carbon pricing, cement is recognized as an EITE industry. Accordingly, these pricing systems generally include complementary policies to protect the competitiveness of EITE sectors (e.g. free allocations, transitional incentives for low carbon fuels, etc.). Until recently, the B.C. carbon tax included no such measures and the impact on the industry has been dramatic.
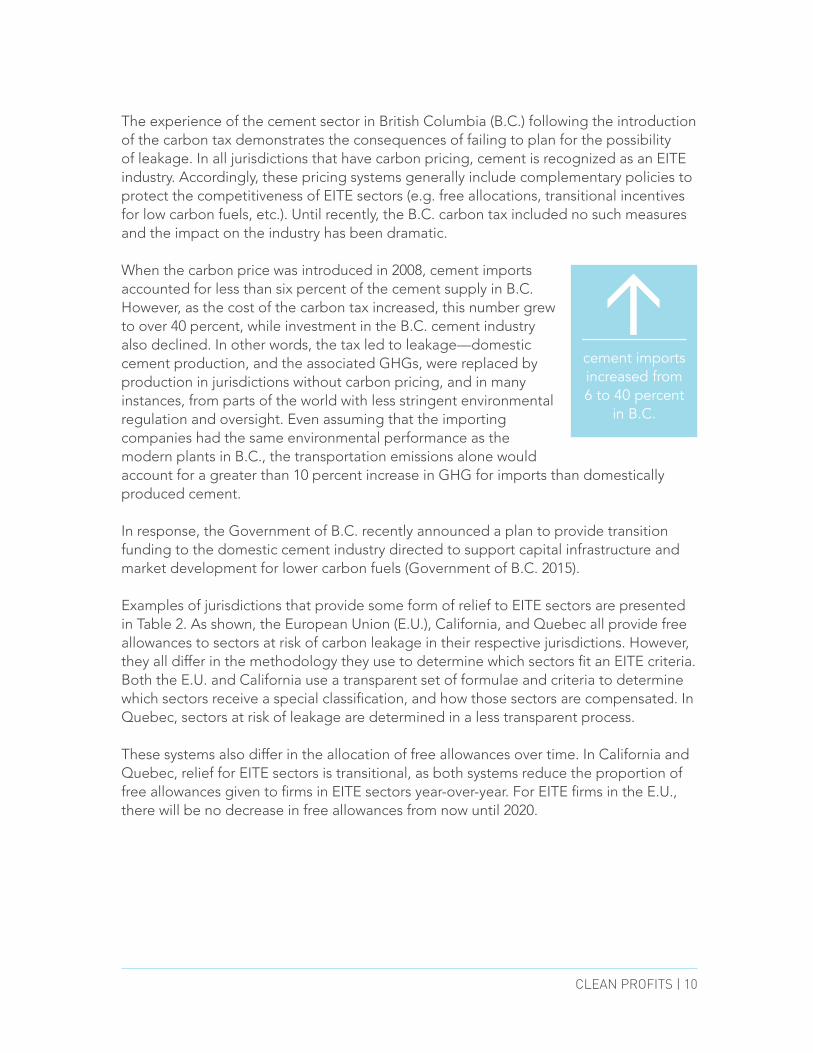
When the carbon price was introduced in 2008, cement imports accounted for less than six percent of the cement supply in B.C. However, as the cost of the carbon tax increased, this number grew to over 40 percent, while investment in the B.C. cement industry also declined. In other words, the tax led to leakage—domestic cement production, and the associated GHGs, were replaced by production in jurisdictions without carbon pricing, and in many instances, from parts of the world with less stringent environmental regulation and oversight. Even assuming that the importing companies had the same environmental performance as the modern plants in B.C., the transportation emissions alone would account for a greater than 10 percent increase in GHG for imports than domestically produced cement. In response, the Government of B.C. recently announced a plan to provide transition funding to the domestic cement industry directed to support capital infrastructure and market development for lower carbon fuels (Government of B.C. 2015).
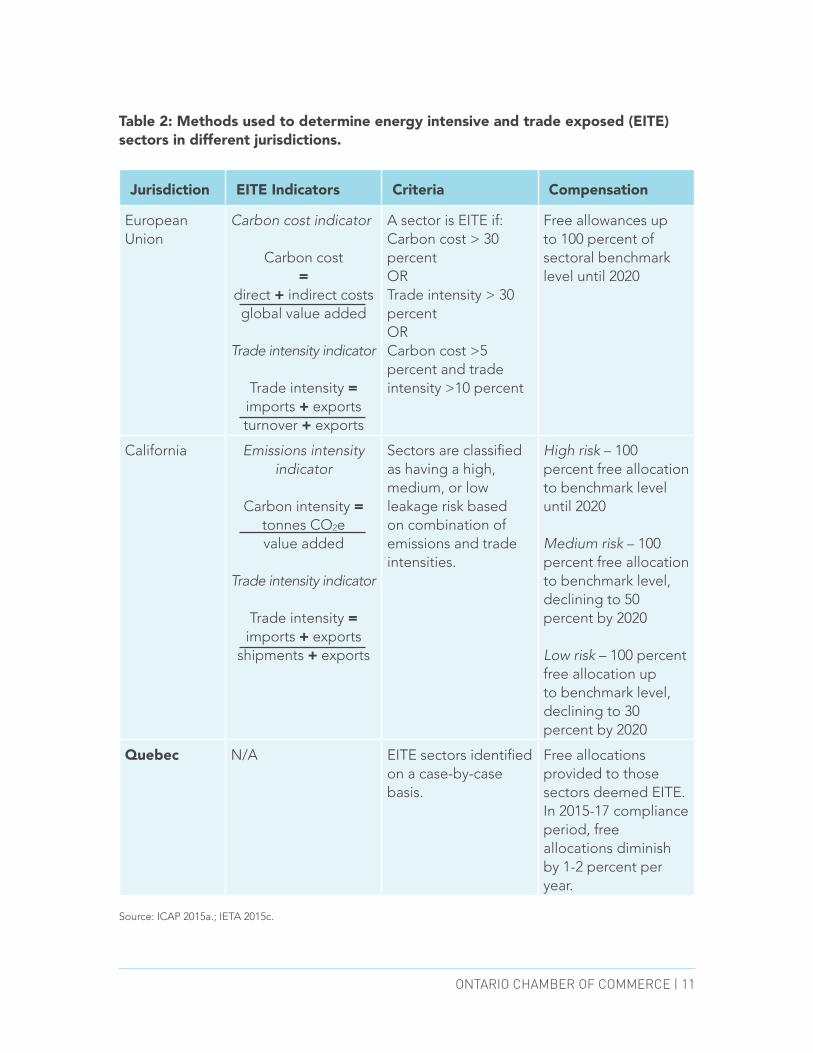
Examples of jurisdictions that provide some form of relief to EITE sectors are presented in Table 2. As shown, the European Union (E.U.), California, and Quebec all provide free allowances to sectors at risk of carbon leakage in their respective jurisdictions. However, they all differ in the methodology they use to determine which sectors fit an EITE criteria. Both the E.U. and California use a transparent set of formulae and criteria to determine which sectors receive a special classification, and how those sectors are compensated. In Quebec, sectors at risk of leakage are determined in a less transparent process.
These systems also differ in the allocation of free allowances over time. In California and Quebec, relief for EITE sectors is transitional, as both systems reduce the proportion of free allowances given to firms in EITE sectors year-over-year. For EITE firms in the E.U., there will be no decrease in free allowances from now until 2020.
>
cement imports increased from 6 to 40 percent
in B.C.
ONTARIO CHAMBER OF COMMERCE | 11
Table 2: Methods used to determine energy intensive and trade exposed (EITE) sectors in different jurisdictions.
Jurisdiction EITE Indicators Criteria Compensation
European Union
Carbon cost indicator
Carbon cost =
direct + indirect costsglobal value added
Trade intensity indicator
Trade intensity = imports + exportsturnover + exports
A sector is EITE if:Carbon cost > 30 percentOR Trade intensity > 30 percentORCarbon cost >5 percent and trade intensity >10 percent
Free allowances up to 100 percent of sectoral benchmark level until 2020
California Emissions intensity indicator
Carbon intensity = tonnes CO2evalue added
Trade intensity indicator
Trade intensity = imports + exports
shipments + exports
Sectors are classified as having a high, medium, or low leakage risk based on combination of emissions and trade intensities.
High risk – 100 percent free allocation to benchmark level until 2020
Medium risk – 100 percent free allocation to benchmark level, declining to 50 percent by 2020
Low risk – 100 percent free allocation up to benchmark level, declining to 30 percent by 2020
Quebec N/A EITE sectors identified on a case-by-case basis.
Free allocations provided to those sectors deemed EITE. In 2015-17 compliance period, free allocations diminish by 1-2 percent per year.
Source: ICAP 2015a.; IETA 2015c.
CLEAN PROFITS | 12
To match actions taken in other jurisdictions and maintain business competitiveness, steps will need to be taken in Ontario to accommodate those sectors that are most exposed to the effect of a price on carbon. As such, the Government of Ontario should develop an objective and transparent set of criteria to determine which sectors will be eligible for free allowances, and how the allocation of free allowances will change over time. Businesses prefer the principled approach taken in California versus the less transparent approach taken in Quebec.
ConCern 2: the system CoulD Create negative Downstream imPaCts for businesses not CovereD by the CaP anD traDe system, inCluDing businesses in the suPPly Chains of CovereD emitters
Ontario’s business community is also concerned about the possible downstream impacts of cap and trade on those businesses who are not directly covered by the system, as well as the downstream impact on consumers.
Many businesses, particularly small and medium-sized enterprises (SMEs), are unsure how the proposed cap and trade system might impact them. Since only large emitters will be directly covered by the system, many believe that cap and trade will not apply to them. In an administrative sense, they are correct, as they will not be required to participate in the market for emissions allowances. However, this does not mean that they will be immune to the downstream impact of the system.
In fact, to maximize the proportion of total emissions that is covered by cap and trade, Ontario is proposing to include electricity generation and fuel distribution, as well as industrial facilities that exceed the emissions threshold. The impact of the carbon price will therefore be felt by smaller emitters through an increase in the cost of inputs, namely electricity and fossil fuels. Both Quebec and California require distributors of fuel to participate in the cap and trade system. Distributors of fuel are not final emitters, but it is assumed that the direct cost of the carbon price will be passed through to consumers of that fuel. In Quebec, it is estimated that the price of gas increased by two to three-and-a-half cents per litre as a result of this policy (MOECC 2015a). In this way, smaller emitters will feel a cost associated with cap and trade, even though they are not direct participants in the system.
Businesses are particularly concerned about the cumulative effect of these pass-through costs on their supply chains. By increasing the costs of production, the rising costs of inputs as a result of a carbon price could make Ontario-based suppliers less attractive to their existing customers. If these customers decide to source their supplies elsewhere, then Ontario’s supply base suffers. Conversely, if the cap and trade system adversely impacts production at the end of the supply chain, then that could have ripple effects for suppliers through that chain.
Ontario’s automotive industry provides a good example of this. In Ontario, the industry is supply-based, meaning that many of the materials and components that make up a
!
ONTARIO CHAMBER OF COMMERCE | 13
vehicle, including steel, aluminum, seats, bumpers, seals, brakes, and suspensions, are manufactured locally by third-party suppliers. These components are then assembled at an assembly plant as the final step in a long and integrated supply chain. Increased input costs for some or all of these suppliers could have a considerable cumulative effect on this production chain.
In the context of a rising cumulative burden facing businesses in Ontario, the effect of increased input costs on local supply chains could have serious unintended impacts on Ontario’s economy.
As a result, the Government of Ontario needs to clearly communicate how the cap and trade system will impact those consumers and businesses that are not directly covered by the system. As it conducts its analysis, the government should evaluate the cumulative impact that cap and trade will have on supply chains.
ConCern 3: government won’t sPenD CaP anD traDe ProCeeDs effeCtively
By requiring emitters covered by the cap and trade system to participate in regular auctions for allowances, the government will be raising considerable funds via the new system. If Ontario’s system is designed in a similar manner to Quebec’s, early estimates suggest that it could generate up to $2 billion per year by 2020 (Wingrove 2015).
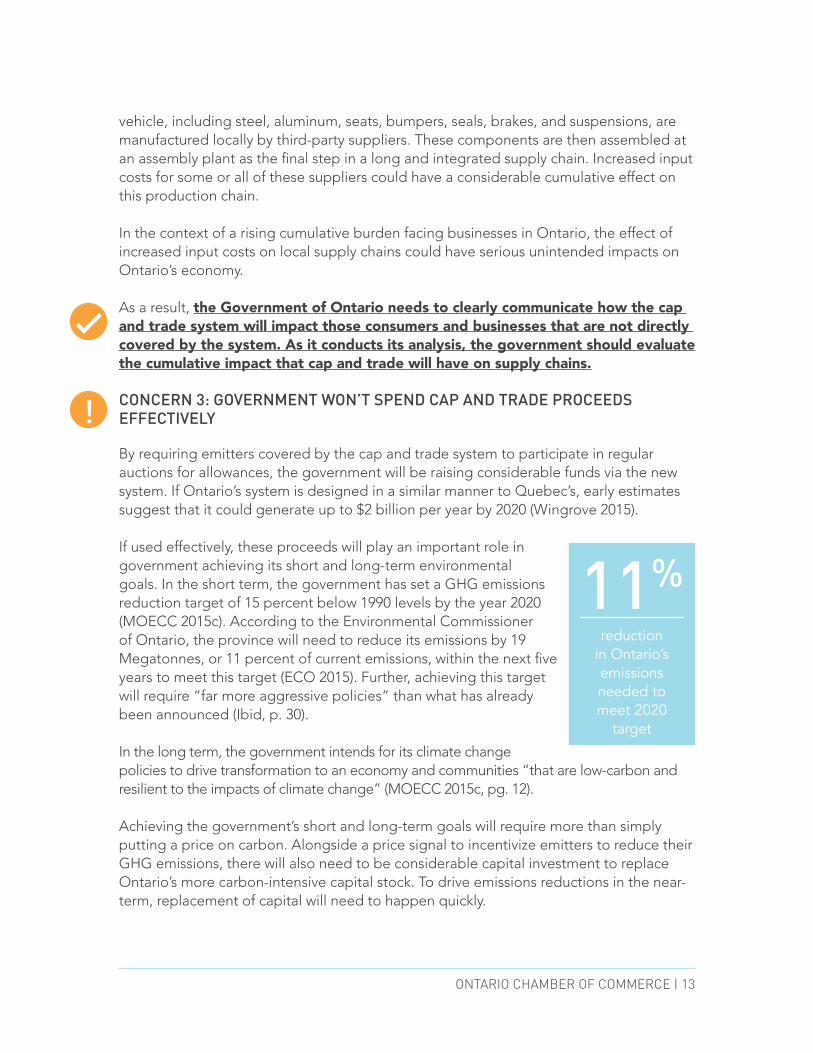
If used effectively, these proceeds will play an important role in government achieving its short and long-term environmental goals. In the short term, the government has set a GHG emissions reduction target of 15 percent below 1990 levels by the year 2020 (MOECC 2015c). According to the Environmental Commissioner of Ontario, the province will need to reduce its emissions by 19 Megatonnes, or 11 percent of current emissions, within the next five years to meet this target (ECO 2015). Further, achieving this target will require “far more aggressive policies” than what has already been announced (Ibid, p. 30).
In the long term, the government intends for its climate change policies to drive transformation to an economy and communities “that are low-carbon and resilient to the impacts of climate change” (MOECC 2015c, pg. 12).
Achieving the government’s short and long-term goals will require more than simply putting a price on carbon. Alongside a price signal to incentivize emitters to reduce their GHG emissions, there will also need to be considerable capital investment to replace Ontario’s more carbon-intensive capital stock. To drive emissions reductions in the near-term, replacement of capital will need to happen quickly.
!
11%reduction
in Ontario’s emissions needed to meet 2020
target
CLEAN PROFITS | 14
It is here where appropriate use of the cap and trade system’s proceeds can significantly increase the effectiveness of the policy as a means to transition to a lower-carbon economy. Among carbon pricing systems in Canada and internationally, there exist a few different models that Ontario can look to as it makes this important design decision. In B.C., the government has taken a revenue neutral approach to its carbon tax. Every year, the government returns the revenue from the carbon tax to individuals and businesses in the form of tax reductions and credits. In 2012-2013, the tax generated $1.12 billion, with $834 million returned to the business community, mostly as a reduction in the general corporate income tax rate (Government of B.C. 2014).
In Quebec, the government uses the proceeds from its cap and trade system to fund carbon-reducing programs under its 2013-2020 Climate Change Action Plan (PACC). These programs are aimed at businesses, municipalities, as well as citizens. (Government of Quebec 2012). From the seven auctions Quebec had held as of May 2015, the cap and trade system raised $548 million (MDDELCC 2015).
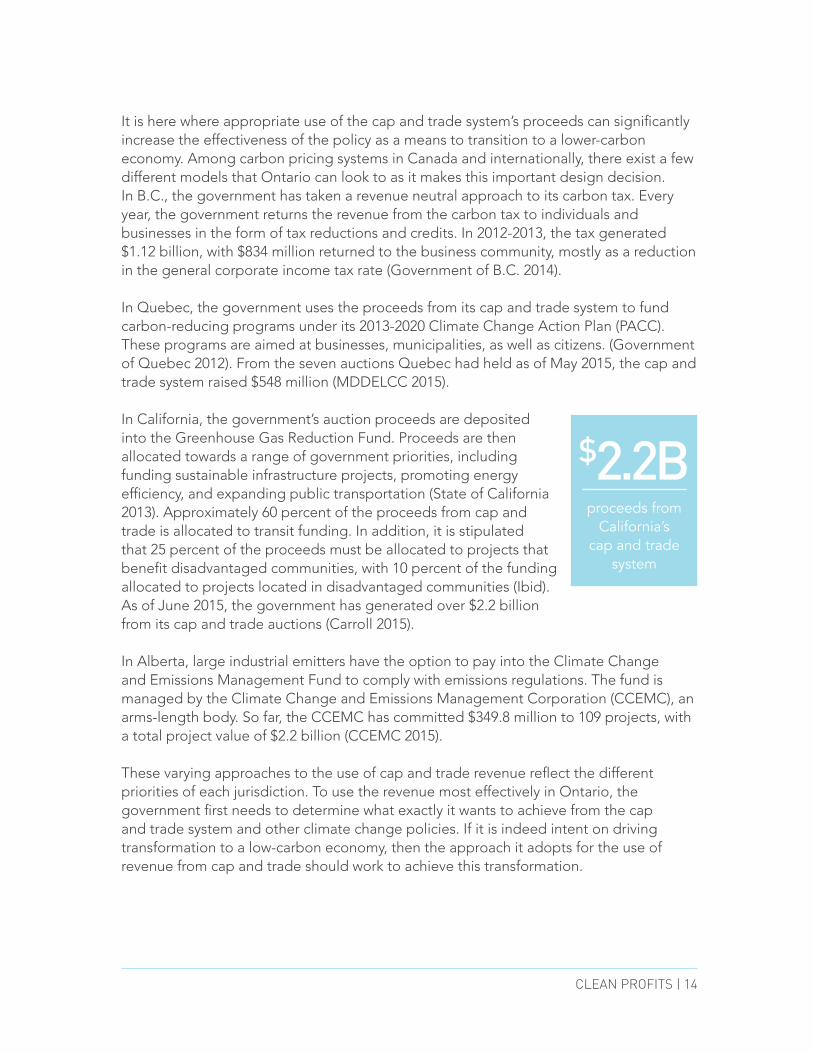
In California, the government’s auction proceeds are deposited into the Greenhouse Gas Reduction Fund. Proceeds are then allocated towards a range of government priorities, including funding sustainable infrastructure projects, promoting energy efficiency, and expanding public transportation (State of California 2013). Approximately 60 percent of the proceeds from cap and trade is allocated to transit funding. In addition, it is stipulated that 25 percent of the proceeds must be allocated to projects that benefit disadvantaged communities, with 10 percent of the funding allocated to projects located in disadvantaged communities (Ibid). As of June 2015, the government has generated over $2.2 billion from its cap and trade auctions (Carroll 2015).
In Alberta, large industrial emitters have the option to pay into the Climate Change and Emissions Management Fund to comply with emissions regulations. The fund is managed by the Climate Change and Emissions Management Corporation (CCEMC), an arms-length body. So far, the CCEMC has committed $349.8 million to 109 projects, with a total project value of $2.2 billion (CCEMC 2015).
These varying approaches to the use of cap and trade revenue reflect the different priorities of each jurisdiction. To use the revenue most effectively in Ontario, the government first needs to determine what exactly it wants to achieve from the cap and trade system and other climate change policies. If it is indeed intent on driving transformation to a low-carbon economy, then the approach it adopts for the use of revenue from cap and trade should work to achieve this transformation.
$2.2bproceeds from
California’s cap and trade
system
ONTARIO CHAMBER OF COMMERCE | 15
As such, Ontario’s business community urges the government to direct cap and trade revenue to efforts that directly facilitate businesses’ transition to a lower carbon economy. Further, the allocation of that revenue should be objective and transparent. Specifically, it should use the revenue to help businesses invest in low-carbon processes, technology, and other capital. Examining a model similar to Alberta’s CCEMC would be a good place to start.
ConCern 4: through CaP anD traDe, businesses will faCe DisProPortionate Pressure to reDuCe ghg emissions DesPite other signifiCant Contributors to ontario’s total ghg outPut
To date, the proposed cap and trade system, which is designed to directly cover the province’s large industrial emitters, is the only concrete policy that has been announced since the end of the government’s consultation on a long-term climate change strategy earlier in 2015. We understand that, as the government makes decisions related to the design of the cap and trade system, it is also determining the actions it will take under a broader climate change strategy.
We encourage the government’s actions under this strategy to reflect the realities of Ontario’s GHG emissions profile.
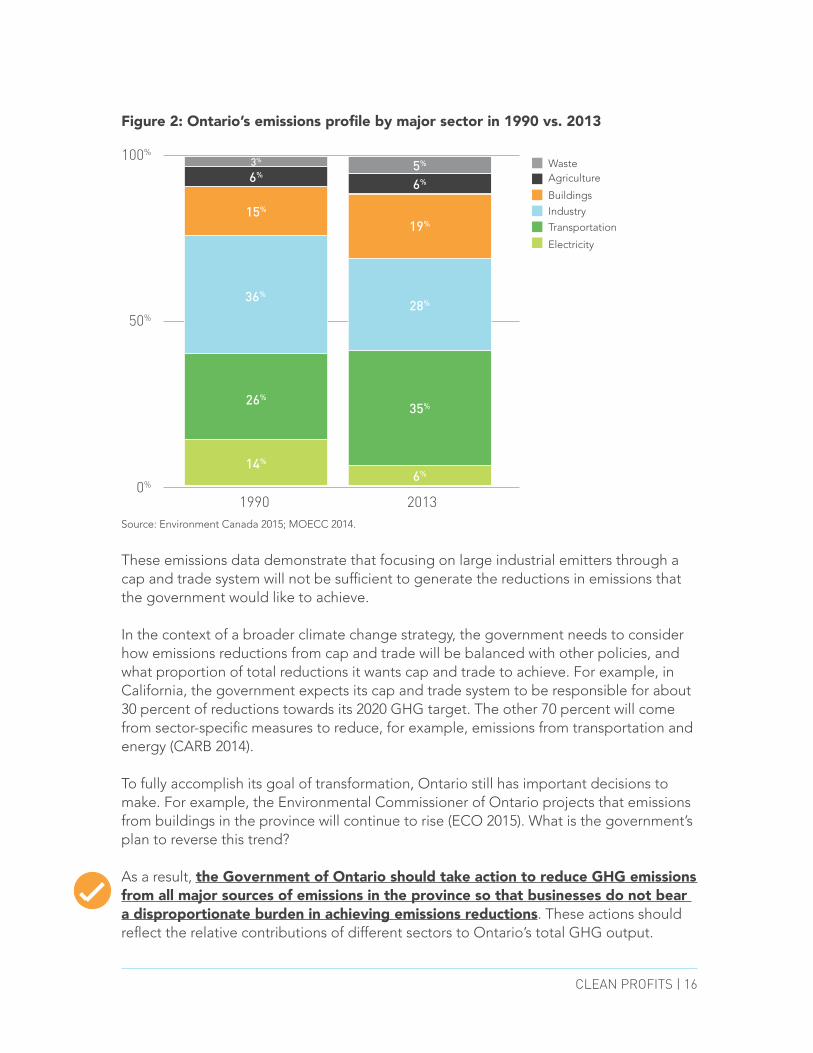
According to 2013 emissions data, industrial emissions make up 28 percent of Ontario’s total GHG output. Ontario businesses do not dispute that this is a significant portion of the province’s emissions. However, as can be seen in Figure 2, there are other significant sources of GHG emissions in Ontario. For example, the transportation sector, which includes road, rail, air, and marine transportation, is the top source of GHG emissions in the province at 35 percent of total emissions. The province’s building stock is also a very significant source of GHG emissions, contributing 19 percent of total emissions.
Ontario’s emissions profile has also changed significantly over time. In 1990, industrial activity was the greatest source of GHG emissions in the province. Since that time, however, emissions from industry have declined by 26 percent. In contrast, transportation and building emissions increased by 31 percent and 17 percent, respectively, over the same period (ECO 2015).
!
26%industrial emissions decline in
Ontario since 1990
CLEAN PROFITS | 16
Figure 2: Ontario’s emissions profile by major sector in 1990 vs. 2013
Source: Environment Canada 2015; MOECC 2014.
These emissions data demonstrate that focusing on large industrial emitters through a cap and trade system will not be sufficient to generate the reductions in emissions that the government would like to achieve.
In the context of a broader climate change strategy, the government needs to consider how emissions reductions from cap and trade will be balanced with other policies, and what proportion of total reductions it wants cap and trade to achieve. For example, in California, the government expects its cap and trade system to be responsible for about 30 percent of reductions towards its 2020 GHG target. The other 70 percent will come from sector-specific measures to reduce, for example, emissions from transportation and energy (CARB 2014).
To fully accomplish its goal of transformation, Ontario still has important decisions to make. For example, the Environmental Commissioner of Ontario projects that emissions from buildings in the province will continue to rise (ECO 2015). What is the government’s plan to reverse this trend?
As a result, the Government of Ontario should take action to reduce GHG emissions from all major sources of emissions in the province so that businesses do not bear a disproportionate burden in achieving emissions reductions. These actions should reflect the relative contributions of different sectors to Ontario’s total GHG output.
100%
0%
50%
WasteAgriculture
Buildings
Industry
Transportation
Electricity
14%
26%
36%
15%
6%3%
6%
35%
28%
19%
6%
5%
1990 2013
ONTARIO CHAMBER OF COMMERCE | 17
ConCern 5: the government CoulD Design a CaP anD traDe system that is not tailoreD to ontario’s eConomiC reality
In joining the WCI and intending to link its cap and trade system with Quebec and California, there are certain design features that Ontario will likely have to take as given. These include anything from administrative features, like the auctioning process, to the emissions threshold for covered emitters.
Despite this, there are critical design elements of cap and trade that are up to Ontario to determine, including how emissions allowances will be allocated and what will be done with the proceeds. This presents an opportunity for government to tailor its cap and trade system to the province’s unique economic context. Businesses do not want to see a system that is simply transplanted from other WCI jurisdictions, as there are clear differences in the economic compositions of Ontario and these jurisdictions.
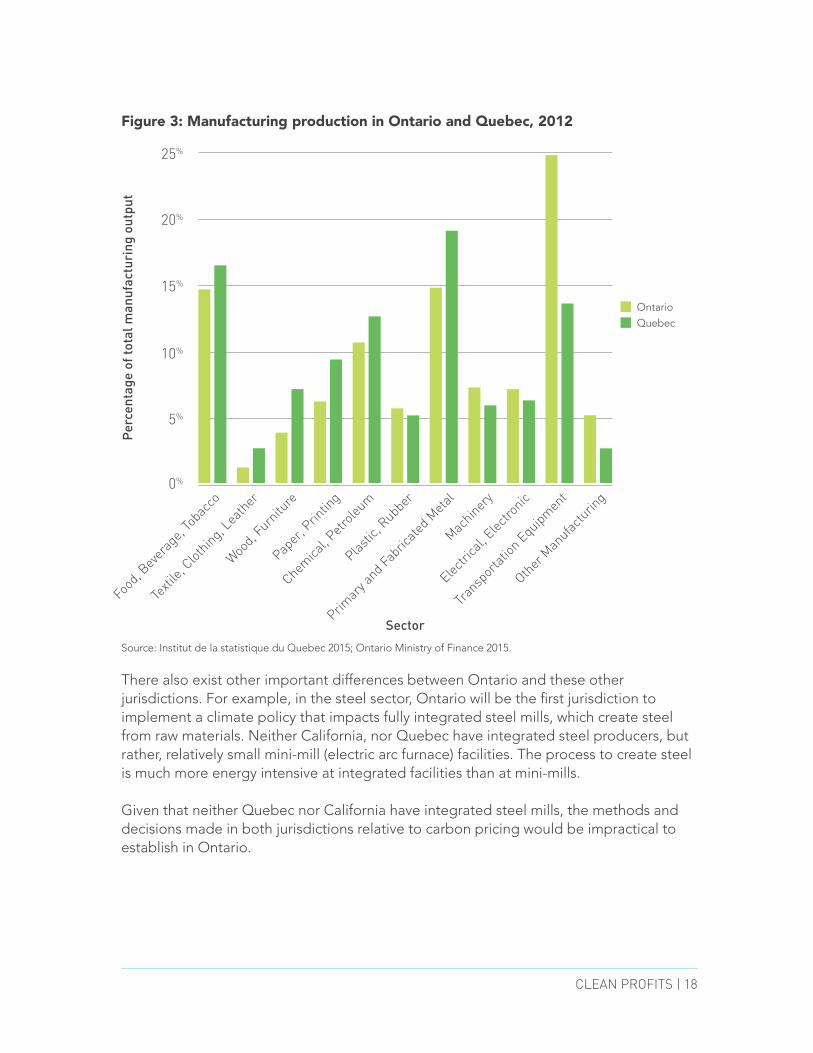
For example, the composition of manufacturing production in Quebec and Ontario differs significantly (Figure 3). As expected, the production of transportation equipment makes up a much larger proportion of total manufacturing output in Ontario than in Quebec (approximately 25 percent versus 13 percent), while primary metals production is a significantly greater proportion of output in Quebec.
!
CLEAN PROFITS | 18
Figure 3: Manufacturing production in Ontario and Quebec, 2012
Source: Institut de la statistique du Quebec 2015; Ontario Ministry of Finance 2015.
There also exist other important differences between Ontario and these other jurisdictions. For example, in the steel sector, Ontario will be the first jurisdiction to implement a climate policy that impacts fully integrated steel mills, which create steel from raw materials. Neither California, nor Quebec have integrated steel producers, but rather, relatively small mini-mill (electric arc furnace) facilities. The process to create steel is much more energy intensive at integrated facilities than at mini-mills.
Given that neither Quebec nor California have integrated steel mills, the methods and decisions made in both jurisdictions relative to carbon pricing would be impractical to establish in Ontario.
Food
, Bev
erag
e, To
bacc
o
Texti
le, C
lothing,
Leath
er
Wood,
Furnitu
re
Paper
, Prin
ting
Chemica
l, Petr
oleum
Plastic
, Rubb
er
Primar
y and F
abric
ated M
etal
Machiner
y
Electri
cal, E
lectro
nic
Tran
spor
tation
Equipm
ent
Other
Man
ufactu
ring
Ontario
Quebec
0%
5%
10%
15%
20%
25%
Per
cent
age
of to
tal m
anuf
actu
ring
out
put
sector
ONTARIO CHAMBER OF COMMERCE | 19
The examples provided above are just a few instances where Ontario’s economy deviates from other WCI jurisdictions. As such, it is important that the government considers these differences as it moves forward with the design of its cap and trade system. The business community therefore recommends that the Government of Ontario incorporate the economic realities of the province into the design of the cap and trade system.
ConCern 6: the CaP anD traDe system CoulD ConfliCt with other PoliCies anD inCrease the Cost of ComPlianCe for business
As explained earlier in this report, one of the major advantages of cap and trade over other emissions-reducing policies is that it is not prescriptive. Once a cap on emissions is established, businesses can choose to comply with the policy through a wide variety of options including purchasing emissions allowances, changing business processes, or investing in low-carbon technology. As a result, businesses can choose the lowest cost option for their business (Ecofiscal Commission 2015).
The flexibility of compliance under cap and trade, however, is also dependent on the effect of other policies and regulations that apply to emitters covered by the cap and trade system. If a policy or regulation exists that limits the options available for compliance under cap and trade, then the cost-effectiveness of the policy, one of its major advantages, is reduced. The effectiveness of cap and trade could also be weakened if it reduces the demand for emissions allowances, and therefore the carbon price, within the cap and trade system. For example, if a utility is required to source a certain proportion of energy generation from renewable sources and that requirement drives emissions reductions, then its need for emissions allowances will be reduced (Carlson 2011).
Obviously, cap and trade will not interact exclusively with policies that reduce emissions, as the system will be situated within the government’s other policies and priorities. Many businesses in Ontario are especially focused on the interaction of cap and trade with the government’s current energy policy. As outlined in the OCC’s recent report, Empowering Ontario, the rising cost of electricity in Ontario is one of the top issues facing the business community today. Over the next five years, industrial customers’ bills are expected to increase by 13 percent, while rates for households and small businesses are predicted to rise by 25 percent (IESO 2014).
During the past few years, the Government of Ontario has adopted a series of policies, such as the elimination of coal generation, that have significantly reduced the carbon content of the province’s electricity generation. In 2008, fossil fuels accounted for over 20 percent of total energy production. By 2014, this number had declined to about 11 percent (IESO 2015). Even with these significant reductions in emissions from production,
!
11%of Ontario’s
energy came from fossil fuels
in 2014
CLEAN PROFITS | 20
there will still be a component of electricity generation that is covered by the cap and trade system. How will this impact electricity prices? Businesses are concerned that the cap and trade system will further contribute to rising electricity prices and make Ontario a less affordable place to do business.
At the same time, the government is planning to refurbish Ontario’s aging nuclear stock in the coming years, which accounts for over half of the province’s total energy supply. As these facilities go offline, it is expected that generation from fossil fuels will rise to make up at least part of the difference (Ontario Ministry of Energy 2013). Will this necessary change to the supply mix also drive up electricity rates?
In presenting these potential conflicts between cap and trade and other policies, the business community is not suggesting that cap and trade is incompatible with them; indeed, as discussed earlier in the report, other policies to reduce emissions will be necessary to shift to a low-carbon economy and society.
What we are suggesting, however, is that other policies need to be compatible with cap and trade.
As a result, the business community recommends that the Government of Ontario ensure that the proposed cap and trade system is aligned with other programs and policies to reduce GHG emissions, as well as other government priorities. The cost-effectiveness of cap and trade, by offering emitters flexibility, should be preserved.
ONTARIO CHAMBER OF COMMERCE | 21
CONCLUSIONOntario’s proposed cap and trade system, by facilitating a transition to a lower-carbon economy, could present economic benefits for the province, if designed correctly.
However, in the context of a rising cumulative burden facing Ontario businesses, we are concerned about the risks, as a poorly designed cap and trade system could negatively impact the province’s economy. As such, we urge the government to consider the broader context for businesses as it moves forward with the design and implementation of this system. The recommendations contained in this report, if adopted, will move the system in a positive direction.
Ontario businesses want to be partners in helping the Province meet its climate change objectives. The OCC and its members support a solution which will balance environmental ambitions while fostering the conditions necessary for economic growth and prosperity.
CLEAN PROFITS | 22
WORKS CITEDCalifornia Air Resources Board (CARB). 2009. Discussion of emissions leakage issues in cap-and-trade. http://www.arb.ca.gov/cc/capandtrade/meet-ings/041309/presentation.pdf
California Air Resources Board (CARB). 2014. First update to the climate change scoping plan: building on the framework. http://www.arb.ca.gov/cc/scop-ingplan/2013_update/first_update_climate_change_scoping_plan.pdf
Carlson, A. 2011. Designing effective climate policy: cap-and-trade and complementary policies. 49 Har-vard Journal on Legislation 207-48 (2012). http://pa-pers.ssrn.com/sol3/papers.cfm?abstract_id=1928971
Carroll, R. 2015, June 17. California carbon revenue tops $2 billion after latest auction. Reuters. http://www.reuters.com/article/2015/06/18/carbon-mar-ket-california-idUSL1N0Z400W20150618
Climate Change and Emissions Management Corpo-ration (CCEMC). 2015. Performance in brief. http://ccemc.ca/about/performance/
Ecofiscal Commission. 2015. The way forward: a practical approach to reducing Canada’s greenhouse gas emissions. http://ecofiscal.ca/wp-content/up-loads/2015/04/Ecofiscal-Commission-Report-The-Way-Forward-April-2015.pdf
Environment Canada. 2015. National inventory re-port 1990-2013: greenhouse gas sources and sinks in Canada. https://unfccc.int/national_reports/annex_i_ghg_inventories/national_inventories_submissions/items/8812.php
Environmental Commissioner of Ontario (ECO). 2015. Feeling the heat: greenhouse gas progress report 2015. http://eco.on.ca/wp-content/up-loads/2015/07/2015-GHG.pdf
Government of B.C. 2014. Budget and fiscal plan 2014/15 – 2016/17. http://bcbudget.gov.bc.ca/2014/bfp/2014_budget_and_fiscal_plan.pdf
Government of B.C. 2015. Budget and fiscal plan 2015/16 – 2017/18. http://bcbudget.gov.bc.ca/2015/bfp/2015_Budget_and_Fiscal_Plan.pdf
Government of Ontario. 2015a, April 13. News release: cap and trade system to limit greenhouse gas pollution in Ontario. http://news.ontario.ca/opo/en/2015/04/cap-and-trade-system-to-limit-greenhouse-gas-pollution-in-ontario.html?utm_source=ondemand&utm_medium=email&utm_cam-paign=p
Government of Ontario. 2015b, September 11. News release: Quebec-Ontario partnership yields results. http://news.ontario.ca/opo/en/2015/09/quebec-ontario-partnership-yields-results.html?utm_source=ondemand&utm_medium=email&utm_cam-paign=p
Government of Quebec. 2012. Quebec in action: greener by 2020 - 2013-2020 climate change action plan. http://www.mddelcc.gouv.qc.ca/changements/plan_action/pacc2020-en.pdf
Heartfield, Kate. 2015, April 24. Cap and trade: a how-to guide for Ontario. Ottawa Citizen. http://ottawacitizen.com/news/politics/cap-and-trade-dos-and-donts
International Carbon Action Partnership (ICAP). 2015a. Canada – Quebec cap-and-trade system. https://icapcarbonaction.com/index.php?op-tion=com_etsmap&task=export&format=pdf&lay-out=list&systems%5B%5D=73
International Carbon Action Partnership (ICAP). 2015b. Emissions trading worldwide – status report 2015. https://icapcarbonaction.com/status-re-port-2015
Independent Electricity System Operator (IESO). 2014. Cost of electricity service, 2013 LTEP: module 4. PowerPoint.
ONTARIO CHAMBER OF COMMERCE | 23
Independent Electricity System Operator (IESO). 2015. Supply overview. http://www.ieso.ca/Pages/Power-Data/Supply.aspx
Institut de la statistique du Quebec. 2015. Pro-duit intérieur brut aux prix de base, par activité économique, Québec, 2007-2013.http://www.stat.gouv.qc.ca/statistiques/economie/comptes-economiques/comptes-revenus-depenses/cea3_1.htm
International Emissions Trading Association (IETA). 2015a. California: an emissions trading case study. http://www.cdcclimat.com/IMG/pdf/california-ets-case_study-ieta-edf-cdc-climat-re-search_28042015-2.pdf
International Emissions Trading Association (IETA). 2015b. Quebec: an emissions trading case study. http://www.cdcclimat.com/IMG/pdf/quebec-ets-case-study-edf-ieta-cdcclimat_28042015-2.pdf
International Emissions Trading Association (IETA). 2015c. Ontario cap and trade – options review: ad-dressing competitiveness & leakage concerns.
Intergovernmental Panel on Climate Change (IPCC). 2014. Climate Change 2014: Synthesis Report. Contribution of Working Groups I, II and III to the Fifth Assessment Report of the Intergovernmental Panel on Climate Change [Core Writing Team, R.K. Pachauri and L.A. Meyer (eds.)]. IPCC, Geneva, Switzerland, 151 pp. https://www.ipcc.ch/pdf/assess-ment-report/ar5/syr/SYR_AR5_FINAL_full.pdf
Ministre de developpement durable, Environne-ment et Lutte contre les changements climatiques (MDDELCC). 2014. A brief look at the Quebec cap and trade system for emission allowances. http://www.mddelcc.gouv.qc.ca/changements/carbone/documents-spede/in-brief.pdf
Ministre de developpement durable, Environnement et Lutte contre les changements climatiques (MD-DELCC). 2015, May 28. Press releases: Minister Heu-rtel announces the results of the third Québec-Cali-fornia carbon market auction. http://www.mddelcc.gouv.qc.ca/infuseur/communique_en.asp?no=3166
Ontario Ministry of Energy. 2013. Achieving bal-ance: Ontario’s long term energy plan. http://www.powerauthority.on.ca/sites/default/files/ planning/LTEP_2013_English_WEB.pdf
Ontario Ministry of Environment and Climate Change (MOECC). 2014. Ontario’s climate change update 2014. http://www.ontario.ca/document/on-tarios-climate-change-update-2014
Ontario Ministry of Environment and Climate Change (MOECC). 2015a, April 13. Backgrounder: how cap and trade works. http://www.news.ontario.ca/ene/en/2015/04/how-cap-and-trade-works.html
Ontario Ministry of Environment and Climate Change (MOECC). 2015b, August 5. Bulletin: On-tario names board members to Western Climate Initiative. http://news.ontario.ca/ene/en/2015/08/on-tario-names-board-members-to-western-climate-ini-tiative.html
Ontario Ministry of Environment and Climate Change (MOECC). 2015c. Ontario’s climate change discussion paper 2015. http://www.down-loads.ene.gov.on.ca/envision/env_reg/er/docu-ments/2015/012-3452.pdf
Ontario Ministry of Finance. 2015. Ontario economic accounts: historical tables. http://www.fin.gov.on.ca/en/economy/ecaccts/#lot
State of California. 2013. Cap-and-trade auction pro-ceeds investment plan: fiscal years 2013-14 through 2015-16. http://www.arb.ca.gov/cc/capandtrade/auctionproceeds/final_investment_plan.pdf
Wingrove, J. 2015, April 21. Ontario’s cap-and-trade regime seen raising C$2 billion a year. Bloomberg News. http://www.bloomberg.com/news/arti-cles/2015-04-21/ontario-s-cap-and-trade-regime-seen-raising-c-2-billion-a-year

occ.ca | @ontarioCofC


