i
i
ii
ii
CENTRAL INSTITUTE OF MINING RESEARCH, DHANBAD
(Council of Scientific & Industrial Research)
PROJECT REPORT
ON
EEIIAA//EEMMPP OOFF Lime Stone, Bauxite and Clay
Mine at
Village: Kubri,Tahsil: Maihar, Dist:
Satna(M.P)
SPONSORED BY
M/s SUKHDEO PRASAD GOENKA
GOENKA BHAWAN STATION ROAD,KATNI, M.P.
May, 2017
(Dr. M.K. Chakraborty)
Project Leader
iii
iii
CONTENT
DESCRIPTION PAGE
NO.
CHAPTER 1 20-31
INTRODUCTION
1.1 Purpose of the Project 20
1.2 Identification of Project & Project Proponent 23
1.3 Scope of Environmental Impact Assessment Study 23
1.4 Terms of reference 24
CHAPTER 2
PROJECT DESCRIPTION 32-40
2.1 Type of Project 32
2.2 Need for the Project 32
2.3 Location 33
2.3.1 Access 33
2.3.2 Climate 34
2.3.3 Physiograph & Drainage 35
2.4 Size or Magnitude of Operation 35
2.4.1 Mining System 35
2.4.2 Selection of Mining Technology 35
2.4.3 Size or Magnitude of Operation 35
2.4.4 Mining System & Major HEMM 35
2.5 Description of Mitigation Measures 40
CHAPTER 3
DESCRIPTION OF THE ENVIRONMENT 42-120
3.1 Study area, Period, Components
3.2 Baseline Environmental Scenario
3.2.0 Air Environment
3.2.1 Micro-meteorology
3.2.2 Air Quality
3.2.2.1 Sampling and Analysis
3.2.2.2 Duration of Sampling

iv
iv
DESCRIPTION PAGE
NO.
3.2.2.3 Results and Discussions
3.3 Water Environment
3.3.1 Water Quality
3.2.2 Methods of Sampling and Analysis
3.3.2.2. Results and Discussions
3.4 Hydrogeology of the Area
3.4.1 Water Table Behavior in the Area
3.4.2 Ground Water Potential of the Study Area
3.4.3 Hydraulic Characteristics
3.5 Acoustic Environment
3.5.1 Instrument Used and Methodology
3.5.2 Noise Standards
3.5.3 Assessment of Noise Level
3.5.4 Results and Discussions
3.6 Land Environment
3.6.1 Land Use Pattern
3.6.2 Status of Forest Clearances
3.7 Soil Quality
3.8 Biological Environment
3.8.1 Survey Methodology
3.8.2 Flora and Fauna Distribution
3.8.2.1 Floral Diversity
3.8.2.2 Fauna
3.9 Socio-économic Environnent
3.9.1 Industrialisation
3.9.2 Communication
3.9.3 Trade and Commerce
3.9.4 Electricity and Power
3.9.5 Socio-Economic Profile
3.9.5.1 Demographic Pattern
3.9.5.2 Literacy
3.9.6 Quality of Life
3.9.6.1 Methodology
3.9.6.2 Quality of life Factor List
v
v
DESCRIPTION PAGE
NO.
3.9.7 Socio Economic Profile of PAP/PAF in Core Zone
3.10 Socio Economic Profile in Core Zone Village
3.11 Health Facilities
CHAPTER 4
ANTICIPATED ENVIRONMENTAL IMPACT
4.1 Introduction
4.2 Air Environment
4.3 Noise Environnent
4.3.1 Day - Night Noise Levels
4.3.2 Prediction of Impacts due to Transportation
4.3.3 Prediction of Impacts on Occupational Health
4.3.4 Prediction of Impact on Community
4.3.5 Impact due to Blasting, Ground Vibrations and Noise
4.4 Water Pollution
4.4.1 Impact on Banzsloi River due to discharge of mine water
4.5 Land Environment
4.5.1 Soil Erosion Mapping
4.5.2 Assessment of Soil Erosion Potential of Study Area
4.5.3 Assessment of Soil Erosion Potential due to Mining Activity
4.5.4 Impact of Diversion of Agriculture Land on the Socio Economic
aspect of the area including Land Owner and Land Less
Laborers
4.6 Biological Environment
4.7 Socio-economic Environment
CHAPTER 5
ANALYSIS OF ALTERNATIVES (TECHNOLOGY & SITE)
5.1 Selection of Site
5.2 Selection of Technology
5.3 Suggested Eco-Friendly Open Cast Mining Technology
5.4 OB Dump Management
5.5 Calendar Plan of the Mine Development
5.6 Underground Mining

vi
vi
DESCRIPTION PAGE
NO.
5.7 Conclusion
CHAPTER 6
ENVIRONMENTAL MONITORING PROGRAMME
6.1 Technical Aspects of Monitoring
6.2 Organization/Environmental Management Cell
6.2.1 Laboratory Facility and Equipment
6.2.2 Environmental Auditing
CHAPTER 7
ADDITIONAL STUDIES
7.1 Public Consultation
7.1.1 Proceedings of the Public Hearing ……..
7.2 Risk Assessment
7.3 Disaster Management In Open –Cast Mines
7.4 Social Impact Assessment
7.5 R & R Action Plan
7.5.1 Socio economic profile of PAP/PAF in eleven villages
7.5.2 Objective of the R&R Policy
7.5.3 The Compensation Package
7.5.3.1 Unit of Entitlement
7.5.3.2 Brief description of benefits as per the R&R package
7.5.4 Additional Benefits
7.6 Other R&R Benefits
7.7 Special Comments
CHAPTER 8
PROJECT BENEFITS
8.1 Improvements in the Physical Infrastructure
8.2 Employment Potential
8.3 Tangible benefits
8.5 Result and Discussion
CHAPTER 9
ENVIRONMENTAL COST BENEFIT ANALYSIS
CHAPTER 10
ENVIRONMENTAL MANAGEMENT PLAN
10.0 Introduction
vii
vii
DESCRIPTION PAGE
NO.
10.1 Air Environment
10.1.1 Dust Control
10.1.2 Gaseous Pollutants
10.2 Water Environment
10.2.1 Water Management
10.2.2 Water balance scenario
10.2.3 Ground Water Conservation, Recharge and Monitoring Plan
10.2.4 Pumping and Drainage
10.2.5 Sewage Treatment Plant for Colony & Rehabilitation Site
10.3 Noise Environment
10.4 Land Environment
10.4.1 Waste Disposal Technique
10.4.2 Stability of Benches
10.4.3 Overburdem Management
10.5 Biological Environment
10.5.1 Screening of Plants
10.5.2 Preservation and amendment of Soil
10.5.3 Methods of Revegetation
10.5.4 Aftercare and Monitoring
10.5.5 Nursery Development
10.5.6 Cost of Bio-reclamation
10.5.7 Greenbelt Development
10.6 Socio-Economic Measures
10.7 Capital Investment for Environmental Control Measures
10.8 Litigation pending regarding the project
CHAPTER 11
SUMMARY & CONCLUSION
11.0 Introduction
11.1 Purpose of the Report
11.2 Identification of Project & Project Proponent
11.3 Scope of Environment Impact Assessment Study
11.4 Project Description
11.4.1 Proposed Schedule for Mining Implementation
11.5 Description of Mitigation Measures
viii
viii
DESCRIPTION PAGE
NO.
11.6 Description of Environment
11.7 Anticipated Environmental Impact
11.8 Analysis of Alternatives (Technology & Site)
11.9 Risk Analysis
11.10 Environmental Management Plan
CHAPTER 12
CONSULTANTS FOR EIA / EMP PREPARATION
12.0 NAME OF THE CONSULTANTS 12-1
ANNEXURES
Annexure The copy of the letter received from the Ministry on the TOR prescribed for the project should be attached as an annexure to the final EIA-EMP report.
Annexure-I Details of the notices issued in the newspapers
Annexure-II Copy of the request letter, proceedings/minutes of public hearing
Annexure-III R &R Plan
Annexure-IV Sanction Letter from Office of the Director, Ground Water Directorate, Jabalpur Madhya Pradesh

TOR CONTENT
POINT
NO. PRESCRIBED TOR POINT
REFERENCE
CHAPTER NO. PAGE NO.
PARA
NO.
i
Year-wise production details since 1994 should be given, clearly stating the highest production
achieved in any one year prior to 1994. It may also be categorically informed whether there had been any increase in production after the EIA
Notification 1994 came into force, w.r.t. the highest production achieved prior to1994.
Not Applicable
New project -- --
ii
A copy of the document in support of the fact that the Proponent is the rightful lessee of the
mine should be given.
.
Lease deed enclosed
Annexure
iii
All documents including approved mine plan, EIA
and Public Hearing should be compatible with one another in terms of the mine lease area,
production levels, waste generation and its management, mining technology etc. and should be in the name of the lessee.
--- ---
----
iv
All corner coordinates of the mine lease area, superimposed on a High Resolution
Imagery/topo sheet, topographic sheet, geomorphology and geology of the area should
be provided. Such an Imagery of the proposed area should clearly show the land use and other
ecological features of the study area (core and buffer zone).
v
Information should be provided in Survey of India Toposheet in 1:50,000 scale indicating geological map of the area, geomorphology of
land forms of the area, existing minerals and mining history of the area, important water
bodies, streams and rivers and soil characteristics.

POINT
NO. PRESCRIBED TOR POINT
REFERENCE
CHAPTER NO. PAGE NO.
PARA
NO.
vi
Details about the land proposed for mining
activities should be given with information as to whether mining conforms to the land use policy
of the State; land diversion for mining should have approval from State land use board or the
concerned authority.
vii
It should be clearly stated whether the
proponent Company has a well laid down Environment Policy approved by its Board of Directors? If so, it may be spelt out in the EIA
Report with description of the prescribed operating process/procedures to bring into focus
any infringement/deviation/violation of the environmental or forest norms/ conditions? The
hierarchical system or administrative order of the Company to deal with the environmental
issues and for ensuring compliance with the EC conditions may also be given. The system of
reporting of non-compliances / violations of environmental norms to the Board of Directors
of the Company and/or shareholders or stakeholders at large, may also be detailed in
the EIA Report.
viii
Issues relating to Mine Safety, including
subsidence study in case of underground mining and slope study in case of open cast mining,
blasting study etc. should be detailed. The proposed safeguard measures in each case
should also be provided.
ix
The study area will comprise of 10 km zone around the mine lease from lease periphery and
the data contained in the EIA such as waste generation etc. should be for the life of the mine
/ lease period.
.
POINT
NO. PRESCRIBED TOR POINT
REFERENCE
CHAPTER NO. PAGE NO.
PARA
NO.
.
x
Land use of the study area delineating forest
area, agricultural land, grazing land, wildlife sanctuary, national park, migratory routes of fauna, water bodies, human settlements and
other ecological features should be indicated. Land use plan of the mine lease area should be
prepared to encompass preoperational, operational and post operational phases and
submitted. Impact, if any, of change of land use should begiven.
xi
Details of the land for any Over Burden Dumps outside the mine lease, such as extent of land
area, distance from mine lease, its land use, R&R issues, if any, should be given.
xii
A Certificate from the Competent Authority in
the State Forest Department should be provided, confirming the involvement of forest land, if any,
in the project area. In the event of any contrary claim by the Project Proponent regarding the
status of forests, the site may be inspected by the State Forest Department along with the
Regional Office of the Ministry to ascertain the status of forests, based on which, the Certificate
in this regard as mentioned above be issued. In all such cases, it would be desirable for
representative of the State Forest Department to assist the Expert Appraisal Committees
.
xiii
Status of forestry clearance for the broken up area and virgin forestland involved in the Project including deposition of net present value (NPV)
and compensatory afforestation (CA) should be indicated. A copy of the forestry clearance
should also be furnished
POINT
NO. PRESCRIBED TOR POINT
REFERENCE
CHAPTER NO. PAGE NO.
PARA
NO.
xiv
Implementation status of recognition of forest rights under the Scheduled Tribes and other
Traditional Forest Dwellers (Recognition of Forest Rights) Act, 2006 should be indicated.
xv
The vegetation in the RF / PF areas in the study area, with necessary details, should be given.
xvi
Impact of mining on hydrology, modification of natural
drainage, diversion and channeling of the existing
rivers/water courses flowing through the ML and adjoining
the lease/project and the impact on the existing users and
impacts of mining operations thereon.
xvii
A study shall be got done to ascertain the impact
of the Mining Project on wildlife of the study area and details furnished. Impact of the project on the wildlife in the surrounding and any other
protected area and accordingly, detailed mitigative measures required, should be worked
out with cost implications and submitted.
xviii
A detailed biological study of the study area [core zone and buffer zone (10 km radius of the
periphery of the mine lease)] shall be carried out. Details of flora and fauna, endangered,
endemic and RET Species duly authenticated, separately for core and buffer zone should be
furnished based on such primary field survey, clearly indicating the Schedule of the fauna
present. In case of any scheduled-I fauna found in the study area, the necessary plan alongwith
budgetary provisions for their conservation should be prepared in consultation with State Forest and Wildlife Department and
details furnished. Necessary allocation of funds for implementing the same should be made as
part of the project cost.
POINT
NO. PRESCRIBED TOR POINT
REFERENCE
CHAPTER NO. PAGE NO.
PARA
NO.
xix
Proximity to Areas declared as ‘Critically Polluted’ or the Project areas likely to come
under the ‘Aravali Range’, (attracting court restrictions for mining operations), should also
be indicated and where so required, clearance certifications from the prescribed Authorities,
such as the SPCB or State Mining Dept. Should be secured and furnished to the effect that the proposed mining activities could be considered.
xx
Similarly, for coastal Projects, A CRZ map duly authenticated by one of the authorized agencies
demarcating LTL. HTL, CRZ area, location of the mine lease w.r.t CRZ, coastal
featuressuchasmangroves,ifany,shouldbefurnished.(Note:TheMiningProjects falling under CRZ
would also need to obtain approval of the concerned Coastal Zone Management Authority).
xxi
R&R Plan/compensation details for the Project
Affected People (PAP) should be furnished. While preparing the R&R Plan, the relevant
State/National Rehabilitation & Resettlement Policy should be kept in view. In respect of SCs
/STs and other weaker sections of the society in the study area, a need based sample survey,
family-wise, should be undertaken to assess their requirements, and action programmes
prepared and submitted accordingly, integrating the sectoral programmes of line departments of the State Government. It may be clearly brought
out whether the village(s) located in the mine lease area will be shifted or not. The issues
relating to shifting of village(s) including their R&R and socio-economic aspects should be
discussed in the Report.
xxii
One season (non-monsoon) [i.e. March - May
(Summer Season); October - December (post monsoon season) ; December - February (winter
season)] primary baseline data on ambient air quality as per CPCB Notification of 2009, water
POINT
NO. PRESCRIBED TOR POINT
REFERENCE
CHAPTER NO. PAGE NO.
PARA
NO.
quality, noise level, soil and flora and fauna shall
be collected and the AAQ and other data so compiled presented date-wise in the EIA and
EMP Report. Site-specific meteorological data should also be collected. The location of the
monitoring stations should be such as to represent whole of the study area and justified keeping in view the pre-dominant downwind
direction and location of sensitive receptors. There should be at least one monitoring station
within 500 m of the mine lease in the pre-dominant downwind direction. The mineralogical
composition of PM10, particularly for free silica, should be given.
xxiii
Airqualitymodelingshouldbecarriedoutforpredictionofimpactoftheprojectonthe
air quality of the area. It should also take into account the
impact of movement of vehicles for transportation of
mineral. The details of the model used and input parameters
used for modeling should be provided. The air quality
contours may be shown on a location map clearly indicating
the location of the site, location of sensitive receptors, if any,
and the habitation. The wind roses showing pre-dominant
wind direction may also be indicated on the map
xxiv
The water requirement for the Project, its availability and source should be furnished. A detailed water balance should also be provided.
Fresh water requirement for the Project should be indicated
xxv
Necessary clearance from the Competent Authority for drawl of requisite quantity of water
for the Project should be provided.
xxvi
Description of water conservation measures
proposed to be adopted in the Project should be given. Details of rainwater harvesting proposed

POINT
NO. PRESCRIBED TOR POINT
REFERENCE
CHAPTER NO. PAGE NO.
PARA
NO.
in the Project, if any, should be provided.
xxvii
Impact of the Project on the water quality, both surface and groundwater, should be assessed and necessary safeguard measures, if any
required, should be provided
xxviii
Based on actual monitored data, it may clearly
be shown whether working will intersect groundwater. Necessary data and
documentation in this regard may be provided. In case the working will intersect groundwater
table, a detailed Hydro Geological Study should be undertaken and Report furnished. The Report
inter-alia, shall include details of the aquifers present and impact of mining activities on these
aquifers. Necessary permission from Central Ground Water Authority for working below
ground water and for pumping of ground water should also be obtained and copy furnished.
xxix
Details of any stream, seasonal or otherwise,
passing through the lease area and modification / diversion proposed, if any, and the impact of
the same on the hydrology should be brought out.
xxx
Information on site elevation, working depth, groundwater table etc. Should be provided both
in AMSL and BGL. A schematic diagram may also be provided for the same
xxxi
A time bound Progressive Greenbelt
Development Plan shall be prepared in a tabular form (indicating the linear and quantitative
coverage, plant species and time frame) and submitted, keeping in mind, the same will have
to be executed up front on commencement of

POINT
NO. PRESCRIBED TOR POINT
REFERENCE
CHAPTER NO. PAGE NO.
PARA
NO.
the Project. Phase-wise plan of plantation and
compensatory afforestation should be charted clearly indicating the area to be covered under
plantation and the species to be planted. The details of plantation already done should be
given. The plant species selected for green belt should have greater ecological value and should be of good utility value to the local population
with emphasis on local and native species and the species which are tolerant to pollution.
xxxii
Impact on local transport infrastructure due to the Project should be indicated. Projected
increase in truck traffic as a result of the Project in the present road network (including those
outside the Project area) should be worked out, indicating whether it is capable of handling the
incremental load. Arrangement for improving the infrastructure, if contemplated (including action
to be taken by other agencies such as State Government) should be covered. Project Proponent shall conduct Impact of
Transportation study as per Indian Road Congress Guideline
xxxiii
Details of the onsite shelter and facilities to be provided to the mine workers should be included
in the EIA Report.
xxxiv
Conceptual post mining land use and Reclamation and Restoration of mined out areas
(with plans and with adequate number of sections) should be given in the EIA report
xxxv
Occupational Health impacts of the Project
should be anticipated and the proposed preventive measures spelt out in detail. Details
of pre-placement medical examination and periodical medical examination schedules should
be incorporated in the EMP. The project specific

POINT
NO. PRESCRIBED TOR POINT
REFERENCE
CHAPTER NO. PAGE NO.
PARA
NO.
occupational health mitigation measures with
required facilities proposed in the mining area may be detailed.
xxxvi
Public health implications of the Project and
related activities for the population in the impact zone should be systematically evaluated and the
proposed remedial measures should be detailed along with budgetary allocations
xxxvii
Measures of socio economic significance and influence to the local community proposed to be provided by the
Project Proponent should be indicated. As far as possible, quantitative dimensions may be given with time frames
for implementation
xxxviii
Detailed environmental management plan (EMP) to mitigate the environmental impacts which, should inter-
alia include the impacts of change of land use, loss of agricultural and grazing land, if any, occupational health
impacts besides other impacts specific to the proposed Project.
xxxvix
Public Hearing points raised and commitment of the Project Proponent on the same along with time bound
Action Plan with budgetary provisions to implement the same should be provided and also incorporated in the
final EIA/EMP Report of the Project.
xxxx
Details of litigation pending against the project, if any, with direction /order passed by any Court of Law against
the Project should be given.
xxxxi
The cost of the Project (capital cost and recurring cost)
as well as the cost towards implementation of EMP should be clearly spelt out.

POINT
NO. PRESCRIBED TOR POINT
REFERENCE
CHAPTER NO. PAGE NO.
PARA
NO.
xxxxii
A Disaster management Plan shall be prepared and included in the EIA/EMP Report
xxxxiii
Benefits of the Project if the Project is implemented should be spelt out. The benefits of the Project shall
clearly indicate environmental, social, economic, employment potential, etc.
xxxxiv
Besides the above, the below mentioned general points are also to be followed:-
a) All documents to be properly referenced with index
and continuous page numbering.
b) Where data are presented in the Report especially in Tables, the period in which the data were collected and
the sources should beindicated.
c)Project Proponent shall enclose all the analysis/testing reports of water, air, soil, noise etc. using the
MoEF&CC/NABL accredited laboratories. All the original analysis/testing reports should be available during appraisal of the Project.
d) Where the documents provided are in a language
other than English, an English translation should be provided.
e) The Questionnaire for environmental appraisal of
mining projects as devised earlier by the Ministry shall also be filled and submitted.
f) While preparing the EIA report, the instructions for the
Proponents and instructions for the Consultants issued by MoEF vide O.M. No. J-11013/41/2006-IA.II(I) dated
4thAugust, 2009, which are available on the website of this Ministry, should be followed.
g) Changes, if any made in the basic scope and project
parameters (as submitted in Form-I and the PFR for securing the TOR) should be brought to the attention of
MoEF&CC with reasons for such changes and permission

POINT
NO. PRESCRIBED TOR POINT
REFERENCE
CHAPTER NO. PAGE NO.
PARA
NO.
should be sought, as the TOR may also have to be
altered. Post Public Hearing changes in structure and content of the draft EIA/EMP (other than modifications
arising out of the P.H. process) will entail conducting the PH again with the revised documentation.
h) As per the circular no. J-11011/618/2010-IA.II(I)
dated 30.5.2012, certified report of the status of compliance of the conditions stipulated in the environment clearance for the existing operations of the
project, should be obtained from the Regional Office of Ministry of Environment, Forest and Climate Change, as
may be applicable.
i) The EIA report should also include (i) surface plan of the area indicating contours of main
topographicfeatures,drainageandminingarea,(ii)geologicalmapsandsectio nsand (iii) sections of the mine pit and external dumps, if any,
clearly showing the land features of the adjoining area.
CHAPTER 1
INTRODUCTION
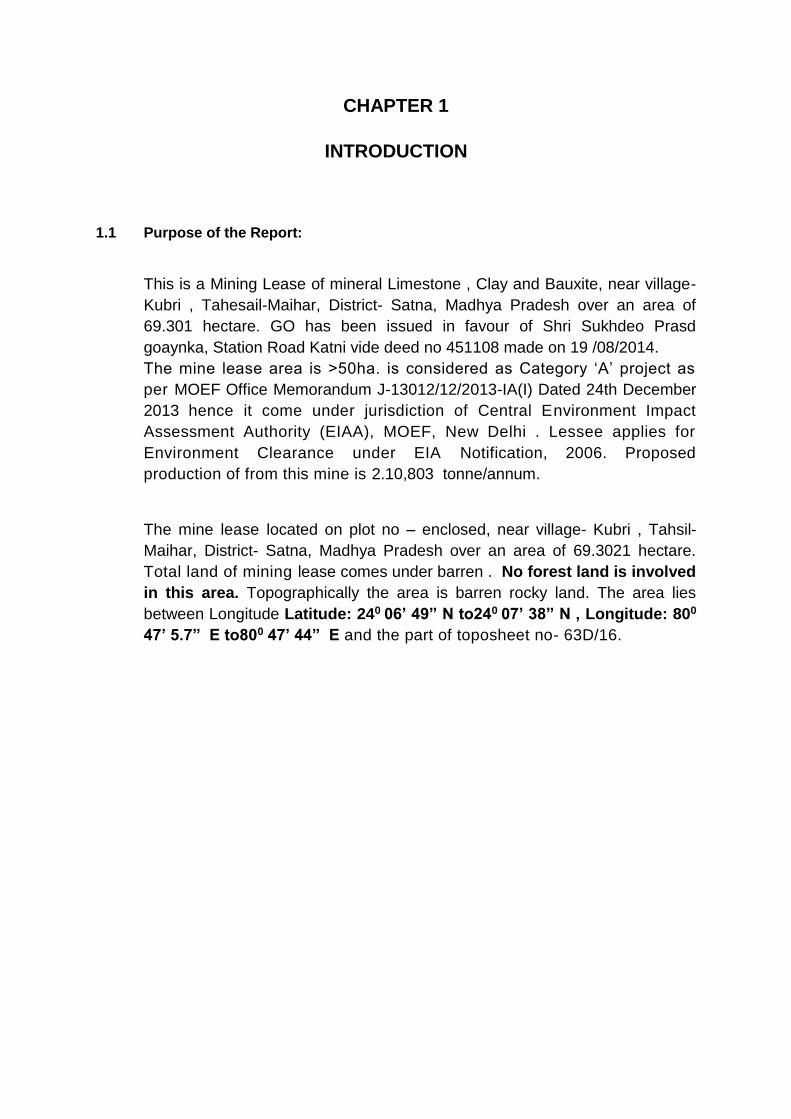
1.1 Purpose of the Report:
This is a Mining Lease of mineral Limestone , Clay and Bauxite, near village-
Kubri , Tahesail-Maihar, District- Satna, Madhya Pradesh over an area of
69.301 hectare. GO has been issued in favour of Shri Sukhdeo Prasd
goaynka, Station Road Katni vide deed no 451108 made on 19 /08/2014.
The mine lease area is >50ha. is considered as Category ‘A’ project as
per MOEF Office Memorandum J-13012/12/2013-IA(I) Dated 24th December
2013 hence it come under jurisdiction of Central Environment Impact
Assessment Authority (EIAA), MOEF, New Delhi . Lessee applies for
Environment Clearance under EIA Notification, 2006. Proposed
production of from this mine is 2.10,803 tonne/annum.
The mine lease located on plot no – enclosed, near village- Kubri , Tahsil-
Maihar, District- Satna, Madhya Pradesh over an area of 69.3021 hectare.
Total land of mining lease comes under barren . No forest land is involved
in this area. Topographically the area is barren rocky land. The area lies
between Longitude Latitude: 240 06’ 49” N to240 07’ 38” N , Longitude: 800
47’ 5.7” E to800 47’ 44” E and the part of toposheet no- 63D/16.
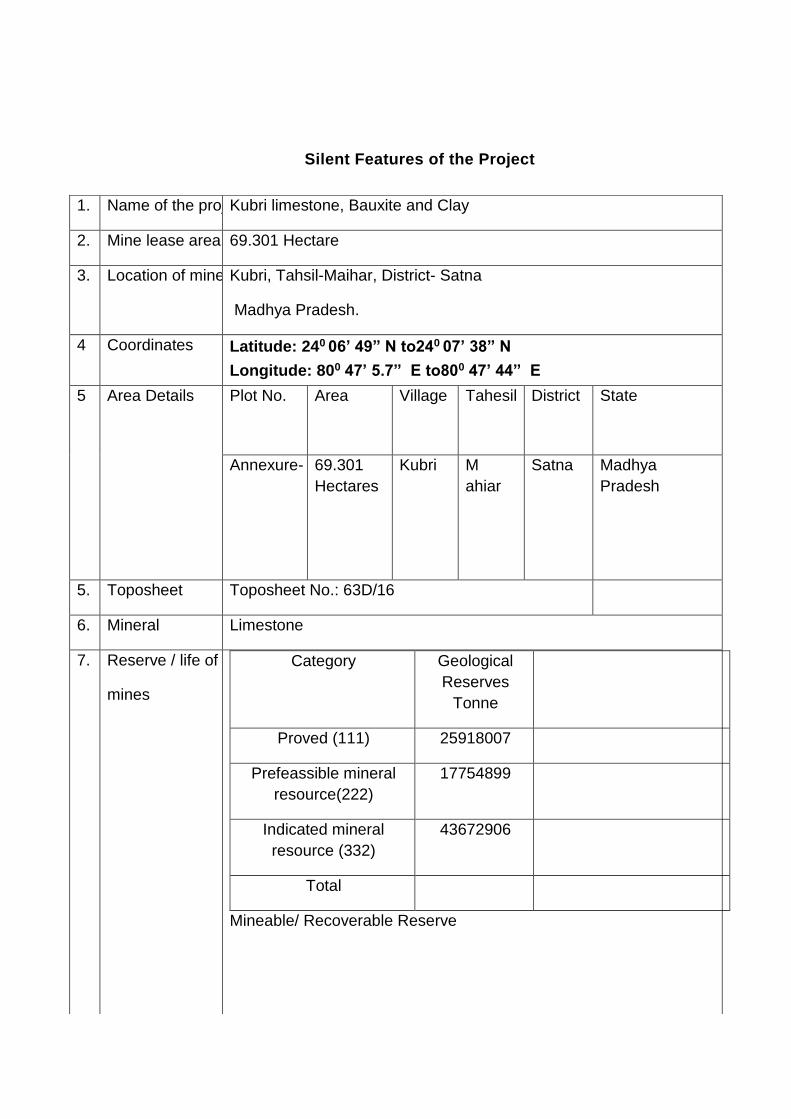
Silent Features of the Project
1. Name of the project Kubri limestone, Bauxite and Clay
2. Mine lease area 69.301 Hectare
3. Location of mine Kubri, Tahsil-Maihar, District- Satna
Madhya Pradesh.
4 Coordinates Latitude: 240 06’ 49” N to240 07’ 38” N
Longitude: 800 47’ 5.7” E to800 47’ 44” E
5 Area Details Plot No.
Area
Village
Tahesil
District
State
Annexure- I
69.301
Hectares
Kubri
M
ahiar
Satna
Madhya
Pradesh
5. Toposheet Toposheet No.: 63D/16
6. Mineral Limestone
7. Reserve / life of
mines
Category Geological
Reserves
Tonne
Proved (111) 25918007
Prefeassible mineral
resource(222)
17754899
Indicated mineral
resource (332)
43672906
Total
Mineable/ Recoverable Reserve
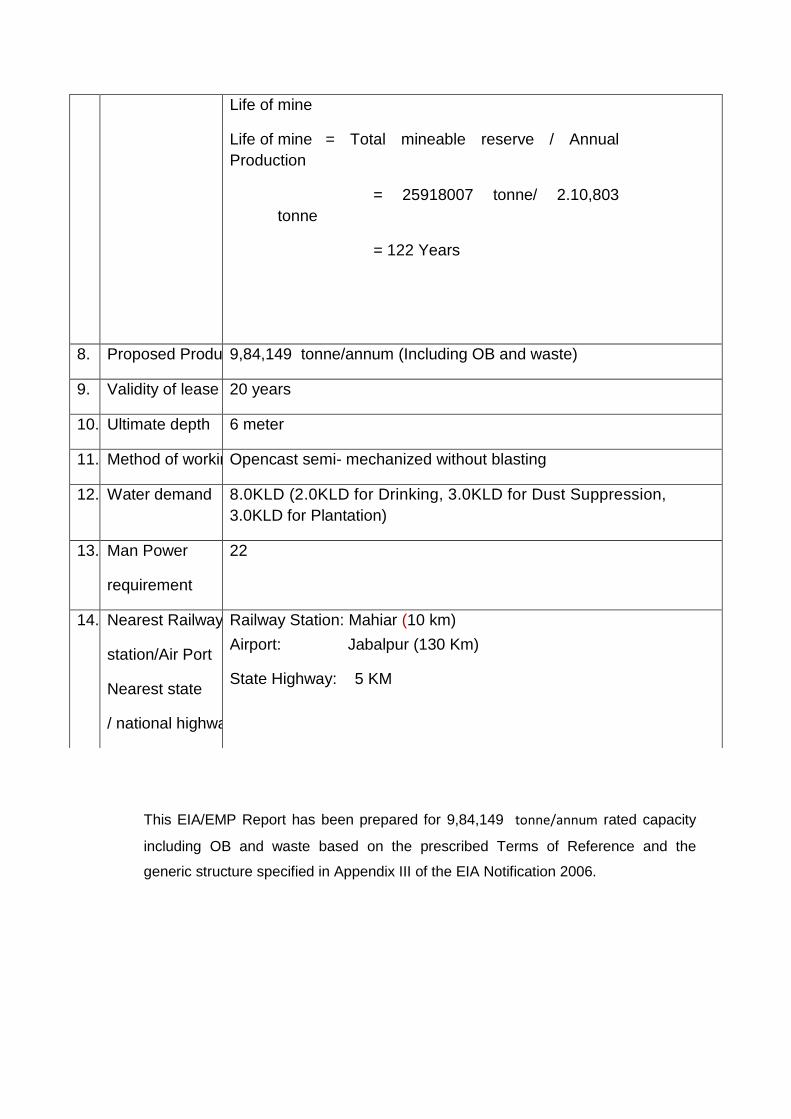
This EIA/EMP Report has been prepared for 9,84,149 tonne/annum rated capacity
including OB and waste based on the prescribed Terms of Reference and the
generic structure specified in Appendix III of the EIA Notification 2006.
Life of mine
Life of mine = Total mineable reserve / Annual
Production
= 25918007 tonne/ 2.10,803
tonne
= 122 Years
8. Proposed Production 9,84,149 tonne/annum (Including OB and waste)
9. Validity of lease 20 years
10. Ultimate depth 6 meter
11. Method of working Opencast semi- mechanized without blasting
12. Water demand 8.0KLD (2.0KLD for Drinking, 3.0KLD for Dust Suppression,
3.0KLD for Plantation)
13. Man Power
requirement
22
14. Nearest Railway
station/Air Port
Nearest state
/ national highway
Railway Station: Mahiar (10 km)
Airport: Jabalpur (130 Km)
State Highway: 5 KM
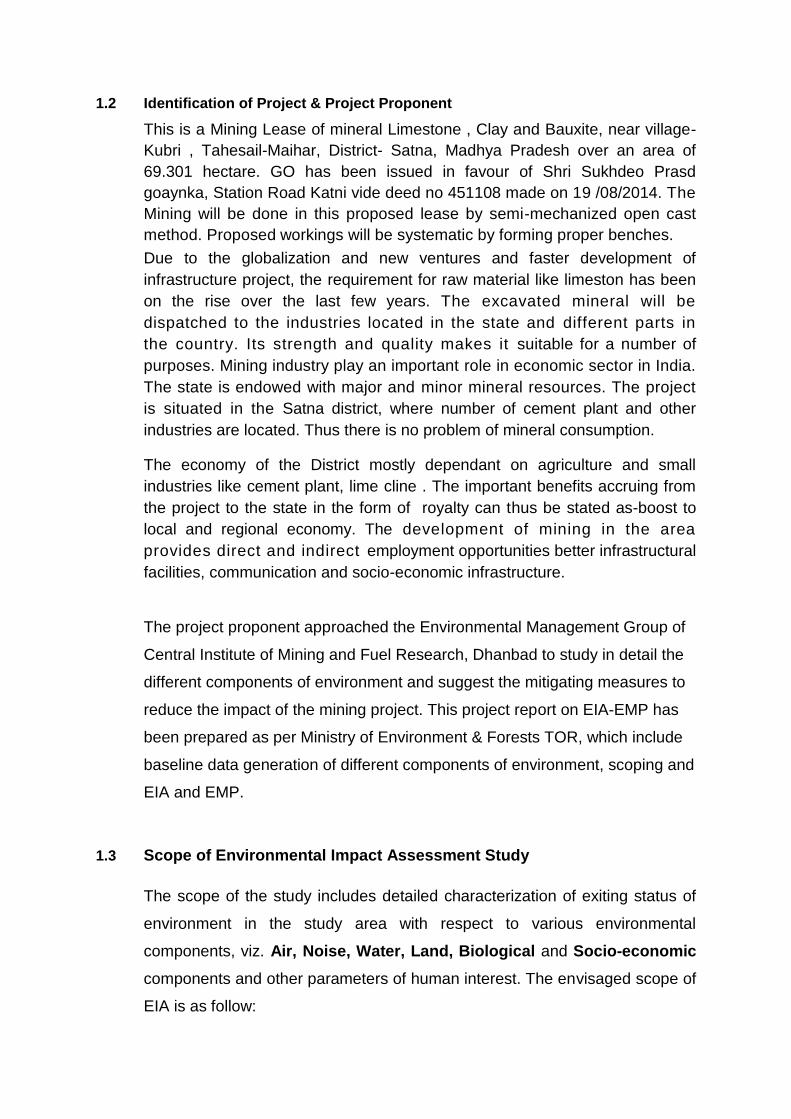
1.2 Identification of Project & Project Proponent
This is a Mining Lease of mineral Limestone , Clay and Bauxite, near village-
Kubri , Tahesail-Maihar, District- Satna, Madhya Pradesh over an area of
69.301 hectare. GO has been issued in favour of Shri Sukhdeo Prasd
goaynka, Station Road Katni vide deed no 451108 made on 19 /08/2014. The
Mining will be done in this proposed lease by semi-mechanized open cast
method. Proposed workings will be systematic by forming proper benches.
Due to the globalization and new ventures and faster development of
infrastructure project, the requirement for raw material like limeston has been
on the rise over the last few years. The excavated mineral will be
dispatched to the industries located in the state and different parts in
the country. Its strength and quality makes it suitable for a number of
purposes. Mining industry play an important role in economic sector in India.
The state is endowed with major and minor mineral resources. The project
is situated in the Satna district, where number of cement plant and other
industries are located. Thus there is no problem of mineral consumption.
The economy of the District mostly dependant on agriculture and small
industries like cement plant, lime cline . The important benefits accruing from
the project to the state in the form of royalty can thus be stated as-boost to
local and regional economy. The development of mining in the area
provides direct and indirect employment opportunities better infrastructural
facilities, communication and socio-economic infrastructure.
The project proponent approached the Environmental Management Group of
Central Institute of Mining and Fuel Research, Dhanbad to study in detail the
different components of environment and suggest the mitigating measures to
reduce the impact of the mining project. This project report on EIA-EMP has
been prepared as per Ministry of Environment & Forests TOR, which include
baseline data generation of different components of environment, scoping and
EIA and EMP.
1.3 Scope of Environmental Impact Assessment Study
The scope of the study includes detailed characterization of exiting status of
environment in the study area with respect to various environmental
components, viz. Air, Noise, Water, Land, Biological and Socio-economic
components and other parameters of human interest. The envisaged scope of
EIA is as follow:
• To assess the present status of Air, Noise, Water, Land, Biological and
Socio-economic components of the environment during different
seasons.
• Identification and quantification of significant impact of mining operations
on various components of the environment.
• Preparation of Environmental Management Plan (EMP) outlining control
measures to be adopted for mitigation of adverse impacts during mining.
1.4 Terms of reference (TOR)
The project was considered in EAC meeting held on 20-21 Februrary and approved
the TOR. The brief is as fellows:
The project pertains to seeking ToR for Limestone , Clay and Bauxite mining
near village- Kubri , Tahsil- Maihar, District- Satna, Madhya Pradesh for
capacity of 9,84,149 TPA including ob and waste ,over an area of 69.301
hectare by Shri Sukhdeo Prasad Goenka. The ML area comes under barren.
No forest land is involved in this area. Topographically the area is barren
rocky land. The area lies between Longitude Latitude 24º06’49”N
to24º07’38”N, Longitude 80º47’5.7”E to 80º47’44”E and covered under topo
sheet no- 63D/16. The PP has provided the KML file which was checked by
the EAC through Google earth/ DSS.
The Committee during presentation noted that the PP has uploaded its
application in the name of Chakraborty Mineral; however, during the
presentation PP has informed that the project proponent is Shri Sukhdeo
Prasad Goenka and the application was inadvertently uploaded in other
name. The Committee noted the same and accepted the change in the name
of PP in view of the lease deed and approved mining plan submitted by the
PP. The PP has applied for 2,10,803 TPA of minerals, however, during
the meeting EAC has clarified to the PP that EC would be given for
2,10,803 TPA of ROM including OB and waste under the instant proposal
or PP may revise it accordingly. The proposed water requirement for the
project is 8KLD with 2.0KLD for Drinking, 3.0KLD for Dust Suppression and
3.0KLD for Plantation.

No ecologically sensitive area such as National park/ Wildlife Sanctuary/
Biosphere Reserve etc. is reported to be located within 10km. radius of the
mine lease area. No forest land is involved in the lease area. The area does
not Minutes of 15thEAC Meeting held during February 20-21, 2017 Page 25 of
74

come under CRZ category. The Committee asked the PP to obtain
necessary NOC/ clearance from concerned authority regarding non-
involvement of forest land and a distance certificate from Chief Wildlife
Warden, Madhya Pradesh in respect of location of National parks,
biospheres, and Wildlife sanctuaries etc. The PP has further informed
that the mining plan has been envisaged for 40.6810 ha (refer Pg.65 of
approved mining plan). The mining is proposed to be done in by semi-
mechanized opencast method. The committee also noted that Lime Stone
and Bauxite are included in the lease deed executed by the State Govt.
The lease area in general comprises of a flat topography and the elevation
ranges from 386mRL to 394mRL.
The PP has presented the tentative plan for baseline data monitoring. The
committee deliberated on the plan and asked the PP to stick to the standards
methodology and protocols framed by Central Pollution Control Board for
baseline data monitoring. The manpower requirement for the proposed mining
operation would be around 22 persons.
The committee deliberated and discussed the proposal submitted by the Shri
Sukhdeo Prasad Goenka and approved the proposal for grant of standard
ToR conditions for mining project to the PP for the preparation of EIA/ EMP
report.
The following Terms Of Reference (TOR) have been prescribed by the Expert
Appraisal Committee.
1) Year-wise production details since 1994 should be given, clearly stating the highest production achieved in any one year prior to 1994. It may also be categorically informed whether there had been any increase in production after the EIA Notification 1994 came into force, w.r.t. the highest production achieved prior to1994.
2) A copy of the document in support of the fact that the Proponent is the rightful lessee of the mine should be given.
3) All documents including approved mine plan, EIA and Public Hearing should be compatible with one another in terms of the mine lease area, production levels, waste generation and its management, mining technology etc. and should be in the name of the lessee.
4) All corner coordinates of the mine lease area, superimposed on a High Resolution Imagery/topo sheet, topographic sheet, geomorphology and geology of the area should be provided. Such an Imagery of the proposed

area should clearly show the land use and other ecological features of the study area (core and buffer zone).
5) Information should be provided in Survey of India Toposheet in 1:50,000 scale indicating geological map of the area, geomorphology of land forms of the area, existing minerals and mining history of the area, important water bodies, streams and rivers and soil characteristics.
6) Details about the land proposed for mining activities should be given with information as to whether mining conforms to the land use policy of the State; land diversion for mining should have approval from State land use board or the concerned authority.
7) It should be clearly stated whether the proponent Company has a well laid down Environment Policy approved by its Board of Directors? If so, it may be spelt out in the EIA Report with description of the prescribed operating process/procedures to bring into focus any infringement/deviation/violation of the environmental or forest norms/ conditions? The hierarchical system or administrative order of the Company to deal with the environmental issues and for ensuring compliance with the EC conditions may also be given. The system of reporting of non-compliances / violations of environmental norms to the Board of Directors of the Company and/or shareholders or stakeholders at large, may also be detailed in the EIA Report.
8) Issues relating to Mine Safety, including subsidence study in case of underground mining and slope study in case of open cast mining, blasting study etc. should be detailed. The proposed safeguard measures in each case should also be provided.
9) The study area will comprise of 10 km zone around the mine lease from lease periphery and the data contained in the EIA such as waste generation etc. should be for the life of the mine / lease period.
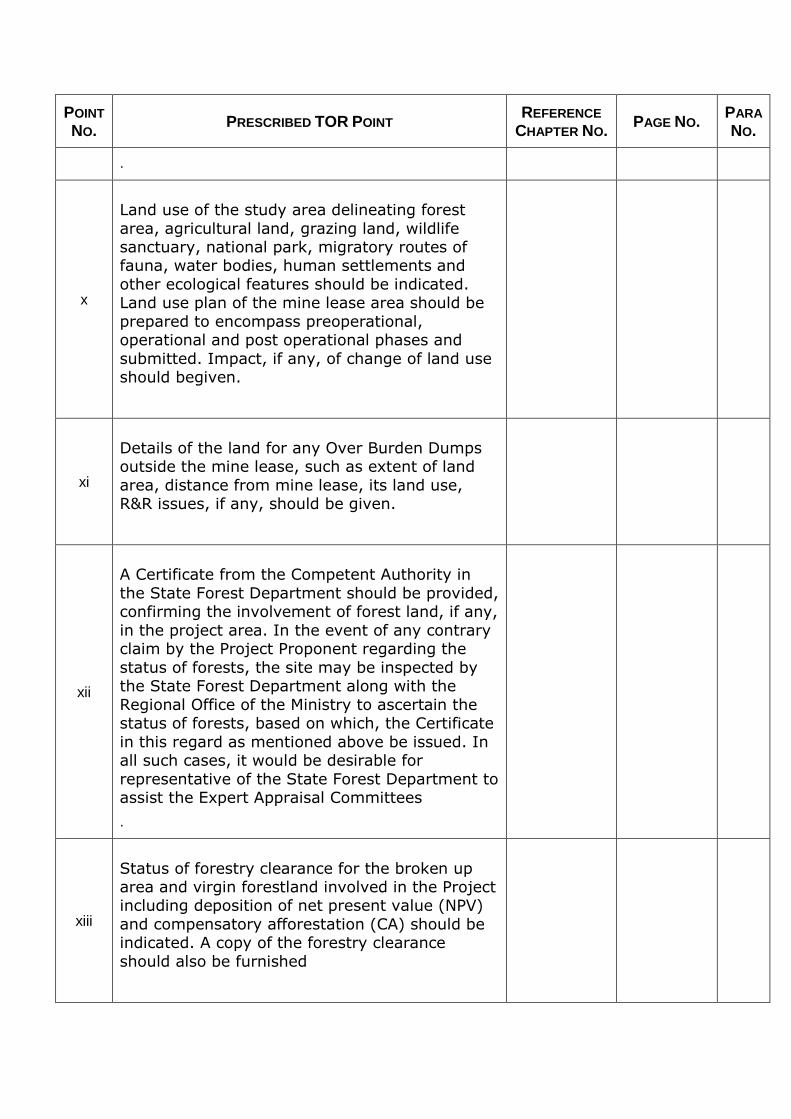
10) Land use of the study area delineating forest area, agricultural land, grazing land, wildlife sanctuary, national park, migratory routes of fauna, water bodies, human settlements and other ecological features should be indicated. Land use plan of the mine lease area should be prepared to encompass preoperational, operational and post operational phases and submitted. Impact, if any, of change of land use should begiven. 11) Details of the land for any Over Burden Dumps outside the mine lease, such as extent of land area, distance from mine lease, its land use, R&R issues, if any, should be given.
12) A Certificate from the Competent Authority in the State Forest Department should be provided, confirming the involvement of forest land, if any, in the project area. In the event of any contrary claim by the Project Proponent regarding the status of forests, the site may be inspected by the State Forest Department along with the Regional Office of the Ministry to ascertain the status of forests, based on which, the Certificate in this regard as mentioned above be issued. In all such cases, it would be desirable for representative of the State Forest Department to assist the Expert Appraisal Committees.
13) Status of forestry clearance for the broken up area and virgin forestland involved in the Project including deposition of net present value (NPV) and compensatory afforestation (CA) should be indicated. A copy of the forestry clearance should also be furnished.
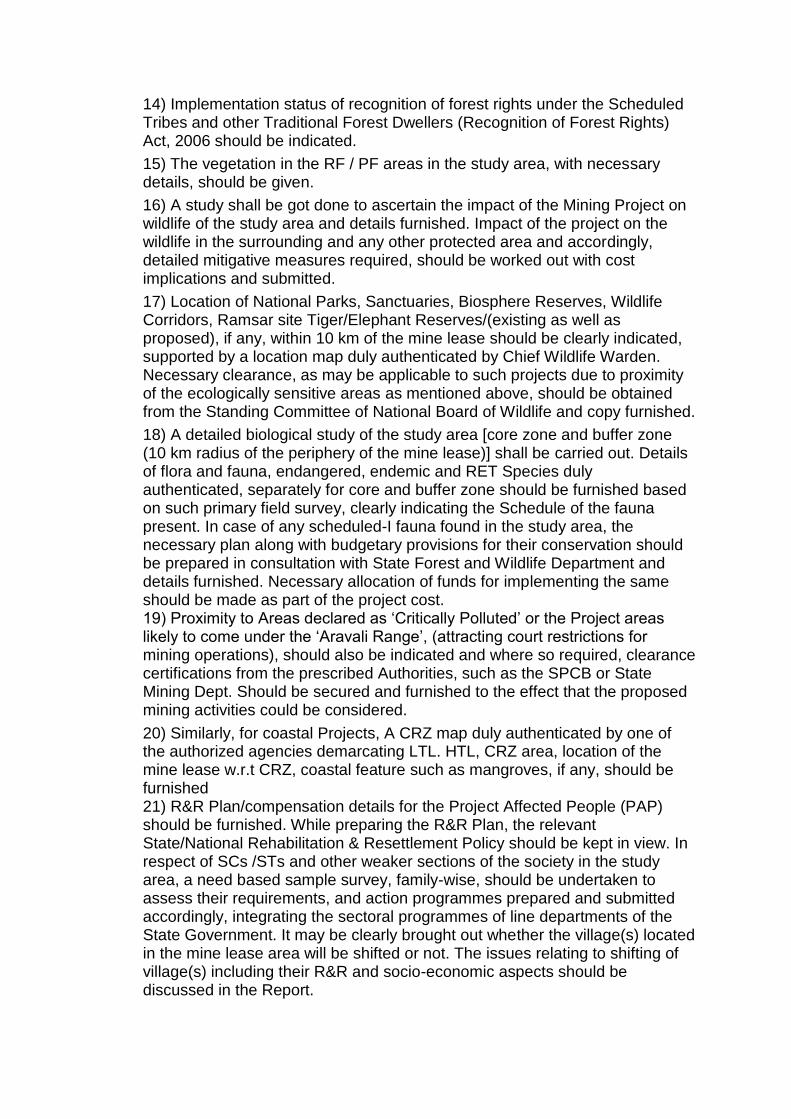
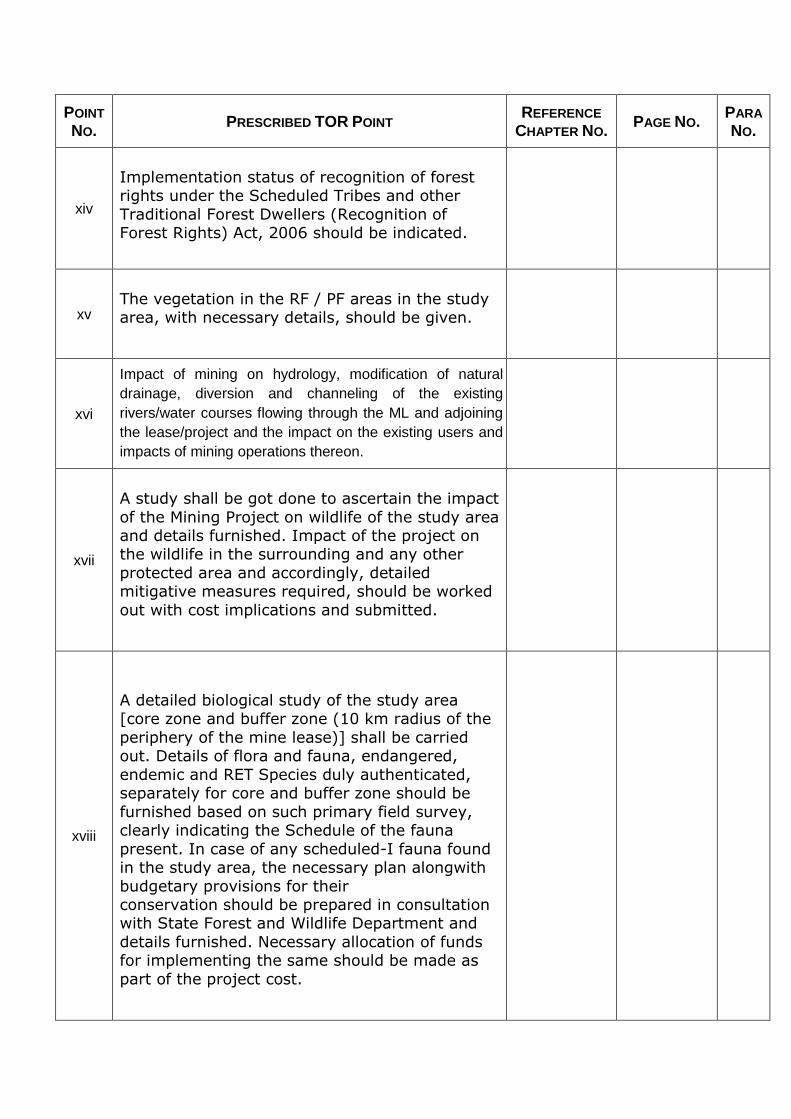
14) Implementation status of recognition of forest rights under the Scheduled Tribes and other Traditional Forest Dwellers (Recognition of Forest Rights) Act, 2006 should be indicated.
15) The vegetation in the RF / PF areas in the study area, with necessary details, should be given.
16) A study shall be got done to ascertain the impact of the Mining Project on wildlife of the study area and details furnished. Impact of the project on the wildlife in the surrounding and any other protected area and accordingly, detailed mitigative measures required, should be worked out with cost implications and submitted.
17) Location of National Parks, Sanctuaries, Biosphere Reserves, Wildlife Corridors, Ramsar site Tiger/Elephant Reserves/(existing as well as proposed), if any, within 10 km of the mine lease should be clearly indicated, supported by a location map duly authenticated by Chief Wildlife Warden. Necessary clearance, as may be applicable to such projects due to proximity of the ecologically sensitive areas as mentioned above, should be obtained from the Standing Committee of National Board of Wildlife and copy furnished.
18) A detailed biological study of the study area [core zone and buffer zone (10 km radius of the periphery of the mine lease)] shall be carried out. Details of flora and fauna, endangered, endemic and RET Species duly authenticated, separately for core and buffer zone should be furnished based on such primary field survey, clearly indicating the Schedule of the fauna present. In case of any scheduled-I fauna found in the study area, the necessary plan along with budgetary provisions for their conservation should be prepared in consultation with State Forest and Wildlife Department and details furnished. Necessary allocation of funds for implementing the same should be made as part of the project cost. 19) Proximity to Areas declared as ‘Critically Polluted’ or the Project areas likely to come under the ‘Aravali Range’, (attracting court restrictions for mining operations), should also be indicated and where so required, clearance certifications from the prescribed Authorities, such as the SPCB or State Mining Dept. Should be secured and furnished to the effect that the proposed mining activities could be considered.
20) Similarly, for coastal Projects, A CRZ map duly authenticated by one of the authorized agencies demarcating LTL. HTL, CRZ area, location of the mine lease w.r.t CRZ, coastal feature such as mangroves, if any, should be furnished 21) R&R Plan/compensation details for the Project Affected People (PAP) should be furnished. While preparing the R&R Plan, the relevant State/National Rehabilitation & Resettlement Policy should be kept in view. In respect of SCs /STs and other weaker sections of the society in the study area, a need based sample survey, family-wise, should be undertaken to assess their requirements, and action programmes prepared and submitted accordingly, integrating the sectoral programmes of line departments of the State Government. It may be clearly brought out whether the village(s) located in the mine lease area will be shifted or not. The issues relating to shifting of village(s) including their R&R and socio-economic aspects should be discussed in the Report.

22) One season (non-monsoon) [i.e. March - May (Summer Season); October - December (post monsoon season) ; December - February (winter season)] primary baseline data on ambient air quality as per CPCB Notification of 2009, water quality, noise level, soil and flora and fauna shall be collected and the AAQ and other data so compiled presented date-wise in the EIA and EMP Report. Site-specific meteorological data should also be collected. The location of the monitoring stations should be such as to represent whole of the study area and justified keeping in view the pre-dominant downwind direction and location of sensitive receptors. There should be at least one monitoring station within 500 m of the mine lease in the pre-dominant downwind direction. The mineralogical composition of PM10, particularly for free silica, should be given.
23) Airqualitymodelingshouldbecarriedoutforpredictionofimpactoftheprojectonthe air quality of the area. It should also take into account the impact of movement of vehicles for transportation of mineral. The details of the model used and input parameters used for modeling should be provided. The air quality contours may be shown on a location map clearly indicating the location of the site, location of sensitive receptors, if any, and the habitation. The wind roses showing pre-dominant wind direction may also be indicated on the map. 24) The water requirement for the Project, its availability and source should be furnished. A detailed water balance should also be provided. Fresh water requirement for the Project should be indicated.
25) Necessary clearance from the Competent Authority for drawl of requisite quantity of water for the Project should be provided.
26) Description of water conservation measures proposed to be adopted in the Project should be given. Details of rainwater harvesting proposed in the Project, if any, should be provided.
27) Impact of the Project on the water quality, both surface and groundwater, should be assessed and necessary safeguard measures, if any required, should be provided.
28) Based on actual monitored data, it may clearly be shown whether working will intersect groundwater. Necessary data and documentation in this regard may be provided. In case the working will intersect groundwater table, a detailed Hydro Geological Study should be undertaken and Report furnished. The Report inter-alia, shall include details of the aquifers present and impact of mining activities on these aquifers. Necessary permission from Central Ground Water Authority for working below ground water and for pumping of ground water should also be obtained and copy furnished.
29) Details of any stream, seasonal or otherwise, passing through the lease area and modification / diversion proposed, if any, and the impact of the same on the hydrology should be brought out.
30) Information on site elevation, working depth, groundwater table etc. Should be provided both in AMSL and BGL. A schematic diagram may also be provided for the same.
31) A time bound Progressive Greenbelt Development Plan shall be prepared in a tabular form (indicating the linear and quantitative coverage, plant species

and time frame) and submitted, keeping in mind, the same will have to be executed up front on commencement of the Project. Phase-wise plan of plantation and compensatory afforestation should be charted clearly indicating the area to be covered under plantation and the species to be planted. The details of plantation already done should be given. The plant species selected for green belt should have greater ecological value and should be of good utility value to the local population with emphasis on local and native species and the species which are tolerant to pollution.
32) Impact on local transport infrastructure due to the Project should be indicated. Projected increase in truck traffic as a result of the Project in the present road network (including those outside the Project area) should be worked out, indicating whether it is capable of handling the incremental load. Arrangement for improving the infrastructure, if contemplated (including action to be taken by other agencies such as State Government) should be covered. Project Proponent shall conduct Impact of Transportation study as per Indian Road Congress Guidelines.
33) Details of the onsite shelter and facilities to be provided to the mine workers should be included in the EIA Report.
34) Conceptual post mining land use and Reclamation and Restoration of mined out areas (with plans and with adequate number of sections) should be given in the EIA report.
35) Occupational Health impacts of the Project should be anticipated and the proposed preventive measures spelt out in detail. Details of pre-placement medical examination and periodical medical examination schedules should be incorporated in the EMP. The project specific occupational health mitigation measures with required facilities proposed in the mining area may be detailed.
36) Public health implications of the Project and related activities for the population in the impact zone should be systematically evaluated and the proposed remedial measures should be detailed along with budgetary allocations.
37) Measures of socio economic significance and influence to the local
community proposed to be provided by the Project Proponent should be indicated. As far as possible, quantitative dimensions may be given with time frames for implementation.
38) Detailed environmental management plan (EMP) to mitigate the environmental impacts which, should inter-alia include the impacts of change of land use, loss of agricultural and grazing land, if any, occupational health impacts besides other impacts specific to the proposed Project.
39) Public Hearing points raised and commitment of the Project Proponent on the same along with time bound Action Plan with budgetary provisions to implement the same should be provided and also incorporated in the final EIA/EMP Report of the Project.
40) Details of litigation pending against the project, if any, with direction /order passed by any Court of Law against the Project should be given 41) The cost of the Project (capital cost and recurring cost) as well as the cost towards implementation of EMP should be clearly spelt out.

42) A Disaster management Plan shall be prepared and included in the EIA/EMP Report.
43) Benefits of the Project if the Project is implemented should be spelt out. The benefits of the Project shall clearly indicate environmental, social, economic, employment potential, etc.
44) Besides the above, the below mentioned general points are also to be followed:-
a) All documents to be properly referenced with index and continuous page numbering.
b) Where data are presented in the Report especially in Tables, the period in which the data were collected and the sources should be indicated.
c) Project Proponent shall enclose all the analysis/testing reports of water, air, soil, noise etc. using the MoEF&CC/NABL accredited laboratories. All the original analysis/testing reports should be available during appraisal of the Project.
d) Where the documents provided are in a language other than English, an English translation should be provided.
e) The Questionnaire for environmental appraisal of mining projects as devised earlier by the Ministry shall also be filled and submitted.
f) While preparing the EIA report, the instructions for the Proponents and instructions for the Consultants issued by MoEF vide O.M. No. J-11013/41/2006-IA.II(I) dated 4thAugust, 2009, which are available on the website of this Ministry, should be followed.
g) Changes, if any made in the basic scope and project parameters (as submitted in Form-I and the PFR for securing the TOR) should be brought to the attention of MoEF&CC with reasons for such changes and permission should be sought, as the TOR may also have to be altered. Post Public Hearing changes in structure and content of the draft EIA/EMP (other than modifications arising out of the P.H. process) will entail conducting the PH again with the revised documentation.
h) As per the circular no. J-11011/618/2010-IA.II(I) dated 30.5.2012, certified report of the status of compliance of the conditions stipulated in the environment clearance for the existing operations of the project, should be obtained from the Regional Office of Ministry of Environment, Forest and Climate Change, as may be applicable. (iii) sections of the mine pit and external dumps, if any, clearly showing the land features of the adjoining area.
CHAPTER 2
PROJECT DESCRIPTION
2.1 Type of Project
(i) Brief Description of nature of project:
This is a Mining Lease of mineral Limestone , Clay and Bauxite, near village-
Kubri , Tahesail-Maihar, District- Satna, Madhya Pradesh over an area of
69.301 hectare. GO has been issued in favour of Shri Sukhdeo Prasd
goaynka, Station Road Katni vide deed no 451108 made on 19 /08/2014. The
Mining will be done in this proposed lease by semi-mechanized open cast
method. Proposed workings will be systematic by forming proper benches.
The lease area comprise of about 69.301 hect., is mostly of agricultural lands.
The other units present within the lease are village roads and high tension
electricity line passing through the lease area in the central part. Beyond
lease area, there are few working pits and abandoned pits, abandoned pits
are mostly water filled.
2.2 Need for the Project
Due to the globalization and new ventures and faster development of
infrastructure project, the requirement for raw material like limeston has been
on the rise over the last few years. The excavated mineral will be
dispatched to the industries located in the state and different parts in
the country. Its strength and quality makes it suitable for a number of
purposes. Mining industry play an important role in economic sector in India.
The state is endowed with major and minor mineral resources. The project
is situated in the Satna district, where number of cement plant and other
industries are located. Thus there is no problem of mineral consumption.
The economy of the District mostly dependant on agriculture and small
industries like cement plant, lime cline . The important benefits accruing from
the project to the state in the form of royalty can thus be stated as-boost to
local and regional economy. The development of mining in the area
provides direct and indirect employment opportunities better infrastructural
facilities, communication and socio-economic infrastructure.
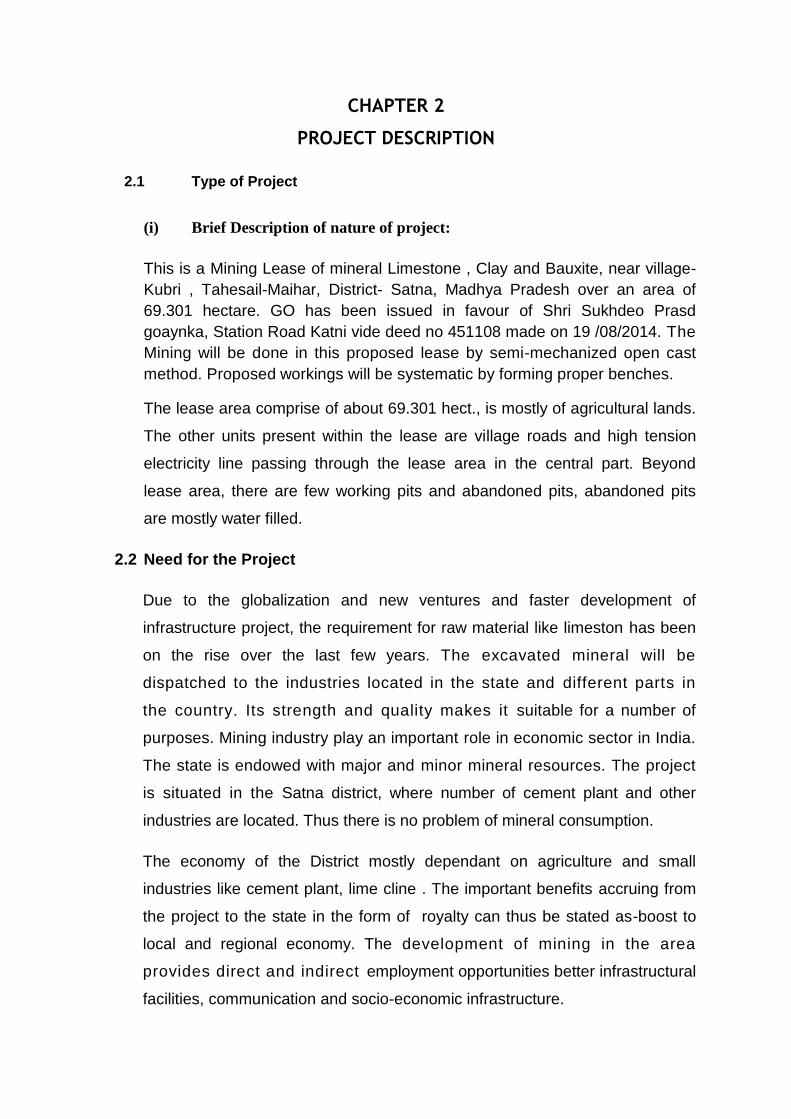
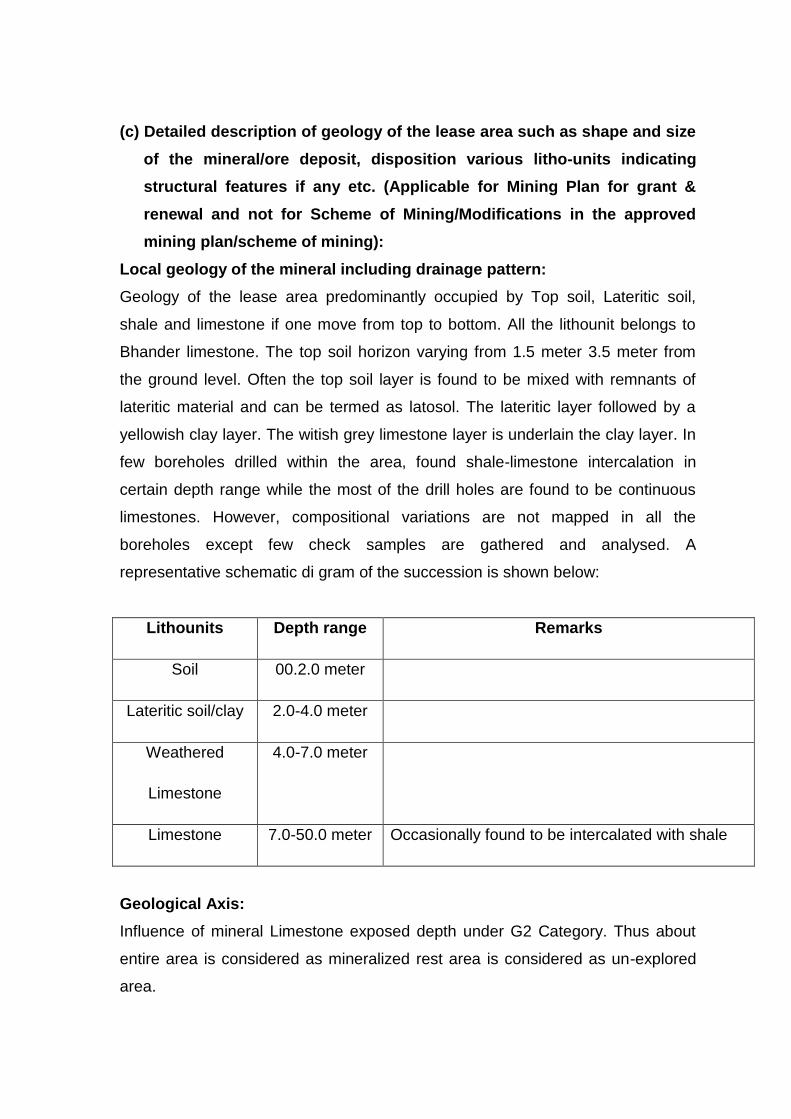
Location
The project / mine lease located on plot nos – Annexure-I, near village- Kubri , Tahsil
– Mahiar, District- Satna, Madhya Pradesh over an area of 69.301 hectare. Total
land of mining lease comes under (39.301 waste land and 30.00 Ha Agriculture
land). No forest land is involved in this area. Topographically the area is barren
rocky land. The area lies between Longitude 80°47’32” and Latitude 24°07’14” and
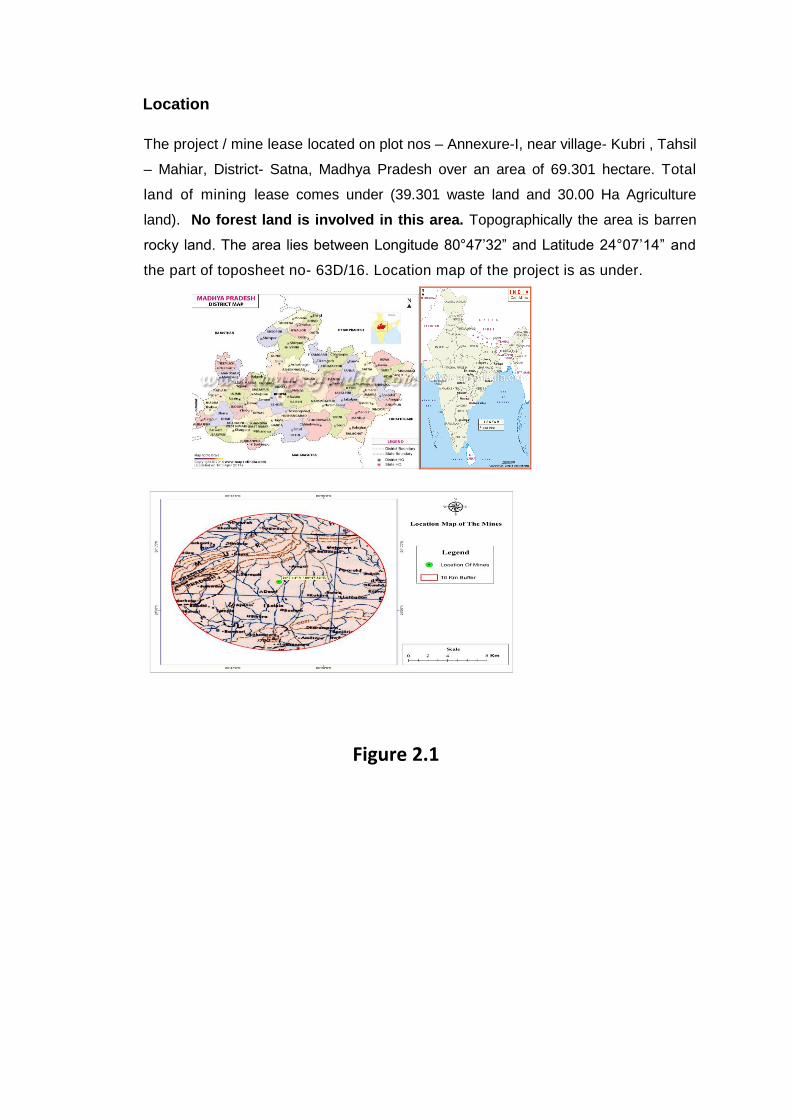
the part of toposheet no- 63D/16. Location map of the project is as under.
Figure 2.1
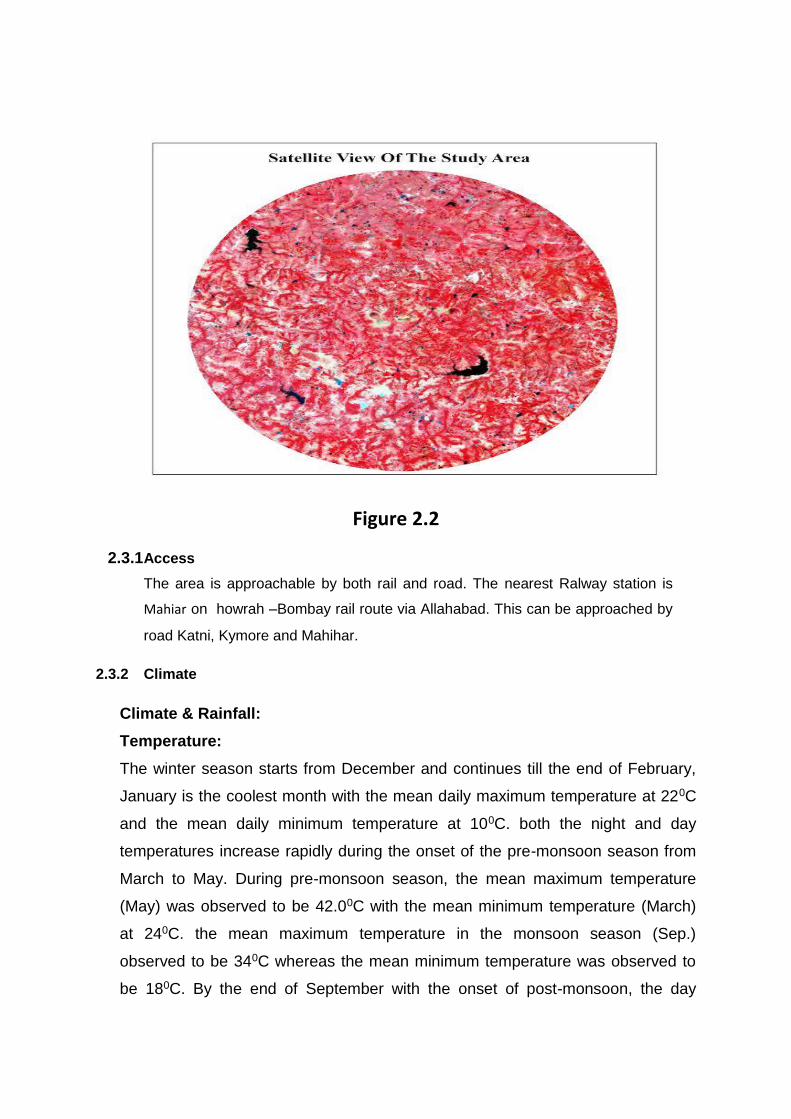
Figure 2.2
2.3.1 Access
The area is approachable by both rail and road. The nearest Ralway station is
Mahiar on howrah –Bombay rail route via Allahabad. This can be approached by
road Katni, Kymore and Mahihar.
2.3.2 Climate
Climate & Rainfall:
Temperature:
The winter season starts from December and continues till the end of February,
January is the coolest month with the mean daily maximum temperature at 220C
and the mean daily minimum temperature at 100C. both the night and day
temperatures increase rapidly during the onset of the pre-monsoon season from
March to May. During pre-monsoon season, the mean maximum temperature
(May) was observed to be 42.00C with the mean minimum temperature (March)
at 240C. the mean maximum temperature in the monsoon season (Sep.)
observed to be 340C whereas the mean minimum temperature was observed to
be 180C. By the end of September with the onset of post-monsoon, the day

temperatures increase slightly, with the mean maximum temperature at 260C and
the mean minimum temperature at 120C.
Relative Humidity:
The air generally humid in this region during the monsoon when the average
relative humidity at 0830 hr. was observed to be with a maximum of 100% and a
minimum of 52%. Similarly, at 1730 hr., the average value was observed to be
with a maximum of 94% and a minimum of 60%. Generally, the weather during
post-monsoon was observed to be with a maximum of 90% and a minimum of
15%.
Rainfall:
Monsoon in the area comes from southwesterly winds. The rainfall in the area is
very erratic. The average annual rainfall based on the last 10 year IMD data, was
observed to be 1168 mm. The monsoon sets in the month of June and continues
till mid observed in the evening, with clear mornings. During the monsoon
season, both in the mornings and evenings, the skies were found to be clouded.
Cloud:
30 years average data reveal that maximum cloud cover was observed around
7.0 oktas in the month of July, august. Whereas cloud cover was observed
around 2.2 (in oktas) in the month of November, December, January, February
and March.
Wind Pattern:
Generally light to moderate winds prevails throughout the year. Winds were light
and moderate particularly during the morning hours. While during the afternoon
hours the winds were stronger. A review of the wind rose diagram shows that
predominant winds are mostly from S, NW, NNW, SW, NE, N and E directions
followed by NW direction.
2.3.3 Physiography & Drainage
The area exhibits undulating topography towards north with elevation
ranging from 392 m to 380 m above mean sea level. Some small and
large hilly terrain may be observed in the central and eastern parts of the
block.

The lease area is falling in a water divider zone of two seasonal nalas flowing
along the eastern and western boundary of the block to join ultimately to
Mahandi River around 8 km south of the area. Mahandi in turn joins Son River
flowing further east. Son in part of greater Ganga Basin.
(b) Geology of the area:
The area in general falls within proterozoic basin of Vindhyan Super Group.
This basin is the largest exposed Precambrian basin of India comprise of
around 104,000 Sq. KM area. The general Stratigraphic sequence of the area
depicts lower and upper group with distinct unconformity between them. The
generalized Stratigraphic sequence of the region is furnished below:
Group Formation Lithology
Upper
Vindhyan
Bhander Sandstone, Shale & Limestone
Rewa Sandstone & Shale
Kaimur Sandstone & Shale
Unconformity
Lower
Vindhyan
Semri
Group
Rohtas Bhagwar Shale
Rohtas Limestone
Kheinjua Rampur Shale
Chorhat Sandstone
Koldaha Shale
Mirzapur Dconar Porcellanite
Kajrahat Limestone
Basal Shale
Deoland Sandstone
The Vindhyan Supergroup, in contrary to the event of tectonics found to be least
deformed, however, a very minor scale syn-sedimentary deformations are
observed by few workers of the area. The geology is also equally important by
discovery of trace fossils and presence of stromatolites (algal colony) in the
Bhander and Semri group of rocks.
(c) Detailed description of geology of the lease area such as shape and size
of the mineral/ore deposit, disposition various litho-units indicating
structural features if any etc. (Applicable for Mining Plan for grant &
renewal and not for Scheme of Mining/Modifications in the approved
mining plan/scheme of mining):
Local geology of the mineral including drainage pattern:
Geology of the lease area predominantly occupied by Top soil, Lateritic soil,
shale and limestone if one move from top to bottom. All the lithounit belongs to
Bhander limestone. The top soil horizon varying from 1.5 meter 3.5 meter from
the ground level. Often the top soil layer is found to be mixed with remnants of
lateritic material and can be termed as latosol. The lateritic layer followed by a
yellowish clay layer. The witish grey limestone layer is underlain the clay layer. In
few boreholes drilled within the area, found shale-limestone intercalation in
certain depth range while the most of the drill holes are found to be continuous
limestones. However, compositional variations are not mapped in all the
boreholes except few check samples are gathered and analysed. A
representative schematic di gram of the succession is shown below:
Lithounits Depth range Remarks
Soil 00.2.0 meter
Lateritic soil/clay 2.0-4.0 meter
Weathered
Limestone
4.0-7.0 meter
Limestone 7.0-50.0 meter Occasionally found to be intercalated with shale
Geological Axis:
Influence of mineral Limestone exposed depth under G2 Category. Thus about
entire area is considered as mineralized rest area is considered as un-explored
area.
The lower limit of estimation is being considered as 50 meter below each
borehole. The whole exercise of resource estimation is being limited to the
northern part of the lease within an area.
Lateral influence of the boreholes has been considered 100m in all direction.
The lease area is geologically probable from surface RL 394 to 344-336 m. Bore
hole as marked on geological plan and sections for this explored depth assigned
G-2 for geological axis of UNFC classification.
On the hasis of existing quarry entire area is considerd for mineralized zone.
Details of minimization are as follows:
Soil Seen in as 1.0 to 4.5m the lease area.
Limestone (95%) Below the Soil up to 50m. i.e. 344-336 mrl
On this basis reserves have been calculated by cross sectional method up to the
depth Mrl 344-336 m in G-2 category.
Pre-Feasibility Axis:
As this is a Mechanized mine “A” Category mine the feasibility study carried out
for this area is considered to be of pre-feasibility status. Hence feasibility axis
under UNFC for the deposit is F-2.
Economic Axis:
On the basis of pre-feasibility study economic viability of the deposit has been
established presently to Borehole G2=50m depth (Up to Mrl 336-344m) thick
mineral over the mineable area of the lease. Hence economic axis under UNFC
for the deposit is E-1,
Note:
332 = 122 probable + 222 PFMR
PFMR are potential resources blocked in 7.5m boundary, in ultimate pit slope,
other block area left as per statute etc.
UNFC CATEGORIZATION OF RESERVES
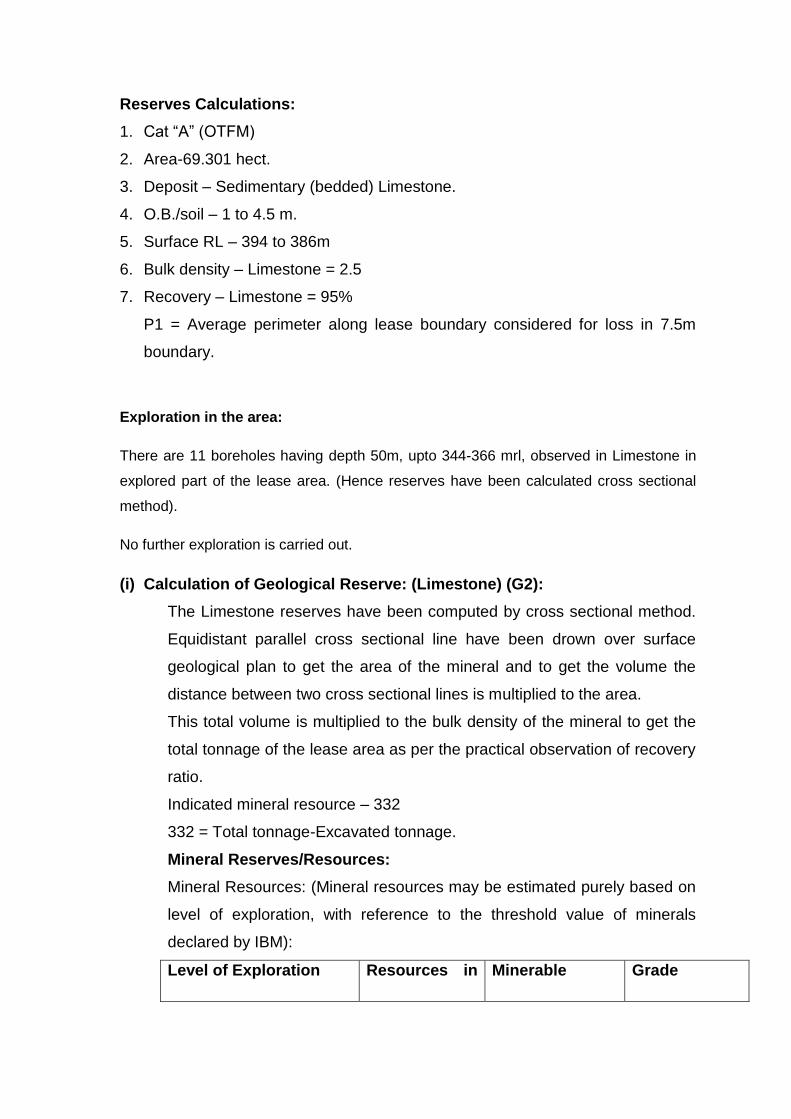
Reserves Calculations:
1. Cat “A” (OTFM)
2. Area-69.301 hect.
3. Deposit – Sedimentary (bedded) Limestone.
4. O.B./soil – 1 to 4.5 m.
5. Surface RL – 394 to 386m
6. Bulk density – Limestone = 2.5
7. Recovery – Limestone = 95%
P1 = Average perimeter along lease boundary considered for loss in 7.5m
boundary.
Exploration in the area:
There are 11 boreholes having depth 50m, upto 344-366 mrl, observed in Limestone in
explored part of the lease area. (Hence reserves have been calculated cross sectional
method).
No further exploration is carried out.
(i) Calculation of Geological Reserve: (Limestone) (G2):
The Limestone reserves have been computed by cross sectional method.
Equidistant parallel cross sectional line have been drown over surface
geological plan to get the area of the mineral and to get the volume the
distance between two cross sectional lines is multiplied to the area.
This total volume is multiplied to the bulk density of the mineral to get the
total tonnage of the lease area as per the practical observation of recovery
ratio.
Indicated mineral resource – 332
332 = Total tonnage-Excavated tonnage.
Mineral Reserves/Resources:
Mineral Resources: (Mineral resources may be estimated purely based on
level of exploration, with reference to the threshold value of minerals
declared by IBM):
Level of Exploration Resources in Minerable Grade
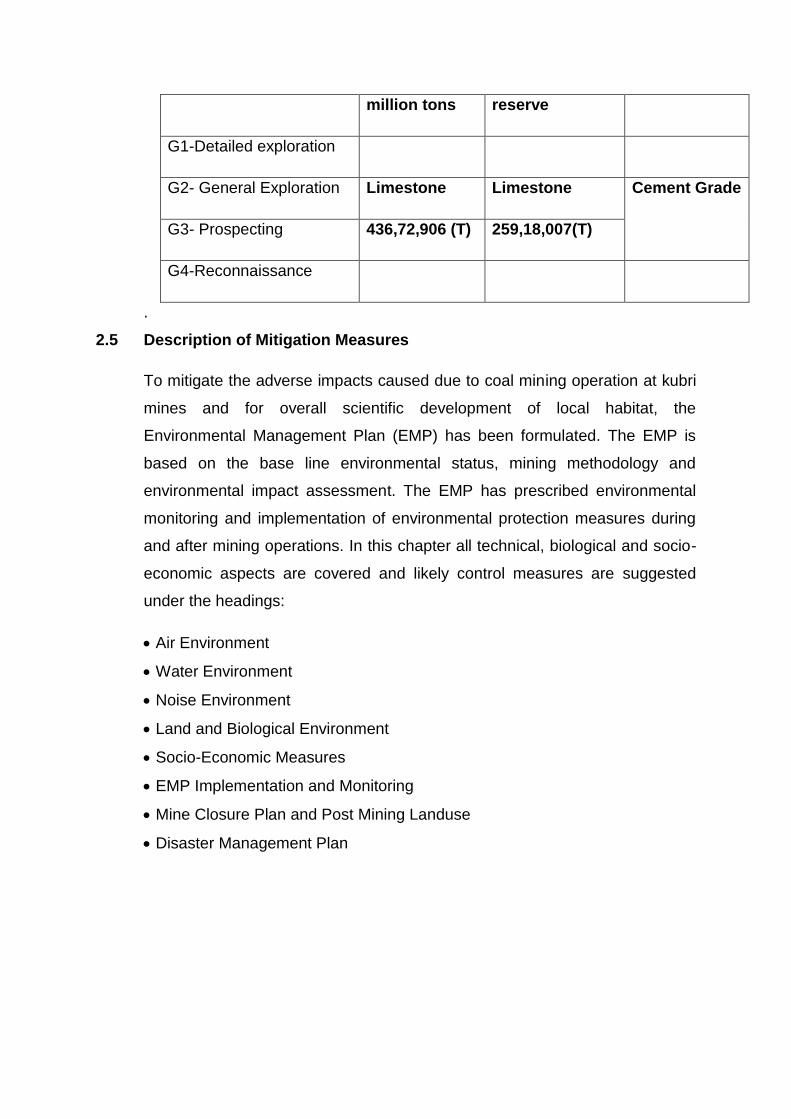
million tons reserve
G1-Detailed exploration
G2- General Exploration Limestone Limestone Cement Grade
G3- Prospecting 436,72,906 (T) 259,18,007(T)
G4-Reconnaissance
.
2.5 Description of Mitigation Measures
To mitigate the adverse impacts caused due to coal mining operation at kubri
mines and for overall scientific development of local habitat, the
Environmental Management Plan (EMP) has been formulated. The EMP is
based on the base line environmental status, mining methodology and
environmental impact assessment. The EMP has prescribed environmental
monitoring and implementation of environmental protection measures during
and after mining operations. In this chapter all technical, biological and socio-
economic aspects are covered and likely control measures are suggested
under the headings:
• Air Environment
• Water Environment
• Noise Environment
• Land and Biological Environment
• Socio-Economic Measures
• EMP Implementation and Monitoring
• Mine Closure Plan and Post Mining Landuse
• Disaster Management Plan
CHAPTER 3
DESCRIPTION OF THE ENVIRONMENT
3.1 Study area
The study area covered Kubri block and area of 10 km radius around the block.
Period
The study was conducted during the summer i.e. March, April 2017 and May 2017.
Methodology for EIA Study
Baseline data have been generated for different components of environment.
Various secondary data have been collected from different government
offices. On the basis of collected data and information, Environmental Impact
Assessment has been evaluated through computer simulation and modeling
of different environmental parameters. From the EIA result Environmental
Management Plan has been prepared for implementation.
Components
Air Environment
The Reconnaissance survey was undertaken to collect topographical
information of the study area. Different air pollutants, namely RPM, SPM, SO2,
NOx, Pb and CO have been identified as related to the project activities for
representing baseline status of ambient air quality within the study area.
Hourly micro-meteorological parameters, viz. wind speed, wind direction,
temperature, rainfall, barometric pressure, relative humidity and solar
radiation have also been measured.
Water Environment
Information as well as samples of water resources in the study area have
been collected. The collected water samples has been analysed for different
physico-chemical parameters to assess the quality of the water. Surface and
subsurface samples have been collected at different locations for the physico-
chemical analysis.
Noise Environment
Noise survey has been carried out in the study area. Noise levels were
measured at several locations in human settlements around proposed mining
area during the day and night time.
Land Environment
Soil samples have been collected randomly from the study area to represent
different categories of soil. Physico-chemical properties of the soil have been
determined. Information on land use pattern in the study area has also been
collected.
Biological Environment
Data have been collected from various Government Departments. The
parameters of prime importance to both biotic and abiotic factors have been
selected to estimate the structural and functional changes in the eco-system.
Detailed survey has been carried out during the field visits.
Socio-economic Environment
Secondary data have been collected from Census Report. A field survey has
been conducted within the study area. The parameters selected under socio-
economic component were, demographic structure of the study area,
availability of basic amenities, welfare facilities, health status and quality of
life. Relevant information collected from selected villages has been critically
analysed.
3.2 Base line environmental scenario
3.2.0 Air Environment
Air pollution includes one or more contaminants (pollutants), in the outdoor
atmosphere in such quantities and of such duration that may be injurious to
human, plant or animal life. Once these contaminants enter in the
atmosphere, either in gaseous form or as particulate matter, these cannot
escape and keep circulating and deteriorating the air quality. Air pollution
effects encompass those that are health related as well as those associated
with damage to property or which cause decreases in atmospheric aesthetic
feature.
Different air pollution parameters like SPM, RPM, SO2 NOX and Pb, CO, Co,
Ozone, NH3, C6 H6, Benzopyrene, As, Ni and Pb were identified as related to
the project activity for representing baseline status of ambient air quality within
the study area. In addition fugitive emission survey was also carried out in
nearby mine with special reference to mining operation.
Micro-meteorological parameters viz. wind speed, wind direction and ambient
temperature were collected from the nearest meteorological studies form
Indian Meteorological Department (IMD), Katni. A fugitive dust model based
on steady state Gaussian Dispersion Model for multiple areas and line source
was used for prediction of impact an air environment.
3.2.1 Micro-meteorology
Micro-meteorological properties of the atmosphere govern the concentration
of pollutant and variation with time and location, with respect to the emission
source. The severity of the pollutant depends on the various meteorological
variables. This includes wind speed and wind direction, temperature and
relative humidity (RH). Meteorological data for the study site has been
generated by using digital weather instrument. The results are presented in
Table 3.1, 3.2 and 3.3 respectively for the summer, monsoon and winter
seasons.
Typical tropical climate with hot summer prevails over the area with summer
lasting from the months of March to June and winter from the months of
November to February. During summer, the temperature generally varies
from 30° C to 42° C while in the winter it drops down to about 4° C to 5° C.
The wind speed is found relatively high in summer and winter seasons (1.5 -
5.1 ms-1, 1.2-6.5 ms-1). The relative humidity varies from 45% to 98%, The
average annual rainfall is about 1200 mm, the major part of which precipitates
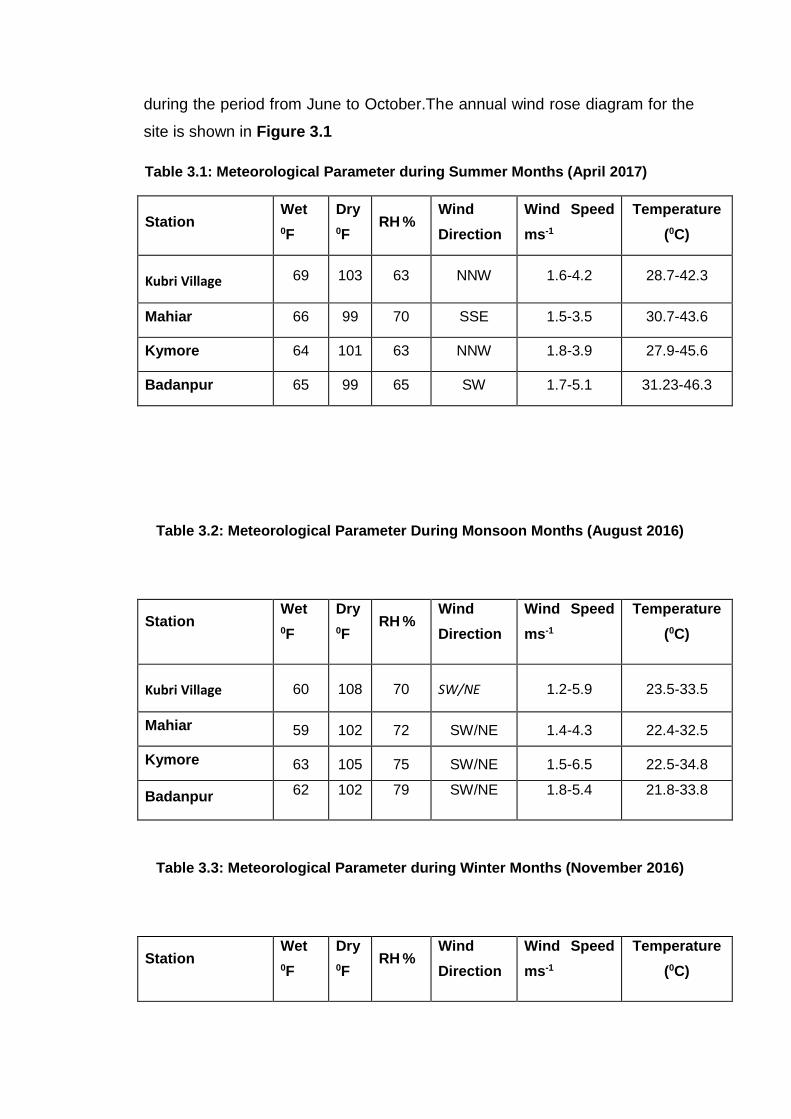
during the period from June to October.The annual wind rose diagram for the
site is shown in Figure 3.1
Table 3.1: Meteorological Parameter during Summer Months (April 2017)
Station Wet
0F
Dry
0F RH %
Wind
Direction
Wind Speed
ms-1
Temperature
(0C)
Kubri Village 69 103 63 NNW 1.6-4.2 28.7-42.3
Mahiar 66 99 70 SSE 1.5-3.5 30.7-43.6
Kymore 64 101 63 NNW 1.8-3.9 27.9-45.6
Badanpur 65 99 65 SW 1.7-5.1 31.23-46.3
Table 3.2: Meteorological Parameter During Monsoon Months (August 2016)
Station Wet
0F
Dry
0F RH %
Wind
Direction
Wind Speed
ms-1
Temperature
(0C)
Kubri Village 60 108 70 SW/NE 1.2-5.9 23.5-33.5
Mahiar 59 102 72 SW/NE 1.4-4.3 22.4-32.5
Kymore 63 105 75 SW/NE 1.5-6.5 22.5-34.8
Badanpur 62 102 79 SW/NE 1.8-5.4 21.8-33.8
Table 3.3: Meteorological Parameter during Winter Months (November 2016)
Station Wet
0F
Dry
0F RH %
Wind
Direction
Wind Speed
ms-1
Temperature
(0C)

Kubri Village 53 77 60.0 NW/SE 1.1-1.3 10.5-25.5
Mahiar 52 80 62.9 NW/SE 1.2-1.7 9.8-26.2
Kymore 55 82 59.5 NW/SE 1.3-1.5 13.5-27.7
Badanpur 60 89 63.5 NW/SE 1.0-1.9 10.5-26.3

Figure 3.2
3.2.2 Air Quality
3.2.2.1 Sampling and Analysis
Seven sampling stations have been selected for air quality monitoring on the basis of
wind direction and other meteorological parameters. Two air sampling locations have
been identified in core zone and five in the buffer zones. Details of sampling stations
along with the source of air pollution are given in Table 3.4. The parameters
monitored are Respirable Particulate Matters (RPM), Suspended Particulate Matters
(SPM), Sulphur Dioxide (SO2), Nitrogen Oxides (NOx), Carbon Monoxide (CO) and
Lead (Pb). The sampling locations of air environment are depicted in Figure 3.2.
Methods and instrument used for air pollutant analysis are given in Table 3.5.
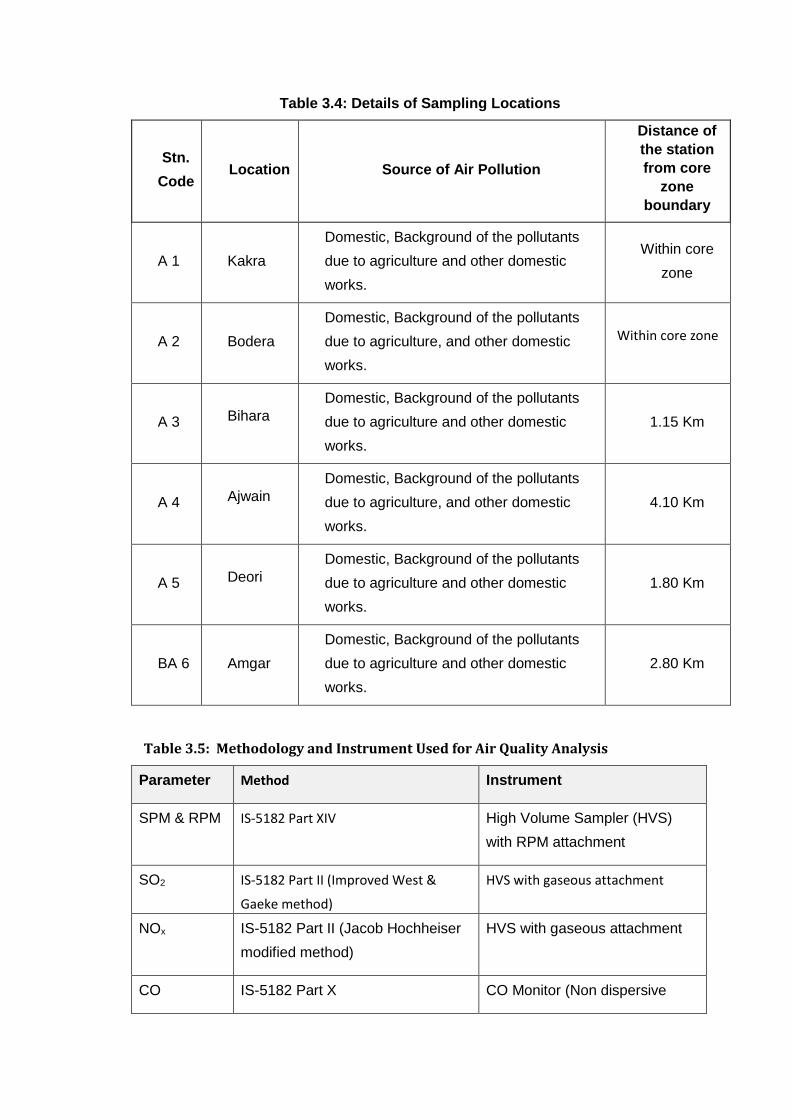
Table 3.4: Details of Sampling Locations
Stn.
Code Location Source of Air Pollution
Distance of
the station
from core
zone
boundary
A 1 Kakra
Domestic, Background of the pollutants
due to agriculture and other domestic
works.
Within core
zone
A 2 Bodera
Domestic, Background of the pollutants
due to agriculture, and other domestic
works.
Within core zone
A 3 Bihara
Domestic, Background of the pollutants
due to agriculture and other domestic
works.
1.15 Km
A 4 Ajwain
Domestic, Background of the pollutants
due to agriculture, and other domestic
works.
4.10 Km
A 5 Deori
Domestic, Background of the pollutants
due to agriculture and other domestic
works.
1.80 Km
BA 6 Amgar
Domestic, Background of the pollutants
due to agriculture and other domestic
works.
2.80 Km
Table 3.5: Methodology and Instrument Used for Air Quality Analysis
Parameter Method Instrument
SPM & RPM IS-5182 Part XIV High Volume Sampler (HVS)
with RPM attachment
SO2 IS-5182 Part II (Improved West &
Gaeke method)
HVS with gaseous attachment
NOx IS-5182 Part II (Jacob Hochheiser
modified method)
HVS with gaseous attachment
CO IS-5182 Part X CO Monitor (Non dispersive
infrared)
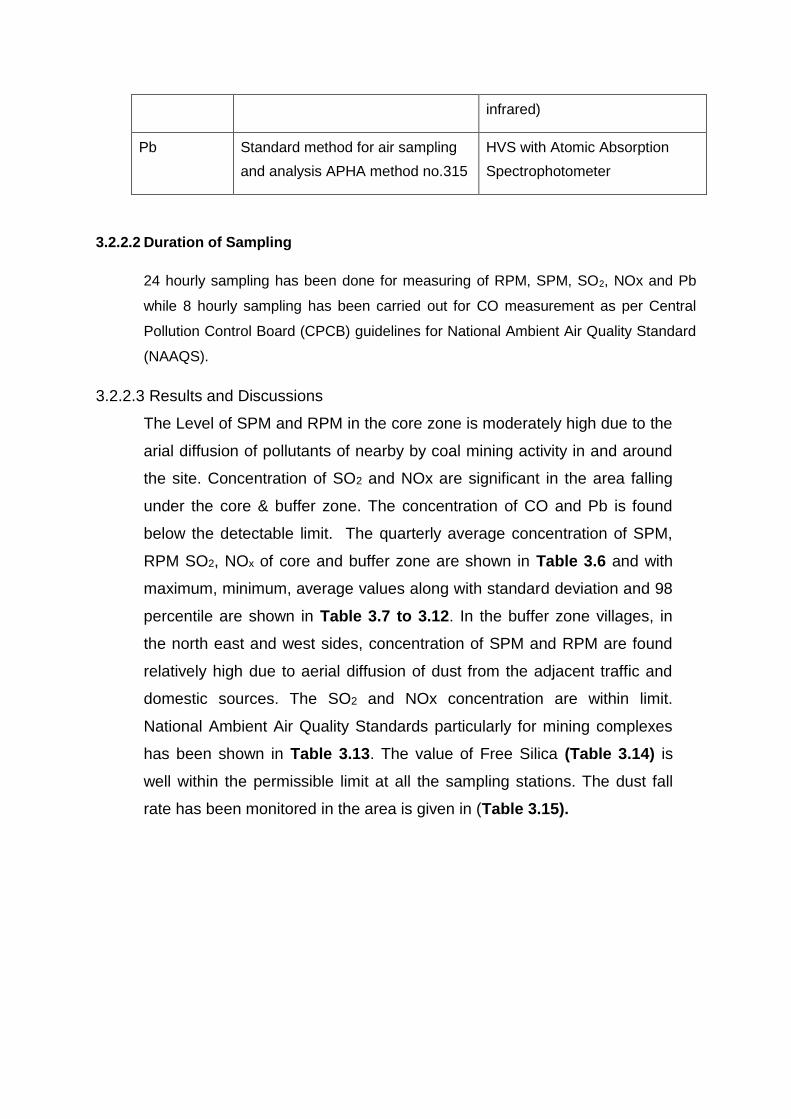
Pb Standard method for air sampling
and analysis APHA method no.315
HVS with Atomic Absorption
Spectrophotometer
3.2.2.2 Duration of Sampling
24 hourly sampling has been done for measuring of RPM, SPM, SO2, NOx and Pb
while 8 hourly sampling has been carried out for CO measurement as per Central
Pollution Control Board (CPCB) guidelines for National Ambient Air Quality Standard
(NAAQS).
3.2.2.3 Results and Discussions
The Level of SPM and RPM in the core zone is moderately high due to the
arial diffusion of pollutants of nearby by coal mining activity in and around
the site. Concentration of SO2 and NOx are significant in the area falling
under the core & buffer zone. The concentration of CO and Pb is found
below the detectable limit. The quarterly average concentration of SPM,
RPM SO2, NOx of core and buffer zone are shown in Table 3.6 and with
maximum, minimum, average values along with standard deviation and 98
percentile are shown in Table 3.7 to 3.12. In the buffer zone villages, in
the north east and west sides, concentration of SPM and RPM are found
relatively high due to aerial diffusion of dust from the adjacent traffic and
domestic sources. The SO2 and NOx concentration are within limit.
National Ambient Air Quality Standards particularly for mining complexes
has been shown in Table 3.13. The value of Free Silica (Table 3.14) is
well within the permissible limit at all the sampling stations. The dust fall
rate has been monitored in the area is given in (Table 3.15).
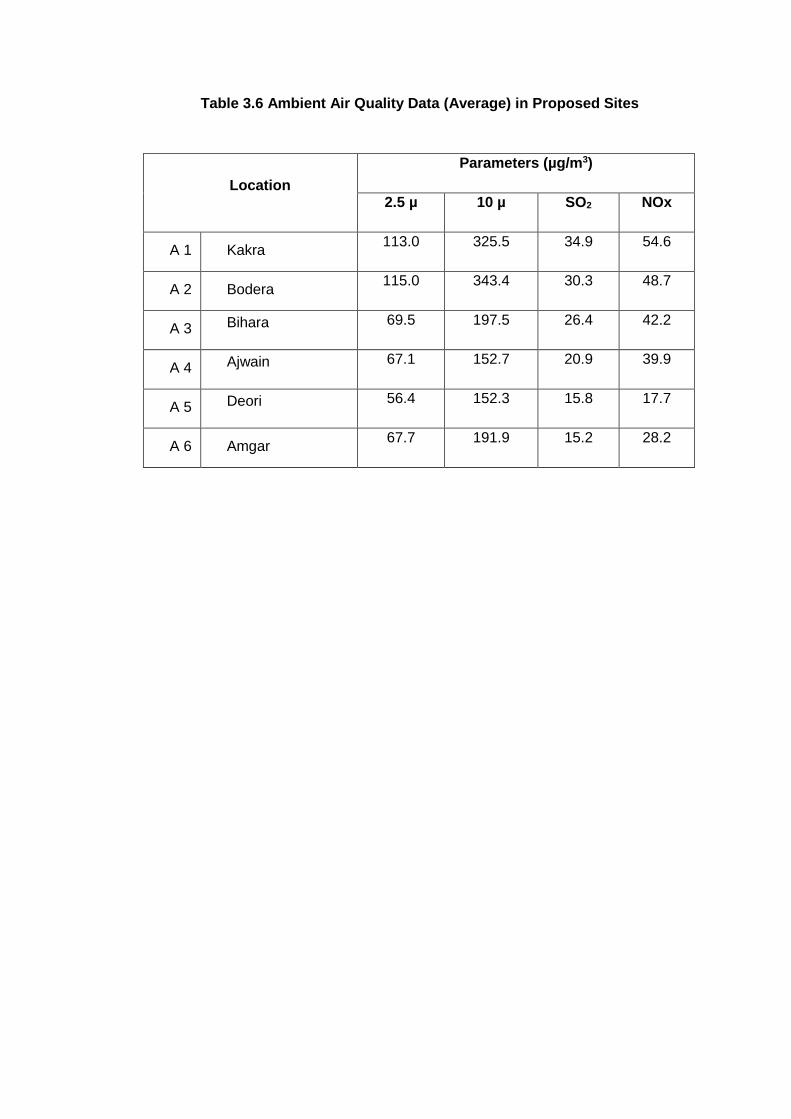
Table 3.6 Ambient Air Quality Data (Average) in Proposed Sites
Location
Parameters (µg/m3)
2.5 µ 10 µ SO2 NOx
A 1 Kakra 113.0 325.5 34.9 54.6
A 2 Bodera 115.0 343.4 30.3 48.7
A 3 Bihara 69.5 197.5 26.4 42.2
A 4 Ajwain 67.1 152.7 20.9 39.9
A 5 Deori 56.4 152.3 15.8 17.7
A 6 Amgar 67.7 191.9 15.2 28.2
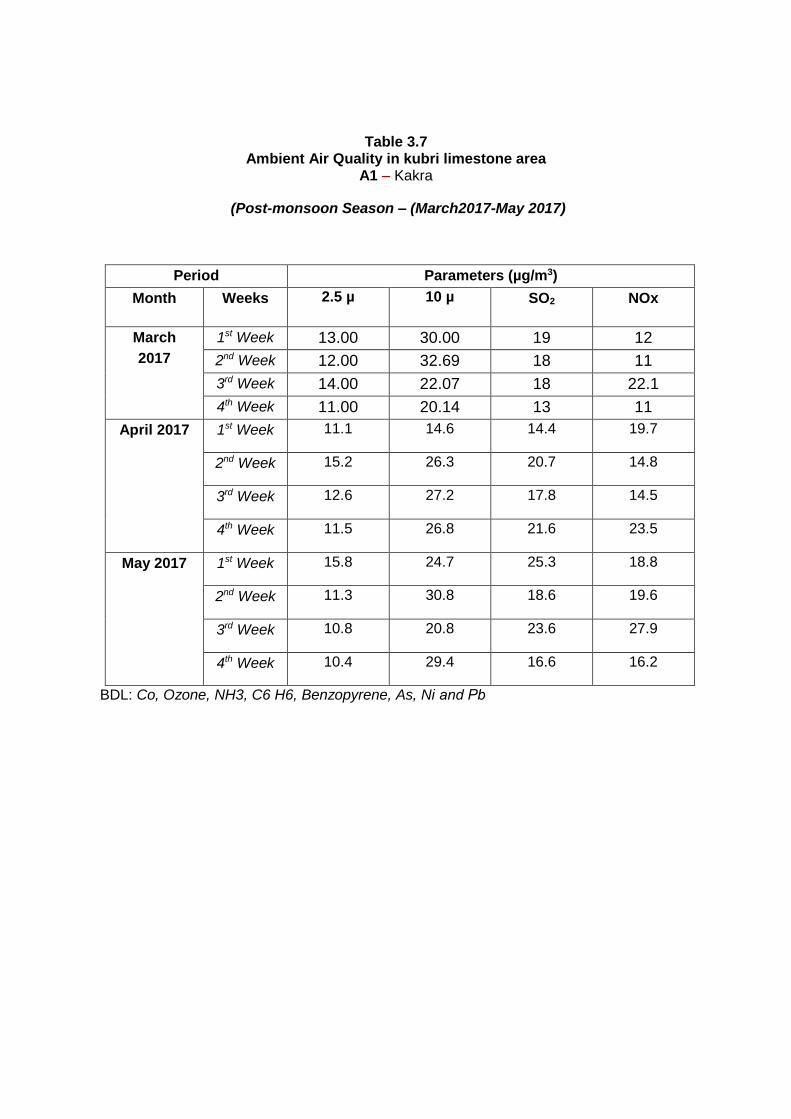
Table 3.7 Ambient Air Quality in kubri limestone area
A1 – Kakra
(Post-monsoon Season – (March2017-May 2017)
Period Parameters (µg/m3)
Month Weeks 2.5 µ 10 µ SO2 NOx
March
2017
1st Week 13.00 30.00 19 12
2nd Week 12.00 32.69 18 11
3rd Week 14.00 22.07 18 22.1
4th Week 11.00 20.14 13 11
April 2017 1st Week 11.1 14.6 14.4 19.7
2nd Week 15.2 26.3 20.7 14.8
3rd Week 12.6 27.2 17.8 14.5
4th Week 11.5 26.8 21.6 23.5
May 2017 1st Week 15.8 24.7 25.3 18.8
2nd Week 11.3 30.8 18.6 19.6
3rd Week 10.8 20.8 23.6 27.9
4th Week 10.4 29.4 16.6 16.2
BDL: Co, Ozone, NH3, C6 H6, Benzopyrene, As, Ni and Pb
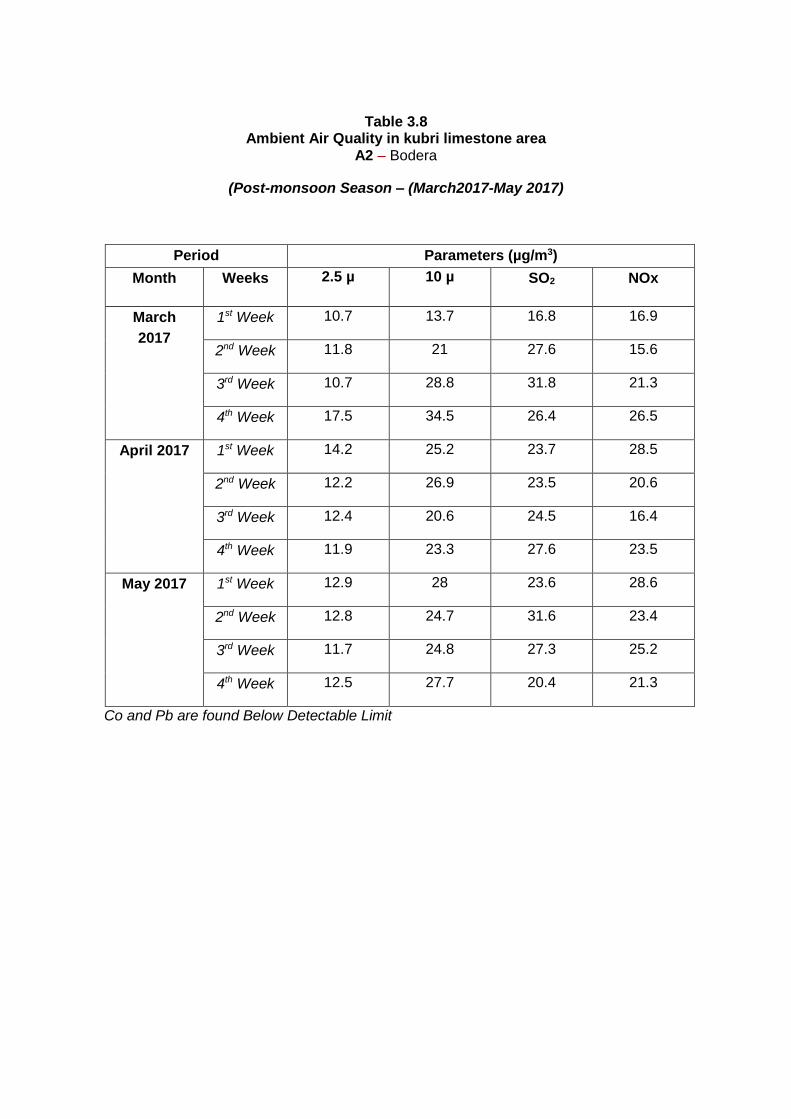
Table 3.8
Ambient Air Quality in kubri limestone area A2 – Bodera
(Post-monsoon Season – (March2017-May 2017)
Period Parameters (µg/m3)
Month Weeks 2.5 µ 10 µ SO2 NOx
March
2017
1st Week 10.7 13.7 16.8 16.9
2nd Week 11.8 21 27.6 15.6
3rd Week 10.7 28.8 31.8 21.3
4th Week 17.5 34.5 26.4 26.5
April 2017 1st Week 14.2 25.2 23.7 28.5
2nd Week 12.2 26.9 23.5 20.6
3rd Week 12.4 20.6 24.5 16.4
4th Week 11.9 23.3 27.6 23.5
May 2017 1st Week 12.9 28 23.6 28.6
2nd Week 12.8 24.7 31.6 23.4
3rd Week 11.7 24.8 27.3 25.2
4th Week 12.5 27.7 20.4 21.3
Co and Pb are found Below Detectable Limit

Table 3.9 Ambient Air Quality in kubri limestone area
A 3 Bihara
(Post-monsoon Season – (March2017-May 2017)
Period Parameters (µg/m3)
Month Weeks 2.5 µ 10 µ SO2 NOx
March
2017
1st Week 18.9 19.2 22.3 14.6
2nd Week 18.6 22.3 24.8 17.5
3rd Week 13 18 19.5 20.2
4th Week 13.9 20.4 20.4 22.6
April 2017 1st Week 6.6 18.4 24.6 16.3
2nd Week 18.8 22.6 24.6 17.4
3rd Week 15 18.4 21.8 14.7
4th Week 13.6 20.8 30.8 17.3
May 2017 1st Week 12.5 17.2 21.9 19.5
2nd Week 12 22.9 28.4 16.5
3rd Week 13.7 27.9 20.2 24.6
4th Week 11.2 16.2 23.8 22.6
Co and Pb are found Below Detectable Limit.
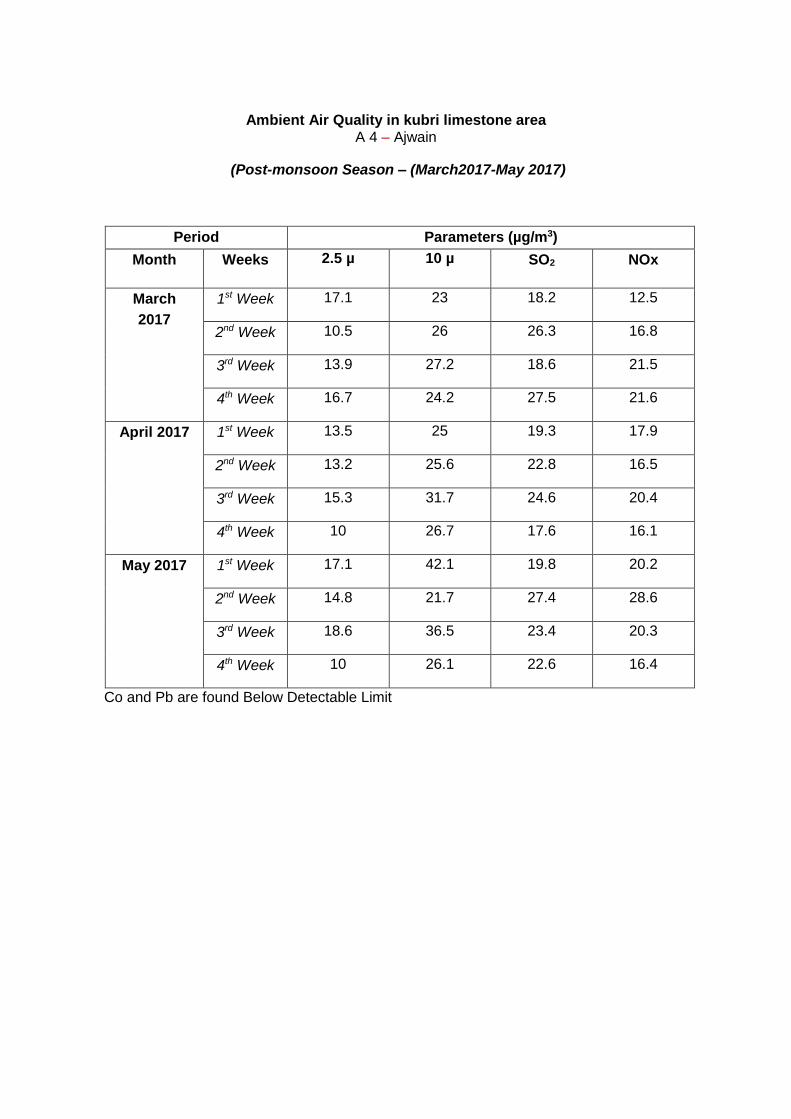
Ambient Air Quality in kubri limestone area
A 4 – Ajwain
(Post-monsoon Season – (March2017-May 2017)
Period Parameters (µg/m3)
Month Weeks 2.5 µ 10 µ SO2 NOx
March
2017
1st Week 17.1 23 18.2 12.5
2nd Week 10.5 26 26.3 16.8
3rd Week 13.9 27.2 18.6 21.5
4th Week 16.7 24.2 27.5 21.6
April 2017 1st Week 13.5 25 19.3 17.9
2nd Week 13.2 25.6 22.8 16.5
3rd Week 15.3 31.7 24.6 20.4
4th Week 10 26.7 17.6 16.1
May 2017 1st Week 17.1 42.1 19.8 20.2
2nd Week 14.8 21.7 27.4 28.6
3rd Week 18.6 36.5 23.4 20.3
4th Week 10 26.1 22.6 16.4
Co and Pb are found Below Detectable Limit
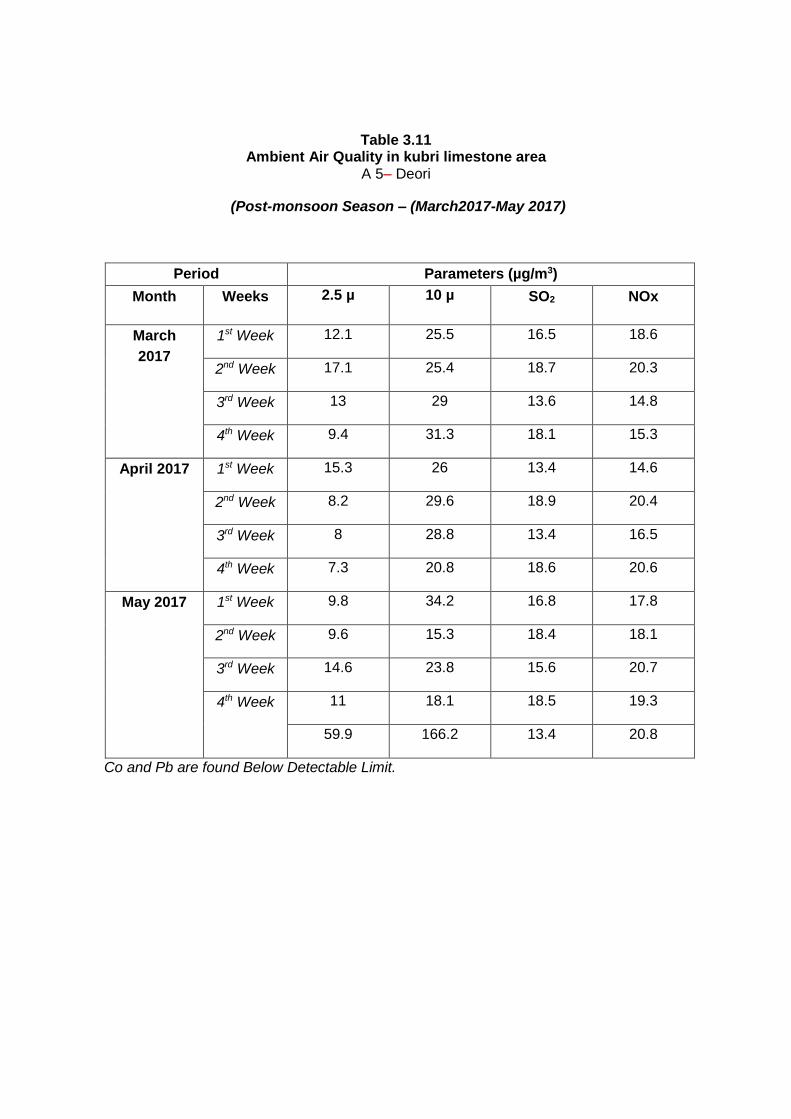
Table 3.11 Ambient Air Quality in kubri limestone area
A 5– Deori
(Post-monsoon Season – (March2017-May 2017)
Period Parameters (µg/m3)
Month Weeks 2.5 µ 10 µ SO2 NOx
March
2017
1st Week 12.1 25.5 16.5 18.6
2nd Week 17.1 25.4 18.7 20.3
3rd Week 13 29 13.6 14.8
4th Week 9.4 31.3 18.1 15.3
April 2017 1st Week 15.3 26 13.4 14.6
2nd Week 8.2 29.6 18.9 20.4
3rd Week 8 28.8 13.4 16.5
4th Week 7.3 20.8 18.6 20.6
May 2017 1st Week 9.8 34.2 16.8 17.8
2nd Week 9.6 15.3 18.4 18.1
3rd Week 14.6 23.8 15.6 20.7
4th Week 11 18.1 18.5 19.3
59.9 166.2 13.4 20.8
Co and Pb are found Below Detectable Limit.

Table 3.12 Ambient Air Quality in kubri limestone area
A 6– Amgar
(Post-monsoon Season – (March2017-May 2017)
Period Parameters (µg/m3)
Month Weeks 2.5 µ 10 µ SO2 NOx
March
2017
1st Week 9.2 21.5 13.4 20.6
2nd Week 8.2 24.9 16.4 20.4
3rd Week 10.2 36.8 12.6 20.8
4th Week 9.4 28.5 14.6 15.3
April 2017 1st Week 14.4 26.5 16.9 15.6
2nd Week 9.5 23.4 18.4 17.9
3rd Week 7.9 23.8 14.1 17.6
4th Week 9.6 23.9 12.6 16.8
May 2017 1st Week 13.7 20.9 15.6 12.2
2nd Week 8.9 22.2 16.7 17.8
3rd Week 6.2 19.1 17.1 18.5
4th Week 9.2 20.7 18.4 18.2
Co and Pb are found Below Detectable Limit.
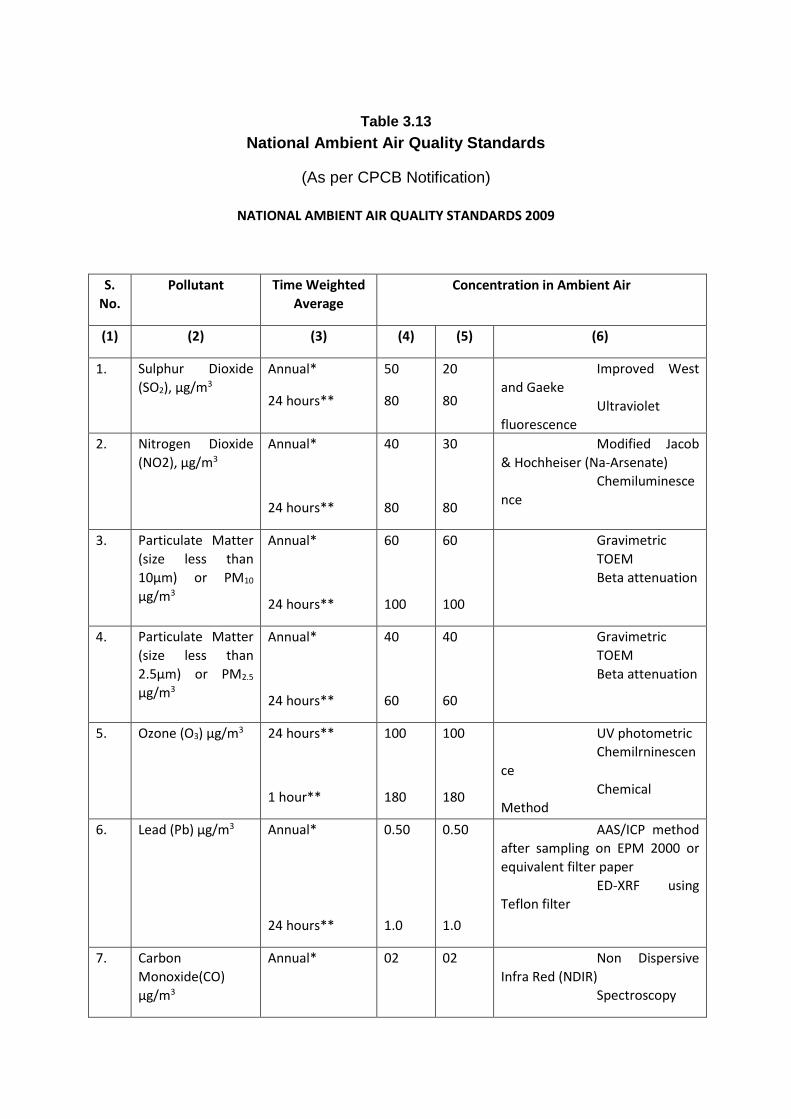
Table 3.13
National Ambient Air Quality Standards
(As per CPCB Notification)
NATIONAL AMBIENT AIR QUALITY STANDARDS 2009
S.
No. Pollutant Time Weighted
Average Concentration in Ambient Air
(1) (2) (3) (4) (5) (6)
1. Sulphur Dioxide
(SO2), µg/m3 Annual*
24 hours**
50
80
20
80
- Improved West
and Gaeke - Ultraviolet
fluorescence 2. Nitrogen Dioxide
(NO2), µg/m3 Annual*
24 hours**
40
80
30
80
- Modified Jacob
& Hochheiser (Na-Arsenate) - Chemiluminesce
nce
3. Particulate Matter
(size less than
10µm) or PM10
µg/m3
Annual*
24 hours**
60
100
60
100
- Gravimetric - TOEM
- Beta attenuation
4. Particulate Matter
(size less than
2.5µm) or PM2.5
µg/m3
Annual*
24 hours**
40
60
40
60
- Gravimetric - TOEM
- Beta attenuation
5. Ozone (O3) µg/m3 24 hours**
1 hour**
100
180
100
180
- UV photometric - Chemilrninescen
ce
- Chemical
Method
6. Lead (Pb) µg/m3 Annual*
24 hours**
0.50
1.0
0.50
1.0
- AAS/ICP method
after sampling on EPM 2000 or
equivalent filter paper - ED-XRF using
Teflon filter
7. Carbon
Monoxide(CO)
µg/m3
Annual*
02
02
- Non Dispersive
Infra Red (NDIR) - Spectroscopy
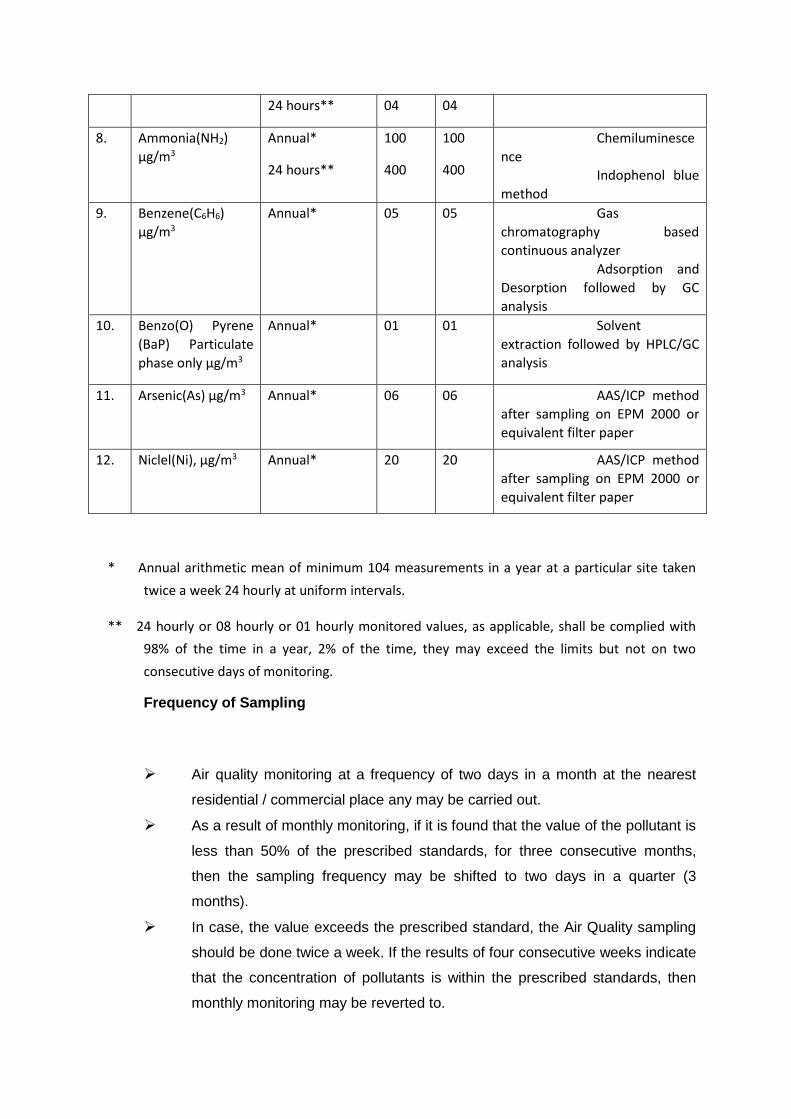
24 hours** 04 04
8. Ammonia(NH2)
µg/m3 Annual*
24 hours**
100
400
100
400
- Chemiluminesce
nce - Indophenol blue
method 9. Benzene(C6H6)
µg/m3 Annual*
05 05 - Gas
chromatography based
continuous analyzer - Adsorption and
Desorption followed by GC
analysis 10. Benzo(O) Pyrene
(BaP) Particulate
phase only µg/m3
Annual*
01 01 - Solvent
extraction followed by HPLC/GC
analysis
11. Arsenic(As) µg/m3 Annual*
06 06 - AAS/ICP method
after sampling on EPM 2000 or
equivalent filter paper
12. Niclel(Ni), µg/m3 Annual*
20 20 - AAS/ICP method
after sampling on EPM 2000 or
equivalent filter paper
* Annual arithmetic mean of minimum 104 measurements in a year at a particular site taken
twice a week 24 hourly at uniform intervals.
** 24 hourly or 08 hourly or 01 hourly monitored values, as applicable, shall be complied with
98% of the time in a year, 2% of the time, they may exceed the limits but not on two
consecutive days of monitoring.
Frequency of Sampling
➢ Air quality monitoring at a frequency of two days in a month at the nearest
residential / commercial place any may be carried out.
➢ As a result of monthly monitoring, if it is found that the value of the pollutant is
less than 50% of the prescribed standards, for three consecutive months,
then the sampling frequency may be shifted to two days in a quarter (3
months).
➢ In case, the value exceeds the prescribed standard, the Air Quality sampling
should be done twice a week. If the results of four consecutive weeks indicate
that the concentration of pollutants is within the prescribed standards, then
monthly monitoring may be reverted to.
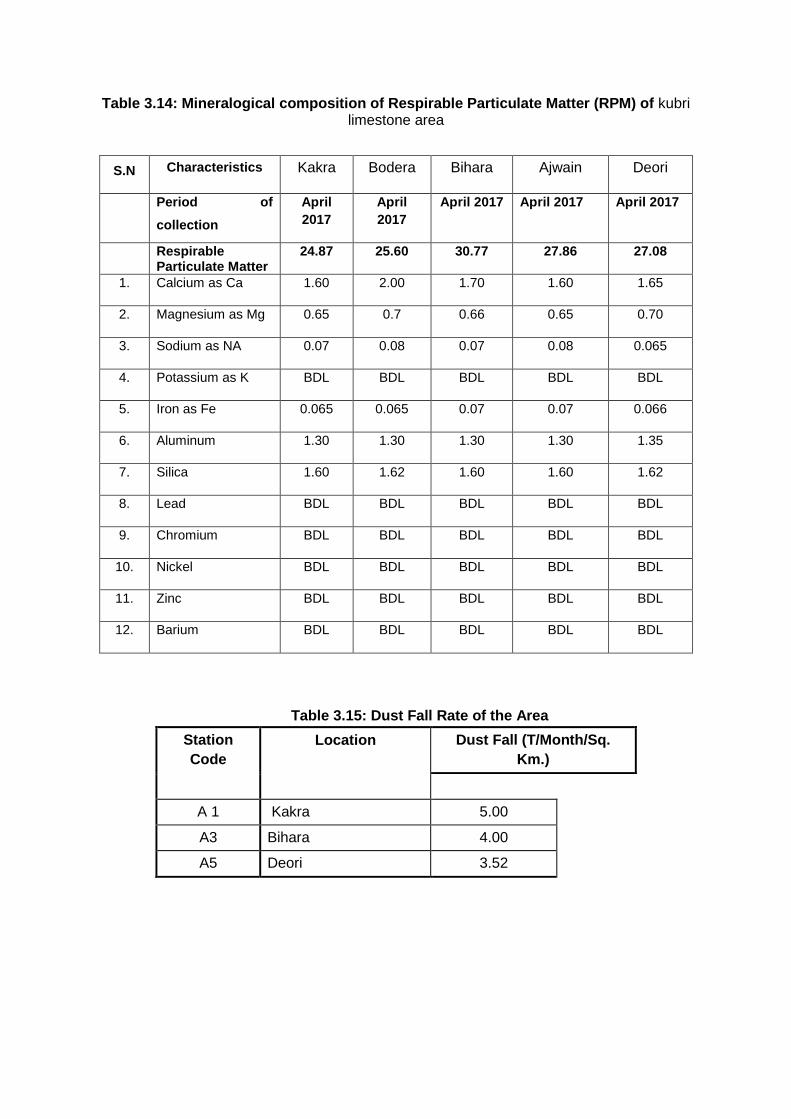
Table 3.14: Mineralogical composition of Respirable Particulate Matter (RPM) of kubri limestone area
S.N Characteristics Kakra Bodera Bihara Ajwain Deori
Period of
collection
April
2017
April
2017
April 2017 April 2017 April 2017
Respirable Particulate Matter
24.87 25.60 30.77 27.86 27.08
1. Calcium as Ca 1.60 2.00 1.70 1.60 1.65
2. Magnesium as Mg 0.65 0.7 0.66 0.65 0.70
3. Sodium as NA 0.07 0.08 0.07 0.08 0.065
4. Potassium as K BDL BDL BDL BDL BDL
5. Iron as Fe 0.065 0.065 0.07 0.07 0.066
6. Aluminum 1.30 1.30 1.30 1.30 1.35
7. Silica 1.60 1.62 1.60 1.60 1.62
8. Lead BDL BDL BDL BDL BDL
9. Chromium BDL BDL BDL BDL BDL
10. Nickel BDL BDL BDL BDL BDL
11. Zinc BDL BDL BDL BDL BDL
12. Barium BDL BDL BDL BDL BDL
Table 3.15: Dust Fall Rate of the Area
Station
Code
Location Dust Fall (T/Month/Sq.
Km.)
A 1 Kakra 5.00
A3 Bihara 4.00
A5 Deori 3.52
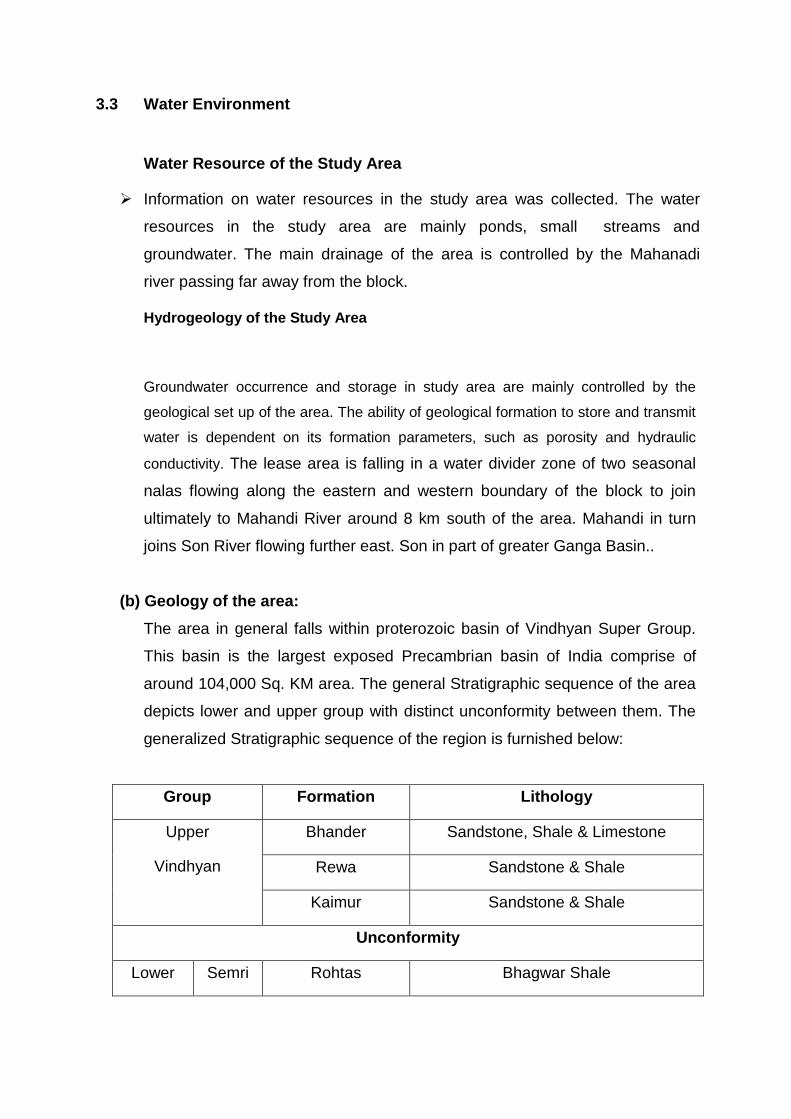
3.3 Water Environment
Water Resource of the Study Area
➢ Information on water resources in the study area was collected. The water
resources in the study area are mainly ponds, small streams and
groundwater. The main drainage of the area is controlled by the Mahanadi
river passing far away from the block.
Hydrogeology of the Study Area
Groundwater occurrence and storage in study area are mainly controlled by the
geological set up of the area. The ability of geological formation to store and transmit
water is dependent on its formation parameters, such as porosity and hydraulic
conductivity. The lease area is falling in a water divider zone of two seasonal
nalas flowing along the eastern and western boundary of the block to join
ultimately to Mahandi River around 8 km south of the area. Mahandi in turn
joins Son River flowing further east. Son in part of greater Ganga Basin..
(b) Geology of the area:
The area in general falls within proterozoic basin of Vindhyan Super Group.
This basin is the largest exposed Precambrian basin of India comprise of
around 104,000 Sq. KM area. The general Stratigraphic sequence of the area
depicts lower and upper group with distinct unconformity between them. The
generalized Stratigraphic sequence of the region is furnished below:
Group Formation Lithology
Upper
Vindhyan
Bhander Sandstone, Shale & Limestone
Rewa Sandstone & Shale
Kaimur Sandstone & Shale
Unconformity
Lower Semri Rohtas Bhagwar Shale
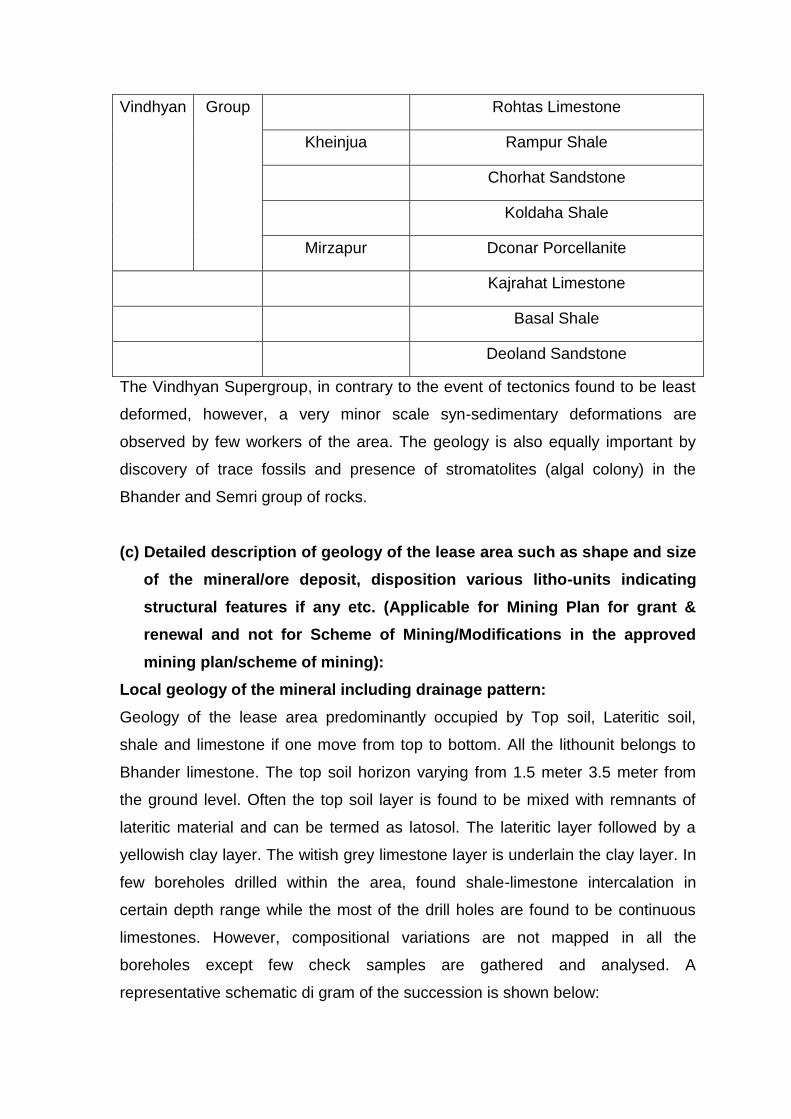
Vindhyan Group Rohtas Limestone
Kheinjua Rampur Shale
Chorhat Sandstone
Koldaha Shale
Mirzapur Dconar Porcellanite
Kajrahat Limestone
Basal Shale
Deoland Sandstone
The Vindhyan Supergroup, in contrary to the event of tectonics found to be least
deformed, however, a very minor scale syn-sedimentary deformations are
observed by few workers of the area. The geology is also equally important by
discovery of trace fossils and presence of stromatolites (algal colony) in the
Bhander and Semri group of rocks.
(c) Detailed description of geology of the lease area such as shape and size
of the mineral/ore deposit, disposition various litho-units indicating
structural features if any etc. (Applicable for Mining Plan for grant &
renewal and not for Scheme of Mining/Modifications in the approved
mining plan/scheme of mining):
Local geology of the mineral including drainage pattern:
Geology of the lease area predominantly occupied by Top soil, Lateritic soil,
shale and limestone if one move from top to bottom. All the lithounit belongs to
Bhander limestone. The top soil horizon varying from 1.5 meter 3.5 meter from
the ground level. Often the top soil layer is found to be mixed with remnants of
lateritic material and can be termed as latosol. The lateritic layer followed by a
yellowish clay layer. The witish grey limestone layer is underlain the clay layer. In
few boreholes drilled within the area, found shale-limestone intercalation in
certain depth range while the most of the drill holes are found to be continuous
limestones. However, compositional variations are not mapped in all the
boreholes except few check samples are gathered and analysed. A
representative schematic di gram of the succession is shown below:
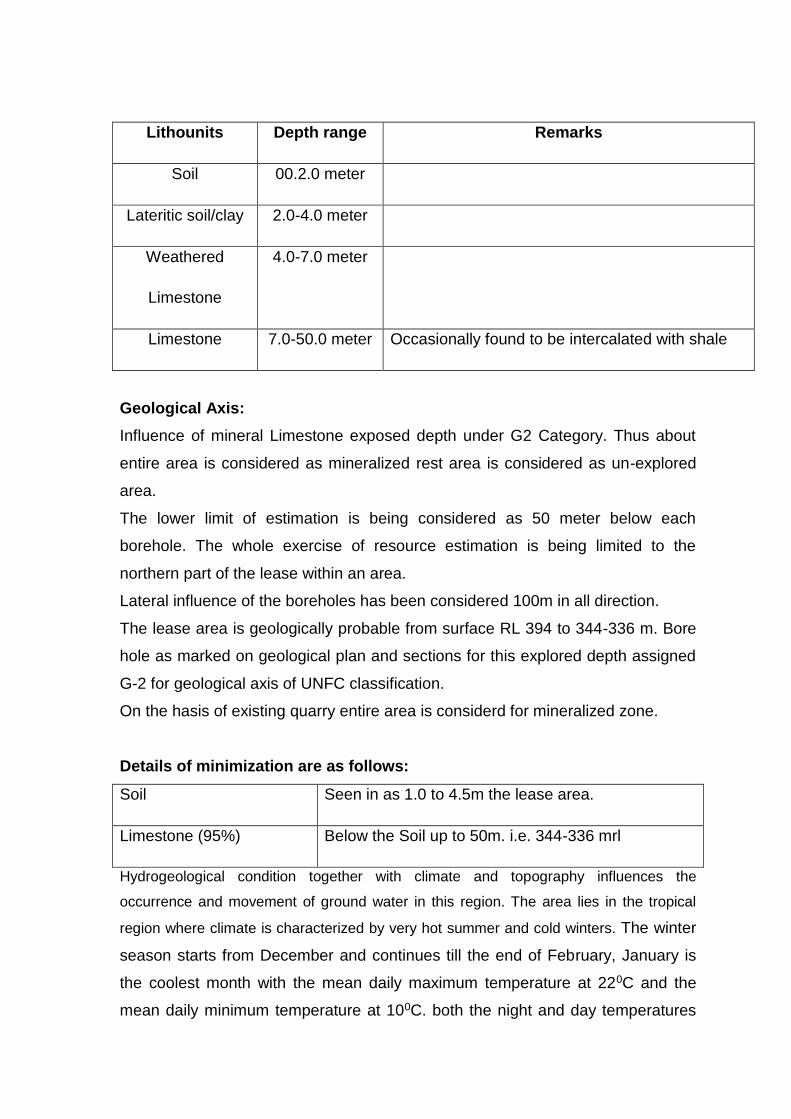
Lithounits Depth range Remarks
Soil 00.2.0 meter
Lateritic soil/clay 2.0-4.0 meter
Weathered
Limestone
4.0-7.0 meter
Limestone 7.0-50.0 meter Occasionally found to be intercalated with shale
Geological Axis:
Influence of mineral Limestone exposed depth under G2 Category. Thus about
entire area is considered as mineralized rest area is considered as un-explored
area.
The lower limit of estimation is being considered as 50 meter below each
borehole. The whole exercise of resource estimation is being limited to the
northern part of the lease within an area.
Lateral influence of the boreholes has been considered 100m in all direction.
The lease area is geologically probable from surface RL 394 to 344-336 m. Bore
hole as marked on geological plan and sections for this explored depth assigned
G-2 for geological axis of UNFC classification.
On the hasis of existing quarry entire area is considerd for mineralized zone.
Details of minimization are as follows:
Soil Seen in as 1.0 to 4.5m the lease area.
Limestone (95%) Below the Soil up to 50m. i.e. 344-336 mrl
Hydrogeological condition together with climate and topography influences the
occurrence and movement of ground water in this region. The area lies in the tropical
region where climate is characterized by very hot summer and cold winters. The winter
season starts from December and continues till the end of February, January is
the coolest month with the mean daily maximum temperature at 220C and the
mean daily minimum temperature at 100C. both the night and day temperatures
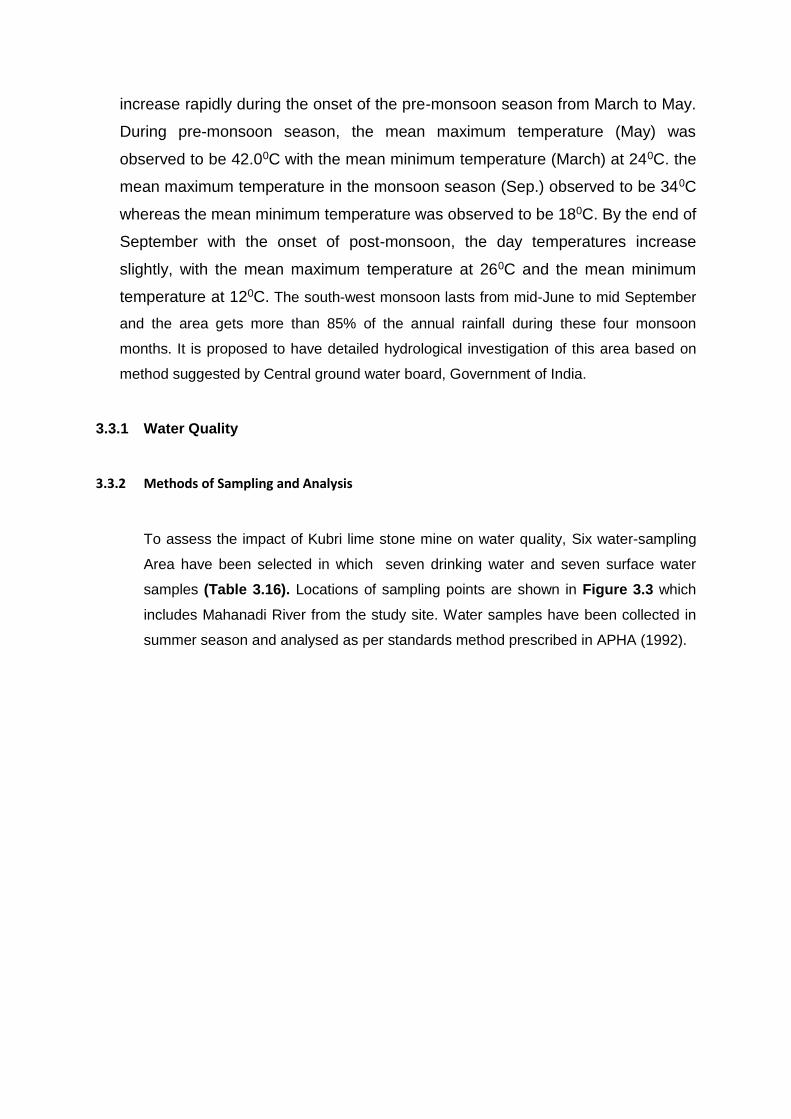
increase rapidly during the onset of the pre-monsoon season from March to May.
During pre-monsoon season, the mean maximum temperature (May) was
observed to be 42.00C with the mean minimum temperature (March) at 240C. the
mean maximum temperature in the monsoon season (Sep.) observed to be 340C
whereas the mean minimum temperature was observed to be 180C. By the end of
September with the onset of post-monsoon, the day temperatures increase
slightly, with the mean maximum temperature at 260C and the mean minimum
temperature at 120C. The south-west monsoon lasts from mid-June to mid September
and the area gets more than 85% of the annual rainfall during these four monsoon
months. It is proposed to have detailed hydrological investigation of this area based on
method suggested by Central ground water board, Government of India.
3.3.1 Water Quality
3.3.2 Methods of Sampling and Analysis
To assess the impact of Kubri lime stone mine on water quality, Six water-sampling
Area have been selected in which seven drinking water and seven surface water
samples (Table 3.16). Locations of sampling points are shown in Figure 3.3 which
includes Mahanadi River from the study site. Water samples have been collected in
summer season and analysed as per standards method prescribed in APHA (1992).
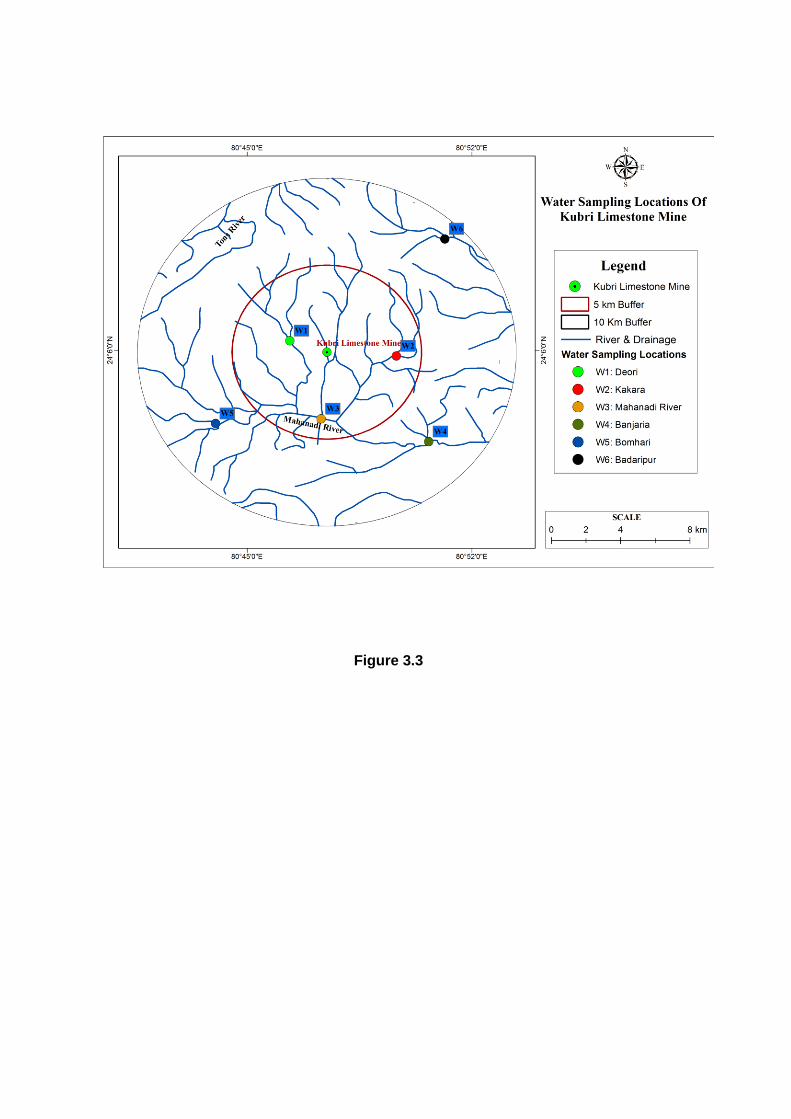
Figure 3.3
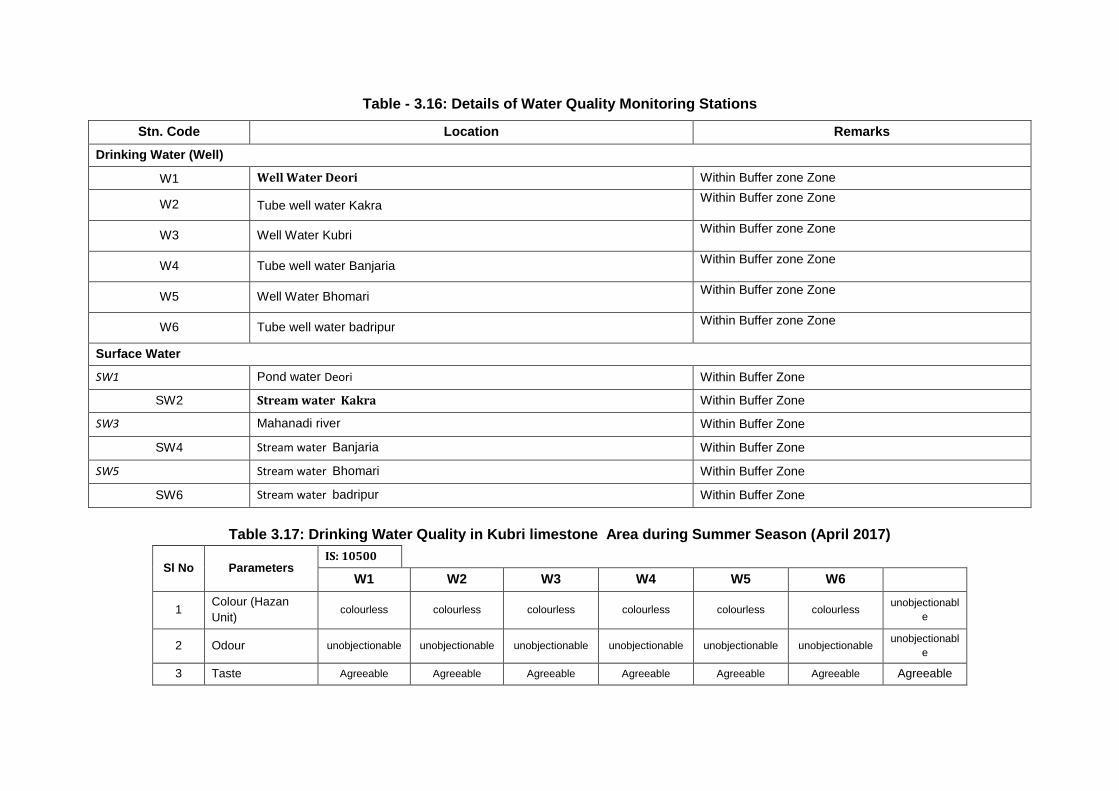
Table - 3.16: Details of Water Quality Monitoring Stations
Stn. Code Location Remarks
Drinking Water (Well)
W1 Well Water Deori Within Buffer zone Zone
W2 Tube well water Kakra Within Buffer zone Zone
W3 Well Water Kubri Within Buffer zone Zone
W4 Tube well water Banjaria Within Buffer zone Zone
W5 Well Water Bhomari Within Buffer zone Zone
W6 Tube well water badripur Within Buffer zone Zone
Surface Water
SW1 Pond water Deori Within Buffer Zone
SW2 Stream water Kakra Within Buffer Zone
SW3 Mahanadi river Within Buffer Zone
SW4 Stream water Banjaria Within Buffer Zone
SW5 Stream water Bhomari Within Buffer Zone
SW6 Stream water badripur Within Buffer Zone
Table 3.17: Drinking Water Quality in Kubri limestone Area during Summer Season (April 2017)
Sl No Parameters IS: 10500
W1 W2 W3 W4 W5 W6
1 Colour (Hazan
Unit) colourless colourless colourless colourless colourless colourless
unobjectionabl
e
2 Odour unobjectionable unobjectionable unobjectionable unobjectionable unobjectionable unobjectionable unobjectionabl
e
3 Taste Agreeable Agreeable Agreeable Agreeable Agreeable Agreeable Agreeable
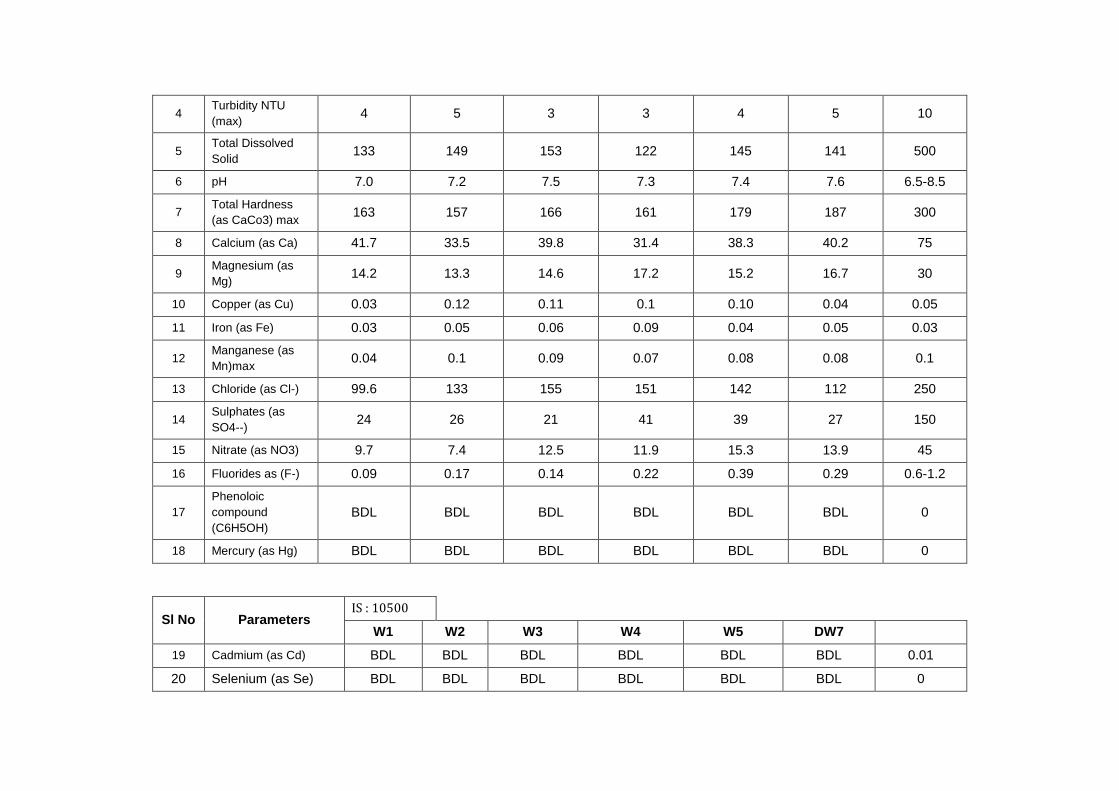
4 Turbidity NTU
(max) 4 5 3 3 4 5 10
5 Total Dissolved
Solid 133 149 153 122 145 141 500
6 pH 7.0 7.2 7.5 7.3 7.4 7.6 6.5-8.5
7 Total Hardness
(as CaCo3) max 163 157 166 161 179 187 300
8 Calcium (as Ca) 41.7 33.5 39.8 31.4 38.3 40.2 75
9 Magnesium (as
Mg) 14.2 13.3 14.6 17.2 15.2 16.7 30
10 Copper (as Cu) 0.03 0.12 0.11 0.1 0.10 0.04 0.05
11 Iron (as Fe) 0.03 0.05 0.06 0.09 0.04 0.05 0.03
12 Manganese (as
Mn)max 0.04 0.1 0.09 0.07 0.08 0.08 0.1
13 Chloride (as Cl-) 99.6 133 155 151 142 112 250
14 Sulphates (as
SO4--) 24 26 21 41 39 27 150
15 Nitrate (as NO3) 9.7 7.4 12.5 11.9 15.3 13.9 45
16 Fluorides as (F-) 0.09 0.17 0.14 0.22 0.39 0.29 0.6-1.2
17
Phenoloic
compound
(C6H5OH)
BDL BDL BDL BDL BDL BDL 0
18 Mercury (as Hg) BDL BDL BDL BDL BDL BDL 0
Sl No Parameters IS : 10500
W1 W2 W3 W4 W5 DW7
19 Cadmium (as Cd) BDL BDL BDL BDL BDL BDL 0.01
20 Selenium (as Se) BDL BDL BDL BDL BDL BDL 0
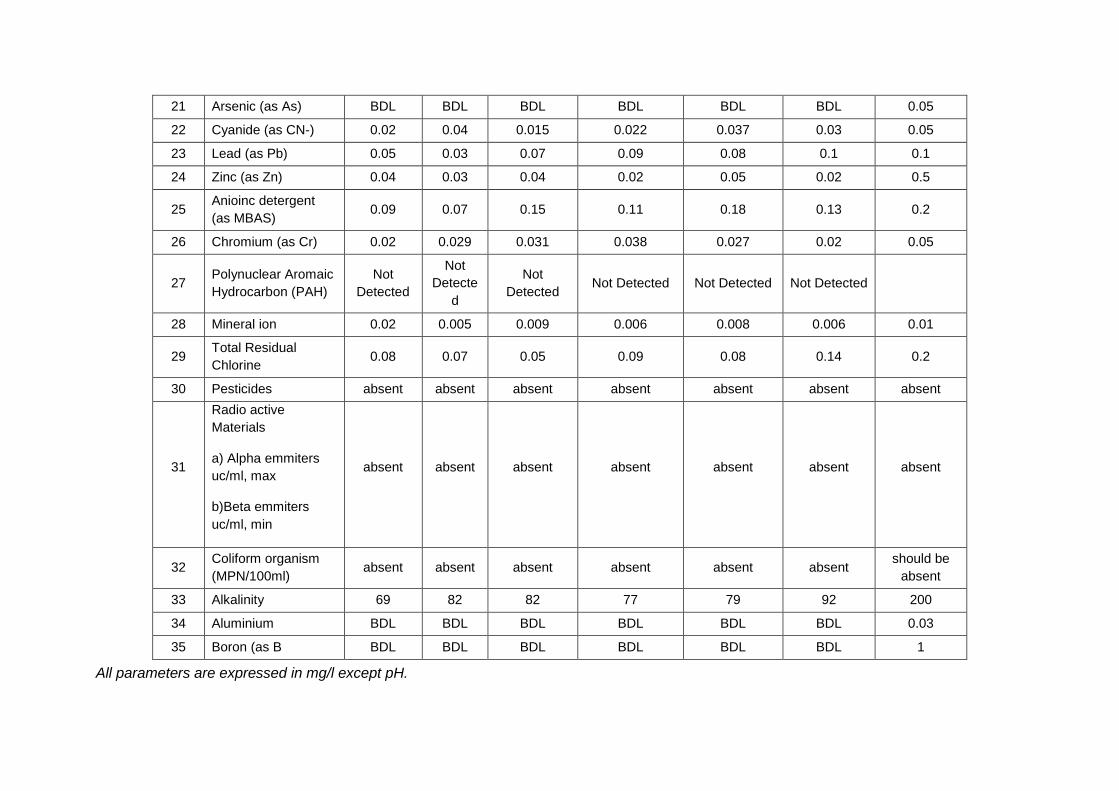
21 Arsenic (as As) BDL BDL BDL BDL BDL BDL 0.05
22 Cyanide (as CN-) 0.02 0.04 0.015 0.022 0.037 0.03 0.05
23 Lead (as Pb) 0.05 0.03 0.07 0.09 0.08 0.1 0.1
24 Zinc (as Zn) 0.04 0.03 0.04 0.02 0.05 0.02 0.5
25 Anioinc detergent
(as MBAS) 0.09 0.07 0.15 0.11 0.18 0.13 0.2
26 Chromium (as Cr) 0.02 0.029 0.031 0.038 0.027 0.02 0.05
27 Polynuclear Aromaic
Hydrocarbon (PAH)
Not
Detected
Not
Detecte
d
Not
Detected Not Detected Not Detected Not Detected
28 Mineral ion 0.02 0.005 0.009 0.006 0.008 0.006 0.01
29 Total Residual
Chlorine 0.08 0.07 0.05 0.09 0.08 0.14 0.2
30 Pesticides absent absent absent absent absent absent absent
31
Radio active
Materials
a) Alpha emmiters
uc/ml, max
b)Beta emmiters
uc/ml, min
absent absent absent absent absent absent absent
32 Coliform organism
(MPN/100ml) absent absent absent absent absent absent
should be
absent
33 Alkalinity 69 82 82 77 79 92 200
34 Aluminium BDL BDL BDL BDL BDL BDL 0.03
35 Boron (as B BDL BDL BDL BDL BDL BDL 1
All parameters are expressed in mg/l except pH.
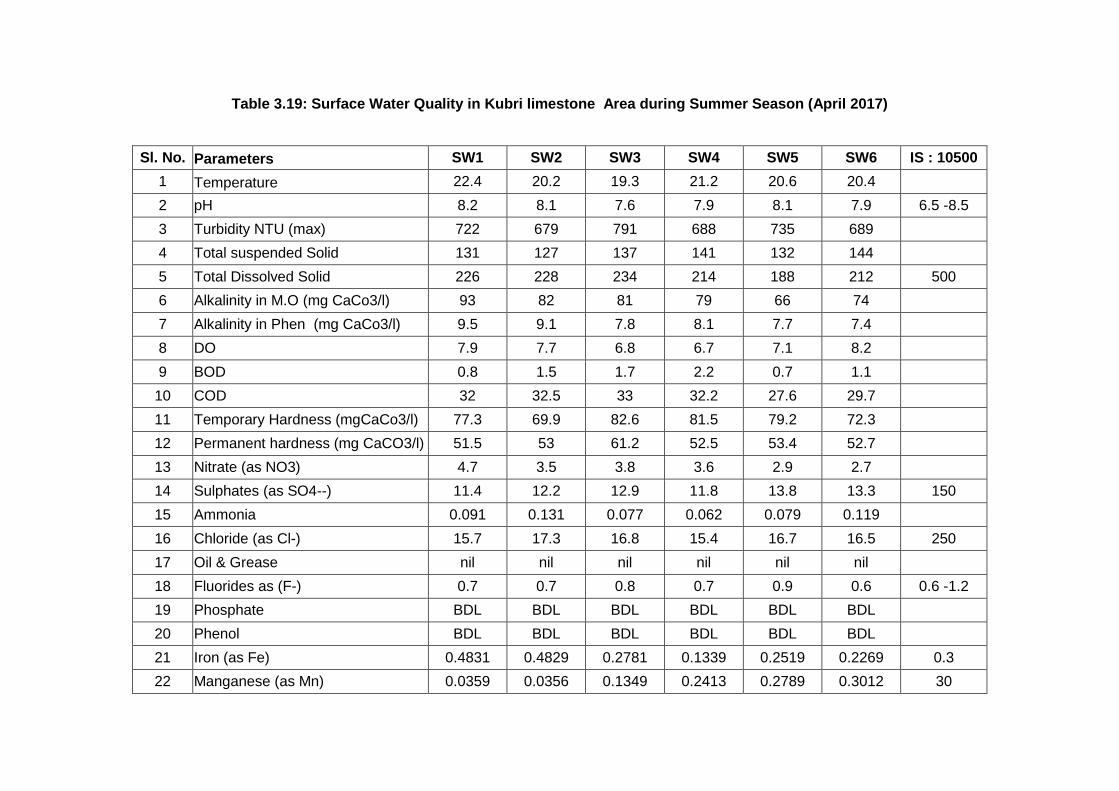
Table 3.19: Surface Water Quality in Kubri limestone Area during Summer Season (April 2017)
Sl. No. Parameters SW1 SW2 SW3 SW4 SW5 SW6 IS : 10500
1 Temperature 22.4 20.2 19.3 21.2 20.6 20.4
2 pH 8.2 8.1 7.6 7.9 8.1 7.9 6.5 -8.5
3 Turbidity NTU (max) 722 679 791 688 735 689
4 Total suspended Solid 131 127 137 141 132 144
5 Total Dissolved Solid 226 228 234 214 188 212 500
6 Alkalinity in M.O (mg CaCo3/l) 93 82 81 79 66 74
7 Alkalinity in Phen (mg CaCo3/l) 9.5 9.1 7.8 8.1 7.7 7.4
8 DO 7.9 7.7 6.8 6.7 7.1 8.2
9 BOD 0.8 1.5 1.7 2.2 0.7 1.1
10 COD 32 32.5 33 32.2 27.6 29.7
11 Temporary Hardness (mgCaCo3/l) 77.3 69.9 82.6 81.5 79.2 72.3
12 Permanent hardness (mg CaCO3/l) 51.5 53 61.2 52.5 53.4 52.7
13 Nitrate (as NO3) 4.7 3.5 3.8 3.6 2.9 2.7
14 Sulphates (as SO4--) 11.4 12.2 12.9 11.8 13.8 13.3 150
15 Ammonia 0.091 0.131 0.077 0.062 0.079 0.119
16 Chloride (as Cl-) 15.7 17.3 16.8 15.4 16.7 16.5 250
17 Oil & Grease nil nil nil nil nil nil
18 Fluorides as (F-) 0.7 0.7 0.8 0.7 0.9 0.6 0.6 -1.2
19 Phosphate BDL BDL BDL BDL BDL BDL
20 Phenol BDL BDL BDL BDL BDL BDL
21 Iron (as Fe) 0.4831 0.4829 0.2781 0.1339 0.2519 0.2269 0.3
22 Manganese (as Mn) 0.0359 0.0356 0.1349 0.2413 0.2789 0.3012 30
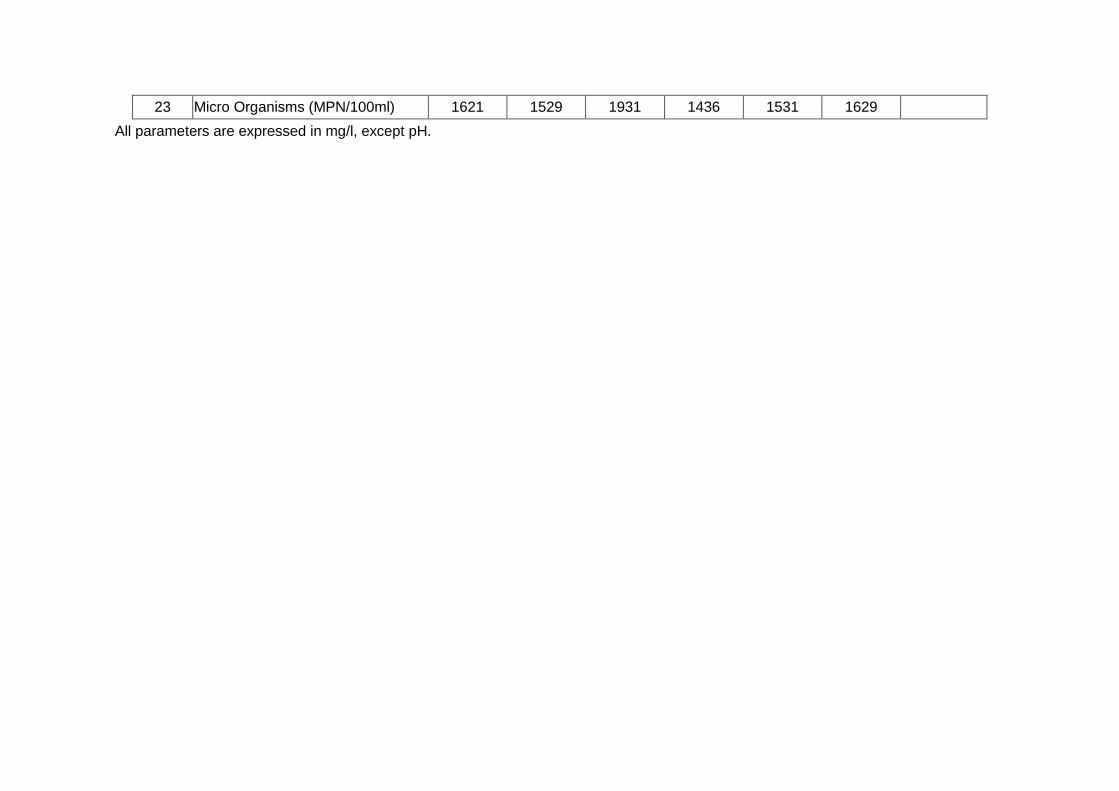
23 Micro Organisms (MPN/100ml) 1621 1529 1931 1436 1531 1629
All parameters are expressed in mg/l, except pH.
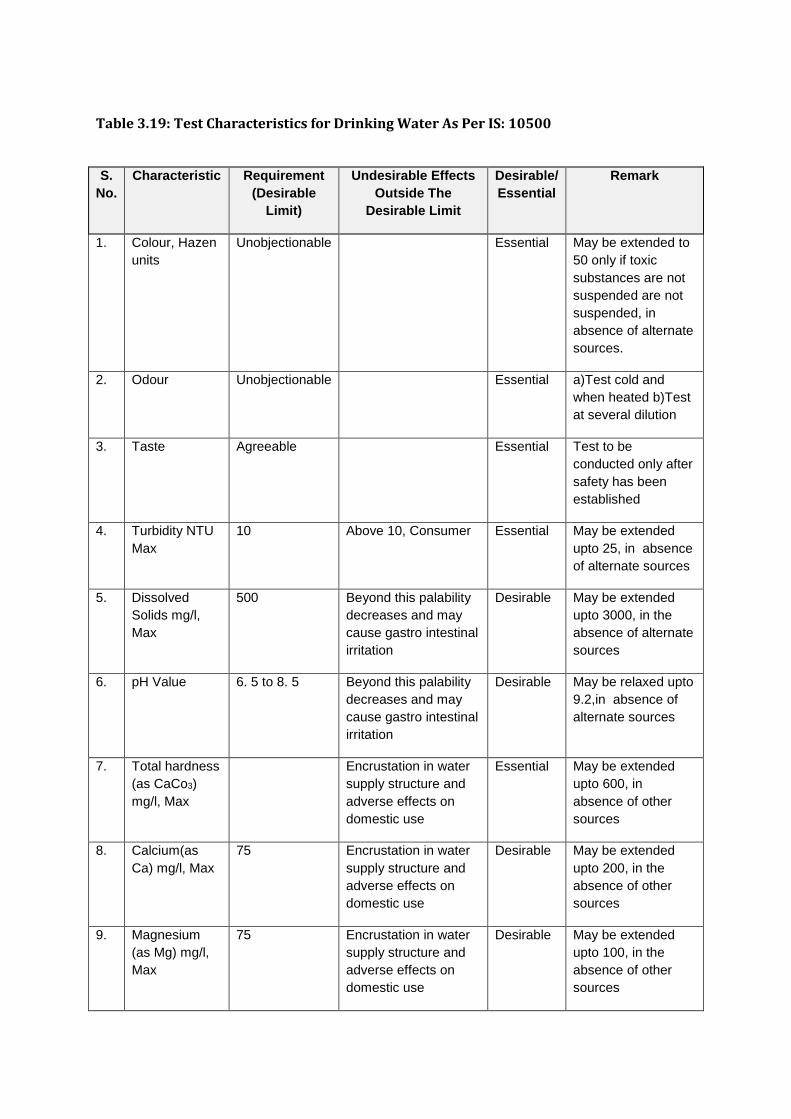
Table 3.19: Test Characteristics for Drinking Water As Per IS: 10500
S.
No.
Characteristic Requirement
(Desirable
Limit)
Undesirable Effects
Outside The
Desirable Limit
Desirable/
Essential
Remark
1. Colour, Hazen
units
Unobjectionable Essential May be extended to
50 only if toxic
substances are not
suspended are not
suspended, in
absence of alternate
sources.
2. Odour Unobjectionable Essential a)Test cold and
when heated b)Test
at several dilution
3. Taste Agreeable Essential Test to be
conducted only after
safety has been
established
4. Turbidity NTU
Max
10 Above 10, Consumer Essential May be extended
upto 25, in absence
of alternate sources
5. Dissolved
Solids mg/l,
Max
500 Beyond this palability
decreases and may
cause gastro intestinal
irritation
Desirable May be extended
upto 3000, in the
absence of alternate
sources
6. pH Value 6. 5 to 8. 5 Beyond this palability
decreases and may
cause gastro intestinal
irritation
Desirable May be relaxed upto
9.2,in absence of
alternate sources
7. Total hardness
(as CaCo3)
mg/l, Max
Encrustation in water
supply structure and
adverse effects on
domestic use
Essential May be extended
upto 600, in
absence of other
sources
8. Calcium(as
Ca) mg/l, Max
75 Encrustation in water
supply structure and
adverse effects on
domestic use
Desirable May be extended
upto 200, in the
absence of other
sources
9. Magnesium
(as Mg) mg/l,
Max
75 Encrustation in water
supply structure and
adverse effects on
domestic use
Desirable May be extended
upto 100, in the
absence of other
sources
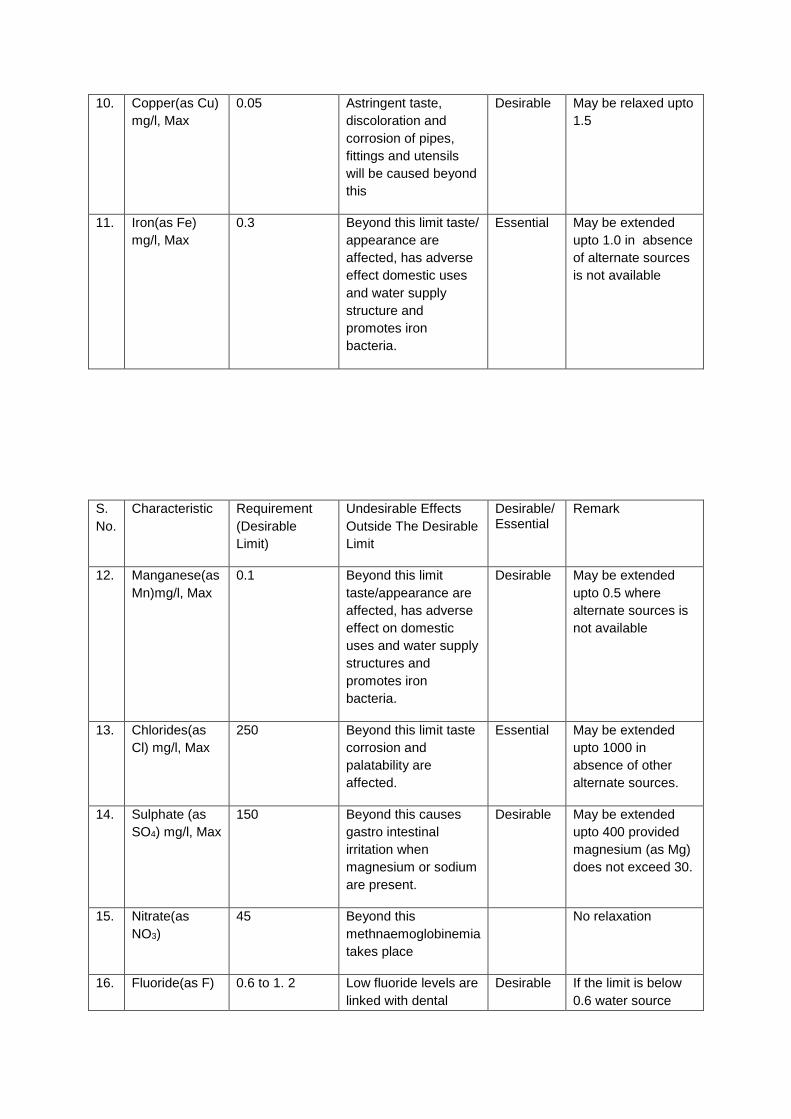
10. Copper(as Cu)
mg/l, Max
0.05 Astringent taste,
discoloration and
corrosion of pipes,
fittings and utensils
will be caused beyond
this
Desirable May be relaxed upto
1.5
11. Iron(as Fe)
mg/l, Max
0.3 Beyond this limit taste/
appearance are
affected, has adverse
effect domestic uses
and water supply
structure and
promotes iron
bacteria.
Essential May be extended
upto 1.0 in absence
of alternate sources
is not available
S.
No.
Characteristic Requirement
(Desirable
Limit)
Undesirable Effects
Outside The Desirable
Limit
Desirable/ Essential
Remark
12. Manganese(as
Mn)mg/l, Max
0.1 Beyond this limit
taste/appearance are
affected, has adverse
effect on domestic
uses and water supply
structures and
promotes iron
bacteria.
Desirable May be extended
upto 0.5 where
alternate sources is
not available
13. Chlorides(as
Cl) mg/l, Max
250 Beyond this limit taste
corrosion and
palatability are
affected.
Essential May be extended
upto 1000 in
absence of other
alternate sources.
14. Sulphate (as
SO4) mg/l, Max
150 Beyond this causes
gastro intestinal
irritation when
magnesium or sodium
are present.
Desirable May be extended
upto 400 provided
magnesium (as Mg)
does not exceed 30.
15. Nitrate(as
NO3)
45 Beyond this
methnaemoglobinemia
takes place
No relaxation
16. Fluoride(as F) 0.6 to 1. 2 Low fluoride levels are
linked with dental
Desirable If the limit is below
0.6 water source
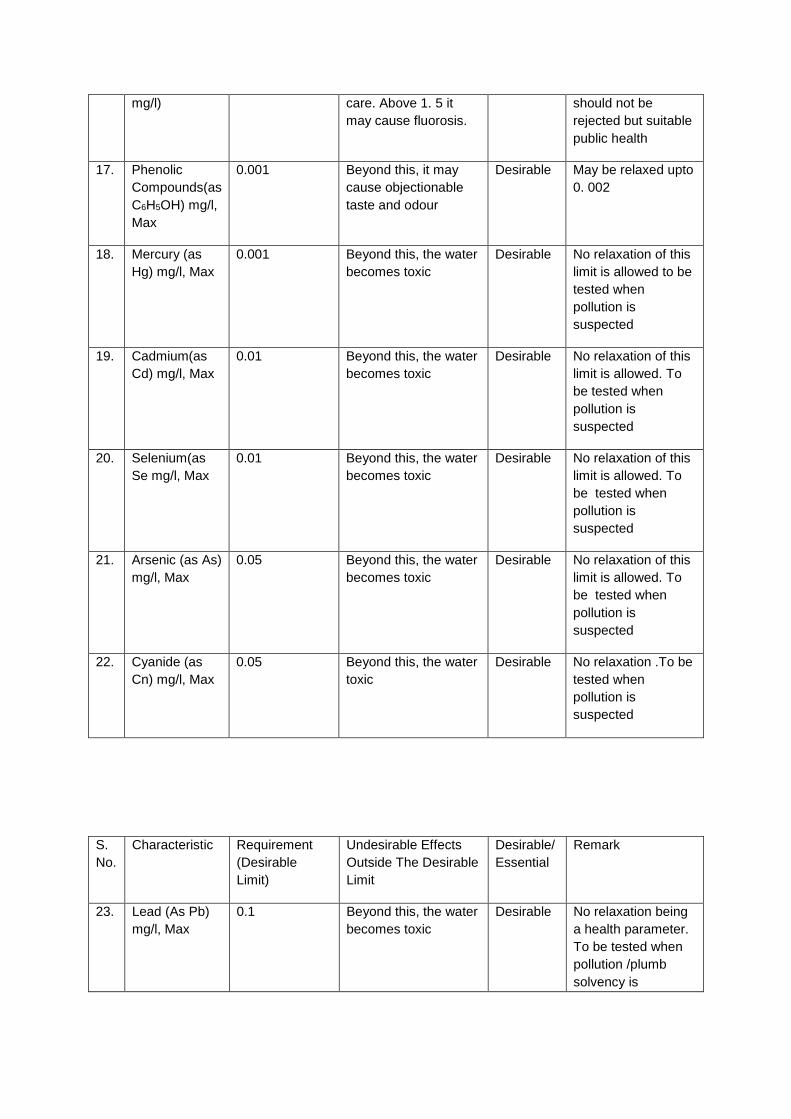
mg/l) care. Above 1. 5 it
may cause fluorosis.
should not be
rejected but suitable
public health
17. Phenolic
Compounds(as
C6H5OH) mg/l,
Max
0.001 Beyond this, it may
cause objectionable
taste and odour
Desirable May be relaxed upto
0. 002
18. Mercury (as
Hg) mg/l, Max
0.001 Beyond this, the water
becomes toxic
Desirable No relaxation of this
limit is allowed to be
tested when
pollution is
suspected
19. Cadmium(as
Cd) mg/l, Max
0.01 Beyond this, the water
becomes toxic
Desirable No relaxation of this
limit is allowed. To
be tested when
pollution is
suspected
20. Selenium(as
Se mg/l, Max
0.01 Beyond this, the water
becomes toxic
Desirable No relaxation of this
limit is allowed. To
be tested when
pollution is
suspected
21. Arsenic (as As)
mg/l, Max
0.05 Beyond this, the water
becomes toxic
Desirable No relaxation of this
limit is allowed. To
be tested when
pollution is
suspected
22. Cyanide (as
Cn) mg/l, Max
0.05 Beyond this, the water
toxic
Desirable No relaxation .To be
tested when
pollution is
suspected
S.
No.
Characteristic Requirement
(Desirable
Limit)
Undesirable Effects
Outside The Desirable
Limit
Desirable/
Essential
Remark
23. Lead (As Pb)
mg/l, Max
0.1 Beyond this, the water
becomes toxic
Desirable No relaxation being
a health parameter.
To be tested when
pollution /plumb
solvency is
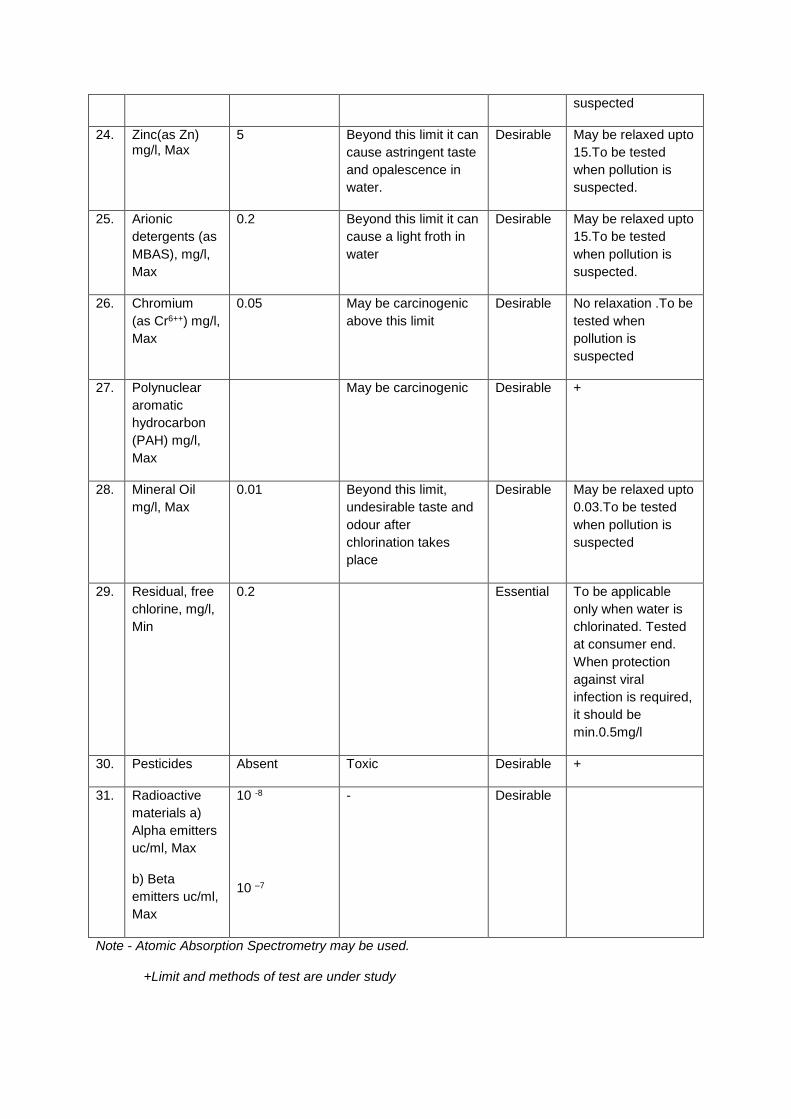
suspected
24. Zinc(as Zn) mg/l, Max
5 Beyond this limit it can
cause astringent taste
and opalescence in
water.
Desirable May be relaxed upto
15.To be tested
when pollution is
suspected.
25. Arionic
detergents (as
MBAS), mg/l,
Max
0.2 Beyond this limit it can
cause a light froth in
water
Desirable May be relaxed upto
15.To be tested
when pollution is
suspected.
26. Chromium
(as Cr6++) mg/l,
Max
0.05 May be carcinogenic
above this limit
Desirable No relaxation .To be
tested when
pollution is
suspected
27. Polynuclear
aromatic
hydrocarbon
(PAH) mg/l,
Max
May be carcinogenic Desirable +
28. Mineral Oil
mg/l, Max
0.01 Beyond this limit,
undesirable taste and
odour after
chlorination takes
place
Desirable May be relaxed upto
0.03.To be tested
when pollution is
suspected
29. Residual, free
chlorine, mg/l,
Min
0.2 Essential To be applicable
only when water is
chlorinated. Tested
at consumer end.
When protection
against viral
infection is required,
it should be
min.0.5mg/l
30. Pesticides Absent Toxic Desirable +
31. Radioactive
materials a)
Alpha emitters
uc/ml, Max
b) Beta
emitters uc/ml,
Max
10 -8
10 –7
- Desirable
Note - Atomic Absorption Spectrometry may be used.
+Limit and methods of test are under study

Table 3.20:-Classification of Inland Surface Water, CPCB Standard
Characteristics A B C D E
Dissolved Oxygen (mg/l), min. 6 5 4 4 -
BOD (Mg/l), Min. 2 3 3 - -
Total Coliform (MPN/100),max 50 500 5000 - -
Total Coliform (MPN/100ml),
max. 500 - 1500 - 2100
Chloride as Cl (mg/l),max 250 - 600 - 500
Colour, Hazen Units, max. 10 300 300 - -
Sodium absorption Ratio,
max. - - - 26
Boron as B (mg/l), max. - - - - 2
Sulphates as SO4 (mg/l) max. 400 - 400 - 1000
Nitrates as NO3 (mg/l) max. 20 - 50 - -
Free Ammonia as N (mg/l),
max. - - - 12 -
Conductivity at 25 o C (us/cm),
max. - - - 1.0 2.25
pH 6.5 - 8.5 6.5 - 8.5 6.5 - 8.5 6.5 - 8.5 6.5 - 8.5
Arsenic as As (mg/l), max. 0.05 0.2 0.2 - -
Iron as Fe (mg/l), max. 0.3 - 50 - -
Fluorides as F (mg/l) max. 1.5 1.5 1 - -
Lead as Pb (mg/l), max. 0.1 - 0.1 - -
Copper as Cu (mg/l), max. 1.5 - 1.5 - -
Zinc as Zn (mg/l), max. 15 - 15 - -
If the Coliform count is found to be more than the prescribed tolerance limit, the
criteria for Coliform shall be satisfied if number is more than 20% of samples show
more than the tolerance limit specified and not more than 5% of samples show
values more than four times the tolerance limits. Further, the faecal coliform should
not be more than 20% of the Coliform.

A) Drinking water source without conventional treatment but after
disinfecting.
B) Outdoor bathing organised.
C) Drinking water source with conventional treatment followed by
disaffection.
D) Propagation of wildlife, fisheries.
E) Irrigation, industrial cooling, controlled waste disposal.
3.4 Hydrogeology of the Area
Introduction
Hydro-geological regime of a geometric region is mostly controlled by three major
aspects, namely (i) Topography, (ii) Geology and (iii) Climate, besides the ground
water and associated phenomena which are
• Mode of occurrence and movement of water,
• The direction and velocity of water flow,
• The rate and magnitude of fluid potential fluctuation,
• The quantity of water present in the formations i.e. conduit and storage
Functions of aquifers,
• The recharge-discharge process,
• The infiltration phenomena,
• The relation/interaction of surface and ground water,
• The type and change of chemical quality of waters in space and time, etc.
Ground water conditions/regime: -
Water levels observed in dug wells in the area indicate that the ground water depth
varies during summer between 4.0 m. to 6.0 m. and 2.5 to 4.0 m during monsoon.
Fluid potential fluctuation between the two extreme climates is around 2.5 m.
Recharge to the aquifer is mostly through precipitation, which is around 1200 mm per
annum and is around 20 % of the annual rainfall due to loose strata. Detail of rainfall
data as recorded during 33 months commencing from January 1986, are as follows:
a) Average number of total rainy days in a year 70

b) Maximum rainfall recorded on a single day 170.00 mm
c) Average rainfall in a year 1200.00 mm
Villages Water Levels (m)
Pre-
monsoon
(May)
Post
Monsoon
(Oct.)
Villages Water Levels
(m)
Gw 1 7.2
6.0 Pre-
monsoon
(May)
Post
Monsoon
(Oct.)
Gw 2
8.1
6.5 Gw
19 7.2
6.0
Gw 3
6.9
5.6 Gw
20 8.1
6.5
Gw 4
6.5
5.2 Gw
21 6.9
5.6
Gw 5
6.6
5.1 Gw
22 6.5
5.2
Gw 6
7.6
5.8 Gw
23 6.6
5.1
Gw 7
5.9
4.3 Gw
24 7.6
5.8
Gw 8
9.5
7.3 Gw
25 5.9
4.3
Gw 9
9.8
7.1 Gw
26 9.5
7.3
Gw 10 8.7
7.6 Gw
27 9.8
7.1
Gw 11 8.2
7.4 Gw
28 8.7 7.6
Gw 12 8.5
7.0 Gw
29 8.2 7.4
Gw 13 8.1
6.9 Gw
30 8.5 7.0
Gw 14 9.6
8.2

d)
Ave
rag
e
rainf
all
on a
rainy day during monsoon 53.00 mm
Ground water in entire region is potable with pH ranging between 7 to 7.5 and total
dissolved solids (TDS) between 240 to 300 mg/liter.
Assessment of Capacity
The following assumptions have been made to arrive at the pumping requirement of
the mine. Maximum rainfall in a single day during monsoon is 170 mm. Catchments
area is considered as the maximum open excavated area. Seepage through
backfilled area, strata and surface is 20 % of water inflow due to direct rainfall.
Pumping capacity is provided on the basis of pumping the accumulated water of the
maximum rainfall/day in 5 days with 20 hrs pumping per day.25 % reserve pumping
capacity is kept as standby.
3.4.1 Water Table Behavior in the Area
The common source of water used for domestic and irrigation in the core zone
villages include wells, shallow dug well, river and ponds. The other system is
tapping deep aquifers in some of the villages by deep tube wells i.e. hand pumps.
Total 30 samples from dug wells of more than 30 villages around the buffer zone
area were selected as observation points in the core and buffer zone for measuring
the water levels in these wells during pre-monsoon and post monsoon seasons. In
the core and buffer zone the fluctuation of ground water level is given in Table
3.21. The ground water monitoring location and water shed map is given in Fig 3.4
and 3.5.
Gw 15 9.7
8.6
Gw 16 8.5
6.8
Gw 17 9.8
8.8
Gw 18 9.6
8.5
Average 8.27 6.82

Table 3.21: Ground Water Level around Block
Average premonsoon 8.27, Average postmonsoon-6.82. All the water level comprise
average value of more than one wells of each village.

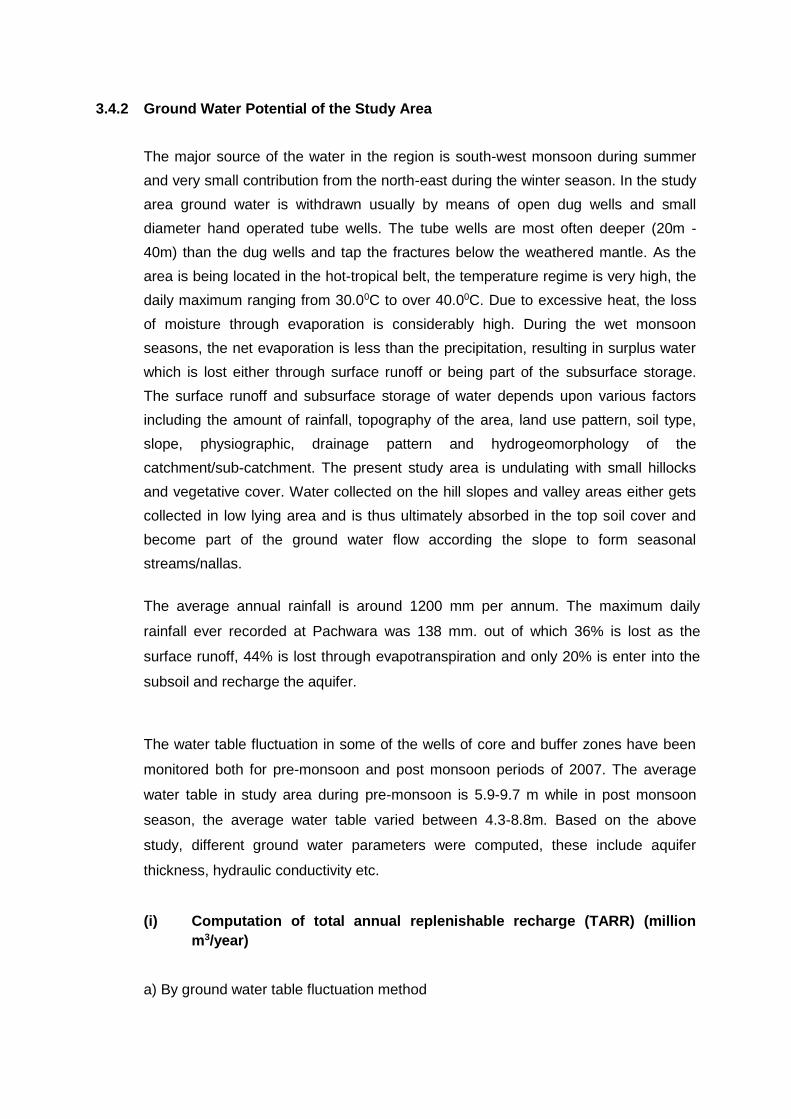
3.4.2 Ground Water Potential of the Study Area
The major source of the water in the region is south-west monsoon during summer
and very small contribution from the north-east during the winter season. In the study
area ground water is withdrawn usually by means of open dug wells and small
diameter hand operated tube wells. The tube wells are most often deeper (20m -
40m) than the dug wells and tap the fractures below the weathered mantle. As the
area is being located in the hot-tropical belt, the temperature regime is very high, the
daily maximum ranging from 30.00C to over 40.00C. Due to excessive heat, the loss
of moisture through evaporation is considerably high. During the wet monsoon
seasons, the net evaporation is less than the precipitation, resulting in surplus water
which is lost either through surface runoff or being part of the subsurface storage.
The surface runoff and subsurface storage of water depends upon various factors
including the amount of rainfall, topography of the area, land use pattern, soil type,
slope, physiographic, drainage pattern and hydrogeomorphology of the
catchment/sub-catchment. The present study area is undulating with small hillocks
and vegetative cover. Water collected on the hill slopes and valley areas either gets
collected in low lying area and is thus ultimately absorbed in the top soil cover and
become part of the ground water flow according the slope to form seasonal
streams/nallas.
The average annual rainfall is around 1200 mm per annum. The maximum daily
rainfall ever recorded at Pachwara was 138 mm. out of which 36% is lost as the
surface runoff, 44% is lost through evapotranspiration and only 20% is enter into the
subsoil and recharge the aquifer.
The water table fluctuation in some of the wells of core and buffer zones have been
monitored both for pre-monsoon and post monsoon periods of 2007. The average
water table in study area during pre-monsoon is 5.9-9.7 m while in post monsoon
season, the average water table varied between 4.3-8.8m. Based on the above
study, different ground water parameters were computed, these include aquifer
thickness, hydraulic conductivity etc.
(i) Computation of total annual replenishable recharge (TARR) (million
m3/year)
a) By ground water table fluctuation method
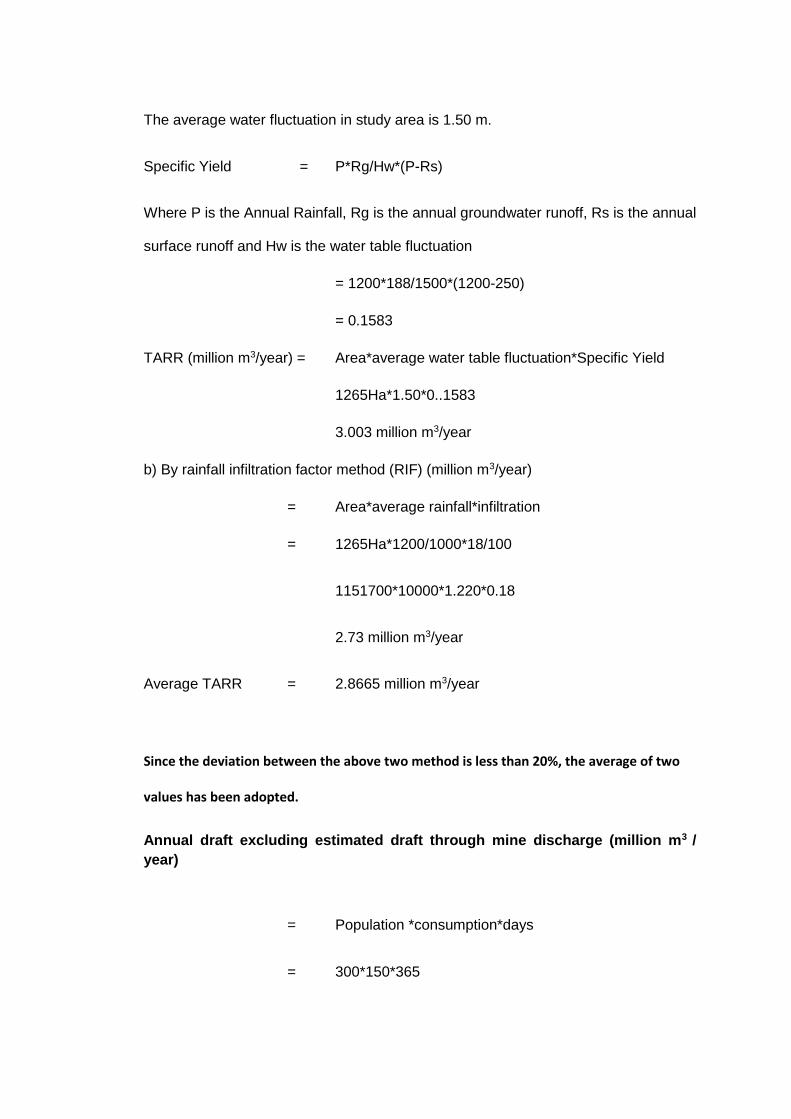
The average water fluctuation in study area is 1.50 m.
Specific Yield = P*Rg/Hw*(P-Rs)
Where P is the Annual Rainfall, Rg is the annual groundwater runoff, Rs is the annual
surface runoff and Hw is the water table fluctuation
= 1200*188/1500*(1200-250)
= 0.1583
TARR (million m3/year) = Area*average water table fluctuation*Specific Yield
1265Ha*1.50*0..1583
3.003 million m3/year
b) By rainfall infiltration factor method (RIF) (million m3/year)
= Area*average rainfall*infiltration
= 1265Ha*1200/1000*18/100
1151700*10000*1.220*0.18
2.73 million m3/year
Average TARR = 2.8665 million m3/year
Since the deviation between the above two method is less than 20%, the average of two
values has been adopted.
Annual draft excluding estimated draft through mine discharge (million m3 /
year)
= Population *consumption*days
= 300*150*365

= 0.016 million m3/year
(ii) Estimated draft through mine discharge (million m3/year)
Average aquifer discharge =0.108 m3/min=155.52 m3/day
Porosity of alluvium =20%
155.52 x 0.6 = 31.10 m3/day pumping out from 4500 sq.m. area
for unit area 31100/4500=6.91 litter/day
for open area of 500x300 m of mines pumping out=150000x6.91 litter/day
= 1036m3/day
.= 378 mcm/year
(iii) Net ground water availability
= Average TARR - Estimated draft through mine
discharge
= 2.8665 million m3/year - 0.3478 million m3/year
= 2.518million m3/year
(iv). Stage of ground water development (in %)
= Estimated draft through mine discharge
0..3478 /2.8665
= 12.13%
1) Total annual replenishable recharge (million m3/year)
• By ground water table fluctuation method (million m3/year) 3.003
• By rainfall infiltration factor method (million m3/year) 2.73
• Average TARR (million m3/year) 2.8665
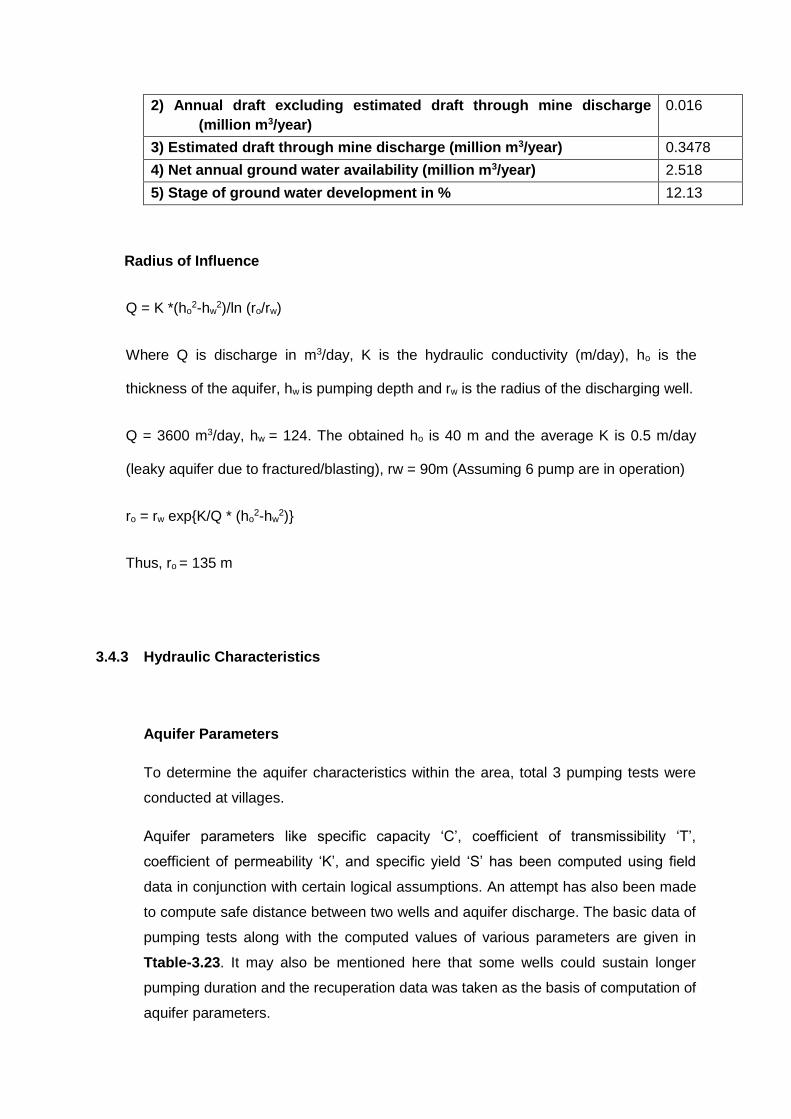
2) Annual draft excluding estimated draft through mine discharge
(million m3/year)
0.016
3) Estimated draft through mine discharge (million m3/year) 0.3478
4) Net annual ground water availability (million m3/year) 2.518
5) Stage of ground water development in % 12.13
Radius of Influence
Q = K *(ho2-hw
2)/ln (ro/rw)
Where Q is discharge in m3/day, K is the hydraulic conductivity (m/day), ho is the
thickness of the aquifer, hw is pumping depth and rw is the radius of the discharging well.
Q = 3600 m3/day, hw = 124. The obtained ho is 40 m and the average K is 0.5 m/day
(leaky aquifer due to fractured/blasting), rw = 90m (Assuming 6 pump are in operation)
ro = rw exp{K/Q * (ho2-hw
2)}
Thus, ro = 135 m
3.4.3 Hydraulic Characteristics
Aquifer Parameters
To determine the aquifer characteristics within the area, total 3 pumping tests were
conducted at villages.
Aquifer parameters like specific capacity ‘C’, coefficient of transmissibility ‘T’,
coefficient of permeability ‘K’, and specific yield ‘S’ has been computed using field
data in conjunction with certain logical assumptions. An attempt has also been made
to compute safe distance between two wells and aquifer discharge. The basic data of
pumping tests along with the computed values of various parameters are given in
Ttable-3.23. It may also be mentioned here that some wells could sustain longer
pumping duration and the recuperation data was taken as the basis of computation of
aquifer parameters.

From the table it can be observed that specific capacity ranges from 0.0187 to 0.28
and the average value is 0.0497 m3 / min / m. Discharge is 0.030 to 0.679 m3/min.
Details of pump tests at two sites within the lease area are listed in Table-3.23.
1. The tube well data reveal that the area is having higher draw down with low yield.
2. The transmissibility and field permeability are very low.
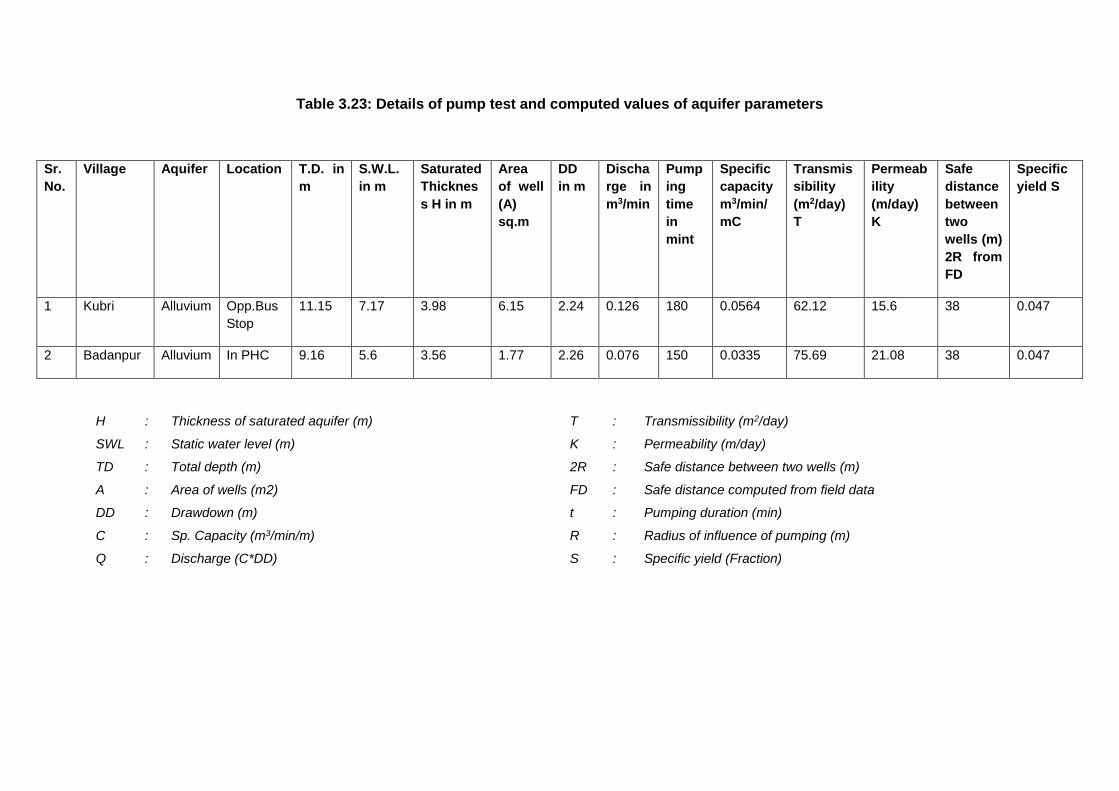
Table 3.23: Details of pump test and computed values of aquifer parameters
Sr.
No.
Village Aquifer Location T.D. in
m
S.W.L.
in m
Saturated
Thicknes
s H in m
Area
of well
(A)
sq.m
DD
in m
Discha
rge in
m3/min
Pump
ing
time
in
mint
Specific
capacity
m3/min/
mC
Transmis
sibility
(m2/day)
T
Permeab
ility
(m/day)
K
Safe
distance
between
two
wells (m)
2R from
FD
Specific
yield S
1 Kubri Alluvium Opp.Bus
Stop
11.15 7.17 3.98 6.15 2.24 0.126 180 0.0564 62.12 15.6 38 0.047
2 Badanpur Alluvium In PHC 9.16 5.6 3.56 1.77 2.26 0.076 150 0.0335 75.69 21.08 38 0.047
H : Thickness of saturated aquifer (m) T : Transmissibility (m2/day)
SWL : Static water level (m) K : Permeability (m/day)
TD : Total depth (m) 2R : Safe distance between two wells (m)
A : Area of wells (m2) FD : Safe distance computed from field data
DD : Drawdown (m) t : Pumping duration (min)
C : Sp. Capacity (m3/min/m) R : Radius of influence of pumping (m)
Q : Discharge (C*DD) S : Specific yield (Fraction)
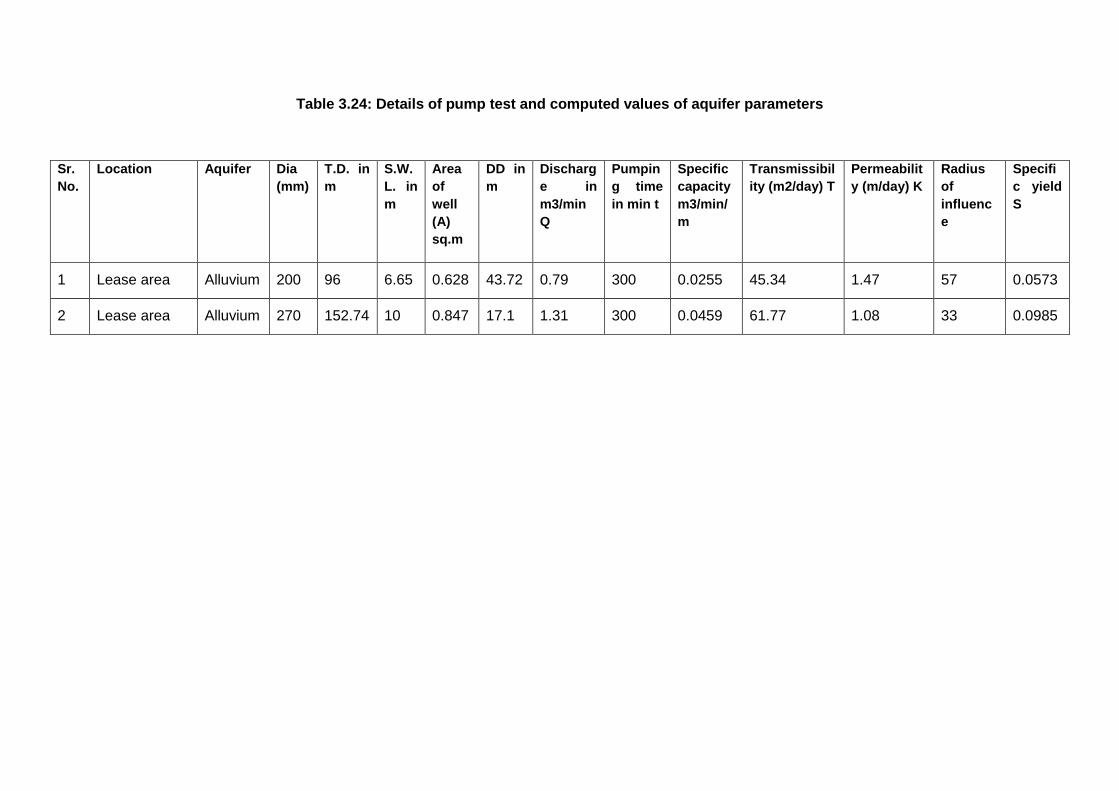
Table 3.24: Details of pump test and computed values of aquifer parameters
Sr.
No.
Location Aquifer Dia
(mm)
T.D. in
m
S.W.
L. in
m
Area
of
well
(A)
sq.m
DD in
m
Discharg
e in
m3/min
Q
Pumpin
g time
in min t
Specific
capacity
m3/min/
m
Transmissibil
ity (m2/day) T
Permeabilit
y (m/day) K
Radius
of
influenc
e
Specifi
c yield
S
1 Lease area Alluvium 200 96 6.65 0.628 43.72 0.79 300 0.0255 45.34 1.47 57 0.0573
2 Lease area Alluvium 270 152.74 10 0.847 17.1 1.31 300 0.0459 61.77 1.08 33 0.0985
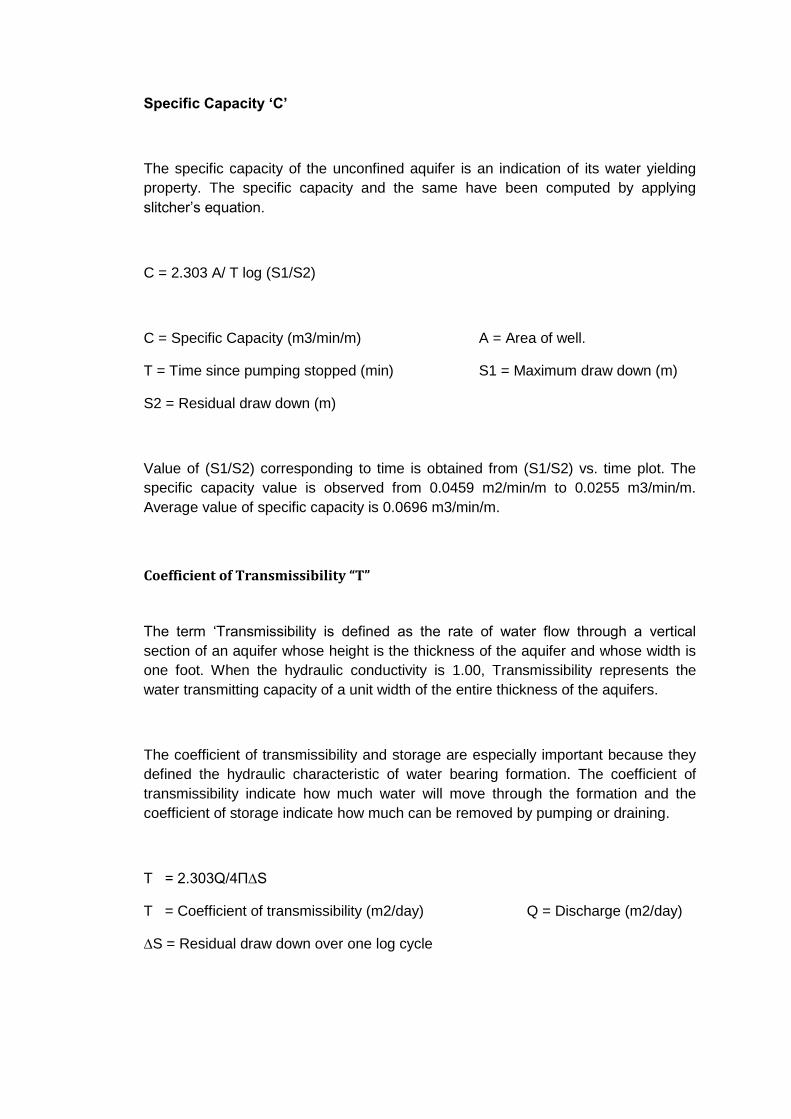
Specific Capacity ‘C’
The specific capacity of the unconfined aquifer is an indication of its water yielding
property. The specific capacity and the same have been computed by applying
slitcher’s equation.
C = 2.303 A/ T log (S1/S2)
C = Specific Capacity (m3/min/m) A = Area of well.
T = Time since pumping stopped (min) S1 = Maximum draw down (m)
S2 = Residual draw down (m)
Value of (S1/S2) corresponding to time is obtained from (S1/S2) vs. time plot. The
specific capacity value is observed from 0.0459 m2/min/m to 0.0255 m3/min/m.
Average value of specific capacity is 0.0696 m3/min/m.
Coefficient of Transmissibility “T”
The term ‘Transmissibility is defined as the rate of water flow through a vertical
section of an aquifer whose height is the thickness of the aquifer and whose width is
one foot. When the hydraulic conductivity is 1.00, Transmissibility represents the
water transmitting capacity of a unit width of the entire thickness of the aquifers.
The coefficient of transmissibility and storage are especially important because they
defined the hydraulic characteristic of water bearing formation. The coefficient of
transmissibility indicate how much water will move through the formation and the
coefficient of storage indicate how much can be removed by pumping or draining.
T = 2.303Q/4П∆S
T = Coefficient of transmissibility (m2/day) Q = Discharge (m2/day)
∆S = Residual draw down over one log cycle
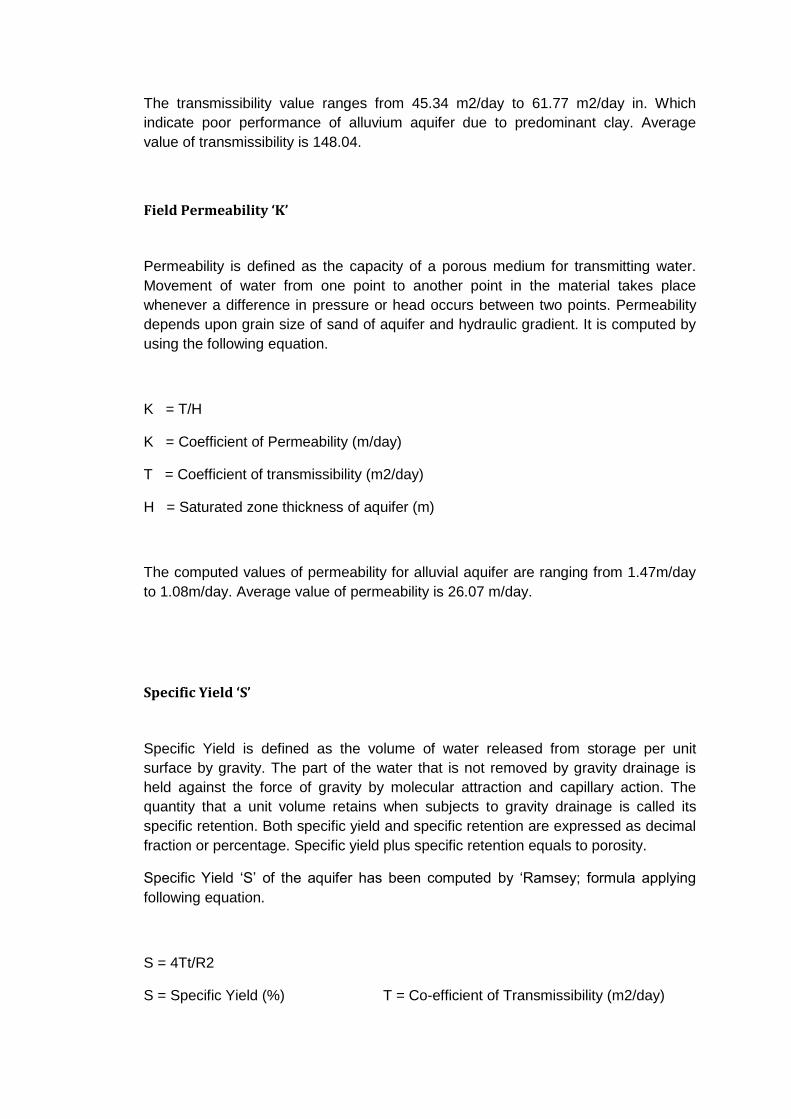
The transmissibility value ranges from 45.34 m2/day to 61.77 m2/day in. Which
indicate poor performance of alluvium aquifer due to predominant clay. Average
value of transmissibility is 148.04.
Field Permeability ‘K’
Permeability is defined as the capacity of a porous medium for transmitting water.
Movement of water from one point to another point in the material takes place
whenever a difference in pressure or head occurs between two points. Permeability
depends upon grain size of sand of aquifer and hydraulic gradient. It is computed by
using the following equation.
K = T/H
K = Coefficient of Permeability (m/day)
T = Coefficient of transmissibility (m2/day)
H = Saturated zone thickness of aquifer (m)
The computed values of permeability for alluvial aquifer are ranging from 1.47m/day
to 1.08m/day. Average value of permeability is 26.07 m/day.
Specific Yield ‘S’
Specific Yield is defined as the volume of water released from storage per unit
surface by gravity. The part of the water that is not removed by gravity drainage is
held against the force of gravity by molecular attraction and capillary action. The
quantity that a unit volume retains when subjects to gravity drainage is called its
specific retention. Both specific yield and specific retention are expressed as decimal
fraction or percentage. Specific yield plus specific retention equals to porosity.
Specific Yield ‘S’ of the aquifer has been computed by ‘Ramsey; formula applying
following equation.
S = 4Tt/R2
S = Specific Yield (%) T = Co-efficient of Transmissibility (m2/day)

T = Pumping duration (min) R = Safe distance constant 25.68
The specific yield for alluvial aquifers is 3.5%. Average value of specific yield is
6.49%.
Safe Distance
When water is pumped from a well the quantity discharged initially is derived from
aquifer storage immediately surrounding the well. As pumping continues more water
must be derived from storage at greater and greater distance from the well. This
means that the circular shaped cone of depression must expand so that water can
move from greater distance towards well.
For individual pumping test data, safe distance between two wells is computed by
using Theism’s formula.
2.25 K H t / S
2R= 2* ---------------------------
Log -1 2 П Ks(2H-s)/Q
2R = Sate distance (m) K = Permeability 9m/hrs)
H = Saturated thickness in m t = Time of pumping in hrs
S = Specific Yield (fraction) s = Draw down at cone boundary in
Q = Discharge in Cubic m/hrs m(Assume to be 0.01 m)

The safe distance between two wells in alluvial aquifer is worked out to be 36 to 42m.
The aquifer are not homogeneous hence their parameters are also not having any
type of consistency.
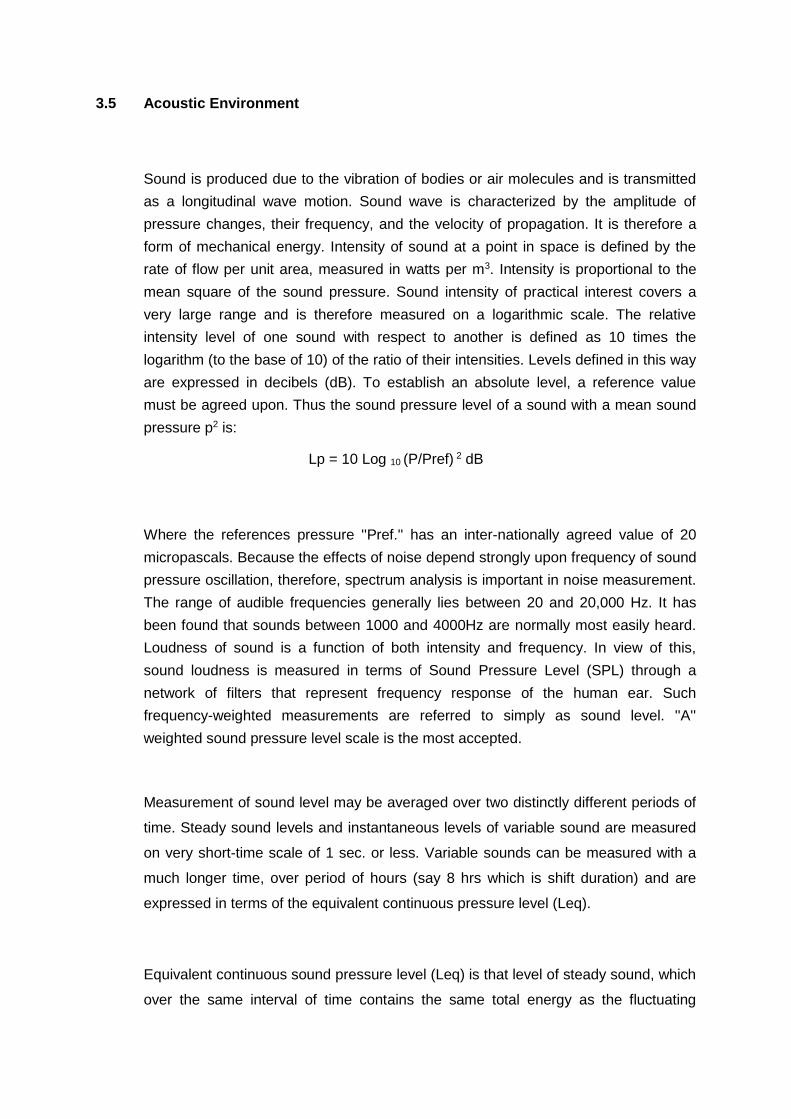
3.5 Acoustic Environment
Sound is produced due to the vibration of bodies or air molecules and is transmitted
as a longitudinal wave motion. Sound wave is characterized by the amplitude of
pressure changes, their frequency, and the velocity of propagation. It is therefore a
form of mechanical energy. Intensity of sound at a point in space is defined by the
rate of flow per unit area, measured in watts per m3. Intensity is proportional to the
mean square of the sound pressure. Sound intensity of practical interest covers a
very large range and is therefore measured on a logarithmic scale. The relative
intensity level of one sound with respect to another is defined as 10 times the
logarithm (to the base of 10) of the ratio of their intensities. Levels defined in this way
are expressed in decibels (dB). To establish an absolute level, a reference value
must be agreed upon. Thus the sound pressure level of a sound with a mean sound
pressure p2 is:
Lp = 10 Log 10 (P/Pref) 2 dB
Where the references pressure ''Pref.'' has an inter-nationally agreed value of 20
micropascals. Because the effects of noise depend strongly upon frequency of sound
pressure oscillation, therefore, spectrum analysis is important in noise measurement.
The range of audible frequencies generally lies between 20 and 20,000 Hz. It has
been found that sounds between 1000 and 4000Hz are normally most easily heard.
Loudness of sound is a function of both intensity and frequency. In view of this,
sound loudness is measured in terms of Sound Pressure Level (SPL) through a
network of filters that represent frequency response of the human ear. Such
frequency-weighted measurements are referred to simply as sound level. ''A''
weighted sound pressure level scale is the most accepted.
Measurement of sound level may be averaged over two distinctly different periods of
time. Steady sound levels and instantaneous levels of variable sound are measured
on very short-time scale of 1 sec. or less. Variable sounds can be measured with a
much longer time, over period of hours (say 8 hrs which is shift duration) and are
expressed in terms of the equivalent continuous pressure level (Leq).
Equivalent continuous sound pressure level (Leq) is that level of steady sound, which
over the same interval of time contains the same total energy as the fluctuating

sound. Thus, Leq is a scale for the measurement of long-term noise exposure. There
is large number of noise scales and rating methods based on average or weighted
averages derived from the detailed noise characteristics. Equivalent sound level
forms a useful measure of noise exposure and forms basis of several noise
indicators. It is defined as
Leq = 10 Log (1/Tfot 10 Lp (t)/10 dt) dB(A)
Where Lp (t) is instantaneous sound pressure level and T is time of averaging
normally 8 or 24 hours.
3.5.1 Instrument Used and Methodology
Noise level study has been done for monitoring the ambient noise level in the leasehold area. Mip-oy integrated sound level
meter meeting IEC-197A was used to measure the noise level. Average day and night Leq values have been assessed at each
location for four hours duration both during day and night time with the interval of 30 minutes.
3.5.2 Noise Standards
Central Pollution Control Board has stipulated some specific standard for ambient
noise-level in industrial, commercial, residential and silence zones for both day and
night time. These are given in Table 3.24.
Table 3.24: Ambient Noise Standard
Sl.
No.
Location Noise Level [Leq in dB(A)]
Day Time Night Time
1. Industrial Area 75 70
2. Commercial Area 65 55
3. Residential Area 55 45

4. Silence Zone 50 40
In addition to this, there are another set of exposure limits laid down by office of
Occupation Safety and Health Administration in USA (OSHA), and IS: 3483.
These are given in Table 3.25.
Table 3.25: Exposure Limit for Different Noise Levels
Maximum Duration (hrs./Day) Sound Level dB (A)
OSHA IS:3483
8 90 85
6 92 -
4 95 88
2 100 91
1 105 94
½ 110 98
¼ 115 100
(OSHA) - Occupational Safety and Health Administration, USA)
3.5.3 Assessment of Noise Level
Noise level in core Zone and Buffer Zone
To assess the ambient noise level, measurements have been carried out at 6(six) as
shown in Figure 3.6, which are listed in Table 3.26. Noise, often defined as
unwanted sound, interferes with speech communication, causes annoyance,
distracts from work, disturbs sleep thus deteriorating the quality of human
environment. Noise levels were measured at several locations in the human
settlements around the proposed mining site by using precision noise level meter.
Detailed analysis of noise has revealed that there is no noticeable impact of noise in
the surrounding environment. All the study sites in the residential areas exhibited a
noise level well within the corresponding threshold limit value as prescribed by
CPCB, both during the day and night time.
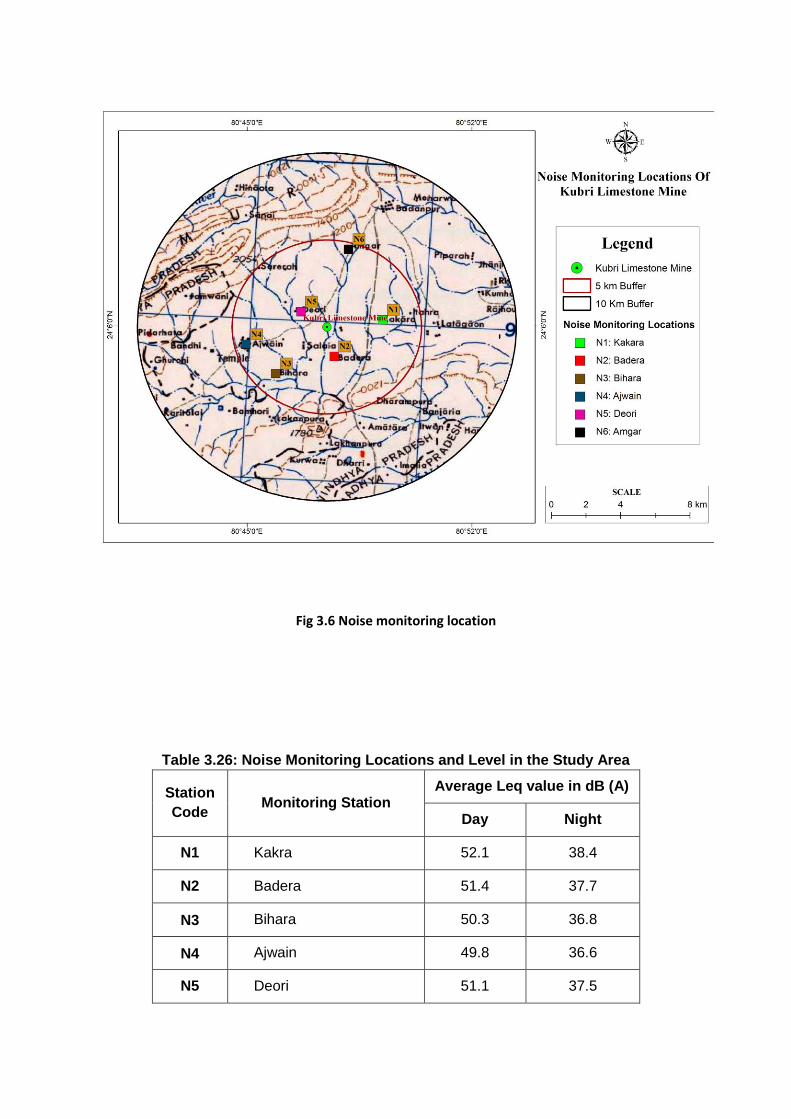
Fig 3.6 Noise monitoring location
Table 3.26: Noise Monitoring Locations and Level in the Study Area
Station
Code Monitoring Station
Average Leq value in dB (A)
Day Night
N1 Kakra 52.1 38.4
N2 Badera 51.4 37.7
N3 Bihara 50.3 36.8
N4 Ajwain 49.8 36.6
N5 Deori 51.1 37.5
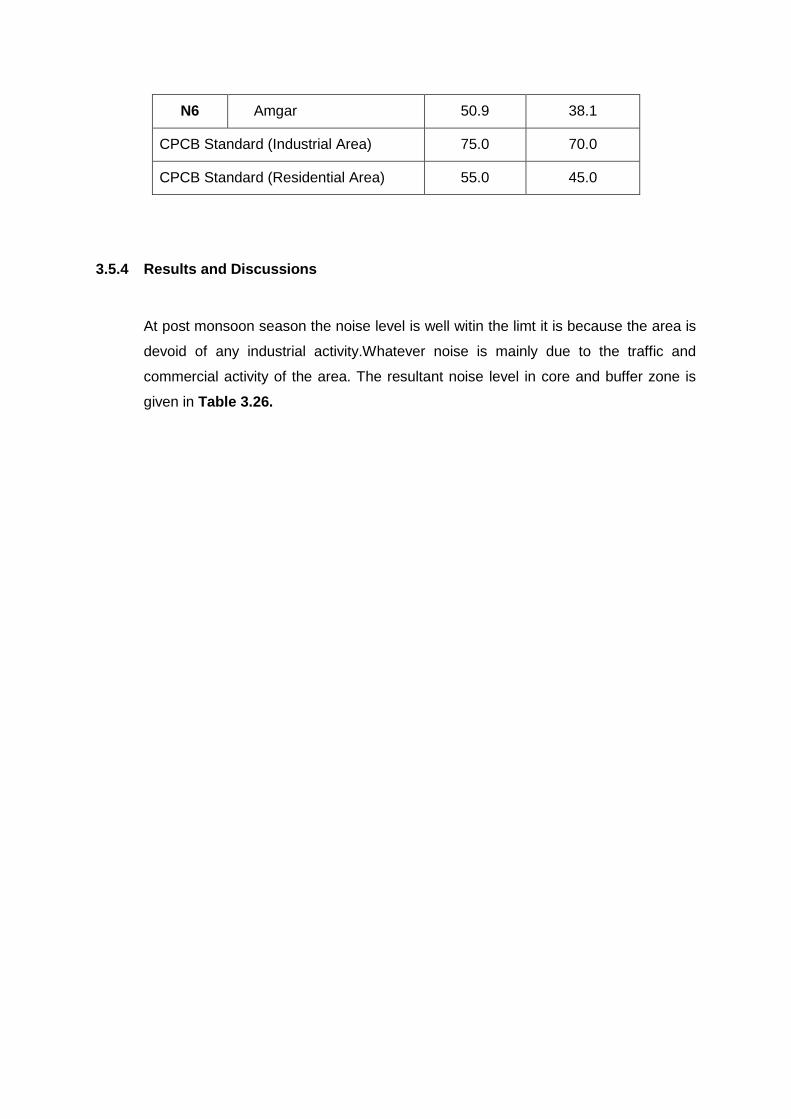
N6 Amgar 50.9 38.1
CPCB Standard (Industrial Area) 75.0 70.0
CPCB Standard (Residential Area) 55.0 45.0
3.5.4 Results and Discussions
At post monsoon season the noise level is well witin the limt it is because the area is
devoid of any industrial activity.Whatever noise is mainly due to the traffic and
commercial activity of the area. The resultant noise level in core and buffer zone is
given in Table 3.26.


3.6 Land Environment
This is a Mining Lease of mineral Limestone , Clay and Bauxite, near village- Kubri ,
Tahesail-Maihar, District- Satna, Madhya Pradesh over an area of 69.301 hectare. GO
has been issued in favour of Shri Sukhdeo Prasd goaynka, Station Road Katni vide deed
no 451108 made on 19 /08/2014. The Mining will be done in this proposed lease by
semi-mechanized open cast method. Proposed workings will be systematic by forming
proper benches. .
3.6.1 Land Use Pattern
For the proposed Mine, the total requirement of land is estimated as 69.03Ha, The total
land area (69.03 Ha) includes Agriculture land 30 Ha, Waste land 39.30 Ha. All the
land stated above are under different stages of acquisition.The core zone land use is
given below;
Fig 3.7 Core zone land use
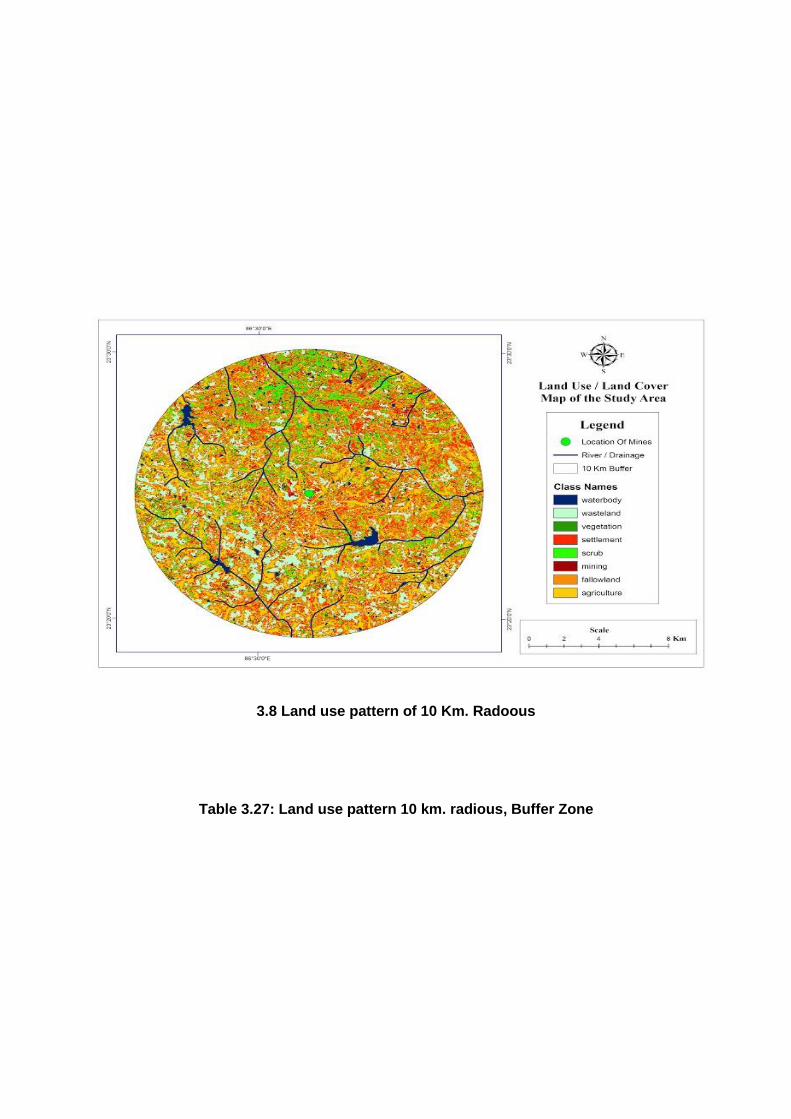
3.8 Land use pattern of 10 Km. Radoous
Table 3.27: Land use pattern 10 km. radious, Buffer Zone
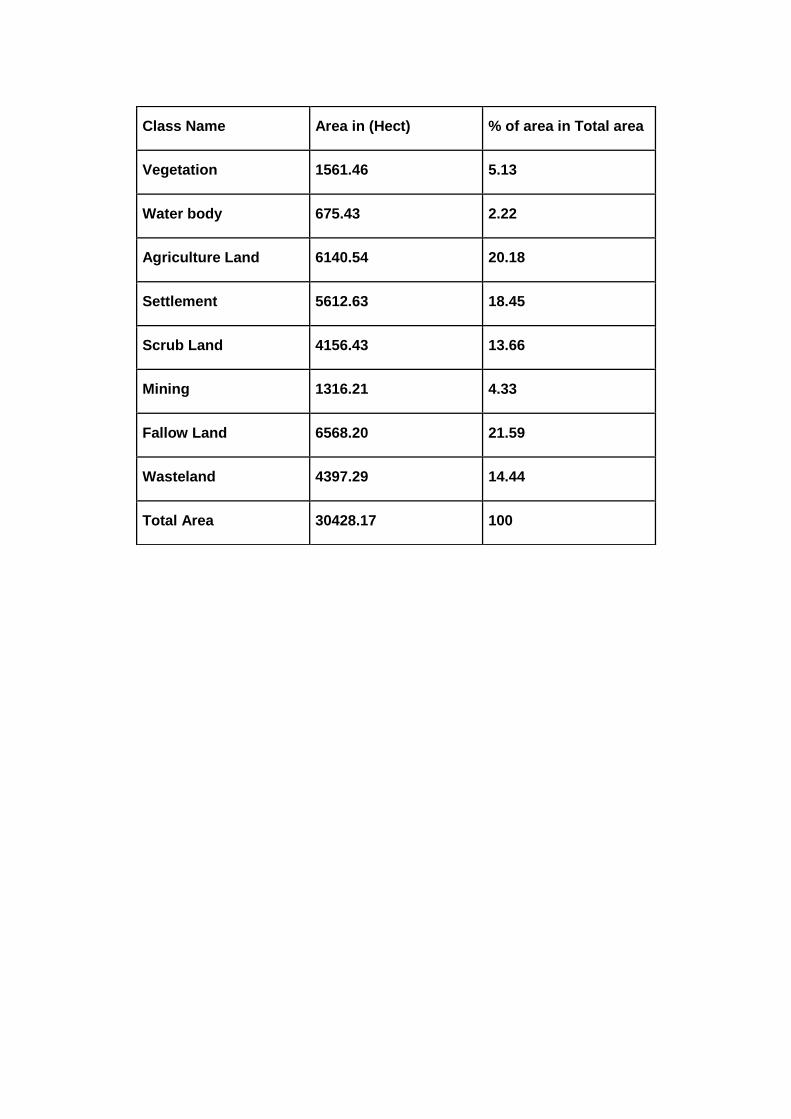
Class Name Area in (Hect) % of area in Total area
Vegetation 1561.46 5.13
Water body 675.43 2.22
Agriculture Land 6140.54 20.18
Settlement 5612.63 18.45
Scrub Land 4156.43 13.66
Mining 1316.21 4.33
Fallow Land 6568.20 21.59
Wasteland 4397.29 14.44
Total Area 30428.17 100
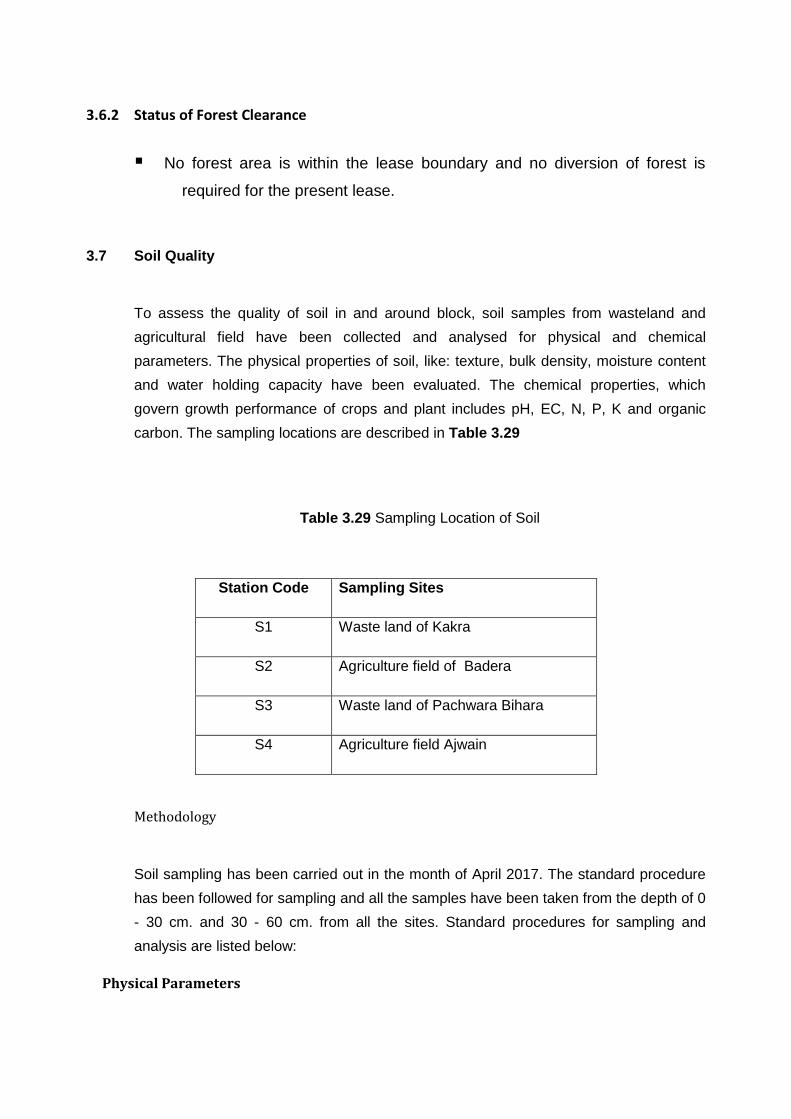
3.6.2 Status of Forest Clearance
▪ No forest area is within the lease boundary and no diversion of forest is
required for the present lease.
3.7 Soil Quality
To assess the quality of soil in and around block, soil samples from wasteland and
agricultural field have been collected and analysed for physical and chemical
parameters. The physical properties of soil, like: texture, bulk density, moisture content
and water holding capacity have been evaluated. The chemical properties, which
govern growth performance of crops and plant includes pH, EC, N, P, K and organic
carbon. The sampling locations are described in Table 3.29
Table 3.29 Sampling Location of Soil
Station Code Sampling Sites
S1 Waste land of Kakra
S2 Agriculture field of Badera
S3 Waste land of Pachwara Bihara
S4 Agriculture field Ajwain
Methodology
Soil sampling has been carried out in the month of April 2017. The standard procedure
has been followed for sampling and all the samples have been taken from the depth of 0
- 30 cm. and 30 - 60 cm. from all the sites. Standard procedures for sampling and
analysis are listed below:
Physical Parameters

Colour Visual Observation
Natural moisture content (%) IS : 2720 Part II (1973)
Bulk density (g/cm3) IS : 2720 Part XXIX (1975)
Particle size analysis IS : 2720 Part II (1973)
Water holding capacity
Chemical Properties
pH IS : 2720 Part XXIX (1973)
Electrical Conductivity (mmoh/cm) IS : 2720 Part XIX (1977)
Organic Carbon (%) IS : 2720 Part XXII (1972)
Available N (Kg/ha) Micro Kjeldhal method (Jackson1958)
Available P (Kg/ha) Olsen method (1954)
Available K (Kg/ha) Ammonium acetate extractable measured
by ASS
Results and Discussions
Four samples comprising of wasteland, agricultural field and forest area have been
analysed for their physico–chemical properties. The results of analysis are presented in
Table 3.30.
Analysis of soil samples reveals that there is no wide variation in the natural material.
Particle size analysis shows that the texture of the soil is of sandy loam in nature. The
bulk density was found to vary from 1.40 to 1.62 g/cm3 showing compactness while
moisture content ranged from 1.9 % to 3.9 %. All the samples showed moderate water
holding capacity ranging from 23.66 to 30.21 %. Further soil of agricultural field was
found slightly acidic in nature while the wasteland and forest soils samples shows
neutral pH. Electrical conductivity measurement of the samples clearly suggests that
total soluble solid concentration is in the normal range and all the values are found
below 1 mmoh/cm the values of EC ranged from 0.19 to o.30 mmoh/cm.

The values of organic carbon of all samples were found to be lower. As compared to
other site, forest soil shows slightly high carbon content. Available nitrogen was found to
be lower ranging from 219 to 288 Kg/ha except in case of forest soil where the value
represents medium range. Available phosphorus and potassium have been found in
medium range. The values are compared with rating chart is given in Table 3.31 and
relation between conductivity and total soluble solid content is given in Table 3.32.

Table 3.30: Physico–Chemical Properties of Soil during November2008
Parameters
Sampling Locations
S1 S2 S3 S4
0-30
cm
30-60
cm
0-30
cm
30-60
cm
0-30
cm
30-60
cm
0-30
cm
30-60
cm
Physical Parameters
Sand (%) 67.0 64.2 66.3 61.0 66.1 60.3 61.4 57.4
Silt (%) 19.2 21.4 20.5 22.7 19.5 22.6 21.4 26.1
Clay (%) 12.6 10.9 13.2 11.4 13.7 15.7 12.8 14.5
Texture Sandy
loam
Sandy
loam
Sandy
loam
Sandy
loam
Sandy
loam
Sandy
loam
Sandy
loam
Sandy
loam
Bulk density
(g/cm3) 1.53 1.41 1.46 1.56 1.40 1.62 1.47 1.51
Moisture
content (%) 2.5 3.9 2.2 3.2 1.9 3.1 2.5 3.3
Water holding
capacity (%) 23.66 26.41 28.21 29.51 24.36 28.62 25.14 30.21
Chemical Parameters
pH 6.1 6.5 6.4 6.7 6.3 7.2 6.4 6.9
EC (m moh/
cm) 0.22 0.27 0.24 0.29 0.19 0.20 0.23 0.30
Organic Carbon
(%) 0.30 0.34 0.27 0.29 0.19 0.28 0.21 0.28
Available N
(Kg/ha) 245 237 243 229 233 219 288 269
Available P
(Kg/ha) 25 19 19 22 17 21 20 25
Available K
(Kg/ha) 131 138 144 142 130 131 139 140
S1 - Waste land of Litipara, S2 - Agriculture field of Bishunpur,
S3 - Waste land of Pachwara Phharitoal; S4 - Agriculture field Baghapara.
Table 3.321 : Rating Chart for Soil Test Value in India
S. N. Parameter Unit Low Medium High
1. Organic % <0.5 0.5 - 0.75 >0.75
2. Available N Kg/ha <280 280 – 560 >560
3. Available P Kg/ha <10 10 – 25 >25
4 Available K Kg/ha <120 120- 280 >280
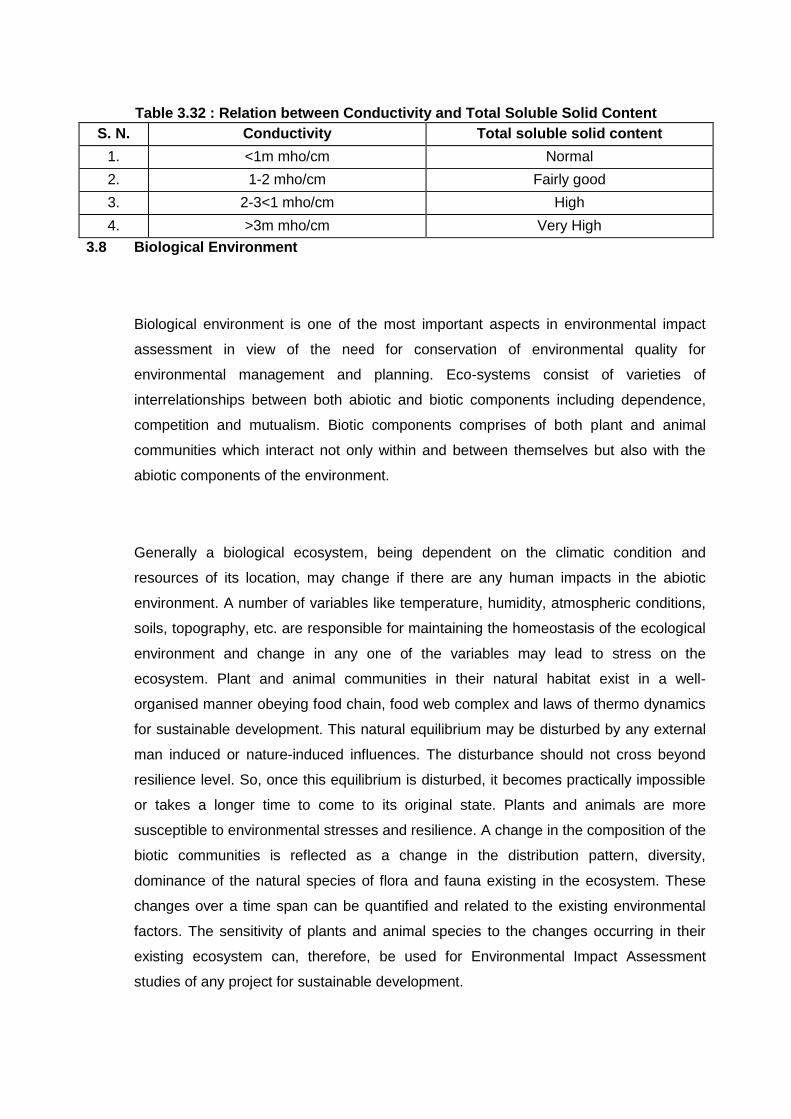
Table 3.32 : Relation between Conductivity and Total Soluble Solid Content
S. N. Conductivity Total soluble solid content
1. <1m mho/cm Normal
2. 1-2 mho/cm Fairly good
3. 2-3<1 mho/cm High
4. >3m mho/cm Very High
3.8 Biological Environment
Biological environment is one of the most important aspects in environmental impact
assessment in view of the need for conservation of environmental quality for
environmental management and planning. Eco-systems consist of varieties of
interrelationships between both abiotic and biotic components including dependence,
competition and mutualism. Biotic components comprises of both plant and animal
communities which interact not only within and between themselves but also with the
abiotic components of the environment.
Generally a biological ecosystem, being dependent on the climatic condition and
resources of its location, may change if there are any human impacts in the abiotic
environment. A number of variables like temperature, humidity, atmospheric conditions,
soils, topography, etc. are responsible for maintaining the homeostasis of the ecological
environment and change in any one of the variables may lead to stress on the
ecosystem. Plant and animal communities in their natural habitat exist in a well-
organised manner obeying food chain, food web complex and laws of thermo dynamics
for sustainable development. This natural equilibrium may be disturbed by any external
man induced or nature-induced influences. The disturbance should not cross beyond
resilience level. So, once this equilibrium is disturbed, it becomes practically impossible
or takes a longer time to come to its original state. Plants and animals are more
susceptible to environmental stresses and resilience. A change in the composition of the
biotic communities is reflected as a change in the distribution pattern, diversity,
dominance of the natural species of flora and fauna existing in the ecosystem. These
changes over a time span can be quantified and related to the existing environmental
factors. The sensitivity of plants and animal species to the changes occurring in their
existing ecosystem can, therefore, be used for Environmental Impact Assessment
studies of any project for sustainable development.
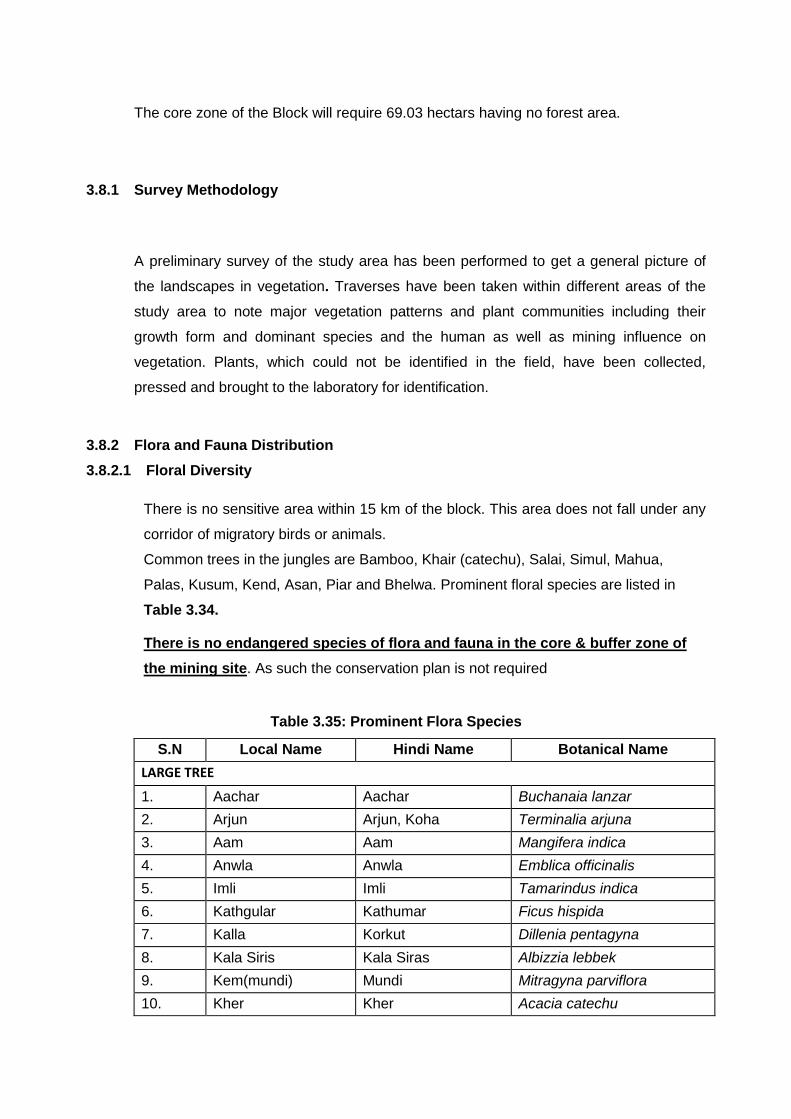
The core zone of the Block will require 69.03 hectars having no forest area.
3.8.1 Survey Methodology
A preliminary survey of the study area has been performed to get a general picture of
the landscapes in vegetation. Traverses have been taken within different areas of the
study area to note major vegetation patterns and plant communities including their
growth form and dominant species and the human as well as mining influence on
vegetation. Plants, which could not be identified in the field, have been collected,
pressed and brought to the laboratory for identification.
3.8.2 Flora and Fauna Distribution
3.8.2.1 Floral Diversity
There is no sensitive area within 15 km of the block. This area does not fall under any
corridor of migratory birds or animals.
Common trees in the jungles are Bamboo, Khair (catechu), Salai, Simul, Mahua,
Palas, Kusum, Kend, Asan, Piar and Bhelwa. Prominent floral species are listed in
Table 3.34.
There is no endangered species of flora and fauna in the core & buffer zone of
the mining site. As such the conservation plan is not required
Table 3.35: Prominent Flora Species
S.N Local Name Hindi Name Botanical Name
LARGE TREE
1. Aachar Aachar Buchanaia lanzar
2. Arjun Arjun, Koha Terminalia arjuna
3. Aam Aam Mangifera indica
4. Anwla Anwla Emblica officinalis
5. Imli Imli Tamarindus indica
6. Kathgular Kathumar Ficus hispida
7. Kalla Korkut Dillenia pentagyna
8. Kala Siris Kala Siras Albizzia lebbek
9. Kem(mundi) Mundi Mitragyna parviflora
10. Kher Kher Acacia catechu
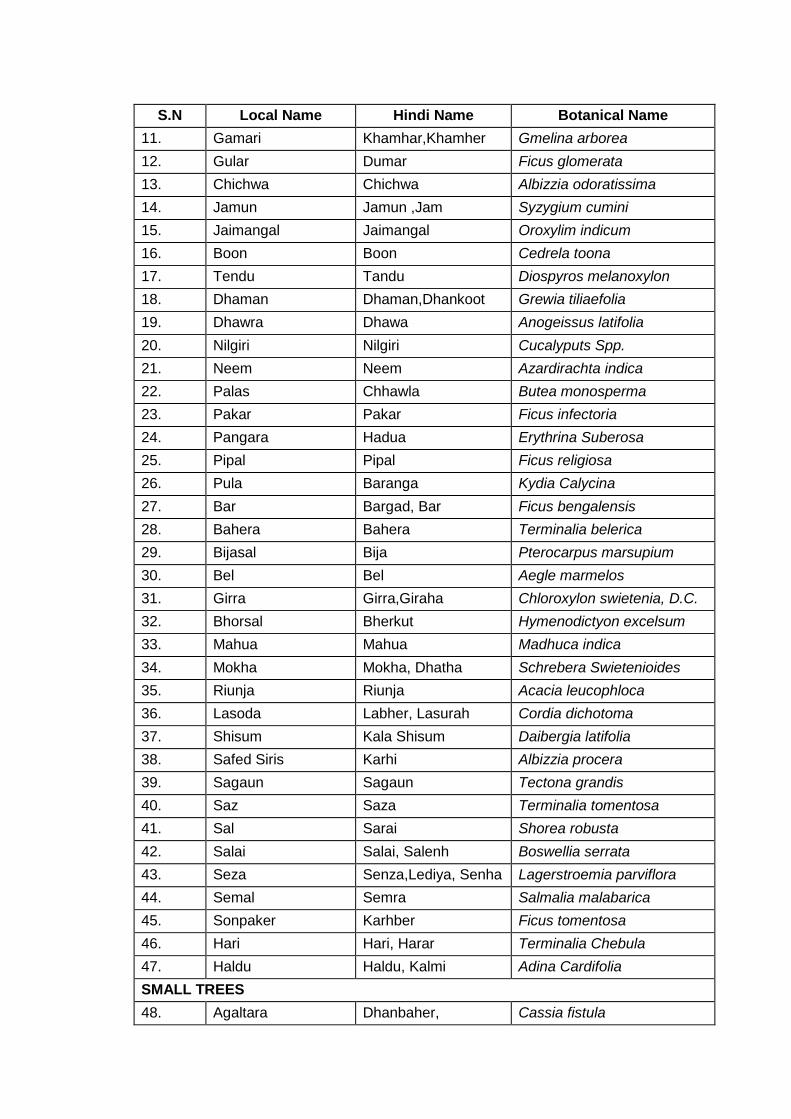
S.N Local Name Hindi Name Botanical Name
11. Gamari Khamhar,Khamher Gmelina arborea
12. Gular Dumar Ficus glomerata
13. Chichwa Chichwa Albizzia odoratissima
14. Jamun Jamun ,Jam Syzygium cumini
15. Jaimangal Jaimangal Oroxylim indicum
16. Boon Boon Cedrela toona
17. Tendu Tandu Diospyros melanoxylon
18. Dhaman Dhaman,Dhankoot Grewia tiliaefolia
19. Dhawra Dhawa Anogeissus latifolia
20. Nilgiri Nilgiri Cucalyputs Spp.
21. Neem Neem Azardirachta indica
22. Palas Chhawla Butea monosperma
23. Pakar Pakar Ficus infectoria
24. Pangara Hadua Erythrina Suberosa
25. Pipal Pipal Ficus religiosa
26. Pula Baranga Kydia Calycina
27. Bar Bargad, Bar Ficus bengalensis
28. Bahera Bahera Terminalia belerica
29. Bijasal Bija Pterocarpus marsupium
30. Bel Bel Aegle marmelos
31. Girra Girra,Giraha Chloroxylon swietenia, D.C.
32. Bhorsal Bherkut Hymenodictyon excelsum
33. Mahua Mahua Madhuca indica
34. Mokha Mokha, Dhatha Schrebera Swietenioides
35. Riunja Riunja Acacia leucophloca
36. Lasoda Labher, Lasurah Cordia dichotoma
37. Shisum Kala Shisum Daibergia latifolia
38. Safed Siris Karhi Albizzia procera
39. Sagaun Sagaun Tectona grandis
40. Saz Saza Terminalia tomentosa
41. Sal Sarai Shorea robusta
42. Salai Salai, Salenh Boswellia serrata
43. Seza Senza,Lediya, Senha Lagerstroemia parviflora
44. Semal Semra Salmalia malabarica
45. Sonpaker Karhber Ficus tomentosa
46. Hari Hari, Harar Terminalia Chebula
47. Haldu Haldu, Kalmi Adina Cardifolia
SMALL TREES
48. Agaltara Dhanbaher, Cassia fistula

S.N Local Name Hindi Name Botanical Name
Karkacha
49. Kachnar Kachnar Bauhinia variegata
50. Kathjamun Kathjamun Syxyglum heyneacum
51. Keblar Keblar Bauhinia purpuraca
52. Galgal Gabandi Cochlospermum religionsum
53. Gilchi Barri Casearia elliptica
54. Ghont Ghonthar Zizyphus xylopyra
55. Dikamali Dikamali,Paprail Gardenia resinifera
56. Tilwan Tilwan Wendiandia excerta
57. Ber Ber Zizophus jujuba
58. Bhilma Bhilma Scenecarpus anacardium
59. Mainphal Mainhar Randla dumetorum
60. Roli Sinduri, Sheri Mallotus philippinensis
SHRUBS AND UNDER SHRUBS
61. Akol Akola Alangium Salvifolium
62. Adusha Adusha Adhatoda vasica
63. Aapamarg Chirchita Achyranthes aspera
64. Arandi Arandi Ricinus Communis
65. Aak Aak Calotropis gigantea
66. Karonda Karonda Carissa opaca
67. Kurchi Kurchi, Keria Holarrhena antidysentrica
68. Kela jangli Jangli kela Musa sapiertum
69. Khurshi Khurshi Grewia rothii
70. Khareta Jangli Mehndi Dodonea viscosa
71. Gursakri -- Grewia hirsute
72. Gokhru Gokhru Tribulus terrestris
73. Godharu -- Xanthium strumarium
74. Jodhrali Wanmasuri Antidesma ghassembilla
75. Jharneri Jhakheri Zizyphus nummularia
76. Jhau Jharu, Jhau Tararix dioica
77. Tulsi Tulsi Ocimum sanctum
78. Thuar Thuar Euphorbia nerifolia
79. Nirguri Nirguri Vitex negundo
80. Nil Birhul Indigofera pulchella
81. Panar Chrot, Chkora Cassia tora
82. Baibirang Baibirang Embelia robusta
83. Besharam Besharam Ipomoea pes-caparae
84. Bhatkaya Bhatkatya Solanum nigrum
85 Bhringraj Dhamira Eclipta prostrata
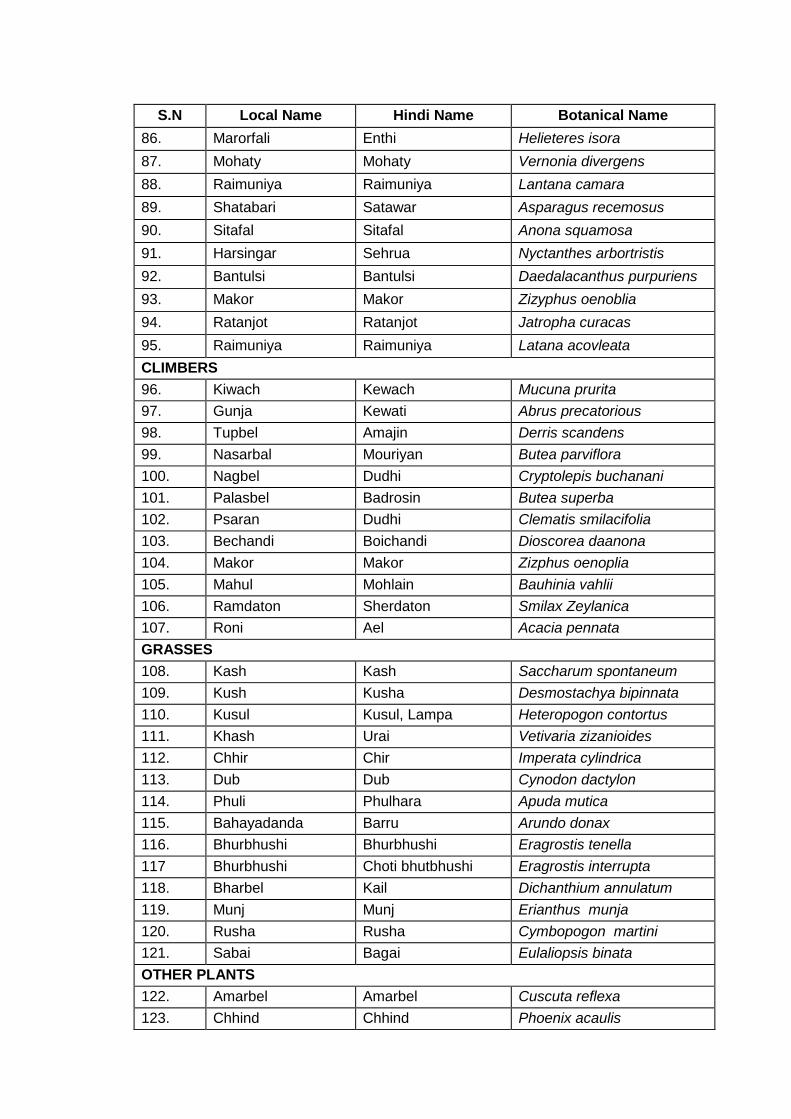
S.N Local Name Hindi Name Botanical Name
86. Marorfali Enthi Helieteres isora
87. Mohaty Mohaty Vernonia divergens
88. Raimuniya Raimuniya Lantana camara
89. Shatabari Satawar Asparagus recemosus
90. Sitafal Sitafal Anona squamosa
91. Harsingar Sehrua Nyctanthes arbortristis
92. Bantulsi Bantulsi Daedalacanthus purpuriens
93. Makor Makor Zizyphus oenoblia
94. Ratanjot Ratanjot Jatropha curacas
95. Raimuniya Raimuniya Latana acovleata
CLIMBERS
96. Kiwach Kewach Mucuna prurita
97. Gunja Kewati Abrus precatorious
98. Tupbel Amajin Derris scandens
99. Nasarbal Mouriyan Butea parviflora
100. Nagbel Dudhi Cryptolepis buchanani
101. Palasbel Badrosin Butea superba
102. Psaran Dudhi Clematis smilacifolia
103. Bechandi Boichandi Dioscorea daanona
104. Makor Makor Zizphus oenoplia
105. Mahul Mohlain Bauhinia vahlii
106. Ramdaton Sherdaton Smilax Zeylanica
107. Roni Ael Acacia pennata
GRASSES
108. Kash Kash Saccharum spontaneum
109. Kush Kusha Desmostachya bipinnata
110. Kusul Kusul, Lampa Heteropogon contortus
111. Khash Urai Vetivaria zizanioides
112. Chhir Chir Imperata cylindrica
113. Dub Dub Cynodon dactylon
114. Phuli Phulhara Apuda mutica
115. Bahayadanda Barru Arundo donax
116. Bhurbhushi Bhurbhushi Eragrostis tenella
117 Bhurbhushi Choti bhutbhushi Eragrostis interrupta
118. Bharbel Kail Dichanthium annulatum
119. Munj Munj Erianthus munja
120. Rusha Rusha Cymbopogon martini
121. Sabai Bagai Eulaliopsis binata
OTHER PLANTS
122. Amarbel Amarbel Cuscuta reflexa
123. Chhind Chhind Phoenix acaulis
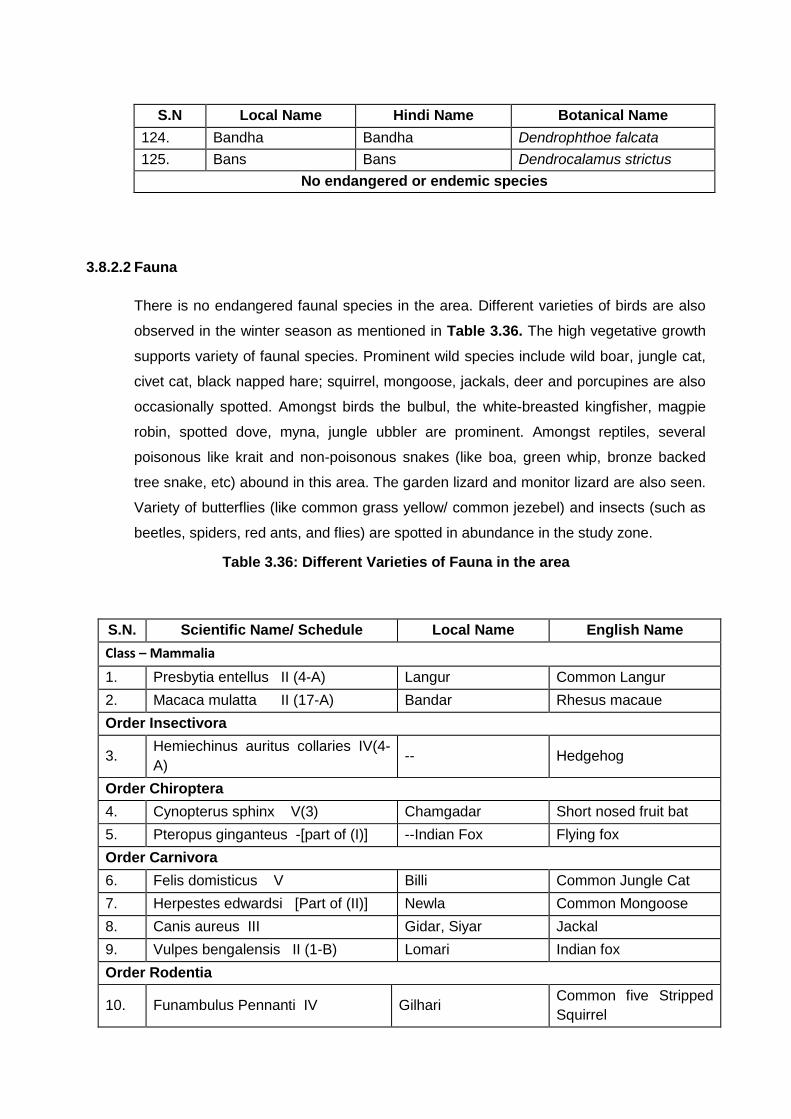
S.N Local Name Hindi Name Botanical Name
124. Bandha Bandha Dendrophthoe falcata
125. Bans Bans Dendrocalamus strictus
No endangered or endemic species
3.8.2.2 Fauna
There is no endangered faunal species in the area. Different varieties of birds are also
observed in the winter season as mentioned in Table 3.36. The high vegetative growth
supports variety of faunal species. Prominent wild species include wild boar, jungle cat,
civet cat, black napped hare; squirrel, mongoose, jackals, deer and porcupines are also
occasionally spotted. Amongst birds the bulbul, the white-breasted kingfisher, magpie
robin, spotted dove, myna, jungle ubbler are prominent. Amongst reptiles, several
poisonous like krait and non-poisonous snakes (like boa, green whip, bronze backed
tree snake, etc) abound in this area. The garden lizard and monitor lizard are also seen.
Variety of butterflies (like common grass yellow/ common jezebel) and insects (such as
beetles, spiders, red ants, and flies) are spotted in abundance in the study zone.
Table 3.36: Different Varieties of Fauna in the area
S.N. Scientific Name/ Schedule Local Name English Name
Class – Mammalia
1. Presbytia entellus II (4-A) Langur Common Langur
2. Macaca mulatta II (17-A) Bandar Rhesus macaue
Order Insectivora
3. Hemiechinus auritus collaries IV(4-
A) -- Hedgehog
Order Chiroptera
4. Cynopterus sphinx V(3) Chamgadar Short nosed fruit bat
5. Pteropus ginganteus -[part of (I)] --Indian Fox Flying fox
Order Carnivora
6. Felis domisticus V Billi Common Jungle Cat
7. Herpestes edwardsi [Part of (II)] Newla Common Mongoose
8. Canis aureus III Gidar, Siyar Jackal
9. Vulpes bengalensis II (1-B) Lomari Indian fox
Order Rodentia
10. Funambulus Pennanti IV Gilhari Common five Stripped
Squirrel
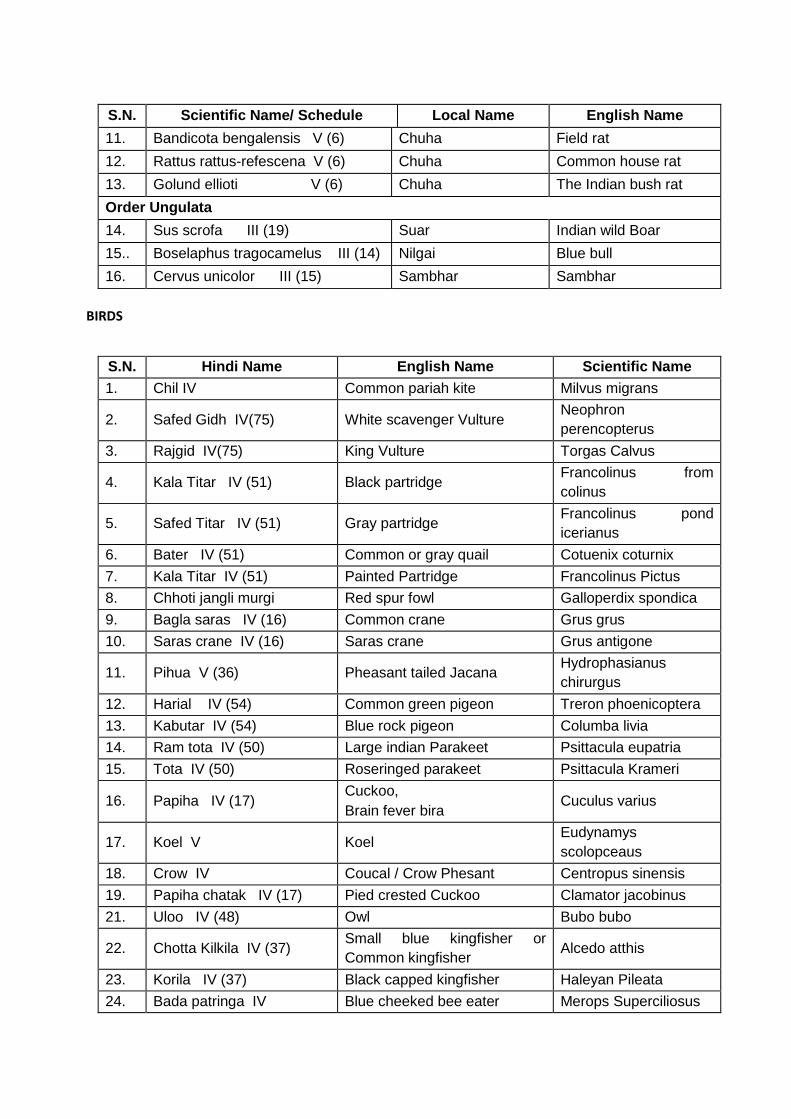
S.N. Scientific Name/ Schedule Local Name English Name
11. Bandicota bengalensis V (6) Chuha Field rat
12. Rattus rattus-refescena V (6) Chuha Common house rat
13. Golund ellioti V (6) Chuha The Indian bush rat
Order Ungulata
14. Sus scrofa III (19) Suar Indian wild Boar
15.. Boselaphus tragocamelus III (14) Nilgai Blue bull
16. Cervus unicolor III (15) Sambhar Sambhar
BIRDS
S.N. Hindi Name English Name Scientific Name
1. Chil IV Common pariah kite Milvus migrans
2. Safed Gidh IV(75) White scavenger Vulture Neophron
perencopterus
3. Rajgid IV(75) King Vulture Torgas Calvus
4. Kala Titar IV (51) Black partridge Francolinus from
colinus
5. Safed Titar IV (51) Gray partridge Francolinus pond
icerianus
6. Bater IV (51) Common or gray quail Cotuenix coturnix
7. Kala Titar IV (51) Painted Partridge Francolinus Pictus
8. Chhoti jangli murgi Red spur fowl Galloperdix spondica
9. Bagla saras IV (16) Common crane Grus grus
10. Saras crane IV (16) Saras crane Grus antigone
11. Pihua V (36) Pheasant tailed Jacana Hydrophasianus
chirurgus
12. Harial IV (54) Common green pigeon Treron phoenicoptera
13. Kabutar IV (54) Blue rock pigeon Columba livia
14. Ram tota IV (50) Large indian Parakeet Psittacula eupatria
15. Tota IV (50) Roseringed parakeet Psittacula Krameri
16. Papiha IV (17) Cuckoo,
Brain fever bira Cuculus varius
17. Koel V Koel Eudynamys
scolopceaus
18. Crow IV Coucal / Crow Phesant Centropus sinensis
19. Papiha chatak IV (17) Pied crested Cuckoo Clamator jacobinus
21. Uloo IV (48) Owl Bubo bubo
22. Chotta Kilkila IV (37) Small blue kingfisher or
Common kingfisher Alcedo atthis
23. Korila IV (37) Black capped kingfisher Haleyan Pileata
24. Bada patringa IV Blue cheeked bee eater Merops Superciliosus
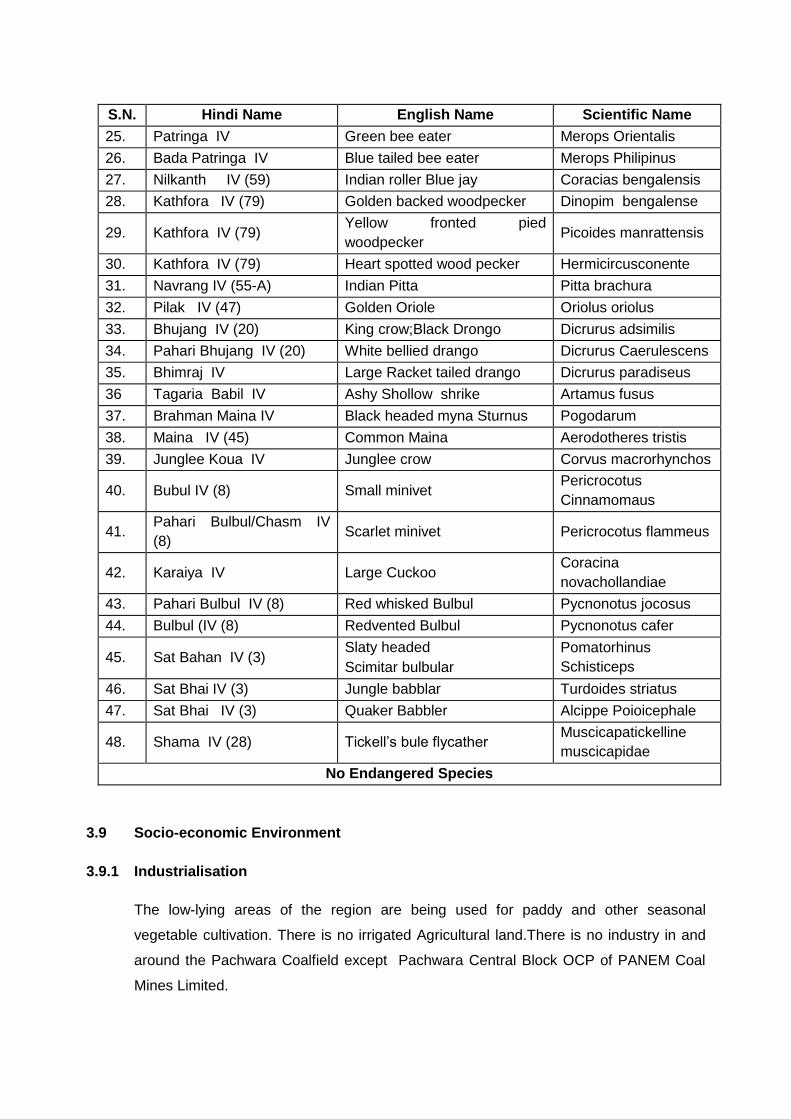
S.N. Hindi Name English Name Scientific Name
25. Patringa IV Green bee eater Merops Orientalis
26. Bada Patringa IV Blue tailed bee eater Merops Philipinus
27. Nilkanth IV (59) Indian roller Blue jay Coracias bengalensis
28. Kathfora IV (79) Golden backed woodpecker Dinopim bengalense
29. Kathfora IV (79) Yellow fronted pied
woodpecker Picoides manrattensis
30. Kathfora IV (79) Heart spotted wood pecker Hermicircusconente
31. Navrang IV (55-A) Indian Pitta Pitta brachura
32. Pilak IV (47) Golden Oriole Oriolus oriolus
33. Bhujang IV (20) King crow;Black Drongo Dicrurus adsimilis
34. Pahari Bhujang IV (20) White bellied drango Dicrurus Caerulescens
35. Bhimraj IV Large Racket tailed drango Dicrurus paradiseus
36 Tagaria Babil IV Ashy Shollow shrike Artamus fusus
37. Brahman Maina IV Black headed myna Sturnus Pogodarum
38. Maina IV (45) Common Maina Aerodotheres tristis
39. Junglee Koua IV Junglee crow Corvus macrorhynchos
40. Bubul IV (8) Small minivet Pericrocotus
Cinnamomaus
41. Pahari Bulbul/Chasm IV
(8) Scarlet minivet Pericrocotus flammeus
42. Karaiya IV Large Cuckoo Coracina
novachollandiae
43. Pahari Bulbul IV (8) Red whisked Bulbul Pycnonotus jocosus
44. Bulbul (IV (8) Redvented Bulbul Pycnonotus cafer
45. Sat Bahan IV (3) Slaty headed
Scimitar bulbular
Pomatorhinus
Schisticeps
46. Sat Bhai IV (3) Jungle babblar Turdoides striatus
47. Sat Bhai IV (3) Quaker Babbler Alcippe Poioicephale
48. Shama IV (28) Tickell’s bule flycather Muscicapatickelline
muscicapidae
No Endangered Species
3.9 Socio-economic Environment
3.9.1 Industrialisation
The low-lying areas of the region are being used for paddy and other seasonal
vegetable cultivation. There is no irrigated Agricultural land.There is no industry in and
around the Pachwara Coalfield except Pachwara Central Block OCP of PANEM Coal
Mines Limited.
3.9.2 Communication
Railway
The area is approachable by both rail and road. The Mahiar raiway nis about 10
km. The fall in the howrah Bombay line via Allahabad.
Road
This area is approachable from Mahiar by metalled road from Maihar as well as
from Kymore-Katni. The state highway is about 5 km.from the site
3.9.3 Trade and Commerce
Mahiar, Satna district is mainly important for agriculture. Mahiar is also the tourist place
because of ma sarda templeThe main commodity imported in the district consists of
Rice, Onion, green vegetables etc. within the district. The main markets are Maihar and
Satna,and Katni.
3.9.4 Electricity and Power
All HEMM proposed for this project, are diesel operated equipment. Hence, quarry
power requirement is only for quarry lighting and haul road lighting, besides catering to
the electrical load requirement for Workshop, Pumping and Colony.
3.9.5 Socio-Economic Profile
A field survey was conducted within 10 km radius of lease area. The parameter selected
under socio-economic component were demographic structure of the study are provision of
basic amenities, industries likely to come up in the study area, welfare facilities to be
provided by the project proponent etc.
Basic data pertaining to population, SC, ST, education facilities, literacy, basic amenities
and main workers, marginal workers, non-workers by sex etc., has been collected from
the census book, for all the villages and the urban area. Field survey has also been
carried out on different aspects of socio-economic dimension indicators to know the
people’s perception on the mining operations and to determine the quality of life of the
people living in the area. Various socio-economic dimensions and quality of life have
been discussed in the following sections.
3.9.5.1 Demographic Pattern
Population of different villages falling in the buffer zone of the is given in Table 3.37.
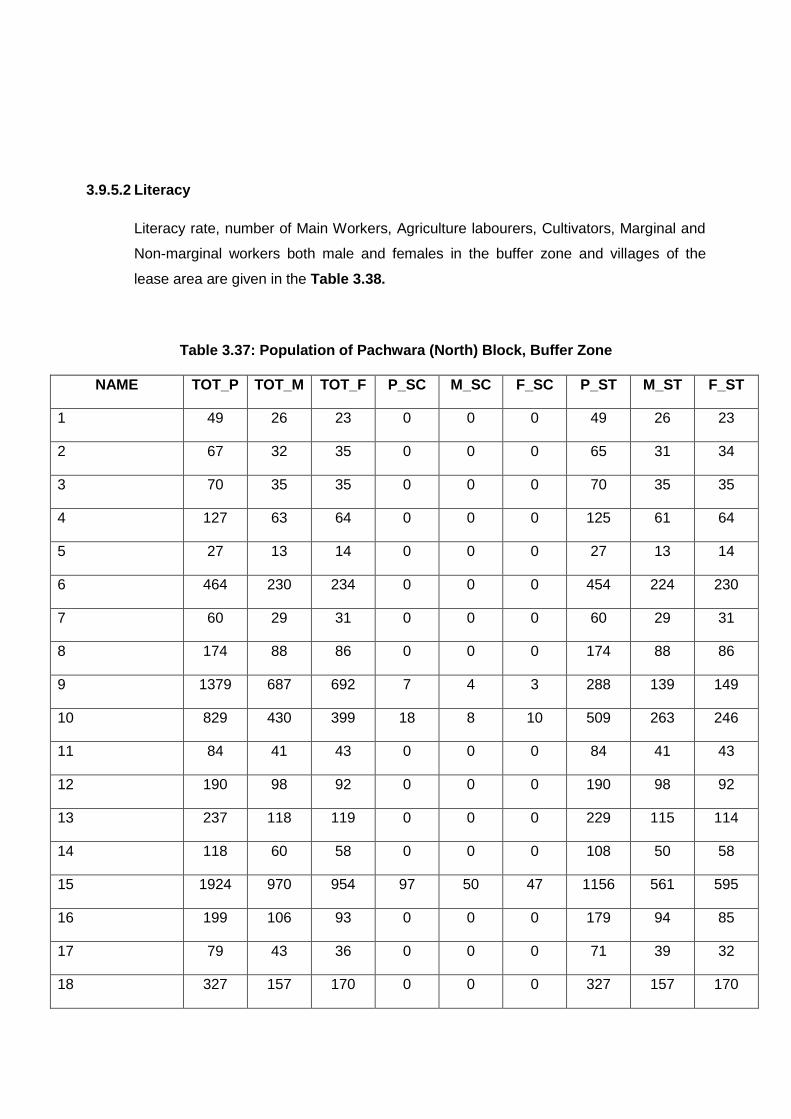
3.9.5.2 Literacy
Literacy rate, number of Main Workers, Agriculture labourers, Cultivators, Marginal and
Non-marginal workers both male and females in the buffer zone and villages of the
lease area are given in the Table 3.38.
Table 3.37: Population of Pachwara (North) Block, Buffer Zone
NAME TOT_P TOT_M TOT_F P_SC M_SC F_SC P_ST M_ST F_ST
1 49 26 23 0 0 0 49 26 23
2 67 32 35 0 0 0 65 31 34
3 70 35 35 0 0 0 70 35 35
4 127 63 64 0 0 0 125 61 64
5 27 13 14 0 0 0 27 13 14
6 464 230 234 0 0 0 454 224 230
7 60 29 31 0 0 0 60 29 31
8 174 88 86 0 0 0 174 88 86
9 1379 687 692 7 4 3 288 139 149
10 829 430 399 18 8 10 509 263 246
11 84 41 43 0 0 0 84 41 43
12 190 98 92 0 0 0 190 98 92
13 237 118 119 0 0 0 229 115 114
14 118 60 58 0 0 0 108 50 58
15 1924 970 954 97 50 47 1156 561 595
16 199 106 93 0 0 0 179 94 85
17 79 43 36 0 0 0 71 39 32
18 327 157 170 0 0 0 327 157 170
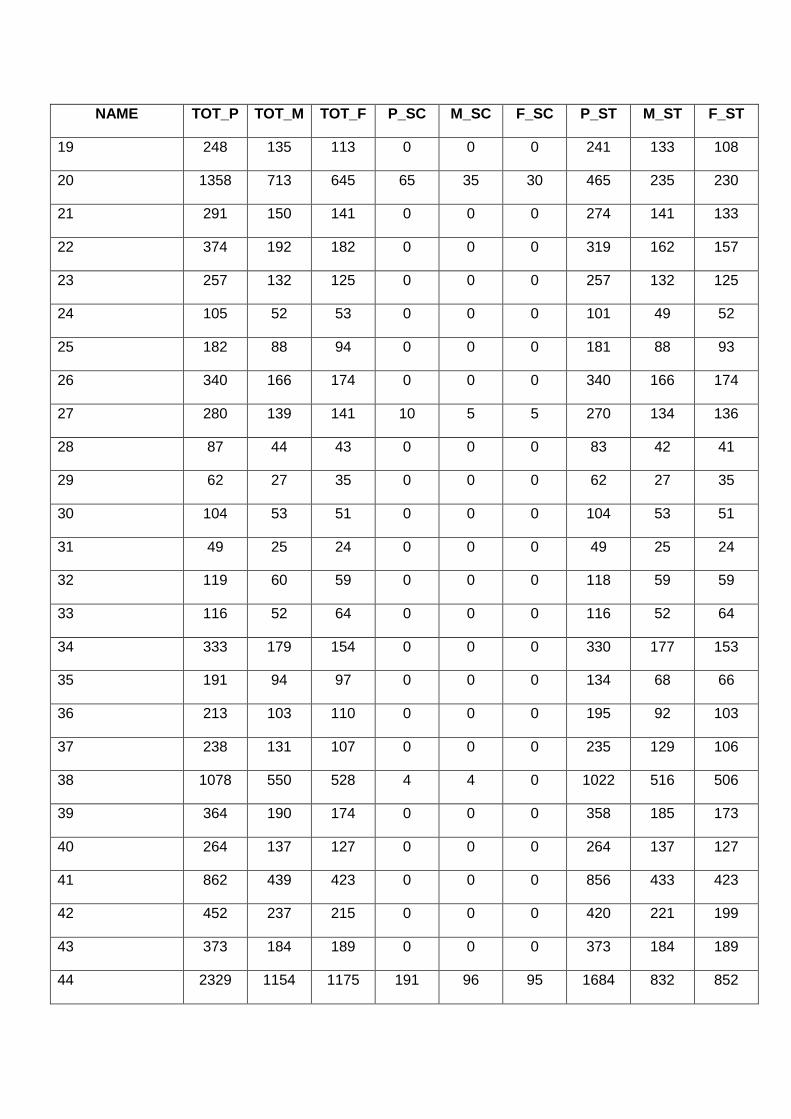
NAME TOT_P TOT_M TOT_F P_SC M_SC F_SC P_ST M_ST F_ST
19 248 135 113 0 0 0 241 133 108
20 1358 713 645 65 35 30 465 235 230
21 291 150 141 0 0 0 274 141 133
22 374 192 182 0 0 0 319 162 157
23 257 132 125 0 0 0 257 132 125
24 105 52 53 0 0 0 101 49 52
25 182 88 94 0 0 0 181 88 93
26 340 166 174 0 0 0 340 166 174
27 280 139 141 10 5 5 270 134 136
28 87 44 43 0 0 0 83 42 41
29 62 27 35 0 0 0 62 27 35
30 104 53 51 0 0 0 104 53 51
31 49 25 24 0 0 0 49 25 24
32 119 60 59 0 0 0 118 59 59
33 116 52 64 0 0 0 116 52 64
34 333 179 154 0 0 0 330 177 153
35 191 94 97 0 0 0 134 68 66
36 213 103 110 0 0 0 195 92 103
37 238 131 107 0 0 0 235 129 106
38 1078 550 528 4 4 0 1022 516 506
39 364 190 174 0 0 0 358 185 173
40 264 137 127 0 0 0 264 137 127
41 862 439 423 0 0 0 856 433 423
42 452 237 215 0 0 0 420 221 199
43 373 184 189 0 0 0 373 184 189
44 2329 1154 1175 191 96 95 1684 832 852
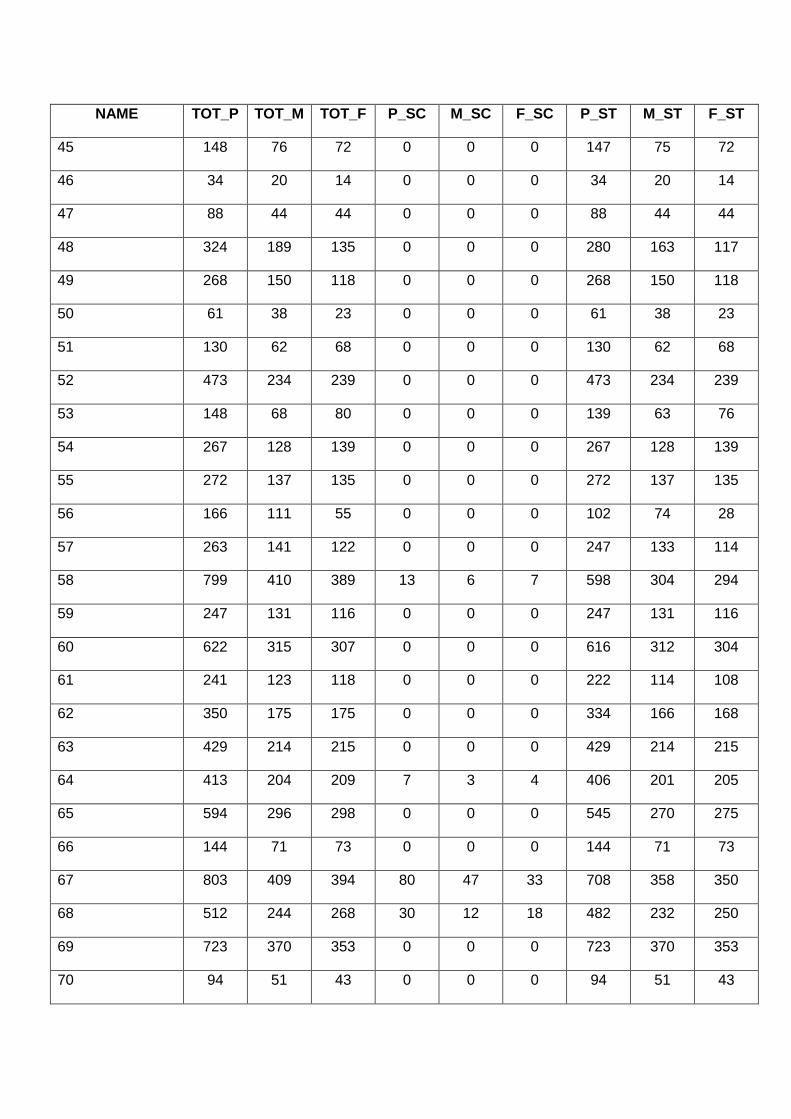
NAME TOT_P TOT_M TOT_F P_SC M_SC F_SC P_ST M_ST F_ST
45 148 76 72 0 0 0 147 75 72
46 34 20 14 0 0 0 34 20 14
47 88 44 44 0 0 0 88 44 44
48 324 189 135 0 0 0 280 163 117
49 268 150 118 0 0 0 268 150 118
50 61 38 23 0 0 0 61 38 23
51 130 62 68 0 0 0 130 62 68
52 473 234 239 0 0 0 473 234 239
53 148 68 80 0 0 0 139 63 76
54 267 128 139 0 0 0 267 128 139
55 272 137 135 0 0 0 272 137 135
56 166 111 55 0 0 0 102 74 28
57 263 141 122 0 0 0 247 133 114
58 799 410 389 13 6 7 598 304 294
59 247 131 116 0 0 0 247 131 116
60 622 315 307 0 0 0 616 312 304
61 241 123 118 0 0 0 222 114 108
62 350 175 175 0 0 0 334 166 168
63 429 214 215 0 0 0 429 214 215
64 413 204 209 7 3 4 406 201 205
65 594 296 298 0 0 0 545 270 275
66 144 71 73 0 0 0 144 71 73
67 803 409 394 80 47 33 708 358 350
68 512 244 268 30 12 18 482 232 250
69 723 370 353 0 0 0 723 370 353
70 94 51 43 0 0 0 94 51 43
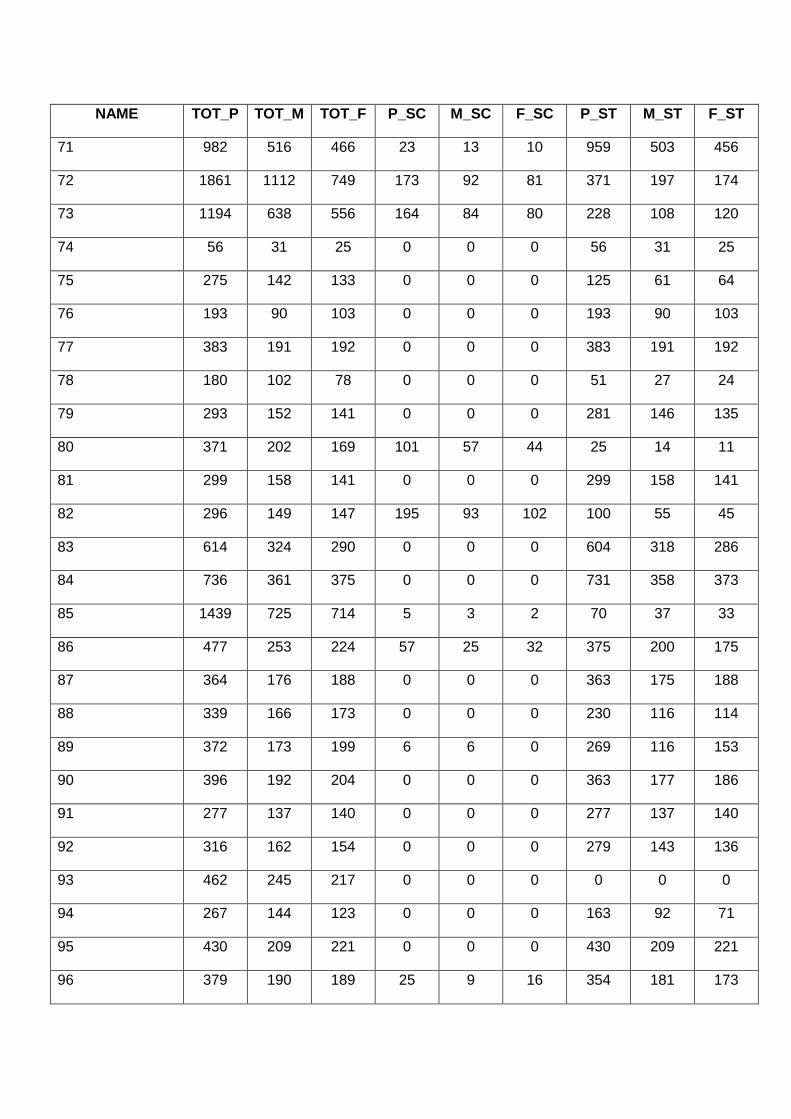
NAME TOT_P TOT_M TOT_F P_SC M_SC F_SC P_ST M_ST F_ST
71 982 516 466 23 13 10 959 503 456
72 1861 1112 749 173 92 81 371 197 174
73 1194 638 556 164 84 80 228 108 120
74 56 31 25 0 0 0 56 31 25
75 275 142 133 0 0 0 125 61 64
76 193 90 103 0 0 0 193 90 103
77 383 191 192 0 0 0 383 191 192
78 180 102 78 0 0 0 51 27 24
79 293 152 141 0 0 0 281 146 135
80 371 202 169 101 57 44 25 14 11
81 299 158 141 0 0 0 299 158 141
82 296 149 147 195 93 102 100 55 45
83 614 324 290 0 0 0 604 318 286
84 736 361 375 0 0 0 731 358 373
85 1439 725 714 5 3 2 70 37 33
86 477 253 224 57 25 32 375 200 175
87 364 176 188 0 0 0 363 175 188
88 339 166 173 0 0 0 230 116 114
89 372 173 199 6 6 0 269 116 153
90 396 192 204 0 0 0 363 177 186
91 277 137 140 0 0 0 277 137 140
92 316 162 154 0 0 0 279 143 136
93 462 245 217 0 0 0 0 0 0
94 267 144 123 0 0 0 163 92 71
95 430 209 221 0 0 0 430 209 221
96 379 190 189 25 9 16 354 181 173
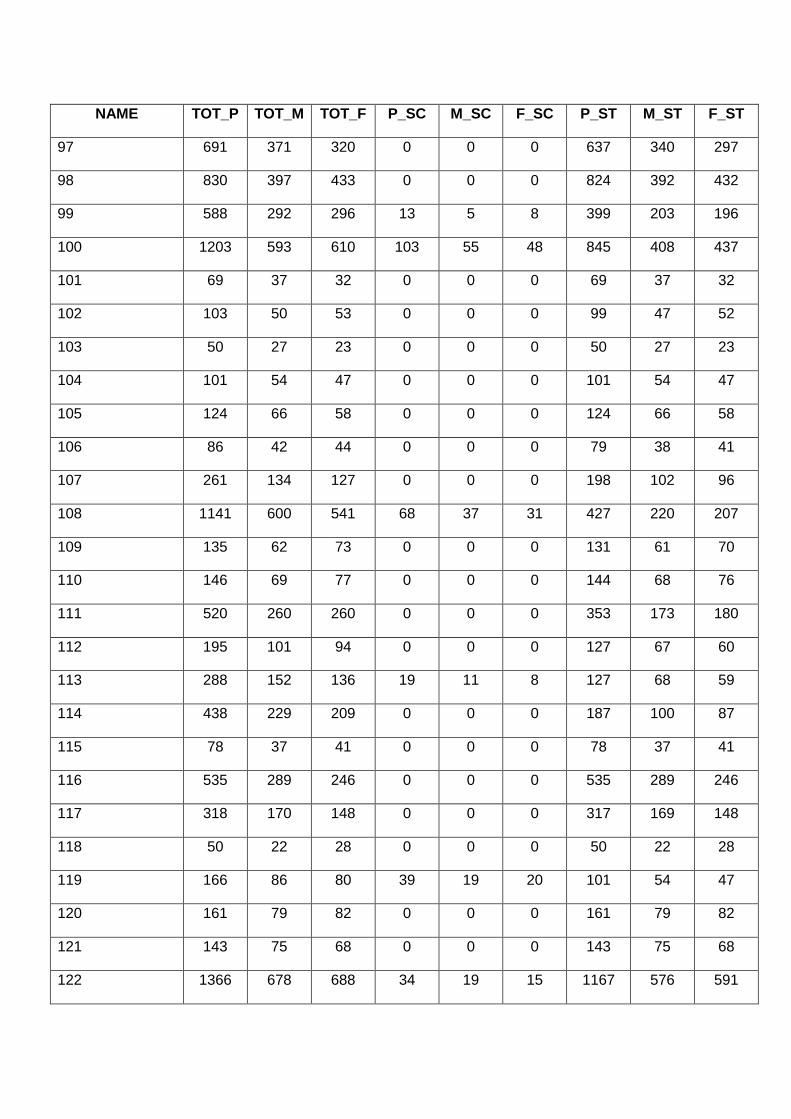
NAME TOT_P TOT_M TOT_F P_SC M_SC F_SC P_ST M_ST F_ST
97 691 371 320 0 0 0 637 340 297
98 830 397 433 0 0 0 824 392 432
99 588 292 296 13 5 8 399 203 196
100 1203 593 610 103 55 48 845 408 437
101 69 37 32 0 0 0 69 37 32
102 103 50 53 0 0 0 99 47 52
103 50 27 23 0 0 0 50 27 23
104 101 54 47 0 0 0 101 54 47
105 124 66 58 0 0 0 124 66 58
106 86 42 44 0 0 0 79 38 41
107 261 134 127 0 0 0 198 102 96
108 1141 600 541 68 37 31 427 220 207
109 135 62 73 0 0 0 131 61 70
110 146 69 77 0 0 0 144 68 76
111 520 260 260 0 0 0 353 173 180
112 195 101 94 0 0 0 127 67 60
113 288 152 136 19 11 8 127 68 59
114 438 229 209 0 0 0 187 100 87
115 78 37 41 0 0 0 78 37 41
116 535 289 246 0 0 0 535 289 246
117 318 170 148 0 0 0 317 169 148
118 50 22 28 0 0 0 50 22 28
119 166 86 80 39 19 20 101 54 47
120 161 79 82 0 0 0 161 79 82
121 143 75 68 0 0 0 143 75 68
122 1366 678 688 34 19 15 1167 576 591

NAME TOT_P TOT_M TOT_F P_SC M_SC F_SC P_ST M_ST F_ST
123 360 196 164 16 7 9 344 189 155
124 427 235 192 27 16 11 354 191 163

Table 3.38: Literacy, Total Main Worker, Cultivators Agricultural, Marginal And Non-Marginal Of the area
Village Category Total population Literate rate Total Main Worker Cultivator MarginalWorker
Male Female Male Female Male Female Male Female
1 Rural 49 11 5 15 1 15 1 0 1
2 Rural 67 5 3 0 0 0 0 12 13
3 Rural 70 3 0 18 16 14 7 1 1
4 Rural 127 7 2 29 21 29 21 7 11
5 Rural 27 1 0 8 0 5 0 0 6
6 Rural 464 22 2 128 112 79 71 9 21
7 Rural 60 4 8 13 14 13 14 2 2
8 Rural 174 0 0 48 12 45 12 8 23
9 Rural 1379 315 139 305 41 91 6 18 139
10 Rural 829 110 37 227 37 98 12 4 167
11 Rural 84 5 4 20 20 20 20 0 2
12 Rural 190 3 1 59 52 59 52 0 0
13 Rural 237 5 1 51 3 49 3 0 0
14 Rural 118 25 11 22 9 22 9 4 15
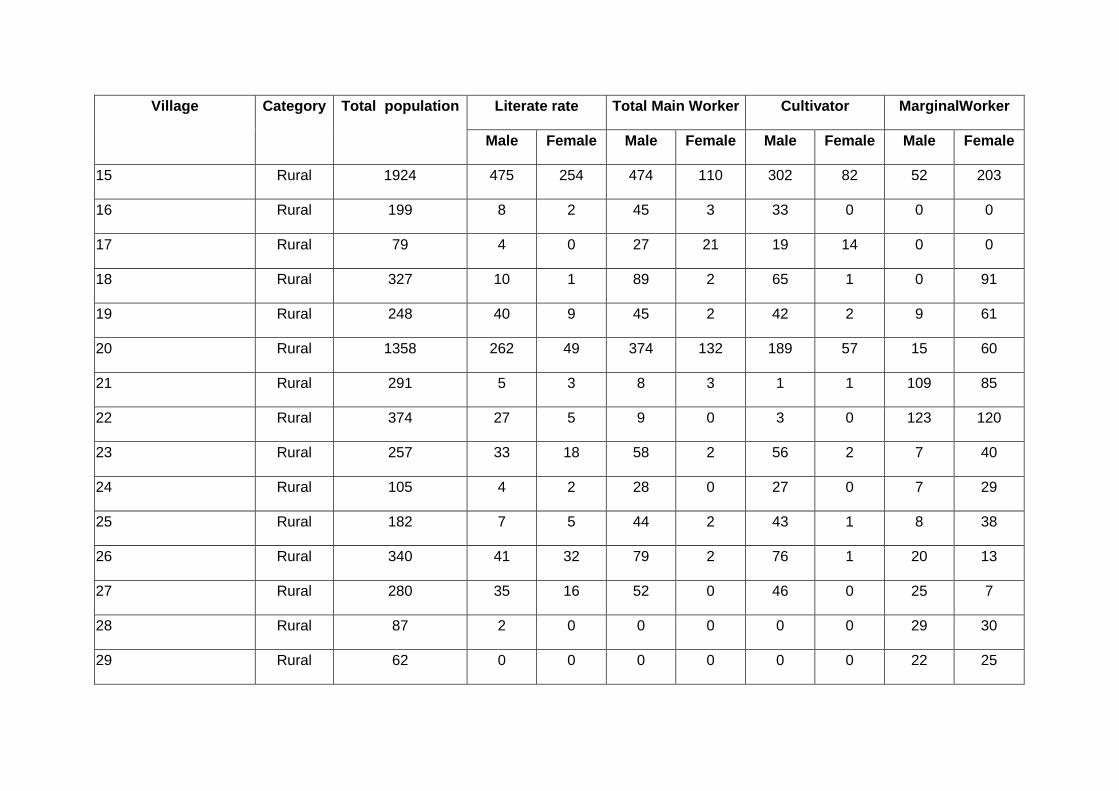
Village Category Total population Literate rate Total Main Worker Cultivator MarginalWorker
Male Female Male Female Male Female Male Female
15 Rural 1924 475 254 474 110 302 82 52 203
16 Rural 199 8 2 45 3 33 0 0 0
17 Rural 79 4 0 27 21 19 14 0 0
18 Rural 327 10 1 89 2 65 1 0 91
19 Rural 248 40 9 45 2 42 2 9 61
20 Rural 1358 262 49 374 132 189 57 15 60
21 Rural 291 5 3 8 3 1 1 109 85
22 Rural 374 27 5 9 0 3 0 123 120
23 Rural 257 33 18 58 2 56 2 7 40
24 Rural 105 4 2 28 0 27 0 7 29
25 Rural 182 7 5 44 2 43 1 8 38
26 Rural 340 41 32 79 2 76 1 20 13
27 Rural 280 35 16 52 0 46 0 25 7
28 Rural 87 2 0 0 0 0 0 29 30
29 Rural 62 0 0 0 0 0 0 22 25
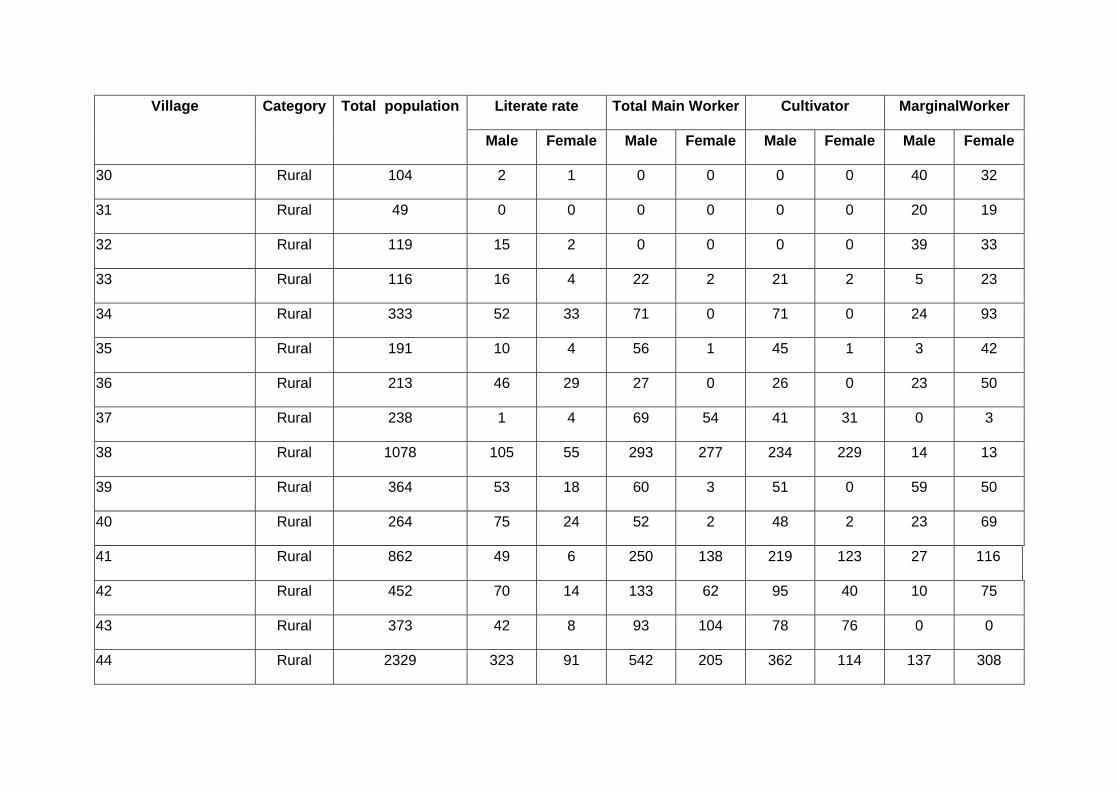
Village Category Total population Literate rate Total Main Worker Cultivator MarginalWorker
Male Female Male Female Male Female Male Female
30 Rural 104 2 1 0 0 0 0 40 32
31 Rural 49 0 0 0 0 0 0 20 19
32 Rural 119 15 2 0 0 0 0 39 33
33 Rural 116 16 4 22 2 21 2 5 23
34 Rural 333 52 33 71 0 71 0 24 93
35 Rural 191 10 4 56 1 45 1 3 42
36 Rural 213 46 29 27 0 26 0 23 50
37 Rural 238 1 4 69 54 41 31 0 3
38 Rural 1078 105 55 293 277 234 229 14 13
39 Rural 364 53 18 60 3 51 0 59 50
40 Rural 264 75 24 52 2 48 2 23 69
41 Rural 862 49 6 250 138 219 123 27 116
42 Rural 452 70 14 133 62 95 40 10 75
43 Rural 373 42 8 93 104 78 76 0 0
44 Rural 2329 323 91 542 205 362 114 137 308

Village Category Total population Literate rate Total Main Worker Cultivator MarginalWorker
Male Female Male Female Male Female Male Female
45 Rural 148 5 0 38 27 37 27 7 18
46 Rural 34 10 1 9 0 9 0 5 8
47 Rural 88 2 0 0 27 0 0 23 0
48 Rural 324 60 19 87 5 84 5 0 1
49 Rural 268 38 14 78 2 77 2 0 4
50 Rural 61 2 3 13 14 13 14 7 3
51 Rural 130 19 6 29 8 27 5 15 38
52 Rural 473 77 23 124 120 70 63 14 13
53 Rural 148 25 10 36 6 29 1 0 12
54 Rural 267 25 4 56 4 54 3 5 57
55 Rural 272 44 25 77 76 69 70 0 1
56 Rural 166 59 2 47 31 37 25 0 0
57 Rural 263 2 2 3 80 1 0 87 1
58 Rural 799 130 77 224 158 155 125 2 2
59 Rural 247 16 3 73 59 67 55 0 0
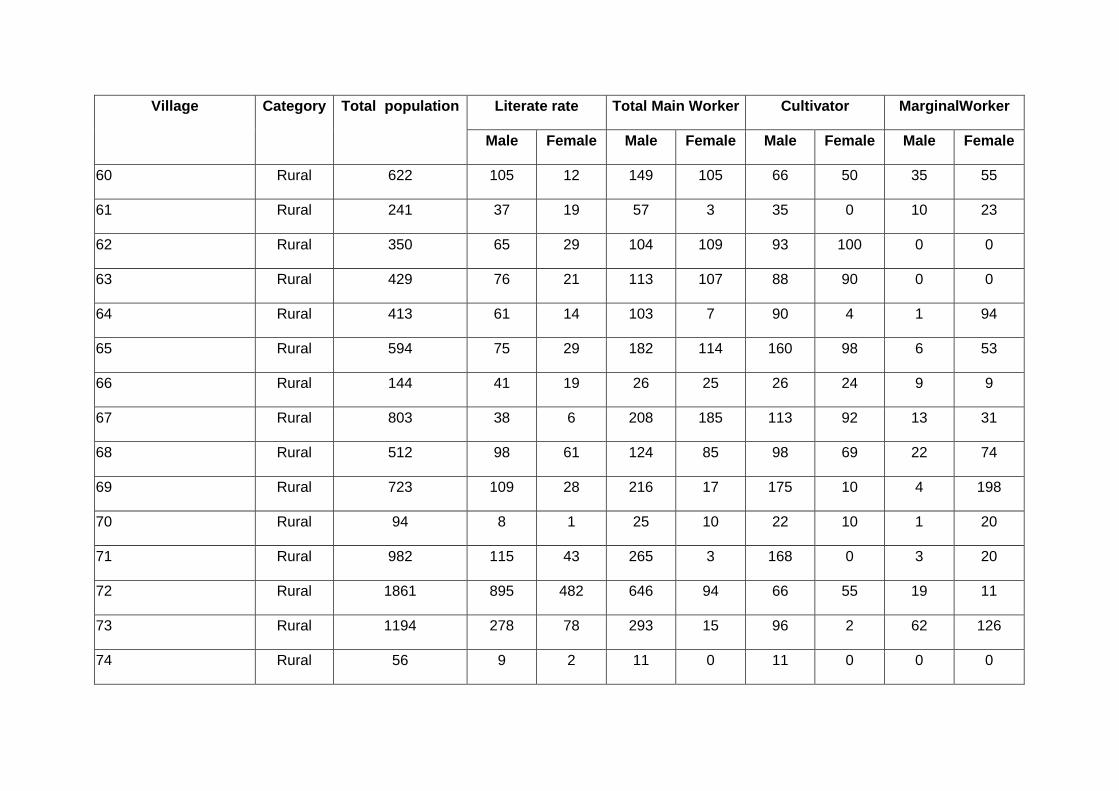
Village Category Total population Literate rate Total Main Worker Cultivator MarginalWorker
Male Female Male Female Male Female Male Female
60 Rural 622 105 12 149 105 66 50 35 55
61 Rural 241 37 19 57 3 35 0 10 23
62 Rural 350 65 29 104 109 93 100 0 0
63 Rural 429 76 21 113 107 88 90 0 0
64 Rural 413 61 14 103 7 90 4 1 94
65 Rural 594 75 29 182 114 160 98 6 53
66 Rural 144 41 19 26 25 26 24 9 9
67 Rural 803 38 6 208 185 113 92 13 31
68 Rural 512 98 61 124 85 98 69 22 74
69 Rural 723 109 28 216 17 175 10 4 198
70 Rural 94 8 1 25 10 22 10 1 20
71 Rural 982 115 43 265 3 168 0 3 20
72 Rural 1861 895 482 646 94 66 55 19 11
73 Rural 1194 278 78 293 15 96 2 62 126
74 Rural 56 9 2 11 0 11 0 0 0

Village Category Total population Literate rate Total Main Worker Cultivator MarginalWorker
Male Female Male Female Male Female Male Female
75 Rural 275 31 9 72 12 45 0 2 2
76 Rural 193 56 23 45 4 6 0 1 0
77 Rural 383 14 3 102 2 86 2 8 95
78 Rural 180 25 7 36 5 12 1 7 3
79 Rural 293 67 49 65 1 61 0 0 0
80 Rural 371 75 28 103 44 101 42 2 32
81 Rural 299 18 9 34 7 34 5 54 61
82 Rural 296 35 1 80 4 0 0 0 63
83 Rural 614 62 41 98 18 0 0 76 161
84 Rural 736 42 30 138 84 94 36 50 40
85 Rural 1439 85 24 301 192 21 4 51 228
86 Rural 477 90 47 106 2 93 0 15 97
87 Rural 364 47 28 69 75 68 75 37 39
88 Rural 339 60 50 92 87 25 13 4 4
89 Rural 372 40 30 59 26 37 3 34 66
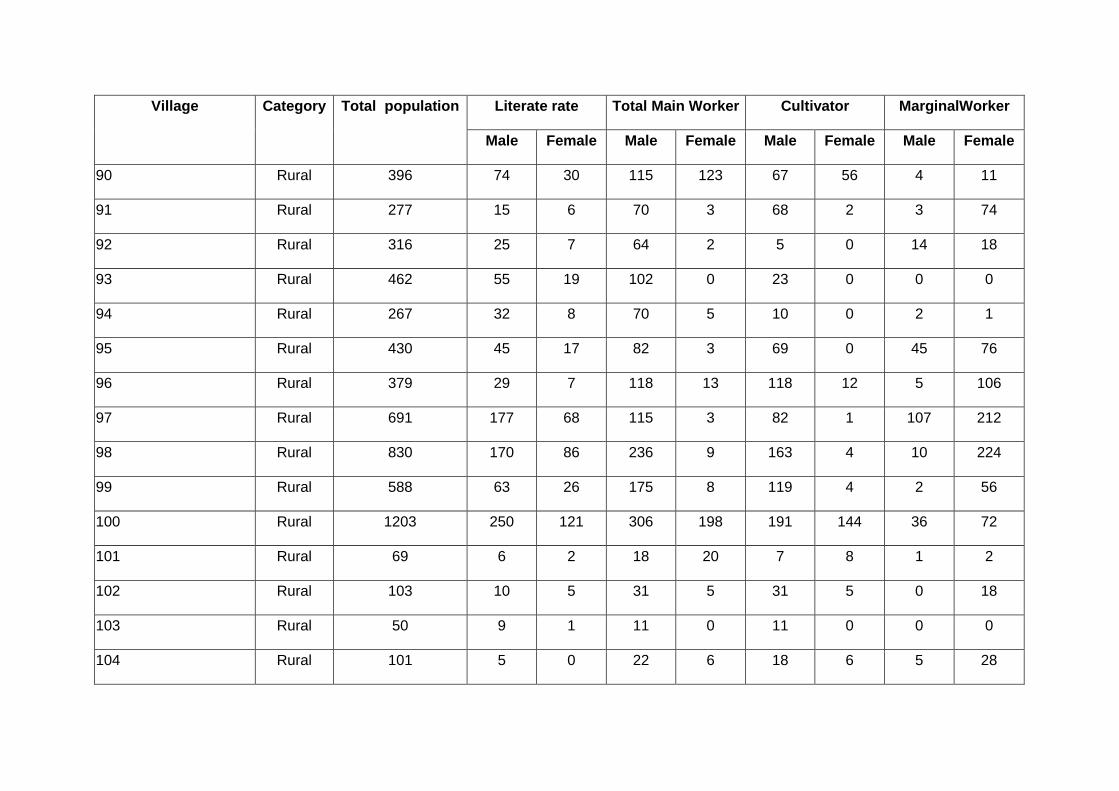
Village Category Total population Literate rate Total Main Worker Cultivator MarginalWorker
Male Female Male Female Male Female Male Female
90 Rural 396 74 30 115 123 67 56 4 11
91 Rural 277 15 6 70 3 68 2 3 74
92 Rural 316 25 7 64 2 5 0 14 18
93 Rural 462 55 19 102 0 23 0 0 0
94 Rural 267 32 8 70 5 10 0 2 1
95 Rural 430 45 17 82 3 69 0 45 76
96 Rural 379 29 7 118 13 118 12 5 106
97 Rural 691 177 68 115 3 82 1 107 212
98 Rural 830 170 86 236 9 163 4 10 224
99 Rural 588 63 26 175 8 119 4 2 56
100 Rural 1203 250 121 306 198 191 144 36 72
101 Rural 69 6 2 18 20 7 8 1 2
102 Rural 103 10 5 31 5 31 5 0 18
103 Rural 50 9 1 11 0 11 0 0 0
104 Rural 101 5 0 22 6 18 6 5 28

Village Category Total population Literate rate Total Main Worker Cultivator MarginalWorker
Male Female Male Female Male Female Male Female
105 Rural 124 12 2 35 20 31 19 14 26
106 Rural 86 4 3 17 2 16 2 6 17
107 Rural 261 54 23 68 9 65 8 8 67
108 Rural 1141 361 207 276 79 109 71 81 159
109 Rural 135 7 1 41 42 33 33 0 4
110 Rural 146 16 8 50 43 50 43 0 1
111 Rural 520 105 44 157 126 136 112 1 0
112 Rural 195 44 13 47 7 33 2 0 8
113 Rural 288 105 62 61 21 15 1 30 48
114 Rural 438 126 74 121 95 101 76 28 33
115 Rural 438 0 0 78 37 41 36 21 15
116 Rural 78 31 2 502 258 244 319 172 147
117 Rural 535 10 0 308 160 148 201 108 93
118 Rural 318 1 0 49 21 28 22 10 12
119 Rural 50 2 2 162 84 78 46 32 14
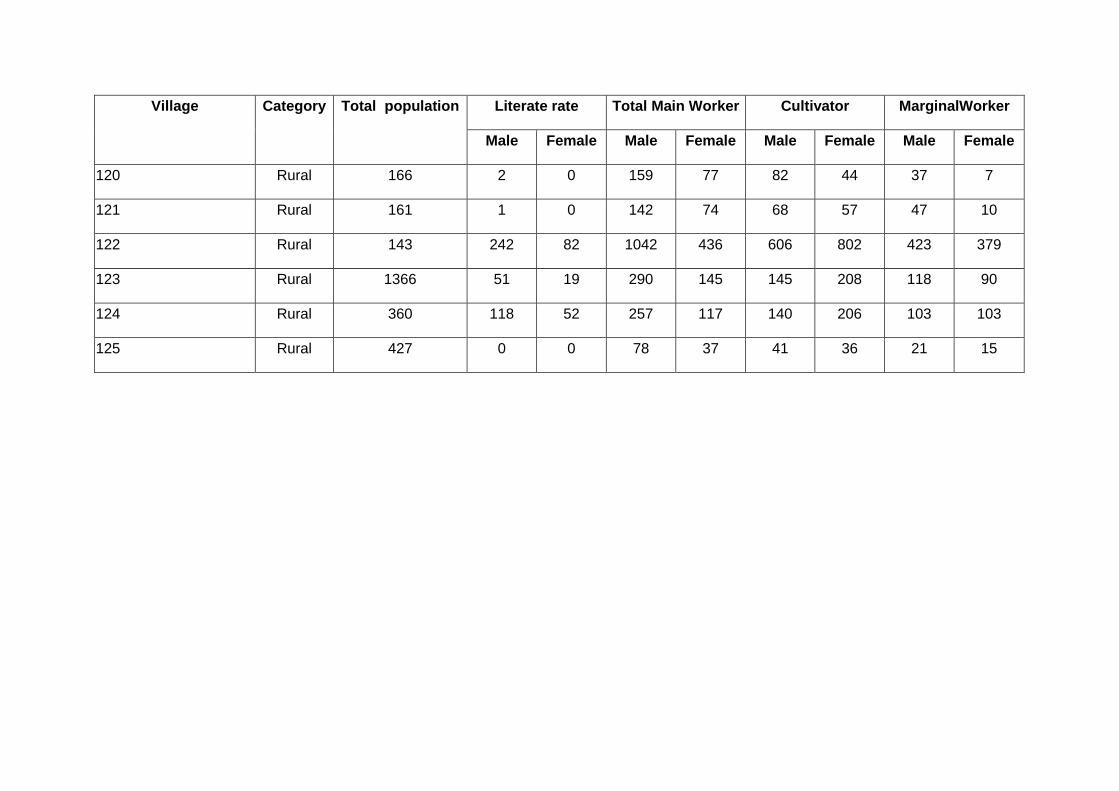
Village Category Total population Literate rate Total Main Worker Cultivator MarginalWorker
Male Female Male Female Male Female Male Female
120 Rural 166 2 0 159 77 82 44 37 7
121 Rural 161 1 0 142 74 68 57 47 10
122 Rural 143 242 82 1042 436 606 802 423 379
123 Rural 1366 51 19 290 145 145 208 118 90
124 Rural 360 118 52 257 117 140 206 103 103
125 Rural 427 0 0 78 37 41 36 21 15

119

120


