Download - Conor butcherminiproject1.2
INFOGRAPHICS: AN AID TO LEARNING? CONOR BUTCHER
WHAT IS AN INFOGRAPHIC? • Short for information graphic
• Present data quickly and clearly
• Integration of words and graphics
WHO USES INFOGRAPHICS? • small business’, non-profits and
large corporations…
• Surge in popularity due to social Media(Smiciklas, 2012)
• Predates the internet by 32,000 years
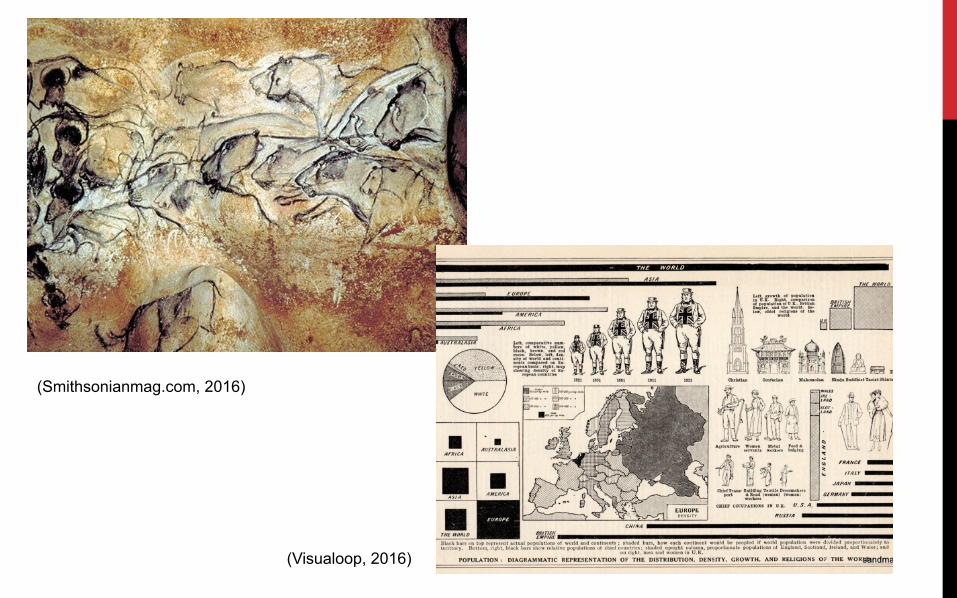
(Visualoop, 2016)
(Smithsonianmag.com, 2016)
WHY INFOGRAPHICS • Shorter attention spans(Rosen, Carrier and
Cheever, 2016) (Microsoft Canada, 2015)
• Advancements In education practice(VARK) (Fleming, 2006)
• Focus on information that is important (McCandles, 2012)
• Hardwired (Smiciklas, 2012)
SHORTER ATTENTION SPANS
“[What information consumes is]… the attention of
its recipients. Hence a wealth of information
creates a poverty of attention.” (simon, 1978)
SHORTER ATTENTION SPANS
Facebook and texting made me do it: Media-induced task-switching while studying. (Rosen, Carrier and Cheever, 2016)
SHORTER ATTENTION SPANS
Attention spans – consumer insights(Microsoft Canada, 2015)
ADVANCEMENTS IN EDUCATION PRACTICE
VARK(Fleming, 2006)
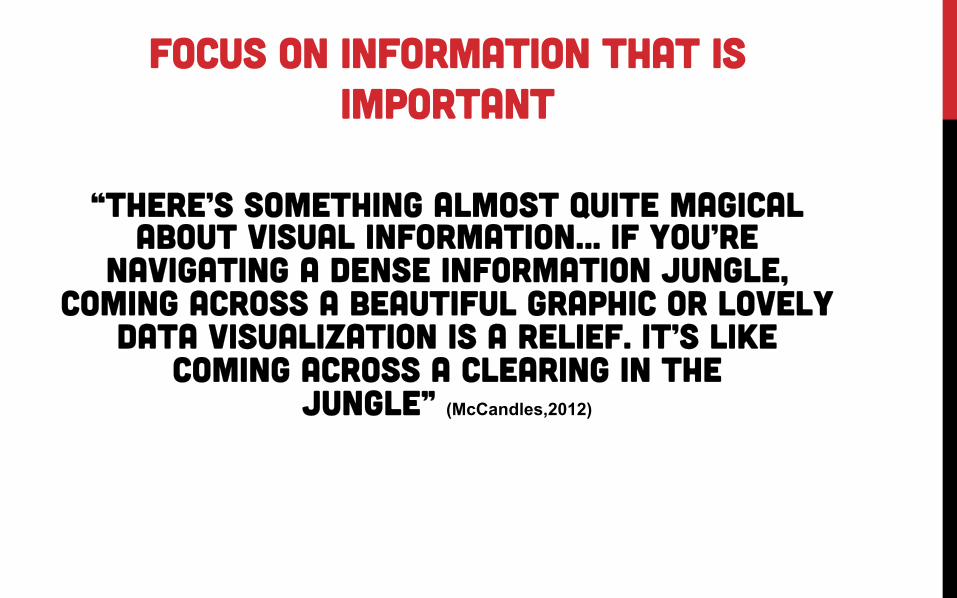
FOCUS ON INFORMATION THAT IS IMPORTANT
“There’s something almost quite magical about visual information… If you’re
navigating a dense information jungle, coming across a beautiful graphic or lovely
data visualization is a relief. It’s like coming across a clearing in the
jungle” (McCandles,2012)
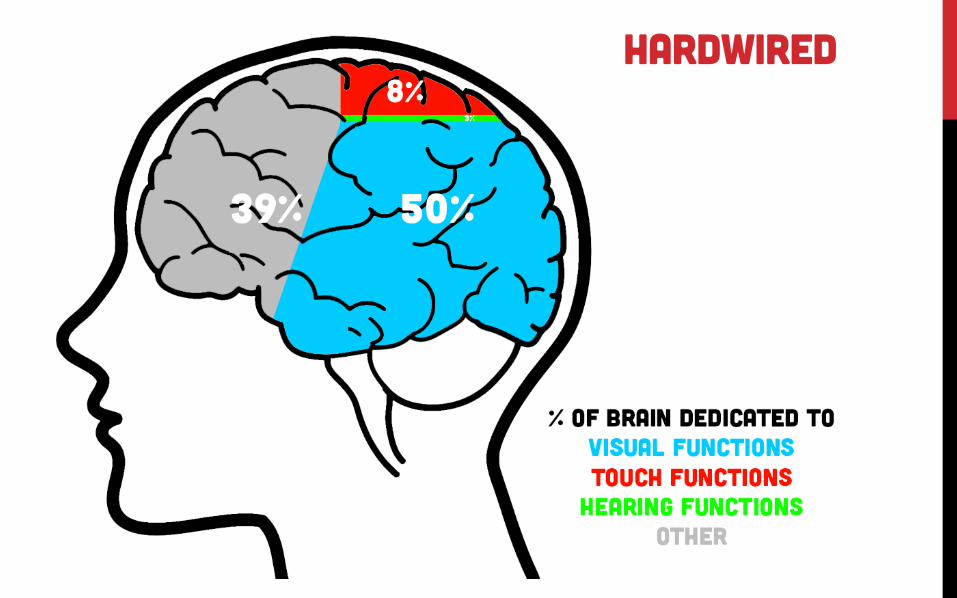
HARDWIRED
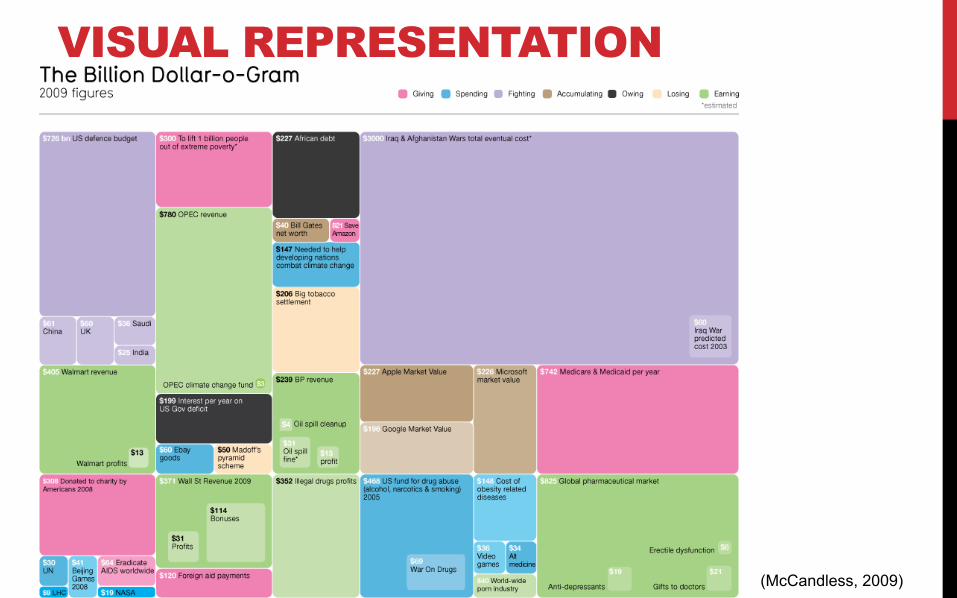
VISUAL REPRESENTATION
(McCandless, 2009)
INFOGRAPHIC V ARTICLE
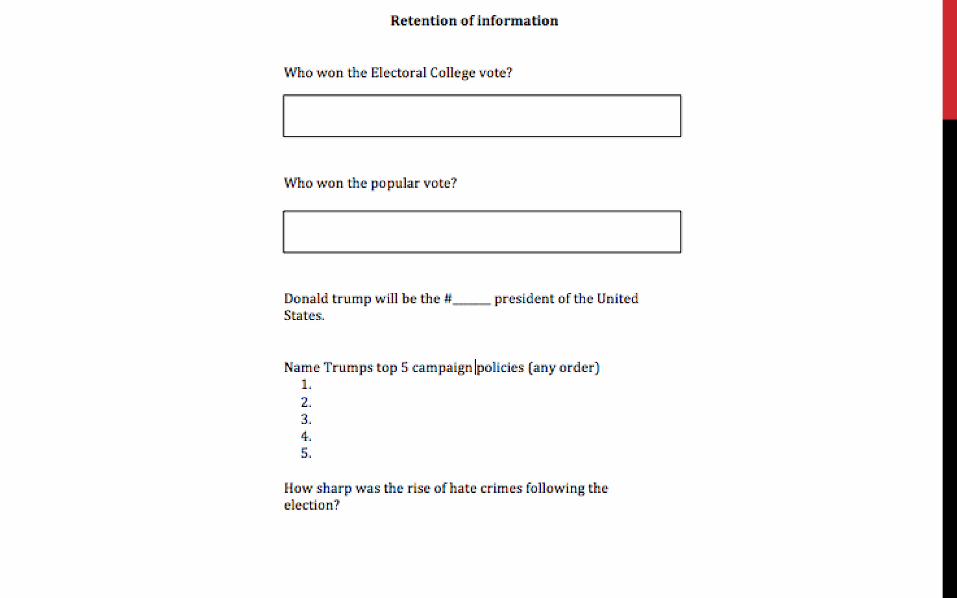
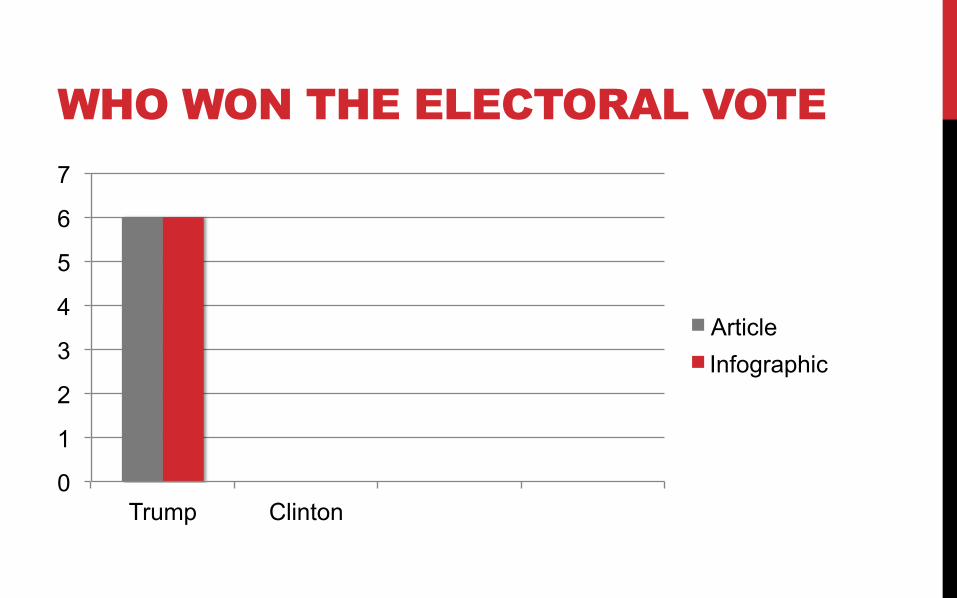
WHO WON THE ELECTORAL VOTE
0
1
2
3
4
5
6
7
Trump Clinton
Article Infographic
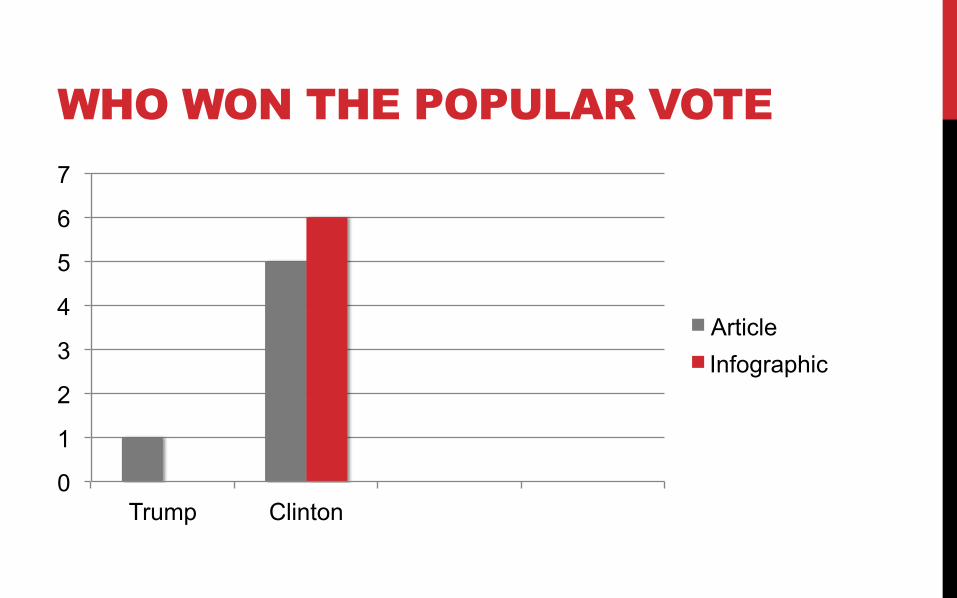
WHO WON THE POPULAR VOTE
0
1
2
3
4
5
6
7
Trump Clinton
Article Infographic
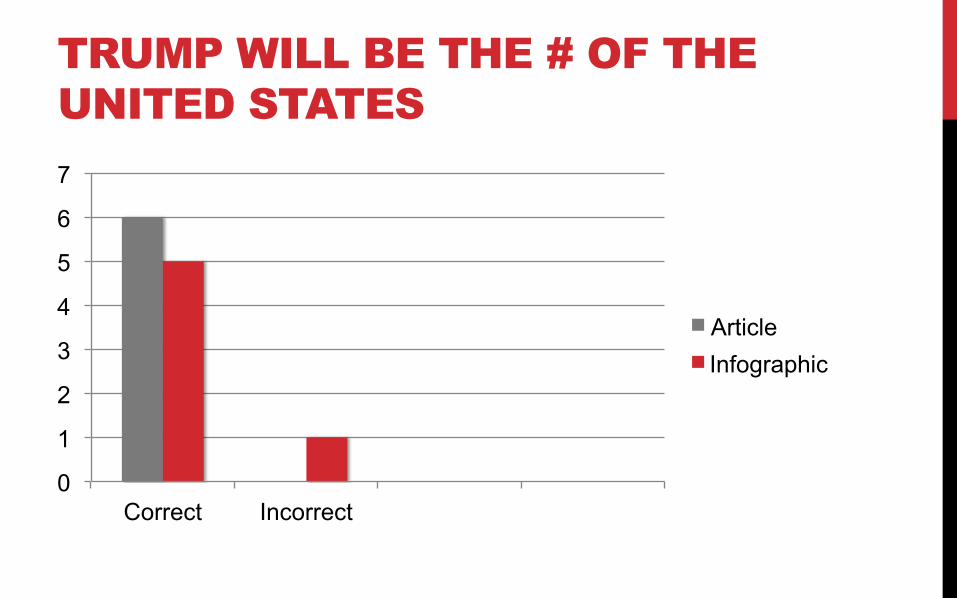
TRUMP WILL BE THE # OF THE UNITED STATES
0
1
2
3
4
5
6
7
Correct Incorrect
Article Infographic
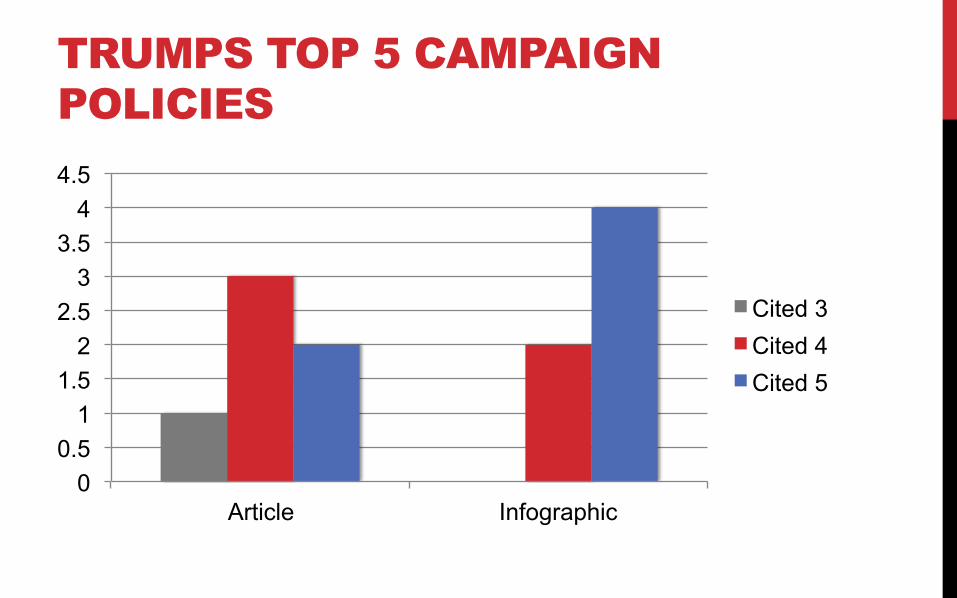
TRUMPS TOP 5 CAMPAIGN POLICIES
0 0.5
1 1.5
2 2.5
3 3.5
4 4.5
Article Infographic
Cited 3 Cited 4 Cited 5
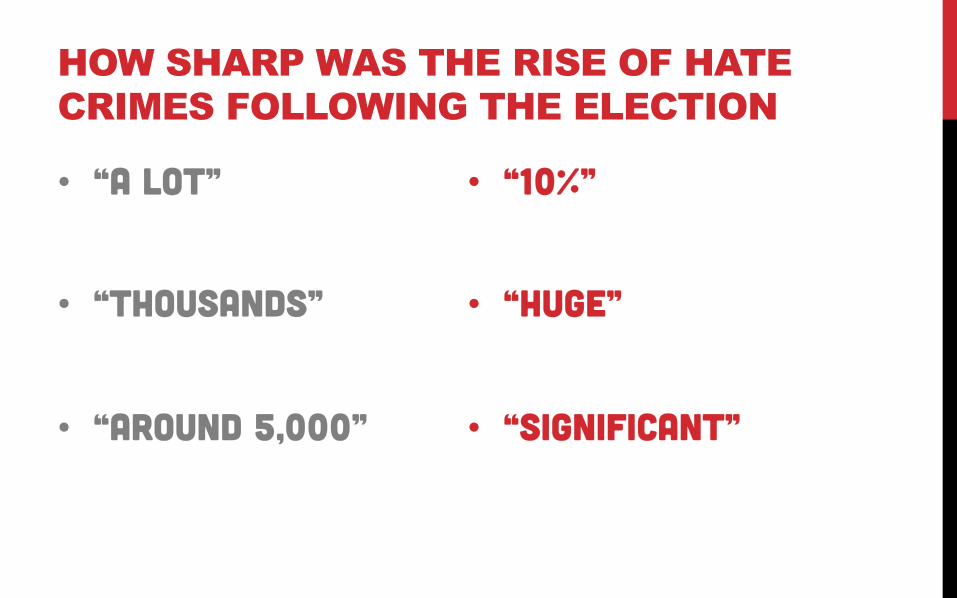
HOW SHARP WAS THE RISE OF HATE CRIMES FOLLOWING THE ELECTION
• “A lot”
• “Thousands”
• “Around 5,000”
• “10%”
• “huge”
• “Significant”

BIBLIOGRAPHY Anon, (2016). [image] Available at: http://mynameisjess.com/wp-content/uploads/2014/04/SOS_Sawfish-infographic_1.jpg [Accessed 15 Nov. 2016].
Fleming, N. (2006). Learning Styles Again: VARKing up the right tree!.
McCandless, D. (2012). The beauty of data visualization - David McCandless. [video] Available at: https://www.youtube.com/watch?v=5Zg-C8AAIGg [Accessed 15 Nov. 2016].
Rosen, L., Mark Carrier, L. and Cheever, N. (2016). Facebook and texting made me do it: Media-induced task-switching while studying.
Smiciklas, M. (2012). The power of infographics. 1st ed. Indianapolis, Ind.: Que Pub.
Smithsonianmag.com. (2016). History, Travel, Arts, Science, People, Places | Smithsonian. [online] Available at: http://www.smithsonianmag.com/history/journey-oldest-cave-paintings-world-180957685/ [Accessed 16 Nov. 2016].
Visually. (2016). History of Infographics | Visually. [online] Available at: https://visual.ly/m/history-of-infographics/ [Accessed 15 Nov. 2016].
Visualoop. (2016). Vintage Infodesign [17] - Visualoop. [online] Available at: http://visualoop.com/blog/6877/vintage-infodesign-17 [Accessed 16 Nov. 2016].
BIBLIOGRAPHY FOR INFOGRAPHIC/ARTICLE Federal Bureau of Investigation. (2016). 2015 Hate Crime Statistics Released. [online] Available at: https://www.fbi.gov/news/stories/2015-hate-crime-statistics-released [Accessed 20 Nov. 2016]. Holly Yan, C. (2016). 'Make America White Again': Hate speech and crimes post-election. [online] CNN. Available at: http://edition.cnn.com/2016/11/10/us/post-election-hate-crimes-and-fears-trnd/ [Accessed 20 Nov. 2016]. PolitiFact. (2016). Donald Trump's top 10 campaign promises. [online] Available at: http://www.politifact.com/truth-o-meter/article/2016/jul/15/donald-trumps-top-10-campaign-promises/ [Accessed 17 Nov. 2016]. Southern Poverty Law Center. (2016). Update: Incidents of Hateful Harassment Since Election Day Now Number 701. [online] Available at: https://www.splcenter.org/hatewatch/2016/11/18/update-incidents-hateful-harassment-election-day-now-number-701 [Accessed 20 Nov. 2016].


