
Work PlanPublic
Engagement & Survey
• Entire CRP Area
Routing Options
Draft Schedule &
Cost
Draft Plan & Costs
Business Case
Pilot Approval
Draft RFP to operate
Evaluation of Bids
Award & Service
Start
Municipal roles
definition
Outcomes and Risks
On
-go
ing
me
etin
gs
with
ele
cte
d o
ffic
ials
an
d s
taff fro
m p
art
icip
atin
g
mu
nic
ipa
litie
s th
rou
gh
ou
t th
e p
roc
ess
Monitor for Success
Pilot Ends –Next steps
Execute Marketing Plan
• Documentation of process
• Costing
• Revenue estimates
• Fare structure
• Internal working document
• Operating options
• Year 2
• Year 3 and beyond
• Business Model
• Opting In/Out
• Public campaign
preceding survey
• SURVEY:
Hargroup
• Developed work
phases of study
• Communications
plan
• Public
engagement plan
• Risks/challenges
Project Start up
Regional Options
PlanTest Pilot
• meet with representatives
from 4 municipalities
• Identify funding
• Raise potential pilot
• Integration with business
model review
• Communications plan
• Municipal roles
• CRP roles
• Costing
• Projections
• Process to evaluate
(KPI)
1. Municipal
2. CRP Executive
Committee
3. CRP Board
• South region focus

In Process
Work PlanPublic
Engagement & Survey
Routing Options
Draft Schedule &
Cost
Draft Plan & Costs
Business Case
Pilot Approval
Draft RFP to operate
Evaluation of Bids
Award & Service
Start
Municipal roles
definition
Outcomes and Risks
On
-go
ing
me
etin
gs
with
ele
cte
d o
ffic
ials
an
d s
taff fro
m p
art
icip
atin
g
mu
nic
ipa
litie
s th
rou
gh
ou
t th
e p
roc
ess
Monitor for Success
Pilot Ends –Next steps
Execute Marketing Plan
Project Start up
Regional Options
PlanTest Pilot

Ridership Estimation
• Heavily based on the HarGroup Survey of residents
• Mode split specific to each community = Transit Population

Survey Results• Stated preference Survey
• Percent of residents likely to use transit
• Times of travel
• Movement between communities
Table: 3.8: Expected Times of Travel between Community and Calgary
% of Respondents
Times of Travel
80 79 210 75
TV BD OK NT Total TV BD OK NT Total
Between 6:00 am up to 9:00 am 38 45 49 38 170 47.5% 57.0% 23.3% 50.7% 28.9%
Between 9:00 am up to noon 43 45 48 64 200 53.8% 57.0% 22.9% 85.3% 34.0%
Between noon up to 3:00 pm 22 21 16 17 76 27.5% 26.6% 7.6% 22.7% 12.9%
Between 3:00 pm up to 6:00 pm 14 16 17 15 62 17.5% 20.3% 8.1% 20.0% 10.5%
Between 6:00 pm up to 9:00 pm 12 14 17 6 49 15.0% 17.7% 8.1% 8.0% 8.3%
Between 9:00 pm up to midnight 3 0 9 2 14 3.8% 0.0% 4.3% 2.7% 2.4%
Between midnight up to 3:00 am 0 0 3 0 3 0.0% 0.0% 1.4% 0.0% 0.5%
Between 3:00 am up to 6:00 am 0 7 4 3 14 0.0% 8.9% 1.9% 4.0% 2.4%
It depends 0 1 0 0 1 0.0% 1.3% 0.0% 0.0% 0.2%
132 149 163 145 589 100.0% 100.0% 100.0% 100.0% 100.0%
Community to Calgary
RESPONSES PERCENTAGE

Process for Estimating Ridership
HargroupSurvey
Use % to create transit
population
Discounting process
Rides per trip
peak/off peak
Sample Fare
Structures
Pass/Ticket split
Revenues
Estimated
Daily Use from
preference
Total Population vs
transit users
Estimate based on
preference
Airdrie ICE as
example
Ridership Estimate

Route Options
• Local Service vsExpress option
• Local input on stop locations, Park and Ride
• Streets considered
• Transfer/layover points
Examine option
without local service

Examine option without
local service


11,800 Annual HoursMonday to Friday
Lv. O
ko
tok
s
Do
wn
tow
n
Ar.
Hig
h R
ive
r
Lv. H
igh
Riv
er
Ar.
Na
nto
n
Lv. N
an
ton
Ar.
Hig
h R
ive
r
Lv. H
igh
Riv
er
Ar.
Ok
oto
ks
(Cim
ma
ron
@
32n
d S
t)
Lv. O
ko
tok
s
(Cim
ma
ron
@
32n
d S
t)
Lv. B
lac
k
Dia
mo
nd
(W
illo
w R
idg
e G
ate
)
Ar.
Tu
rne
r V
alle
y(R
oya
l &
Hu
be
rt)
Lv. Tu
rne
r V
alle
y(R
oya
l &
Hu
be
rt)
Lv. B
lac
k
Dia
mo
nd
(W
illo
w R
idg
e G
ate
)
Ar.
Ok
oto
ks
(Cim
ma
ron
@
32n
d S
t)
Lv. O
ko
toks
(Cim
ma
ron
@
32n
d S
t)
Lv. O
ko
toks
(Eliz
ab
eth
St.
@
Elk
St)
Ar.
So
me
rse
t-
Brid
lew
oo
d L
RT
Lv. B
rid
lew
oo
d
Sta
tio
n
Ar.
City H
all
Sta
tio
n
Lv. C
ity H
all
Sta
tio
n
Ar.
Brid
lew
oo
d
Sta
tio
n
Lv. So
me
rse
t-
Brid
lew
oo
d L
RT
Lv. O
ko
toks
(Eliz
ab
eth
St.
@
Elk
St)
Ar.
O
ko
toks
(Cim
ma
ron
@
32n
d S
t)
0:04 0:46 0:16 0:19 0:37 0:18 0:05 0:25 0:12 0:10 0:20 0:25 0:05 0:11 0:24 0:05 0:24 0:11
5:39 6:03 6:23 6:48 6:48 6:59 7:23 6:19 6:45 7:28 7:52 8:03 Bus 1
7:21 7:32 7:56 6:59 7:25 8:01 8:25 8:36 Bus 2
6:26 6:51 7:03 7:03 7:23 7:48 7:48 7:59 8:23 7:39 8:05 8:28 8:52 9:03 Bus 3
5:55 6:41 6:57 7:16 7:53 8:11 8:16 8:27 8:51 8:19 8:45 8:56 9:20 9:31 Bus 4
8:45 8:56 9:20 9:01 9:25 9:25 9:49 10:00 Bus 2
8:12 8:37 8:49 8:59 9:19 9:44 9:44 9:55 10:19 9:39 10:05 10:24 10:48 10:59 Bus 1
10:09 10:20 10:44 9:59 10:25 10:49 11:13 11:24 Bus 2
9:45 10:10 10:22 10:22 10:42 11:07 11:07 11:18 11:42 11:47 12:11 12:22 Bus 3
9:31 10:17 10:33 10:52 11:29 11:47 11:52 12:03 12:27 12:32 12:56 13:07 Bus 4
11:33 11:58 12:10 12:20 12:40 13:05 13:05 13:16 13:40 13:45 14:09 14:20 Bus 2
12:31 12:56 13:08 13:18 13:38 14:03 14:03 14:14 14:38 15:39 16:05 14:43 15:07 15:18 Bus 3
14:29 14:40 15:04 16:19 16:45 15:09 15:33 15:44 Bus 2
13:50 14:15 14:27 14:27 14:47 15:12 15:12 15:23 15:47 16:59 17:25 15:52 16:16 16:27 Bus 4
15:53 16:04 16:28 17:39 18:05 16:33 16:57 17:08 Bus 2
14:05 14:51 15:07 15:26 16:03 16:21 16:26 16:37 17:01 17:59 18:25 17:06 17:30 17:41 Bus 1
15:27 15:52 16:04 16:14 16:34 16:59 16:59 17:10 17:34 17:39 18:03 18:14 Bus 3
17:50 18:01 18:25 18:30 18:54 19:05 Bus 1
17:17 17:42 17:54 17:54 18:14 18:39 GARAGE Bus 2
16:27 17:13 17:29 17:48 18:25 18:43 18:43 19:08 19:20 19:20 19:40 20:05 GARAGE Bus 4
Turner Valley/Black DiamondNANTON & HIGH RIVER Okotoks - Calgary CALGARY TRANSIT SERVICE Calgary - Okotoks
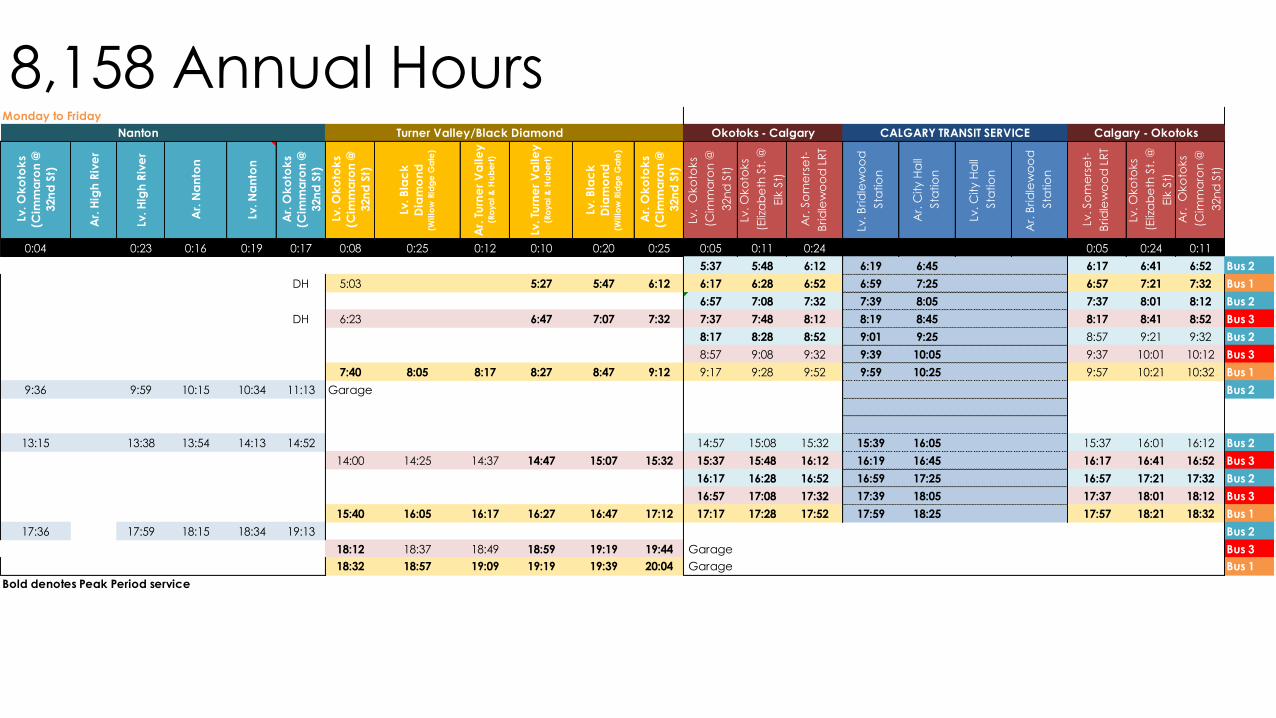
8,158 Annual HoursMonday to Friday
Lv. O
ko
tok
s
(Cim
ma
ron
@
32n
d S
t)
Ar.
Hig
h R
ive
r
Lv. H
igh
Riv
er
Ar.
Na
nto
n
Lv. N
an
ton
Ar.
Ok
oto
ks
(Cim
ma
ron
@
32n
d S
t)
Lv. O
ko
tok
s
(Cim
ma
ron
@
32n
d S
t)
Lv. B
lac
k
Dia
mo
nd
(W
illo
w R
idg
e G
ate
)
Ar.
Tu
rne
r V
alle
y(R
oya
l &
Hu
be
rt)
Lv. Tu
rne
r V
alle
y(R
oya
l &
Hu
be
rt)
Lv. B
lac
k
Dia
mo
nd
(W
illo
w R
idg
e G
ate
)
Ar.
Ok
oto
ks
(Cim
ma
ron
@
32n
d S
t)
Lv. O
ko
toks
(Cim
ma
ron
@
32n
d S
t)
Lv. O
ko
toks
(Eliz
ab
eth
St.
@
Elk
St)
Ar.
So
me
rse
t-
Brid
lew
oo
d L
RT
Lv. B
rid
lew
oo
d
Sta
tio
n
Ar.
City H
all
Sta
tio
n
Lv. C
ity H
all
Sta
tio
n
Ar.
Brid
lew
oo
d
Sta
tio
n
Lv. So
me
rse
t-
Brid
lew
oo
d L
RT
Lv. O
ko
toks
(Eliz
ab
eth
St.
@
Elk
St)
Ar.
O
ko
toks
(Cim
ma
ron
@
32n
d S
t)
0:04 0:23 0:16 0:19 0:17 0:08 0:25 0:12 0:10 0:20 0:25 0:05 0:11 0:24 0:05 0:24 0:11
5:37 5:48 6:12 6:19 6:45 6:17 6:41 6:52 Bus 2
DH 5:03 5:27 5:47 6:12 6:17 6:28 6:52 6:59 7:25 6:57 7:21 7:32 Bus 1
6:57 7:08 7:32 7:39 8:05 7:37 8:01 8:12 Bus 2
DH 6:23 6:47 7:07 7:32 7:37 7:48 8:12 8:19 8:45 8:17 8:41 8:52 Bus 3
8:17 8:28 8:52 9:01 9:25 8:57 9:21 9:32 Bus 2
8:57 9:08 9:32 9:39 10:05 9:37 10:01 10:12 Bus 3
7:40 8:05 8:17 8:27 8:47 9:12 9:17 9:28 9:52 9:59 10:25 9:57 10:21 10:32 Bus 1
9:36 9:59 10:15 10:34 11:13 Garage Bus 2
Bus 3
13:15 13:38 13:54 14:13 14:52 14:57 15:08 15:32 15:39 16:05 15:37 16:01 16:12 Bus 2
14:00 14:25 14:37 14:47 15:07 15:32 15:37 15:48 16:12 16:19 16:45 16:17 16:41 16:52 Bus 3
16:17 16:28 16:52 16:59 17:25 16:57 17:21 17:32 Bus 2
16:57 17:08 17:32 17:39 18:05 17:37 18:01 18:12 Bus 3
15:40 16:05 16:17 16:27 16:47 17:12 17:17 17:28 17:52 17:59 18:25 17:57 18:21 18:32 Bus 1
17:36 17:59 18:15 18:34 19:13 Bus 2
18:12 18:37 18:49 18:59 19:19 19:44 Garage Bus 3
18:32 18:57 19:09 19:19 19:39 20:04 Garage Bus 1
Bold denotes Peak Period service
SERVICE HOURS BY BUS
Start Finish Shift Total Start Finish Shift Total Start Finish Shift Total
5:03 10:32 5:29 9:53 5:37 11:13 5:36 11:34 6:23 10:12 3:49 9:33
15:40 20:04 4:24 13:15 19:13 5:58 14:00 19:44 5:44
Verification AM 5:29 4:24 PM AM 5:36 5:58 PM AM 3:49 5:44 PM
bus 1 bus 2 bus 3
Nanton Turner Valley/Black Diamond CALGARY TRANSIT SERVICEOkotoks - Calgary Calgary - Okotoks

Comparison11,800 8,200
Total Cost $ 1,223,000 $ 897,400
Total Revenue $ 924,500 $ 679,400
Remaining Cost $ 298,500 $ 218,000
Cost Recovery 76% 84%
Annual Rides 157,400 155,700
Annual Trips 10,793 10,584
Rides Per Trip 14.6 14.7
Average Fare $ 5.87 $ 4.36
# of Vehicles 4 3

Initial Documentation
• Initial Feedback from Municipal Staff
• Add Performance Measures
• Explain ridership estimation process
• Update Service options:• Add Express options for Okotoks and Black Diamond &
cost
• Add Southland and CT LRT service to schedules
• Estimate total per trip fare including CT use

Next Steps
• Internal Workshop (FEB 20, 2015)• Routings
• Schedules
• Stop locations
• Fares
• Draft Service Plan
• Business Case outline


