Download - The Wharf (Holdings) Limited

The Wharf (Holdings) Limited Annual Report 2009
Stock Code: 4

On the Cover: Wheelock Square, 1717 Nanjing Xi Road, Shanghai
Designed by Kohn Pedersen Fox, Wheelock Square features simple yet refined symmetrical lines combined with subtle elegance. It is among the tallest in Puxi upon completion in June 2010.
Offering premium Grade A office of 1.2 million square feet GFA, the tower will feature top modern office specification and facilities rarely matched in the current market.
Strategically situated in the heart of Jing’an District and overlooking Jing’an Park, Wheelock Square is located directly opposite Jing’an Temple Station for Metro lines 2 & 7, as well as within 5 minutes’ walk to Changshu Road Station for Metro line 1.

1The Wharf (Holdings) Limited Annual Report 2009
36
002 Corporate Profile
003 Corporate Information
004 Group Business Structure
006 Chairman’s Statement
008 Financial Highlights
009 Managing Director’s Report
Business Review
010 Harbour City
018 Times Square
024 China Properties
036 Modern Terminals
040 Other Businesses
044 Corporate Social Responsibility
052 Financial Review
059 Corporate Governance Report
065 Report of the Directors
076 Financial Information
077 Report of the Independent Auditor
078 Consolidated Income Statement
079 Consolidated Statement of Comprehensive Income
080 Consolidated Statement of Financial Position
082 Company Statement of Financial Position
083 Consolidated Statement of Changes in Equity
084 Consolidated Statement of Cash Flows
087 Notes to the Financial Statements
128 Principal Accounting Policies
144 Principal Subsidiaries, Associates and Jointly Controlled Entities
148 Schedule of Principal Properties
154 Ten-year Financial Summary
Contents
10
24
40
44
18

2The Wharf (Holdings) Limited Annual Report 2009
For over a century since 1886, The Wharf (Holdings) Limited has enjoyed a distinguished history of Building for Tomorrow.
Prime real estate is Wharf’s primary strategic focus. Site acquisition, financing, development planning, design, construction and marketing are its core competencies. Mall management is its strategic differentiation.
With a combined valuation of HK$87 billion, landmarks Harbour City and Times Square account for an exceptional 8% share of total retail sales throughout Hong Kong. The two assets together represent 51% of the Group’s total business assets and 62% of operating profit.
Property Development is an additional cylinder for growth. From a land bank in Mainland China of over 100 million square feet, only 3.7 million square feet were recognised in 2009 but operating profit surpassed HK$1 billion for the first time, at an attractive margin of 33%.
Wharf has been Building for Tomorrow in the property sector and achieved a few firsts. That includes the first all-weather mall in Hong Kong (Ocean Terminal), the first vertical mall in Hong Kong with nearly HK$1 billion of annual rental income (Times Square) and the first 40-storey industrial building in Hong Kong (Cable TV Tower).
Wharf has also been Building for Tomorrow in other sectors. That includes the first and only cruise terminal in Hong Kong (Ocean Terminal), the first container terminal in Hong Kong (Modern Terminals), the first cross-harbour tunnel in Hong Kong (Hunghom Tunnel), the first electronic toll collection system in Hong Kong (Autopass), the first multi-channel Pay TV service in Hong Kong (CABLE TV), the first 24-hour news channel in Cantonese and the first 24-hour entertainment news channel in Cantonese in the world (i-CABLE News and i-CABLE Entertainment News).
Wharf’s strategic thrust into the Mainland started in 2007. Off a very humble base, a medium term target weighting of 50% for Mainland assets was set, and communicated to investors. Currently at 32%, we are making reasonable progress. In addition to the land bank, included are key port assets along the China coast, the most dynamic coast line in the world for cargo movement in the coming decades.
The Group remains enthusiastic about the fundamentals for the Mainland real estate market. Continuation of urbanization at a break neck pace will stimulate demand not only quantitatively but also qualitatively. We will be seeking to increase our land bank.
China West and China East account for about 46% and 50% of the current land bank respectively. Alongside the Times Squares, a series of IFCs (International Finance Centres) will be developed in Chengdu, Chongqing, Suzhou and Wuxi. The first two will be comparable in scale and significance to Harbour City in Hong Kong.
Wharf’s commitment to Building for Tomorrow extends to corporate social responsibility and organizational development. The Group is firmly committed to the sustainability of the community.
Corporate Profile

3The Wharf (Holdings) Limited Annual Report 2009
Board of Directors
Mr Peter K C Woo, GBS, JP, Chairman
Mr Stephen T H Ng, Deputy Chairman & Managing Director
Ms Doreen Y F Lee, Executive Director
Mr T Y Ng, Executive Director
Mr Paul Y C Tsui, Executive Director & Group Chief Financial Officer
Independent Non-executive Directors
Hon Paul M P Chan, JP*
Professor Edward K Y Chen, GBS, CBE, JP
Dr Raymond K F Ch’ien, GBS, CBE, JP
Hon Vincent K Fang, SBS, JP*
Mr Hans Michael Jebsen, BBS*
Mr James E Thompson, GBS*
* Members of the Audit Committee
Secretary Mr Wilson W S Chan, FCIS
Auditors KPMG
Principal Banker The Hongkong and Shanghai Banking Corporation Limited
Registrars Tricor Tengis Limited 26th Floor, Tesbury Centre 28 Queen’s Road East Wanchai, Hong Kong
Registered Office 16th Floor, Ocean Centre, Harbour City Canton Road, Kowloon, Hong Kong Tel: (852) 2118 8118 Fax: (852) 2118 8018 Website: www.wharfholdings.com
Corporate Information

4The Wharf (Holdings) Limited Annual Report 2009
Peter WooChairman
4The Wharf (Holdings) Limited Annual Report 2009
Group Business Structure
Investment Properties
Doreen LeeSenior Managing Director
Wharf China Estates
Wharf China Development
Andrew ChowVice Chairman
T Y NgSenior Managing Director
Development Properties(China)

5The Wharf (Holdings) Limited Annual Report 2009
Logistics, Communications,Media & Entertainment
Stephen NgChairman
5The Wharf (Holdings) Limited Annual Report 2009

6The Wharf (Holdings) Limited Annual Report 2009
Chairman’sStatement
Group Profit
HK$17.5 billion
180%Profit before Investment Property Revaluation Surplus
HK$7.8 billion
86%
The Hong Kong economy contracted by 2.7% in 2009 in the midst of a severe worldwide recession. The Group’s overall performance well exceeded our budgets, achieved primarily on the unexpected strength of the property segments in both Hong Kong and the Mainland. Group profit rose by 180% to HK$17.5 billion. Profit before Investment Property revaluation rose by 86% to HK$7.8 billion.
Property Investment accounted for over 70% of Group operating profit. Strong structural growth in this segment more than compensated for the cyclical weakness in the other segments including Logistics. The “Heart” of the Group, Harbour City and Times Square, comfortably outperformed the market and accounted for 8% of total retail sales in all of Hong Kong.
Three other key factors drove the Group’s earnings growth in 2009 in roughly equal importance: Property Development, favourable financing costs and disposal of Beijing Capital Times Square. In particular, operating profit from Property Development exceeded HK$1 billion (from a 33% margin) to rise to 12% of Group operating profit. It is well poised as a reliable new source of income for the Group in the coming years.
“Heart of the Group” – Harbour City and Times Square The two core assets in the Property Investment segment, Harbour City and Times Square, continued to deliver with a 10% - increase in recurring profit to HK$5,313 million. Under the Group’s leadership in retail management, the two properties once again comfortably exceeded the Hong Kong average for retail sales growth over 2008. Distinguished by their premier location, sustained quality for the most exhilarating and rewarding shopping experience, diversified trade-mix and powerful retail marketing, Harbour City and Times Square combined accounted for around 8% of total Hong Kong retail sales in 2009. Both core assets held up well in office occupancy and rent for their ideal locations, served by excellent transportation networks and well-rounded ancillary services.
China PropertiesThe Group’s strategy to increase its Mainland assets to 50% of Group assets is progressing well. Our land bank in the Mainland has already exceeded the interim target of 100 million square feet of gross floor area. To sustain development in the Mainland, the Group has taken deliberate steps to localise its management teams. The China East team has been fully localised, while the China West team, established in Chengdu, continues to be led by Hong Kong executives until it is fully localised.
A new milestone for profitability
The China property segment, while still at a relatively early stage of development, outpaced all other segments in profit growth.

7The Wharf (Holdings) Limited Annual Report 2009
The China property segment, while still at a relatively early stage of development, outpaced all other segments in profit growth. Sales for 3.7 million square feet of properties recognised in 2009 helped increase operating profit by elevenfold to exceed HK$1 billion. Including sales not yet recognised, a total of 4.7 million square feet of properties were sold in 2009 for RMB4.6 billion to exceed target. They spanned across six cities (Chengdu, Chongqing, Dalian, Shanghai, Wuhan and Wuxi) and reflected soaring housing demand across urban China, the properties’ excellent location and quality, as well as Wharf’s reputable brand strength.
The 2010 aim for sales/presales of close to 10 million square feet for RMB10 billion will mark a new milestone for the Group. The strong cash flow from this programme would provide additional resources for additional investment in quality projects when suitable opportunities arise.
In Property Investment, the Times Squares in Beijing, Chongqing, Dalian and Shanghai together registered a 15% growth in revenue and a 26% growth in operating profit. In November 2009, the Group accepted an attractive offer to dispose of the Beijing Capital Times Square. It is intended to re-invest the capital from the disposal in other interesting prospects in due course.
2009 Financial SummaryGroup turnover for 2009 increased by 10% to HK$17,553 million on account of strong recurrent rental income, coupled with phenomenal revenue growth from China property sales. Operating profit grew by 13% to HK$8,554 million.
Profit attributable to Shareholders excluding the net investment property revaluation surplus rose by a robust 86% to HK$7,817 million. Including a higher unrealised surplus from the revaluation of investment properties, profit attributable to Shareholders rose by 180% to HK$17,501 million. Earnings per share were HK$6.35.
Revaluation of the Group’s investment properties, underpinned by higher rentals, grew by 12% to HK$115,492 million as at the end of 2009. Gearing was 17.5%. Including Logistics, 32% of the Group’s assets were Renminbi-based assets as at the end of 2009.
The Board is recommending a 45% increase in final dividend to 64 cents per share. This would increase total dividend for the full year by 25% to HK$1.00 per share.
OutlookSubsequent to the severe global downturn in the second half of 2008, the Hong Kong economy started to pick up in the middle of 2009 and staged a strong recovery late in the year. The government forecasts Hong Kong’s GDP will revert to a positive annual growth
of 4~5% in 2010. Local consumption, having regained momentum in the second half of 2009, is poised to rise further in 2010, along with an improving employment market in tandem with the economic upturn. According to the Hong Kong Tourism Board, tourist arrivals are expected to grow by 5% to 31 million this year on the back of a strong growth in visitors from the Mainland and emerging markets. A further revival in consumer sentiment and inbound tourism will add impetus to the Hong Kong retail market in 2010.
While the global economy has emerged from the doldrums, China is expected to take the lead in the recovery process. Riding on the close economic ties with the Mainland, Hong Kong will continue to benefit from the Mainland’s vibrant growth and strong economic fundamentals. The medium-term outlook for the Hong Kong economy remains cautiously optimistic. The remarkable economic resilience of our vast hinterland will cushion Hong Kong against the uncertainties in the global environment in the longer term.
In 2009, the Mainland’s GDP grew by 8.7% and the growth is targeted to maintain at 8% in 2010. The high-speed railway development commenced since 2003 marks a cornerstone for all major cities throughout the country to be connected. It will generate more economic activities in and between the cities over the next 30 years of China’s opening up. The recent Central Economic Work Conference underlined the Central government’s pledge to speed up the process of substantial urbanisation and further relaxation over residence permits that would lend further support to housing demand. I remain enthusiastic on the fundamentals of the Mainland property market, where the Group’s motto of “Building for Tomorrow” is the right message internally and externally.
However, we also see new uncertainties looming for 2010 and 2011. They include the multi-government ‘exit strategies’ around the world, the fragile state of the European economy, and tension between China and the United States of America. The Group will persistently pursue its business objectives while maintaining its consistently sound financial management to ride out this exciting journey.
On behalf of all Shareholders and my fellow Directors, I wish to express our heartfelt appreciation to all Staff for their dedication and contribution throughout the year. In particular, Mr Gonzaga Li, Senior Deputy Chairman, is retiring after serving in the senior management nucleus for 30 years. I am personally indebted to him for his invaluable assistance to me over the years. Special mention is also due to our property teams who are fully energised and motivated to help propel the Group and to make great advances to establish our leadership position in the segment.
Peter K C WooChairmanHong Kong, 23 March 2010

8The Wharf (Holdings) Limited Annual Report 2009
2009 2008 HK$ Million HK$ Million
ResultsTurnover 17,553 15,940Operating profit before depreciation, amortisation, interest and tax 9,855 8,935Profit before property revaluation surplus 7,817 4,194Profit attributable to equity shareholders 17,501 6,247Earnings per share HK$6.35 HK$2.28Dividend per share HK$1.00 HK$0.80
Financial PositionTotal assets 190,461 168,554Total business assets 169,924 151,962Net debt 21,432 22,123Shareholders’ equity 115,210 99,494Total equity 122,164 105,857Net asset value per share HK$41.83 HK$36.13Net debt to total equity 17.5% 20.9%
Financial Hightlights
05 06 07 08 09
Shareholders’ Equity (HK$ Million)
115,21099,494
86,364
75,162
65,374
Year
Net Asset Value Per Share (HK$)
41.83
05 06 07 08 09
36.13
35.28
30.70
26.71
Year
05 06 07 08 09
Dividend Per Share (HK$)
1.00
0.80
Year
Group Profit Attributable to Equity Shareholders (HK$ Million)(before revaluation surplus)
7,817
05 06 07 08 09
4,194
5,947
4,285
4,499
Year 05 06 07 08 09
Earnings Per Share (HK$)(before revaluation surplus)
2.84
1.53
Year
2.34
1.75
1.84

9The Wharf (Holdings) Limited Annual Report 2009
Business Review
Harbour City & Times SquareLandmarks Harbour City and Times Square account for an exceptional 8% share of total retail sales throughout Hong Kong, and represent 51% of the Group’s total business assets and 62% of operating profit.
China PropertiesProperty Development is an additional cylinder for growth. From a land bank in Mainland China of over 100 million square feet, only 3.7 million square feet were recognised in 2009 but operating profit surpassed HK$1 billion for the first time, at an attractive margin of 33%.
Modern TerminalsRevenue and operating profit were challenged by the global economic downturn. Yet favorable finance costs and effective cost initiatives mitigated Modern Terminals' net profit decline to 4%.
Other BusinessesThe Group's portfolio also includes Other Properties, Hotels, Communications, Media and Entertainment (CME), and Transportation.
Corporate Social ResponsibilityWharf ’s commitment to Building for Tomorrow extends to corporate social responsibility and organizational development. The Group is firmly committed to the sustainability of the community.
Managing Director’s Report

10The Wharf (Holdings) Limited Annual Report 2009
HARBOURCITY
”The gradually recovering global economy and stability in Asia are rebuilding consumer sentiments among both locals and visitors. We enthusiastically see attractive potential in the coming years from our landmarks Harbour City and Times Square which together generate around HK$6 billion of rental billings annually.“
Doreen LeeExecutive Director, The Wharf (Holdings) Limited

11The Wharf (Holdings) Limited Annual Report 2009
HARBOURCITY

12The Wharf (Holdings) Limited Annual Report 200912
Business Review
Harbour City
The premium location, diversified trade mix, well-rounded ancilliary services and innovative marketing campaigns... made Harbour City the ideal destination for shoppers and companies.
Total Business Assets
HK$ 63,221 million
Revenue
HK$ 5,356 million
Operating Profit
HK$ 4,071 million
The Wharf (Holdings) Limited Annual Report 2009

13The Wharf (Holdings) Limited Annual Report 2009
Statement of Financial Position (Extract)As at 31 December 2009
Business Assets HK$ Million
Properties 62,581
Hotel and club (cost less depreciation) 247
Other assets 393
Total business assets 63,221
Gross Revenue2009
HK$ Million2008
HK$ Million Change (%)
Retail 2,550 2,166 +18
Office 1,662 1,585 +5
Serviced Apartments 255 275 -7
Hotel and Club 889 1,042 -15
5,356 5,068 +6
Operating Profit2009
HK$ Million2008
HK$ Million Change (%)
Retail 2,199 1,796 +22
Office 1,461 1,381 +6
Serviced Apartments 180 198 -9
Hotel and Club 231 351 -34
4,071 3,726 +9

14The Wharf (Holdings) Limited Annual Report 2009
Business Review
Habour City
Harbour City is the single largest shopping mall in town, it
represents about 75% of the total shopping area of Canton Road.
Harbour City posted remarkable results for 2009, which marked its notable resilience to the global economic downturn and reaffirmed its distinguished position in the marketplace. Harbour City alone accounted for an unmatched 5.6% of total Hong Kong retail sales in 2009.
Harbour City (excluding hotels) achieved a turnover of HK$4,467 million during the year, an increase of 11% over 2008, while its operating profit rose by 14% to HK$3,840 million. Excluding the three hotels which are stated at cost less accumulated depreciation, Harbour City was valued at HK$62,581 million at the end of 2009. Harbour City’s total business assets represented 37% that of the Group.
RetailThe local retail market, despite being rocked by the onset of the global economic turmoil and the swine flu pandemic, has shown a marked revival since the latter part of 2009 as a result of a steadily recovering economy in tandem with a distinct upturn in local consumer sentiment. Spurred by a notable increase in the Mainland visitor arrivals, the retail market staged a strong recovery towards the end of 2009. Total retail sales of 2009 as a whole increased by 0.6% in value from a year earlier.
Retail performance at Harbour City consistently and significantly beat the overall retail market. For the full year of 2009, tenants at Harbour City registered
Total retail sales of Harbour City in 2009 set a new record at HK$15.5 billion, grew by 16% from previous year, and represented 5.6% of the total retail sales in Hong Kong
Revenue (HK$ Million)
5,356
05 06 07 08 09
5,068
4,328
3,7223,332
Year
05 06 07 08 09
Property Value (HK$ Million)
(hotel and club excluded)
62,58156,268
55,225
48,76545,118
Year

15The Wharf (Holdings) Limited Annual Report 2009
The world’s second largest Louis Vuitton
flagship store in Harbour City
Enjoying the unique Victoria Harbour view
over a sumptuous meal on the 4th floor patio
a 16% year-on-year growth in total retail sales, outperforming the market by over 15 percentage points, thanks to the mall’s premier location, sustained quality for the most exhilarating and rewarding shopping experience, diversified trade-mix and powerful retail marketing. In 2009, turnover of Harbour City’s retail sector grew by 18% to HK$2,550 million. Retail occupancy was committed at virtually 100% throughout the year while rents grew favorably. Total retail sales in 2009 set a new record at HK$15.5 billion, with the average sales per square foot in December surging to a record high of close to HK$2,400.
With the opening of the world’s second largest Louis Vuitton store as well as Hermès boutique in 2008, Harbour City continued to recruit a host of new and international designers’ labels such as Cartier, Moncler, and Vacheron Constantin etc. during 2009 to enrich the tenant mix as well as the retail shopping experience. The Food and Beverage sector at Harbour City has been further refined, with recruitment of BLT Burger, BLT Steak, Hip-Katsu and Nha Trang Vietnamese, which have been well-received by patrons.
Harbour City has been well-positioned to weather the aftershocks of the global economic recession on the back of its leadership retail management. With a critical mass of stores across a finely-calibrated price point matrix of luxury, middle market and high street, Harbour City is renowned for its diversified trade-mix and its proven win-win partnership with leading tenants. Harbour City has created some high-growth clusters which have showcased their
leadership category positioning – KidX for kids (the best of class selection), Cosmetics (over 200 brands), SportX, Audio-visual Centre and Shoes (more than 100 brands).
Other complementary/ancillary facilities such as cinemas, fitness centres, recreational clubs and gallery facilitate the liveliest shopping experience at Harbour City.
Harbour City: Retail Tenant Mix (by Rental and Area)
% by Rental % by Area
Fashion 36.4 26.8
Leather Goods - Shoes Bags & Related Trades 23.9 11.8
Department Stores, Confectionery Products 12.0 7.4
Jewellery, Beauty and Accessories 11.5 20.6
Restaurant, Fast Food, F&B 5.2 15.5
Children’s Wear & Related Trades, Toys 3.5 6.6
Sports Wear 2.8 3.0
Electrical & Audio-visual Equipments 2.2 2.3Others 2.5 6.0
Total 100.0 100.0

16The Wharf (Holdings) Limited Annual Report 2009
Harbour City is among the first to introduce the ‘art and culture’ element to the shopping mall and office premises.
Premier location is one of the crucial factors contributing to the success of Harbour City. The Harbour City shopping mecca is a mega retail footprint at the heart of Hong Kong’s most dynamic and productive retail district. It is also the largest retail offer under one roof in Hong Kong and represents around 75% of the retail representation of Canton Road which by itself has formed a good critical mass.
Powerful retail marketing enables Harbour City to continuously excel in the marketplace. Its concerted efforts in staging innovative and product-driven promotions as well as sales-driven initiatives successfully boosted foot traffic and retail sales at Harbour City. Harbour City is among the first to introduce the “music in the city” in every weekend and to hold regular extraordinary art exhibitions with designated themes. It is also the pioneer in launching street parties at Canton Road to celebrate festive seasons. In addition, Harbour City has established long-term strategic partnerships with premiere partners such as China Union Pay (“CUP”). In
2009, total sales transactions of CUP at Harbour City were HK$5.3 billion, up by 65% from a year earlier.
Harbour City will continue to put in the best of its efforts to fortify its competitive edge and to stay ahead of competition at all times.
OfficeThe office leasing market, being
adversely affected by the global
economic turmoil in the first half of
2009, turned up in the latter half of the
year following a rebound in economic
activity and henceforth an improved
outlook. The office sector at Harbour
City, on the back of positive rental
reversion, performed satisfactorily.
Turnover grew by 5% to HK$1,662
million. Committed office occupancy
was maintained at 93% at the end of
2009. Following the relocation of Sony
Corporation from The Lee Gardens to
The Gateway, Taishin International Bank,
being enticed by the cluster of Taiwanese
banks in Harbour City, has recently
committed a floor at The Gateway by
relocating from Admiralty.
Business Review
Habour City

17The Wharf (Holdings) Limited Annual Report 2009
Despite the challenging economic environment, there were a number of ‘in-house expansions’ at Harbour City including Estée Lauder, Mizuho Corporate Bank and Prudential. These expansions are of particular significance for Harbour City as other companies were relocating their offices to Kowloon East in anticipation of cost savings.
Lease renewal retention rate at Harbour City held up reasonably well at 67% during the year, with favourable rental increment. These included a host of anchor tenants such as APL, Japan
Airlines, LG Sourcing, Marks and Spencer, and Prudential etc. Thanks to its superb location at the heart of the business hub of Tsimshatsui with ideal transportation network, Harbour City continues to be a natural choice for multinationals, mainland and local enterprises. Well-rounded ancillary services including the mega shopping mall, three Marco Polo hotels, fitness centres and private recreation clubs enable the office sector at Harbour City to be better-positioned by comparing to other ‘pure office’ districts. In an effort to stay ahead in the increasingly competitive marketplace,
Office Occupancy at Harbour City Gateway II Gateway I Others
Total GFA (sq ft) 1,570,000 1,128,000 1,737,000
Average Occupancy 95.5% 94.1% 89.0%
Harbour City: Portfolio Information Gross Floor
Area (sq ft)
Revenue (HK$ Million)
Average Occupancy
(%)
Year-endValuation
(HK$ Million)
Retail 1,948,000 2,550 95 24,311
Office 4,435,000 1,662 93 31,840
Serviced Apartments 670,000 255 79 6,430
Hotel and Club (Stated at amortised cost) 1,364,000 889 82 5,160
the leasing and property management teams will further improve the premises and be flexible to cope with market changes.
Serviced ApartmentsWith a decrease in average occupancy, turnover for the serviced apartments dropped by 7% to HK$255 million. At the end of December 2009, committed occupancy at Gateway Apartments was maintained at 87% (2008: 87%). Large units of two-bedroom and three-bedroom apartments continued to enjoy virtually full occupancy.
The Gateway Apartments are popular
among expatriate and business travelers on
extended business trips
18The Wharf (Holdings) Limited Annual Report 2009
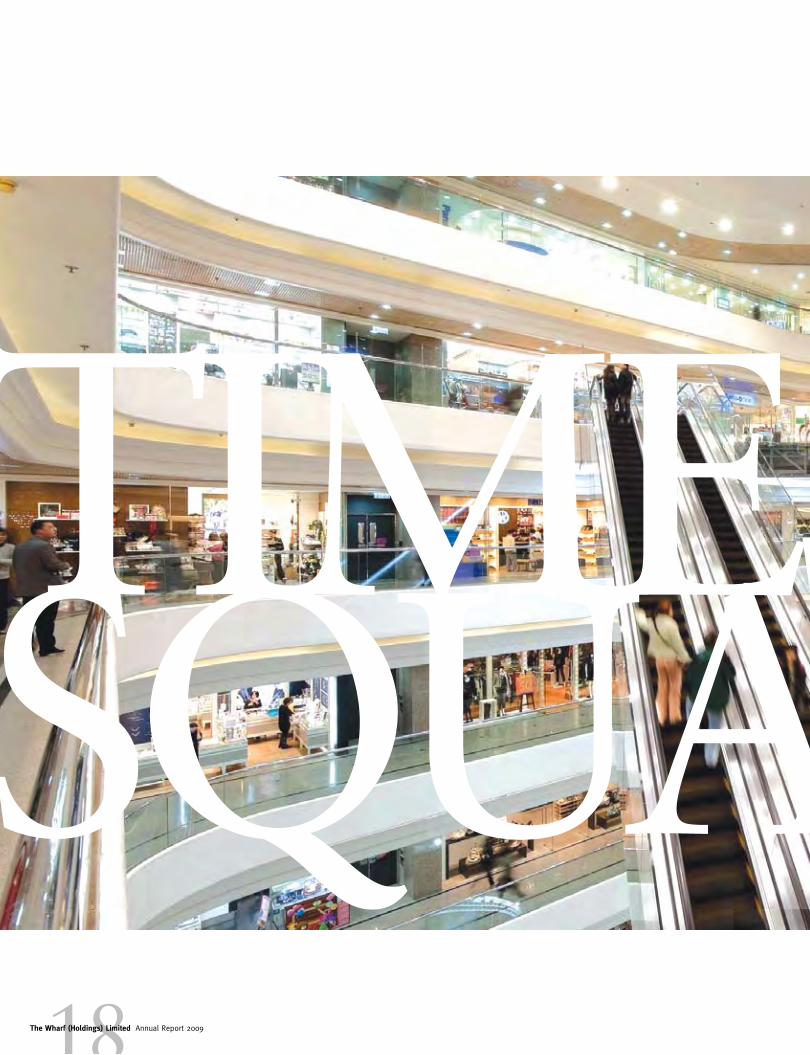
TIMESSQUARE

Times Square is the most successful vertical mall in town achieving close to HK$1 billion retail rental revenue in 2009
19The Wharf (Holdings) Limited Annual Report 2009
TIMESSQUARE

Business Review
Times Square
20The Wharf (Holdings) Limited Annual Report 2009
Total Business Assets
HK$ 24,057 million
Revenue
HK$ 1,426 million
Operating Profit
HK$ 1,242 million
The right merchandising, right foot traffic and right rental are instrumental to the success of Times Square.
20The Wharf (Holdings) Limited Annual Report 2009

Statement of Financial Position (Extract)As at 31 Decemeber 2009
Business Assets HK$ Million
Properties 24,000
Other assets 57
Total business assets 24,057
Gross Revenue2009
HK$ Million2008
HK$ Million Change (%)
Retail 956 871 +10
Office 470 440 +7
1,426 1,311 +9
Operating Profit2009
HK$ Million2008
HK$ Million Change (%)
Retail 826 739 +12
Office 416 385 +8
1,242 1,124 +10

22The Wharf (Holdings) Limited Annual Report 2009
One of the most successful vertical malls in town offering 1 million square feet of retail space, Times Square’s 2009 retail sales accounted for 2.4% of Hong Kong’s total.
Times Square turned over HK$1,426 million during 2009, for an increase of 9% over 2008. Operating profit rose by 10% to HK$1,242 million. Times Square was valued at HK$24,000 million at the end of 2009. Times Square’s total business assets represented 14% of the Group’s.
RetailTurnover for Times Square’s retail sector increased by 10% to HK$956 million. Average retail occupancy was maintained at virtually 100%, with favourable rental growth. In a bid to enrich the product offerings, tenant mix was further refined, with recruitment of a spate of international and trendy labels including CK Calvin Klein, Jill Stuart, Levi’s, Replay etc during the year. The audio-visual cluster at Times Square was further strengthened with the opening of Radar Audio Company and Sunlite Computronics. Toast Box, a popular toast and coffee shop operated by Singapore’s Megabite opened in the basement in March 2009, has met with favourable responses. The Food Forum has been further fine-tuned with recruitment of a host of quality operators including Budaoweng Hotpot Cuisine and SML which opened in June and August 2009 respectively.
The new sky escalators in the atrium of the mall were completed in November 2009 and are now up and running. These escalators are not only exciting but also improving the circulation of the mall. Successful zoning at Times Square facilitated an even distribution of foot traffic around the retail mall.
Times Square, similar to Harbour City, displayed its resilience in weathering the storm during 2009. It is among the most successful vertical malls in town, with unique design (16 floors), exciting and diverse trade-mix as well as direct link to the Mass Transit Railway in Causeway Bay. It is also the single largest iconic mall, with one million square feet in the prime retail district on Hong Kong Island, providing endless excitement to shoppers under one roof. It manages to achieve total retail rental revenue close to HK$1 billion in 2009.
The success of Times Square was underpinned by its right merchandising, right foot traffic and right rental rates. Constant trade-mix enhancement, strong branding and innovative marketing initiatives enabled Times Square to stay ahead in the marketplace. The New
Business Review
Times Square
Revenue (HK$ Million)
1,4261,311
1,139
1,000
886
05 06 07 08 09
Property Value (HK$ Million)
(hotel and club excluded)
24,00022,000
21,10019,200
17,350
05 06 07 08 09
Year
Year
The renowned art master
Jimmy Liao’s exhibition
was held in 2009 during
Christmas

23The Wharf (Holdings) Limited Annual Report 2009
Year’s Eve Apple Countdown which attracted a myriad of visitors annually to celebrate the arrival of the new year has been a Hong Kong landmark event since 1993. Times Square, over the years, supported and organised exhibitions of both local artists and world-renowned art masters including Ju Ming, Huang Yong Yu and Jimmy Liao and has evolved itself as an art and cultural hub. It will continue to strengthen its leading position through continuous brand-mix refinement and providing shoppers with vibrant and all-round shopping experience. The Group is poised to embark on a myriad of exciting plans, which will be unveiled in the near future.
Times Square: Retail Tenant Mix (by Rental and Area)
% by Rental % by Area
Fashion 32.0 19.7
Jewellery, Beauty and Accessories 23.6 11.3
Restaurant, Fast Food, F&B 13.4 20.7
Department Stores, Confectionery Products 10.6 12.9
Electrical & Audio-visual Equipment & Entertainment 10.3 25.9
Sports Wear 8.0 5.4
Others 2.1 4.1
Total 100.0 100.0
OfficeTurnover from the office tenants rose by 7% to HK$470 million, on the back of positive rental reversion. Committed occupancy was maintained at 95% at the end of 2009.
Times Square remained to be the preferred location for many multinationals engaged in the service or consumer goods sectors. Lease renewal retention rate stood high at 75%, and renewals included AIA, Assicurazioni Generali, Coca-Cola, Walt Disney, etc. New lettings during the year included in-house expansions such as Assicurazioni Generali, Bershka, JTI and Mary Kay etc.
Times Square: Retail Tenant Mix (by Rental and Area)Gross Floor
Area (sq ft)
Revenue(HK$ Million)
AverageOccupancy
(%)
Year-endValuation
(HK$ Million)
Retail 936,000 956 99 15,022
Office 1,033,000 470 95 8,978
The only vertical mall with close
to HK$1 billion retail rental
revenue

24The Wharf (Holdings) Limited Annual Report 2009
ChinaProPerties
”“Andrew Chow Vice Chairman, Wharf China Development Limited
We are dedicated to building Wharf China to become a forerunner among all Hong Kong developers in the China real estate market in the next 3 to 5 years.
”While we continue to place top management focus to our China business, we would not have achieved what we did without leveraging local knowledge and organisation which enhance efficiency and effectiveness. Commitment to localization is the inevitable approach and a sustainable way to be really successful in China.
“T Y NgExecutive Director, The Wharf (Holdings) Limited, andSenior Managing Director, Wharf China Development Limited

25The Wharf (Holdings) Limited Annual Report 2009
ChinaProPerties
26The Wharf (Holdings) Limited Annual Report 2009
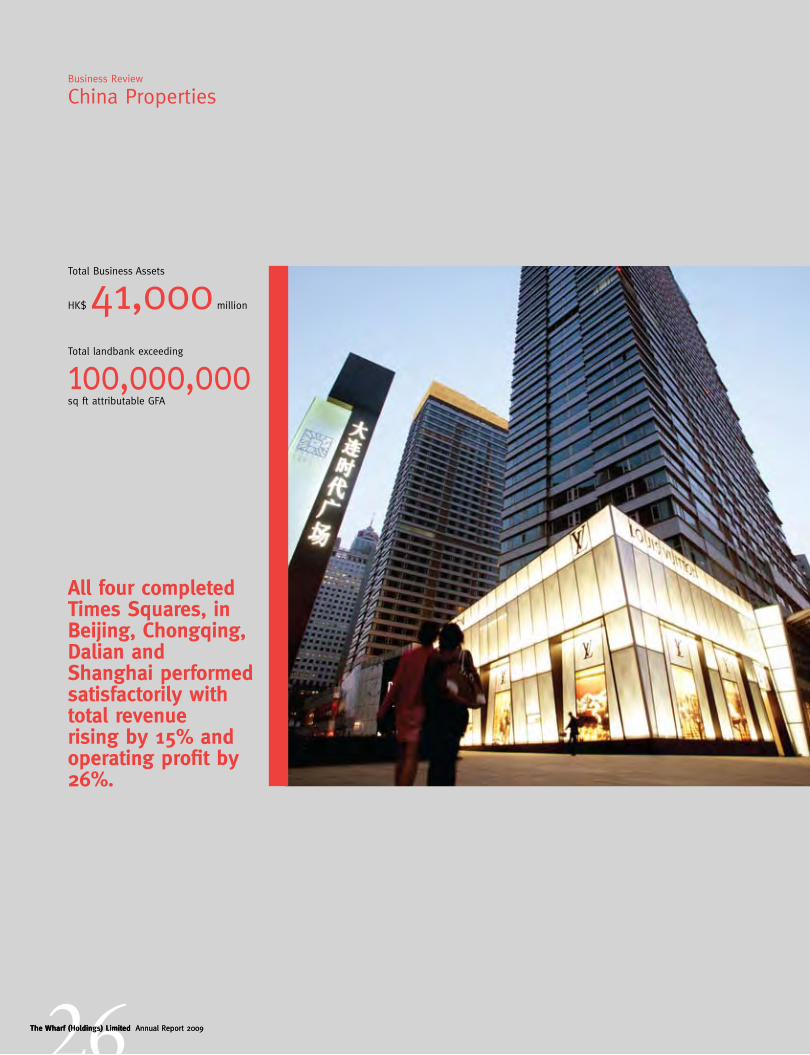
Total Business Assets
HK$ 41,000 million
Total landbank exceeding
100,000,000sq ft attributable GFA
All four completed Times Squares, in Beijing, Chongqing, Dalian and Shanghai performed satisfactorily with total revenue rising by 15% and operating profit by 26%.
Business Review
China Properties
26The Wharf (Holdings) Limited Annual Report 2009

Statement of Financial Position (Extract)As at 31 December 2009
Business Assets HK$ Million
Investment properties 12,809
Property inventory and development 16,979
Interest in associates/jointly controlled entities 7,634
Other properties and fixed assets 577
Other assets 3,001
Total business assets 41,000

28The Wharf (Holdings) Limited Annual Report 2009
Business Review
China Properties
The China property segment, while still at a relatively early stage of development, outpaced all other segments in profit growth in 2009.
Western China
47.2 million sq ft
ChinaOVERViEW

29The Wharf (Holdings) Limited Annual Report 2009
The Group’s strategy to increase its Mainland assets to 50% of the Group’s total is progressing well. Its land bank in the Mainland has already exceeded the interim target of 100 million square feet after its recent acquisition of six prime sites for development in the cities of Chengdu, Chongqing, Hangzhou and Tianjin since September 2009.
In investment properties, all four completed Times Squares, in Beijing, Chongqing, Dalian and Shanghai performed satisfactorily. Total revenue spurred by a full-year contribution from Dalian Times Square, which opened in late 2008, rose by 15% and operating profit by 26%. The disposal of the Beijing Capital Times Square in November 2009 for RMB2.7 billion at an after-tax profit
The Group’s land bank in the mainland has already exceeded the interim target of 100 million square feet.
amounting to HK$1.4 billion was recognised in 2009.
Turnover for property development grew by HK$2,355 million to HK$3,065 million and profit before tax improved by HK$1,242 million to HK$1,074 million.
Thanks to the economic stimulus measures by the Central Government, the property market in the Mainland, following a fall-off in late 2008, has regained momentum and turned up distinctly in 2009. Underpinned by its reputable brand strength, execution capability and well-located residential projects, the Group has proven track record of price leadership in the marketplace. Both sales volume and prices achieved have been kept on a rising trend. As a result, the Group has surpassed its 4.5-million-square-foot sales target for the full year of 2009. A total of 4.7 million square feet of properties were sold or pre-sold in 2009, with a combined value of RMB4.6 billion, primarily in Chengdu, Chongqing, Dalian, Shanghai and Wuxi.
Other regions
4.4 million sq ft
Eastern China
52.1 million sq ft
ChinaOVERViEW

30The Wharf (Holdings) Limited Annual Report 2009
BEST OF THE WEST
Business Review
China Properties
Western ChinaProperty Investment The Group was particularly active in Chengdu, Sichuan. Chengdu International Finance Centre is the Group’s next flagship development. Ideally located in Hongxing Road (紅星路) in the heart of the city’s business centre, it is comparable in scale and significance to Harbour City in Hong Kong. It will comprise a mega retail complex, Grade A offices, a five-star hotel and luxury residences. From its superb location in the city’s main commercial district, the project will link to the adjacent mass transit railway station where two lines intersect. It aims to become the “Best of the West” as the new shopping hub for not only Chengdu but also the entire Western region. Foundation work has commenced. Phase one of the project comprising the mega retail complex and one office tower is targeted to complete by the first half of 2013.
Property DevelopmentOver 99% of the first nine residential towers (Times Residences) at Tian Fu Times Square in Chengdu, six of which launched during February-October 2009, have been sold/pre-sold. The first three
towers were completed and the related property sales profits were recognised in 2009. Over 99% of the first eight residential towers at Crystal Park, six of which launched during February-June 2009, have been sold/pre-sold. The ninth residential tower has recently been launched for sales since mid-January 2010. Over 98% of these units offered were pre-sold within one month at an average price of over RMB9,200 per square metre, which has surged notably from the previous price levels. The first four towers were completed and the related property sales profits were booked in 2009.
In Chongqing, the CBD International Community project in Danzishi (彈子
石) of Nanan District (南岸區) along the Yangtze River (長江), ideally located in the future headquarters hub of Chongqing and developed by the Group and China Overseas Group on a 40:60 basis, has pre-sold over 99% of its first 13 residential towers and 88% of its retail units launched. The development comprises 22.6 million square feet GFA of high-end comprehensive residences, apartments/retail development and is expected to be completed in phases by 2014.
Other Projects under DevelopmentIn Chengdu, a site in Shuangliu Development Zone (雙流發展區) will be developed into a commercial and residential complex with an attributable GFA of 9.8 million square feet. In Phase one, an outlet mall, namely, Times outlets with an attributable GFA of 680,000 square feet, started trial operation on 27 November 2009. Grand opening was held on 18 December 2009. It attracted a spate of reputable international and local brands including Adidas, Cerruti 1881, Guess, Hush Puppies, Kent & Curwen and Nike etc. In addition, a site in Dongda Jie (東大
街) of Jinjiang District (錦江區) will be Tian Fu Times Square, Chengdu
Chengdu
Chongqing

31The Wharf (Holdings) Limited Annual Report 2009
BEST OF THE WEST
Crystal Park, Chengdu
Chongqing Times Square
developed with Sun Hung Kai Properties and Henderson Land in the near future. The Group’s 30% stake translates into an attributable GFA of over 4.0 million square feet.
Separately, listed subsidiary Harbour Centre Development Limited (“HCDL”) is developing a prime site in Chongqing, a joint development with China Overseas Group with HCDL owning 55%, which is ideally located in Jiangbei City (江北城) facing both Yangtze River (長江) and Jialing River (嘉陵江). Chongqing is designated as one of the five national central cities and is the only one in the central and western China region. Jiangbei City is to become the future Central Business District (“CBD”) with excellent transportation links. Furthermore, light railway lines 6 and 9 will be passing this area with respective stations near the site. Developments in this new CBD include City of Memory (記憶之城) comprising public facilities, three theme parks and shopping centres, together with City of Future (未來之城) comprising Grade A office buildings, 5-star hotels and shopping centres. This Chongqing project, adjacent to the Chongqing City Grand Theatre (重慶大劇院), the Chongqing Science Museum (重慶科技館) and the Central Park (中央公園), boasts a site area of about one million square feet and offers an attributable GFA of 2.5 million square feet. Planning approval is underway. This prestigious residential development is scheduled for completion in phases by 2014.
New AcquisitionThe Group, since September 2009, has acquired two prime sites in the cities of both Chengdu and Chongqing.
In Chengdu, following its acquisition of five prime sites over the past few years, the Group has acquired, since November 2009, another two sites close to the city centre for residential development. One of the sites is located at Jinjiang District (錦江區) and bounded by Dongdajie (東大街) to its southern side and Jinhua Nan Lu (經華南路) to its eastern side. It is close to the junction of first Ring Road and Dongdajie, which provides direct access to the city centre and major districts in Chengdu. Metro line 2 will pass through Dongdajie with a stop at Niushikou (牛市口), 500 metres from the site. The development boasts a site area of 160,000 square feet and offers a GFA of 639,000 square feet. Planning and design are in progress. Construction is targeted to commence by mid 2010. Another site is located at a mature residential area in east second Ring Road of Chenghua District (成華區,川
棉廠) with sufficient community facilities nearby. It offers a GFA of 3.5 million square feet and will be developed into upscale residences.
Following its acquisition of one site in Jiangbei City (江北城) and one site in Danzishi (彈子石) of Chongqing which are designated to be the future CBD with good transportation networks, the Group
acquired another two sites in Jiangbei City. All of these sites are developed together with China Overseas Group. With these acquisitions, the Group has become the dominant player in the future CBD of Chongqing that secures its distinct positioning in the district. The two recent sites, being developed by the Group and China Overseas Group on a 50:50 basis, boast a site area of 2.9 million square feet developable into 14.4 million square feet (attributable GFA: 7.2 million square feet). One of the sites perfectly located at the centre of Jiangbei City, is for commercial development. This site, which embraces a GFA of 4.8 million square feet (attributable GFA: 2.4 million square feet), will be developed into a large commercial complex comprising retail, offices and apartments. Another site which offers a GFA of 9.6 million square feet (attributable GFA: 4.8 million square feet), will be developed into high-end residences. Construction is targeted to commence in the third quarter of 2010 and completion is expected to take place in 2018.

32The Wharf (Holdings) Limited Annual Report 2009
Business Review
China Properties
Eastern ChinaProperty Investment Probably the tallest building in Puxi, Shanghai, the Wheelock Square at Nanjing Xi Road (南京西路), with an attributable GFA of 1.2 million square feet of premium Grade A offices, is scheduled for completion by June 2010. Marketing of Wheelock Square is in progress following the completion of the show suite in 2009. Commitments and letter of intent received so far are encouraging.
Property Development In terms of property development, No. 1 Xin Hua Road in Shanghai is a low density super-deluxe residential development ideally located at the junction of Xin Hua Road (新華路) and Huai Hai Xi Road (淮海西路) in Changning District (長寧區). The first four residential blocks have been launched since August 2009, of which 86% have been pre-sold at an average price of RMB80,000 per square metre. Latest transactions witnessed an average price exceeding RMB100,000 per square metre. The development is expected to be completed by July 2010.
At Wellington Garden, 100% of the units had been sold at the end of December 2009.
In Wuxi, the first 22 residential towers (Wuxi Times City) at Wuxi Taihu Plaza have been launched since August 2009, of which 83% have been pre-sold at excellent prices. 14 of these towers were launched in 2009 while the rest in the first quarter of 2010. Construction work for the first phase of residential development is underway. The whole development is scheduled for completion in phases by 2015.
Other Projects under Development The Jingan Garden in Shanghai is well located at the prime residential area of Jingan District on Wanhangdu Road (萬航渡路). It offers an attributable GFA of 763,000 square feet. Construction work is expected to commence in the fourth quarter of 2010. The development is scheduled for completion by 2013.
In Suzhou, a site located between Jinji Lake (金雞湖) and Dushu Lake (獨墅湖) on the eastern side of the city and next to a 27-hole golf club will be developed into deluxe low density residences with an attributable GFA of 2.1 million square feet. Construction work has commenced since the fourth quarter of 2009. Another site, located in the Suzhou Industrial Park (蘇州工業園區) next to Qing Jian Hu (青劍湖) and Wei Ting Sun Island Golf & Resorts (唯亭太陽
島高爾夫俱樂部), is being developed by the Group and China Merchants Property on a 50:50 basis. The residential development will have an attributable GFA of 0.9 million square feet.
In Hangzhou, a site ideally located in a prime area in the Xihu District (西湖區), Zhuantang Town (轉塘鎮) and next to West Lake International Golf & Country Club (西湖國際高爾夫俱樂部) in the proximity of Songcheng (宋城), is jointly developed with Jindu on a 50:50 basis. It will offer an attributable GFA of 2.0 million square feet and is scheduled for completion in phases by 2014. Construction work for the first three phases has commenced.
In Wuxi, a site located along Beijing-Hangzhou Grand Canal (京杭大運河) at Renmin Plaza (人民廣場), in the new CBD Nanchang (南長區), comprises two parcels of land with a total attributable GFA of 11.9 million square feet. One
Wheelock Square, Shanghai
Changzhou
WuxiSuzhouShanghai
Hangzhou

33The Wharf (Holdings) Limited Annual Report 2009
parcel is planned for an upscale residential project (8.9 million square feet), namely, Wuxi Times City. Pre-sale of which has commenced since August 2009 and its sales progress has been previously described. The other land parcel is for a high-rise commercial development, which comprises offices (including a super high rise tower), hotel and apartments, is expected to be completed by 2016.
The second site in Wuxi comprising three land parcels is also located in Nanchang District (南長區) and alongside the 2,500-year-old ancient canal. They offer a total attributable GFA of 7.0 million square feet. Two parcels are wholly owned by the Group (GFA: 5.2 million square feet) and the third (GFA: 3.5 million square feet) is being developed with Shanghai Forte on a 50:50 basis. These commercial and residential developments are scheduled for completion in phases by 2014 to 2015.
Meanwhile the Group’s listed subsidiary, HCDL, is developing four prime sites in the cities of Shanghai, Suzhou, and Changzhou.
In Shanghai, the Xinjiangwancheng (新江灣城) development boasts a site area of 0.6 million square feet and GFA of 1.08 million square feet. Xinjiangwancheng provides the only original ecological environment in association with abundant green and wetlands within the city of Shanghai, and is established to accommodate the concept of high quality living community. The development, close to Wujiaochang (五角場), a commercial centre which has been positioned as one of the four vice city centres of Shanghai (上海市副中
心), consists of high end medium-rise residences. It is adjacent to a station of the Shanghai Metro line 10 which is expected to be in operation within this
year. Two other Metro lines (Line 17 & 18) near the site are also under planning. Scheduled for completion by 2012, construction of the project is underway with foundations being completed. The first phase of presales is targeted to be launched in the middle of this year.
The two Suzhou projects are developed by a joint venture owned 80:20 respectively by HCDL and Genway Housing Development. Together, they embrace a total site area of 5.65 million square feet and offer an attributable GFA of 13.5million square feet.
The first project is located in Xinghu Jie (星湖街) in the new CBD. A 450-metre skyscraper landmark (mixed office, hotel and apartment building), tallest in Jiangsu Province with a panoramic view over Jinji Lake and the city skyline, will be built. Underground connections will provide seamless access to two nearby subway stations. The project will also benefit from well-established regional transportation networks comprising highly efficient highways and rapid trains connecting with Shanghai, Hangzhou and Nanjing. A ground breaking ceremony was held in early March and excavation works have commenced. The project is scheduled for completion by 2016.
The second project is located at Xiandai Da Dao (現代大道) in Suzhou Industrial Park (蘇州工業園區). There will be sizeable residential developments to cater to the solid and steady demand for residential properties in the Park, where master town planning is of international standard. The site, perfectly located on the axis of eastern expansion of Suzhou along the main east-west thoroughfare of Xiandai Da Dao, and next to the future subway terminal, is divided into four plots, each of which will be developed by phases into high-end residential developments. Construction work for the
first phase commenced in March, 2010 and the whole development is scheduled for completion by 2017.
The Changzhou project is ideally located in the future CBD of Xinbei District (新北區), five kilometers away from the city centre, in the vicinity of the national AAAA scenic area China Changzhou Dinosaur Land theme park (中華恐龍
園) and Xin Qu Park (新區公園), with excellent air-sea transportation links to Changzhou Airport and Huning Express Railway. The project commands a total site area of 4.4 million square feet and offers an attributable GFA of 8.7 million square feet. The development comprises mainly high-end residences including high-rise buildings, semi-detached houses and villas, a 5-star hotel and a State Guest House. Construction works for the residential developments have commenced. The whole project is scheduled for completion in phases by 2016, with the first phase of presales launched in March.
New AcquisitionThe Group has its second project for residential development in Hangzhou further to the newly acquired land parcel in November 2009. It comprises two sites located at Gongshu District (拱墅
區), a traditional residential district with well-developed living facilities, and near the historical Gongchen Bridge (拱辰
橋) and Beijing-Hangzhou Grand Canel (京杭大運河) of Hangzhou. These sites boast a site area of 914,000 square feet and offer a GFA of 2.4 million square feet. Construction work is expected to commence in the first quarter of 2011. The whole development is scheduled for completion by 2014.
No. 1 Xin Hua Road, Shanghai
34The Wharf (Holdings) Limited Annual Report 2009
Business Review
China Properties
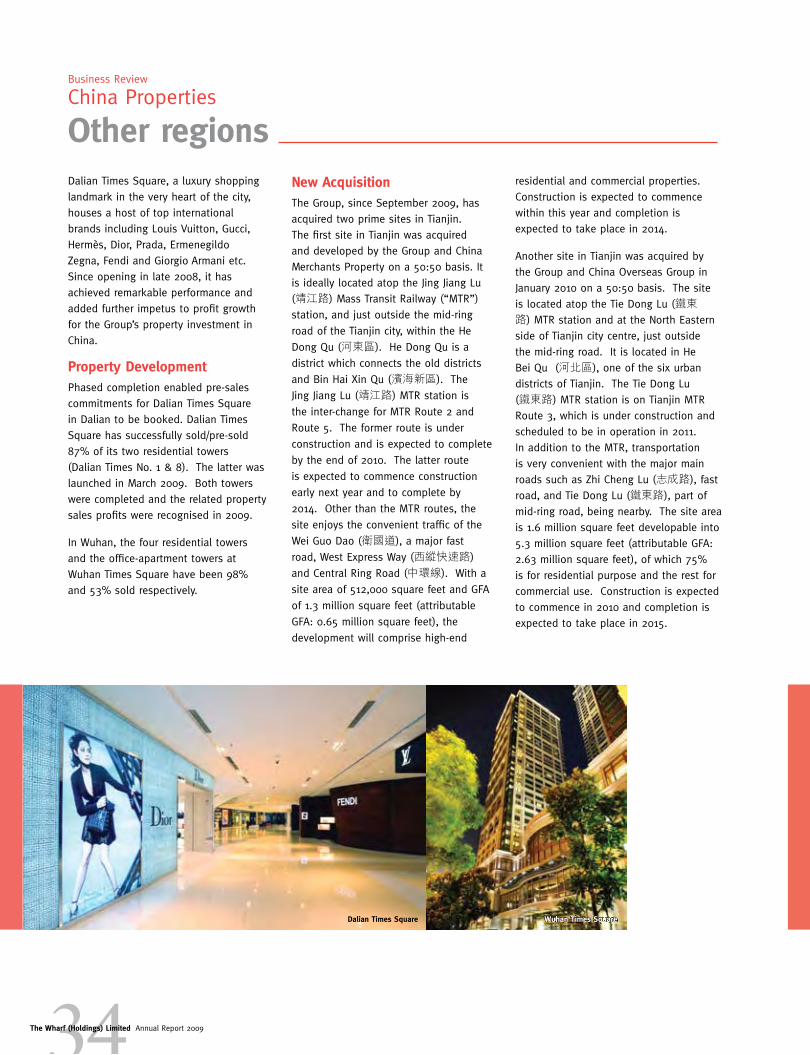
Dalian Times Square, a luxury shopping landmark in the very heart of the city, houses a host of top international brands including Louis Vuitton, Gucci, Hermès, Dior, Prada, Ermenegildo Zegna, Fendi and Giorgio Armani etc. Since opening in late 2008, it has achieved remarkable performance and added further impetus to profit growth for the Group’s property investment in China.
Property DevelopmentPhased completion enabled pre-sales commitments for Dalian Times Square in Dalian to be booked. Dalian Times Square has successfully sold/pre-sold 87% of its two residential towers (Dalian Times No. 1 & 8). The latter was launched in March 2009. Both towers were completed and the related property sales profits were recognised in 2009.
In Wuhan, the four residential towers and the office-apartment towers at Wuhan Times Square have been 98% and 53% sold respectively.
residential and commercial properties. Construction is expected to commence within this year and completion is expected to take place in 2014.
Another site in Tianjin was acquired by the Group and China Overseas Group in January 2010 on a 50:50 basis. The site is located atop the Tie Dong Lu (鐵東
路) MTR station and at the North Eastern side of Tianjin city centre, just outside the mid-ring road. It is located in He Bei Qu (河北區), one of the six urban districts of Tianjin. The Tie Dong Lu (鐵東路) MTR station is on Tianjin MTR Route 3, which is under construction and scheduled to be in operation in 2011. In addition to the MTR, transportation is very convenient with the major main roads such as Zhi Cheng Lu (志成路), fast road, and Tie Dong Lu (鐵東路), part of mid-ring road, being nearby. The site area is 1.6 million square feet developable into 5.3 million square feet (attributable GFA: 2.63 million square feet), of which 75% is for residential purpose and the rest for commercial use. Construction is expected to commence in 2010 and completion is expected to take place in 2015.
Other regionsNew AcquisitionThe Group, since September 2009, has acquired two prime sites in Tianjin. The first site in Tianjin was acquired and developed by the Group and China Merchants Property on a 50:50 basis. It is ideally located atop the Jing Jiang Lu (靖江路) Mass Transit Railway (“MTR”) station, and just outside the mid-ring
road of the Tianjin city, within the He
Dong Qu (河東區). He Dong Qu is a
district which connects the old districts
and Bin Hai Xin Qu (濱海新區). The
Jing Jiang Lu (靖江路) MTR station is
the inter-change for MTR Route 2 and
Route 5. The former route is under
construction and is expected to complete
by the end of 2010. The latter route
is expected to commence construction
early next year and to complete by
2014. Other than the MTR routes, the
site enjoys the convenient traffic of the
Wei Guo Dao (衛國道), a major fast
road, West Express Way (西縱快速路)
and Central Ring Road (中環線). With a
site area of 512,000 square feet and GFA
of 1.3 million square feet (attributable
GFA: 0.65 million square feet), the
development will comprise high-end
Dalian Times Square Wuhan Times Square

35The Wharf (Holdings) Limited Annual Report 2009
China Properties ListProject Nature
Attributable GFA
(sq ft)
StatusEffective
% Owned
retail office residential hotel servicedapartment
Completed under construction
under planning
Western China - Chengdu
Shuangliu Development Zone
Shuangliu Development Zone 9,127,000 100
Chengdu Times Outlet 680,000 100
Chengdu IFC 4,724,000 100
Tian Fu Times Square 4,156,000 * 100
Chengdu Shahe Project 4,046,000 (30%) ** 30
Crystal Park 3,807,000 * 100
Chuan Mian Project # 3,500,000 100
Chengdu Jinjiang District Yixinqiao St Project 639,000 100
Western China - Chongqing
The CBD International Community Project 7,908,000 * (40%) ** 40
Jiangbei City Project, Zone A & C 7,166,000 (50%) ** 50
Jiangbei City Project, Zone B 2,524,000 (55%) ** 39
Chongqing Times Square 591,800 100
Eastern China - Changzhou
Changzhou Dinosaur Park Project 8,590,000 70
Eastern China - Hangzhou
Hangzhou Hangyimian Lot C/D 2,422,000 100
Hangzhou Zhuantang Town Project 2,004,000 (50%) ** 50
Eastern China - Shanghai
Wheelock Square 1,228,000 98
Shanghai Xinjiangwancheng 1,074,000 70
Shanghai Times Square 973,000 100
Jingan Garden 763,000 55
No.1 Xin Hua Road 200,000 * 85
Eastern China - Suzhou
Suzhou Industrial Park
Xiandai Da Dao 9,765,000 56
Suzhou Super Tower 3,780,000 56
Lot No. 68210 Suzhou Industrial Park 2,123,000 100
Suzhou Wei Ting Project, Suzhou Industrial Park 908,000 (50%) ** 50
Eastern China - Wuxi
Wuxi Taihu Plaza Project
Taihu Plaza, Nanchang District, Wuxi 8,949,000 * 100
Wuxi Super Tower 3,013,000 100
Wuxi Old Canal Lot 72 2,670,000 100
Wuxi Old Canal Lot 71 2,551,000 100
Wuxi Old Canal Lot 73 1,760,000 (50%) ** 50
Other Regions
Tianjin Tie Dong Lu # 2,630,000 (50%) ** 50
Tianjin Jin Jiang Lu Project 646,900 (50%) ** 50
Dalian Times Square 518,000 100
Wuhan Times Square Tower 2 413,000 100
Wuhan Times Square Tower 1, 3, 4, 8 & 9 177,000 100
For details of completion date of above properties, please refer to Schedule of Principal Properties on pages 148 to 153* Partly pre-sold ** Being attributable percentage held through jointly controlled entities/associates and the respective GFA are shown on an attributable basis# Land sites acquired subsequent to 2009

36The Wharf (Holdings) Limited Annual Report 2009
ModernTerMinals

37The Wharf (Holdings) Limited Annual Report 2009
ModernTerMinals
The proactive and aggressive cost saving initiatives rolled out in 2009, effectively reduced the consolidated operating costs by 22%, with the consolidated operating profit held up at HK$1,307 million.
Statement of Financial Position (Extract)As at 31 December 2009
Business Assets HK$ Million
Fixed assets 13,898
Interest in associates/jointly controlled entities 4,063
Goodwill 297
Other assets 478
Total business assets 18,736
Business Review
Modern Terminals
Total Business Assets
HK$ 18,736 million
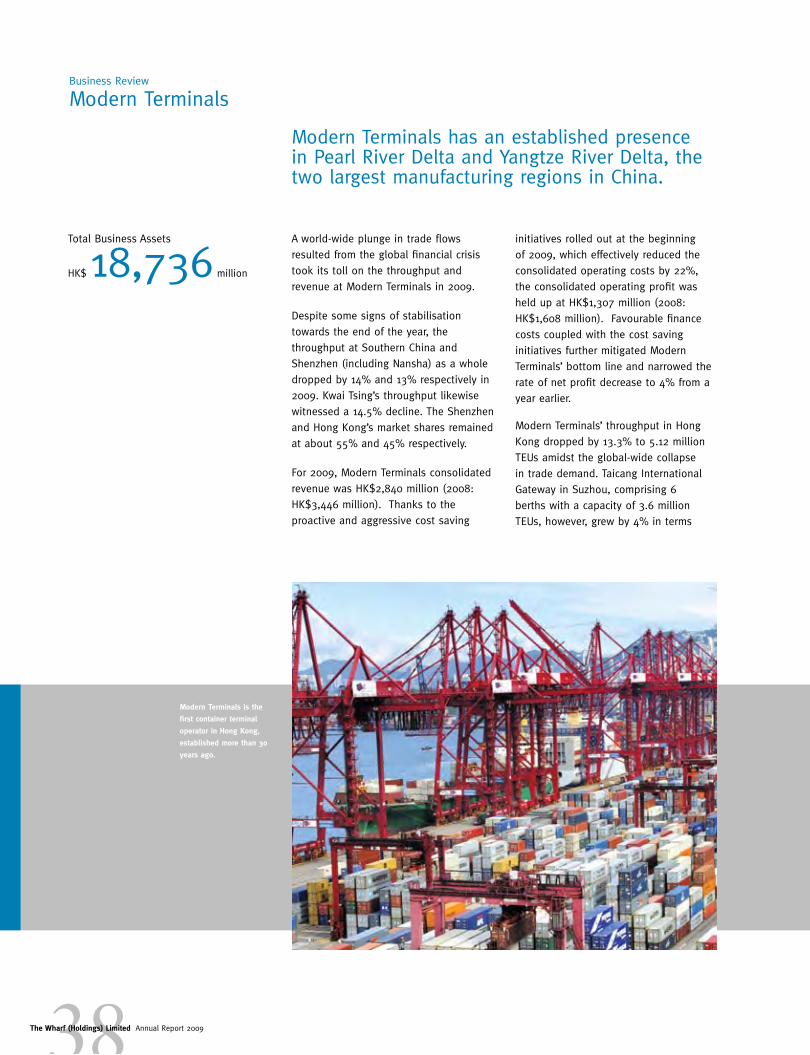
Modern Terminals is the
first container terminal
operator in Hong Kong,
established more than 30
years ago.
38The Wharf (Holdings) Limited Annual Report 2009
Modern Terminals has an established presence in Pearl River Delta and Yangtze River Delta, the two largest manufacturing regions in China.
A world-wide plunge in trade flows resulted from the global financial crisis took its toll on the throughput and revenue at Modern Terminals in 2009.
Despite some signs of stabilisation towards the end of the year, the throughput at Southern China and Shenzhen (including Nansha) as a whole dropped by 14% and 13% respectively in 2009. Kwai Tsing’s throughput likewise witnessed a 14.5% decline. The Shenzhen and Hong Kong’s market shares remained at about 55% and 45% respectively.
For 2009, Modern Terminals consolidated revenue was HK$2,840 million (2008: HK$3,446 million). Thanks to the proactive and aggressive cost saving
initiatives rolled out at the beginning of 2009, which effectively reduced the consolidated operating costs by 22%, the consolidated operating profit was held up at HK$1,307 million (2008: HK$1,608 million). Favourable finance costs coupled with the cost saving initiatives further mitigated Modern Terminals’ bottom line and narrowed the rate of net profit decrease to 4% from a year earlier.
Modern Terminals’ throughput in Hong Kong dropped by 13.3% to 5.12 million TEUs amidst the global-wide collapse in trade demand. Taicang International Gateway in Suzhou, comprising 6 berths with a capacity of 3.6 million TEUs, however, grew by 4% in terms

39The Wharf (Holdings) Limited Annual Report 2009
Market Share (HK) (%)
33.333.2
35.3
05 06 07 08 09
Throughput (HK) (Million TEUs)
5.12
5.9
5.725.425.04
05 06 07 08 09Year
Year
Modern Terminals is one of the world’s most efficient operators by productivity.
of container volume in 2009, coupled with a significant growth in breakbulk cargo alongside a revival in intra-Asia trade since the middle of 2009. Da Chan Bay Terminal One in Shenzhen, notwithstanding the difficult market climate, has successfully added eight new services throughout the year and now provides a full and comprehensive range of service routes to meet different customer needs. Chiwan Container Terminal, in which Modern Terminals holds an 8% attributable stake, handled 3.0 million TEUs and Shekou Container Terminals, in which Modern Terminals holds a 25% stake, handled 3.3 million
TEUs. Such 25% stake was diluted from 27% upon the completion of Stage three of the rationalisation agreement in March 2009 and will eventually be diluted to 20% with the completion of all stages of rationalisation.
Modern Terminals has an established presence in Pearl River Delta and Yangtze River Delta, the two largest manufacturing regions in China. The group will continue to seek business expansion opportunities, in line with China’s “Master Plan” for port development.
33.8 33.8

OtherBusinesses

41The Wharf (Holdings) Limited Annual Report 2009
OtherBusinesses
Statement of Financial Position (Extract)As at 31 December 2009
Business Assets HK$ Million
Properties 16,269
Interest in associates 52
Property inventory and development 818
Other assets 28
Total business assets 17,167
The Group’s other businesses, including the Plaza Hollywood, i-CABLE, Wharf T&T and the Marco Polo Hotels, have been most active in 2009.

Business Review
Other Businesses
1 Plantation Road
42The Wharf (Holdings) Limited Annual Report 2009
Marco Polo HotelsThe Group currently has a portfolio of ten operating Marco Polo hotels in the Asia Pacific region.
Total hotel and club revenue was HK$963 million. The three hotels in Harbour City were significantly impacted by the global recession and the swine flu pandemic that curtailed travel demand for most of the year. An 18% decline in the average room rate was the primary factor impacting overall performance. Consolidated occupancy in 2009 dropped to 82% (2008: 86%) as a result of a notable slowdown in inbound travel, particularly in the first half of 2009.
A new deluxe Marco Polo hotel in Jinjiang, Fujian opened in February 2010. Marco Polo is set to expand its footprint in Asia Pacific with six additional hotels. Additional Marco Polo hotels are planned for Changzhou, Chengdu, Suzhou and Wuxi in China; Manila in the Philippines and the first resort at Mission Beach in Australia.
Marco Polo hotels are achieving very strong performance in their respective locations with the Marco Polo Wuhan, Marco Polo Shenzhen, Marco Polo Davao and the Prince Hotel achieving leading competitive market positions.
Other Properties Highlights
Project Nature AttributableGFA
(sq ft)%
Ownedretail office residential industrial
The Peak Portfolio
1 Plantation Road 97,000 100
Mountain Court 49,900 100
Chelsea Court 43,000 100
77 Peak Road 32,000 100
Strawberry Hill - various units 13,000 100
Plaza Hollywood 562,000 100
Star House - various units 50,800 70
Wharf T&T Square 395,000 100
Delta House 349,000 100
Cable TV Tower - various units 566,000 100
Under Construction
Kowloon Godown 924,000 100
Cable TV Tower South* 585,000 100
Yau Tong Godown 255,700 100
Yau Tong JV Project 651,400 14.9* Foundation completed
Other Hong Kong PropertiesFor our Peak property portfolio, leasing activities remained active during the year. 1 Plantation Road, Chelsea Court and Mountain Court were over 90% let during 2009 with favourable rental growth.
Plaza Hollywood posted a 6% growth in turnover to HK$340 million, on the back of favourable rental growth during the year. Average occupancy was maintained at over 99% throughout 2009.
The Group continues to look for opportunities to dispose of its non-core properties in accordance with its policy.
Marco Polo Wuhan

43The Wharf (Holdings) Limited Annual Report 2009
Cable TV reached its 0ne
million mark for its household
subscribers base
i-CABLEi-CABLE has sharpened its business focus and exited marginal non-core businesses. It has emerged from the financial tsunami as a more focused, sharpened and vibrant organisation. Work processes have been streamlined and resources have been redeployed from support to content, marketing and sales. Renewed momentum marked the group’s performance in 2009. The momentum, together with effective cost control, reduced the loss after tax to HK$40 million, from HK$111 million in 2008. Turnover decreased by 16% to HK$1,754 million (2008: HK$2,080 million). The group’s cash position remains strong with net cash of HK$531 million as at 31 December 2009, despite an increase in capital investment in a new encryption system to protect its content and in production facilities for High Definition (HDTV) programmes.
Pay TV revenue bottomed out in mid-2009 and is on a course of firm rebound ahead of FIFA World Cup 2010 and the new Premier League season. High-yield Pay TV subscription resurged, spurred on by the shutting down of the old, leaky encryption system as well as the strong local content and acquired programmes such as the UEFA Champion and Europa Leagues. As a result, Pay TV subscribers grew by 9% year-on-year to exceed the one million mark at the end of 2009. The group is investing in more content, (HDTV), content protection and broadband upgrade. Steps are being taken to unlock the value hidden in i-CABLE’s content capability including Free TV, outdoor media and new media.
Wharf T&TBacked by the state-of-the-art fully fibre-optic network, Wharf T&T is the second largest fixed line operator, and the first and only comprehensive ICT since provide in Hong Kong.
Vindicating its deliberate ‘Strictly Business’ focus and ICT transformation over the past few years, Wharf T&T has made new history in 2009 and is very well positioned to take over as the up and coming leader for business customers. Buoyed by a noticeable rise in profits and cash flow, Wharf T&T outperformed the competition despite unfavourable market conditions. Both installed base and net revenue improved. Profit margin continued to widen and free cash flow expanded to HK$1 million a day. Total turnover rose slightly to HK$1,650 million (2008: HK$1,641 million). Record high net profit of HK$213 million (2008: HK$140 million) and free cash flow of HK$366 million (2008: HK$223 million) were reported in 2009.
The fixed line installed base grew by 7,000 to 628,000 (2008: 621,000), representing an overall market share of 12%. Business lines rose to 450,000 (2008: 441,000) for a 17% market share, and residential lines slipped slightly to 178,000 (2008: 180,000) for an 8% market share.
(From left) Stephen Ng, Chairman
and CEO of Wharf T&T, Mr John
Tsang, JP, Financial Secretary, the
Government of the Hong Kong
Special Administrative Region,
and Vincent Ma, President of
Wharf T&T officiating the launch
of Wharf T&T’s “+EN”

Corporate SoCial reSponSibility44The Wharf (Holdings) Limited Annual Report 2009
Workplace
Corporate Governance
Environment
Community
44The Wharf (Holdings) Limited Annual Report 2009

Corporate SoCial reSponSibility
45The Wharf (Holdings) Limited Annual Report 2009
Workplace
Community
Environment
Workplace
Corporate GovernanceEnvironment
Corporate Governance

46The Wharf (Holdings) Limited Annual Report 2009
Doreen Lee, Executive Director, The Wharf
(Holdings) Limited (right), receives the
President’s Award from The Community
Chest’s President Mrs Selina Tsang
Harriman Management Services,
i-CABLE Communications and The
“Star” Ferry have been recognised with
the “5 Years Plus” logo of the “Caring
Company” logo 2009/2010 by the Hong
Kong Council of Social Service
Sustainability is intrinsic to the way we do
business. Rooted in Hong Kong since 1886,
Wharf strives to fulfil its corporate social
responsibility commitment with the vision
‘Building for Tomorrow’.
With a portfolio that includes investment
properties, development properties,
logistics, hotels, communications, media
and entertainment, Wharf incorporates CSR
principles and practices in the whole host
of businesses the Group participates in and
maintains a high level of ethical standard
and code of conduct.
We endeavor to find a proper balance
between corporate, social, environmental
and economic responsibility with
appropriate involvement of key
stakeholders including customers,
employees, suppliers, partners, society,
governments, regulators and investors.
We do not discriminate. We are committed
to contributing to the sustainability of the
communities in which we conduct business
and where our associates live.
Wharf’s approach to CSR is in four folds
– Community Investment, Environment,
Workplace and Corporate Governance –
taking into consideration social welfare, art
& culture; efficient use of resources such
as energy, water, emissions and effluents
and policies, staff development and
Business Review
Corporate Social Responsibility
communications, stakeholders’ expectations
and compliance with legislation and
international standards and practices etc.,
backed by strong support from senior
management. Appropriate channels are in
place to communicate the Group’s efforts in
these areas.
A Caring CompanyIn addition to monetary aid, the Group
continues to support community activities
through various means. In 2009 alone,
the Group’s shopping malls and The “Star”
Ferry for example together supported
more than 100 charitable events through
venue sponsorship. Various business
units mobilised staff members to serve the
community through a number of voluntary
programs throughout the year. We are
particularly proud of The “Star” Ferry which
remains the only public transport operator
in Hong Kong that offers complimentary
rides to holders of a valid senior citizen
card. Fare concessions are also offered to
disabled ferry passengers.
In recognition of their good corporate
citizenship, various business units within
the Group were awarded the “Caring
Company” status in 2009/2010 by the Hong
Kong Council of Social Service. Among
them, Harriman Management Services,
i-CABLE Communications and The “Star”
Ferry were recognised with the “5 Years

47The Wharf (Holdings) Limited Annual Report 2009
Plus” status whilst Harriman Property
Management received the “5 Consecutive
Years Logo” in appreciation of their
sustainable commitment.
Most recently, Wharf T&T’s commitment
to CSR has been recognised by the Hong
Kong Quality Assurance Agency (“HKQAA”).
As the first ICT service provider awarded
the HKQAA-HSBC CSR Index Advocate Mark,
Wharf T&T continues to embrace CSR in
its operation and creates a favourable
business environment that fosters
sustainable development while pursuing
genuine long term business values.
COMMUNITY INVESTMENT
We at Wharf believe in the fundamental
dignity and value of individuals. We
believe that supporting the communities
in which we operate is integral to
running a successful business. Key areas
supported over the years include helping
the underprivileged, providing immediate
disaster relief for the needy, promoting
art and culture, youth development,
volunteering and enabling a quality
workplace for our staff.
The Group’s focus and effort in community
investment is well demonstrated via a
broad array of self-initiated programs
and partnerships with various reputable
organizations.
Staff VolunteerismCommunity service through volunteering
is a critical component of CSR@Wharf. To
walk the talk of being a good corporate
citizen, we encourage employees and
members of the community to support
organizations and initiatives that cultivate
meaningful opportunities for civic
engagement.
Various business units have established
their own volunteering teams where regular
community services are conducted. The
types of community services include but
are not limited to house-keeping for the
solitary seniors before Chinese New Year,
festive celebrations with the elderly, flag
selling to raise funds for various non-
governmental organisations and offering
tour services for children and the youth.
In 2009, Modern Terminals volunteers were
recognised with a Certificate of Appreciation
from the Agency for Volunteer Service for
their dedication in volunteering work.
i-CABLE volunteers received a Certificate
of Appreciation from Hong Kong Red
Cross and a Certificate of Recognition of
Corporate Partnership from Tung Wah Group
of Hospitals.
PartnershipsOver the years, the Group has been
supporting a host of charitable
organizations in good and challenging
times. The Community Chest, one of the
most important charities in Hong Kong, has
been a long-term beneficiary and partner
of Wharf for more than a decade. This was
evidenced by the Group’ winning a Top
Donor Award and becoming one of the top
“Star” Ferry’s (above) and Modern Terminals’
(below) volunteers teams actively participate in
various community service programs
10 donors in the 2008/2009 campaign year.
In addition, Wharf was recognised with a
Distinguished Award under the Corporate
and Employee Contribution Programme
2008/2009 (“CECP”) and additionally a
President’s Award for the significant overall
contribution by the Group and its members
during the same period. Meanwhile,
participation in the Dress Special Day has
been popular among our subsidiaries.
Wharf became the event’s Overall Third
Top Fund Raiser and clinched the Third
Top Fund Raiser in the Companies &
Organisations Category of Dress Special Day
2009. For year 2009/2010, the Wharf Group
pledged a donation to the CECP again to
continue its support for The Chest’s work in
local social welfare.
The Group’s other contributions included
the numerous charitable initiatives
undertaken by our shopping malls and
other subsidiaries around the year. Other
charitable organizations we have worked
with include but are not limited to UNICEF,
HK Red Cross, World Vision, ORBIS,
St James Settlement, HK Blood Cancer
Foundation, HK Anti-Cancer Society, HK
Against Child Abuse, and End Child Sexual
Abuse Foundation etc.

48The Wharf (Holdings) Limited Annual Report 2009
Art & CultureThe Group believes that art and culture
form a vital part of a quality life and we
strive to promote people’s interest in and
appreciation for art and culture by various
means including bringing masterpieces of
international standards to Hong Kong and
nurturing local young talents.
Harbour City has devoted a 1,000-square-
foot prime retail space on Level 2 of
Ocean Centre for the establishment of
a unique art gallery – the Gallery by the
Harbour − since 2007. Commanding an
unrivalled view of the Victoria Harbour, this
admission-free gallery showcases works
by artists from around the world. During
2009, numerous art exhibitions were held
to bring a wide variety of world-renowned
artists’ collections to the people of Hong
Kong. Other than art exhibitions, art talks
were given to Fine Art students from local
tertiary institutions, enabling them a wider
exposure on various art origins, forms and
styles.
Located at the heart of the city with
unmatched neighbourhood and high
foot traffic, the Group’s shopping malls
undoubtedly are the ideal venues for first-
class art exhibitions and events. Supported
by Harbour City, the “Reborn – The Silk
Road Arts Exhibition” organised by Leisure
and Cultural Services Department and
other local cultural organisations, was held
at Ocean Terminal Main Concourse and
forecourt, where a fascinating collection
of Silk Road-themed installations were
displayed.
Similarly, Times Square spares no efforts
in bringing art and cultural activities to
the people of Hong Kong. A dozen of
art exhibitions and events were held
during the year, in particular, the works of
contemporary artists Chocolate Rain and
Jimmy Liao were presented to the public in
a lively environment.
In support of art and music performance in
Hong Kong, the Group has been sponsoring
Hong Kong Philharmonic Orchestra’s Club
Maestro since 2003 as a Platinum member.
Other forms of sponsorships were also
provided by the Group’s members to
various art groups, for example, Marco
Polo Hotels offered complimentary hotel
accommodation for performance groups,
while the “Star” Ferry provided media and
publicity support to art organisations, with
Hong Kong Repertory Theatre being one of
the beneficiaries.
Emergency ReliefThe Group extends its helping hands
beyond the geography of Hong Kong. It
provides immediate funding support for
emergency, enabling victims and people
affected to recover from the tragedy or
natural disasters such as earthquakes,
floods and health hazards, and resume
normal course of lives as soon as possible.
For example, i-CABLE and its staff raised
a total of HK$1 million for relief effort
immediately after Typhoon Morakot
slammed Taiwan on 8 August 2009.
ENVIRONMENTAL PROTECTION
The Group strives to contribute to the
sustainability and long term development
of our environment for the many future
generations. Across various business
units, the Group has established a set of
environmental policy and practices which
are extended to all operations, business
Shanghai Times Square and
Harbour City support and regularly
organise various art and culture
events in their premises
(above) Makoto Ozone Jazz Piano Solo Concert
at Shanghai Times Square
(below) “Chocolate Museum by Chef Koo”, one
of the exhibitions of “Chocolate Trail
@ Harbour City”
Business Review
Corporate Social Responsibility

We believe that supporting the communities in which we operate is integral to running a successful business.
49The Wharf (Holdings) Limited Annual Report 2009
associates and the chain of supply. We
are committed to internal and external
initiatives supporting the sustainable use
and protection of natural resources. As
applicable, our businesses employ and
manage our environmental impacts through
the use of an environmental management
system (EMS) and have proper procedures
in place to record the performance
and measure the effectiveness against
targets. Green initiatives by Wharf and its
members are multi-facetted and covering
a spectrum of programs. They are on top
of our associates’ active participation
in community activities in support for
protecting biological diversity and integrity
of restoration and conservation projects.
With parent company Wheelock and
Company Limited being a founding member
of the Business Environment Council, the
Group has long been aware of the critical
importance of environmental protection
in Hong Kong as well as the pivotal
role of the private sector in helping to
conserve the environment. To support the
preservation of the long-term economic,
social and environmental interests of the
Harbour, the Group has joined the Harbour
Business Forum as a Patron member since
its launch in 2005. Moreover, Wharf and
its various business units have endorsed
the Clean Air Charter initiated by the Hong
Kong General Chamber of Commerce and
the Hong Kong Business Coalition on
the Environment to make a contribution
to combat air pollution and improve air
quality in the Greater Pearl River Delta. The
Woo Wheelock Green Fund (WWGF) has
pledged its support to the Environment
and Conservation Fund since 1994 and
supported result-oriented research projects
worth more than HK$1.7 million in 2009.
Green Policy and PracticesThe Group has established a green policy
and practices throughout its diversified
operations. Regular monitoring and
review of the environmental protection
performance is conducted. During the year,
the Group made encouraging achievements
in reducing the usage of energy, water
and paper as well as the emission of
greenhouse gases.
In particular, Modern Terminals has been
aggressive in energy saving and achieved a
significant drop in energy, water and paper
consumption by around 10%, 17% and 33%
respectively, compared with 2008.
i-CABLE in the meantime achieved a
substantial reduction in paper usage by
27% and energy usage by 10%.
Reduction of greenhouse gas emission
is also one of the Group’s major targets.
Various business units have become a
Carbon Audit • Green Partner by signing the
Carbon Reduction Charter and pledged to
carry out activities to support the reduction
of greenhouse gas emission. Participating
business units included Gateway
Apartments, Gateway Hotel, Harbour City,
Harriman Property Management, Harriman
Management Services, i-CABLE, Marco Polo
Hongkong Hotel, Marco Polo Hotels, Pacific
Club, Plaza Hollywood, Prince Hotel and
Times Square.
Harbour City, for instance, reduced
approximately 1,600 tons of CO2 emission
in 2009 after introducing a number of
energy saving initiatives such as replacing
Chiller plant and pumps, implementing
upgrading work for capacity banks,
replacing LED fluorescent tubes, replacing
energy saving lamp bulbs and installing
frequency inverter and replacing FCU energy
saving motors.
The “Star” Ferry has worked together with
the University of Hong Kong to develop a
tailor-made ‘wet scrubber’ for its own fleet
which effectively removed about 90% of
SO2.
Modern Terminals’ achievements in energy saving
earn the company an award in the Power Smart
Contest organised by The Friends of the Earth
Wharf has been a long-time supporter of the World
Wide Fund for Nature Hong Kong

Business Review
Corporate Social Responsibility
50The Wharf (Holdings) Limited Annual Report 2009
Other individual operating units have made
equally interesting green moves. Gateways
Apartments has kicked off its solar energy
plan in June 2009. A hundred solar panels
were installed at its rooftop to replace the
existing heat pump system. During a six-
month period, a total of 28.3 tons of CO2
emission was reduced.
Externally, a Purchasing Policy has been
in place to ensure that its procurement
practices are carried out by taking green,
health and safety considerations. Where
appropriate, our business units extend
their green policies to their suppliers
through guidelines, terms and conditions in
contracts to ensure that their suppliers are
qualified to run the business and provide
products and services in a green manner.
Partnering with Green GroupsThe Group teams up with green advocates
to promote environmental conservation.
Wharf is a long-time supporter of
World Wide Fund for Nature Hong Kong
(“WWFHK”). The Group has been a WWFHK
corporate member since 2001 and is
currently a Double Diamond member.
Additionally, Modern Terminals, a subsidiary
of the Group, also supports WWFHK as a
Silver member.
During 2009, the Group also supported
programs organised by other green groups
including Friends of the Earth’s “Dim It
6.21” campaign in June 2009. External
lights of the Groups’ shopping malls
Harbour City, Times Square and Plaza
Hollywood were switched off during a
designated period of time to demonstrate
our commitment to promoting green
awareness.
Promoting Green AwarenessThe Group does not only think green for
itself, but it also supports and promotes
environmental awareness among the
general public. During 2009, our shopping
malls were venue sponsors for various
promotional activities held by green
organisations or the government to help
spread the eco messages. Further, The
“Star” Ferry is a co-organiser of One Tonne
Challenge Carnival, which is held regularly
at its Central Pier with an aim to call upon
Hong Kong people to reduce carbon dioxide
emissions. Meanwhile, Modern Terminals’
volunteers continued to participate in the
Hong Kong Reef Check 2009 organised by
the Agriculture, Fisheries and Conservation
Department to help promote sustainable
management of coral reefs.
Green RecognitionsGreen efforts by the Group’s various
operating units are duly recognised.
Modern Terminals was awarded ISO14001
accreditation for its EMS in 2009,
demonstrating that the system currently
in place is highly effective as well as
comprehensive enough to constantly
improve the company’s environmental
performance. Honours, certificates of
appreciation and more were received from
Environmental Protection Department,
Water Supplies Department, Environmental
Campaign Committee, Hong Kong Quality
Assurance Association and more by Group
members during 2009 in recognition of
their zealous engagement in maintaining
high standards of indoor air quality, water
quality, hygiene control, source separation
of waste and waste reduction.
WORKPLACE
People Development & DiversityIn addition to Community Investment, the
Group has also demonstrated its respect for
Human Rights by implementing appropriate
procedures and frameworks in our business
process. The Group is an equal opportunity
employer where a policy on equal
opportunities is in place to ensure non-
discrimination against gender, disability,
family, age and race. We promote equal
opportunities to applicants and existing
employees, scrutinizing staff promotion
and development in accordance with
individual performance and the genuine
job requirements, and support with on-
going training programs and development
opportunities.
Staff TrainingHuman resources are the most valuable
asset of the Group. In 2009, the Group and
its members provided some 250 in-house
training programs to more than 6,500 staff
members. A comprehensive array of training
programs are available which include
foreign language learning, Putonghua
training, stress management, negotiation
skills, leadership training, first aid, team
building and communications, problem-
solving and decision-making workshops,
health talks and more. Orientation program
and on-the-job training are offered to
new staff to assist them to adapt to new
job and work environment. Continuing
education is encouraged. During 2009,
more than 800 staff received education
or training subsidies for taking external
courses to upgrade their skills.
Prince Hotel’s colleagues walk for the underprivileged school children in China

51The Wharf (Holdings) Limited Annual Report 2009
Occupational health and safety are also
among our key concerns for staff. Circulars,
guidelines and procedures are issued
with training held on a regular basis to
continuously promote workplace safety
among staff at all levels. The Group’s
property management arm has also
established Safety Committees to review
and implement new measures with cross
centre audit of work safety.
Our people development efforts are
extended to outsourced staff. Wharf
Institute of Service Excellence (WISE)
is an example. Supported by full-time
trainers, this in-house training academy
offers regular core competence programs
and refresher courses for our malls’
direct employed and outsourced staff. It
aims to train and shape their service
attitudes, service delivery standards
and technical skills, ensuring a premier
property management service is brought to
customers.
Intra-Group CommunicationsTo keep staff in various business units
abreast of the latest developments within
the Group, an intranet is regularly updated
with latest happenings. A bilingual staff
bulletin The Link is another important
channel for internal communications with
featured story, business updates, news
on community involvements, awards and
recognitions, staff activities and personal
interviews.
A Balanced LifeThe Group encourages staff to pursue
a balanced work life. To ensure the
health and wellness of staff, Wharf Staff
Recreation Committee provides a variety of
activities for staff and their families meeting
different interests and needs. In 2009,
the Committee organised a wide range of
interest classes, sports and recreational
activities such as Ocean Park visit, horse-
back riding, squid fishing, karaoke, Chinese
checkers competitions, cooking classes and
more.
CORPORATE GOVERNANCE
Policies and Code of Business Conduct Wharf is committed to full compliance
of standards of conduct across our
businesses. Each and every associate of
Wharf must conduct their business in an
ethically responsible manner and behave in
accordance with Wharf’s norms and values
as well as regulatory requirements. All
employees are required to sign the Code of
Conducts and adhere to the Code. Policies
The Group encourages staff
to pursue a balanced work
life by organising a host of
activities for staff and their
family member via the Wharf
recreational club
on a range of subjects like Safety and
Security Alertness, Office Safety and Health
Regulations, Equal Opportunities, Office
Harassment, Privacy, Purchasing policy and
holiday gifting etc are circulated among our
staff in addition to regular communication
via training and in written form to promote
awareness of Group’s standards and
requirements across all business units,
suppliers and contractors.
The management has been closely
involved in the Group’s Business Conducts
& Ethics, Risk Management, Audit and
Compliance as well as Shareholder Rights
& Reporting. The Group has instituted
a sound internal controls system. The
Group’s Board of Directors, through the
Audit Committee, conduct annual review of
the effectiveness of the system and report
to shareholders. Involving executives of
each business units and corporate units,
the internal control system presents a
well-defined organisational structure with
specific limits of authority in place, while
areas of responsibility of each business and
operational units are also clearly defined to
ensure effective checks and balances.
A full Corporate Governance Report is
available from page 59 to 64 of this annual
report.

52
Results Review
Liquidity, Financial Resourcesand Capital Commitments
Human Resources
52

53The Wharf (Holdings) Limited Annual Report 2009
Financial Review
(I) Review of 2009 Results
Despite the global economic downturn in 2009, the Group achieved an all-time high profit attributable to shareholders of
HK$7,817 million before and HK$17,501 million after the net investment property revaluation surplus, representing an increase
of 86% and 180% over 2008 respectively. The unprecedented results reflected the Group’s strong rental revenue growth, the
sharp rise in profit on property sales in China, the benefit from the persistent low interest environment, the one-off profit
on disposal of Beijing Capital Times Square and the appreciation of the underlying value of the Group’s investment property
portfolio.
Turnover
The Group’s turnover for 2009 rose by 10% to HK$17,553 million (2008: HK$15,940 million), benefiting from the robust growth
in rental revenue and the encouraging property sales in the Mainland.
Property Investment’s rental revenue from Hong Kong recorded a 10% increase to HK$6,637 million whilst that from China
rose by 15% to HK$592 million. However, the worldwide slowdown of the hotel industry stemming from the global financial
crisis persisted, albeit to a lesser extent in the second half of 2009, resulting in the Group’s hotel revenue declining by 9% to
HK$963 million. In aggregate, the segment reported a net increase of 8% to a record high of HK$8,192 million.
Property Development recorded a significant increase in revenue by 332% to HK$3,065 million as the Group’s China segment
experienced strong growth in property sales and with the phased completion of the residential towers in Dalian Times Square
and Chengdu Tian Fu Times Square.
Logistics revenue decreased by 20% to HK$3,091 million, mainly reflecting the 13% reduction in volume throughput at Modern
Terminals as world trade sharply contracted.
CME revenue dropped by 9% to HK$3,404 million, primarily due to the decrease reported by i-CABLE.
Operating Profit
The Group’s operating profit increased by 13% to HK$8,554 million, mainly driven by the increase in rental revenue and the
robust profit contribution from property sales in China.
Property Investment continued to be the key profit contributor with its operating profit increasing by 12% to HK$6,191 million.
Harbour City (excluding Hotels) and Times Square rose by 14% and 10%, respectively, reflecting the underlying strong rental
reversion and consistently high occupancy for the retail areas, despite the pressure on office rental rates and occupancy since
late 2008. The investment properties in China also performed well and increased their operating profit by 26%, partly due to
the expanding portfolio.
Hotel operating profit decreased by 21% to HK$242 million with both occupancy and average room rate adversely affected by
the weak demand in the hotel industry under the prevailing economic conditions. That performance was largely in line with the
market.
Property Development’s operating profit expanded to HK$1,012 million, an increase of HK$928 million from its low level in
2008, wholly attributable to the expanding property sales in the Mainland.
Logistics’ operating profit dropped by 20% to HK$1,418 million primarily due to the decrease in Modern Terminals’ consolidated
throughput from its terminal operations in Hong Kong and the Mainland. However, favourable finance costs together with
proactive cost saving initiatives helped to mitigate its bottom line to a decrease of 4% against 2008.

54The Wharf (Holdings) Limited Annual Report 2009
Financial Review
CME’s operating profit recorded an increase to HK$163 million (2008: HK$64 million). Wharf T&T’s operating profit increased
by 52% to HK$213 million. i-CABLE, through effective cost control initiatives, narrowed its operating loss by HK$28 million.
Investment and Others segment reported a decrease in operating profit to HK$90 million (2008: HK$304 million), mainly due
to the reduction in interest income amid the exceptionally low interest rate environment.
Profit on Disposal of an Investment Property
Profit on disposal of Beijing Capital Times Square in the year amounted to HK$1,110 million. Together with the net tax credit of
HK$283 million mainly related to the release of the deferred tax previously provided in view of the revaluation surpluses, the
net profit for the disposal amounted to HK$1,393 million.
Increase in Fair Value of Investment Properties
The book value of the Group’s investment property portfolio as at 31 December 2009 was HK$115.5 billion, with
HK$111.8 billion thereof stated at fair value based on an independent valuation as at 31 December 2009, which produced a
revaluation surplus of HK$12,204 million (2008: HK$1,793 million). The attributable net revaluation surplus of HK$9,684 million
(2008: HK$1,363 million), after deducting related deferred tax and minority interests, was credited to the consolidated income
statement.
Investment properties in the amount of HK$3.7 billion not revalued were all under development and not carried at fair value
until at the earlier of when their fair values first become reliably measurable or the dates of their respective completion. This is
to accord with the revised accounting standard HKAS 40, which expands the definition of an investment property to include an
investment property under development.
Other Net Income/Net Other Charge
Other net income for the year amounting to HK$227 million (2008: HK$96 million) mainly included profit on disposal of
available-for-sale investments, certain subsidiaries and jointly controlled entities. Net other charge of HK$52 million (2008:
HK$145 million) represented the write-off of certain fixed assets.
Finance Costs
Finance costs charged to the consolidated income statement were HK$338 million for the year (2008: HK$1,521 million).
Included in finance costs was a mark-to-market unrealised gain of HK$46 million (2008: unrealised loss of HK$612 million) on
the cross currency/interest rate swaps in compliance with the prevailing accounting standard.
Excluding the impact of the unrealised mark-to-market changes on the swaps, finance cost after capitalisation was
HK$384 million (2008: HK$909 million), representing a reduction of HK$525 million due to the persistent low interest rate in
the prevailing market during the year.
Finance costs was stated after capitalisation of HK$212 million (2008: HK$200 million) in respect of the Group’s related assets.
Share of Results (after tax) of Associates and Jointly Controlled Entities
The share of profit of associates increased by 107% to HK$281 million (2008: HK$136 million). Profit contribution from the
jointly controlled entities increased by HK$70 million to HK$75 million, mainly benefitting from the property sales recognised
by a jointly controlled entity involved in property development in China.

55The Wharf (Holdings) Limited Annual Report 2009
Income Tax
Taxation charge for the year was HK$3,973 million (2008: HK$1,189 million), which included deferred taxation of
HK$2,449 million (2008: HK$433 million) provided for the current year’s investment properties revaluation surplus. In 2008,
there was a credit adjustment of HK$768 million in respect of the previous years’ deferred tax liabilities, mainly related to
investment property revaluation surplus, resulting from the 1% reduction in Hong Kong profits tax rate.
Excluding the above deferred tax charge and credit adjustment, the tax charge was HK$1,524 million (2008: HK$1,524 million),
which included a provision of HK$194 million (2008: HK$292 million) made for certain tax cases primarily relating to interest
deductibility under discussion with the Inland Revenue Department.
Minority Interests
Minority interests increased by HK$116 million to HK$587 million reflecting the increase in net profits of certain non-wholly-
owned subsidiaries, mainly from HCDL.
Profit Attributable to Equity Shareholders
The Group’s profit attributable to equity shareholders increased by 180% to HK$17,501 million (2008: HK$6,247 million).
Earnings per share were HK$6.35 (2008: HK$2.28), based on 2,754 million issued shares.
Excluding the net investment property revaluation surplus after associated deferred tax of HK$9,684 million (2008:
HK$1,363 million and the related deferred tax credit of HK$690 million), the Group’s profit attributable to shareholders for the
year was HK$7,817 million (2008: HK$4,194 million), a rise of 86% over 2008.
(II) Liquidity, Financial Resources and Capital Commitments
Shareholders’ and Total Equity
As at 31 December 2009, the Group’s shareholders’ equity increased by HK$15,716 million to HK$115,210 million, equivalent to
an increase of 16% to HK$41.83 per share (2008: HK$36.13 per share).
Including the minority interests, the Group’s total equity increased by 15% to HK$122,164 million (2008: HK$105,857 million).
Total Assets
The Group’s total assets increased by 13% to HK$190.5 billion (2008: HK$168.6 billion). Total business assets, excluding bank
deposit and cash, held-to-maturity investment and available-for-sale investment, increased by 12% to HK$170.0 billion (2008:
HK$152.0 million).
Included in the Group’s total assets is the Investment Property portfolio of HK$115.5 billion, representing 68% of total business
assets. The core assets in this portfolio are Harbour City and Times Square in Hong Kong, which are valued at HK$62.6
billion (excluding the 3 Hotels) and HK$24.0 billion, respectively. Together, they represent 75% of the value of the Investment
Property portfolio.
Other major business assets included other properties and fixed assets of HK$18.5 billion, interest in jointly controlled entities
and associates (mainly for China property and port projects) of HK$11.8 billion and properties under development and held for
sale (mainly in China) of HK$17.8 billion.
Geographically, the Group’s business assets in China, mainly properties and terminals, increased to HK$53.4 billion,
represented 32% of the Group’s business assets.

56The Wharf (Holdings) Limited Annual Report 2009
Financial Review
In previous years, an investment property under development was not classified as investment property and stated at cost.
As a result of the change in the relevant accounting standard, such property has been classified as investment property and
carried at fair value at the earlier of when the fair value first becomes reliably measurable or the date of completion of the
property.
Debts and Gearing
The Group’s net debt decreased by HK$0.7 billion to HK$21.4 billion as at 31 December 2009 (2008: HK$22.1 billion), which
was made up of HK$39.8 billion in debts and HK$18.4 billion in bank deposits and cash. Included in the Group’s net debts
were HK$12.0 billion (2008: HK$11.6 billion) attributable to Modern Terminals, HCDL and other subsidiaries, which are without
recourse to the Company and other subsidiaries of the Group. Excluding these non-recourse debts, the Group’s net debt was
reduced by 10% to HK$9.4 billion (2008: HK$10.5 billion).
As at 31 December 2009, the ratio of net debt to total equity was 17.5% (2008: 20.9%).
Finance and Availability of Facilities
The Group’s available loan facilities and debt securities totally amounting to HK$58.9 billion, of which HK$39.8 billion were
drawn, as at 31 December 2009 are analysed as below:
31 December 2009
Available Total Undrawn
Facility Debts Facility
HK$ Billion HK$ Billion HK$ Billion
Company/wholly-owned subsidiaries
Committed facilities 33.8 25.0 8.8
Uncommitted facilities 0.5 – 0.5
34.3 25.0 9.3
Non-wholly-owned subsidiaries
Committed and uncommitted
– Modern Terminals 16.8 11.1 5.7
– HCDL 4.6 3.0 1.6
– i-CABLE 0.4 – 0.4
– Others 2.8 0.7 2.1
58.9 39.8 19.1
Of the above debts, HK$8,996 million (2008: HK$8,160 million) was secured by mortgage over certain properties under
development and fixed assets with total carrying value of HK$22,474 million (2008: HK$15,915 million).
The Group’s debts were primarily denominated in Hong Kong dollar (“HKD”), United States dollar and Renminbi (“RMB”). RMB
borrowings were used to fund the Group’s property development and port-related investments in China.
The use of derivative financial instruments was strictly monitored and controlled. The majority of the derivative financial
instruments entered into by the Group were primarily used for management of the Group’s interest rate and foreign currency
exposures.

57The Wharf (Holdings) Limited Annual Report 2009
The Group maintained a very strong financial position with ample surplus cash denominated principally in HKD and RMB and
undrawn committed facilities to facilitate the Group’s expanding business and investment activities. As at 31 December 2009,
the Group also maintained a portfolio of available-for-sale investments with an aggregate market value of HK$1.3 billion
(2008: HK$0.7 billion), which is immediately available for liquidation for the Group’s use.
Cash Flows for the Group’s Operating and Investing Activities
For the year under review, the Group’s net cash inflow before change in working capital increased to HK$9.7 billion (2008:
HK$8.6 billion). The changes in working capital resulted in a net cash outflow of HK$2.1 billion (2008: HK$6.9 billion),
primarily due to payment for land and construction cost for trading properties under development in China. For investing
activities, the Group reported a net cash outflow of HK$5.4 billion (2008: HK$5.7 billion), mainly representing payment of
construction cost for investment properties under development in China and investments in jointly controlled entities involved
in property development projects in China.
Major Expenditure and Commitments
The major expenditure incurred by the Group’s core businesses during the year and related commitments at 31 December 2009
are analysed as follows:
Commitments as at
31 December 2009
Authorised Authorised
Expenditure and but not
for 2009 Contracted for Contracted for
Business Unit/Company HK$ Million HK$ Million HK$ Million
a. Capital expenditure
Property Investments 1,586 6,264 11,212
Wharf T&T 287 92 141
i-CABLE (73.8%-owned) 261 45 90
Modern Terminals (67.6%-owned) 862 553 1,416
2,996 6,954 12,859
b. Programming and others 87 2,226 139
c. Trading properties under development
Subsidiaries (China/Hong Kong) 4,018 8,027 20,428
Jointly controlled entities/associates (China) 1,788 4,335 10,459
5,806 12,362 30,887
For the Property Investment segment, the capital expenditure incurred was mainly for the construction of Shanghai Wheelock
Square, Chengdu International Finance Centre and certain refurbishment and renovation work in particular for Harbour City. For
i-CABLE and Wharf T&T, the capital expenditures were incurred substantially for procurement of production and broadcasting
equipment, network rollout and internet service equipment while those for Modern Terminals were mainly for the construction
of the Dachan Bay Phase I and Taicang Phase II ports. i-CABLE and Modern Terminals, respectively 73.8% and 67.6% owned by
the Group, independently funded their own capital expenditure programmes.
In addition to the capital expenditure, the Group also incurred HK$5.8 billion for development of its trading properties in
China, either wholly-owned or undertaken through associates and jointly controlled entities.

58The Wharf (Holdings) Limited Annual Report 2009
Financial Review
As at 31 December 2009, the total outstanding commitment for the development of properties for investment or trading
purposes was about HK$60.7 billion, including attributable land cost of HK$13.2 billion payable by installments mainly from
2010 to 2013. These developments will be executed by stages in the forthcoming years and funded by the Group’s internal
financial resources including its surplus cash of HK$18.4 billion, as well as bank and other financings. Other available resources
include proceeds from sales and pre-sales of properties.
In January and February 2010, the Group acquired another two land parcels in Chengdu and Tianjin respectively with total
attributable land cost payable of HK$2.7 billion.
Rights Issue by a subsidiary
In May 2009, HCDL, a non-wholly-owned listed subsidiary, completed a rights issue for 236 million new ordinary shares at
HK$3.99 each with proceeds of about HK$277 million received from the minority shareholders. The Group maintained its
interest in HCDL at 70.37% as that before the rights issue.
(III) Human Resources
The Group had approximately 12,700 employees as at 31 December 2009, including about 1,900 employed by managed
operations. Employees are remunerated according to their job responsibilities and the market pay trend with a discretionary
annual performance bonus as variable pay for rewarding individual performance and contributions to the respective group’s
achievement and results.

59The Wharf (Holdings) Limited Annual Report 2009
Corporate Governance Report
(A) CORPORATE GOVERNANCE PRACTICES
During the financial year ended 31 December 2009, all the code provisions set out in the Code on Corporate Governance
Practices in Appendix 14 (the “Code”) of the Rules Governing the Listing of Securities (the “Listing Rules”) on The Stock
Exchange of Hong Kong Limited (the “Stock Exchange”) were met by the Company, with the exception of one deviation as set
out under section (D) below. The application of the relevant principles, and the reasons for the abovementioned deviation from
a Code provision, are stated in the following sections.
(B) DIRECTORS’ SECURITIES TRANSACTIONS
The Company has adopted the Model Code for Securities Transactions by Directors of Listed Issuers (the “Model Code”) set out
in Appendix 10 of the Listing Rules. Having made specific enquiry of all Directors of the Company who were in office during the
financial year ended 31 December 2009, they have confirmed that they have complied with the Model Code during the financial
year.
(C) BOARD OF DIRECTORS
(i) Composition of the Board, number of Board meetings and Directors’ attendance
The Company’s Board has a balance of skills and experience and a balanced composition of executive and non-executive
directors. Four Board meetings were held during the financial year ended 31 December 2009. The composition of the
Board and attendance of the Directors are set out below:
Directors Attendance/Number of Meetings
Chairman
Mr Peter K C Woo 4/4
Senior Deputy Chairman
Mr Gonzaga W J Li (retiring as Senior Deputy Chairman & Director effective 1 April 2010) 4/4
Deputy Chairman & Managing Director
Mr Stephen T H Ng 4/4
Executive Director
Ms Doreen Y F Lee 4/4
Executive Director
Mr T Y Ng (re-designated as Executive Director on 8 June 2009) 3/4
Executive Director & Group Chief Financial Officer
Mr Paul Y C Tsui 4/4
Independent Non-executive Directors
Hon Paul M P Chan 3/4
Professor Edward K Y Chen 2/4
Dr Raymond K F Ch’ien 2/4
Hon Vincent K Fang 3/4
Mr Hans Michael Jebsen 3/4
Mr James E Thompson 4/4
Each Director of the Company has been appointed on the strength of his/her calibre, experience and stature, and his/her
potential to contribute to the proper guidance of the Group and its businesses. Apart from formal meetings, matters
requiring board approval were arranged by means of circulation of written resolutions.
60The Wharf (Holdings) Limited Annual Report 2009
Corporate Governance Report
(ii) Operation of the Board
The Company is headed by an effective Board which takes decisions objectively in the interests of the Company. The
Company’s management has closely monitored changes to regulations that affect its corporate affairs and businesses,
and changes to accounting standards, and adopted appropriate reporting format in its interim report, annual report
and other related documents to present a balanced, clear and comprehensible assessment of the Group’s performance,
position and prospects. Where these changes are pertinent to the Company or Directors’ disclosure obligations, the
Directors are either briefed during Board meetings or issued with regular updates and materials to keep them abreast of
their responsibilities and of the conduct, business activities and development of the Group. Newly appointed Directors
receive briefings and orientation on their legal and other responsibilities as a Director and the role of the Board. The
Company has also provided appropriate information in a timely manner to the Directors to enable them to make an
informed decision and to discharge their duties and responsibilities as Directors of the Company.
There is a clear division of responsibilities between the Board and the management. Decisions on important matters are
specifically reserved to the Board while decisions on the Group’s general operations are delegated to the management.
Important matters include those affecting the Group’s strategic policies, major investment and funding decisions and
major commitments relating to the Group’s operations.
(D) CHAIRMAN AND CHIEF EXECUTIVE OFFICER
Mr Peter K C Woo serves as the Chairman and also as the de facto chief executive officer of the Company. This is a deviation
from the Code provision with respect to the roles of chairman and chief executive officer to be performed by different
individuals. Such deviation is deemed appropriate as it is considered to be more efficient to have one single person to be the
Chairman of the Company as well as to discharge the executive functions of a chief executive officer. The Board of Directors
believes that the balance of power and authority is adequately ensured by the operations of the Board which comprises
experienced and high calibre individuals, a substantial proportion thereof being independent Non-executive Directors.
Furthermore, the Chairman is supported by Deputy Chairman & Managing Director Mr Stephen T H Ng, and also by Executive
Director Ms Doreen Y F Lee, the vice chairman of Wharf China Development Limited Mr Andrew O K Chow, Executive Director
Mr T Y Ng, and Executive Director & Group Chief Financial Officer Mr Paul Y C Tsui. The Chairman is responsible for the Board,
focuses on Group strategies and Board issues, ensures a cohesive working relationship between members of the Board and
management, and directly has responsibilities in certain major business units of the Group. The other executive directors/senior
executive as mentioned above have full executive responsibilities in the business directions and operational efficiency of the
business units under their respective responsibilities and are accountable to the Chairman.
(E) NON-EXECUTIVE DIRECTORS
All those existing Directors of the Company who do not hold any executive office of the Company have their respective terms
of appointment coming to an end normally three years after their appointment to the Board or (in the case of Directors who
were re-elected to the Board at previous Annual General Meetings) their last re-election as Directors.

61The Wharf (Holdings) Limited Annual Report 2009
(F) REMUNERATION OF DIRECTORS
The Company has set up a Remuneration Committee consisting of the Chairman of the Company and two independent Non-
executive Directors.
Three Remuneration Committee meetings were held during the financial year ended 31 December 2009. Attendance of the
Members is set out below:
Members Attendance/Number of Meetings
Mr Peter K C Woo, Chairman 3/3
Mr Hans Michael Jebsen 1/3
Mr James E Thompson 3/3
(i) The terms of reference of the Remuneration Committee are aligned with the provisions set out in the Code. Given below
are the main duties of the Remuneration Committee:
(a) to consider the Company’s policy and structure for all remuneration of Directors and senior management;
(b) to determine the specific remuneration packages of all executive Directors and senior management;
(c) to review performance-based remuneration by reference to corporate goals and objectives resolved by the Board
from time to time;
(d) to review the compensation payable to executive Directors and senior management in connection with any loss or
termination of their office or appointment; and
(e) to review compensation arrangements relating to dismissal or removal of Directors for misconduct.
(ii) The work performed by the Remuneration Committee for the financial year ended 31 December 2009 is summarised
below:
(a) review of the Company’s policy and structure for all remuneration of Directors and senior management;
(b) consideration of the emoluments for all Directors and senior management; and
(c) review of the level of fees for Directors and Audit Committee Members.
The basis of determining the emoluments payable to its Directors and senior management by the Company is by reference to
the level of emoluments normally paid by a listed company in Hong Kong to directors and senior executives of comparable
calibre and job responsibilities so as to ensure a fair and competitive remuneration package as is fit and appropriate. The
basis of determining the Directors’ fees, currently at the rate of HK$60,000 per annum per Director, payable to Directors of
the Company, and the Audit Committee Members’ fees, currently at the rate of HK$20,000 per annum per Member, payable to
those Directors of the Company who are also Members of the Audit Committee of the Company is by reference to the level of
fees of similar nature normally paid by a listed company in Hong Kong to its directors.

62The Wharf (Holdings) Limited Annual Report 2009
Corporate Governance Report
(G) NOMINATION OF DIRECTORS
The Company does not have a nomination committee as the role and function of such committee are performed by the Board.
The Board is responsible for the formulation of the nomination policies, making recommendations to Shareholders on Directors
standing for re-election, providing sufficient biographical details of Directors to enable Shareholders to make an informed
decision on the re-election, and where necessary, nominate Directors to fill casual vacancies. The Chairman in conjunction
with the Deputy Chairman & Managing Director from time to time reviews the composition of the Board with particular regard
to ensuring that there is an appropriate number of Directors on the Board independent of management. They also identify
and nominate qualified individuals for appointment as new Directors of the Company. New Directors of the Company will be
appointed by Board. Any and all new Directors are subject to retirement from the Board at the Annual General Meeting of the
Company immediately following his or her appointment and may stand for re-election at the Annual General Meeting.
(H) AUDITORS’ REMUNERATION
The fees in relation to the audit and other services for the financial year ended 31 December 2009 provided by KPMG, the
external auditors of the Company, amounted to HK$13 million and HK$4 million respectively.
(I) AUDIT COMMITTEE
All the Members of the Audit Committee of the Company are appointed from the independent Non-executive Directors.
All Members have sufficient experience in reviewing audited financial statements as aided by the auditors of the Group
whenever required. In addition, Hon Paul M P Chan has the appropriate professional qualifications and experience in financial
matters.
Four Audit Committee meetings were held during the financial year ended 31 December 2009. Attendance of the Members is
set out below:
Members Attendance/Number of Meetings
Hon Vincent K Fang, Chairman 4/4
Hon Paul M P Chan 4/4
Mr Hans Michael Jebsen 3/4
Mr James E Thompson 4/4
(i) The terms of reference of the Audit Committee are aligned with the recommendations set out in “A Guide for Effective
Audit Committees” issued by the Hong Kong Institute of Certified Public Accountants. Given below are the main duties of
Audit Committee:
(a) to consider the appointment of the external auditors and any questions of resignation or dismissal;
(b) to discuss with the external auditors before the audit commences, the nature and scope of the audit;

63The Wharf (Holdings) Limited Annual Report 2009
(c) to review the half-year and annual financial statements before submission to the Board, focusing particularly on:
(i) any changes in accounting policies and practices;
(ii) major judgmental areas;
(iii) significant adjustments resulting from the audit;
(iv) the going concern assumption;
(v) compliance with accounting standards; and
(vi) compliance with Stock Exchange and legal requirements.
(d) to discuss problems and reservations arising from the audits, and any matters the external auditors may wish to
discuss (in the absence of management where necessary);
(e) to discuss with management the internal control system including the adequacy of resources, qualifications and
experience of staff of the Group’s accounting and financial reporting function, and their training programmes and
budget; and
(f ) to review the audit programme of the internal audit function.
(ii) The work performed by the Audit Committee for the financial year ended 31 December 2009 is summarised below:
(a) approval of the remuneration and terms of engagement of the external auditors;
(b) review of the external auditors’ independence and objectivity and the effectiveness of audit process in accordance
with applicable standards;
(c) review of the half-year and annual financial statements before submission to the Board, with particular
consideration of the points mentioned in paragraph (i)(c) above regarding the duties of the Audit Committee;
(d) discussion with the external auditors before the audit commences, the nature and scope of the audit;
(e) review of the audit programme of the internal audit function;
(f ) review of the Group’s financial controls, internal control and risk management systems; and
(g) meeting with the external auditors without executive Board members present.
(J) INTERNAL CONTROL
The Directors are ultimately responsible for the internal control system of the Group and, through the Audit Committee, have
reviewed the effectiveness of the system including the adequacy of resources, qualifications and experience of staff of the
Group’s accounting and financial reporting functions, and their training programmes and budget. The internal control system
comprises a well-defined organisational structure with specified limits of authority in place. Areas of responsibility of each
business and operational units are also clearly defined to ensure effective checks and balances.
Procedures have been designed for safeguarding assets against unauthorised use or disposition, maintenance of proper
accounting records, assurance of the reliability of financial information for internal use or publication and compliance with
relevant legislation and regulations. Such procedures are designed to manage risks of failure in operational systems and can
provide reasonable assurance against material errors, losses or fraud.
The internal audit function monitors compliance with policies and standards and the effectiveness of internal control structures
across the whole Group. Findings regarding internal control matters are reported to the Audit Committee. The external auditors
have access to the full set of internal audit reports.

64The Wharf (Holdings) Limited Annual Report 2009
Corporate Governance Report
A review of the effectiveness of the Group’s internal control system and procedures covering all controls, including financial,
operational and compliance and risk management, was conducted by the Audit Committee and subsequently reported to the
Board during the financial year ended 31 December 2009. Based on the result of the review, in respect of the financial year
ended 31 December 2009, the Directors considered that the internal control system and procedures of the Group were effective
and adequate.
(K) DIRECTORS’ RESPONSIBILITIES FOR THE FINANCIAL STATEMENTS
The Directors are responsible for overseeing the preparation of financial statements for the financial year ended
31 December 2009, which give a true and fair view of the affairs of the Company and of the Group and of the Group’s results
and cash flow for the year then ended and in compliance with the requirements of the Hong Kong Companies Ordinance and
the applicable disclosure provisions of the Listing Rules.
In preparing the financial statements for the financial year ended 31 December 2009:
(i) appropriate accounting policies are selected, applied consistently and in accordance with the Hong Kong Financial
Reporting Standards;
(ii) prudent and reasonable judgements and estimates are made; and
(iii) the reasons for any significant departure from applicable accounting standards are stated, if applicable.
(L) COMMUNICATION WITH SHAREHOLDERS
The Group uses several formal channels to ensure fair disclosure and comprehensive and transparent reporting of its
performance and activities. Annual and interim reports are printed and sent to all Shareholders. Press releases are posted on
the Company’s corporate website www.wharfholdings.com. The Company’s website provides email address, postal address, fax
number and telephone number by which enquiries may be put to the Company’s Board. Constantly being updated in a timely
manner, the website also contains a wide range of additional information on the Group’s business activities. As a standard
part of the investor relations programme to maintain a constant dialogue on the Group’s performance and objectives, senior
executives hold regular briefings and attend conferences with institutional investors and financial analysts.
The Company encourages its Shareholders to attend Annual General Meetings to ensure a high level of accountability and for
Shareholders to stay informed of the Group’s strategy and goals.
The Board and external auditors attend the Annual General Meetings to answer Shareholders’ questions.
(M) SHAREHOLDERS’ RIGHTS TO CONVENE AN EXTRAORDINARY GENERAL MEETING
Pursuant to the Hong Kong Companies Ordinance, on requisition of one or more Shareholders in aggregate holding not less
than 5% of the paid-up capital of the Company carrying the right to vote at general meetings, the Directors of the Company
must convene an extraordinary general meeting.

65The Wharf (Holdings) Limited Annual Report 2009
Report of the Directors
The Directors have pleasure in submitting their Report and the Audited Financial Statements for the financial year ended
31 December 2009.
PRINCIPAL ACTIVITIES
The principal activity of the Company is investment holding and those of its principal subsidiaries are set out on pages 144 to 147.
RESULTS, APPROPRIATIONS AND RESERVES
The results of the Group for the financial year ended 31 December 2009 are set out in the Consolidated Income Statement and
Consolidated Statement of Comprehensive Income on pages 78 and 79.
Appropriations of profits and movements in reserves during the financial year are set out in the Consolidated Statement of Changes
in Equity on page 83 and Note 29 to the Financial Statements on page 122.
DIVIDENDS
An interim dividend of 36 cents per share was paid on 30 September 2009. The Directors have now recommended for adoption
at the Annual General Meeting to be held on Tuesday, 8 June 2010 the payment on 15 June 2010 to Shareholders on record as at
8 June 2010 of a final dividend of 64 cents per share in respect of the financial year ended 31 December 2009. This recommendation
has been disclosed in the Financial Statements.
FIXED ASSETS
Movements in fixed assets during the financial year are set out in Note 11 to the Financial Statements on pages 97 to 99.
DONATIONS
The Group made donations during the financial year totalling HK$4.6 million.
DIRECTORS
The Directors of the Company during the financial year were Mr P K C Woo, Mr G W J Li (who will retire and cease to be a director
effective 1 April 2010), Mr S T H Ng, Ms D Y F Lee, Mr T Y Ng (re-designated as Executive Director on 8 June 2009), Mr P Y C Tsui,
Hon P M P Chan, Professor E K Y Chen, Dr R K F Ch’ien, Hon V K Fang, Mr Hans Michael Jebsen and Mr J E Thompson.
Professor E K Y Chen, Dr R K F Ch’ien and Mr T Y Ng are due to retire from the Board at the forthcoming Annual General Meeting.
Being eligible, they offer themselves for re-election. None of the retiring Directors proposed for re-election at the forthcoming Annual
General Meeting has a service contract with the Company which is not determinable by the employer within one year without
payment of compensation (other than statutory compensation).
INTERESTS IN CONTRACTS
No contract of significance in relation to the Company’s business to which the Company, it subsidiaries or its ultimate holding
company or any subsidiary of that ultimate holding company was a party and in which a Director of the Company had a material
interest, whether directly or indirectly, subsisted at the end of the financial year or at any time during that financial year.

66The Wharf (Holdings) Limited Annual Report 2009
Report of the Directors
MANAGEMENT CONTRACTS
No contracts for the management and administration of the whole or any substantial part of any business of the Company were
entered into or existed during the financial year.
ARRANGEMENTS TO PURCHASE SHARES OR DEBENTURES
At no time during the financial year was the Company, its subsidiaries or its ultimate holding company or any subsidiary of such
ultimate holding company a party to any arrangement to enable the Directors of the Company to acquire benefits by means of
acquisition of shares in or debentures of the Company or any other body corporate, with the exception that there existed certain
outstanding options to subscribe for ordinary shares of i-CABLE Communications Limited (“i-CABLE”) granted under i-CABLE’s Share
Option Scheme (the “Scheme”) to certain executives/employees of i-CABLE or its subsidiaries, one of whom was a Director of the
Company during the financial year.
Under the rules of the Scheme (subject to any such restrictions or alterations as may be prescribed or provided under the Rules
Governing the Listing of Securities (the “Listing Rules”) of The Stock Exchange of Hong Kong Limited (the “Stock Exchange”) from
time to time in force), shares of i-CABLE would be issued at such prices, not being less than 80% of i-CABLE’s average closing prices
on the Stock Exchange for the five trading days immediately preceding the date of offer of the options, and the relevant options
would be exercisable during such periods, not being beyond the expiration of 10 years from the date of grant, as determined by the
board of directors of i-CABLE. During the financial year, no share of i-CABLE was issued to any Director of the Company under the
Scheme.
PURCHASE, SALE OR REDEMPTION OF SHARES
Neither the Company nor any of its subsidiaries has purchased, sold or redeemed any listed securities of the Company during the
financial year.
AUDITORS
The Financial Statements now presented have been audited by KPMG, Certified Public Accountants, who retire and being eligible,
offer themselves for re-appointment.
By Order of the Board
Wilson W S Chan
Secretary
Hong Kong, 23 March 2010

67The Wharf (Holdings) Limited Annual Report 2009
SUPPLEMENTARY CORPORATE INFORMATION
(A) Biographical Details of Directors and Senior Managers etc.
(i) DirectorsPeter Kwong Ching Woo, GBS, JP, Chairman (Age: 63)Mr Woo has resumed the role of Chairman of the Company since 2002 after having also served in that capacity from 1986 to 1994. He also serves as a member and the chairman of the Company’s Remuneration Committee. He is also the chairman and a substantial shareholder of the Company’s ultimate holding company, namely, Wheelock and Company Limited (“Wheelock”), and chairman of a fellow subsidiary of the Company, namely, Wheelock Properties Limited (“WPL”), both publicly listed in Hong Kong. Furthermore, he is the chairman of another fellow subsidiary of the Company, namely, Wheelock Properties (Singapore) Limited (“WPSL”), which is publicly listed in Singapore. He is also a director of certain subsidiaries of the Company. He has for many years been actively engaged in community and related services, both locally and in the international arena, and has held various Government appointments.
Mr Woo serves as a member of the Standing Committee of the Eleventh National Committee of the Chinese People’s Political Consultative Conference of the People’s Republic of China. He was appointed a Justice of the Peace in 1993 and awarded the Gold Bauhinia Star in 1998 by the Hong Kong SAR Government. He has been appointed a non-official member of the Commission on Strategic Development since June 2007. He had served as the chairman of Hospital Authority from 1995 to 2000, the council chairman of Hong Kong Polytechnic University from 1993 to 1997 and the Government-appointed chairman of the Hong Kong Trade Development Council from 2000 to 2007. He was the chairman of the Hong Kong Environment and Conservation Fund Committee set up in 1994 which he co-funded with the Government. He also served as a deputy chairman in 1991 to Prince of Wales Business Leaders Forum, and as a member of the International Advisory Council of JPMorgan Chase & Co., National Westminster Bank, Banca Nazionale del Lavoro, Elf Aquitaine of France and General Electric of America. He has received Honorary Doctorates from various universities in Australia, Hong Kong and the United States. Under the existing service contract between the Group and Mr Woo, his basic salary and various allowances for the year 2010, exclusive of the amounts which would be borne by Wheelock and/or its wholly-owned subsidiary(ies) and calculated on annualised basis, would be approximately HK$11.10 million per annum (2009: HK$10.49 million).
Stephen Tin Hoi Ng, Deputy Chairman & Managing Director (Age: 57)Mr Ng joined the Company in 1981. He has been the Managing Director of the Company since 1989 and became the Deputy Chairman in 1994. He is also the deputy chairman of Wheelock as well as the chairman and chief executive officer of i-CABLE Communications Limited (“i-CABLE”) and the chairman of Harbour Centre Development Limited (“HCDL”), both being publicly-listed subsidiaries of the Company. Furthermore, Mr Ng is the chairman of Modern Terminals Limited (a subsidiary of the Company), the chairman and chief executive officer of Wharf T&T Limited (a wholly-owned subsidiary of the Company), and a director of certain other subsidiaries of the Company. Mr Ng is also the chairman of publicly-listed Joyce Boutique Holdings Limited (“Joyce”). Under the existing service contract between the Group and Mr Ng, his basic salary and various allowances for the year 2010, calculated on annualised basis, would be approximately HK$4.70 million per annum (2009: HK$4.46 million).
68The Wharf (Holdings) Limited Annual Report 2009
Report of the Directors
Doreen Yuk Fong Lee, Executive Director (Age: 53)Ms Lee joined the Company in 1984. She has been a Director of the Company since 2003 and became an Executive Director in March 2007. She is also the senior managing director of Wharf China Estates Limited, and the managing director of Harbour City Estates Limited, Times Square Limited and Wharf Estates Limited, all being wholly-owned subsidiaries of the Company, as well as a director of certain other subsidiaries of the Company. Ms Lee is responsible for overseeing all of the Group’s investment properties in Hong Kong and the Mainland China, particularly, two core properties of the Group in Hong Kong, namely, Harbour City and Times Square, and also the Group’s Times Square developments in Shanghai, Chongqing, Wuhan and Dalian. Ms Lee is also a director of Joyce. She is a graduate of The University of Hong Kong where she obtained her bachelor’s degree in Arts (Hon). Under the existing service contract between the Group and Ms Lee, her basic salary and various allowances for the year 2010, calculated on annualised basis, would be approximately HK$3.75 million per annum (2009: HK$3.57 million).
Tze Yuen Ng, Executive Director (Age: 62)Mr Ng, ACPA, ACMA, joined the Company in 1985 and has been a Director of the Company since 1998. He was re-designated as an Executive Director in June 2009. He is also a director of HCDL, the senior managing director of Wharf China Development Limited, and a director of certain other subsidiaries of the Company. Furthermore, Mr Ng is a director of WPL, and was formerly a director of Joyce from 2000 to 2008. Under the existing service contract between the Group and Mr Ng, his basic salary and various allowances for the year 2010, exclusive of the amounts which would be borne by Wheelock and/or its wholly-owned subsidiary(ies) and calculated on annualised basis, would be approximately HK$2.91 million per annum (2009: HK$2.85 million).
Paul Yiu Cheung Tsui, Executive Director and Group Chief Financial Officer (Age: 63)Mr Tsui, FCCA, FCPA, FCMA, FCIS, CGA-Canada, is an Executive Director & Group Chief Financial Officer of both Wheelock and the Company. He joined Wheelock/Wharf group in 1996 and became Wheelock’s director in 1998. He is also a director of HCDL and i-CABLE, and a director of certain other subsidiaries of the Company. Furthermore, Mr Tsui is a director of two fellow subsidiaries of the Company, namely, WPL and WPSL, as well as a director of Joyce. Under the existing service contract between the Group and Mr Tsui, his basic salary and various allowances for the year 2010, exclusive of the amounts which would be borne by Wheelock and/or its wholly-owned subsidiary(ies) and calculated on annualised basis, would be approximately HK$2.23 million per annum (2009: HK$1.95 million).
Hon Paul Mo Po Chan, JP, Director (Age: 55)Mr Chan, FCPA, FCCA, FCPA (Australia), FCIS, FCS, FTIHK, has been an independent Non-executive Director of the Company since September 2004. He also serves as a member of the Company’s Audit Committee. He is the chairman of Crowe Horwath (HK) CPA Ltd. He is also an independent non-executive director of three other companies publicly listed in Hong Kong, namely, Kingmaker Footwear Holdings Limited, Hong Kong Economic Times Holdings Limited and China Communications Services Corporation Limited. He has been appointed the chairman of the Legal Aid Services Council since September 2006. Mr Chan was formerly an independent non-executive director of I.T Limited from 2004 to 2007 and of China Resources Land Limited from 2006 to 2009, both being publicly-listed companies.
Mr Chan is a graduate of The Chinese University of Hong Kong where he obtained both his bachelor’s and master’s degrees in Business Administration.
Mr Chan has over 30 years’ experience in accounting and finance field and is a former president of the Hong Kong Institute of Certified Public Accountants. He is also a former chairman of The Association of Chartered Certified Accountants – Hong Kong. In 2007, he was appointed a Justice of the Peace. In 2008, he was appointed a member of Shanghai City’s Chinese People’s Political Consultative Conference. Mr Chan was elected in September 2008 as a member of Legislative Council representing the Accountancy Functional Constituency.

69The Wharf (Holdings) Limited Annual Report 2009
Edward Kwan Yiu Chen, GBS, CBE, JP, Director (Age: 65)
Professor Chen has been an independent Non-executive Director of the Company since 2002. He was the president
of Lingnan University in Hong Kong from September 1995 to August 2007. He is an honorary professor of the Open
University of Hong Kong and a distinguished fellow of the Centre of Asian Studies at The University of Hong Kong. He
was a member of the Legislative Council of Hong Kong from 1991 to 1992, and a member of the Executive Council of
Hong Kong from 1992 to 1997. He was also a member of the Hong Kong SAR Basic Law Consultative Committee from
1985 to 1990. He is a director of two companies publicly listed in Hong Kong, namely, First Pacific Company Limited and
Asia Satellite Telecommunications Holdings Limited.
Professor Chen was educated at The University of Hong Kong (Bachelor of Arts and Master of Social Science) and Oxford
University (Doctor of Philosophy). He was appointed a Justice of the Peace in 1993 and awarded a CBE in 1995. In 2003,
he was awarded the Gold Bauhinia Star Medal by the Hong Kong SAR Government.
Raymond Kuo Fung Ch’ien, GBS, CBE, JP, Director (Age: 58)
Dr Ch’ien has been an independent Non-executive Director of the Company since 2002. He is chairman of
CDC Corporation as well as the chairman and a director respectively of its subsidiaries China.com Inc., publicly listed
in Hong Kong, and CDC Software Corporation. Dr Ch’ien is also the chairman of two companies publicly listed in Hong
Kong, namely, MTR Corporation Limited and Hang Seng Bank Limited. Dr Ch’ien also serves on the boards of The
Hongkong and Shanghai Banking Corporation Limited, Hong Kong Mercantile Exchange Limited, Swiss Reinsurance
Company Ltd and publicly-listed Convenience Retail Asia Limited. He was formerly an independent non-executive director
of publicly-listed VTech Holdings Limited from 2001 to 2008.
In public service, Dr Ch’ien is the chairman of the Hong Kong/European Union Business Cooperation Committee and a
member of the Standing Committee of the Tianjin Municipal Committee of the Chinese People’s Political Consultative
Conference. Dr. Ch’ien is an honorary president and past chairman of the Federation of Hong Kong Industries. From 1992
to 1997, Dr Ch’ien was a member of the Executive Council of Hong Kong, then under British administration. He was
appointed a member of the Executive Council of the Hong Kong SAR on 1 July 1997 and served until June 2002.
Dr Ch’ien received a doctoral degree in Economics from the University of Pennsylvania in 1978 and became a Trustee of
the University in 2006. He was appointed a Justice of the Peace in 1993 and a Commander in the Most Excellent Order of
the British Empire in 1994. In 1999, he was awarded the Gold Bauhinia Star Medal by the Hong Kong SAR Government.
In 2008, he was conferred the honour of Chevalier de l’Ordre du Merite Agricole of France.
Hon Vincent Kang Fang, SBS, JP, Director (Age: 66)
Mr Fang has been an independent Non-executive Director of the Company since 1993. He also serves as a member and
chairman of the Company’s Audit Committee. He is the chief executive officer of Toppy Company (Hong Kong) Limited
and managing director of Fantastic Garments Limited.
Mr Fang currently serves as a member of Legislative Council representing Wholesale and Retail in Functional Constituency.
He is a member of the Hospital Authority and Hong Kong Tourism Board. He is also a member of the Operations Review
Committee of the Independent Commission Against Corruption (“ICAC”) and a board member of the Airport Authority. He
is the chairman of Hospital Governing Committee of Princess Margaret Hospital and Kwai Chung Hospital and the Quality
Tourism Services Association. He is an honorary advisor of Hong Kong Retail Management Association and a director of
The Federation of Hong Kong Garment Manufacturers.
Mr Fang is a graduate of North Carolina State University where he obtained both his bachelor’s and master’s degrees
in Science of Textiles Engineering. Mr Fang was awarded the Silver Bauhinia Star by the Hong Kong SAR Government in
2008. He is also a Justice of the Peace.

70The Wharf (Holdings) Limited Annual Report 2009
Report of the Directors
Hans Michael Jebsen, BBS, Director (Age: 53)
Mr Jebsen has been an independent Non-executive Director of the Company since 2001. He also serves as a member of
the Company’s Audit Committee and Remuneration Committee. He is the chairman of Jebsen and Company Limited and
also a non-executive director of publicly-listed Hysan Development Company Limited as well as vice chairman and a
Board Member of Danfoss A/S, Denmark. He currently holds a number of public offices, namely, the vice-president and a
trustee of World Wide Fund for Nature Hong Kong, the chairman of the Friend’s Committee of the Asian Cultural Council
Hong Kong, a Board Member of the Asian Cultural Council Board of Trustees, affiliate of the Rockefeller Brothers Fund,
New York, an honorary fellow and a council member of the Hong Kong University of Science & Technology, as well as
a member of the Advisory Council for the Environment, Hong Kong European Union Business Co-operation Committee
of the Hong Kong Trade Development Council, Advisory Council as well as Board of Trustees of Asia Society Hong Kong
Center and Advisory Board of the Hong Kong Red Cross. He is also an Honorary Citizen and Municipal Economic Advisor
as well as a Committee Member of the CPPCC Jilin City, China.
After schooling in Germany and Denmark, he received a two-year banking education in Germany and the UK and studied
Business Administration at the University of St. Gallen in Switzerland from 1978 to 1981.
Mr Jebsen was awarded the Bronze Bauhinia Star by the Hong Kong SAR Government in 2001, made a Knight of the
Dannebrog by receiving the Silver Cross of the Order of Dannebrog by H. M. the Queen of Denmark in 2006 and was
awarded the Merit Cross of the Order of the Merit of the Federal Republic of Germany in 2008.
James Edward Thompson, GBS, Director (Age: 70)
Mr Thompson has been an independent Non-executive Director of the Company since 2001. He also serves as a member
of the Company’s Audit Committee and Remuneration Committee. He established his company, Crown Worldwide, in
Japan in 1965. He is a member of the American Chamber of Commerce (“ACC”) in Hong Kong and was appointed as the
chairman of ACC in 2003. He also serves on Hong Kong – United States Business Council, the Hong Kong Japan Business
Co-operation Committee, and the Hong Kong Korea Business Roundtable. Mr Thompson has lived in Hong Kong for over
30 years and has served on the Trade Development Council, the ICAC Advisory Committee as well as other government
and charitable committees. He was awarded the Gold Bauhinia Star by the Hong Kong SAR Government in 2003.
Notes:
(1) Wheelock, WF Investment Partners Limited, Wheelock Corporate Services Limited, Myers Investments Limited, WPL, Star Attraction
Limited and Lynchpin Limited (of which one or more of Mr P K C Woo, Mr S T H Ng, Mr P Y C Tsui and Mr T Y Ng is/are director(s))
have interests in the share capital of the Company discloseable to the Company under the provisions of Divisions 2 and 3 of Part
XV of the Securities and Futures Ordinance (the “SFO”).
(2) The Company confirms that it has received written confirmation from each of the independent Non-executive Directors confirming
their independence pursuant to Rule 3.13 of the Listing Rules and considers them independent.
(ii) Senior Management
Peter K C Woo, Chairman
Stephen T H Ng, Deputy Chairman & Managing Director
Doreen Y F Lee, Executive Director
Andrew O K Chow, Vice Chairman – Wharf China Development Limited (Age: 59)
Mr Chow joined the Group in 2006. He is the vice chairman of Wharf China Development Limited, which is a wholly-
owned subsidiary of the Company. Mr Chow has extensive experience in banking, finance, trading, investment as well
as property investment in Mainland China. He is responsible for overseeing all of the Group’s property development and
related businesses in Mainland China. Mr Chow is also an independent non-executive director of Hong Kong Economic
Times Holdings Limited, a company publicly-listed in Hong Kong. He formerly held senior executive position in Tian An
China Investment Limited and Next Media Limited before he joined the Group. Mr Chow is a graduate of The University
of Hong Kong where he obtained his bachelor’s degree in Social Science.
T Y Ng, Executive Director
Paul Y C Tsui, Executive Director & Group Chief Financial Officer

71The Wharf (Holdings) Limited Annual Report 2009
(B) Directors’ Interests in Shares
At 31 December 2009, Directors of the Company had the following beneficial interests, all being long positions, in the share
capitals of the Company, Wheelock (which is the Company’s parent company), WPL (which is a fellow subsidiary of the
Company), and two subsidiaries of the Company, namely, i-CABLE and Modern Terminals, and the percentages which the
relevant shares represented to the issued share capitals of the five companies respectively are also set out below:
No. of Ordinary Shares
(percentage of issued capital) Nature of Interest
The Company
Gonzaga W J Li 772,367 (0.0280%) Personal Interest
Stephen T H Ng 731,314 (0.0266%) Personal Interest
T Y Ng 200,268 (0.0073%) Personal Interest
Wheelock
Peter K C Woo 1,204,934,330 (59.3023%) Personal Interest in 8,847,510 shares,
Corporate Interest in 200,865,142 shares
and Other Interest in 995,221,678 shares
Gonzaga W J Li 1,486,491 (0.0732%) Personal Interest
Stephen T H Ng 300,000 (0.0148%) Personal Interest
T Y Ng 70,000 (0.0034%) Personal Interest
WPL
Gonzaga W J Li 2,900 (0.0001%) Personal Interest
i-CABLE
Gonzaga W J Li 68,655 (0.0034%) Personal Interest
Stephen T H Ng 1,265,005 (0.0629%) Personal Interest
T Y Ng 17,801 (0.0009%) Personal Interest
Modern Terminals
Hans Michael Jebsen 3,787 (5.40%) Corporate Interest
Notes:
(1) The 995,221,678 shares of Wheelock stated above as “Other Interest” against the name of Mr Peter K C Woo represented an interest
comprised in certain trust properties in which Mr Woo was taken, under certain provisions in Part XV of the SFO which are applicable to
a director or chief executive of a listed company, to be interested.
(2) The shareholdings classified as “Corporate Interest” in which the Directors concerned were taken to be interested as stated above were
interests of corporations at respective general meetings of which the relevant Directors were respectively either entitled to exercise
(or taken under Part XV of the SFO to be able to exercise) or control the exercise of one-third or more of the voting power in general
meetings of such corporations.
Except as disclosed above, as recorded in the register kept by the Company under section 352 of the SFO in respect of
information required to be notified to the Company and the Stock Exchange by the Directors and/or Chief Executive of the
Company pursuant to the SFO or to the Model Code for Securities Transactions by Directors of Listed Issuers, there were
no interests, both long and short positions, held during the financial year by any of the Directors or Chief Executive of the
Company in shares, underlying shares or debentures of the Company and its associated corporations (within the meaning
of Part XV of the SFO), nor had there been any exercises during the financial year of any rights to subscribe for any shares,
underlying shares or debentures of the Company.

72The Wharf (Holdings) Limited Annual Report 2009
Report of the Directors
(C) Substantial Shareholders’ Interests
Given below are the names of all parties which were, directly or indirectly, interested in 5% or more of the nominal value of
any class of share capital of the Company as at 31 December 2009, the respective relevant numbers of shares in which they
were, and/or were deemed to be, interested as at the date as recorded in the register kept by the Company under section 336
of the SFO (the “Register”) and the percentages which the shares represented to the issued share capital of the Company:
No. of Ordinary Shares
Names (percentage of issued capital)
(i) Lynchpin Limited 193,879,157 (7.04%)
(ii) Star Attraction Limited 193,879,157 (7.04%)
(iii) Wheelock Properties Limited 193,879,157 (7.04%)
(iv) Myers Investments Limited 193,879,157 (7.04%)
(v) Wheelock Corporate Services Limited 193,879,157 (7.04%)
(vi) WF Investment Partners Limited 1,183,652,306 (42.98%)
(vii) Wheelock and Company Limited 1,377,531,463 (50.02%)
(viii) HSBC Trustee (Guernsey) Limited 1,377,531,463 (50.02%)
(ix) JPMorgan Chase & Co. 162,637,735 (5.91%)
Note: For the avoidance of doubt and double counting, it should be noted that duplication occurs in respect of the shareholdings stated
against parties (i) to (viii) above to the extent that the shareholding stated against party (i) above was entirely duplicated or included in
that against party (ii) above, with the same duplication of the shareholdings in respect of (ii) in (iii), (iii) in (iv), (iv) in (v), (v) in (vi), (vi)
in (vii) and (vii) in (viii).
All the interests stated above represented long positions and as at 31 December 2009, there were no short position interests
recorded in the Register.
(D) Directors’ Interests in Competing Business
Set out below is information disclosed pursuant to Rule 8.10 of the Listing Rules.
Five Directors of the Company, namely, Mr P K C Woo, who is also the chairman and a substantial shareholder of Wheelock,
and Mr S T H Ng, Ms D Y F Lee, Mr T Y Ng and Mr P Y C Tsui, being also directors of Wheelock and/or certain subsidiaries of
Wheelock, are considered as having an interest in Wheelock under Rule 8.10 of the Listing Rules.
Ownership of property for letting and development of properties for sale and/or investment carried on by Wheelock and
subsidiaries of Wheelock (the “Wheelock Group”) constitute competing businesses of the Group.
The ownership of commercial premises for rental purposes and the development of properties for sale and/or investment
purposes by the Wheelock Group are considered as competing businesses for the Group. However, the Group itself has
adequate experience in property leasing and property development and is therefore capable of carrying on its property leasing
and property development business independently of the Wheelock Group.
For safeguarding the interests of the Group, the independent Non-executive Directors and the Audit Committee of the Company
would on a regular basis review the business and operational results of the Group to ensure, inter alia, that the Group’s
development of properties for sale and/or investment and property leasing businesses are and continue to be run on the basis
that they are independent of, and at arm’s length from, those of the Wheelock Group.

73The Wharf (Holdings) Limited Annual Report 2009
(E) Major Customers and Suppliers
For the financial year ended 31 December 2009:
(i) the aggregate amount of purchases (not including the purchases of items which are of a capital nature) attributable to
the Group’s five largest suppliers represented less than 30% of the Group’s total purchases; and
(ii) the aggregate amount of turnover attributable to the Group’s five largest customers represented less than 30% of the
Group’s total turnover.
(F) Bank Loans, Overdrafts and other Borrowings
Particulars of any and all bank loans, overdrafts and/or other borrowings of the Company and of the Group as at
31 December 2009 which are repayable on demand or within a period not exceeding one year are set out in Note 24 to
the Financial Statements on pages 111 and 112. Those which would fall due for repayment after a period of one year are
particularised in Note 24 to the Financial Statements on pages 111 and 112.
Set out below is information regarding certain borrowings of the Group outstanding as at 31 December 2009, all in the form of
debt securities issued by wholly-owned subsidiaries of and guaranteed by the Company:
Outstanding
Name of Subsidiary/Borrower Description of Debt Securities Issued Principal Amount
(1) Wharf Finance (BVI) Limited HK$ Guaranteed Floating Rate Notes due 2010 HK$200 Million
HK$ Guaranteed Fixed Rate Notes due 2011 HK$200 Million
HK$ Guaranteed Floating Rate Notes due 2013 HK$300 Million
HK$ Guaranteed Fixed Rate Notes due 2016 HK$250 Million
(2) Wharf Finance Limited HK$ Guaranteed Zero Coupon Callable Notes due 2019 HK$320 Million
HK$ Guaranteed Zero Coupon Callable Notes due 2019 HK$160 Million
US$ Guaranteed Fixed Rate Notes due 2017 US$400 Million
HK$ Guaranteed Floating Rate Notes due 2014 HK$200 Million
(3) Wharf Finance (No. 1) Limited HK$ Guaranteed Fixed Rate Notes due 2019 HK$240 Million
(G) Interest Capitalised
The amount of interest (all being borrowing costs) capitalised by the Group during the financial year is set out in Note 6 to the
Financial Statements on page 94.
(H) Public Float
Based on information that is publicly available to the Company and within the knowledge of the Directors as at the date of
this report, the Company has maintained the prescribed public float under the Listing Rules throughout the financial year
ended 31 December 2009.

74The Wharf (Holdings) Limited Annual Report 2009
Report of the Directors
(I) Disclosure of Connected Transactions
Set out below is information in relation to certain connected transactions involving the Company and/or its subsidiaries,
particulars of which were previously disclosed in announcements of the Company dated 21 November 2008, 17 September 2009
and 3 November 2009 respectively and are required under the Listing Rules to be disclosed in the Annual Report and Financial
Statements of the Company:
(i) Master Tenancy Agreement
Various tenancy agreements (the “Existing Tenancy Agreements”) were previously entered into between certain
subsidiaries of the Company as landlords and certain subsidiaries and associates of Chesterland Group Limited (formerly
known as The Lane Crawford Joyce Group (BVI) Limited) (“CGL”) as tenants, for the purpose of the letting by the
landlords to the tenants certain retail/commercial premises situate at Harbour City and/or Times Square for operating
Lane Crawford stores, City Super stores, Ferragamo shop and Joyce Boutique shop.
On 21 November 2008, a master tenancy agreement (the “MTA”) was entered into between the Company and CGL
for a term of three years from 1 January 2009 to 31 December 2011 to, among other things, provide for the maximum
aggregate annual cap amount that will be payable by the tenants to the landlords under the Existing Tenancy
Agreements and all further individual tenancy agreements from time to time during the three-year term of the MTA to
be separately entered into between member of the Group and subsidiaries and/or associates of CGL in respect of the
leasing of premises owned by the Group.
CGL is indirectly wholly-owned by a trust of which Mr P K C Woo, the Chairman of the Company, is the settlor.
Consequently, the entering into of the MTA and the relevant transactions regulated thereunder (the “MTA Transactions”)
constitute continuing connected transactions for the Company.
The aggregate amount of rental receivable by the Group under the MTA is subject to an annual cap amount previously
disclosed in the abovementioned announcement dated 21 November 2008 and the aggregate amount of rental receivable
by the Group for the financial year ended 31 December 2009 was HK$300.89 million.
(ii) Tianjin Land Joint Venture
On 17 September 2009, the Group together with China Merchants Property Development Co., Ltd. (“CMP”) group
succeeded in bidding for a piece of land in Tianjin with a site area of approximately 511,558 square feet (the “Tianjin
Land”) at a price of RMB641 million (equal to about HK$728 million) (the “Tianjin Land Transaction”). The Group and
CMP group will jointly develop the Tianjin Land, on a 50:50 ownership basis, into residential and commercial properties.
As CMP is a 54.1%-owned subsidiary of China Merchants Group Limited which in turn is an indirect substantial
shareholder of a non wholly-owned subsidiary of the Company, CMP is regarded as a connected person of the Company.
Therefore, the entering into of the Tianjin Land Transaction together with the joint development of the Tianjin Land
constitute connected transactions for the Company under the Listing Rules.

75The Wharf (Holdings) Limited Annual Report 2009
(iii) Chongqing Land Joint Venture
On 29 October 2009, the Group together with China Overseas Land & Investment Ltd. (“COLI”) group succeeded in
bidding for two pieces of land in Chongqing with a site area of approximately 2.85 million square feet (the “Chongqing
Land”) at a price of RMB4,100 million (equal to about HK$4,654 million) (the “Chongqing Land Transaction”). The
Group and COLI group will jointly develop the Chongqing Land, on a 50:50 ownership basis, into residential and
office/commercial properties.
As COLI is a substantial shareholder of a non wholly-owned subsidiary of the Company, COLI is regarded as a connected
person of the Company. Therefore, the entering into of the Chongqing Land Transaction together with the joint
development of the Chongqing Land constitute connected transactions for the Company under the Listing Rules.
The purpose of the transactions set out under (I)(ii) and (I)(iii)above is for broadening the assets and earnings base of the
Group.
(iv) Confirmation from the Directors etc.
(i) The Directors, including the independent Non-executive Directors, of the Company have reviewed the MTA
Transactions mentioned under Section I(i) above and confirmed that the MTA Transactions were entered into:
(1) by the Group in the ordinary and usual course of its business;
(2) either on normal commercial terms or, if there are not sufficient comparable transactions, on terms that are
no less favourable than those available to or from (as appropriate) independent third parties; and
(3) in accordance with the relevant agreements governing the MTA Transactions on terms that are fair and
reasonable and in the interests of the Shareholders of the Company as a whole.
(ii) Furthermore, the auditors of the Company have advised the following:
(1) the MTA Transactions had been approved by the Company’s Board of Directors;
(2) nothing came to the attention of the auditors of the Company that caused them to believe that the MTA
Transactions were not entered into in accordance with the terms of the related agreements governing the
MTA Transactions; and
(3) the relevant cap amounts, where applicable, have not been exceeded during the financial year ended
31 December 2009.

76

77The Wharf (Holdings) Limited Annual Report 2009
Report of the Independent Auditor
TO THE SHAREHOLDERS OF THE WHARF (HOLDINGS) LIMITED
(INCORPORATED IN HONG KONG WITH LIMITED LIABILITY)
We have audited the consolidated financial statements of The Wharf (Holdings) Limited (the “Company”) set out on pages 78 to
147, which comprise the consolidated and company statements of financial position as at 31 December 2009, and the consolidated
income statement, the consolidated statement of comprehensive income, the consolidated statement of changes in equity and
the consolidated statement of cash flows for the year then ended, and a summary of significant accounting policies and other
explanatory notes.
DIRECTORS’ RESPONSIBILITY FOR THE FINANCIAL STATEMENTS
The Directors of the Company are responsible for the preparation and the true and fair presentation of these financial statements in
accordance with Hong Kong Financial Reporting Standards issued by the Hong Kong Institute of Certified Public Accountants and the
Hong Kong Companies Ordinance. This responsibility includes designing, implementing and maintaining internal control relevant to
the preparation and the true and fair presentation of financial statements that are free from material misstatement, whether due to
fraud or error; selecting and applying appropriate accounting policies; and making accounting estimates that are reasonable in the
circumstances.
AUDITOR’S RESPONSIBILITY
Our responsibility is to express an opinion on these financial statements based on our audit. This report is made solely to you,
as a body, in accordance with section 141 of the Hong Kong Companies Ordinance, and for no other purpose. We do not assume
responsibility towards or accept liability to any other person for the contents of this report.
We conducted our audit in accordance with Hong Kong Standards on Auditing issued by the Hong Kong Institute of Certified Public
Accountants. Those standards require that we comply with ethical requirements and plan and perform the audit to obtain reasonable
assurance as to whether the financial statements are free from material misstatement.
An audit involves performing procedures to obtain audit evidence about the amounts and disclosures in the financial statements.
The procedures selected depend on the auditor’s judgement, including the assessment of the risks of material misstatement of the
financial statements, whether due to fraud or error. In making those risk assessments, the auditor considers internal control relevant
to the entity’s preparation and true and fair presentation of the financial statements in order to design audit procedures that are
appropriate in the circumstances, but not for the purpose of expressing an opinion on the effectiveness of the entity’s internal
control. An audit also includes evaluating the appropriateness of accounting policies used and the reasonableness of accounting
estimates made by the Directors, as well as evaluating the overall presentation of the financial statements.
We believe that the audit evidence we have obtained is sufficient and appropriate to provide a basis for our audit opinion.
OPINION
In our opinion, the consolidated financial statements give a true and fair view of the state of affairs of the Company and of the
Group as at 31 December 2009 and of the Group’s profit and cash flows for the year then ended in accordance with Hong Kong
Financial Reporting Standards and have been properly prepared in accordance with the Hong Kong Companies Ordinance.
KPMG
Certified Public Accountants
8th Floor, Prince’s Building
10 Chater Road
Central, Hong Kong
23 March 2010

78The Wharf (Holdings) Limited Annual Report 2009
Consolidated Income StatementFor the year ended 31 December 2009
2009 2008
Note HK$ Million HK$ Million
Turnover 1 17,553 15,940
Direct costs and operating expenses (6,069) (5,359)
Selling and marketing expenses (722) (695)
Administrative and corporate expenses (907) (951)
Operating profit before depreciation, amortisation, interest and tax 9,855 8,935
Depreciation and amortisation 2 (1,301) (1,392)
Operating profit 2 8,554 7,543
Profit on disposal of an investment property 3 1,110 –
Increase in fair value of investment properties 12,204 1,793
Other net income 4 227 96
Net other charge 5 (52) (145)
22,043 9,287
Finance costs 6 (338) (1,521)
Share of results after tax of:
Associates 14(d) 281 136
Jointly controlled entities 15 75 5
Profit before taxation 22,061 7,907
Income tax 7 (3,973) (1,189)
Profit for the year 18,088 6,718
Profit attributable to:
Equity shareholders 8 17,501 6,247
Minority interests 587 471
18,088 6,718
Earnings per share 10
Basic HK$6.35 HK$2.28
Diluted HK$6.35 HK$2.28
The notes and principal accounting policies on pages 87 to 147 form part of these financial statements. Details of dividends payable
to equity shareholders of the Company attributable to the profit for the year are set out in note 9.

79The Wharf (Holdings) Limited Annual Report 2009
Consolidated Statement of Comprehensive IncomeFor the year ended 31 December 2009
2009 2008
HK$ Million HK$ Million
Profit for the year 18,088 6,718
Other comprehensive income
Actuarial gain/(loss) on defined benefit pension schemes 274 (412)
Exchange difference (155) 891
Exchange gain 37 891
Transferred to consolidated income statement:
– on disposal of an investment property (119) –
– others (73) –
Cash flow hedge: transfer to consolidated income statement – (45)
Available-for-sale investments:
Net movement in the investments revaluation reserves 555 (958)
Surplus/(deficit) on revaluation 573 (777)
Transferred to consolidated income statement :
– on disposal (18) (326)
– on impairment – 145
Share of other comprehensive income of associates/jointly controlled entities (12) 122
Others (26) (3)
Other comprehensive income for the year 636 (405)
Total comprehensive income for the year 18,724 6,313
Total comprehensive income attributable to:
Equity shareholders 17,919 6,212
Minority interests 805 101
18,724 6,313
The notes and principal accounting policies on pages 87 to 147 form part of these financial statements.

80The Wharf (Holdings) Limited Annual Report 2009
Consolidated Statement of Financial PositionAt 31 December 2009
2009 2008
Note HK$ Million HK$ Million
Non-current assets
Investment properties 115,492 98,410
Other property, plant and equipment 14,722 16,980
Leasehold land 3,788 4,203
Total fixed assets 11 134,002 119,593
Goodwill and other intangible assets 13 297 297
Interest in associates 14 4,238 4,009
Interest in jointly controlled entities 15 7,551 7,989
Available-for-sale investments 16 1,331 706
Long term receivables 17 249 357
Programming library 113 132
Employee retirement benefit assets 18 139 –
Deferred tax assets 25 366 383
Derivative financial assets 21 318 83
148,604 133,549
Current assets
Properties for sale 19 17,797 17,272
Inventories 107 112
Held-to-maturity investments 16 794 –
Trade and other receivables 20 4,554 1,727
Derivative financial assets 21 193 8
Bank deposits and cash 22 18,412 15,886
41,857 35,005
Current liabilities
Trade and other payables 23 (8,240) (6,924)
Bank loans and other borrowings 24 (8,328) (4,443)
Derivative financial liabilities 21 (100) (166)
Taxation payable 7(d) (1,581) (1,259)
(18,249) (12,792)
Net current assets 23,608 22,213
Total assets less current liabilities 172,212 155,762
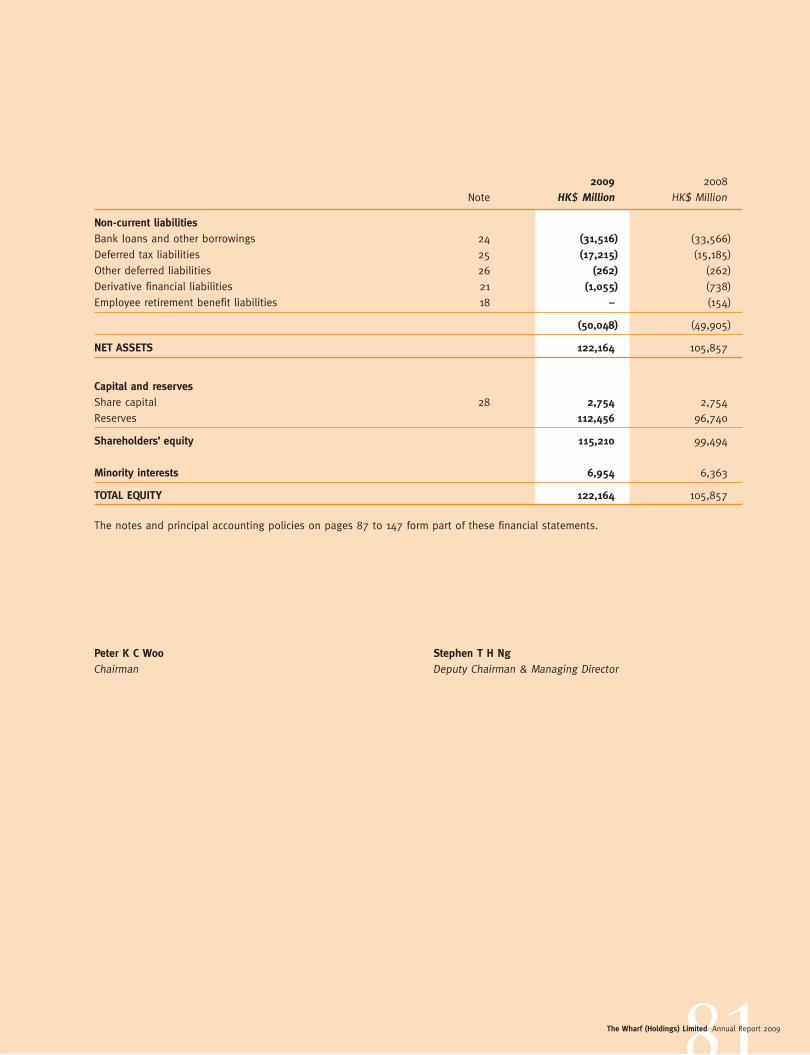
81The Wharf (Holdings) Limited Annual Report 2009
2009 2008
Note HK$ Million HK$ Million
Non-current liabilities
Bank loans and other borrowings 24 (31,516) (33,566)
Deferred tax liabilities 25 (17,215) (15,185)
Other deferred liabilities 26 (262) (262)
Derivative financial liabilities 21 (1,055) (738)
Employee retirement benefit liabilities 18 – (154)
(50,048) (49,905)
NET ASSETS 122,164 105,857
Capital and reserves
Share capital 28 2,754 2,754
Reserves 112,456 96,740
Shareholders’ equity 115,210 99,494
Minority interests 6,954 6,363
TOTAL EQUITY 122,164 105,857
The notes and principal accounting policies on pages 87 to 147 form part of these financial statements.
Peter K C Woo Stephen T H Ng
Chairman Deputy Chairman & Managing Director

82The Wharf (Holdings) Limited Annual Report 2009
Company Statement of Financial PositionAt 31 December 2009
2009 2008
Note HK$ Million HK$ Million
Non-current assets
Interest in subsidiaries 12 23,107 14,362
Long term receivables 17 241 347
23,348 14,709
Current assets
Receivables 1 2
Bank deposits and cash 22 1 9,309
Taxation recoverable 7(d) 1 –
3 9,311
Current liability
Trade and other payables (24) (20)
Net current (liabilities)/assets (21) 9,291
NET ASSETS 23,327 24,000
Capital and reserves
Share capital 28 2,754 2,754
Reserves 20,573 21,246
SHAREHOLDERS’ EQUITY 29(a) 23,327 24,000
The notes and principal accounting policies on pages 87 to 147 form part of these financial statements.
Peter K C Woo Stephen T H Ng
Chairman Deputy Chairman & Managing Director

83The Wharf (Holdings) Limited Annual Report 2009
Consolidated Statement of Changes in EquityFor the year ended 31 December 2009
Shareholders’ equity
Capital Investments Exchange Total
Share Share redemption revaluation and other Revenue Shareholders’ Minority Total
capital premium reserves reserves reserves reserves equity interests equity
HK$ Million HK$ Million HK$ Million HK$ Million HK$ Million HK$ Million HK$ Million HK$ Million HK$ Million
At 1 January 2008 2,448 7,751 7 763 791 74,604 86,364 5,638 92,002
Total comprehensive income for the year – – – (662) 917 5,957 6,212 101 6,313
Rights issue 306 8,815 – – – – 9,121 – 9,121
Shares issued by subsidiaries – – – – – – – 950 950
Final dividends paid in respect of 2007 – – – – – (1,212) (1,212) – (1,212)
Interim dividends paid in respect of 2008 (Note 9) – – – – – (991) (991) – (991)
Dividends paid to minority interests – – – – – – – (326) (326)
At 31 December 2008 and 1 January 2009 2,754 16,566 7 101 1,708 78,358 99,494 6,363 105,857
Total comprehensive income for the year – – – 395 (166) 17,690 17,919 805 18,724
Shares issued by subsidiaries – – – – – – – 292 292
Final dividends paid in respect of 2008 (Note 9) – – – – – (1,212) (1,212) – (1,212)
Interim dividends paid in respect of 2009 (Note 9) – – – – – (991) (991) – (991)
Dividends paid to minority interests – – – – – – – (268) (268)
Disposal of an investment property – – – – – – – (238) (238)
At 31 December 2009 2,754 16,566 7 496 1,542 93,845 115,210 6,954 122,164
The notes and principal accounting policies on pages 87 to 147 form part of these financial statements.

84The Wharf (Holdings) Limited Annual Report 2009
Consolidated Statement of Cash FlowsFor the year ended 31 December 2009
2009 2008
Note HK$ Million HK$ Million
Operating cash inflow (a) 9,660 8,557
Changes in working capital (a) (2,053) (6,918)
Cash generated from operations (a) 7,607 1,639
Interest paid (615) (1,117)
Interest received 59 272
Dividends received from associates/jointly controlled entities 347 264
Dividends received from investments 131 139
Hong Kong profits tax paid (1,357) (1,297)
Overseas tax paid (239) (331)
Net cash generated from/(used in) operating activities 5,933 (431)
Investing activities
Purchase of fixed assets (2,158) (3,568)
Additions to programming library (87) (103)
Net (increase)/decrease in interest in associates (286) 133
Net increase in interest in jointly controlled entities (1,068) (3,395)
Net proceeds from disposal of subsidaries and a jointly controlled entity (c) 812 –
Net proceeds from disposal of fixed assets 82 6
Purchase of financial investments (881) (17)
Proceeds from disposal of available-for-sale investments 130 1,205
Repayment of long term receivables 108 5
Uplift of pledged deposits 605 81
Placement of bank deposits with maturity greater than three months (2,700) –
Net cash used in investing activities (5,443) (5,653)
Financing activities
Proceeds from the Rights issue of shares – 9,121
Drawdown of bank loans and other borrowings 7,769 13,684
Repayment of bank loans and other borrowings (5,649) (6,991)
Issue of shares by subsidiaries to minority interests (b) 292 950
Dividends paid to equity shareholders (2,203) (2,203)
Dividends paid to minority interests (268) (326)
Net cash (used in)/generated from financing activities (59) 14,235
Increase in cash and cash equivalents 431 8,151
Cash and cash equivalents at 1 January 15,281 7,031
Effect of exchange rate changes – 99
Cash and cash equivalents at 31 December 15,712 15,281
Analysis of the balance of cash and cash equivalents
Bank deposits and cash (d) 15,712 15,281
The notes and principal accounting policies on pages 87 to 147 form part of these financial statements.

85The Wharf (Holdings) Limited Annual Report 2009
NOTE TO THE CONSOLIDATED STATEMENT OF CASH FLOWS
(a) Reconciliation of operating profit to cash generated from operations
2009 2008
HK$ Million HK$ Million
Operating profit 8,554 7,543
Interest income (71) (272)
Dividends receivable from investments (131) (139)
Depreciation 1,105 1,158
Amortisation 196 234
Loss on disposal of fixed assets 7 4
Impairment loss on fixed assets/programming library – 29
Operating cash inflow 9,660 8,557
Increase in properties under development for sale (4,018) (8,243)
Decrease in completed properties for sale 1,916 528
Increase in inventories (2) (15)
Increase in trade and other receivables (243) (331)
Increase in trade and other payables 434 1,101
(Decrease)/increase in derivative financial instruments (134) 60
Other non-cash items (6) (18)
Changes in working capital (2,053) (6,918)
Cash generated from operations 7,607 1,639
(b) Issue of shares by subsidiaries to minority interests
Cash inflow from issue of shares by subsidiaries to minority interests in 2009 included proceeds of HK$277 million from
minority shareholders of Harbour Centre Development Limited (“HCDL”) on completion of its rights issue in May 2009. The
Group maintained its interests in HCDL at the same 70.4% as before the rights issue.

86The Wharf (Holdings) Limited Annual Report 2009
Consolidated Statement of Cash FlowsFor the year ended 31 December 2009
(c) Net proceeds from disposal of subsidiaries and a jointly controlled entity
The cash flow and the net assets of subsidiaries and a jointly controlled entity disposed of were as follows:
2009
HK$ Million
Investment property 2,440
Fixed assets 172
Other non-current assets 1,568
Current assets 18
Current liabilities (65)
Non-current liabilities (255)
Minority interests (238)
Net assets disposed of 3,640
Exchange gain realised (119)
Profit on disposal (Note) 1,200
Total consideration 4,721
Satisfied by:
Receivables 2,506
Cash received 812
Carrying value of net assets in lieu of cash 1,403
4,721
Note: Profit on disposal included HK$1,110 million related to disposal of the Group’s entire 87.5% equity interests of the owning company of
Beijing Capital Times Square.
(d) Cash and cash equivalents
2009 2008
HK$ Million HK$ Million
Bank deposits and cash in the consolidated statement of financial position (Note 22) 18,412 15,886
Less: Bank deposits with maturity greater than three months (2,700) –
Pledged bank deposits – (605)
Cash and cash equivalents in the consolidated statement of cash flows 15,712 15,281

87The Wharf (Holdings) Limited Annual Report 2009
Notes to the Financial Statements
1. SEGMENT INFORMATION
The Group manages its diversified businesses according to the nature of services and products provided. Management has
determined five reportable operating segments for measuring performance and allocating resources. The segments are property
investment, property development, communications, media and entertainment (“CME”), logistics and investment and others.
No operating segments have been aggregated to form the following reportable segments.
Property investment segment primarily includes property leasing and hotel operations. Currently, the Group’s properties
portfolio, which consists of retail, office, service apartment and hotels, is primarily located in Hong Kong and China.
Property development segment encompasses activities relating to the acquisition, development, design, construction, sale and
marketing of the Group’s trading properties primarily in Hong Kong and China.
CME segment comprises pay television, internet and multimedia and other businesses operated by the Group’s non-wholly-
owned subsidiary, i-CABLE Communications Limited (“i-CABLE”). It also includes the telecommunication businesses operated by
Wharf T&T Limited.
Logistics segment mainly includes the container terminal operations of Modern Terminals Limited (“Modern Terminals”) and
other public transport operations.
Investment and others segment includes activities for managing the Group’s corporate assets and liabilities, available-for-sale
investments, financial instruments and other treasury operations.
Management evaluates performance primarily based on operating profit as well as the equity share of results of associates and
jointly controlled entities of each segment. Inter-segment pricing is generally determined at arm’s length basis.
Segment assets principally comprise all tangible assets, intangible assets and current assets directly attributable to each
segment with the exception of income tax assets.

88The Wharf (Holdings) Limited Annual Report 2009
Notes to the Financial Statements
a. Analysis of segment revenues and results
Profit on Increase
disposal in fair
of an value of Net other Jointly Profit
Operating investment investment charge/ Finance controlled before
Turnover profit property properties income costs Associates entities taxation
For the year ended 2009 HK$ Million HK$ Million HK$ Million HK$ Million HK$ Million HK$ Million HK$ Million HK$ Million HK$ Million
Property investment 8,192 6,191 1,110 12,204 (39) (332) – – 19,134
Hong Kong 6,637 5,630 – 10,668 11 (278) – – 16,031
China 592 319 1,110 1,536 (50) (45) – – 2,870
Hotels 963 242 – – – (9) – – 233
Property development 3,065 1,012 – – 44 (22) 64 41 1,139
Hong Kong – – – – – – 65 – 65
China 3,065 1,012 – – 44 (22) (1) 41 1,074
CME 3,404 163 – – – – – – 163
i-CABLE 1,754 (48) – – – – – – (48)
Telecommunications 1,650 213 – – – – – – 213
Others – (2) – – – – – – (2)
Logistics 3,091 1,418 – – – 11 217 34 1,680
Terminals 2,840 1,307 – – – 11 217 34 1,569
Others 251 111 – – – – – – 111
Investment and others 118 90 – – 170 5 – – 265
Inter-segment revenue (317) – – – – – – – –
Segment total 17,553 8,874 1,110 12,204 175 (338) 281 75 22,381
Corporate expenses – (320) – – – – – – (320)
Group total 17,553 8,554 1,110 12,204 175 (338) 281 75 22,061
For the year ended 2008
Property investment 7,606 5,551 – 1,793 – (668) – – 6,676
Hong Kong 6,038 4,989 – 1,401 – (492) – – 5,898
China 514 254 – 392 – (113) – – 533
Hotels 1,054 308 – – – (63) – – 245
Property development 710 84 – – 82 (128) (154) (28) (144)
Hong Kong – (7) – – – – 31 – 24
China 710 91 – – 82 (128) (185) (28) (168)
CME 3,722 64 – – (3) – (17) – 44
i-CABLE 2,080 (76) – – (3) – (17) – (96)
Telecommunications 1,641 140 – – – – – – 140
Others 1 – – – – – – – –
Logistics 3,875 1,763 – – 42 (248) 307 33 1,897
Terminals 3,446 1,608 – – 42 (248) 307 33 1,742
Others 429 155 – – – – – – 155
Investment and others 328 304 – – (170) (477) – – (343)
Inter-segment revenue (301) – – – – – – – –
Segment total 15,940 7,766 – 1,793 (49) (1,521) 136 5 8,130
Corporate expenses – (223) – – – – – – (223)
Group total 15,940 7,543 – 1,793 (49) (1,521) 136 5 7,907

89The Wharf (Holdings) Limited Annual Report 2009
b. Analysis of inter-segment revenue
2009 2008
Inter- Inter-
Total segment Group Total segment Group
Revenue revenue Revenue Revenue revenue Revenue
HK$ Million HK$ Million HK$ Million HK$ Million HK$ Million HK$ Million
Property investment 8,192 (159) 8,033 7,606 (148) 7,458
Property development 3,065 – 3,065 710 – 710
CME 3,404 (158) 3,246 3,722 (153) 3,569
Logistics 3,091 – 3,091 3,875 – 3,875
Investment and others 118 – 118 328 – 328
17,870 (317) 17,553 16,241 (301) 15,940
c. Analysis of total assets
Total assets
2009 2008
HK$ Million HK$ Million
Property investment 120,459 104,188
Hong Kong 103,142 92,367
China 16,316 10,613
Hotels 1,001 1,208
Property development 31,625 27,827
Hong Kong 910 894
China 30,715 26,933
CME 4,911 5,222
i-CABLE 2,287 2,424
Telecommunications 2,623 2,789
Others 1 9
Logistics 19,486 18,895
Terminals 19,149 18,343
Others 337 552
Investment and others 13,614 12,039
Segment total 190,095 168,171
Unallocated 366 383
Group total 190,461 168,554
Segment assets held through jointly controlled entities and associates included in above are:
2009 2008
HK$ Million HK$ Million
Property development 7,689 7,751
CME 38 39
Logistics 4,062 4,208
Group total 11,789 11,998
Unallocated assets mainly comprise income tax assets.

90The Wharf (Holdings) Limited Annual Report 2009
Notes to the Financial Statements
d. Other information
Increase in interests
in associates
and jointly Depreciation and
Capital expenditure controlled entities amortisation
2009 2008 2009 2008 2009 2008
HK$ Million HK$ Million HK$ Million HK$ Million HK$ Million HK$ Million
Property investment 1,584 947 – – 124 128
Hong Kong 180 226 – – 19 19
China 1,387 697 – – 25 27
Hotels 17 24 – – 80 82
Property development (China) – – 1,787 3,543 – –
CME 548 472 – – 756 890
i-CABLE 261 144 – – 364 504
Telecommunications 287 328 – – 392 386
Logistics 864 2,226 1 4 421 374
Terminals 862 2,216 1 4 414 360
Others 2 10 – – 7 14
Group total 2,996 3,645 1,788 3,547 1,301 1,392
Interest income was mainly attributable to the Investment and others segment. In addition, CME segment incurred
HK$87 million (2008: HK$103 million) for its programming library. The Group has no significant non-cash expenses other
than depreciation and amortisation.
e. Geographical information
Revenue Operating Profit
2009 2008 2009 2008
HK$ Million HK$ Million HK$ Million HK$ Million
Hong Kong 13,605 14,392 7,605 7,444
China 3,917 1,510 918 61
Singapore 31 38 31 38
Group total 17,553 15,940 8,554 7,543
Specified non-current assets Total assets
2009 2008 2009 2008
HK$ Million HK$ Million HK$ Million HK$ Million
Hong Kong 113,115 102,924 128,700 117,544
China 33,335 29,453 60,677 50,415
Singapore – – 1,084 595
Group total 146,450 132,377 190,461 168,554
Specified non-current assets represented non-current assets other than employee retirement benefit assets, deferred tax
assets, available-for-sale investments and derivative financial assets.

91The Wharf (Holdings) Limited Annual Report 2009
2. OPERATING PROFIT
a. Operating profit is arrived at:
2009 2008
HK$ Million HK$ Million
After charging/(crediting):
Depreciation
– assets held for use under operating leases 97 96
– other fixed assets 1,008 1,062
1,105 1,158
Amortisation
– programming library 106 142
– leasehold land (Note 11) 90 87
– other intangible assets (Note 13) – 5
Total depreciation and amortisation 1,301 1,392
Impairment losses on fixed assets/programming library – 29
Impairment loss on trade receivables 8 84
Staff costs 2,411 2,553
including:
– contributions to defined contribution pension schemes including
MPF schemes (after a forfeiture of HK$5 million (2008: HK$2 million)) 98 101
– income recognised in respect of defined benefit pension schemes (Note 18) (6) (16)
Auditors’ remuneration
– audit services 13 16
– other services 4 3
Cost of trading properties sold during the year 1,916 557
Rental charges under operating leases in respect of telecommunications
equipment and services 90 98
Rental income less direct outgoings (6,097) (5,335)
including:
– contingent rentals (813) (628)
Interest income (71) (272)
Dividend income from listed investments (31) (45)
Dividend income from unlisted investments (100) (94)
Loss on disposal of fixed assets 7 4
Rental income under operating leases in respect of owned plant
and machinery (24) (61)

92The Wharf (Holdings) Limited Annual Report 2009
Notes to the Financial Statements
b. Directors’ emoluments
Directors’ emoluments are as follows:
Salaries, allowances and Contributions 2009 2008 benefits Discretionary to pension Total Total Fees in kind bonuses schemes emoluments emoluments HK$’000 HK$’000 HK$’000 HK$’000 HK$’000 HK$’000
Board of DirectorsPeter K C Woo 100 10,487 6,750 12 17,349 19,598Gonzaga W J Li 60 5,036 5,250 – 10,346 11,985Stephen T H Ng 60 4,461 6,750 264 11,535 13,806Doreen Y F Lee 60 3,573 3,800 396 7,829 8,343T Y Ng 60 2,851 1,557 12 4,480 3,548Paul Y C Tsui (Note (i)) 60 1,952 818 9 2,839 1,093Independent Non-executive DirectorsPaul M P Chan (Note (iii)) 80 – – – 80 80Edward K Y Chen 60 – – – 60 60Raymond K F Ch’ien 60 – – – 60 60Vincent K Fang (Note (iii)) 80 – – – 80 80Hans Michael Jebsen (Note (iii)) 80 – – – 80 80James E Thompson (Note (iii)) 80 – – – 80 80
840 28,360 24,925 693 54,818 58,813
Total for 2008 813 26,466 30,848 686 58,813
(i) Mr. Paul Y C Tsui was appointed as director of the Company with effect from 16 June 2008.
(ii) There were no compensation for loss of office and/or inducement for joining the Group paid/payable in respect of the years ended 31 December 2009 and 2008.
(iii) Includes Audit Committee Member’s fee for the year ended 31 December 2009 of HK$20,000 (2008: HK$20,000) received by each of relevant Directors.

93The Wharf (Holdings) Limited Annual Report 2009
c. Emoluments of the highest paid employees
For the year ended 31 December 2009, information regarding emoluments (excluding amounts, if any, paid or payable
by way of commissions on sales generated by the employees concerned) of one employee (2008: one) of the Group
who, not being a Director of the Company, was among the top five highest paid individuals (including Directors of the
Company and other employees of the Group) employed by the Group is set out below.
2009 2008
Aggregate emoluments HK$ Million HK$ Million
Salaries, allowances and benefits in kind 10 9
Contributions to pension schemes – –
Discretionary bonuses 8 2
Compensation for loss of office – –
Inducement for joining the Group – –
Total 18 11
2009 2008
Bands (in HK$) Number Number
$10,500,001 – $11,500,000 – 1
$18,000,001 – $18,500,000 1 –
3. PROFIT ON DISPOSAL OF AN INVESTMENT PROPERTY
The profit was arrived from the disposal of the Group’s entire 87.5% equity interests of the owning company of Beijing Capital
Times Square.
4. OTHER NET INCOME
Other net income includes (a) net profit on disposal of available-for-sale investments of HK$50 million (2008: HK$137 million)
which included a revaluation surplus of HK$18 million (2008: HK$326 million) transferred from the investments revaluation
reserve of the Group and (b) net foreign exchange gains of HK$77 million (2008: loss of HK$41 million) which included the
impact of forward foreign exchange contracts.
5. NET OTHER CHARGE
Net other charge represented fixed assets written off and impairment loss on available-for-sale investments.

94The Wharf (Holdings) Limited Annual Report 2009
Notes to the Financial Statements
6. FINANCE COSTS
2009 2008
HK$ Million HK$ Million
Interest charged on:
Bank loans and overdrafts repayable within five years 334 777
Other borrowings repayable within five years 9 51
Bank loans repayable after five years 56 116
Other borrowings repayable after five years 119 119
Total interest charge 518 1,063
Other finance costs 78 46
Less: Amount capitalised (212) (200)
384 909
Fair value cost/(gain):
Cross currency interest rate swaps 315 508
Interest rate swaps (361) 104
338 1,521
a. Interest was capitalised at an average annual rate of approximately 0.9% (2008: 1.6%).
b. Included in total interest charge are amounts totalling HK$512 million (2008: HK$1,020 million) in respect of interest
bearing borrowings that are stated at amortised cost.
c. The above interest charge has taken into account the interest paid/receipts in respect of interest rate swaps and cross
currency interest rate swaps.
7. INCOME TAX
Taxation charged to consolidated income statement represents:
2009 2008
HK$ Million HK$ Million
Current income tax
Hong Kong
– provision for the year 1,069 1,017
– underprovision in respect of prior years (Note 7(g)) 162 254
Outside Hong Kong
– provision for the year 462 178
– overprovision in respect of prior years – (31)
1,693 1,418
Land appreciation tax (“LAT”) in China 235 30
Deferred tax
Change in fair value of investment properties 2,449 433
Origination and reversal of temporary differences 116 99
Effect on decrease in tax rate on deferred tax balances – (768)
Tax released on disposal of an investment property (510) –
Benefit of previously unrecognised tax losses now recognised (10) (23)
2,045 (259)
3,973 1,189
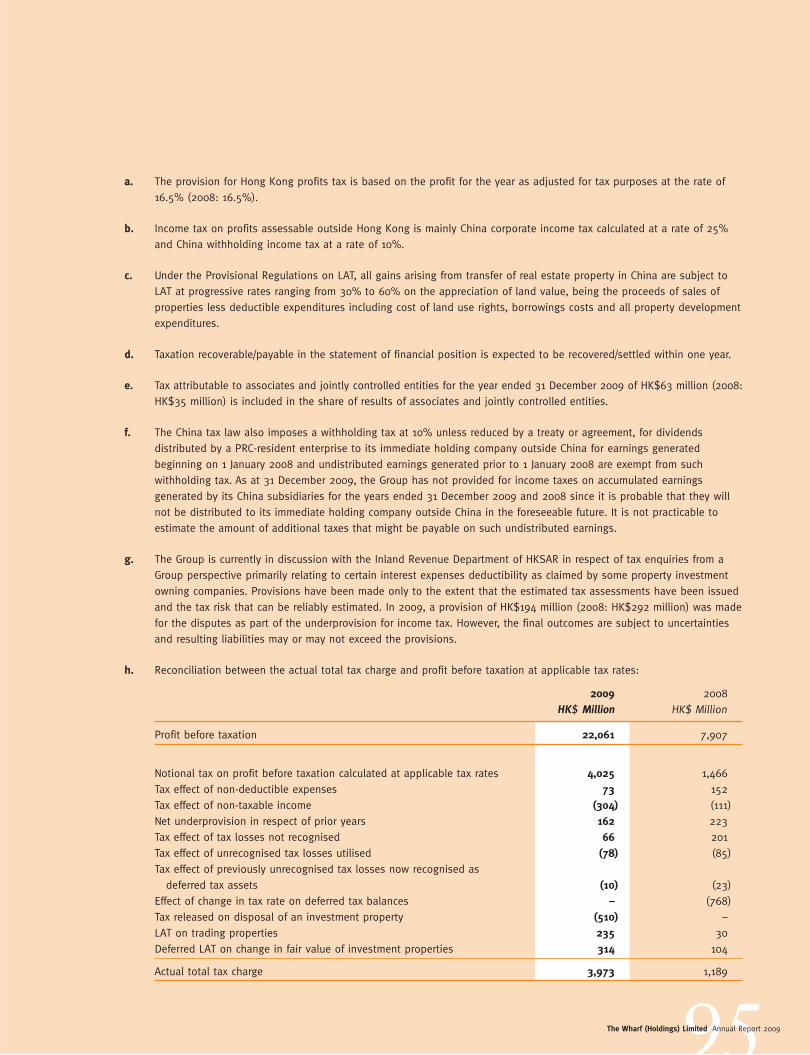
95The Wharf (Holdings) Limited Annual Report 2009
a. The provision for Hong Kong profits tax is based on the profit for the year as adjusted for tax purposes at the rate of
16.5% (2008: 16.5%).
b. Income tax on profits assessable outside Hong Kong is mainly China corporate income tax calculated at a rate of 25%
and China withholding income tax at a rate of 10%.
c. Under the Provisional Regulations on LAT, all gains arising from transfer of real estate property in China are subject to
LAT at progressive rates ranging from 30% to 60% on the appreciation of land value, being the proceeds of sales of
properties less deductible expenditures including cost of land use rights, borrowings costs and all property development
expenditures.
d. Taxation recoverable/payable in the statement of financial position is expected to be recovered/settled within one year.
e. Tax attributable to associates and jointly controlled entities for the year ended 31 December 2009 of HK$63 million (2008:
HK$35 million) is included in the share of results of associates and jointly controlled entities.
f. The China tax law also imposes a withholding tax at 10% unless reduced by a treaty or agreement, for dividends
distributed by a PRC-resident enterprise to its immediate holding company outside China for earnings generated
beginning on 1 January 2008 and undistributed earnings generated prior to 1 January 2008 are exempt from such
withholding tax. As at 31 December 2009, the Group has not provided for income taxes on accumulated earnings
generated by its China subsidiaries for the years ended 31 December 2009 and 2008 since it is probable that they will
not be distributed to its immediate holding company outside China in the foreseeable future. It is not practicable to
estimate the amount of additional taxes that might be payable on such undistributed earnings.
g. The Group is currently in discussion with the Inland Revenue Department of HKSAR in respect of tax enquiries from a
Group perspective primarily relating to certain interest expenses deductibility as claimed by some property investment
owning companies. Provisions have been made only to the extent that the estimated tax assessments have been issued
and the tax risk that can be reliably estimated. In 2009, a provision of HK$194 million (2008: HK$292 million) was made
for the disputes as part of the underprovision for income tax. However, the final outcomes are subject to uncertainties
and resulting liabilities may or may not exceed the provisions.
h. Reconciliation between the actual total tax charge and profit before taxation at applicable tax rates:
2009 2008
HK$ Million HK$ Million
Profit before taxation 22,061 7,907
Notional tax on profit before taxation calculated at applicable tax rates 4,025 1,466
Tax effect of non-deductible expenses 73 152
Tax effect of non-taxable income (304) (111)
Net underprovision in respect of prior years 162 223
Tax effect of tax losses not recognised 66 201
Tax effect of unrecognised tax losses utilised (78) (85)
Tax effect of previously unrecognised tax losses now recognised as
deferred tax assets (10) (23)
Effect of change in tax rate on deferred tax balances – (768)
Tax released on disposal of an investment property (510) –
LAT on trading properties 235 30
Deferred LAT on change in fair value of investment properties 314 104
Actual total tax charge 3,973 1,189

96The Wharf (Holdings) Limited Annual Report 2009
Notes to the Financial Statements
8. PROFIT ATTRIBUTABLE TO EQUITY SHAREHOLDERS
Profit attributable to equity shareholders for the year is dealt with in the financial statements of the Company to the extent of
HK$1,530 million (2008: HK$3,376 million).
9. DIVIDENDS ATTRIBUTABLE TO EQUITY SHAREHOLDERS
2009 2008
HK$ Million HK$ Million
Interim dividend declared and paid of 36 cents (2008: 36 cents) per share 991 991
Final dividend of 64 cents (2008: 44 cents) per share proposed after the end
of the reporting date 1,763 1,212
2,754 2,203
a. The proposed final dividend after the end of the reporting date has not been recognised as a liability at the end of the
reporting date.
b. The final dividend of HK$1,212 million for 2008 was approved and paid in 2009.
10. EARNINGS PER SHARE
The calculation of earnings per share is based on the earnings attributable to ordinary equity shareholders for the year of
HK$17,501 million (2008: HK$6,247 million) and the weighted average of 2,754 million ordinary shares in issue during the year
(2008: 2,745 million ordinary shares after adjusting for the rights issue which was completed in January 2008).
There were no potential diluted ordinary shares in existence during the years ended 31 December 2009 and 2008.

97The Wharf (Holdings) Limited Annual Report 2009
11. FIXED ASSETS
Group
Properties Broad-
under or casting & Other
held for Hotel commun- properties
Investment redeve- and club ications and fixed Leasehold
properties lopment properties equipment assets land Total
HK$ Million HK$ Million HK$ Million HK$ Million HK$ Million HK$ Million HK$ Million
a. Cost or valuation
At 1 January 2008 95,782 5,160 674 9,687 11,403 4,155 126,861
Exchange adjustment 369 88 – – 71 67 595
Additions 166 2,394 – 350 393 342 3,645
Disposals – – – (91) (112) – (203)
Reclassification 300 (2,401) 522 – 1,697 107 225
Revaluation surpluses 1,793 – – – – – 1,793
Write off – – (11) – – – (11)
At 31 December 2008
and 1 January 2009 98,410 5,241 1,185 9,946 13,452 4,671 132,905
Exchange adjustment 11 1 – – 2 2 16
Additions 1,539 465 1 459 260 272 2,996
Disposals (67) – – (204) (59) – (330)
Disposals of subsidiaries (2,440) – – – (239) (147) (2,826)
Reclassification 5,881 (3,716) (1) (2) 1,459 (491) 3,130
Revaluation surpluses 12,204 – – – – – 12,204
Write off (46) – – – (14) – (60)
At 31 December 2009 115,492 1,991 1,185 10,199 14,861 4,307 148,035
Accumulated depreciation,
amortisation and
impairment losses
At 1 January 2008 – – 549 6,372 4,947 380 12,248
Exchange adjustment – – – – 6 1 7
Charge for the year – – 36 626 496 87 1,245
Written back on disposals – – – (85) (108) – (193)
(Write off )/ impairment loss – – (11) 16 – – 5
At 31 December 2008
and 1 January 2009 – – 574 6,929 5,341 468 13,312
Charge for the year – – 32 534 539 90 1,195
Written back on disposals – – – (198) (54) – (252)
Written back on disposals
of subsidiaries – – – – (175) (39) (214)
Write off – – – – (8) – (8)
At 31 December 2009 – – 606 7,265 5,643 519 14,033
Net book value
At 31 December 2009 115,492 1,991 579 2,934 9,218 3,788 134,002
At 31 December 2008 98,410 5,241 611 3,017 8,111 4,203 119,593

98The Wharf (Holdings) Limited Annual Report 2009
Notes to the Financial Statements
Group
Properties Broad-
under or casting & Other
held for Hotel commun- properties
Investment redeve- and club ications and fixed Leasehold
properties lopment properties equipment assets land Total
HK$ Million HK$ Million HK$ Million HK$ Million HK$ Million HK$ Million HK$ Million
b. The analysis of cost or
valuation of the above
assets is as follows:
2009 valuation 111,761 – – – – – 111,761
Cost less provisions 3,731 1,991 1,185 10,199 14,861 4,307 36,274
115,492 1,991 1,185 10,199 14,861 4,307 148,035
2008 valuation 98,410 – – – – – 98,410
Cost less provisions – 5,241 1,185 9,946 13,452 4,671 34,495
98,410 5,241 1,185 9,946 13,452 4,671 132,905
c. Tenure of title to properties:
At 31 December 2009
Held in Hong Kong
Long term leases 85,471 – 85 – 11 82 85,649
Medium term leases 16,102 – – – 2,826 1,073 20,001
Short term leases 1,110 – – – – – 1,110
102,683 – 85 – 2,837 1,155 106,760
Held outside Hong Kong
Medium term leases 12,809 1,991 494 – 2,212 2,633 20,139
115,492 1,991 579 – 5,049 3,788 126,899
At 31 December 2008
Held in Hong Kong
Long term leases 77,068 – 92 – 11 82 77,253
Medium term leases 12,961 680 – – 2,939 1,215 17,795
Short term leases 1,200 – – – – – 1,200
91,229 680 92 – 2,950 1,297 96,248
Held outside Hong Kong
Medium term leases 7,181 4,561 519 – 1,539 2,906 16,706
98,410 5,241 611 – 4,489 4,203 112,954

99The Wharf (Holdings) Limited Annual Report 2009
d. Investment properties revaluation
The Group’s investment properties under development are stated at fair value at the earlier of when the fair value
first becomes reliably measurable and the date of completion of the property. Those investment properties stated at
fair value as at 31 December 2009 were revalued by Knight Frank Petty Limited (“Knight Frank”), an independent firm
of professional surveyors who have among their staff Fellows of the Hong Kong Institute of Surveyors with extensive
experience in valuing properties in Hong Kong and the PRC. Knight Frank has valued the investment properties on a
market value basis and has taken into account the net income of the respective properties and allowing for reversionary
potential.
The surplus or deficit arising on revaluation is recognised directly in the consolidated income statement.
Gross rental revenue from investment properties amounted to HK$7,229 million (2008: HK$6,552 million).
e. Impairment of fixed assets
The value of properties, other than investment properties which are revalued annually, is assessed at the end of each
reporting date for indications of impairment with reference to valuations undertaken by management. Such valuations
assess the recoverable amount of each property based on its value in use (using relevant discount rates) or on its net
selling price (by reference to market prices), depending upon the anticipated future plans for the property. No such
provision was made or written back for 2009 and 2008.
f. The Group leases out properties under operating leases, which generally run for an initial period of one to six years, with
an option to renew the lease after that date at which time all terms are renegotiated. Lease payments may be varied
periodically to reflect market rentals and may contain a contingent rental element which is based on various percentages
of tenants’ sales receipts.
g. The Group’s total future minimum lease income under non-cancellable operating leases is receivable as follows:
Group
2009 2008
HK$ Million HK$ Million
Within 1 year 4,895 4,887
After 1 year but within 5 years 5,107 5,578
After 5 years 301 520
10,303 10,985

100The Wharf (Holdings) Limited Annual Report 2009
Notes to the Financial Statements
12. INTEREST IN SUBSIDIARIES
Company
2009 2008
HK$ Million HK$ Million
Unlisted shares, at cost less provision 27,765 7,765
Amounts due from subsidiaries, less provision 30,451 34,704
58,216 42,469
Amounts due to subsidiaries (35,109) (28,107)
23,107 14,362
Details of principal subsidiaries at 31 December 2009 are shown on pages 144 to 146.
Amounts due from subsidiaries are unsecured, non-interest bearing with no fixed terms of repayment and hence are classified
as non-current as these are not expected to be recoverable within the next twelve months. Amounts due to subsidiaries are
unsecured, non-interest bearing with no fixed terms of payment.
13. GOODWILL AND OTHER INTANGIBLE ASSETS
Other
intangible
Goodwill assets Total
HK$ Million HK$ Million HK$ Million
Cost
At 1 January 2008, 31 December 2008 and 31 December 2009 297 12 309
Accumulated amortisation
At 1 January 2008 – 7 7
Charge for the year – 5 5
At 31 December 2008 and 31 December 2009 – 12 12
Net carrying value
At 31 December 2009 297 – 297
At 31 December 2008 297 – 297
Goodwill is mainly related to the Group’s terminals business. As at 31 December 2009, an impairment test was performed
by comparing the attributable carrying amount of the business with the recoverable amount. The recoverable amount of the
terminals business is based on fair value less costs to sell, which is determined by the latest transaction price. No impairment
was recorded.
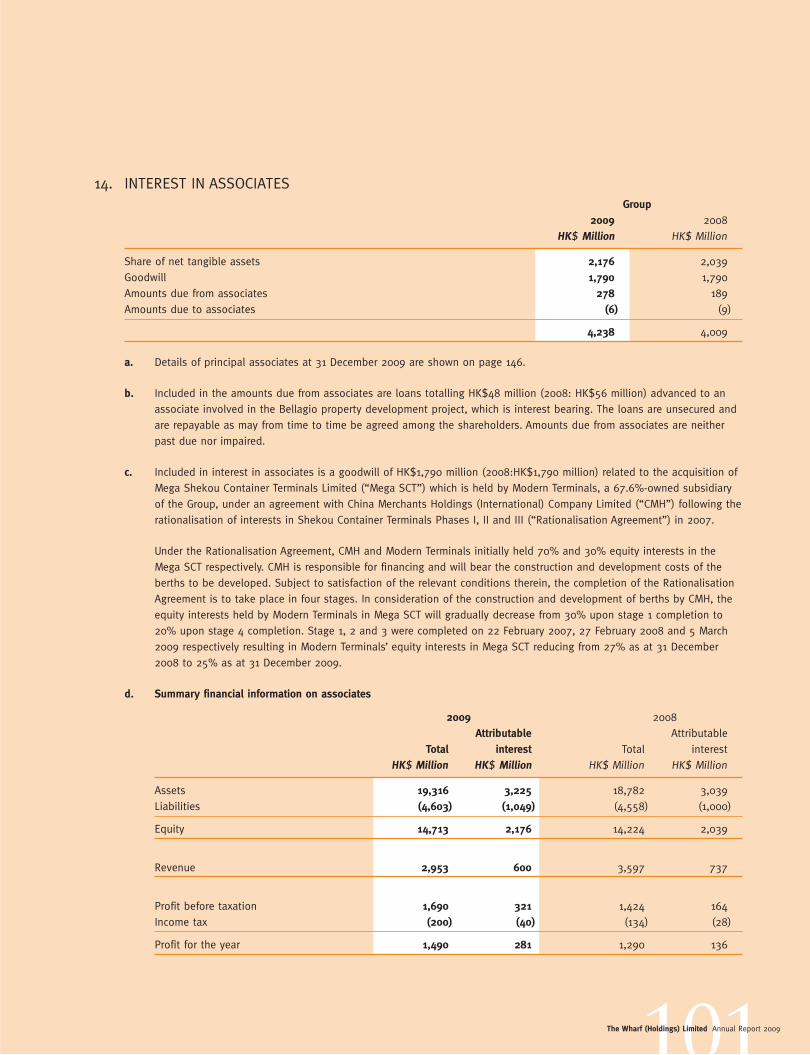
101The Wharf (Holdings) Limited Annual Report 2009
14. INTEREST IN ASSOCIATES
Group
2009 2008
HK$ Million HK$ Million
Share of net tangible assets 2,176 2,039
Goodwill 1,790 1,790
Amounts due from associates 278 189
Amounts due to associates (6) (9)
4,238 4,009
a. Details of principal associates at 31 December 2009 are shown on page 146.
b. Included in the amounts due from associates are loans totalling HK$48 million (2008: HK$56 million) advanced to an
associate involved in the Bellagio property development project, which is interest bearing. The loans are unsecured and
are repayable as may from time to time be agreed among the shareholders. Amounts due from associates are neither
past due nor impaired.
c. Included in interest in associates is a goodwill of HK$1,790 million (2008:HK$1,790 million) related to the acquisition of
Mega Shekou Container Terminals Limited (“Mega SCT”) which is held by Modern Terminals, a 67.6%-owned subsidiary
of the Group, under an agreement with China Merchants Holdings (International) Company Limited (“CMH”) following the
rationalisation of interests in Shekou Container Terminals Phases I, II and III (“Rationalisation Agreement”) in 2007.
Under the Rationalisation Agreement, CMH and Modern Terminals initially held 70% and 30% equity interests in the
Mega SCT respectively. CMH is responsible for financing and will bear the construction and development costs of the
berths to be developed. Subject to satisfaction of the relevant conditions therein, the completion of the Rationalisation
Agreement is to take place in four stages. In consideration of the construction and development of berths by CMH, the
equity interests held by Modern Terminals in Mega SCT will gradually decrease from 30% upon stage 1 completion to
20% upon stage 4 completion. Stage 1, 2 and 3 were completed on 22 February 2007, 27 February 2008 and 5 March
2009 respectively resulting in Modern Terminals’ equity interests in Mega SCT reducing from 27% as at 31 December
2008 to 25% as at 31 December 2009.
d. Summary financial information on associates
2009 2008
Attributable Attributable
Total interest Total interest
HK$ Million HK$ Million HK$ Million HK$ Million
Assets 19,316 3,225 18,782 3,039
Liabilities (4,603) (1,049) (4,558) (1,000)
Equity 14,713 2,176 14,224 2,039
Revenue 2,953 600 3,597 737
Profit before taxation 1,690 321 1,424 164
Income tax (200) (40) (134) (28)
Profit for the year 1,490 281 1,290 136
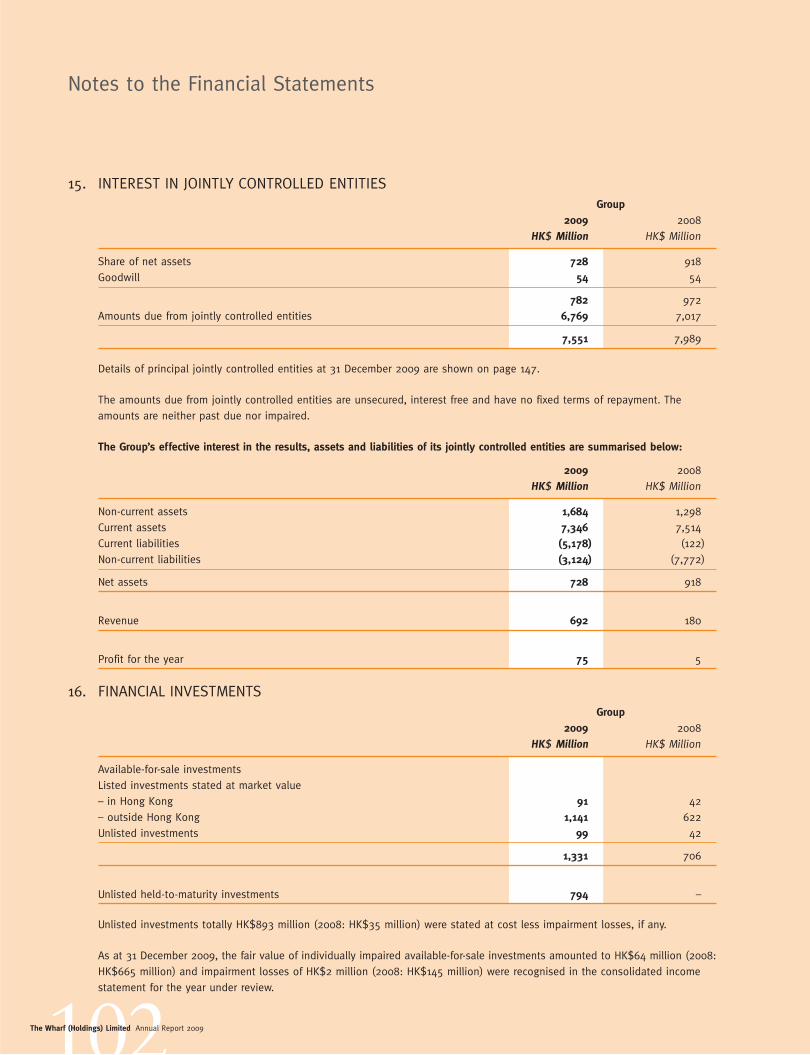
102The Wharf (Holdings) Limited Annual Report 2009
Notes to the Financial Statements
15. INTEREST IN JOINTLY CONTROLLED ENTITIES
Group
2009 2008
HK$ Million HK$ Million
Share of net assets 728 918
Goodwill 54 54
782 972
Amounts due from jointly controlled entities 6,769 7,017
7,551 7,989
Details of principal jointly controlled entities at 31 December 2009 are shown on page 147.
The amounts due from jointly controlled entities are unsecured, interest free and have no fixed terms of repayment. The
amounts are neither past due nor impaired.
The Group’s effective interest in the results, assets and liabilities of its jointly controlled entities are summarised below:
2009 2008
HK$ Million HK$ Million
Non-current assets 1,684 1,298
Current assets 7,346 7,514
Current liabilities (5,178) (122)
Non-current liabilities (3,124) (7,772)
Net assets 728 918
Revenue 692 180
Profit for the year 75 5
16. FINANCIAL INVESTMENTS
Group
2009 2008
HK$ Million HK$ Million
Available-for-sale investments
Listed investments stated at market value
– in Hong Kong 91 42
– outside Hong Kong 1,141 622
Unlisted investments 99 42
1,331 706
Unlisted held-to-maturity investments 794 –
Unlisted investments totally HK$893 million (2008: HK$35 million) were stated at cost less impairment losses, if any.
As at 31 December 2009, the fair value of individually impaired available-for-sale investments amounted to HK$64 million (2008:
HK$665 million) and impairment losses of HK$2 million (2008: HK$145 million) were recognised in the consolidated income
statement for the year under review.

103The Wharf (Holdings) Limited Annual Report 2009
17. LONG TERM RECEIVABLES
Long term receivables represent receivables due after more than one year.
18. EMPLOYEE RETIREMENT BENEFITS
a. Defined benefit pension schemes
The Group makes contributions to five defined benefit pension schemes that provide pension benefits for employees
upon retirement. The assets of the schemes are held separately by independently administered funds. The schemes are
funded by contributions both from employers and employees, which are in accordance with the recommendations made
by actuaries based on their valuation of the schemes. The latest valuations of the schemes as at 31 December 2009
were performed either by HSBC Life (International) Limited or Watson Wyatt Hong Kong Limited, who are independent
qualified actuaries, using the projected unit credit method. The aggregate funding ratio of the schemes was 119%.
(i) The defined benefit pension scheme assets/(liabilities) recognised in the consolidated statement of financial
position is as follows:
2009 2008
HK$ Million HK$ Million
Fair value of scheme assets 860 734
Present value of funded obligations (721) (888)
Net defined benefit pension scheme assets/(liabilities) 139 (154)
A portion of the above liability is expected to be settled after more than one year. However, it is not practicable to
segregate this amount from the amount payable in the next twelve months, as future contributions will also relate
to future services rendered and future changes in actuarial assumptions and market conditions. The Group expects
to pay HK$2 million in contribution to defined benefit pension schemes in 2010.
(ii) Scheme assets consist of the following:
2009 2008
HK$ Million HK$ Million
Equity securities 127 490
Debt securities 624 209
Deposits and cash 109 35
860 734
(iii) Movements in the present value of the defined benefit obligations are as follows:
2009 2008
HK$ Million HK$ Million
At 1 January 888 891
Benefits paid by the schemes (61) (56)
Current service cost 33 34
Employees’ contribution 1 2
Interest cost 12 30
Disposal of a subsidiary (50) –
Actuarial gains (102) (13)
At 31 December 721 888
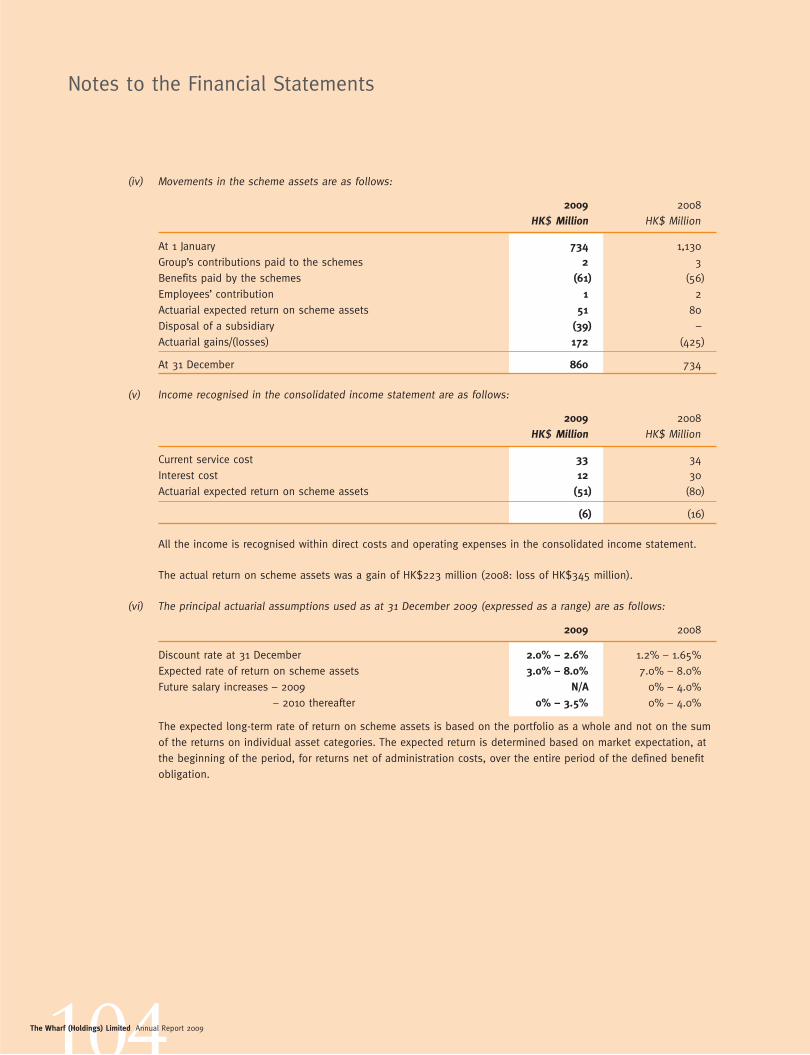
104The Wharf (Holdings) Limited Annual Report 2009
Notes to the Financial Statements
(iv) Movements in the scheme assets are as follows:
2009 2008
HK$ Million HK$ Million
At 1 January 734 1,130
Group’s contributions paid to the schemes 2 3
Benefits paid by the schemes (61) (56)
Employees’ contribution 1 2
Actuarial expected return on scheme assets 51 80
Disposal of a subsidiary (39) –
Actuarial gains/(losses) 172 (425)
At 31 December 860 734
(v) Income recognised in the consolidated income statement are as follows:
2009 2008
HK$ Million HK$ Million
Current service cost 33 34
Interest cost 12 30
Actuarial expected return on scheme assets (51) (80)
(6) (16)
All the income is recognised within direct costs and operating expenses in the consolidated income statement.
The actual return on scheme assets was a gain of HK$223 million (2008: loss of HK$345 million).
(vi) The principal actuarial assumptions used as at 31 December 2009 (expressed as a range) are as follows:
2009 2008
Discount rate at 31 December 2.0% – 2.6% 1.2% – 1.65%
Expected rate of return on scheme assets 3.0% – 8.0% 7.0% – 8.0%
Future salary increases – 2009 N/A 0% – 4.0%
– 2010 thereafter 0% – 3.5% 0% – 4.0%
The expected long-term rate of return on scheme assets is based on the portfolio as a whole and not on the sum
of the returns on individual asset categories. The expected return is determined based on market expectation, at
the beginning of the period, for returns net of administration costs, over the entire period of the defined benefit
obligation.

105The Wharf (Holdings) Limited Annual Report 2009
(vii) Historical information
2009 2008 2007 2006
HK$ Million HK$ Million HK$ Million HK$ Million
Fair value of scheme assets 860 734 1,130 1,005
Present value of the defined benefit obligations (721) (888) (891) (775)
Surplus/(deficit) in the scheme 139 (154) 239 230
Experience adjustments arising on scheme liabilities -3% 14% -6% 9%
Experience adjustments arising on scheme assets 20% -58% 10% 2%
(viii) The Group recognised an actuarial gain amounting to HK$274 million (2008: loss of HK$412 million) for the
year ended 31 December 2009 directly in other comprehensive income. The cumulative amount of actuarial gain
recognised amounted to HK$19 million (2008: loss of HK$265 million) as at 31 December 2009.
b. Defined contribution pension schemes
A number of defined contribution pension schemes (including the Mandatory Provident Fund) administered by
independent trustees are available to the employees of the Group not covered by the defined benefit pension
schemes. For defined contribution pension schemes, both the Group and the employees contribute respectively to the
schemes sums which represent percentages of the employees’ salaries as defined under the relevant trust deeds. The
contributions by the Group are expensed as incurred and may be reduced by contributions forfeited for those employees
who have left the scheme prior to full vesting of the related contributions.
19. PROPERTIES FOR SALE
Group
2009 2008
HK$ Million HK$ Million
Properties under development for sale 17,423 16,866
Completed properties for sale 374 406
17,797 17,272
a. Properties under development for sale are expected to be substantially completed after more than one year.
b. Included in properties under development for sale are deposits of HK$3,494 million (2008: HK$5,233 million) paid for
the acquisition of certain land sites/properties located in China.
c. Properties under development for sale and completed properties for sale are stated at the lower of cost and net
realisable value. The total carrying value of properties stated at net realisable value at 31 December 2009 was
HK$48 million (2008: HK$47 million).

106The Wharf (Holdings) Limited Annual Report 2009
Notes to the Financial Statements
d. The carrying value of leasehold land and land deposit included in properties under development for sale and completed
properties for sale is summarised as follows:
Group
2009 2008
HK$ Million HK$ Million
Held in Hong Kong
Medium term leases 941 941
Held outside Hong Kong
Medium term leases 13,766 13,340
14,707 14,281
20. TRADE AND OTHER RECEIVABLES
a. Ageing analysis
Included in this item are trade receivables (net of allowance for bad and doubtful debts) with an ageing analysis based
on invoice date as at 31 December 2009 as follows:
Group
2009 2008
HK$ Million HK$ Million
Trade receivables
0 – 30 days 417 501
31 – 60 days 170 177
61 – 90 days 43 57
Over 90 days 68 67
698 802
Other receivables 3,856 925
4,554 1,727
Other receivables at 31 December 2009 included the remaining instalments of proceeds in total amount of HK$2.5 billion
in respect of the disposal of Beijing Capital Times Square, which have all been received subsequent to the reporting
date.
The Group has established credit policies for each of its core businesses. The general credit terms allowed range
from 0 to 60 days, except for sale of properties the proceeds from which are receivable pursuant to the terms of the
agreements. All the receivables are expected to be virtually recoverable within one year.

107The Wharf (Holdings) Limited Annual Report 2009
b. Impairment of trade receivables
Impairment losses in respect of trade receivables are recorded using an allowance account unless the Group is satisfied
that recovery of the amount is remote, in which case the impairment loss is written off against trade receivable directly.
The movement in the allowance account for the bad and doubtful debts during the year, including both specific and
collective loss components, is as follows:
Group
2009 2008
HK$ Million HK$ Million
At 1 January 114 53
Impairment loss recognised 8 84
Uncollectible amounts written off (24) (23)
At 31 December 98 114
c. Trade receivables that are not impaired
As at 31 December 2009, 89% (2008 : 88%) of the Group’s trade receivables were not impaired, of which 86% (2008 :
92%) was either not past due or less than two months past due.
Based on past experience of the Group, it is determined that no impairment allowance is necessary in respect of past
due balances as there has not been a significant change in credit quality and the balances are still considered to be fully
recoverable. The Group does not hold any collateral over these balances.
21. DERIVATIVE FINANCIAL INSTRUMENTS
2009 2008
Assets Liabilities Assets Liabilities
HK$ Million HK$ Million HK$ Million HK$ Million
At fair value through profit or loss
Fixed-to-floating interest rate swaps 102 35 83 –
Floating-to-fixed interest rate swaps 307 98 – 126
Cross currency interest rate swaps 102 1,020 8 612
Forward foreign exchange contracts – 2 – 166
Total 511 1,155 91 904
Analysis
Current 193 100 8 166
Non-current 318 1,055 83 738
Total 511 1,155 91 904

108The Wharf (Holdings) Limited Annual Report 2009
Notes to the Financial Statements
Analysis of the remaining maturities at the end of reporting date of the above derivative financial instruments were as follows:
2009 2008
Assets Liabilities Assets Liabilities
HK$ Million HK$ Million HK$ Million HK$ Million
Fixed-to-floating interest rate swaps
Expiring within 1 year 40 – 8 –
Expiring after more than 1 year but not exceeding
5 years 26 7 37 –
Expiring after 5 years 36 28 38 –
102 35 83 –
Floating-to-fixed interest rate swaps
Expiring within 1 year – 5 – –
Expiring after 5 years 307 93 – 126
307 98 – 126
Cross currency interest rate swaps
Expiring after more than 1 year but not exceeding
5 years 25 30 8 11
Expiring after 5 years 77 990 – 601
102 1,020 8 612
Forward foreign exchange contracts
Expiring within 1 year – 2 – 166
– 2 – 166
Total 511 1,155 91 904
a. The notional principal amounts of derivative financial instruments outstanding at the end of reporting date were as
follows:
2009 2008
HK$ Million HK$ Million
Forward foreign exchange contracts 1,755 942
Fixed-to-floating interest rate swaps 4,800 3,350
Floating-to-fixed interest rate swaps 6,330 2,500
Cross currency interest rate swaps 10,117 9,217
The notional amount of cross currency interest rate swaps included the USD400 million swaps against JPY with the effect
of converting the USD400 million ten-year fixed-rate notes issued in 2007 into JPY borrowings.
b. Derivative financial assets represented the amounts the Group would receive whilst derivative financial liabilities
represented the amounts the Group would pay if the position were closed at the end of reporting date. Derivative
financial instruments did not qualify for hedge accounting and their corresponding changes in fair values have been
recognised in the consolidated income statement.

109The Wharf (Holdings) Limited Annual Report 2009
c. During the year, a gain of HK$31 million (2008: loss of HK$124 million) in respect of forward foreign exchange contracts
was recognised in the consolidated income statement as follows:
2009 2008
HK$ Million HK$ Million
Gain/(loss) on forward foreign exchange contracts not qualified for
hedge accounting 31 (166)
Gain on forward foreign exchange contracts under cash flow hedge – 42
31 (124)
d. During the year, fair value cost on cross currency interest rate swaps and gain on interest rate swaps in the amounts
of HK$315 million (2008: HK$508 million) and HK$361 million (2008: loss of HK$104 million) respectively have been
included under finance costs in the consolidated income statement.
22. BANK DEPOSITS AND CASH
Group Company
2009 2008 2009 2008
HK$ Million HK$ Million HK$ Million HK$ Million
Bank deposits and cash
– not pledged 18,412 15,281 1 9,309
– pledged – 605 – –
18,412 15,886 1 9,309
Bank deposits and cash as at 31 December 2009 include HK$7,181 million equivalent (2008: HK$4,188 million) placed with
banks in China, the remittance of which are subject to relevant rules and regulations of foreign exchange control promulgated
by the PRC government.
At 31 December 2009, bank deposits and cash included bank deposits of RMB1,084 million (equivalent to HK$1,230 million)
which are solely for certain designated property development projects in China.
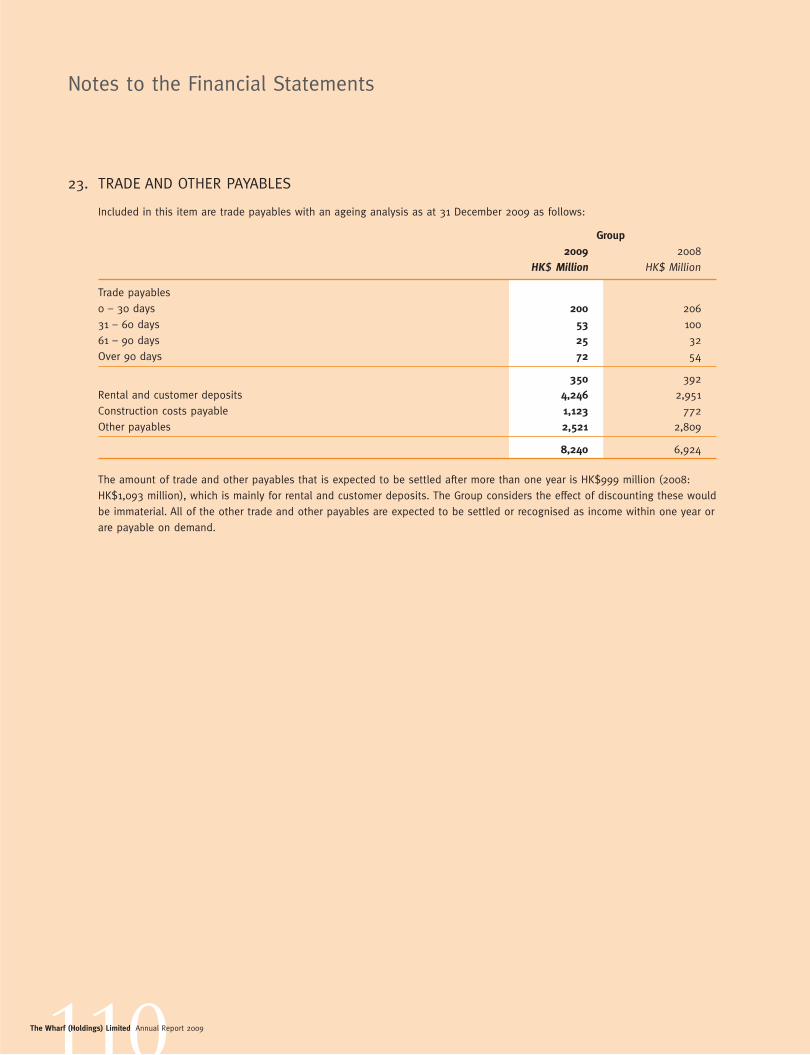
110The Wharf (Holdings) Limited Annual Report 2009
Notes to the Financial Statements
23. TRADE AND OTHER PAYABLES
Included in this item are trade payables with an ageing analysis as at 31 December 2009 as follows:
Group
2009 2008
HK$ Million HK$ Million
Trade payables
0 – 30 days 200 206
31 – 60 days 53 100
61 – 90 days 25 32
Over 90 days 72 54
350 392
Rental and customer deposits 4,246 2,951
Construction costs payable 1,123 772
Other payables 2,521 2,809
8,240 6,924
The amount of trade and other payables that is expected to be settled after more than one year is HK$999 million (2008:
HK$1,093 million), which is mainly for rental and customer deposits. The Group considers the effect of discounting these would
be immaterial. All of the other trade and other payables are expected to be settled or recognised as income within one year or
are payable on demand.

111The Wharf (Holdings) Limited Annual Report 2009
24. BANK LOANS AND OTHER BORROWINGS
Group
2009 2008
HK$ Million HK$ Million
Bonds and notes (unsecured)
HK dollar fixed rate notes due 2009 – 308
HK dollar fixed rate notes due 2011 210 214
HK dollar fixed rate notes due 2016 271 289
HK dollar fixed rate notes due 2019 713 –
HK dollar floating rate notes due 2009 – 100
HK dollar floating rate notes due 2010 200 200
HK dollar floating rate notes due 2013 300 300
HK dollar floating rate notes due 2014 200 –
US dollar fixed rate notes due 2017 3,120 3,120
5,014 4,531
Bank loans (secured)
Due within 1 year 733 536
Due after more than 1 year but not exceeding 2 years 607 1,251
Due after more than 2 years but not exceeding 5 years 4,669 3,269
Due after more than 5 years 2,987 3,104
8,996 8,160
Bank loans (unsecured)
Due within 1 year 7,395 3,499
Due after more than 1 year but not exceeding 2 years 4,200 6,942
Due after more than 2 years but not exceeding 5 years 13,239 14,077
Due after more than 5 years 1,000 800
25,834 25,318
Total bank loans and other borrowings 39,844 38,009
Analysis of maturities of the above borrowings
Current borrowings
Due within 1 year 8,328 4,443
Non-current borrowings
Due after more than 1 year but not exceeding 5 years 23,425 26,253
Due after more than 5 years 8,091 7,313
31,516 33,566
Total bank loans and other borrowings 39,844 38,009

112The Wharf (Holdings) Limited Annual Report 2009
Notes to the Financial Statements
a. The Group’s borrowings are considered by the management to be effectively denominated in the following currencies (after
the effects of cross currency interest rate swaps arrangements as detailed in Note 27(b)):
2009 2008
HK$ Million HK$ Million
HKD 32,818 30,795
RMB 3,517 3,743
USD 389 351
JPY 3,120 3,120
39,844 38,009
b. The interest rate profile of the Group’s borrowings (after the effects of interest rate swaps and cross currency interest
rate swaps as detailed in Notes 27(a) and (b)) were as follows:
2009 2008
Effective Effective
interest interest
rate rate
% HK$ Million % HK$ Million
Fixed rate borrowings
Bonds and notes 3.1 3,120 3.1 3,120
Floating rate borrowings
Bonds and notes 1.3 1,894 2.5 1,411
Bank loans 1.1 34,830 2.7 33,478
36,724 34,889
Total borrowings 39,844 38,009
c. All the interest bearing borrowings are carried at amortised cost except for loans in an amount of HK$954 million (2008:
HK$911 million) which are carried at their fair values. None of the non-current interest bearing borrowings are expected
to be settled within one year.
d. Included in the Group’s total loans are bank loans totalling HK$14,809 million (2008: HK$13,712 million) borrowed by
certain subsidiaries in China, Modern Terminals and HCDL. The loans are without recourse to the Company and its other
subsidiaries.
e. As at 31 December 2009, certain banking facilities of the Group are secured by mortgages over properties under
development and certain fixed assets with an aggregate carrying value of HK$22,474 million (2008: HK$15,915 million).
f. Certain of the Group’s borrowings are attached with financial covenants which require that at any time, the Group’s
consolidated tangible net worth is not less than and the ratio of borrowings to consolidated tangible net worth is not
more than certain required levels. During the year under review, all these covenants have been complied with by the
Group.
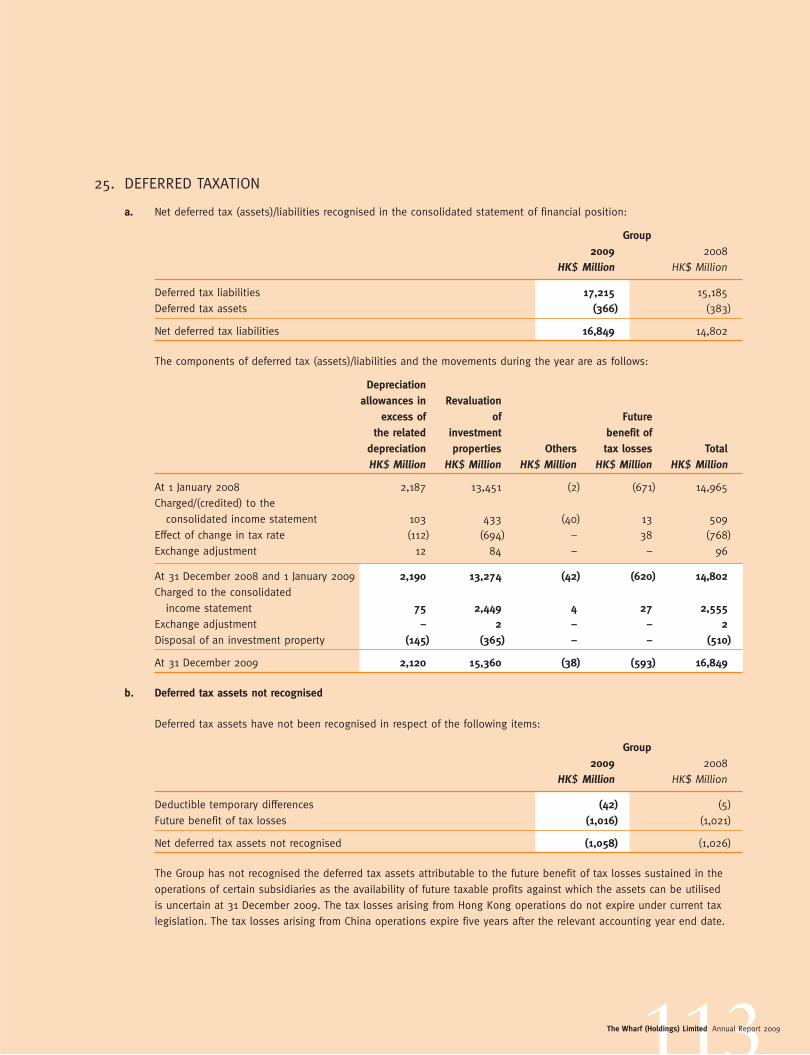
113The Wharf (Holdings) Limited Annual Report 2009
25. DEFERRED TAXATION
a. Net deferred tax (assets)/liabilities recognised in the consolidated statement of financial position:
Group
2009 2008
HK$ Million HK$ Million
Deferred tax liabilities 17,215 15,185
Deferred tax assets (366) (383)
Net deferred tax liabilities 16,849 14,802
The components of deferred tax (assets)/liabilities and the movements during the year are as follows:
Depreciation
allowances in Revaluation
excess of of Future
the related investment benefit of
depreciation properties Others tax losses Total
HK$ Million HK$ Million HK$ Million HK$ Million HK$ Million
At 1 January 2008 2,187 13,451 (2) (671) 14,965
Charged/(credited) to the
consolidated income statement 103 433 (40) 13 509
Effect of change in tax rate (112) (694) – 38 (768)
Exchange adjustment 12 84 – – 96
At 31 December 2008 and 1 January 2009 2,190 13,274 (42) (620) 14,802
Charged to the consolidated
income statement 75 2,449 4 27 2,555
Exchange adjustment – 2 – – 2
Disposal of an investment property (145) (365) – – (510)
At 31 December 2009 2,120 15,360 (38) (593) 16,849
b. Deferred tax assets not recognised
Deferred tax assets have not been recognised in respect of the following items:
Group
2009 2008
HK$ Million HK$ Million
Deductible temporary differences (42) (5)
Future benefit of tax losses (1,016) (1,021)
Net deferred tax assets not recognised (1,058) (1,026)
The Group has not recognised the deferred tax assets attributable to the future benefit of tax losses sustained in the
operations of certain subsidiaries as the availability of future taxable profits against which the assets can be utilised
is uncertain at 31 December 2009. The tax losses arising from Hong Kong operations do not expire under current tax
legislation. The tax losses arising from China operations expire five years after the relevant accounting year end date.

114The Wharf (Holdings) Limited Annual Report 2009
Notes to the Financial Statements
26. OTHER DEFERRED LIABILITIES
Group
2009 2008
HK$ Million HK$ Million
Club debentures issued (non-interest bearing) 215 217
Deferred revenue 47 45
262 262
The Group considers the effect of discounting the club debentures would be immaterial to the Group.
27. FINANCIAL RISK MANAGEMENT AND FAIR VALUES
The Group is exposed to financial risks related to interest rate, foreign currency, equity price, liquidity and credit in the normal
course of business. To manage some of these risks, the Group Finance Committee develops, maintains and monitors the
Group’s financial policies designed to facilitate cost efficient funding to the Group and to mitigate the impact of fluctuations in
interest rates and exchange rates. The financial policies are implemented by the Group’s Treasury department, which operates
as a centralised service unit in close co-operation with the Group’s operating units for managing the day-to-day treasury
functions and financial risks and for providing cost efficient funding to the Group.
The Group uses derivatives, principally forward currency contracts and interest rate and cross currency interest rate swaps,
as deemed appropriate, for financing and hedging transactions and for managing the Group’s assets and liabilities. It is the
Group’s policy not to enter into derivative transactions and invest in financial products with significant underlying leverage
which are commercially speculative.
a. Interest rate risk
The Group’s main exposure to interest rate risk relates principally to the Group’s long term borrowings denominated
in HKD, USD and RMB borrowings. Borrowings at variable rates expose the Group to cash flow interest rate risk whilst
borrowings at fixed rate expose the Group to fair value interest rate risk. The Group manages its interest rate risk
exposure in accordance with defined policies and regular review with a focus on reducing the Group’s overall cost of
funding as well as having regard to the floating/fixed rate mix appropriate to its current business portfolio.
In line with the Group’s prevailing strategy, the Group has entered into a number of interest rate swaps (“IRS”) which
have the economic effect of converting certain fixed rate interest bearing notes with the notional amounts totalling
HK$930 million (2008: HK$850 million) into floating rates borrowings. For each of the IRS entered into by the Group, the
tenor and timing of the IRS cash flows matches with those of the notes interest expenses.
For ensuring the certainty for a proportion of funding costs in the forthcoming years, the Group has entered into various
floating-to-fixed IRS with the notional amounts totalling HK$3,630 million with maturity of 10 years together with
another HK$3,630 million fixed-to-floating IRS with maturity of 2 years. Effectively, this arrangement has locked in fixed
interest rates ranging from 2.1% to 3.6% for certain portion of its floating rate loan portfolio for a period of eight years
from 2010 and 2011 onwards.
As at 31 December 2009, after taking into account of IRS, approximately 92% (2008: 92%) of the Group’s borrowings
were at floating rates and the remaining 8% (2008: 8%) were at fixed rates (see Note 24(b)).
Based on the sensitivity analysis performed as at 31 December 2009, it was estimated that a general increase/decrease
of 1% (2008:1%) in interest rates, with all other variables held constant, would decrease/increase the Group’s post-tax
profit and total equity by approximately HK$28 million (2008: HK$120 million). This takes into account the effect of
interest bearing bank deposits.

115The Wharf (Holdings) Limited Annual Report 2009
The sensitive analysis above indicates the instantaneous change in the Group’s post-tax profit and total equity that
would arise assuming that the change in interest rates had occurred at the end of reporting date and had been applied
to re-measure those financial instruments held by the Group which expose the Group to fair value interest rate risk at the
end of reporting date. In respect of the exposure to cash flow interest rate risk arising from floating rate non-derivative
instruments held by the Group at the end of reporting date, the impact on the Group’s post-tax profit and total equity
is estimated as an annualised impact on interest expense or income of such a change in interest rates. The analysis is
performed on the same basis for 2008.
b. Foreign currency risk
The Group owns assets and conducts its businesses primarily in Hong Kong and secondarily in China, with its cash
flows denominated substantially in HKD and RMB which exposes the Group to foreign currency risk with respect to RMB
related to its property development and port-related operations and investments in China.
The Group is also exposed to foreign currency risk in respect of its USD denominated borrowings. Anticipated foreign
exchange payments relate primarily to interest expense payments, repayment of principal and capital expenditure.
Where appropriate or available in a cost-efficient manner, the Group may enter into forward foreign exchange and swap
contracts to manage its foreign currency risk arising from above anticipated transactions denominated in currencies other
than its entities’ functional currencies.
The Group’s borrowings are predominantly denominated in the functional currency of the entity taking out the
borrowings. In the case of group companies whose functional currencies are in HKD, their borrowings will be either
in HKD or USD. For managing the overall financing costs of existing and future capital requirements for the projects
in China, the Group has adopted a diversified funding approach and entered into certain cross currency interest rate
swaps and forward foreign exchange contracts. Some of the cross currency interest rate swaps have the financial
effect of converting certain USD borrowings into JPY borrowings, taking the advantage of lower interest rate for the
JPY borrowings but exposing the Group to exchange rate risk with respect to JPY. The swaps entered into under this
arrangement have effectively converted the USD400 million ten-year fixed-rate notes issued in 2007 into JPY borrowings,
which has and is anticipated going forward to save the Group interest of approximately 3% per annum for and over the
tenure of the notes. Concurrently, the swaps expose the Group to fluctuation in the JPY exchange rate. Based on the
prevailing accounting standard, such swaps need to be marked to market with the valuation movement recognised to
the consolidated income statement.
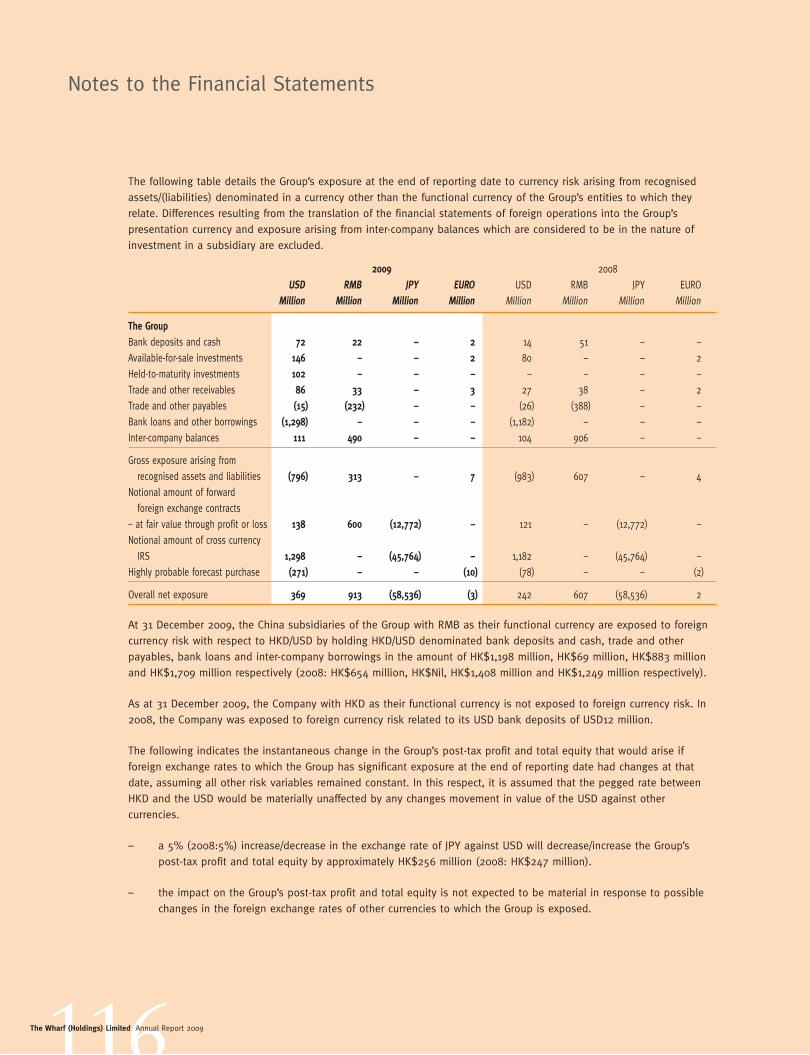
116The Wharf (Holdings) Limited Annual Report 2009
Notes to the Financial Statements
The following table details the Group’s exposure at the end of reporting date to currency risk arising from recognised
assets/(liabilities) denominated in a currency other than the functional currency of the Group’s entities to which they
relate. Differences resulting from the translation of the financial statements of foreign operations into the Group’s
presentation currency and exposure arising from inter-company balances which are considered to be in the nature of
investment in a subsidiary are excluded.
2009 2008
USD RMB JPY EURO USD RMB JPY EURO
Million Million Million Million Million Million Million Million
The Group
Bank deposits and cash 72 22 – 2 14 51 – –
Available-for-sale investments 146 – – 2 80 – – 2
Held-to-maturity investments 102 – – – – – – –
Trade and other receivables 86 33 – 3 27 38 – 2
Trade and other payables (15) (232) – – (26) (388) – –
Bank loans and other borrowings (1,298) – – – (1,182) – – –
Inter-company balances 111 490 – – 104 906 – –
Gross exposure arising from
recognised assets and liabilities (796) 313 – 7 (983) 607 – 4
Notional amount of forward
foreign exchange contracts
– at fair value through profit or loss 138 600 (12,772) – 121 – (12,772) –
Notional amount of cross currency
IRS 1,298 – (45,764) – 1,182 – (45,764) –
Highly probable forecast purchase (271) – – (10) (78) – – (2)
Overall net exposure 369 913 (58,536) (3) 242 607 (58,536) 2
At 31 December 2009, the China subsidiaries of the Group with RMB as their functional currency are exposed to foreign
currency risk with respect to HKD/USD by holding HKD/USD denominated bank deposits and cash, trade and other
payables, bank loans and inter-company borrowings in the amount of HK$1,198 million, HK$69 million, HK$883 million
and HK$1,709 million respectively (2008: HK$654 million, HK$Nil, HK$1,408 million and HK$1,249 million respectively).
As at 31 December 2009, the Company with HKD as their functional currency is not exposed to foreign currency risk. In
2008, the Company was exposed to foreign currency risk related to its USD bank deposits of USD12 million.
The following indicates the instantaneous change in the Group’s post-tax profit and total equity that would arise if
foreign exchange rates to which the Group has significant exposure at the end of reporting date had changes at that
date, assuming all other risk variables remained constant. In this respect, it is assumed that the pegged rate between
HKD and the USD would be materially unaffected by any changes movement in value of the USD against other
currencies.
– a 5% (2008:5%) increase/decrease in the exchange rate of JPY against USD will decrease/increase the Group’s
post-tax profit and total equity by approximately HK$256 million (2008: HK$247 million).
– the impact on the Group’s post-tax profit and total equity is not expected to be material in response to possible
changes in the foreign exchange rates of other currencies to which the Group is exposed.

117The Wharf (Holdings) Limited Annual Report 2009
The sensitivity analysis performed in the above represents the aggregation of the instantaneous effects on each of the
Group entities’ post-tax profit and total equity measured in the respective functional currencies, translated into HKD at
the exchange rate ruling at the end of the reporting date for presentation purposes.
The sensitivity analysis assumes that the change in foreign exchange rates had been applied to remeasure those
financial instruments held by the Group which expose the Group to foreign currency risk at the end of the reporting date,
including balances between group companies which are denominated in a currency other than the functional currencies
of the Group’s entities to which they relate. The analysis excludes the differences that would result from the translation
of the financial statements of foreign operations into the Group’s presentation currency. The analysis is performed at the
same basis for 2008.
c. Equity price risk
The Group is exposed to equity price changes arising from equity investments classified as available-for-sale investments.
Listed investments held in the available-for-sale portfolio have been chosen taking reference to their long term growth
potential and returns and are monitored regularly for performance. Given that the volatility of the stock markets may not
have a direct correlation with the Group’s investment portfolio, it is impractical to determine the impact that the changes
in stock market indices would have on the Group’s portfolio of equity investments.
Based on the sensitivity analysis performed as at 31 December 2009, it is estimated that an increase/decrease of 10% in
the market value of the Group’s listed available-for-sale investments, with all other variables held constant, would not
affect the Group’s post-tax profit unless there are impairments but would increase/decrease the Group’s total equity by
HK$123 million (2008: HK$66 million). The analysis is performed on the same basis for 2008.
d. Liquidity risk
The Group adopts a prudent liquidity risk management policy, maintaining sufficient reserves of cash and readily
realisable marketable securities and adequate committed lines of funding with staggered maturities to reduce refinancing
risk in any year from major financial institutions and to maintain flexibility for meeting its liquidity requirements in the
short and longer term. The Group’s cash management is substantially centralised within the Group Treasury department,
which regularly monitors the current and expected liquidity requirements and its compliance with lending covenants.
Certain non-wholly-owned subsidiaries are responsible for their own cash management, including the short term
investment of cash surpluses with creditworthy financial institutions and the raising of loans to cover expected cash
demands, in accordance with the established policies and strategies with the concurrence by the Company.

118The Wharf (Holdings) Limited Annual Report 2009
Notes to the Financial Statements
The following tables detail the remaining contractual maturities at the end of reporting date of the Group’s derivative and
non-derivative financial liabilities, which are based on contractual undiscounted cash flows (including interest payments
computed using contractual rates or, if floating, based on rates at the end of reporting date and carried at exchange rate
prevailing at the end of reporting date) and the earliest date the Group can be required to pay:
Contractual undiscounted cash flow
Within More than More than
1 year 1 year but 2 years but More
Carrying or on less than less than than
amount Total demand 2 years 5 years 5 years
HK$ Million HK$ Million HK$ Million HK$ Million HK$ Million HK$ Million
At 31 December 2009
Bank loans and other borrowings (39,844) (42,878) (8,842) (5,422) (19,690) (8,924)
Trade and other payables (8,240) (8,240) (7,241) (516) (423) (60)
Other deferred liabilities
(Club debentures issued) (215) (215) – – – (215)
Forward foreign exchange contracts (2) (2) (2) – – –
Cross currency interest rate swaps (918) (33) 105 99 254 (491)
Interest rate swaps 276 (486) (2) (52) (190) (242)
(48,943) (51,854) (15,982) (5,891) (20,049) (9,932)
At 31 December 2008
Bank loans and other borrowings (38,009) (41,117) (5,044) (6,568) (21,387) (8,118)
Trade and other payables (6,924) (6,924) (5,831) (505) (430) (158)
Other deferred liabilities
(Club debentures issued) (217) (217) – – – (217)
Forward foreign exchange contracts (166) (166) (166) – – –
Cross currency interest rate swaps (604) (228) 59 58 179 (524)
Interest rate swaps (43) (167) 7 1 (57) (118)
(45,963) (48,819) (10,975) (7,014) (21,695) (9,135)
The Company on its own exposes to liquidity risk that arose from financial guarantees given by the Company on
behalf of subsidiaries. The guarantees are callable if the respective subsidiary is unable to meet its obligation and the
maximum amount callable as at 31 December 2009 was HK$25.1 billion (2008: HK$23.5 billion).

119The Wharf (Holdings) Limited Annual Report 2009
e. Credit risk
The Group’s credit risk is primarily attributable to rental, other trade and other receivables, cash and cash equivalents,
held-to-maturity investments and over-the-counter derivative financial instruments. The exposures to these credit risks
are closely monitored on an ongoing basis by established credit policies and procedures in each of the Group’s core
businesses. In respect of rental receivables, sufficient rental deposits from tenants are held to cover potential exposure
to credit risk. Further, evaluations are made for the customers with reference to their repayment history and financial
strength, as well as the economic environment in which the customer operates.
Cash at bank, deposits placed with financial institutions, and investments and transactions involving derivative financial
instruments are with counter parties with sound credit ratings to minimise credit exposure.
The Group has no significant concentrations of credit risk. The maximum exposure to credit risk is represented by the
carrying amount of each financial asset in the consolidated statement of financial position. Except for the financial
guarantees given by the Company as set out in Note 31, the Group does not provide any other guarantee which would
expose the Group or the Company to material credit risk.
f. Fair value
(i) Fair value estimation
The fair value of financial instruments are determined as follows :
Listed investments are stated at quoted market prices. Unlisted investments for which fair values cannot be
reliably measured are stated at cost less impairment losses.
The fair values of held-to-maturity investments, receivables, bank balances and other current assets, payables and
accruals, current borrowings, and provisions are assumed to approximate their carrying amounts due to the short-
term maturities of these assets and liabilities.
The fair value of forward foreign exchange contracts is determined by using the forward exchange rates at the
end of reporting date and comparing to the contractual rates. The fair value of interest rate swaps and cross
currency interest rate swaps is determined based on the amount that the Group would receive or pay to terminate
the swaps at the end of reporting date taking into account current interest rates and current creditworthiness of
the swap counter parties. The fair value of bank loans and other borrowings is estimated as the present value of
future cash flows, discounted at current market interest rates for similar financial institutions.
All financial instruments are carried at amounts not materially different from their fair values as at 31 December
2009 and 2008. Amounts due (to)/from subsidiaries are unsecured, interest free and have no fixed repayment
terms. Given these terms it is not meaningful to disclose fair values.

120The Wharf (Holdings) Limited Annual Report 2009
Notes to the Financial Statements
(ii) Financial instruments carried at fair value
The following table presents the carrying value of financial instruments measured at fair value at the end of reporting
date across the three levels of the fair value hierarchy defined in HKFRS 7, Financial Instruments: Disclosures, with
the fair value of each financial instrument categorised in its entirety based on the lowest level of input that is
significant to that fair value measurement. The levels are defined as follows:
• Level 1 (highest level): fair values measured using quoted prices (unadjusted) in active markets for identical
financial instruments.
• Level 2: fair values measured using quoted prices in active markets for similar financial instruments, or
using valuation techniques in which all significant inputs are directly or indirectly based on observable
market data.
• Level 3 (lowest level): fair values measured using valuation techniques in which any significant input is not
based on observable market data.
Group
Level 1 Level 2 Total
At 31 December 2009 HK$ Million HK$ Million HK$ Million
Assets
Available-for-sale investments:
– Listed 1,232 – 1,232
Derivative financial instruments:
– Interest rate swaps – 409 409
– Cross currency interest rate swaps – 102 102
1,232 511 1,743
Liabilities
Derivative financial instruments:
– Interest rate swaps – (133) (133)
– Cross currency interest rate swaps – (1,020) (1,020)
– Forward foreign exchange contracts – (2) (2)
– (1,155) (1,155)
During the year there were no significant transfers between instruments in Level 1 and Level 2.
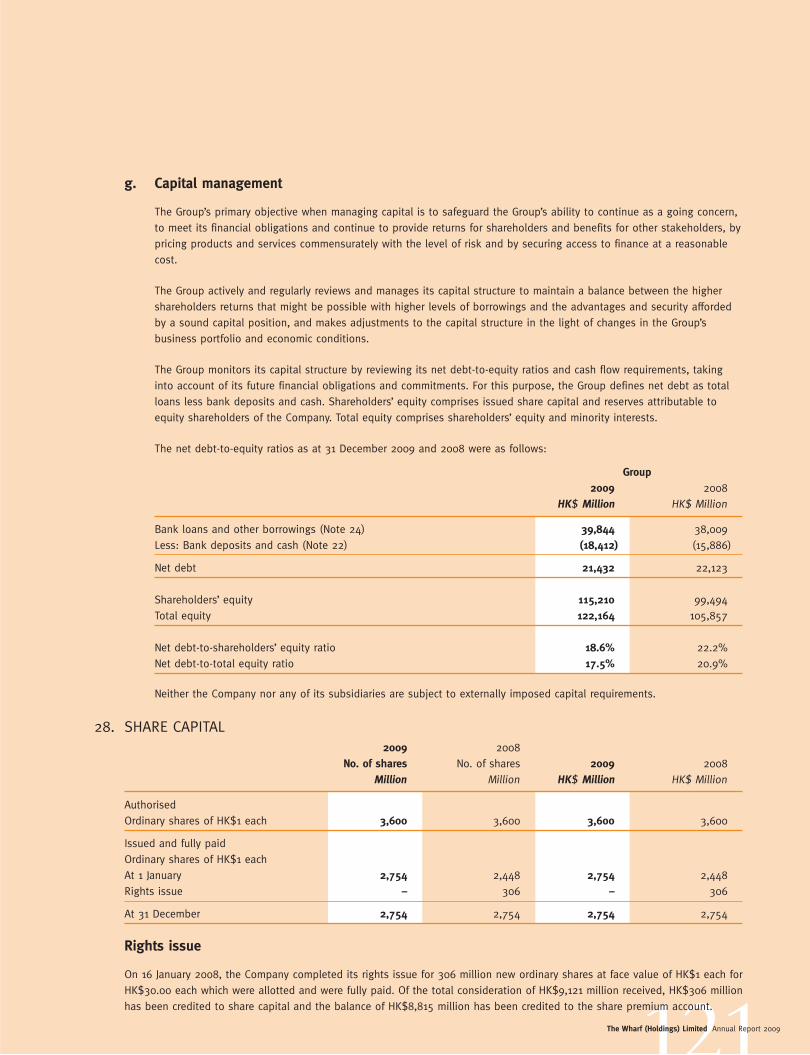
121The Wharf (Holdings) Limited Annual Report 2009
g. Capital management
The Group’s primary objective when managing capital is to safeguard the Group’s ability to continue as a going concern,
to meet its financial obligations and continue to provide returns for shareholders and benefits for other stakeholders, by
pricing products and services commensurately with the level of risk and by securing access to finance at a reasonable
cost.
The Group actively and regularly reviews and manages its capital structure to maintain a balance between the higher
shareholders returns that might be possible with higher levels of borrowings and the advantages and security afforded
by a sound capital position, and makes adjustments to the capital structure in the light of changes in the Group’s
business portfolio and economic conditions.
The Group monitors its capital structure by reviewing its net debt-to-equity ratios and cash flow requirements, taking
into account of its future financial obligations and commitments. For this purpose, the Group defines net debt as total
loans less bank deposits and cash. Shareholders’ equity comprises issued share capital and reserves attributable to
equity shareholders of the Company. Total equity comprises shareholders’ equity and minority interests.
The net debt-to-equity ratios as at 31 December 2009 and 2008 were as follows:
Group
2009 2008
HK$ Million HK$ Million
Bank loans and other borrowings (Note 24) 39,844 38,009
Less: Bank deposits and cash (Note 22) (18,412) (15,886)
Net debt 21,432 22,123
Shareholders’ equity 115,210 99,494
Total equity 122,164 105,857
Net debt-to-shareholders’ equity ratio 18.6% 22.2%
Net debt-to-total equity ratio 17.5% 20.9%
Neither the Company nor any of its subsidiaries are subject to externally imposed capital requirements.
28. SHARE CAPITAL
2009 2008
No. of shares No. of shares 2009 2008
Million Million HK$ Million HK$ Million
Authorised
Ordinary shares of HK$1 each 3,600 3,600 3,600 3,600
Issued and fully paid
Ordinary shares of HK$1 each
At 1 January 2,754 2,448 2,754 2,448
Rights issue – 306 – 306
At 31 December 2,754 2,754 2,754 2,754
Rights issue
On 16 January 2008, the Company completed its rights issue for 306 million new ordinary shares at face value of HK$1 each for
HK$30.00 each which were allotted and were fully paid. Of the total consideration of HK$9,121 million received, HK$306 million
has been credited to share capital and the balance of HK$8,815 million has been credited to the share premium account.

122The Wharf (Holdings) Limited Annual Report 2009
Notes to the Financial Statements
29. CAPITAL AND RESERVES
a. The reconciliation between the opening and closing balances of each component of the Group’s consolidated equity is
set out in the consolidated statement of changes in equity.
The Group’s investments revaluation reserves have been set up and will be dealt with in accordance with the accounting
policy adopted for the revaluation of available-for-sale investments. The exchange and other reserves mainly comprise
exchange differences arising from the translation of the financial statements of foreign operations.
Details of the changes in the Company’s individual components of equity between the beginning and the end of the year
are set out below:
Capital
Share Share redemption Revenue
capital premium reserve reserves Total
HK$ Million HK$ Million HK$ Million HK$ Million HK$ Million
The Company
At 1 January 2008 2,448 7,751 7 3,500 13,706
Rights issue 306 8,815 – – 9,121
Profit for the year – – – 3,376 3,376
Final dividends paid in respect of
2007 – – – (1,212) (1,212)
Interim dividends paid in respect of
2008 (Note 9) – – – (991) (991)
At 31 December 2008
and 1 January 2009 2,754 16,566 7 4,673 24,000
Profit for the year – – – 1,530 1,530
Final dividends paid in respect of
2008 (Note 9) – – – (1,212) (1,212)
Interim dividends paid in respect of
2009 (Note 9) – – – (991) (991)
At 31 December 2009 2,754 16,566 7 4,000 23,327
b. Reserves of the Company available for distribution to equity shareholders of the Company at 31 December 2009
amounted to HK$4,000 million (2008: HK$4,673 million).
c. The application of the share premium account and capital redemption reserve are governed by Section 48B and Section
49H of the Hong Kong Companies Ordinance respectively.
d. After the end of reporting date the Directors proposed a final dividend of 64 cents per share (2008: 44 cents per share)
amounting to HK$1,763 million (2008: HK$1,212 million). This dividend has not been recognised as a liability at the end
of reporting date.

123The Wharf (Holdings) Limited Annual Report 2009
30. MATERIAL RELATED PARTY TRANSACTIONS
Except for the transactions noted below, the Group and the Company have not been a party to any material related party
transactions during the year ended 31 December 2009:
a. In respect of the year ended 31 December 2009, the Group earned rental income totalling HK$513 million (2008:
HK$490 million) from various tenants which are wholly-owned by, or are non wholly-owned subsidiaries of, companies
which in turn are wholly-owned by the family interests of, or by a trust the settlor of which is, the Chairman of the
Company. Such transactions are considered to be related party transactions and also constitute connected transactions
as defined under the Listing Rules.
b. Remuneration for key management personnel of the Group, including amounts paid to the Directors of the Company and
the five highest paid employees are disclosed in Notes 2(b) and (c).
31. CONTINGENT LIABILITIES
As at 31 December 2009, there were contingent liabilities in respect of guarantees given by the Company on behalf of
subsidiaries relating to overdrafts, short term loans and credit facilities, bonds and notes of up to HK$38,828 million (2008:
HK$36,969 million). The Company has not recognised any deferred income for the guarantees given in respect of borrowings
and other banking facilities for subsidiaries as their fair value cannot be reliably measured and their transaction price was
HK$Nil.
As at the end of reporting date, the Directors do not consider it is probable that a claim will be made against the Company
under any of the guarantees.

124The Wharf (Holdings) Limited Annual Report 2009
Notes to the Financial Statements
32. COMMITMENTS
The Group’s outstanding commitments on expenditures as at the end of reporting date included below:
Group
2009 2008
Hong Kong China Total Hong Kong China Total
HK$ Million HK$ Million HK$ Million HK$ Million HK$ Million HK$ Million
a. Capital expenditure
(including investment properties)
Authorised and contracted for 330 6,624 6,954 369 1,903 2,272
Authorised but not contracted for 1,148 11,711 12,859 1,144 1,304 2,448
1,478 18,335 19,813 1,513 3,207 4,720
b. Programming and others
Authorised and contracted for 2,226 – 2,226 783 – 783
Authorised but not contracted for 139 – 139 71 – 71
2,365 – 2,365 854 – 854
c. Properties under development
(other than investment properties)
Authorised and contracted for 7 8,020 8,027 8 10,592 10,600
Authorised but not contracted for – 20,428 20,428 – 35,090 35,090
7 28,448 28,455 8 45,682 45,690
d. Properties under development
undertaken by jointly controlled
entities and associates
attributable to the Group
Authorised and contracted for – 4,335 4,335 – 3,538 3,538
Authorised but not contracted for – 10,459 10,459 – 8,178 8,178
– 14,794 14,794 – 11,716 11,716
e. Expenditure for operating leases
Within one year 29 – 29 50 – 50
After one year but within five years 41 – 41 51 – 51
Over five years 58 – 58 65 – 65
128 – 128 166 – 166
(i) Commitments for properties under development by the Group’s subsidiaries or through jointly controlled entities
included outstanding land cost attributable to the Group of HK$13.2 billion payable by instalments from 2010 to 2013.
Other commitments under the categories are mainly construction cost for the forthcoming years.
(ii) Commitments for capital expenditure in China are mainly related to land and construction cost for investment property
under development and Modern Terminal’s port expenditure for the Dachan Bay and Taicang projects.
(iii) The Group leases a number of properties and telecommunication network facilities under operating leases. The
leases typically run for an initial period of two to fifteen years, with an option to renew the lease when all terms are
renegotiated. Lease payments are usually increased annually to reflect market rentals. None of the leases includes
contingent rentals.

125The Wharf (Holdings) Limited Annual Report 2009
33. CHANGES IN ACCOUNTING POLICIES
The HKICPA has issued the following new and revised Hong Kong Financial Reporting Standards (“HKFRS”), amendments to
HKFRSs and interpretations that are first effective for the current accounting period of the Group and the Company:
HKAS 1 (Revised) Presentation of financial statements
HKFRS 7 (Amendment) Improving disclosures about financial instruments
HKFRS 8 Operating segments
Improvements to HKFRSs (2008) Amendments to HKAS 40 investment property
The “Principal accounting policies” set out on pages 128 to 143 summarises the accounting policies of the Group and the
Company after the adoption of these policies to the extent that they are relevant to the Group and the Company.
Except as described below, the adoption of the above new or revised standards, amendments and interpretations had no
significant impact on the financial information of the Group.
a. HKAS 1 (Revised) – Presentation of financial statements
As a result of the adoption of HKAS 1 (Revised), details of changes in equity during the period arising from transactions
with equity shareholders in their capacity as such have been presented separately from all other income and expenses
in a revised consolidated statement of changes in equity. All other items of income and expense are presented in the
consolidated income statement, if they are recognised as part of profit or loss for the period, or otherwise in a new
primary statement, the consolidated statement of comprehensive income. Corresponding amounts have been restated to
conform to the new presentation.
This change in presentation has no effect on reported profit or loss, total income and expense or net assets for any
period presented.
b. HKFRS 7 (Amendment) – Improving disclosures about financial instruments
As a result of the adoption of the amendments to HKFRS 7, the financial statements include expanded disclosures
in note 27(f ) about the fair value measurement of the Group’s financial instruments, categorising these fair value
measurements into a three-level fair value hierarchy according to the extent to which they are based on observable
market data. The Group has taken advantage of the transitional provisions set out in the amendments to HKFRS 7,
under which comparative information for the newly required disclosures about the fair value measurements of financial
instruments has not been provided.
c. HKFRS 8 – Operating segments
HKFRS 8 requires segment disclosure to be based on the way that the Group’s chief operating decision maker regards
and manages the Group, with the amounts reported for each reportable segment being the measures reported to the
Group’s chief operating decision maker for the purposes of assessing segment performance and making decisions
about operating matters. This contrasts with the presentation of segment information in prior years which was based
on disaggregation of the Group’s financial statements into segments based on related products and services and on
geographical areas. The adoption of HKFRS 8 has resulted in the presentation of segment information in a manner
that is more consistent with internal reporting provided to the Group’s top management, and has resulted in amended
disclosure being presented. Corresponding amounts have been restated on a basis consistent with the revised segment
information.

126The Wharf (Holdings) Limited Annual Report 2009
Notes to the Financial Statements
d. Improvements to HKFRSs (2008) – Amendments to HKAS 40 investment property
As a result of the amendments to HKAS 40, investment property which is under construction will be carried at fair value
at the earlier of when the fair value first becomes reliably measurable and the date of completion of the property. Any
gain or loss will be recognised in profit or loss. Previously such property was carried at cost until the construction was
completed, at which time it was fair valued with any gain or loss being recognised in profit or loss. This amendment is
applied prospectively and the corresponding amounts have not been restated. As a result of this amendment, the profit
attributable to equity shareholders increased by HK$1,877 million for the year ended 31 December 2009.
34. FUTURE CHANGES IN ACCOUNTING POLICIES
Up to the date of issue of these financial statements, the HKICPA has issued a number of amendments, new standards and
interpretations, which have not been adopted since they are only effective after 31 December 2009.
The Group is in the process of making an assessment of what the impact of these amendments, new standards and new
interpretations is expected to be in the period of initial application. So far it has concluded that apart from Improvements to
HKFRSs 2009 which may have some impact, the adoption of the other new standards and interpretations is unlikely to have a
significant impact on the Group’s results of operations and financial position.
In addition, the following developments may result in new or amended disclosures in the financial statements including
possible restatement of comparative amounts in the first period of adoption:
Effective for accounting
periods beginning on or after
HKFRS 3 (Revised), Business combinations 1 July 2009
Amendments to HKAS 27, Consolidated and separate financial statements 1 July 2009
Amendments to HKAS 39, Financial instruments:
Recognition and measurement – Eligible hedged items 1 July 2009
Improvements to HKFRSs 2009 1 July 2009 or 1 January 2010
35. EVENTS AFTER THE REPORTING PERIOD
After the end of the reporting date the Directors proposed a final dividend. Further details are disclosed in Note 9.

127The Wharf (Holdings) Limited Annual Report 2009
36. COMPARATIVE FIGURES
As a result of the application of HKAS 1 (revised), Presentation of financial statements and HKFRS 8 Operating segments,
certain comparative figures have been reclassified to conform to current year’s presentation. Further details of these
developments are disclosed in note 33.
37. PARENT AND ULTIMATE HOLDING COMPANY
The Directors consider the parent and ultimate holding company at 31 December 2009 to be Wheelock and Company Limited,
incorporated and listed in Hong Kong. Wheelock and Company Limited produces financial statements available for public use.
38. APPROVAL OF THE FINANCIAL STATEMENTS
The financial statements were approved and authorised for issue by the Directors on 23 March 2010.

128The Wharf (Holdings) Limited Annual Report 2009
Principal Accounting Policies
a. Statement of compliance
These financial statements have been prepared in accordance with all applicable Hong Kong Financial Reporting Standards
(“HKFRSs”), which collective term includes all applicable individual Hong Kong Financial Reporting Standards, Hong Kong
Accounting Standards (“HKASs”) and Interpretations issued by the Hong Kong Institute of Certified Public Accountants
(“HKICPA”), accounting principles generally accepted in Hong Kong and the requirements of the Hong Kong Companies
Ordinance. These financial statements also comply with the applicable disclosure provisions of the Rules Governing the Listing
of Securities on The Stock Exchange of Hong Kong Limited. A summary of the principal accounting policies adopted by the
Group is set out below.
The HKICPA has issued certain new and revised HKFRSs that are first effective or available for early adoption for the current
accounting period of the Group and the Company. Note 33 to the Financial Statements provides information on any changes
in accounting policies resulting from initial application of these developments to the extent that they are relevant to the
Group for the current and prior accounting periods reflected in these financial statements. The Group has not applied any new
standard or interpretation that is not yet effect for the current accounting period (note 34).
b. Basis of preparation of the financial statements
The consolidated financial statements made up to 31 December comprise the Company and its subsidiaries (together referred
to as the “Group”) and the Group’s interest in associates and jointly controlled entities.
The measurement basis used in the preparation of the financial statements is the historical cost basis except where stated
otherwise in the accounting policies set out below.
The preparation of financial statements in conformity with HKFRSs requires management to make judgements, estimates and
assumptions that affect the application of policies and reported amounts of assets, liabilities, income and expenses. The
estimates and associated assumptions are based on historical experience and various other factors that are believed to be
reasonable under the circumstances, the results of which form the basis of making the judgements about carrying values of
assets and liabilities that are not readily apparent from other sources. Actual results may differ from these estimates.
The estimates and underlying assumptions are reviewed on an ongoing basis. Revisions to accounting estimates are
recognised in the period in which the estimate is revised if the revision affects only that period, or in the period of the revision
and future periods if the revision affects both current and future periods.
Judgements made by management in the application of HKFRSs that have significant effect on the financial statements and
major sources of estimation uncertainty are discussed in note (z).
c. Basis of consolidation
i. Subsidiaries and minority interests
Subsidiaries are entities controlled by the Group. Control exists when the Group has the power, to govern the financial
and operating policies of an entity, so as to obtain benefits from its activities. In assessing control, potential voting
rights that presently are exercisable are taken into account.
An investment in a subsidiary is consolidated into the consolidated financial statements from the date that control
commences until the date that control ceases. Intra-group balances and transactions, and any unrealised profits arising
from intra-group transactions, are eliminated in full in preparing the consolidated financial statements. Unrealised losses
resulting from intra-group transactions are eliminated in the same way as unrealised gains, but only to the extent that
there is no evidence of impairment.

129The Wharf (Holdings) Limited Annual Report 2009
Minority interests represent the portion of the net assets of subsidiaries attributable to interests that are not owned by
the Company, whether directly or indirectly through subsidiaries, and in respect of which the Group has not agreed any
additional terms with the holders of those interests which would result in the Group as a whole having a contractual
obligation in respect of those interests that meets the definition of a financial liability. Minority interests are presented
in the consolidated statement of financial position within equity, separately from equity attributable to the equity
shareholders of the Company. Minority interests in the results of the Group are presented on the face of the consolidated
income statement and the consolidated statement of comprehensive income as an allocation of the total profit or loss
and total comprehensive income for the year between minority interests and the equity shareholders of the Company.
Where losses applicable to the minority exceed the minority’s interest in the equity of a subsidiary, the excess, and
any further losses applicable to the minority, are charged against the Group’s interest except to the extent that the
minority has a binding obligation to, and is able to, make additional investment to cover the losses. If the subsidiary
subsequently reports profits, the Group’s interest is allocated all such profits until the minority’s share of losses
previously absorbed by the Group has been recovered.
In the Company’s statement of financial position, an investment in a subsidiary is stated at cost less impairment losses.
ii. Associates and jointly controlled entities
An associate is an entity in which the Group or Company has significant influence, but not control or joint control, over
its management, including participation in the financial and operating policy decisions.
A jointly controlled entity is an entity which operates under a contractual arrangement between the Group or Company
and other parties, where the contractual arrangement establishes that the Group or Company and one or more of the
other parties share joint control over the economic activity of the entity.
An investment in an associate or a jointly controlled entity is accounted for in the consolidated financial statements
under the equity method, unless it is classified as held for sale (or included in a disposal group that is classified as
held for sale). Under the equity method, the investment is initially recorded at cost and adjusted thereafter for the post
acquisition change in the Group’s share of the associate’s or the jointly controlled entity’s net assets and any impairment
loss relating to the investment (see notes (c)(iii) and (k)). The Group’s share of the post-acquisition, post-tax results of
the investees and any impairment losses for the year are recognised in the consolidated income statement, whereas the
Group’s share of the post-acquisition post-tax items of the investees’ other comprehensive income is recognised in the
consolidated statement of comprehensive income.
When the Group’s share of losses exceeds its interest in the associate or jointly controlled entity, the Group’s interest is
reduced to nil and recognition of further losses is discontinued except to the extent that the Group has incurred legal
or constructive obligations or made payments on behalf of the investee. For this purpose, the Group’s interest in the
associate or jointly controlled entity is the carrying amount of the investment under the equity method together with
the Group’s long-term interests that, in substance, form part of the Group’s net investment in the associate or jointly
controlled entity.
Unrealised profits and losses resulting from transactions between the Group and its associates and jointly controlled
entities are eliminated to the extent of the Group’s interest in the investee, except where unrealised losses provide
evidence of an impairment of the asset transferred, in which case they are recognised immediately in the consolidated
income statement.
In the individual company’s statement of financial position, investments in associates and jointly controlled entities are
stated at cost less impairment losses.

130The Wharf (Holdings) Limited Annual Report 2009
Principal Accounting Policies
iii. Goodwill
Goodwill represents the excess of the cost of a business combination or an investment in an associate or a jointly
controlled entity over the Group’s interest in the net fair value of the acquiree’s identifiable assets, liabilities and
contingent liabilities.
Goodwill is stated at cost less accumulated impairment losses. Goodwill arising on a business combination is allocated
to cash-generating units and is tested annually for impairment. In respect of associates or jointly controlled entities, the
carrying amount of goodwill is included in the carrying amount of the interest in the associate or jointly controlled entity
and the investment as a whole is tested for impairment whenever there is objective evidence of impairment (see note (k)).
Any excess of the Group’s interest in the fair value of the acquiree’s identifiable assets, liabilities and contingent
liabilities over the cost of a business combination or an investment in an associate or a jointly controlled entity is
recognised immediately in consolidated income statement.
On disposal of a cash-generating unit, an associate or a jointly controlled entity during the year, any attributable amount
of purchased goodwill is included in the calculation of the profit or loss on disposal.
d. Fixed assets
i. Investment properties
Investment properties are land and/or buildings which are owned or held under a leasehold interest to earn rental
income and/or for capital appreciation. These include land held for a currently undetermined future use and property
that is being constructed or developed for future use as investment property.
Investment properties are stated in the statement of financial position at fair value, unless they are still in the course
of construction or development at the end of reporting date and their fair value cannot be reliably determined at that
time. Any gain or loss arising from a change in fair value or from the retirement or disposal of an investment property
is recognised in the consolidated income statement. Rental income from investment properties is accounted for as
described in note (s)(i).
When the Group holds a property interest under an operating lease to earn rental income and/or for capital appreciation,
the interest is classified and accounted for as an investment property on a property-by-property basis. Any such property
interest which has been classified as an investment property is accounted for as if it were held under a finance lease,
and the same accounting policies are applied to that interest as are applied to other investment properties leased under
finance leases. Lease payments are accounted for as described in note (i).
ii. Hotel and club properties
Hotel and club properties are stated at cost less accumulated depreciation and impairment losses.
iii. Broadcasting and communications equipment
Broadcasting and communications equipment is stated at cost less accumulated depreciation and impairment losses.
Cost includes materials, direct labour and an appropriate proportion of overheads and borrowing costs directly
attributable to the acquisition, construction or production of such equipment which necessarily takes a substantial
period of time to get ready for its intended use.

131The Wharf (Holdings) Limited Annual Report 2009
iv. Other properties and fixed assets held for own use
Other properties and fixed assets held for own use are stated at cost less accumulated depreciation and impairment
losses.
v. Gains or losses arising from the retirement or disposal of a fixed asset are determined as the difference between the net
disposal proceeds and the carrying amount of the asset and are recognised in the consolidated income statement on the
date of retirement or disposal.
e. Depreciation of fixed assets
Depreciation is calculated to write-off the cost of items of fixed assets, less their estimated residual value, if any, using a
straight line method over their estimated useful lives as follows:
i. Investment properties
No depreciation is provided on investment properties.
ii. Hotel and club properties
Depreciation is provided on the cost of the leasehold land of hotel and club properties over the unexpired period of the
lease. Costs of buildings thereon are depreciated on a straight line basis over their estimated useful lives of not more
than 40 years.
iii. Broadcasting and communications equipment
Depreciation is provided on a straight line basis on the cost of the equipment at rates determined by the estimated
useful lives of the assets of 2 to 20 years.
iv. Other properties and fixed assets held for own use
Depreciation is provided on the cost of the leasehold land of all other properties held for own use over the unexpired
period of the lease. Costs of the buildings thereon are depreciated on a straight line basis over their unexpired period of
leases or estimated useful live whichever is shorter.
Depreciation is provided on a straight line basis on the cost of other fixed assets held for own use at rates determined
by the estimated useful lives of these assets of 3 to 25 years.
Where parts of an item of property, plant and equipment have different useful lives, the cost or valuation of the item is
allocated on a reasonable basis between the parts and each part is depreciated separately. Both the useful life of an asset and
its residual value, if any, are reviewed annually.

132The Wharf (Holdings) Limited Annual Report 2009
Principal Accounting Policies
f. Investments in debt and equity securities
Investments in debt and equity securities (other than investments in subsidiaries, associates and jointly controlled entities)
are initially stated at fair value, which is their transaction price unless fair value can be more reliably estimated using
valuation techniques whose variables include only data from observable markets. Cost includes attributable transaction costs,
except where indicated otherwise below. These investments are subsequently accounted for as follows, depending on their
classification.
Investments in securities held for trading are classified as current assets. Any attributable transaction costs are recognised
in the consolidated income statement as incurred. At the end of each reporting date the fair value is remeasured, with
any resultant gain or loss being recognised in the consolidated income statement. The net gain or loss recognised in the
consolidated income statement does not include any dividends or interest earned as these are recognised in accordance with
the policies set out in notes (s)(iv) and (v).
Dated debt securities that the Group and/or the Company has the positive ability and intention to hold to maturity are
classified as held-to-maturity securities. Held-to-maturity securities are stated in the statement of financial position at
amortised cost less impairment losses.
Investments in equity securities that do not have a quoted market price in an active market and whose fair value cannot be
reliably measured are recognised in the statement of financial position at cost less impairment losses.
Investments in securities which do not fall into any of the above categories are classified as available-for-sale securities.
At the end of each reporting date the fair value is remeasured, with any resultant gain or loss being recognised in other
comprehensive income and accumulated separately in equity in the investments revaluation reserve, except foreign exchange
gains and losses resulting from changes in the amortised cost of monetary items such as debt securities which are recognised
directly in the consolidated profit or loss. Where these investments are interest-bearing, interest calculated using the effective
interest method is recognised in consolidated profit or loss. When these investments are derecognised or impaired, the
cumulative gain or loss is reclassified from equity to profit or loss.
Investments are recognised/derecognised on the date the Group commits to purchase/sell the investments or they expire.
g. Derivative financial instruments
Derivative financial instruments are recognised initially at fair value. Subsequent to initial recognition, the fair value is
remeasured. The gain or loss on remeasurement to fair value is recognised immediately in the consolidated income statement.
However, where derivatives qualify for hedge accounting, recognition of any resultant gain or loss depends on the nature of
the item being hedged.
h. Hedging
i. Fair value hedge
A fair value hedge is a hedge of the exposure to changes in fair value of a recognised asset or liability or an
unrecognised firm commitment, or an identified portion of such an asset, liability or firm commitment, that is attributable
to a particular risk and could affect the consolidated income statement. The gain or loss from remeasuring the hedging
instrument at fair value together with the gain or loss on the hedged item attributable to the hedged risk are recorded
in the consolidated income statement.

133The Wharf (Holdings) Limited Annual Report 2009
ii. Cash flow hedge
Where a derivative financial instrument is designated as a hedge of the variability in cash flows of a recognised asset
or liability or a highly probable forecast transaction or the foreign currency risk of a committed future transaction, the
effective portion of any gain or loss on remeasurement of the derivative financial instrument to fair value is recognised
directly in other comprehensive income and accumulated separately in equity. The ineffective portion of any gain or loss
is recognised immediately in the consolidated income statement.
If a hedge of a forecast transaction subsequently results in the recognition of a non-financial asset or non-financial
liability, the associated gain or loss is reclassified from equity to be included in the initial cost or other carrying amount
of the non-financial asset or liability.
If a hedge of a forecast transaction subsequently results in the recognition of a financial asset or a financial liability, the
associated gain or loss is reclassified from equity to the consolidated income statement in the same period or periods
during which the asset acquired or liability assumed affects the consolidated income statement (such as when interest
income or expense is recognised).
For cash flow hedges, other than those covered by the preceding two policy statements, the associated gain or loss is
reclassified from equity to the consolidated income statement in the same period or periods during which the hedged
forecast transaction affects the consolidated income statement.
When a hedging instrument expires or is sold, terminated or exercised, or the entity revokes designation of the hedge
relationship but the hedged forecast transaction is still expected to occur, the cumulative gain or loss at that point
remains in equity until the transaction occurs and it is recognised in accordance with the above policy. If the hedged
transaction is no longer expected to take place, the cumulative unrealised gain or loss is reclassified from equity to the
consolidated income statement immediately.
iii. Hedge of net investment in a foreign operation
The portion of the gain or loss on remeasurement to fair value of an instrument used to hedge a net investment in
a foreign operation that is determined to be an effective hedge is recognised directly in other comprehensive income
and accumulated separately in equity in the exchange reserve until the disposal of the foreign operation, at which time
the cumulative gain or loss is reclassified from equity to the consolidated income statement. The ineffective portion is
recognised immediately in the consolidated income statement.

134The Wharf (Holdings) Limited Annual Report 2009
Principal Accounting Policies
i. Leased assets
An arrangement comprising a transaction or a series of transactions is or contains a lease if the Group determines that the
arrangement conveys a right to use a specific asset or assets for an agreed period of time in return for a payment or a series
of payments. Such a determination is made based on an evaluation of the substance of the arrangement and is regardless of
whether the arrangement takes the legal form of a lease.
i. Classification of leased assets
Assets that are held by the Group under leases which transfer to the Group substantially all the risks and rewards of
ownership are classified as being held under finance leases. Leases which do not transfer substantially all the risks and
rewards of ownership to the Group are classified as operating leases, with the following exceptions:
– property held under operating leases that would otherwise meet the definition of an investment property is
classified as an investment property on a property-by-property basis and, if classified as an investment property,
is accounted for as if held under a finance lease (see note (d)(i)); and
– land held for own use under an operating lease, the fair value of which cannot be measured separately from the
fair value of a building situated thereon at the inception of the lease, is accounted for as being held under a
finance lease, unless the building is also clearly held under an operating lease. For these purposes, the inception
of the lease is the time that the lease was first entered into by the Group, or taken over from the previous lessee.
ii. Assets held under operating leases
(a) Where the Group has the use of assets held under operating leases, payments made under the leases are charged
to the consolidated income statement in equal instalments over the accounting periods covered by the lease term,
except where an alternative basis is more representative of the pattern of benefits to be derived from the leased
asset. Lease incentives received are recognised in the consolidated income statement as an integral part of the
aggregate net lease payments made. Contingent rentals are charged to the consolidated income statement in the
accounting period in which they are incurred.
(b) The cost of acquiring land held under an operating lease is recognised as interest in leasehold land in the
statement of financial position and amortised on a straight line basis over the period of the lease term except
where the property is classified as an investment property (see note (d)(i)) or is held for development for sale
(see note l(i)).
iii. Assets held under finance leases
Where the Group acquires the use of assets under finance leases, the amounts representing the fair value of the leased
asset, or, if lower, the present value of the minimum lease payments, of such assets are included in fixed assets and
the corresponding liabilities, net of finance charges, are recorded as obligations under finance leases. Depreciation is
provided at rates which write off the cost or valuation of the assets over the term of the relevant lease or, where it
is likely the Group will obtain ownership of the asset, the life of the asset, as set out in note (e). Impairment losses
are accounted for in accordance with the accounting policy as set out in note (k). Finance charges implicit in the
lease payments are charged to the consolidated income statement over the period of the leases so as to produce
an approximately constant periodic rate of charge on the remaining balance of the obligations for each accounting
period. Contingent rentals are charged to the consolidated income statement in the accounting period in which they are
incurred.
135The Wharf (Holdings) Limited Annual Report 2009
j. Programming library
Programming library consists of presentation rights for commissioned programmes and acquired programmes for showing on
the Group’s television channels, and commissioned programmes and films for licensing purposes.
Presentation rights are stated in the statement of financial position at cost less accumulated amortisation (where the estimated
useful life is other than indefinite) and any impairment losses. Amortisation is charged to profit or loss on an accelerated basis
over the licence period or over the estimated number of future showings. Subsequent expenditure on programmes after initial
acquisition is recognised as an expense when incurred. Cost of in-house programmes are written-off in the period in which
they are incurred.
Commissioned programmes and films for licensing purposes comprise direct production costs and production overheads, and
are stated at the lower of amortised cost or net realisable value. Costs are amortised on an individual programme/film basis in
the ratio of the current year’s gross revenues to management’s forecast of the total ultimate gross revenues from all sources.
Both the period and method of amortisation are reviewed annually.
k. Impairment of assets
i. Impairment of investments in debt and equity securities and other receivables
Investments in debt and equity securities (other than investments in subsidiaries) and other current and non-current
receivables that are stated at cost or amortised cost or are classified as available-for-sale investments are reviewed at
each of the end of reporting date to determine whether there is objective evidence of impairment. If any such evidence
exists, any impairment loss is determined and recognised as follows:
– For investments in associates and jointly controlled entities recognised using the equity method (see note (c)(ii)),
the impairment loss is measured by comparing the recoverable amount of the investment as a whole with its
carrying amount in accordance with note (k)(ii). The impairment loss is reversed if there has been a favourable
change in the estimates used to determine the recoverable amount in accordance with note (k)(ii).
– For unquoted equity securities carried at cost, the impairment loss is measured as the difference between the
carrying amount of the financial asset and the estimated future cash flows, discounted at the current market rate
of return for a similar financial asset where the effect of discounting is material. Impairment losses arising on
equity securities carried at cost are not reversed (including those provided during the interim financial reporting).
– For trade and other current receivables and other financial assets carried at amortised cost, the impairment loss
is measured as the difference between the asset’s carrying amount and the present value of estimated future cash
flows, discounted at the financial asset’s original effective interest rate (i.e. the effective interest rate computed at
initial recognition of these assets) where the effect of discounting is material.
If in a subsequent period the amount of an impairment loss decreases and the decrease can be linked objectively
to an event occurring after the impairment loss was recognised, the impairment loss is reversed through the
consolidated income statement. A reversal of an impairment loss shall not result in the asset’s carrying amount
exceeding that which would have been determined had no impairment loss been recognised in prior years.

136The Wharf (Holdings) Limited Annual Report 2009
Principal Accounting Policies
– For available-for-sale investments, the cumulative loss that has been recognised directly in investments revaluation
reserve is reclassified to the consolidated income statement. The amount of the cumulative loss that is recognised
in the consolidated income statement is the difference between the acquisition cost (net of any principal
repayment and amortisation) and current fair value, less any impairment loss on that asset previously recognised
in the consolidated income statement.
Impairment losses recognised in the consolidated income statement in respect of available-for-sale equity
investments are not reversed through the consolidated income statement. Any subsequent increase in the fair
value of such assets is recognised directly in other comprehensive income.
Impairment losses are written off against the corresponding assets directly, except for impairment losses recognised in
respect of trade receivables whose recovery is considered doubtful but not remote. In this case, the impairment losses
for doubtful debts are recorded using an allowance account. When the Group is satisfied that recovery is remote, the
amount considered irrecoverable is written off against trade receivables directly and any amounts held in the allowance
account relating to that debt are reversed. Subsequent recoveries of amounts previously charged to the allowance
account are reversed against the allowance account. Other changes in the allowance account and subsequent recoveries
of amounts previously written off directly are recognised in the consolidated income statement.
ii. Impairment of other assets
The carrying amounts of non-current assets, other than properties carried at revalued amounts and deferred tax assets,
are reviewed at the end of each reporting date to determine whether there is any indication of impairment. If any such
indication exists, the recoverable amount is estimated. In addition, for goodwill, intangible assets that are not yet
available for use and intangible assets that have indefinite useful lives, the recoverable amount is estimated annually
whether or not there is any indication of impairment.
– Recoverable amount
The recoverable amount of an asset is the greater of its fair value less costs to sell and value in use. In assessing
value in use, the estimated future cash flows are discounted to their present value using a pre-tax discount rate
that reflects current market assessments of the time value of money and the risks specific to the asset. Where
an asset does not generate cash inflows largely independent of those from other assets, the recoverable amount
is determined for the smallest group of assets that generates cash inflows independently (i.e. a cash-generating
unit).
– Recognition of impairment losses
An impairment loss is recognised as an expense in the consolidated income statement whenever the carrying
amount exceeds the recoverable amount. Impairment losses recognised in respect of cash-generating units are
allocated first to reduce the carrying amount of any goodwill allocated to the cash-generating unit (or group of
units) and then, to reduce the carrying amount of the other assets in the unit (or group of units) on a pro rata
basis, except that the carrying value of an asset will not be reduced below its individual fair value less costs to
sell, or value in use, if determinable.

137The Wharf (Holdings) Limited Annual Report 2009
– Reversals of impairment losses
In respect of assets other than goodwill, an impairment loss is reversed if there has been a favourable change
in the estimates used to determine the recoverable amount. An impairment loss in respect of goodwill is not
reversed (including those provided during the interim financial reporting).
A reversal of an impairment loss is limited to the asset’s carrying amount that would have been determined had
no impairment loss been recognised in prior years. Reversals of impairment losses are credited to the consolidated
income statement in the year in which the reversals are recognised.
– Interim financial reporting and impairment
Under the Rules Governing the Listing of Securities on The Stock Exchange of Hong Kong Limited, the Group
is required to prepare an interim financial report in compliance with HKAS 34, Interim financial reporting, in
respect of the first six months of the financial year. At the end of the interim period, the Group applies the same
impairment testing, recognition, and reversal criteria as it would at the end of the financial year.
Impairment losses recognised in an interim period in respect of goodwill, available-for-sale equity securities and
unquoted equity securities carried at cost are not reversed in a subsequent period. This is the case even if no
loss, or a smaller loss, would have been recognised has the impairment been assessed only at the end of the
financial year to which the interim period relates. Consequently, if the fair value of an available-for-sale equity
security increases in the remainder of the annual period, or in any other period subsequently, the increase is
recognised in other comprehensive income and not in the consolidated income statement.
l. Properties for sale
i. Completed properties for sale
Completed properties for sale are stated at the lower of cost and net realisable value. Cost is determined by
apportionment of the total development costs, including borrowing costs capitalised, attributable to unsold units. Net
realisable value is estimated by the management, based on prevailing market conditions which represents the estimated
selling price less costs to be incurred in selling the property. Cost of completed properties held for sale comprises
all costs of purchase, costs of conversion and costs incurred in bringing the inventories to their present location and
condition.
The amount of any write down of or provision for properties held for sale is recognised as an expense in the period the
write down or loss occurs. The amount of any reversal of any write down or provision arising from an increase in net
realisable value is recognised in the consolidated income statement in the period in which the reversal occurs.
ii. Properties under development for sale
Properties under development for sale are classified as current assets and stated at the lower of cost and net realisable
value. Cost includes identified costs including the acquisition cost of land, aggregate cost of development, borrowing
costs capitalised, material and supplies, wages, other direct expenses and an appropriate proportion of overheads. Net
realisable value is estimated by the management, taking into account the expected price that can ultimately be achieved,
based on prevailing market conditions and the anticipated costs of completion and costs to be incurred in selling the
property.
The amount of any write down of or provision for properties under development for sale is recognised as an expense
in the period the write down or loss occurs. The amount of any reversal of any write down or provision arising from an
increase in net realisable value is recognised in the consolidated income statement in the period in which the reversal
occurs.
138The Wharf (Holdings) Limited Annual Report 2009
Principal Accounting Policies
m. Inventories
Inventories are stated at the lower of cost and net realisable value. Cost comprises all costs of purchase, cost of conversion
and other costs incurred in bringing the inventories to their present location and condition. Net realisable value is estimated
by the management, based on the expected selling price in the ordinary course of business less the anticipated costs of
completion and the estimated costs necessary to make the sale.
n. Trade and other receivables
Trade and other receivables are initially recognised at fair value and thereafter stated at amortised cost less allowance for
impairment of bad and doubtful debts, except where the receivables are interest-free loans made to related parties without
any fixed repayment terms or the effect of discounting would be immaterial. In such cases, the receivables are stated at cost
less allowance for impairment of bad and doubtful debts.
o. Interest-bearing borrowings
Interest-bearing borrowings for which there is a hedging relationship with a derivative financial instrument, which does not
qualify for hedge accounting are initially recognised at fair value less transaction costs. At the end of each reporting date the
fair value is remeasured and any change in fair value is recognised in the consolidated income statement.
Other interest-bearing borrowings are initially recognised at fair value less transaction costs. Subsequent to initial recognition,
the interest-bearing borrowings are stated at amortised cost with any difference between the amount initially recognised and
redemption value being recognised in the consolidated income statement over the period of the borrowings together with any
interest and fees payable using the effective interest method.
p. Trade and other payables
Trade and other payables are initially recognised at fair value and subsequently stated at amortised cost unless the effect of
discounting would be immaterial, in which case they are stated at cost.
q. Cash and cash equivalents
Cash and cash equivalents comprise cash at bank and on hand, demand deposits with banks and other financial institutions,
and short-term, highly liquid investments that are readily convertible into known amounts of cash and which are subject to
an insignificant risk of changes in value, having been within three months of maturity at acquisition. Bank overdrafts that are
repayable on demand and form an integral part of the Group’s cash management are also included as a component of cash
and cash equivalents for the purpose of the consolidated statement of cash flows.
r. Foreign currencies
Foreign currency transactions during the year are translated into Hong Kong dollars at the exchange rates ruling at the
transaction dates. Monetary foreign currency balances and the statements of financial position of foreign operations are
translated into Hong Kong dollars at the exchange rates ruling at the end of reporting date. The income statement of foreign
operations subsidiaries are translated into Hong Kong dollars at the monthly weighted average exchange rates for the year.
Differences arising from the translation of the financial statements of foreign operations are recognised in other comprehensive
income and accumulated separately in equity in the exchange reserve and those arising from the financing of properties under
development by foreign currency borrowings are capitalised as part of the development costs. All other exchange differences
are dealt with in the consolidated income statement. On disposal of a foreign operation, the cumulative amount of the
exchange differences recognised in equity which relate to that foreign operation is reclassified from equity to the consolidated
income statement and is included in the calculation of the profit or loss on disposal. Non-monetary assets and liabilities
denominated in foreign currencies that are stated at fair value are translated using the foreign exchange rates ruling at the
dates the fair value was determined.
139The Wharf (Holdings) Limited Annual Report 2009
s. Recognition of revenue
Revenue is measured at the fair value of the consideration received or receivable. Provided it is probable that the economic
benefits will flow to the Group and the revenue and costs, if applicable, can be measured reliably, revenue is recognised in the
consolidated income statement as follows:
i. Rental income under operating leases is recognised in equal instalments over the accounting periods covered by the
lease term, except where an alternative basis is more representative of the pattern of benefits to be derived from the
use of the leased asset. Lease incentives granted are recognised as an integral part of the aggregate net lease payments
receivable. Contingent rentals are recognised in the accounting period in which they are earned.
ii. Income arising from the sale of properties held for sale is recognised upon the later of the execution of the formal
sale and purchase agreement and the issue of occupation permit/completion certificate by the relevant government
authorities, which is taken to be the point in time when the risks and rewards of ownership of the property have passed
to the buyer. Deposits and instalments received on properties sold prior to the date of revenue recognition are included
in the statement of financial position under rental and customer deposits.
iii. Income from communications, media and entertainment operations, logistics operations and hotels operations is
recognised at the time when the services are provided.
iv. Dividend income from unlisted investments is recognised when the shareholder’s right to receive payment is established.
Dividend income from listed investments is recognised when the share price of the investment goes ex-dividend.
v. Interest income is recognised as it accrues using the effective interest method.
vi. Deferred revenue
Income received in advance attributable to long term service contracts is deferred and recognised over the contract
period on a straight line basis.
t. Borrowing costs
Borrowing costs that are directly attributable to the acquisition, construction or production of an asset which necessarily takes
a substantial period of time to get ready for its intended use or sale are capitalised as part of the cost of that asset. Other
borrowing costs are expensed in the period in which they incurred.
The capitalisation of borrowing costs as part of the cost of a qualifying asset commences when expenditure for the asset is
being incurred, borrowing costs are being incurred and activities that are necessary to prepare the asset for its intended use or
sale are in progress. Capitalisation of borrowing costs is suspended or ceases when substantially all the activities necessary to
prepare the qualifying asset for its intended use or sale are interrupted or complete.

140The Wharf (Holdings) Limited Annual Report 2009
Principal Accounting Policies
u. Income tax
i. Income tax for the year comprises current tax and movements in deferred tax assets and liabilities. Current tax and
movements in deferred tax assets and liabilities are recognised in the consolidated income statement except to the
extent that they relate to items recognised in other comprehensive income or directly in equity, in which case the
relevant amounts of tax are recognised in other comprehensive income or directly in equity, respectively.
ii. Current tax is the expected tax payable on the taxable income for the year, using tax rates enacted or substantively
enacted at the end of reporting date, and any adjustment to tax payable in respect of previous years.
iii. Deferred tax assets and liabilities arise from deductible and taxable temporary differences between the carrying amounts
of assets and liabilities for financial reporting purposes and the tax bases respectively. Deferred tax assets also arise
from unused tax losses and unused tax credits.
Apart from certain limited exceptions, all deferred tax liabilities and all deferred tax assets, to the extent that it is
probable that future taxable profits will be available against which the asset can be utilised, are recognised. Future
taxable profits that may be capable to support the recognition of deferred tax assets arising from deductible temporary
differences include those that will arise from the reversal of existing taxable temporary differences.
The limited exceptions to recognition of deferred tax assets and liabilities are those temporary differences arising from
goodwill not deductible for tax purposes and the initial recognition of assets or liabilities that affect neither accounting
nor taxable profit (provided that they are not part of a business combination).
The amount of deferred tax recognised is measured based on the expected manner of realisation or settlement of the
carrying amount of the assets and liabilities, using tax rates enacted or substantively enacted at the end of reporting
date. Deferred tax assets and liabilities are not discounted.
The carrying amount of a deferred tax asset is reviewed at each of reporting date and is reduced to the extent that it
is no longer probable that sufficient taxable profits will be available to allow the related tax benefit to be utilised. Any
such reduction is reversed to the extent that it becomes probable that sufficient taxable profits will be available.
Additional income taxes that arise from the distribution of dividends are recognised when the liability to pay the related
dividends is recognised.
iv. Current tax balances and deferred tax balances, and movements therein, are presented separately from each other and
are not offset. Current tax assets are offset against current tax liabilities, and deferred tax assets against deferred tax
liabilities if, and only if, the Group has the legally enforceable right to set off current tax assets against current tax
liabilities.
v. Related parties
For the purposes of these financial statements, a party is considered to be related to the Group if:
i. the party has the ability, directly or indirectly through one or more intermediaries, to control the Group or exercise
significant influence over the Group in making financial and operating policy decisions, or has joint control over the
Group;
ii. the Group and the party are subject to common control;
iii. the party is an associate of the Group or a joint venture in which the Group is a venturer;

141The Wharf (Holdings) Limited Annual Report 2009
iv. the party is a member of key management personnel of the Group or the Group’s parent, or a close family member of
such an individual, or is an entity under the control, joint control or significant influence of such individuals;
v. the party is a close family member of a party referred to in (i) or is an entity under the control, joint control or significant
influence of such individuals; or
vi. the party is a post-employment benefit plan which is for the benefit of employees of the Group or of any entity that is a
related party of the Group.
w. Financial guarantees issued, provisions and contingent liabilities
i. Financial guarantees issued
Financial guarantees are contracts that require the issuer (i.e. the guarantor) to make specified payments to reimburse
the beneficiary of the guarantee (the “holder”) for a loss the holder incurs because a specified debtor fails to make
payment when due in accordance with the terms of a debt instrument.
Where the Group issues a financial guarantee, the fair value of the guarantee (being the transaction price, unless the fair
value can otherwise be reliably estimated) is initially recognised as deferred income within trade and other payables.
Where consideration is received or receivable for the issuance of the guarantee, the consideration is recognised in
accordance with the Group’s policies applicable to that category of asset. Where no such consideration is received or
receivable, an immediate expense is recognised in profit or loss on initial recognition of any deferred income.
ii. Other provisions and contingent liabilities
Provisions are recognised for other liabilities of uncertain timing or amount when the Group or the Company has a legal
or constructive obligation arising as a result of a past event, it is probable that an outflow of economic benefits will
be required to settle the obligation and a reliable estimate can be made. Where the time value of money is material,
provisions are stated at the present value of the expenditure expected to settle the obligation.
Where it is not probable that an outflow of economic benefits will be required, or the amount cannot be estimated
reliably, the obligation is disclosed as a contingent liability, unless the probability of outflow of economic benefits is
remote. Possible obligations, whose existence will only be confirmed by the occurrence or non-occurrence of one or
more future events are also disclosed as contingent liabilities unless the probability of outflow of economic benefits is
remote.
x. Segment reporting
Operating segments, and the amounts of each segment item reported in the financial statements, are identified from the
financial information provided regularly to the Group’s top management for the purposes of allocating resources to, and
assessing the performance of, the Group’s various lines of business and geographical locations.
Individually material operating segments are not aggregated for financial reporting purposes unless the segments have similar
economic characteristics and are similar in respect of the nature of products and services, the nature of production processes,
the type or class of customers, the methods used to distribute the products or provide the services, and the nature of the
regulatory environment. Operating segments which are not individually material may be aggregated if they share a majority of
these criteria.

142The Wharf (Holdings) Limited Annual Report 2009
Principal Accounting Policies
y. Employee benefits
i. Defined benefit pension schemes
The Group’s net obligation in respect of defined benefit pension schemes is calculated separately for each scheme by
estimating the amount of future benefit that employees have earned in return for their service in the current and prior
periods; that benefit is discounted to determine the present value and the fair value of any scheme assets is deducted.
The discount rate is the yield at the end of the reporting date on high quality corporate bonds that have maturity dates
approximating the terms of the Group’s obligations. The calculation is performed using the projected unit credit method.
When the benefits of a scheme are improved, the portion of the increased benefit relating to past service by employees
is recognised as an expense in the consolidated income statement on a straight-line basis over the average period until
the benefits become vested. If the benefits vest immediately, the expense is recognised immediately in the consolidated
income statement.
Any actuarial gains and losses are fully recognised in other comprehensive income in the period they occur.
Where the calculation of the Group’s net obligation results in a negative amount, the asset recognised is limited to
the present value of any future refunds from the scheme or reductions in future contributions to the scheme less past
service cost.
ii. Shared based payments
The fair value of share options granted to employees is recognised as an employee cost with a corresponding increase
in a capital reserve within equity. The fair value is measured at grant date using the Black-Scholes option-pricing model,
taking into account the terms and conditions upon which the options were granted. Where the employees have to meet
vesting conditions before becoming unconditionally entitled to the options, the total estimated fair value of the share
options is spread over the vesting period, taking into account the probability that the options will vest.
During the vesting period, the number of share options that is expected to vest is reviewed. Any resulting adjustment
to the cumulative fair value recognised in prior years is charged/credited to the consolidated income statement for the
year of the review, unless the original employee expenses qualify for recognition as an asset, with a corresponding
adjustment to the capital reserve. On vesting date, the amount recognised as an expense is adjusted to reflect the
actual number of options that vest (with a corresponding adjustment to the capital reserve) except where forfeiture is
only due to not achieving vesting conditions that relate to the market price of the Company’s shares. The equity amount
is recognised in the capital reserve until either the option is exercised (when it is transferred to the share premium
account) or the option expires (when it is released directly to revenue reserves).
iii. Short term employee benefits and contributions to defined contribution retirement plans
Salaries, annual bonuses, paid annual leave, leave passage, contributions to defined contribution retirement plans and
the cost of non-monetary benefits are accrued in the year in which the associated services are rendered by employees of
the Group. Where payment or settlement is deferred and the effect would be material, these amounts are stated at their
present values.

143The Wharf (Holdings) Limited Annual Report 2009
z. Significant accounting estimates and judgements
Key sources of estimation uncertainty
Notes 18 and 27 contain information about the assumptions and their risk relating to defined benefit retirement obligations
and financial instruments. Other key sources of estimation uncertainty are as follows:
– Valuation of investment properties
Investment properties are included in the statement of financial position at their market value, unless they are still in the
course of construction or development at the end of reporting date and their fair value cannot be reliably determined at
that time. The market value of investment properties is assessed annually by independent qualified valuers, after taking
into consideration the net income allowing for reversionary potential.
The assumptions adopted in the property valuations are based on the market conditions existing at the end of reporting
date, with reference to current market sales prices and the appropriate capitalisation rate.
– Assessment of useful economic lives for depreciation of fixed assets
In assessing the estimated useful lives of fixed assets, management takes into account factors such as the expected
usage of the asset by the Group based on past experience, the expected physical wear and tear (which depends on
operational factors), technical obsolescence arising from changes or improvements in production or from a change in the
market demand for the product or service output of the asset. The estimation of the useful life is a matter of judgement
based on the experience of the Group.
Management reviews the useful lives of fixed assets annually, and if expectations are significantly different from previous
estimates of useful economic lives, the useful lives and, therefore, the depreciation rate for the future periods will be
adjusted accordingly.
– Assessment of impairment of non-current assets
Management assesses the recoverable amount of each asset based on its value in use (using relevant rates) or on its
net selling price (by reference to market prices), depending upon the anticipated future plans for the asset. Estimating
the value in use of an asset involves estimating the future cash inflows and outflows to be derived from continuing use
of the asset and from its ultimate disposal and applying the appropriate discount rate to these future cash flows. Cash
flow projections for remaining useful life of the asset and the most recent financial budgets/forecasts are approved by
management.
– Assessment of provision for properties held under development and for sale
Management determines the net realisable value of properties held for sale by using (i) prevailing market data such as
most recent sale transactions and market survey reports available from independent property valuers; and (ii) internal
estimates of costs based on quotes by suppliers.
Management’s assessment of net realisable value of properties under development for sale requires the application
of a risk-adjusted discount rate to estimate future discounted cash flows to be derived from the properties under
development for sale. These estimates require judgement as to the anticipated sale prices by reference to recent sale
transactions in nearby locations, rate of new property sales, marketing costs (including price discounts required to
stimulate sales) and the expected costs to completion of properties, the legal and regulatory framework and general
market conditions. The Group’s estimates may be inaccurate, and estimates may need to be adjusted in later periods.
– Recognition of deferred tax assets
The recognition of deferred tax assets requires formal assessment by the Group of the future profitability of related
operations. In making this judgement, the Group evaluates, amongst other factors, the forecast financial performance,
changes in technology and operational and financing cashflows.

144The Wharf (Holdings) Limited Annual Report 2009
Principal Subsidiaries, Associates andJointly Controlled EntitiesAt 31 December 2009
Issued ordinary
share capital Percentage
Place of (except otherwise of equity
incorporation/ stated)/registered attributable
Subsidiaries operation and paid up capital to the Group Principal activities
Properties# Wharf Estates Limited Hong Kong 2 HK$1 shares 100 Holding company
Harbour City Estates Limited Hong Kong 20,000 HK$10 shares 100 Property
Wharf Realty Limited Hong Kong 2 HK$1 shares 100 Property
Times Square Limited Hong Kong 2 HK$10 shares 100 Property
Plaza Hollywood Limited Hong Kong 10,000 HK$1 shares 100 Property
# Wharf Development Limited (formerly Wharf Estates Development limited) Hong Kong 2 HK$1 shares 100 Holding company
# Wharf China Holdings Limited British Virgin Islands 2,564,102,500 US$1 shares 100 Holding company
Wharf China Estates Limited British Virgin Islands 500 US$1 shares 100 Holding companyiii Shanghai Long Xing Property Development Company Limited The People’s Republic of China US$45,000,000 100 Propertyii Dalian Times Square Development Company Limited The People’s Republic of China RMB420,000,000 100 Propertyii Long Qing Property Development (Chongqing) Company Limited The People’s Republic of China RMB194,000,000 100 Propertyi Shanghai Wheelock Square Development Limited The People’s Republic of China US$179,900,000 98 Propertyii 龍昌綜合開發(成都)有限公司 The People’s Republic of China HK$330,000,000 100 Propertyii 龍錦綜合開發(成都)有限公司 The People’s Republic of China US$387,593,812 100 PropertyIi 成都時代奧特萊斯商業有限公司 The People’s Republic of China HK$170,000,000 100 Property
Wharf China Development Limited (formerly Wharf Estates China Limited) British Virgin Islands 500 US$1 shares 100 Holding companyii Han Long Development (Wuhan) Company Limited The People’s Republic of China US$33,100,000 100 Propertyiii Shanghai Jiu Zhou Property Development Company Limited The People’s Republic of China US$30,000,000 85 Propertyi Shanghai Long Shen Real Estate Development Company Limited The People’s Republic of China US$22,330,000 55 Propertyii Wharf Estates (Wuxi) Company Limited The People’s Republic of China US$192,580,000 100 Propertyii 龍茂房地產開發(成都)有限公司 The People’s Republic of China HK$750,000,000 100 Propertyii 龍潤房地產開發(成都)有限公司 The People’s Republic of China HK$820,000,000 100 Propertyii 蘇州蘇龍地產發展有限公司 The People’s Republic of China US$166,800,000 100 Propertyii 無錫港龍置業有限公司 The People’s Republic of China US$105,400,000 100 Propertyii 無錫河畔置業有限公司 The People’s Republic of China US$84,700,000 100 Propertyii 港盈房地產(杭州)有限公司 The People’s Republic of China US$99,990,000 100 Propertyii 九龍倉(杭州)置業有限公司 The People’s Republic of China US$99,980,000 100 Property
* Harbour Centre Development Limited Hong Kong 708,750,000 HK$0.5 shares 70 Holding companyi 蘇州高龍房產發展有限公司 The People’s Republic of China RMB3,097,596,772 56 Propertyii 九龍倉(常州)置業有限公司 The People’s Republic of China US$229,800,000 70 Propertyii 上海綠源房地產開發有限公司 The People’s Republic of China RMB770,000,000 70 Property

145The Wharf (Holdings) Limited Annual Report 2009
Issued ordinary
share capital Percentage
Place of (except otherwise of equity
incorporation/ stated)/registered attributable
Subsidiaries operation and paid up capital to the Group Principal activities
Logistics
Wharf Transport Investments Limited Hong Kong 2 HK$1 shares 100 Holding company
The “Star” Ferry Company, Limited Hong Kong 1,440,000 HK$5 shares 100 Public transport
Modern Terminals Limited Hong Kong 70,116 HK$1,000 shares 68 Container terminali Shenzhen Dachan Bay Modern Port Development Company, Limited The People’s Republic of China RMB2,475,550,000 44 Container terminali Suzhou Modern Terminals Limited The People’s Republic of China RMB822,500,000 48 Container terminal
Hotels# Marco Polo Hotels Limited Cayman Islands 500,000,000 US$1 shares 100 Holding company
Marco Polo Hotels Management Limited Hong Kong 2 HK$10 shares 100 Hotel management
The Hongkong Hotel Limited Hong Kong 100,000 HK$1 shares 70 Hotel and property
The Marco Polo Hotel (Hong Kong) Limited Hong Kong 1,000 HK$1 shares 100 Hotel operation
The Prince Hotel Limited Hong Kong 2 HK$1 shares 100 Hotel operationii Wuhan Marco Polo Hotels Company Limited The People’s Republic of China US$3,850,000 100 Hotel management
CME# Wharf Communications Limited Hong Kong 1,000,000 HK$10 shares 100 Holding company
* i-CABLE Communications Limited Hong Kong 2,011,512,400 HK$1 shares 74 Holding company
Hong Kong Cable Enterprises Limited Hong Kong 2 HK$1 shares 74 Advertising airtime
and programming
licensing
Hong Kong Cable Television Limited Hong Kong 750,000,000 HK$1 shares 74 Pay television and
internet and
multimedia
i-CABLE Entertainment Limited Hong Kong 10,000,000 HK$1 shares 74 Programme
production and
channel operation
i-CABLE News Limited Hong Kong 10,000,000 HK$1 shares 74 Programme
production and
channel operation
i-CABLE Sports Limited Hong Kong 10,000,000 HK$1 shares 74 Programme
production and
channel operation
i-CABLE Network Limited Hong Kong 100 HK$1 shares 74 Network operation
2 HK$1 non-voting deferred shares
i-CABLE Network Operations Limited Hong Kong 500,000 HK$1 shares 74 Network operation
Sundream Motion Pictures Limited Hong Kong 10,000,000 HK$1 shares 74 Film production
Wharf T&T Limited Hong Kong 100,000,000 HK$1 shares 100 Telecommunication
EC Telecom Limited Hong Kong 2 HK$1 shares 100 Telecommunication
COL Limited Hong Kong 40,000 HK$500 shares 100 Computer services

146The Wharf (Holdings) Limited Annual Report 2009
Principal Subsidiaries, Associates and Jointly Controlled EntitiesAt 31 December 2009
Issued ordinary
share capital Percentage
Place of (except otherwise of equity
incorporation/ stated)/registered attributable
Subsidiaries operation and paid up capital to the Group Principal activities
Investment and others
Wharf Limited Hong Kong 2 HK$10 shares 100 Management services
Wharf Finance Limited Hong Kong 2 HK$1 shares 100 Finance
Wharf Finance (BVI) Limited British Virgin Islands 500 US$1 shares 100 Finance# Wharf Hong Kong Limited Cayman Islands 500,000,000 US$1 shares 100 Holding company
Wharf China Finance Limited Hong Kong 5,000,000 HK$1 shares 100 Finance
Wharf Finance (No.1) Limited Hong Kong 2 HK$1 shares 100 Finance
Wharf Finance (BVI) No. 1 Limited British Virgin Islands 500 US$1 shares 100 Finance
Percentage
Place of of equity
incorporation/ attributable
Associates operation Class of shares to the Group Principal activities
Logistics
Mega Shekou Container Terminals Limited British Virgin Islands Ordinary 17 Holding company
Properties
蘇州雙湖房地產有限公司 The People’s Republic of China Ordinary 50 Property
天津港威房地產開發有限公司 The People’s Republic of China Ordinary 50 Property

147The Wharf (Holdings) Limited Annual Report 2009
Percentage
of equity
attributable
Jointly controlled entities Place of incorporation/operation Class of shares to the Group Principal activities
Properties
Elite Mind International Limited Hong Kong Ordinary 40 Holding company
Show All Limited Hong Kong Ordinary 50 Holding company
Tartar Investments Limited British Virgin Islands Ordinary 30 Holding company
Speedy Champ Investments Limited Hong Kong Ordinary 39 Holding company
Empire Land Investments Limited Hong Kong Ordinary 50 Holding company
重慶嘉江房地產開發有限公司 The People’s Republic of China Ordinary 40 Property
浙江金盈置業有限公司 The People’s Republic of China Ordinary 50 Property
無錫都會置業有限公司 The People’s Republic of China Ordinary 50 Property
祥寶投資(成都)有限公司 The People’s Republic of China Ordinary 30 Property
重慶豐盈房地產開發有限公司 The People’s Republic of China Ordinary 39 Property
重慶嘉益房地產開發有限公司 The People’s Republic of China Ordinary 50 Property
Logistics
Taicang International Container Terminals Company Limited The People’s Republic of China Ordinary 34 Container terminal
Notes:
(a) All the subsidiaries listed above were, as at 31 December 2009, indirect subsidiaries of the Company except where marked #.
(b) The above list gives the principal subsidiaries, associates and jointly controlled entities of the Group which, in the opinion of the Directors,
principally affect the profit and assets of the Group.
# Subsidiaries held directly
* Listed companies
i This entity is registered as a sino-foreign joint venture company under PRC law
ii This entity is registered as a wholly foreign owned enterprise under PRC law
iii This entity is registered as a foreign owned enterprise under PRC law

148The Wharf (Holdings) Limited Annual Report 2009
Schedule of Principal PropertiesAs at 31 December 2009
Approximate Gross Floor Areas (sq. ft.)
Address Total Office Retail Residential Others (Remarks)
Investment Properties in Hong KongHarbour City, TsimshatsuiOcean Terminal 658,000 – 658,000 – – Ocean Centre 901,000 677,000 224,000 – – Wharf T&T Centre 257,000 257,000 – – – World Commerce Centre 257,000 257,000 – – – World Finance Centre 512,000 512,000 – – – Ocean Galleries 386,000 – 386,000 – – Gateway I 1,236,000 1,128,000 108,000 – – Gateway II 2,640,000 1,570,000 400,000 670,000 – The Marco Polo Hongkong Hotel (Commercial Section) 206,000 34,000 172,000 – –
Times SquareSharp Street East, Causeway Bay 1,969,000 1,033,000 936,000 – – OthersPlaza Hollywood, 3 Lung Poon Street, Diamond Hill 562,000 – 562,000 – – Wharf T&T Square, Hoi Bun Road, Kwun Tong 395,000 330,000 65,000 – – Delta House, 3 On Yiu Street, Shatin 349,000 349,000 – – – Units at Cable TV Tower, Hoi Shing Road, Tsuen Wan 566,000 – – – 566,000 (Industrial) Units at Strawberry Hill, 8 Plunkett’s Road, The Peak 13,000 – – 13,000 – 77 Peak Road, The Peak 32,000 – – 32,000 – Chelsea Court, 63 Mount Kellett Road, The Peak 43,000 – – 43,000 – Mountain Court, 11-13 Plantation Road, The Peak 49,900 – – 49,900 – 1 Plantation Road, The Peak 97,000 – – 97,000 – Cable TV Tower South, Chai Wan Kok Street, Tsuen Wan 585,000 – – – 585,000 (Industrial) Kowloon Godown, 1-5 Kai Hing Road, Kowloon Bay 924,000 – – 924,000 – Units at Star House, 3 Salisbury Road, Kowloon 50,800 – 50,800 – –
12,688,700 6,147,000 3,561,800 1,828,900 1,151,000
Investment Properties in ChinaShanghai Times Square 973,000 331,000 447,000 195,000* – 93-111 Huai Hai Zhong Road, ShanghaiShanghai Wheelock Square 1,228,000 1,149,000 79,000 – – 1717 Nan Jing Xi Road, Jingan District, ShanghaiChongqing Times Square 591,800 13,800 578,000 – – 100 Zou Rong Road, Yuzhong District, ChongqingWuhan Times Square 8,000 – 8,000 – – 160 Yan Jiang Da Dao, Jiangan District, WuhanDalian Times Square 188,000 – 188,000 – – 50 Ren Min Road, Zhongshan District, DalianChengdu Times Outlet 680,000 – 680,000 – – No. 633 Shuangnan Avenue (Middle Section) Shuangliu County, ChengduChengdu IFC 4,724,000 2,226,000 1,248,000 490,000 760,000 (Other represents a 304-room hotel) Junction of Hongxing Road and Da Ci Si Road, Jinjiang DistrictSuzhou Industrial Park Project Suzhou Super Tower, Xing Hu Jie 3,780,000 1,890,000 – 1,890,000 –
12,172,800 5,609,800 3,228,000 2,575,000 760,000

149The Wharf (Holdings) Limited Annual Report 2009
Effective Year of Equity Interest
Site Area Completion/Expected Stage of to the (Sq. ft.) Lot Number Lease Expiry Completion Completion Company
346,719 KPP 83 2012 1966 N/A 100%126,488 KML 11 S.A. 2880 1977 N/A 100%
(a) KML 11 S.B. 2880 1981 N/A 100%(a) KML 11 S.B. 2880 1981 N/A 100%(a) KML 11 S.D. 2880 1983 N/A 100%(a) KML 11 S.B. & D. 2880 1981 / 83 N/A 100%(a) KML 11 R.P. 2880 1994 N/A 100%(a) KML 11 S.B. & D. 2880 1998/ 99 N/A 100%(b) KML 91 S.A. & KML 10 S.B. 2863 1969 N/A 70%
112,441 IL 731, IL 728, IL 727, 2850/60/80 1993 N/A 100% IL 725 S.A. & R.P., IL 724 S.A., B & R.P., IL 722 & IL 718
280,510 NKIL 6160 2047 1997 N/A 100%48,438 KTIL 713 2047 1991 N/A 100%70,127 STTL 422 2047 1999 N/A 100%
N/A TWTL 218 2047 1992 N/A 100%N/A RBL 512 & 1004 2027/28 1974/77 N/A 100%
76,728 RBL 836 2029 1951 N/A 100%29,640 RBL 556 R.P.S.A. & S.B. 2035 2001 N/A 100%32,145 RBL 522, 639, 661 2027 2001 N/A 100%97,670 RBL 534 S.E. & S.F. 2028 2002 N/A 100%66,000 TWIL 36 2047 2012 Foundation completed 100%
165,809 NKIL 5805, 5806 & 5982 2047 N/A Planning stage 100%N/A KML 10 S.A. 2863 1966 N/A 70%
148,703 N/A 2043 1999 N/A 100%
136,432 N/A 2049 2010 Near to final completion 98%
95,799 N/A 2050 2004 N/A 100%
(c) N/A 2053 2008 N/A 100%
(d) N/A 2039 2008 N/A 100%
(e) N/A 2047 2009 N/A 100%
590,481 N/A 2047 2013 Excavation work in progress 100%
229,069 N/A 2047/77 2016 Planning stage 56%
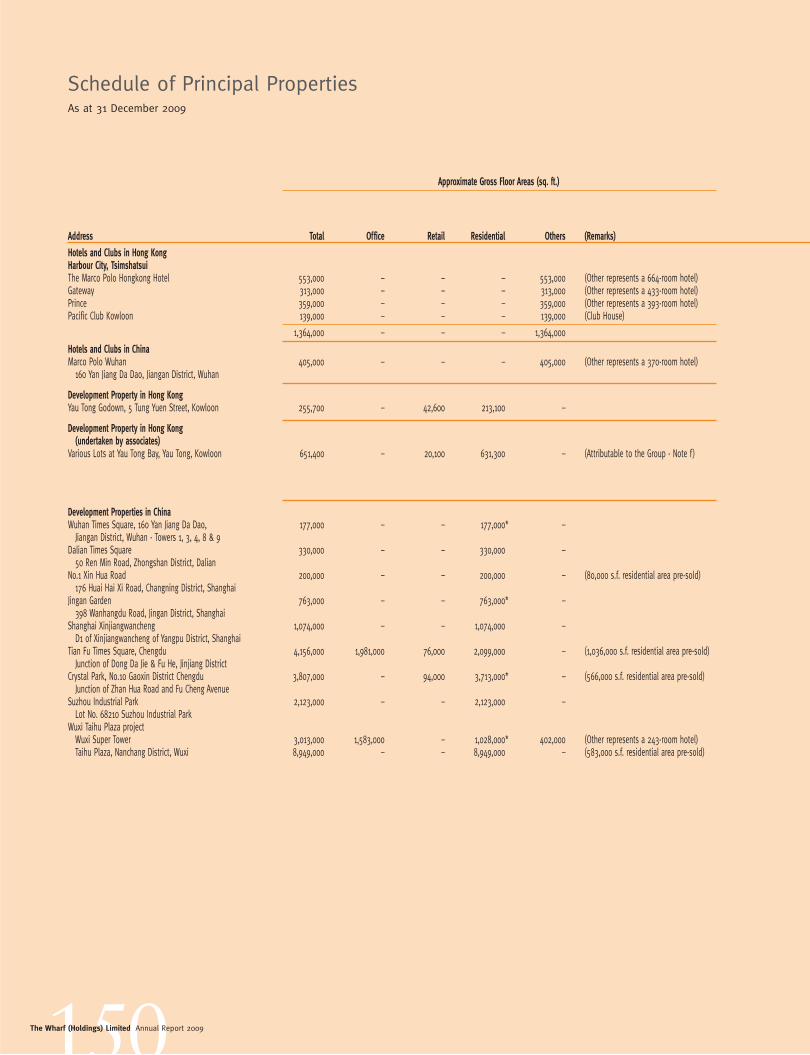
150The Wharf (Holdings) Limited Annual Report 2009
Schedule of Principal PropertiesAs at 31 December 2009
Approximate Gross Floor Areas (sq. ft.)
Address Total Office Retail Residential Others (Remarks)
Hotels and Clubs in Hong KongHarbour City, TsimshatsuiThe Marco Polo Hongkong Hotel 553,000 – – – 553,000 (Other represents a 664-room hotel) Gateway 313,000 – – – 313,000 (Other represents a 433-room hotel) Prince 359,000 – – – 359,000 (Other represents a 393-room hotel) Pacific Club Kowloon 139,000 – – – 139,000 (Club House)
1,364,000 – – – 1,364,000
Hotels and Clubs in ChinaMarco Polo Wuhan 405,000 – – – 405,000 (Other represents a 370-room hotel) 160 Yan Jiang Da Dao, Jiangan District, Wuhan
Development Property in Hong KongYau Tong Godown, 5 Tung Yuen Street, Kowloon 255,700 – 42,600 213,100 –
Development Property in Hong Kong (undertaken by associates)Various Lots at Yau Tong Bay, Yau Tong, Kowloon 651,400 – 20,100 631,300 – (Attributable to the Group - Note f )
Development Properties in ChinaWuhan Times Square, 160 Yan Jiang Da Dao, 177,000 – – 177,000* – Jiangan District, Wuhan - Towers 1, 3, 4, 8 & 9Dalian Times Square 330,000 – – 330,000 – 50 Ren Min Road, Zhongshan District, DalianNo.1 Xin Hua Road 200,000 – – 200,000 – (80,000 s.f. residential area pre-sold) 176 Huai Hai Xi Road, Changning District, ShanghaiJingan Garden 763,000 – – 763,000* – 398 Wanhangdu Road, Jingan District, Shanghai Shanghai Xinjiangwancheng 1,074,000 – – 1,074,000 – D1 of Xinjiangwancheng of Yangpu District, ShanghaiTian Fu Times Square, Chengdu 4,156,000 1,981,000 76,000 2,099,000 – (1,036,000 s.f. residential area pre-sold) Junction of Dong Da Jie & Fu He, Jinjiang DistrictCrystal Park, No.10 Gaoxin District Chengdu 3,807,000 – 94,000 3,713,000* – (566,000 s.f. residential area pre-sold) Junction of Zhan Hua Road and Fu Cheng AvenueSuzhou Industrial Park 2,123,000 – – 2,123,000 – Lot No. 68210 Suzhou Industrial ParkWuxi Taihu Plaza project Wuxi Super Tower 3,013,000 1,583,000 – 1,028,000* 402,000 (Other represents a 243-room hotel) Taihu Plaza, Nanchang District, Wuxi 8,949,000 – – 8,949,000 – (583,000 s.f. residential area pre-sold)

151The Wharf (Holdings) Limited Annual Report 2009
Approximate Gross Floor Areas (sq. ft.)
Effective Year of Equity Interest Site Area Completion/Expected Stage of to the Address Total Office Retail Residential Others (Remarks) (Sq. ft.) Lot Number Lease Expiry Completion Completion Company
Hotels and Clubs in Hong KongHarbour City, TsimshatsuiThe Marco Polo Hongkong Hotel 553,000 – – – 553,000 (Other represents a 664-room hotel) 58,814 KML 91 S.A. & KML 10 S.B. 2863 1969 N/A 70%Gateway 313,000 – – – 313,000 (Other represents a 433-room hotel) (a) KML 11 S.B. 2880 1981 N/A 100%Prince 359,000 – – – 359,000 (Other represents a 393-room hotel) (a) KML 11 S.D. 2880 1983 N/A 100%Pacific Club Kowloon 139,000 – – – 139,000 (Club House) 48,309 KIL 11179 2021 1990 N/A 100%
1,364,000 – – – 1,364,000
Hotels and Clubs in ChinaMarco Polo Wuhan 405,000 – – – 405,000 (Other represents a 370-room hotel) (c) N/A 2053 2008 N/A 100% 160 Yan Jiang Da Dao, Jiangan District, Wuhan
Development Property in Hong KongYau Tong Godown, 5 Tung Yuen Street, Kowloon 255,700 – 42,600 213,100 – 42,625 YTIL 4SA & adjoining Government land 2047 N/A Planning stage 100%
Development Property in Hong Kong (undertaken by associates)Various Lots at Yau Tong Bay, Yau Tong, Kowloon 651,400 – 20,100 631,300 – (Attributable to the Group - Note f ) 673,055 R.P. of YTML 22 & ext., YTML 28 & ext., 2047 N/A Planning stage 14.9% YTML 29 & ext., and YTML 12, 32 and 33 together with adjoining lots at Yau Tong Bay
Development Properties in ChinaWuhan Times Square, 160 Yan Jiang Da Dao, 177,000 – – 177,000* – (c) N/A 2053/73 2007/08 Completed 100% Jiangan District, Wuhan - Towers 1, 3, 4, 8 & 9Dalian Times Square 330,000 – – 330,000 – (d) N/A 2069 2009 Completed 100% 50 Ren Min Road, Zhongshan District, DalianNo.1 Xin Hua Road 200,000 – – 200,000 – (80,000 s.f. residential area pre-sold) 118,220 N/A 2070 2010 Superstructure in progress 85% 176 Huai Hai Xi Road, Changning District, ShanghaiJingan Garden 763,000 – – 763,000* – 170,825 N/A 2043/63 2013 Planning stage 55% 398 Wanhangdu Road, Jingan District, Shanghai Shanghai Xinjiangwancheng 1,074,000 – – 1,074,000 – 638,000 N/A 2077 2012 Superstructure in progress 70% D1 of Xinjiangwancheng of Yangpu District, ShanghaiTian Fu Times Square, Chengdu 4,156,000 1,981,000 76,000 2,099,000 – (1,036,000 s.f. residential area pre-sold) 761,520 N/A 2045/75 2012 Superstructure in progress 100% Junction of Dong Da Jie & Fu He, Jinjiang DistrictCrystal Park, No.10 Gaoxin District Chengdu 3,807,000 – 94,000 3,713,000* – (566,000 s.f. residential area pre-sold) 884,459 N/A 2046/76 2013 Superstructure in progress 100% Junction of Zhan Hua Road and Fu Cheng AvenueSuzhou Industrial Park 2,123,000 – – 2,123,000 – 3,654,152 N/A 2076 2012 Planning stage 100% Lot No. 68210 Suzhou Industrial ParkWuxi Taihu Plaza project Wuxi Super Tower 3,013,000 1,583,000 – 1,028,000* 402,000 (Other represents a 243-room hotel) 313,867 N/A 2047/57 2016 Substructure in progress 100% Taihu Plaza, Nanchang District, Wuxi 8,949,000 – – 8,949,000 – (583,000 s.f. residential area pre-sold) 3,314,418 N/A 2078 2015 Superstructure in progress 100%

152The Wharf (Holdings) Limited Annual Report 2009
Schedule of Principal PropertiesAs at 31 December 2009
Approximate Gross Floor Areas (sq. ft.)
Effective Year of Equity Interest Site Area Completion/Expected Stage of to the Address Total Office Retail Residential Others (Remarks) (Sq. ft.) Lot Number Lease Expiry Completion Completion Company
Shuangliu Development Zone, Chengdu 9,127,000 3,922,800 1,281,400 3,922,800 – (e) N/A 2047/77 2013 Planning stage 100% Junction of Shuang Nan Avenue and Guang Hua Avenue, Shuangliu CountyChengdu Jinjiang District Yixinqiao St Project 639,000 – 24,000 615,000 – 160,000 N/A 2079 2012 Planning stage 100% Bounded by Dongdajie south, Jinhua Nan Lu east and Datiankan Jie north, Jinjiang DistrictChangzhou Xinbei District Project 8,590,000 – – 8,073,000 517,000 (Other represents a 305-room hotel) 4,427,804 N/A 2047/77 2016 Planning stage 70% China Dinosaur Park, Xinbei District, Changzhou, Jiangsu ProvinceSuzhou Industrial Park Project Xiandai Da Dao, Suzhou Industrial Park, Suzhou 9,765,000 – – 9,765,000 – 5,425,454 N/A 2077 2017 Planning stage 56%Wuxi Old Canal Lot#71 2,551,000 – – 2,551,000 – 1,416,822 N/A 2078 2015 Planning stage 100% Nanchang District and abutting on Jinhang CanalWuxi Old Canal Lot#72 2,670,000 646,000 – 2,024,000 – 1,276,142 N/A 2078 2014 Planning stage 100% Nanchang District and abutting on Jinhang CanalHangzhou Hangyimian Lot C/D 2,422,000 – – 2,422,000 – 914,000 N/A 2080 2014 Planning stage 100% Gongshu District Gongchen Bridge West
60,356,000 8,132,800 1,475,400 49,828,800 919,000
Development Properties in China (undertaken by associates)Suzhou Industrial Park Lot B24 - Wei Ting Project 908,000 – – 908,000 – (Attributable to the Group - Note f ) 1,976,237 N/A 2077 2014 Planning stage 50% South of Lin Hu Road, East & West sides of Ying Hu RoadTianjin Jin Jiang Lu Project 646,900 – 173,000 473,900 – (Attributable to the Group - Note f ) 511,560 N/A 2079 2014 Planning stage 50% Junction of Weiguo Road & Jingjiang Road, Hedong District
1,554,900 – 173,000 1,381,900 –
Development Properties in China (undertaken by jointly controlled entities)Hangzhou Zhuantang Town Project 2,004,000 – 83,000 1,921,000 – (Attributable to the Group - Note f ) 2,046,685 N/A 2047/77 2014 Superstructure in progress 50% Zhuantang Town, Zhijiang National Tourist Holiday Resort, Xihi District, HangzhouWuxi Old Canal Lot#73 1,760,000 – – 1,760,000 – (Attributable to the Group - Note f ) 2,121,662 N/A 2048/78 2015 Planning stage 50% Nanchang District and abutting on Jinhang CanalChongqing Danzishi Project 7,908,000 – 1,470,000 6,438,000 – (Attributable to the Group - Note f ) 6,080,656 N/A 2047/57 2014 Superstructure in progress 40% Zone C of Danzishi, Nanan District (72,000 s.f. residential, and 3,000 s.f. Retail pre-sold )Chengdu Shahe Project 4,046,000 484,500 484,500 2,916,000 161,000 (Other represents hotel) 2,212,128 N/A 2048/78 2011 and beyond Planning stage 30% South of Shuanggui Road, North of Niusha Road, (Attributable to the Group - Note f ) East of Erhuan Road, West of Shahe, Jinjiang District, ChengduChongqing Jiangbei City Project 2,524,000 – – 2,524,000 – (Attributable to the Group - Note f ) 1,002,408 N/A 2057 2014 Planning stage 39% Zone B of Jiangbei City, Jiang Bei District, ChongqingChongqing Jiangbei City Project 7,166,000 – – 4,763,000 2,403,000 (Others GFAs include all commercial use 2,851,556 N/A 2050/60 2018 Planning stage 50% Zones A&C of Jiangbei City, Jiang Bei District, Chongqing GFAs of Zones A&C) (Attributable to the Group - Note f )
25,408,000 484,500 2,037,500 20,322,000 2,564,000
TOTAL 114,856,500 20,374,100 10,538,400 76,781,000 7,163,000
* Residential includes office-apartments
Notes :(a) Part of Harbour City, total site area is 428,719 sq. ft.(b) Part of The Marco Polo Hongkong Hotel building.(c) Components of Wuhan Times Square which has a total site area of 188,090 sq. ft.(d) Components of Dalian Times Square which has a total site area of 171,356 sq. ft.(e) Components of Chengdu Shuangliu Development Zone which has a total site area of 3,900,589 sq. ft.(f ) The floor areas of properties held through jointly controlled entities and associates are shown on an attributable basis.(g) Subsequent to 2009, the Group acquired two more sites in China i) Chengdu (Chuan Mian Project) (100%-owned), with attributable GFA 3.5 million sq.ft. and ii) Tianjin Tie Dong Lu (50%-owned), with attributable GFA 2.6 million sq.ft.

153The Wharf (Holdings) Limited Annual Report 2009
Effective Year of Equity Interest
Site Area Completion/Expected Stage of to the (Sq. ft.) Lot Number Lease Expiry Completion Completion Company
(e) N/A 2047/77 2013 Planning stage 100%
160,000 N/A 2079 2012 Planning stage 100%
4,427,804 N/A 2047/77 2016 Planning stage 70%
5,425,454 N/A 2077 2017 Planning stage 56%1,416,822 N/A 2078 2015 Planning stage 100%
1,276,142 N/A 2078 2014 Planning stage 100%
914,000 N/A 2080 2014 Planning stage 100%
1,976,237 N/A 2077 2014 Planning stage 50%
511,560 N/A 2079 2014 Planning stage 50%
2,046,685 N/A 2047/77 2014 Superstructure in progress 50%
2,121,662 N/A 2048/78 2015 Planning stage 50%
6,080,656 N/A 2047/57 2014 Superstructure in progress 40%
2,212,128 N/A 2048/78 2011 and beyond Planning stage 30%
1,002,408 N/A 2057 2014 Planning stage 39%
2,851,556 N/A 2050/60 2018 Planning stage 50%

154The Wharf (Holdings) Limited Annual Report 2009
Ten-year Financial Summary
Year ended Year ended Year ended Year ended Year ended 31/12/2009 31/12/2008 31/12/2007 31/12/2006 31/12/2005 HK$ Million HK$ Million HK$ Million HK$ Million HK$ Million
Consolidated Income StatementTurnover 17,553 15,940 16,208 13,364 12,543
Profit before investment properties surplus 7,817 4,194 5,947 4,285 4,499Investment properties surplus (Note a) 9,684 2,053 7,196 6,472 9,389
Profit attributable to shareholders 17,501 6,247 13,143 10,757 13,888
Dividends attributable to shareholders 2,754 2,203 2,093 1,958 1,958
Consolidated Statement of Financial PositionFixed assets 134,002 119,593 114,613 102,198 90,658Interest in associates 4,238 4,009 4,182 781 1,638Interest in jointly controlled entities 7,551 7,989 4,555 788 896Available-for-sale investments 1,331 706 2,858 2,921 1,677Properties for sale 17,797 17,272 9,235 5,784 4,370Bank deposits and cash 18,412 15,886 7,717 3,769 2,508Other assets 7,130 3,099 3,011 3,036 2,745
Total assets 190,461 168,554 146,171 119,277 104,492Bank loan/other borrowings (39,844) (38,009) (31,282) (20,670) (18,558)Other liabilities (28,453) (24,688) (22,887) (18,689) (17,408)
Net assets 122,164 105,857 92,002 79,918 68,526
Share capital 2,754 2,754 2,448 2,448 2,448Reserves 112,456 96,740 83,916 72,714 62,926
Shareholders’ equity 115,210 99,494 86,364 75,162 65,374Minority interests 6,954 6,363 5,638 4,756 3,152
Total equity 122,164 105,857 92,002 79,918 68,526
Financial DataPer share dataEarnings per share (HK$) (Note b) 6.35 2.28 5.17 4.39 5.67Net assets per share (HK$) 41.83 36.13 35.28 30.70 26.71Dividends per share (Cents) 100.00 80.00 80.00 80.00 80.00
Financial ratiosNet debt to total equity (%) 17.5% 20.9% 25.6% 21.1% 23.4%Return on shareholders’ equity (%) (Note c) 16.3% 6.7% 16.3% 15.3% 23.1%Dividend cover (Times) 6.4 2.9 6.5 5.5 7.1

155The Wharf (Holdings) Limited Annual Report 2009
Year ended Year ended Year ended Year ended Year ended 31/12/2004 31/12/2003 31/12/2002 31/12/2001 31/12/2000 HK$ Million HK$ Million HK$ Million HK$ Million HK$ Million
Consolidated Income StatementTurnover 11,953 11,253 11,333 11,725 12,023
Profit before investment properties surplus 3,740 3,043 2,259 2,519 2,494Investment properties surplus (Note a) 8,937 N/A N/A N/A N/A
Profit attributable to shareholders 12,677 3,043 2,259 2,519 2,494
Dividends attributable to shareholders 1,683 1,487 1,370 1,908 1,908
Consolidated Statement of Financial PositionFixed assets 78,916 71,120 69,044 74,445 77,237nterest in associates 1,583 2,075 3,367 3,389 4,972Interest in jointly controlled entities 348 – – – –Available-for-sale investments 1,654 1,392 1,178 1,088 1,901Properties for sale 2,915 2,589 2,776 2,747 3,139Bank deposits and cash 2,209 1,512 1,518 3,140 3,194Other assets 2,513 2,474 3,239 3,655 2,060
Total assets 90,138 81,162 81,122 88,464 92,503Bank loans/other borrowings (16,442) (18,674) (22,653) (23,893) (22,698)Other liabilities (15,072) (6,839) (7,054) (6,196) (7,829)
Net assets 58,624 55,649 51,415 58,375 61,976
Share capital 2,447 2,447 2,447 2,447 2,446Reserves 52,502 49,181 45,287 52,198 55,504
Shareholders’ equity 54,949 51,628 47,734 54,645 57,950Minority interests 3,675 4,021 3,681 3,730 4,026
Total equity 58,624 55,649 51,415 58,375 61,976
Financial DataPer share dataEarnings per share (HK$) (Note b) 5.18 1.24 0.92 1.03 1.02Net assets per share (HK$) 22.46 21.09 19.50 22.33 23.69Dividends per share (Cents) 68.80 60.80 56.00 78.00 78.00 Financial ratiosNet debt to total equity (%) 24.3% 30.8% 41.1% 35.6% 31.5%Return on shareholders’ equity (%) (Note c) 23.8% 6.1% 4.4% 4.5% 4.4%Dividend cover (Times) 7.5 2.0 1.6 1.3 1.3
Notes:
(a) Investment properties surplus on revaluation is after deferred tax and minority interests.
(b) Number of shares as at 31 December 2007 have been restated for rights issue.
(c) Return on shareholders’ equity is based on profit attributable to shareholders over average shareholders’ equity during the year.
(d) Certain figures have been reclassified or restated to comply with the prevailing HKFRSs.

A Chinese version of this Annual Report is available from the Company upon request.
如有需要,可向本公司索取本年報之中文版本。

This annual report is printed on FSC certified Magno Matt Art Card, 9lives 55 Matt Art Paper and Ozone Offset Paper, Pulps used are chlorine-free and acid-free.
The FSC logo identifies products which contain wood from well-managed forests certified in accordance with the rules of the Forest Stewardship Council.
Conc
ept an
d de
sign
by
Qua
lides
ign
ing
Lim
ited

www.wharfholdings.com


