downloaded from will be boys.pdf · boys will be boys: gender, overconfidence, and common stock...
TRANSCRIPT

BOYS WILL BE BOYS: GENDER, OVERCONFIDENCE, AND COMMON STOCK INVESTMENT*
BRAD M. BARBER AND TERRANCE ODEAN
Theoretical models predict that overconfident investors trade excessively. We test this prediction by partitioning investors on gender. Psychological research demonstrates that, in areas such as finance, men are more overconfident than women. Thus, theory predicts that men will trade more excessively than women. Using account data for over 35,000 households from a large discount brokerage, we analyze the common stock investments of men and women from February 1991 through January 1997. We document that men trade 45 percent more than women. Trading reduces men's net returns by 2.65 percentage points a year as opposed to 1.72 percentage points for women.
It's not what a man don't know that makes him a fool, but what he does know that ain't so.
Josh Billings, nineteenth century American humorist
It is difficult to reconcile the volume of trading observed in equity markets with the trading needs of rational investors. Rational in~estors make periodic contributions and withdrawals from their investment portfolios, rebalance their portfolios, and trade to minimize their taxes. Those possessed of superior information may trade speculatively, although rational speculative traders will generally not choose to trade with each other. It is unlikely that rational trading needs account for a turnover rate of 76 percent on the New York Stock Exchange in 1998.1
We believe there is a simple and powerful explanation for high levels of trading on financial markets: overconfidence. Human beings are overconfident about their abilities, their knowledge, and their future prospects. Odean [1998] shows that overconfident investors-who believe that the precision of their knowledge about the value of a security is greater than it actually
* We are grateful to the discount brokerage firm that provided us with the data for this study and grateful to Paul Thomas, David Moore, Paine Webber, and the Gallup Organization for providing survey data. We appreciate the comments of Diane Del Guercio, David Hirshleifer, Andrew Karolyi, Timothy Loughran, Edward Opton Jr., Sylvester Schieber, Andrei Shleifer, Martha Starr-McCluer, Richard Thaler, Luis Viceira, and participants at the University of Alberta, Arizona State University, INSEAD, the London Business School, the University of Michigan, the University of Vienna, the Institute on Psychology and Markets, the Conference on Household Portfolio Decision-making and Asset Holdings at the University of Pennsylvania, and the Western Finance Association Meetings. All errors are our own. Terrance Odean can be reached at (530) 752-5332 or [email protected]; Brad Barber can be reached at (530) 752-0512 or bmbarber®ucdavis.edu.
1. NYSE Fact Book for the Year 1999.
© 2001 by the President and Fellows of Harvard College and the Massachusetts Institute of Technology. The Quarterly Journal of Economics, February 2001
261
at Vrije Universiteit, Library on March 4, 2013http://qje.oxfordjournals.org/Downloaded from

262 QUARTERLY JOURNAL OF ECONOMICS
is-trade more than rational investors and that doing so lowers their expected utilities. Greater overconfidence leads to greater trading and to lower expected utility.
A direct test of whether overconfidence contributes to excessive market trading is to separate investors into those more and those less prone to overconfidence. One can then test whether more overconfidence leads to more trading and to lower returns. Such a test is the primary contribution of this paper.
Psychologists find that in areas such as finance men are more overconfident than women. This difference in overconfidence yields two predictions: men will trade more than women, and the performance of men will be hurt more by excessive trading than the performance of women. To test these hypotheses, we partition a data set of position and trading records for over 35,000 households at a large discount brokerage firm into accounts opened by men and accounts opened by women. Consistent with the predictions of the overconfidence models, we find that the average turnover rate of common stocks for men is nearly one and a half times that for women. While both men and women reduce their net returns through trading, men do so by 0.94 percentage points more a year than do women.
The differences in turnover and return performance are even more pronounced between single men and single women. Single men trade 67 percent more than single women thereby reducing their returns by 1.44 percentage points per year more than do single women.
The remainder of this paper is organized as follows. We motivate our test of overconfidence in Section I. We discuss our data and empirical methods in Section II. Our main results are presented in Section III. We discuss competing explanations for our results in Section N and make concluding remarks in Section V.
I. A TEST OF OVERCONFIDENCE
I.A. Overconfidence and Trading on Financial Markets
Studies ofthe calibration of subjective probabilities find that people tend to overestimate the precision of their knowledge [Alpert and Raiffa 1982; Fischhoff, Slovic, and Lichtenstein 1977]; see Lichtenstein, Fischhoff, and Phillips [1982] for a review of the calibration literature. Such overconfidence has been
at Vrije Universiteit, Library on March 4, 2013http://qje.oxfordjournals.org/Downloaded from

BOYS WILL BE BOYS 263
observed in many professional fields. Clinical psychologists [Oskamp 1965], physicians and nurses [Christensen-Szalanski and Bushyhead 1981; Baumann, Deber, and Thompson 1991], investment bankers [Stael von Holstein 1972], engineers [Kidd 1970], entrepreneurs [Cooper, Woo, and Dunkelberg 1988], lawyers [Wagenaar and Keren 1986], negotiators [Neale and Bazerman 1990], and managers [Russo and Schoemaker 1992] have all been observed to exhibit overconfidence in their judgments. (For further discussion see Lichtenstein, Fischhoff, and Phillips [1982] and Yates [1990].)
Overconfidence is greatest for difficult tasks, for forecasts with low predictability, and for undertakings lacking fast, clear feedback [Fischhoff, Slovic, and Lichtenstein 1977; Lichtenstein, Fischhoff, and Phillips 1982; Yates 1990; Griffin and Tversky 1992]. Selecting common stocks that will outperform the market is a difficult task. Predictability is low; feedback is noisy. Thus, stock selection is the type of task for which people are most overconfident.
Odean [1998] develops models in which overconfident investors overestimate the precision of their knowledge about the value of a financial security.2 They overestimate the probability that their personal assessments of the security's value are more accurate than the assessments of others. Thus, overconfident investors believe more strongly in their own valuations, and concern themselves less about the beliefs of others. This intensifies differences of opinion. And differences of opinion cause trading [Varian 1989; Harris and Raviv 1993]. Rational investors only trade and only purchase information when doing so increases their expected utility (e.g., Grossman and Stiglitz [1980]). Overconfident investors, on the other hand, lower their expected utility by trading too much; they hold unrealistic beliefs about how high their returns will be and how precisely these can be estimated; and they expend too many resources (e.g., time and money) on investment information [Odean 1998]. Overconfident
2. Other models of overconfident investors include De Long, Shleifer, Summers, and Waldmann [1991], Benos [1998], Kyle and Wang [1997], Daniel, Hirshleifer, and Subramanyam [1998], Gervais and Odean [1998], and Caballe and Sakovics [1998]. Kyle and Wang argue that when traders compete for duopoly profits, overconfident traders may reap greater profits. However, this prediction is based on several assumptions that do not apply to individuals trading common stocks.
Odean [1998] points out that overconfidence may result from investors overestimating the precision of their private signals or, alternatively, overestimating their abilities to correctly interpret public signals.
at Vrije Universiteit, Library on March 4, 2013http://qje.oxfordjournals.org/Downloaded from
264 QUARTERLY JOURNAL OF ECONOMICS
investors also hold riskier portfolios than do rational investors with the same degree of risk aversion [Odean 1998].
Barber and Odean [2000] and Odean [1999] test whether investors decrease their expected utility by trading too much. Using the same data analyzed in this paper, Barber and Odean show that after accounting for trading costs, individual investors underperform relevant benchmarks. Those who trade the most realize, by far, the worst performance. This is what the models of overconfident investors predict. With a different data set, Odean [1999] finds that the securities individual investors buy subsequently underperform those they sell. When he controls for liquidity demands, tax-loss selling, rebalancing, and changes in risk aversion, investors' timing of trades is even worse. This result suggests that not only are investors too willing to act on too little information, but they are too willing to act when they are wrong.
These studies demonstrate that investors trade too much and to their detriment. The findings are inconsistent with rationality and not easily explained in the absence of overconfidence. Nevertheless, overconfidence is neither directly observed nor manipulated in these studies. A yet sharper test of the models that incorporate overconfidence is to partition investors into those more and those less prone to overconfidence. The models predict that the more overconfident investors will trade more and realize lower average utilities. To test these predictions, we partition our data on gender.
LB. Gender and Overconfidence
While both men and women exhibit overconfidence, men are generally more overconfident than women [Lundeberg, Fox, and Puncochaf 1994] .3 Gender differences in overconfidence are highly task dependent [Lundeberg, Fox, and Puncochaf 1994]. Deaux and Farris [1977] write "Overall, men claim more ability than do women, but this difference emerges most strongly on ... masculine task[s]." Several studies confirm that differences in confidence are greatest for tasks perceived to be in the masculine domain [Deaux and Emswiller 1974; Lenney 1977; Beyer and Bowden 1997]. Men are inclined to feel more competent than
3. While Lichtenstein and Fishhoff [1981] do not find gender differences in calibration of general knowledge, Lundeberg, Fox, and Puncochaf [1994] argue that this is because gender differences in calibration are strongest for topics in the masculine domain.
at Vrije Universiteit, Library on March 4, 2013http://qje.oxfordjournals.org/Downloaded from

BOYS WILL BE BOYS 265
women do in financial matters [Prince 1993]. Indeed, casual observation reveals that men are disproportionately represented in the financial industry. We expect, therefore, that men will generally be more overconfident about their ability to make financial decisions than women.
Additionally, Lenney [1977] reports that gender differences in self-confidence depend on the lack of clear and unambiguous feedback. When feedback is "unequivocal and immediately available, women do not make lower ability estimates than men. However, when such feedback is absent or ambiguous, women seem to have lower opinions of their abilities and often do underestimate relative to men." Feedback in the stock market is ambiguous. All the more reason to expect men to be more confident than women about their ability to make common stock investments.
Gervais and Odean [1998] develop a model in which investor overconfidence results from self-serving attribution bias. Investors in this model infer their own abilities from their successes and failures. Due to their tendency to take too much credit for their successes, they become overconfident. Deaux and Farris [1977], Meehan and Overton [1986], and Beyer [1990] find that the self-serving attribution bias is greater for men than for women. And so men are likely to become more overconfident than women.
The previous study most like our own is Lewellen, Lease, and Schlarbaum's [1977] analysis of survey answers and brokerage records (from 1964 through 1970) of 972 individual investors. Lewellen, Lease, and Schlarbaum's report that men spend more time and money on security analysis, rely less on their brokers, make more transactions, believe that returns are more highly predictable, and anticipate higher possible returns than do women. In all these ways, men behave more like overconfident investors than do women.
Additional evidence that men are more overconfident investors than women comes from surveys conducted by the Gallup Organization for PaineWebber. Gallup conducted the survey fifteen times between June 1998 and January 2000. There were approximately 1000 respondents per survey. In addition to other questions, respondents were asked "What overall rate of return do you expect to get on your portfolio in the NEXT twelve months?" and "Thinking about the stock market more generally, what overall rate of return do you think the stock market will
at Vrije Universiteit, Library on March 4, 2013http://qje.oxfordjournals.org/Downloaded from

266 QUARTERLY JOURNAL OF ECONOMICS
provide investors during the coming twelve months?" On average, both men and women expected their own portfolios to outperform the market. However, men expected to outperform by a greater margin (2.8 percent) than did women (2.1 percent). The difference in the average anticipated outperformance of men and women is statistically significant (t = 3.3).4
In summary, we have a natural experiment to (almost) directly test theoretical models of investor overconfidence. A rational investor only trades if the expected gain exceeds the transactions costs. An overconfident investor overestimates the precision of his information and thereby the expected gains of trading. He may even trade when the true expected net gain is negative. Since men are more overconfident than women, this gives us two testable hypotheses:
HI: Men trade more than women.
H2: By trading more, men hurt their performance more than do women.
It is these two hypotheses that are the focus of our inquiry.5
II. DATA AND METHODS
II.A. Household Account and Demographic Data
Our main results focus on the common stock investments of 37,664 households for which we are able to identify the gender of the person who opened the household's first brokerage account. This sample is compiled from two data sets.
Our primary data set is information from a large discount brokerage firm on the investments of 78,000 households for the six years ending in December 1996. For this period, we have end-ofmonth position statements and trades that allow us to reasonably estimate monthly returns from February 1991 through January
4. Some respondents answered that they expected market returns as high as 900. We suspect that these respondents were thinking of index point moves rather than percentage returns. Therefore, we have dropped from our calculations respondents who gave answers of more than 100 to this question. If, alternatively, we Windsorize answers over 900 at 100 there is no significant change in our results.
5. Overconfidence models also imply that more overconfident investors will hold riskier portfolios. In Section III we present evidence that men hold riskier common stock portfolios than women. However, gender differences in portfolio risk may be due to differences in risk tolerance rather than (or in addition to) differences in overconfidence.
at Vrije Universiteit, Library on March 4, 2013http://qje.oxfordjournals.org/Downloaded from

BOYS WILL BE BOYS 267
1997. The data set includes all accounts opened by the 78,000 households at this discount brokerage finn. Sampled households were required to have an open account with the discount brokerage finn during 1991. Roughly half of the accounts in our analysis were opened prior to 1987, while half were opened between 1987 and 1991. On average, men opened their first account at this brokerage 4.7 years before the beginning of our sample period, while women opened theirs 4.3 years before. During the sample period, men's accounts held common stocks for 58 months on average and women's for 59 months. The median number of months men held common stocks is 70. For women it is 71.
In this research, we focus on the common stock investments of households. We exclude investments in mutual funds (both open- and closed-end), American depository receipts (ADRs), warrants, and options. Of the 78,000 sampled households, 66,465 had positions in common stocks during at least one month; the remaining accounts either held cash or investments in other than individual common stocks. The average household had approximately two accounts, and roughly 60 percent of the market value in these accounts was held in common stocks. These households made over 3 million trades in all securities during our sample period; common stocks accounted for slightly more than 60 percent of all trades. The average household held four stocks worth $47,000 during our sample period, although each of these figures is positively skewed.6 The median household held 2.6 stocks worth $16,000. In aggregate, these households held more than $4.5 billion in common stocks in December 1996.
Our secondary data set is demographic infonnation compiled by Infobase Inc. (as of June 8, 1997) and provided to us by the brokerage house. These data identify the gender of the person who opened a household's first account for 37,664 households, of which 29,659 (79 percent) had accounts opened by men and 8,005 (21 percent) had accounts opened by women. In addition to gender, Infobase provides data on marital status, the presence of children, age, and household income. We present descriptive statistics in Table I, Panel A. These data reveal that the women in our sample are less likely to be married and to have children than men. The mean and median ages of the men and women in our sample are roughly equal. The women report slightly lower household income, although the difference is not economically large.
6. Throughout the paper, portfolio values are reported in current dollars.
at Vrije Universiteit, Library on March 4, 2013http://qje.oxfordjournals.org/Downloaded from

TABLE I ~
DESCRIPTIVE STATISTICS FOR DEMOGRAPHICS OF FEMALE AND MALE HOUSEHOLDS O'l 00
All households Married households Single households
Difference Difference Difference (women- (women- (women-
Variable Women Men men) Women Men men) Women Men men) .()
Panel A: Infobase data ~ Number of households 8,005 29,659 NA 4,894 19,741 NA 2,306 6,326 NA ~ Percentage married 68.0 75.7 -7.7 Percentage with children 25.2 32.2 -7.0 33.6 40.4 -6.8 10.6 10.5 0.1 8l Mean age 50.9 50.3 0.6 49.9 51.1 -1.2 53.0 48.2 4.8 ~ Median age 48.0 48.0 0.0 48.0 48.0 0.0 50.0 46.0 4.0
C5 Mean income ($000) 73.0 75.6 -2.6 81.2 79.6 1.6 56.7 62.8 -6.1 % with income >$125,000 11.2 11.7 -0.5 14.2 13.0 1.2 5.9 7.4 -1.5 § Panel B: Self-reported data ~ Number of households 2,637 11,226 1,707 7,700 652 2,184 Net worth ($000) ~ 90th Percentile 500.0 500.0 0.0 500.0 500.0 0.0 350.0 450.0 -100.0
75th Percentile 200.0 250.0 -50.0 250.0 250.0 0.0 175.0 200.0 -25.0 t>::I (J
Median 100.0 100.0 0.0 100.0 100.0 0.0 100.0 100.0 0.0 ~ 25th Percentile 60.0 74.5 -14.5 62.5 74.5 -12.0 40.0 62.0 -22.0 10th Percentile 27.0 37.0 -10.0 35.0 37.0 -2.0 20.0 35.0 -15.0 Q
EMity to net worth (%) E5 ean 13.3 13.2 0.1 12.9 12.9 0.0 14.4 14.3 0.1 &5 Median 6.7 6.7 0.0 6.3 6.6 -0.3 7.9 7.4 0.5
Investment experience (%) None 5.4 3.4 2.0 4.7 3.4 1.3 7.4 3.0 4.4 Limited 46.8 34.1 12.7 44.9 34.2 10.7 52.6 33.3 19.3 Good 39.1 48.5 -9.4 40.8 48.5 -7.7 33.3 48.8 -15.5 Extensive 8.7 14.0 -5.3 9.6 13.9 -4.3 6.7 14.9 -8.2
The sample consists of households with conunon stock investment at a large discount brokerage firm for which we are able to identifY the gender of the person who opened the household's first account. Data on marital status, children. age, and income are from Infobase Inc. as of June 1997. Self-reported data are information supplied to the discount brokerage firm at the time the account is opened by the person on opening the account. Income is reported within eight ranges, where the top range is greater than $125,000. We calculate means using the midpoint of each range and $125,000 for the top range. Equity to Net Worth (%) is the proportion of the market value of common stock investment at this discount brokerage firm as of January 1991 to total self-reported net worth when the household opened ita first account at this brokerage. Those households with a proportion equity to net worth greater than 100 percent are deleted when calculating means and medians. Number of observations for each variable is slightly less than the number of reported households.
at Vrije U
niversiteit, Library on M
arch 4, 2013http://qje.oxfordjournals.org/
Dow
nloaded from
BOYS WILL BE BOYS 269
In addition to the data from Infobase, we also have a limited amount of self-reported data collected at the time each household first opened an account at the brokerage (and not subsequently updated), which we summarize in Table I, Panel B. Of particular interest to us are two variables: net worth, and investment experience. For this limited sample (about one-third of our total sample), the distribution of net worth for women is slightly less than that for men, although the difference is not economically large. For this limited sample, we also calculate the ratio of the market value of equity (as of the first month that the account appears in our data set) to self-reported net worth (which is reported at the time the account is opened). This provides a measure, albeit crude, of the proportion of a household's net worth that is invested in the common stocks that we analyze. (If this ratio is greater than one, we delete the observation from our analysis.) The mean household holds about 13 percent of its net worth in the common stocks we analyze, and there is little difference in this ratio between men and women.
The differences in self-reported experience by gender are quite large. In general, women report having less investment experience than men. For example, 47.8 percent of women report having good or extensive investment experience, while 62.5 percent of men report the same level of experience.
Married couples may influence each other's investment decisions. In some cases the spouse making investment decisions may not be the spouse who originally opened a brokerage account. Thus, we anticipate that observable differences in the investment activities of men and women will be greatest for single men and single women. To investigate this possibility, we partition our data on the basis of marital status. The descriptive statistics from this partition are presented in the last six columns of Table I. For married households, we observe very small differences in age, income, the distribution of net worth, and the ratio of net worth to equity. Married women in our sample are less likely to have children than married men, and they report having less investment experience than men.
For single households, some differences in demographics become larger. The average age of the single women in our sample is five years older than that of the single men; the median is four years older. The average income of single women is $6,100 less than that of single men, and fewer report having incomes in excess of $125,000. Similarly, the distribution of net worth for single women
at Vrije Universiteit, Library on March 4, 2013http://qje.oxfordjournals.org/Downloaded from
270 QUARTERLY JOURNAL OF ECONOMICS
is lower than that of single men. Finally, single women report having less investment experience than single men.
II.B. Return Calculations
To evaluate the investment performance of men and women, we calculate the gross and net return performance of each household. The net return performance is calculated after a reasonable accounting for the market impact, commissions, and bid-ask spread of each trade.
For each trade, we estimate the bid-ask spread component of transaction costs for purchases (spr db) or sales (spr d) as
Sprd, = (~f: -1), and Sprdb = -(~;: - 1). P'i, and P'ib are the reported closing prices from the Center for Research in Security Prices (CRSP) daily stock return files on the day of a sale and purchase, respectively; P'!:is and P~b are the actual sale and purchase price from our account database. Our estimate of the bid-ask spread component of transaction costs includes any market impact that might result from a trade. It also includes an intraday return on the day of the trade. The commission component of transaction costs is calculated to be the dollar value of the commission paid scaled by the total principal value of the transaction, both of which are reported in our account data.
The average purchase costs an investor 0.31 percent, while the average sale costs an investor 0.69 percent in bid-ask spread. Our estimate of the bid-ask spread is very close to the trading cost of 0.21 percent for purchases and 0.63 percent for sales paid by open-end mutual funds from 1966 to 1993 [Carhart 1997].1 The average purchase in excess of $1000 cost 1.58 percent in commissions, while the average sale in excess of$1000 cost 1.45 percent.8
We calculate trade-weighted (weighted by trade size) spreads and commissions. These figures can be thought of as the total cost
7. Odean [1999] finds that individual investors are more likely to both buy and sell particular stocks when the prices of those stocks are rising. This tendency can partially explain the asymmetry in buy and sell spreads. Any intraday price rises following transactions subtract from our estimate of the spread for buys and add to our estimate of the spread for sells.
8. To provide more representative descriptive statistics on percentage commissions, we exclude trades less than $1000. The inclusion of these trades results in a round-trip commission cost of 5 percent, on average (2.1 percent for purchases and 3.1 percent for sales).
at Vrije Universiteit, Library on March 4, 2013http://qje.oxfordjournals.org/Downloaded from

BOYS WILL BE BOYS 271
of conducting the $24 billion in common stock trades (approximately $12 billion each in purchases and sales). Trade-size weighting has little effect on spread costs (0.27 percent for purchases and 0.69 percent for sales) but substantially reduces the commission costs (0.77 percent for purchases and 0.66 percent for sales).
In sum, the average trade in excess of $1000 incurs a roundtrip transaction cost of about 1 percent for the bid-ask spread and about 3 percent in commissions. In aggregate, round-trip trades cost about 1 percent for the bid-ask spread and about 1.4 percent in commissions.
We estimate the gross monthly return on each common stock investment using the beginning-of-month position statements from our household data and the CRSP monthly returns file. In so doing, we make two simplifying assumptions. First, we assume that all securities are bought or sold on the last day ofthe month. Thus, we ignore the returns earned on stocks purchased from the purchase date to the end of the month and include the returns earned on stocks sold from the sale date to the end of the month. Second, we ignore intramonth trading (e.g., a purchase on March 6 and a sale of the same security on March 20), although we do include in our analysis short-term trades that yield a position at the end of a calendar month. Barber and Odean [2000] provide a careful analysis of both of these issues and document that these simplifying assumptions yield trivial differences in our return calculations.
Consider the common stock portfolio for a particular household. The gross monthly return on the household's portfolio (REf.'t) is calculated as
Sh,
R1.~ = ~ pitRr;, i=l
where Pit is the beginning-of-month market value for the holding of stock i by household h in month t divided by the beginning-ofmonth market value of all stocks held by household h, Rf; is the gross monthly return for that stock, and S ht is the number of stocks held by household h in month t.
For security i in month t, we calculate a monthly return net of transaction costs (R'tlt) as
(1 + Ritet) = (1 + RrF) (1 - cit)/(l + Cr,t-l),
at Vrije Universiteit, Library on March 4, 2013http://qje.oxfordjournals.org/Downloaded from

272 QUARTERLY JOURNAL OF ECONOMICS
where Crt is the cost of sales scaled by the sales price in month t and C?,t-l is the cost of purchases scaled by the purchase price in month t - 1. The cost of purchases and sales include the commissions and bid-ask spread components, which are estimated individually for each trade as previously described. Thus, for a security purchased in month t - 1 and sold in month t, both Crt
and C?'t-l are positive; for a security that was neither purchased in month t - 1 nor sold in month t, both cft and C?,t-l are zero. Because the timing and cost of purchases and sales vary across households, the net return for security i in month t will vary across households. The net monthly portfolio return for each household is
Sh,
R net -" Rnet ht - L.J P it it·
i=l
(If only a portion of the beginning-of-month position in stock i was purchased or sold, the transaction cost is only applied to the portion that was purchased or sold.)
We estimate the average gross and net monthly returns earned by men as
1 - 1 -RMgtr = - L Rgr and RMnet = - L Rnet n ht, n ht, mt h=l mt h=l
where nmt is the number of male households with common stock investment in month t. There are analogous calculations for women.
II. C. Turnover
We calculate the monthly portfolio turnover for each household as one-half the monthly sales turnover plus one-half the monthly purchase turnover.9 In each month during our sample period, we identify the common stocks held by each household at the beginning of month t from their position statement. To calculate monthly sales turnover, we match these positions to sales
9. Sell turnover for household h in month t is calculated as '2'.f!!\ Pit min (1, Sit/Hit), where Sit is the number of shares in security i sold during the month, Pit is the value of stock i held at the beginning of month t scaled by the total value of stock holdings, and Hit is the number of shares of security i held at the beginning of month t. Buy turnover is calculated as '2'.f!;'t Pi,t+l min (1, Bit/Hi,t+l), where Bit is the number of shares of security i bought during the month.
at Vrije Universiteit, Library on March 4, 2013http://qje.oxfordjournals.org/Downloaded from

BOYS WILL BE BOYS 273
during month t. The monthly sales turnover is calculated as the shares sold times the beginning-of-month price per share divided by the total beginning-of-month market value of the household's portfolio. To calculate monthly purchase turnover, we match these positions to purchases during month t - 1. The monthly purchase turnover is calculated as the shares purchased times the beginning-of-month price per share divided by the total beginning-of-month market value of the portfolio.1o
Il.D. The Effect of Trading on Return Performance
We calculate an "own-benchmark" abnormal return for individual investors that is similar in spirit to those proposed by Lakonishok, Shleifer, and Vishny [1992] and Grinblatt and Titman [1993]. In this abnormal return calculation, the benchmark for household h is the month t return of the beginning-of-year portfolio held by household h,n denoted R%t. It represents the return that the household would have earned ifit had merely held its beginning-of-year portfolio for the entire year. The gross or net own-benchmark abnormal return is the return earned by household h less the return of household h's beginning-of-year portfolio (AR%~ = R%~ - R%t or ARh~t = Rh~t - R~t). If the household did not trade during the year, the own-benchmark abnormal return would be zero for all twelve months during the year.
In each month the abnormal returns across male households are averaged yielding a 72-month time-series of mean monthly own-benchmark abnormal returns. Statistical significance is calculated using t-statistics based on this time-series: ARfl [O"(ARf)/\I72] , where
__ 1 nmt
ARf = n 2: (R%~ - R~t). mt t=l
10. If more shares were sold than were held at the beginning of the month (because, for example, an investor purchased additional shares after the beginning of the month), we assume the entire beginning-of-month position in that security was sold. Similarly, if more shares were purchased in the preceding month than were held in the position statement, we assume that the entire position was purchased in the preceding month. Thus, turnover, as we have calculated it, cannot exceed 100 percent in a month.
11. When calculating this benchmark, we begin the year on February 1. We do so because our first monthly position statements are from the month end of January 1991. If the stocks held by a household at the beginning of the year are missing CRSP returns data during the year, we assume that stock is invested in the remainder of the household's portfolio.
at Vrije Universiteit, Library on March 4, 2013http://qje.oxfordjournals.org/Downloaded from

274 QUARTERLY JOURNAL OF ECONOMICS
There is an analogous calculation of net abnormal returns for men, gross abnormal returns for women, and net abnormal returns for women.12
The advantage of the own-benchmark abnormal return measure is that it does not adjust returns according to a particular risk model. No model of risk is universally accepted; furthermore, it may be inappropriate to adjust investors' returns for stock characteristics that they do not associate with risk. The ownbenchmark measure allows each household to self-select the investment style and risk profile of its benchmark (i.e., the portfolio it held at the beginning of the year), thus emphasizing the effect trading has on performance.
II.E. Security Selection
Our theory says that men will underperform women because men trade more and trading is costly. An alternative cause of underperformance is inferior security selection. Two investors with similar initial portfolios and similar turnover will differ in performance if one consistently makes poor security selections. To measure security selection ability, we compare the returns of stocks bought with those of stocks sold.
In each month we construct a portfolio comprised of those stocks purchased by men in the preceding twelve months. The returns on this portfolio in month t are calculated as
where Tfr is the aggregate value of all purchases by men in security i from month t - 12 through t - 1, Rit is the gross monthly return of stock i in month t, and npt is the number of different stocks purchased from month t - 12 through t - l. (Alternatively, we weight by the number rather than the value of trades.) Four portfolios are constructed: one for the purchases of men (Rfm ), one for the purchases of women (RfW ), one for the sales of men (Rfm ), and one for the sales of women (Rfw ).
12. Alternatively, one can first calculate the monthly time-series average own-benchmark return for each household and then test the significance of the cross-sectional average of these. The t-statistics for the cross-sectional tests are larger than those we report for the time-series tests.
at Vrije Universiteit, Library on March 4, 2013http://qje.oxfordjournals.org/Downloaded from

BOYS WILL BE BOYS 275
III. RESULTS
III.A. Men versus Women
In Table II, Panel A, we present position values and turnover rates for the portfolios held by men and women. Women hold slightly, but not dramatically smaller, common stock portfolios ($18,371 versus $21,975). Of greater interest is the difference in turnover between women and men. Models of overconfidence predict that women, who are generally less overconfident than men, will trade less than men. The empirical evidence is consistent with this prediction. Women turn their portfolios over approximately 53 percent annually (monthly turnover of 4.4 percent times twelve), while men turn their portfolios over approximately 77 percent annually (monthly turnover of 6.4 percent times twelve). We are able to comfortably reject the null hypothesis that turnover rates are similar for men and women (at less than a 1 percent level). Although the median turnover is substantially less for both men and women, the differences in the median levels of turnover are also reliably different between genders.
In Table II, Panel B, we present the gross and net percentage monthly own-benchmark abnormal returns for common stock portfolios held by women and men. Women earn gross monthly returns that are 0.041 percent lower than those earned by the portfolio they held at the beginning of the year, while men earn gross monthly returns that are 0.069 percent lower than those earned by the portfolio they held at the beginning of the year. Both shortfalls are statistically significant at the 1 percent level as is their 0.028 difference (0.34 percent annually).
Turning to net own-benchmark returns, we find that women earn net monthly returns that are 0.143 percent lower than those earned by the portfolio they held at the beginning of the year, while men earn net monthly returns that are 0.221 percent lower than those earned by the portfolio they held at the beginning of the year. Again, both shortfalls are statistically significant at the 1 percent level as is their difference of 0.078 percent (0.94 percent annually).
Are the lower own-benchmark returns earned by men due to more active trading or to poor security selection? The calculations described in subsection H.E indicate that the stocks both men and women choose to sen earn reliably greater returns than the stocks they choose to buy. This is consistent with Odean [1999], who uses different data to show that the stocks individual investors
at Vrije Universiteit, Library on March 4, 2013http://qje.oxfordjournals.org/Downloaded from
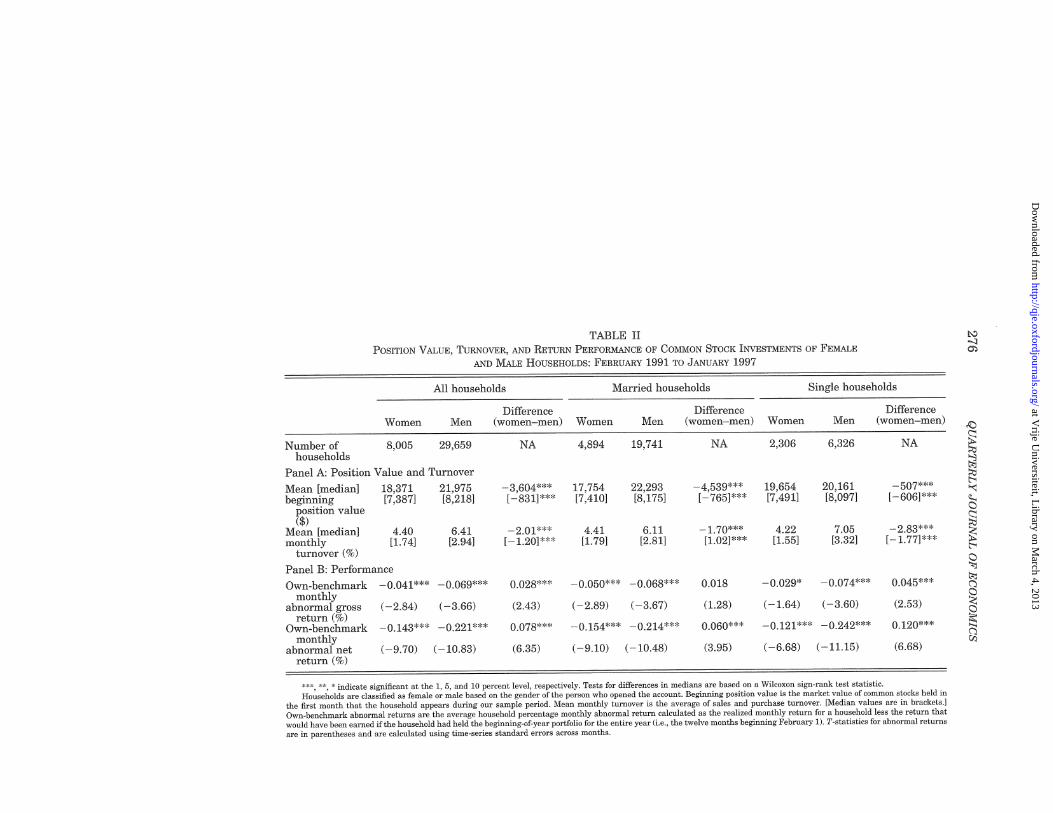
TABLE II POSITION VALUE, TuRNOVER, AND RETURN PERFORMANCE OF COMMON STOCK INVESTMENTS OF FEMALE
AND MALE HOUSEHOLDS: FEBRUARY 1991 TO JANUARY 1997
All households Married households Single households
Difference Difference Difference Women Men (women-men) Women Men (women-men) Women Men (women-men)
Number of 8,005 29,659 NA 4,894 households
19,741 NA 2,306 6,326 NA
Panel A: Position Value and Turnover
Mean [median] 18,371 21,975 -3,604*** 17,754 22,293 -4,539*** 19,654 20,161 -507*** beginning [7,387] [8,218] [-831]*** [7,410] [8,175] [-765]*** [7,491] [8,097] [-606]***
position value ($)
Mean [median] 4.40 6.41 -2.01*** 4.41 6.11 -1.70*** 4.22 7.05 -2.83*** monthly [1.74] [2.94] [ -1.20]*** [1.79] [2.81] [1.02]*** [1.55] [3.32] [-1.77]***
turnover (%)
Panel B: Performance
Own-benchmark -0.041 *** -0.069*** 0.028*** -0.050*** -0.068*** 0.018 -0.029* -0.074*** 0.045*** monthly
abnormal gross (-2.84) ( -3.66) (2.43) ( -2.89) (-3.67) (1.28) (-1.64) (-3.60) (2.53) return (%)
Own-benchmark -0.143*** -0.221*** 0.078*** -0.154*** -0.214*** 0.060*** -0.121 *** -0.242*** 0.120*** monthly
abnormal net (-9.70) (-10.83) (6.35) ( -9.10) (-1D.48) (3.95) ( -6.68) (-11.15) (6.68) return (%)
***, **, * indicate significant at the 1, 5, and 10 percent level, respectively. Tests for differences in medians are based on a Wilcoxon sign-rank test statistic. Households are classified as female or male based on the gender of the person who opened the account. Beginning position value is the market value of common stocks held in
the first month that the household appears during our sample period. Mean monthly turnover is the average of sales and purchase turnover. [Median values are in brackets.] Own-benchmark abnormal returns are the average household percentage monthly abnormal return calculated as the realized monthly return for a household less the return that would have been earned if the household had held the beginning-of-year portfolio for the entire year (i.e., the twelve months beginning February 1). T-statistics for abnormal returns are in parentheses and are calculated using time-series standard errors across months.
I:>:) ....::J (j)
.0
~ t;5 ~ "'<:
C3 ~ ~ ~ t.>::l Q
~ ~ ~
at Vrije U
niversiteit, Library on M
arch 4, 2013http://qje.oxfordjournals.org/
Dow
nloaded from
BOYS WILL BE BOYS 277
sell earn reliably greater returns than the stocks they buy. We find that the stocks men choose to purchase underperform those that they choose to sell by twenty basis points per month (t =
- 2.79) .13 The stocks women choose to purchase underperform those they choose to sell by seventeen basis points per month (t = - 2.02). The difference in the underperformances of men and women is not statistically significant. (When we weight each trade equally rather than by its value, men's purchases underperform their sales by 23 basis points per month and women's purchases underperform their sales by 22 basis points per month.) Both men and women detract from their returns (gross and net) by trading; men simply do so more often.
While not pertinent to our hypotheses-which predict that overconfidence leads to excessive trading and that this trading hurts performance-one might want to compare the raw returns of men with those of women. During our sample period, men earned average monthly gross and net returns of 1.501 and 1.325 percent; women earned average monthly gross and net returns of 1.482 and 1.361 percent. Men's gross and net average monthly market-adjusted returns (the raw monthly return minus the monthly return on the CRSP value-weighted index) were 0.081 and -0.095 percent; women's gross and net average monthly market-adjusted returns were 0.062 and -0.059 percent.l4 For none of these returns are the differences between men and women statistically significant. The gross raw and market-adjusted returns earned by men and women differed in part because, as we document in subsection III.D, men tended to hold smaller, higher beta stocks than did women; such stocks performed well in our sample period.
In summary, our main findings are consistent with the two predictions of the overconfidence models. First, men, who are more overconfident than women, trade more than women (as measured by monthly portfolio turnover). Second, men lower their returns more through excessive trading than do women.
13. This t-statistic is calculated as
(Rim - R:m) t =---------
a(Rfm - R:m)! Jf2' 14. The gross (net) annualized geometric mean returns earned by men and
women were 18.7 (16.3) and 18.6 (16.9) percent, respectively.
at Vrije Universiteit, Library on March 4, 2013http://qje.oxfordjournals.org/Downloaded from

278 QUARTERLY JOURNAL OF ECONOMICS
Men lower their returns more than women because they trade more, not because their security selections are worse.
III.B. Single Men versus Single Women
If gender serves as a reasonable proxy for overconfidence, we would expect the differences in portfolio turnover and net return performance to be larger between the accounts of single men and single women than between the accounts of married men and married women. This is because, as discussed above, one spouse may make or influence decisions for an account opened by the other. To test this ancillary prediction, we partition our sample into four groups: married women, married men, single women, and single men. Because we do not have marital status for all heads of households in our data set, the total number of households that we analyze here is less than that previously analyzed by about 4400.
Position values and turnover rates of the portfolios held by the four groups are presented in the last six columns of Table II, Panel A. Married women tend to hold smaller common stock portfolios than married men; these differences are smaller between single men and single women. Differences in turnover are larger between single women and men than between married women and men, thus confirming our ancillary prediction.
In the last six columns of Table II, Panel B, we present the gross and net percentage monthly own-benchmark abnormal returns for common stock portfolios of the four groups. The gross monthly own-benchmark abnormal returns of single women (-0.029) and of single men (-0.074) are statistically significant at the 1 percent level, as is their difference (O.045-annually 0.54 percent). We again stress that it is not the superior timing ofthe security selections of women that leads to these gross return differences. Men (and particularly single men) are simply more likely to act (i.e., trade) despite their inferior ability.
The net monthly own-benchmark abnormal returns of married women (-0.154) and married men (-0.214) are statistically significant at the 1 percent level, as is their difference (0.060). The net monthly own-benchmark abnormal returns of single women (-0.121) and of single men (-0.242) are statistically significant at the 1 percent level, as is their difference (0.120-annually 1.4 percent). Single men underperform single women by significantly more than married men underperform married women (0.120 - 0.60 = 0.60; t = 2.80).
at Vrije Universiteit, Library on March 4, 2013http://qje.oxfordjournals.org/Downloaded from

BOYS WILL BE BOYS 279
In summary, if married couples influence each other's investment decisions and thereby reduce the effects of gender differences in overconfidence, then the results of this section are consistent with the predictions of the overconfidence models. First, men trade more than women, and this difference is greatest between single men and women. Second, men lower their returns more through excessive trading than do women, and this difference is greatest between single men and women.
III.C. Cross-Sectional Analysis of Turnover and Performance
Perhaps turnover and performance differ between men and women because gender correlates with other attributes that predict turnover and performance. We therefore consider several demographic characteristics known to affect financial decisionmaking: age, marital status, the presence of children in a household, and income.
To assess whether the differences in turnover can be attributed to these demographic characteristics, we estimate a crosssectional regression where the dependent variable is the observed average monthly turnover for each household. The independent variables in the regression include three dummy variables: marital status (one indicating single), gender (one indicating woman), and the presence of children (one indicating a household with children). In addition, we estimate the interaction between marital status and gender. Finally, we include the age of the person who opened the account and household income. Since our income measure is truncated at $125,000, we also include a dummy variable if household income was greater than $125,000.15
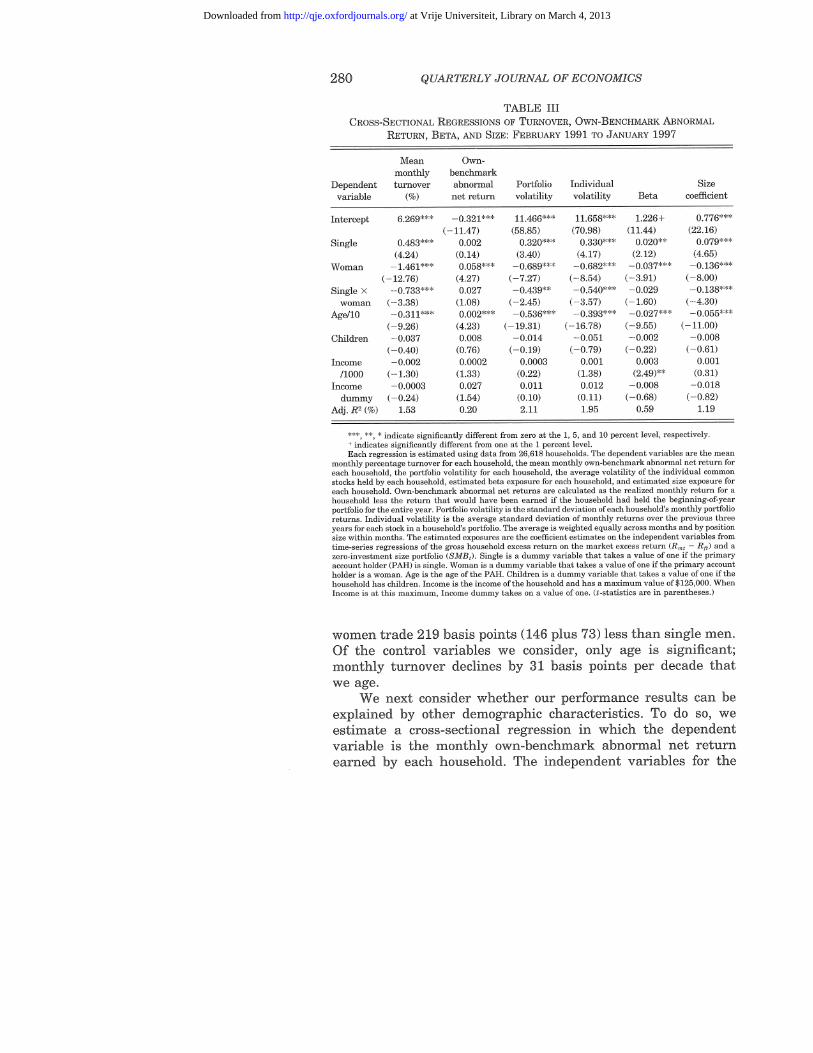
We present the results of this analysis in column 2 of Table III; they support our earlier findings. The estimated dummy variable on gender is highly significant (t = -12.76) and indicates that (ceteris paribus) the monthly turnover in married women's accounts is 146 basis points less than in married men's. The differences in turnover are significantly more pronounced between single women and single men; ceteris paribus, single
15. Average monthly turnover for each household is calculated for the months during which common stock holdings are reported for that household. Marital status, gender, the presence of children, age, and income are from Infobase's records as of June 8, 1997. Thus, the dependent variable is observed before the independent variables. This is also true for the cross-sectional tests reported below.
at Vrije Universiteit, Library on March 4, 2013http://qje.oxfordjournals.org/Downloaded from
280 QUARTERLY JOURNAL OF ECONOMICS
TABLE III CROSS-SECTIONAL REGRESSIONS OF TURNOVER, OWN-BENCHMARK ABNORMAL
RETURN, BETA, AND SIZE: FEBRUARY 1991 TO JANUARY 1997
Mean Own-monthly benchmark
Dependent turnover abnormal Portfolio Individual Size variable (%) net return volatility volatility Beta coefficient
Intercept 6.269*** -0.321*** 11.466*** 11.658*** 1.226+ 0.776*** ( -11.47) (58.85) (70.98) (11.44) (22.16)
Single 0.483*** 0.002 0.320*** 0.330*** 0.020** 0.079*** (4.24) (0.14) (3.40) (4.17) (2.12) (4.65)
Woman 1.461 *** 0.058*** -0.689*** -0.682*** --0.037*** -0.136*** ( -12.76) (4.27) ( -7.27) (-8.54) (--3.91) ( -8.00)
Single x -0.733*** 0.027 -0.439** -0.540*** -0.029 --0.138*** woman (-3.38) (1.08) (-2.45) (-3.57) ( -1.60) ( -4.30)
Age/l0 -0.311*** 0.002*** -0.536*** --0.393*** -0.027*** -0.055*** (-9.26) (4.23) ( -19.31) (-16.78) ( -9.55) ( -11.00)
Children -0.037 0.008 -0.014 --0.051 -0.002 -0.008 ( -0.40) (0.76) ( -0.19) (-0.79) (-0.22) (-0.61)
Income -0.002 0.0002 0.0003 0.001 0.003 0.001 /1000 ( --1.30) (1.33) (0.22) (1.38) (2.49)** (0.31)
Income -0.0003 0.027 0.011 0.012 -0.008 -0.018 dummy (-0.24) (1.54) (0.10) (0.11) (-0.68) (-0.82)
Adj. R2 (%) 1.53 0.20 2.11 1.95 0.59 1.19
***, **, * indicate significantly different from zero at the 1, 5, and 10 percent level, respectively. + indicates significantly different from one at the 1 percent level. Each regression is estimated using data from 26,618 households. The dependent variables are the mean
monthly percentage turnover for each household, the mean monthly own~benchmark abnormal net return for each household, the portfolio volatility for each household, the average volatility of the individual common stocks held by each household, estimated beta exposure for each household, and estimated size exposure for each household. Own~benchmark abnormal Ilet returns are calculated as the realized monthly return for a household less the return that would have been earned if the household had held the beginning~of-year portfolio for the entire year. Portfolio volatility is the standard deviation of each household's monthly portfolio returns. Individual volatility is the average standard deviation of monthly returns over the previous three years for each stock in a household's portfolio. The average is weighted equally across months and by position size within months. The estimated exposures are the coefficient estimates on the independent variables from time-series regressions of the gross household excess return on the market excess return (R mt - Rlt ) and a zero-investment size portfolio (SMB t ). Single is a dummy variable that takes a value of one if the primary account holder (PAR) is single. Woman is a dummy variable that takes a value of one if the primary account holder is a woman. Age is the age of the PAll. Children is a dummy variable that takes a value of one if the household has children. Income is the income of the household and has a maximum value of$125,000. VVhen Income is at this maximum, Income dummy takes on a value of one. (t-statistics are in parentheses.)
women trade 219 basis points (146 plus 73) less than single men. Of the control variables we consider, only age is significant; monthly turnover declines by 31 basis points per decade that we age.
We next consider whether our performance results can be explained by other demographic characteristics. To do so, we estimate a cross-sectional regression in which the dependent variable is the monthly own-benchmark abnormal net return earned by each household. The independent variables for the
at Vrije Universiteit, Library on March 4, 2013http://qje.oxfordjournals.org/Downloaded from
BOYS WILL BE BOYS 281
regression are the same as those previously employed. 16 The results of this analysis, presented in column 3 of Table III, confirm our earlier finding that men deduct more from their return performance by trading than do women. The estimated dummy variable on gender is highly significant (t = 4.27) and indicates that (ceteris paribus) the monthly own-benchmark abnormal net return for married men is 5.8 basis points less than for married women. The difference in the performance of single men and women, 8.5 basis points a month (5.8 plus 2.7), is even greater than that of their married counterparts, although not reliably so. Of the control variables that we consider, only age appears as statistically significant; own-benchmark abnormal net returns improve by 0.2 basis points per decade that we age. (The last four columns of Table III are discussed in the following subsection.)
III.D. Portfolio Risk
In this subsection we estimate risk characteristics of the common stock investments of men and women. Although not the central focus of our inquiry, we believe the results that we present here are the first to document that women tend to hold less risky positions than men within their common stock portfolios. Our analysis also provides additional evidence that men decrease their portfolio returns through trading more so than do women.
We estimate market risk (beta) and the risk associated with small firms by estimating the following two-factor monthly timeseries regression:
(RMf - Rft) = OLi + f3i(R mt -- R ft ) + 8iSMBt + Ei/)
where
Rft = the monthly return on T-Bills,17
16. The statistical significance of the results reported in this section should be interpreted with caution. On one hand, the standard errors of the coefficient estimates are likely to be infl.ated, since the dependent variable is estimated with error. (Although we observe several months of each household's own-benchmark returns, a household's observed own-benchmark returns may differ from its long-run average.) On the other hand, these standard errors may be deflated, since different households may choose to trade in or out of the same security resulting in cross-sectional dependence in the abnormal performance measure across households. We suspect that the problem of cross-sectional dependence is not severe, since the average household invests in only four securities.
To reduce the undue infl.uence of a few households with position statements for only a few months, we delete those households with less than three years of positions. The tenor of our results is similar if we include these households.
17. The return on T-bills is from Stocks, Bonds, Bills, and Inflation, 1997 Yearbook, Ibbotson Associates, Chicago, IL.
at Vrije Universiteit, Library on March 4, 2013http://qje.oxfordjournals.org/Downloaded from
282 QUARTERLY JOURNAL OF ECONOMICS
R mt = the monthly return on a value-weighted market index, 5MB t = the return on a value-weighted portfolio of small stocks
minus the return on a value-weighted portfolio of big stocks,18
(Xi = the intercept, l3i = the market beta, Si = coefficient of size risk, and
Eit = the regression error term.
The subscript i denotes parameter estimates and error terms from regression i, where we estimate twelve regressions: one each for the gross and net performances of the average man, the average married man, and the average single man, and one each for the gross and net performance of the average woman, the average married woman, and the average single woman.
In each regression the estimate of l3i measures portfolio risk due to covariance with the market portfolio. The estimate of Si
measures risk associated with the size of the firms held in a portfolio; a larger value of Si denotes increased exposure to small stocks. Fama and French [1993] and Berk [1995] argue that firm size is a proxy for risk.19 Finally, the intercept, (Xi, is an estimate of risk-adjusted return and thus provides an alternative performance measure to our own-benchmark abnormal return.
The results of this analysis are presented in Table N. The time-series regressions of the gross average monthly excess return earned by women and men on the market excess return and a size based zero-investment portfolio reveal that women hold less risky positions than men. While, relative to the total market, both women and men tilt their portfolios toward high beta, small firms, women do so less. These regressions also confirm our finding that men decrease their portfolio returns through trading more so than do women. Men and women earn similar gross and net returns; however, men do so by investing in smaller stocks
18. The construction of this portfolio is discussed in detail in Fama and French [1993]. We thank Kenneth French for providing us with these data.
19. Berk [1995] points out that systematic effects in returns are likely to appear in price, since price is the value of future cash flows discounted by expected return. Thus, size and the book-to-market ratio are likely to correlate with cross-sectional differences in expected returns. Fama and French [1993] also claim that size and the book-to-market ratio proxy for risk. Not all authors agree that book-to-market ratios are risk proxies (e.g., Lakonishok, Shleifer, and Vishny [1994]). Our qualitative results are unaffected by the inclusion of a book-tomarket factor.
at Vrije Universiteit, Library on March 4, 2013http://qje.oxfordjournals.org/Downloaded from

TABLE IV RISK EXPOSURES AND RISK-ADJUSTED RETURNS OF COMMON STOCK INVESTMENTS OF FEMALE
AND MALE HOUSEHOLDS: FEBRUARY 1991 TO JANUARY 1997
All households Married households Single households
Difference Difference Difference Women Men (women-men) Women Men (women-men) Women Men (women-men)
Number of households 8,005 29,659 NA 4,894 19,741 NA 2,306 6,326 NA
Panel A: Gross average household percentage monthly returns
Two-factor model intercept
Two-factor -0.044 -0.083 0.039 -0.051 -0.082 0.031 -0.036 -0.099 0.063
model coefficient estimate on (R mt -
R ft ) 1.050*** 1.081 *** -0.031** 1.053*** 1.075*** 0.022* 1.035*** 1.088*** 0.053*** Two-factor
model coefficient estimate onSMBt 0.360*** 0.519*** -0.159*** 0.380*** 0.490*** 0.109*** 0.307*** 0.582*** 0.275***
Adjusted R2 93.8 92.0 65.3 93.4 92.1 52.8 94.4 91.5 70.6
Panel B: Net average household percentage monthly returns
Two-factor model intercept -0.162* -0.253** 0.091 *** -0.171** -0.245** 0.074** -0.142** -0.285** 0.143***
", **, * indicate significant at the 1, 5, and 10 percent level, respectively. Households are classified as female or male based on the gender of the person who opened the account. Households are classified as married or single based on the marital status
of the head of household. Coefficient and intercept estimates for the two-factor model are those from a time-series regression of the gross (net) average household excess return on the market excess return (R mt - R ft ) and a zero-investment size portfolio (8MB t ): (RMr - R ft ) = <Xl + ~i(Rmt - Rtf} + B l 8MB t + E/,f'
b:l a ~ ~ t-< t-< b:l tt:l b:l a ~
t-:l 00 W
at Vrije U
niversiteit, Library on M
arch 4, 2013http://qje.oxfordjournals.org/
Dow
nloaded from

284 QUARTERLY JOURNAL OF ECONOMICS
with higher market risk. 20 The intercepts from the two-factor regressions of net returns (Table IV, Panel B) suggest that, after a reasonable accounting for the higher market and size risks of men's portfolios, women earn net returns that are reliably higher (by nine basis points per month or 1.1 percent annually) than those earned by men. 21
Beta and size may not be the only two risk factors that concern individual investors. These investors hold, on average, only four common stocks in their portfolios. Those without other common stock or mutual fund holdings bear a great deal of idiosyncratic risk. To measure differences in the idiosyncratic risk exposures of men and women, we estimate the volatility of their common stock portfolios as well as the average volatility of the stocks they hold. We calculate portfolio volatility as the standard deviation of each household's monthly portfolio returns for the months in which the household held common stocks. We calculate the average volatility of the individual stocks they hold as the average standard deviation of monthly returns during the previous three calendar years for each stock in a household's portfolio. This average is weighted by position size within months and equally across months.
To test whether men and women differ in the volatility of their portfolios and of the stocks they hold, and to confirm that they differ in the market risk and size risk of their portfolios, we estimate four additional cross-sectional regressions. As in the cross-sectional regressions of turnover and own-benchmark returns, the independent variables in these regressions include dummy variables for marital status, gender, the presence of children in the household, and the interaction between marital status and gender, as well as variables for age and income and a dummy
20. During our sample period, the mean monthly return on 5MB t was seventeen basis points.
21. Fama and French [1993] argue that the risk of common stock investments can be parsimoniously summarized as risk related to the market, firm size, and a firm's book-to-market ratio. When the return on a value-weighted portfolio of high book-to-market stocks minus the return on a value-weighted portfolio of low book-to-market stocks (HML t ) is added as an independent variable to the twofactor monthly time-series regressions, we find that both men and women tilt their portfolios toward high book-to-market stocks, although men do more so. The intercepts from these regressions indicate that after accounting for the market, size, and book-to-market tilts of their portfolios, women outperformed men by twelve basis points a month (1.4 percent annually). Lyon, Barber, and Tsai [1999] document that intercept tests using the three-factor model are well specified in random samples and samples of large or small firms. Thus, the Fama-French intercept tests account well for the small stock tilt of individual investors. During our sample period, the mean monthly return on HML t was twenty basis points.
at Vrije Universiteit, Library on March 4, 2013http://qje.oxfordjournals.org/Downloaded from

BOYS WILL BE BOYS 285
variable for income over $125,000. The dependent variable is alternately, the volatility of each household's portfolio, the average volatility of the individual stocks held by each household, the coefficient on the market risk premium (i.e., beta) and the coefficient on the size zero-investment portfolio. Both coefficients are estimated from the two-factor model described above.22
We present the results of these regressions in the last four columns of Table III. For all four risk measures (portfolio volatility, individual stock volatility, beta, and size) men invest in riskier positions than women. Of the control variables that we consider, marital status, age, and income appear to be correlated with the riskiness ofthe stocks in which a household invests. The young and single hold more volatile portfolios composed of more volatile stocks. They are more willing to accept market risk and to invest in small stocks. Those with higher incomes are also more willing to accept market risk. These results are completely in keeping with the common-sense notion that the young and wealthy with no dependents are willing to accept more investment risk.
The risk differences in the common stock portfolios held by men and women are not surprising. There is considerable evidence that men and women have different attitudes toward risk. From survey responses of 5200 men and 6400 women, Barsky, ,Juster, Kimball, and Shapiro [1997J conclude that women are more risk-averse than men. Analyzing off-track betting slips for 2000 men and 2000 women, Bruce and Johnson [1994] find that men take larger risks than women although they find no evidence of differences in performance. Jianakoplos and Bernasek [1998] report that roughly 60 percent of the female respondents to the 1989 Survey of Consumer Finances, but only 40 percent of the men, said they were not willing to take any financial risks. Karabenick and Addy [1979], Sorrentino, Hewitt, and Raso-Knott [1992], and Zinkhan and Karande [1991] observe that men have riskier preferences than women. Flynn, Slovic, and Mertz [1994], Finucane, Slovic, Mertz, Flynn, and Satterfield [2000], and Finucane and Slovic [1999] find that white men perceive a wide variety of risks as lower than do women and nonwhite men. Bajtelsmit and Bernasek [1996], Bajtelsmit and VanDerhei
22. These regressions are estimated for households with at least three years of available data. Statistical inference might also be affected by measurement error in the dependent variable and cross-sectional dependence in the risk measures (see footnotes 11 and 12).
at Vrije Universiteit, Library on March 4, 2013http://qje.oxfordjournals.org/Downloaded from

286 QUARTERLY JOURNAL OF ECONOMICS
[1997], Hinz, McCarthy, and Turner [1997], and Sunden and Surette [1998] find that men hold more of their retirement savings in risky assets. Jianakoplos and Bernasek [1998] report the same for overall wealth. Papke [1998], however, finds in a sample of near retirement women and their spouses, that women do not invest their pensions more conservatively than men.
IV. COMPETING EXPLANATIONS FOR DIFFERENCES
IN TURNOVER AND PERFORMANCE
IV.A. Risk Aversion
Since men and women differ in both overconfidence and risk aversion, it is natural to ask whether differences in risk aversion alone explain our findings. They do not. While rational informed investors will trade more ifthey are less risk averse, they will also improve their performance by trading. Thus, if rational and informed, men (and women) should improve their performance by trading. But both groups hurt their performance by trading. And men do so more than women. This outcome can be explained by differences in the overconfidence of men and women and by differences in the risk aversion of overconfident men and women. It cannot be explained by differences in risk aversion alone.
IV.B. Gambling
To what extent may gender differences in the propensity to gamble explain the differences in turnover and returns that we observe? There are two aspects of gambling that we consider: risk-seeking and entertainment.
Risk-seeking is when one demonstrates a preference for outcomes with greater variance but equal or lower expected return. In equity markets the simplest way to increase variance without increasing expected return is to underdiversify. Excessive trading has a related, but decidedly different effect; it decreases expected returns without decreasing variance. Thus risk-seeking may account for underdiversification (although lack of diversification could also result from simple ignorance of its benefits or from overconfidence), but it does not explain excessive trading.
It may be that some men, and to a lesser extent women, trade for entertainment. They may enjoy placing trades that they expect, on average, will lose money. It is more likely that even those who enjoy trading believe, overconfidently, that they have trading
at Vrije Universiteit, Library on March 4, 2013http://qje.oxfordjournals.org/Downloaded from
BOYS WILL BE BOYS 287
ability. This would be consistent with the Gallup Poll finding (reported in subsection I.E) that both men and women expect their own portfolios to outperform the market, but that men anticipate a greater outperformance.
Some investors may set aside a small portion of their wealth to trade for entertainment, while investing the majority more prudently. If "entertainment accounts" are driving our findings, we would expect turnover and underperformance to decline as the common stocks in the accounts we observe represent a larger proportion of each household's total wealth. We find, however, that this is not the case.
Approximately one-third of our households reported their net worth at the time they opened their accounts. We calculate the proportion of net worth invested in the common stock portfolios we observe as the beginning value of a household's common stock investments scaled by its self-reported net worth. 23 We then analyze the turnover and investment performance of 2333 households with at least 50 percent of their net worth invested in common stock at this brokerage. These households have similar turnover (6.25 percent per month,24 75 percent annually) to our full sample (Table II). Furthermore, these households earn gross and net returns that are very similar to the full sample.
If households trade actively solely for entertainment, then it is likely that the households that trade most actively find trading most entertaining. How much does active trading cost these households compared with their other household expenses? To estimate the cost of trading for the 20 percent of households in our sample that trade most actively, we calculate the monthly dollar loss as the own-benchmark abnormal return times the beginning of month position value. This monthly dollar loss is averaged across months for each household and multiplied by twelve to obtain an average annual cost oftrading. The average annual cost of trading for the quintile of most active traders is $2849. The Department of Labor Consumer Expenditure Survey reports on various categories of household expenditures. The Survey partitions households into quintiles based on household income. The average annual income ($74,000)25 of the quintile of most actively
23. This estimate is biased because the account opening date generally precedes our first position observation and net worth is likely to have increased in the interimo
24. The standard error of the mean turnover is 0020 250 This average annual income is understated since in calculating
at Vrije Universiteit, Library on March 4, 2013http://qje.oxfordjournals.org/Downloaded from

288 QUARTERLY JOURNAL OF ECONOMICS
trading households in our sample corresponds most closely to that of the mean income ($92,523) of the top quintile of the 1996 Survey. The active traders in our sample spent on average 3.9 percent oftheir annual income on trading costs, while comparable households in the Survey spent 3.3 percent of their income on utilities, 2.6 percent on health care, and 4.0 percent on all entertainment expenses including fees, admissions, television, radio, and sound equipment, pets, toys, and playground equipment. If the active traders in our sample are trading solely for entertainment, they must find it very entertaining indeed.
For mutual funds, as for individuals, turnover has a negative impact on returns [Carhart 1997].26 Some mutual fund managers may actively trade, and thereby knowingly reduce their funds' expected returns, simply to create the illusion that they are providing a valuable service [Dow and Gorton 1994]. If the majority of active managers believe that they offer only disservice to their clients, this is a cynical industry indeed. We propose that most mutual fund managers, while aware that active management on average detracts value, believe that their personal ability to manage is above average. Thus, they are motivated to trade by overconfidence, not cynicism.
Individuals may trade for entertainment. Mutual fund managers may trade to appear busy. It is unlikely that most individuals churn their accounts to appear busy or that most fund managers trade for fun. Overconfidence offers a simple explanation for the high trading activity of both groups.
v. CONCLUSION
Modern financial economics assumes that we behave with extreme rationality; but, we do not. Furthermore, our deviations from rationality are often systematic. Behavioral finance relaxes the traditional assumptions of financial economics by incorporating these observable, systematic, and very human departures from rationality into standard models of financial markets. Overconfidence is one such departure. Models that assume market
average household income, we treat households in the over $125,000 category as if their incomes were $125,000. These account for less than 12 percent of the households for which we have income data.
26. Lakonishok, Shleifer, and Vishny [1992] report a positive relation between turnover and performance for 769 all-equity pension funds, although this finding puzzles the authors.
at Vrije Universiteit, Library on March 4, 2013http://qje.oxfordjournals.org/Downloaded from

BOYS WILL BE BOYS 289
participants are overconfident yield one central prediction: overconfident investors will trade too much.
We test this prediction by partitioning investors on the basis of a variable that provides a natural proxy for overconfidencegender. Psychological research has established that men are more prone to overconfidence than women, particularly so in male-dominated realms such as finance. Rational investors trade only if the expected gains exceed transactions costs. Overconfident investors overestimate the precision of their information and thereby the expected gains of trading. They may even trade when the true expected net gains are negative. Models of investor overconfidence predict that, since men are more overconfident than women, men will trade more and perform worse than women.
Our empirical tests provide strong support for the behavioral finance model. Men trade more than women and thereby reduce their returns more so than do women. Furthermore, these differences are most pronounced between single men and single women.
Individuals turn over their common stock investments about 70 percent annually [Barber and Odean 2000]. Mutual funds have similar turnover rates [Carhart 1997]. Yet, those individuals and mutual funds that trade most earn the lowest returns. We believe that there is a simple and powerful explanation for the high levels of counterproductive trading in financial markets: overconfidence.
UNIVERSITY OF CALIFORNIA, DAVIS
REFERENCES
Alpert, Marc, and Howard Raiffa, "A Progress Report on the Training of Probability Assessors," in Judgment Under Uncertainty: Heuristics and Biases, Daniel Kahneman, Paul Slovic, and Amos Tversky, eds. (Cambridge and New York: Cambridge University Press, 1982), pp. 294-305.
Bajtelsmit, Vickie L., and Alexandra Bernasek, "Why Do Women Invest Differently than Men?" Financial Counseling and Planning, VII (1996), 1-10.
Bajtelsmit, Vickie L., and Jack L. VanDerhie, "Risk Aversion and Pension Investment Choices," in Positioning Pensions for the Twenty-first Century, Michael S. Gordon, Olivia S. Mitchell, and Marc M. Twinney, eds. (Philadelphia: University of Pennsylvania Press, 1997), pp. 45-65.
Barber, Brad M., and Terrance Odean, "Trading Is Hazardous to Your Wealth: The Common Stock Investment Performance of Individual Investors," Journal of Finance, LV (2000),773-806.
Barsky, Robert B., F. Thomas Juster, Miles S. Kimball, and Matthew D. Shapiro, "Preference Parameters and Behavioral Heterogeneity: An Experimental Approach in the Health and Retirement Study," Quarterly Journal of Economics, CXII (1997), 537-579.
at Vrije Universiteit, Library on March 4, 2013http://qje.oxfordjournals.org/Downloaded from

290 QUARTERLY JOURNAL OF ECONOMICS
Baumann, Andrea 0., Raisa B. Deber, and Gail G. Thompson, "Overconfidence among Physicians and Nurses: The 'Micro-Certainty, Macro-Uncertainty' Phenomenon," Social Science and Medicine, XXXII (1991),167-174.
Benos, Alexandros V., "Overconfident Speculators in Call Markets: Trade Patterns and Survival," Journal of Financial Markets, I (1998), 353-383.
Berk, Jonathan, "A Critique of Size Related Anomalies," Review of Financial Studies, vm (1995), 275-286.
Beyer, Sylvia, "Gender Differences in the Accuracy of Self-Evaluations of Performance," Journal of Personality and Social Psychology, LIX (1990), 960-970.
Beyer, Sylvia, and Edward M. Bowden, "Gender Differences in Self-Perceptions: Convergent Evidence from Three Measures of Accuracy and Bias," Personality and Social Psychology Bulletin, XXIII (1997), 157-172.
Bruce, Alistair C., and Johnnie E. Johnson, "Male and Female Betting Behaviour: New Perspectives," Journal of Gambling Studies, X (1994),183-198.
Caballe, Jordi, and J6zsef Sakovics, "Overconfident Speculation with Imperfect Competition," working paper, Universitat Autonoma de Barcelona, Spain, 1998.
Carhart, Mark M., "On Persistence in Mutual Fund Performance," Journal of Finance, LH (1997), 57-82.
Christensen-Szalanski, Jay J., and James B. Bushyhead, "Physicians' Use of Probabilistic Information in a Real Clinical Setting," Journal of Experimental Psychology: Human Perception and Performance, vn (1981), 928-935.
Cooper, Arnold C., Carolyn Y. Woo, and William C. Dunkelberg, "Entrepreneurs' Perceived Chances for Success," Journal of Business Venturing, HI (1988), 97-108.
Daniel, Kent, David Hirshleifer, and Avanidar Subrahmanyam, "Investor Psychology and Security Market Under- and Overreactions," Journal of Finance, LUI (1998), 1839-1885.
Deaux, Kay, and Tim Emswiller, "Explanations of Successful Performance on Sex-Linked Tasks: What Is Skill for the Male is Luck for the Female," Journal of Personality and Social Psychology, XXIX (1974),80-85.
Deaux, Kay, and Elizabeth Farris, "Attributing Causes for One's Own Performance: The Effects of Sex, Norms, and Outcome," Journal of Research in Personality, XI (1977), 59-72.
De Long, J. Bradford, Andrei Shleifer, Lawrence H. Summers, and Robert J. Waldmann, "The Survival of Noise Traders in Financial Markets," Journal of Business, LXIV (1991), 1-19.
Dow, James, and Gary Gorton, "Noise Trading, Delegated Portfolio Management, and Economic Welfare," Journal of Political Economy, CV (1994),1024-1050.
Fama, Eugene F., and Kenneth R. French, "Common Risk Factors in Returns on Stocks and Bonds," Journal of Financial Economics, XXXIII (1993), 3-56.
Finucane, Melissa, and Paul Slovic, "Risk and the White Male: A Perspective on Perspectives," Framtider, XVIII (1999), 24-29.
Finucane, Melissa, Paul Slovic, C. K. Mertz, James Flynn, and Theresa Satterfield, "Gender, Race, and Perceived Risk: The 'White Male' Effect," Health, Risk and Society, II (2000), 159-179.
Fischhoff, Baruch, Paul Slovic, and Sarah Lichtenstein, "Knowing with Certainty: The Appropriateness of Extreme Confidence," Journal of Experimental Psychology, HI (1977), 552-564.
Flynn, James, Paul Slovic, and C. K. Mertz, "Gender, Race, and Perception of Environmental Health Risks," Risk Analysis, XN (1994), 1101-1108.
Frank, Jerome D., "Some Psychological Determinants of the Level of Aspiration," American Journal of Psychology, XLVn (1935), 285-293.
Gervais, Simon, and Terrance Ode an, "Learning to Be Overconfident," working paper, Wharton School, University of Pennsylvania, 1998.
Griffin, Dale, and Amos Tversky, "The Weighing of Evidence and the Determinants of Confidence," Cognitive Psychology, XXN (1992), 411-435.
Grinblatt, Mark, and Sheridan Titman, "Performance Measurement without Benchmarks: An Examination of Mutual Fund Returns," Journal of Business, LXVI (1993), 47-68.
Grossman, Sanford J., and Joseph E. Stiglitz, "On the Impossibility of Informa-
at Vrije Universiteit, Library on March 4, 2013http://qje.oxfordjournals.org/Downloaded from

BOYS WILL BE BOYS 291
tionally Efficient Markets," American Economic Review, LXX (1980), 393-408.
Harris, Milton, and Artur Raviv, "Differences of Opinion Make a Horse Race," Review of Financial Studies, VI (1993),473-506.
Hinz, Richard P., David D. McCarthy, and John A. Turner, "Are Women Conservative Investors? Gender Differences in Participant-Directed Pension Investments," in Positioning Pensions for the Twenty-first Century, Michael S. Gordon, Olivia S. Mitchell, and Marc M. Twinney, eds. (Philadelphia: University of Pennsylvania Press, 1997), pp. 91-103.
Jianakoplos, Nancy A., and Alexandra Bernasek, "Are Women More Risk Averse?" Economic Inquiry, XXXVI (1998), 620-630.
Karabenick, Stuart A., and Milton M. Addy, "Locus of Control and Sex Differences in Skill and Chance Risk-Taking Conditions," Journal of General Psychology, C (1979), 215-228.
Kidd, John B., "The Utilization of Subjective Probabilities in Production Planning," Acta Psychologica, XXXIV (1970),338-347.
Kyle, Albert S., and F. Albert Wang, "Speculation Duopoly with Agreement to Disagree: Can Overconfidence Survive the Market Test?" Journal of Finance, LII (1997), 2073-2090.
Lakonishok, Josef, Andrei Shleifer, and Robert W. Vishny, "The Structure and Performance of the Money Management Industry," in Martin Neil Baily and Clifford Winston, eds., Brookings Papers on Economic Activity: Microeconomics (Washington, DC: Brookings Institution, 1992).
Lakonishok, Josef, Andrei Shleifer, and Robert W. Vishny, "Contrarian Investment, Extrapolation, and Risk," Journal o[.Finance, LIX (1994), 1541-1578.
Lenney, Ellen, "Women's Self-Confidence in Achievement Settings," Psychological Bulletin, LXXXIV (1977), 1-13.
Lewellen, Wilber G., Ronald C. Lease, Gary G. Schlarbaum, "Patterns of Investment Strategy and Behavior among Individual Investors," Journal of Business, L (1977), 296-333.
Lichtenstein, Sarah, and Baruch Fischhoff, "The Effects of Gender and Instructions on Calibration," Decision Research Report 81-5. Eugene, OR, Decision Research, 1981.
Lichtenstein, Sarah, Baruch Fischhoff, and Lawrence Phillips, "Calibration of Probabilities: The State of the Art to 1980," in Judgment Under Uncertainty: Heuristics and Biases, Daniel Kahneman, Paul Slovic, and Amos Tversky, eds. (Cambridge and New York: Cambridge University Press, 1982).
Lundeberg, Mary A., Paul W. Fox, Judith Punccohar, "Highly Confident but Wrong: Gender Differences and Similarities in Confidence Judgments," Journal of Educational Psychology, LXXXVI (1994), 114-121.
Lyon, ,John D., Brad M. Barber, and Chih-Ling Tsai, "Improved Methods for Tests of Long-Run Abnormal Stock Returns," Journal of Finance, LIV (1999), 165-201.
Meehan, Anita M., and Willis F. Overton, "Gender Differences in Expectancies for Success and Performance on Piagetian Spatial Tasks," Merrill-Palmer Quarterly, XXXII (1986), 427-44l.
Neale, Margaret A., and Max H. Bazerman, Cognition and Rationality in Negotiation (New York: The Free Press, 1990).
Odean, Terrance, "Volume, Volatility, Price, and Profit When All Traders Are above Average," Journal of Finance, LUI (1998), 1887-1934.
--, "Do Investors Trade Too Much?" American Economic Review, LXXXIX (1999), 1279-1298.
Oskamp, Stuart, "Overconfidence in Case-Study ,Judgments," Journal of Consulting Psychology, XXIX (1965),261-265.
Papke, Leslie E., "Individual Financial Decisions in Retirement Savings Plans: The Role of Participant-Direction," working paper, Michigan State University, 1998.
Prince, Melvin, "Women, Men, and Money Styles," Journal of Economic Psychology, XIV (1993),175-182.
Russo, J. Edward, and Paul J. H. Schoemaker, "Managing Overconfidence," Sloan Management Review, XXXIn (1992), 7-17.
Sorrentino, Richard M., Erin C. Hewitt, and Patricia A. Raso-Knott, "Risk-Taking
at Vrije Universiteit, Library on March 4, 2013http://qje.oxfordjournals.org/Downloaded from

292 QUARTERLY JOURNAL OF ECONOMICS
in Games of Chance and Skill: Information and Mfective Influences on Choice Behavior," Journal of Personality and Social Psychology, LXII (1992), 522-533.
Stael von Holstein, Carl-Axel S., "Probabilistic Forecasting: An Experiment Related to the Stock Market," Organizational Behavior and Human Performance, VIII (1972), 139-158.
Sunden, Annika E., and Brian J. Surette, "Gender Differences in the Allocation of Assets in Retirement Savings Plans," working paper, Board of Governors of the Federal Reserve System, 1998.
Varian, Hal R., "Differences of Opinion in Financial Markets," Financial Risk: Theory, Evidence and Implications, Courtenay C. Stone, ed. (Proceedings of the Eleventh Annual Economic Policy conference ofthe Federal Reserve Bank of St. Louis, Boston, 1989).
Wagenaar, Willem, and Gideon B. Keren, "Does the Expert Know? The Reliability of Predictions and Confidence Ratings of Experts," in Intelligent Decision Support in Process Environments, Erik Hollnagel, Giuseppe Mancini, and David D. Woods, eds. (Berlin: Springer, 1986).
Yates, J. Frank, Judgment and Decision Making (Englewood Cliffs, NJ: Prentice Hall, 1990).
Zinkhan, George M., and Kiran W. Karande, "Cultural and Gender Differences in Risk-Taking Behavior among American and Spanish Decision Makers," Journal of Social Psychology, CXXXI (1991), 741-742.
at Vrije Universiteit, Library on March 4, 2013http://qje.oxfordjournals.org/Downloaded from