downtown market analysis - faribault area chamber of commerce
TRANSCRIPT
FARIBAULT MAIN STREET
Downtown Market Analysis Faribault, Minnesota
Prepared
September 2011
Copyright ©2011 IN(ALLIANCE), LLC
IN(ALLIANCE) was engaged by Minnesota Main Street to conduct a market analysis of Downtown Faribault with Faribault Main Street, to evaluate current trends regarding business development that will shape near‐term prospects for the downtown business district. IN(ALLIANCE)’s approach included the following steps:
Examination of existing market demographics and associated trends.
Discussion of the retail market, highlighting national trends in retail sales, regional and sector‐ specific pull factors and trends in Faribault’s retail and entertainment environment.
A discussion of the cultural diversity trends affecting business development in the downtown.
A discussion of the residential market potential in the downtown area.
A discussion of current downtown real estate fundamentals, barriers to reuse of existing buildings, and methods to overcome them.
Sources
Data for this analysis was collected from a host of sources, including:
The U.S. Census Bureau and Bureau of Labor Statistics
Graphical Information System (GIS) data from ESRI
Faribault Area Chamber of Commerce
Surveys conducted in Faribault June‐July, 2011
Association and industry data as noted in report
Downtown Faribault business owners
Focus groups of downtown Faribault stakeholders
Acknowledgments
The following individuals are noted for their support to the process:
Emily Northey, Program Coordinator for Minnesota Main Street, Preservation Alliance of Minnesota Kymn Anderson, Director, Faribault Area Chamber of Commerce Kelly Henry, Intern, Faribault Area Chamber of Commerce/Faribault Main Street Bruce Burkhartzmeyer, Board Co‐Chair, Faribault Main Street Peggy Keilen, Board Co‐Chair, Faribault Main Street Prepared by IN(ALLIANCE), LLC 1722 West Homewood Ave. Springfield, IL 62701 Copyright ©2011 This project has been financed in part with funds provided by the State of Minnesota from the Arts and Cultural Heritage Fund through Minnesota Historical Society.
Contents Introduction .................................................................................................................................................. 1
Methodology ................................................................................................................................................. 2
Targeted Area ............................................................................................................................................... 3
Demographic and Economic Base Assessment ............................................................................................. 4
Population trends in 5 minute radius from downtown Faribault ............................................................. 4
Population trend 30 minute radius of downtown Faribault ..................................................................... 4
Population trend 60 minute radius of downtown Faribault ..................................................................... 5
Key population trends in 30 minute radius of downtown Faribault ......................................................... 5
Population by age and household income ............................................................................................ 5
Population by Employment................................................................................................................... 6
Population by Education ....................................................................................................................... 6
Retail Market Assessment ............................................................................................................................ 6
Downtown Surveys ................................................................................................................................... 6
Target Market ........................................................................................................................................... 7
Downtown Faribault’s Competitive Position ............................................................................................ 7
Downtown Faribault Market Potential ......................................................................................................... 8
Spending Potential Index .......................................................................................................................... 8
Leakage ................................................................................................................................................... 10
Downtown Traffic ................................................................................................................................... 12
Entertainment Venues ............................................................................................................................ 12
Creating Destinations .............................................................................................................................. 12
Business Opportunity .................................................................................................................................. 14
Unique Dining Experience ....................................................................................................................... 14
Unique Drinking Establishment .............................................................................................................. 15
Types of craft brew market segments ................................................................................................ 15
History of Faribault and Brewing ........................................................................................................ 16
Unique Clothier ....................................................................................................................................... 16
Boutique Retail ........................................................................................................................................ 17
Recruiting Boutique Retail .................................................................................................................. 17
Pop Ups ............................................................................................................................................... 18
Observations for Downtown Faribault ....................................................................................................... 19
Cultural diversity in downtown Faribault ............................................................................................... 19
Resources for Somali population integration ..................................................................................... 20
Safety in the Downtown ......................................................................................................................... 20
Downtown Building Improvement .......................................................................................................... 21
Recommendations and Implementation .................................................................................................... 23
Organization ............................................................................................................................................ 23
Branding the Downtown ..................................................................................................................... 23
Commitment ....................................................................................................................................... 23
Design ...................................................................................................................................................... 24
Inventory Downtown Assets ............................................................................................................... 24
Building Inventory ............................................................................................................................... 24
Second Story Residential ..................................................................................................................... 24
Pedestrian Safety ................................................................................................................................ 25
Building Improvement and Signage .................................................................................................... 25
Economic Restructuring .......................................................................................................................... 25
Business Retention .............................................................................................................................. 26
Promotion ............................................................................................................................................... 27
Committee Work Plans ............................................................................................................................... 30
1 | P a g e
Introduction Understanding the downtown environment and downtown’s role in the 21st century is critical to the success of downtown Faribault in the future. The formation of Faribault Main Street was an important initial step. This market analysis has been undertaken to provide a context for focusing future downtown improvement activities.
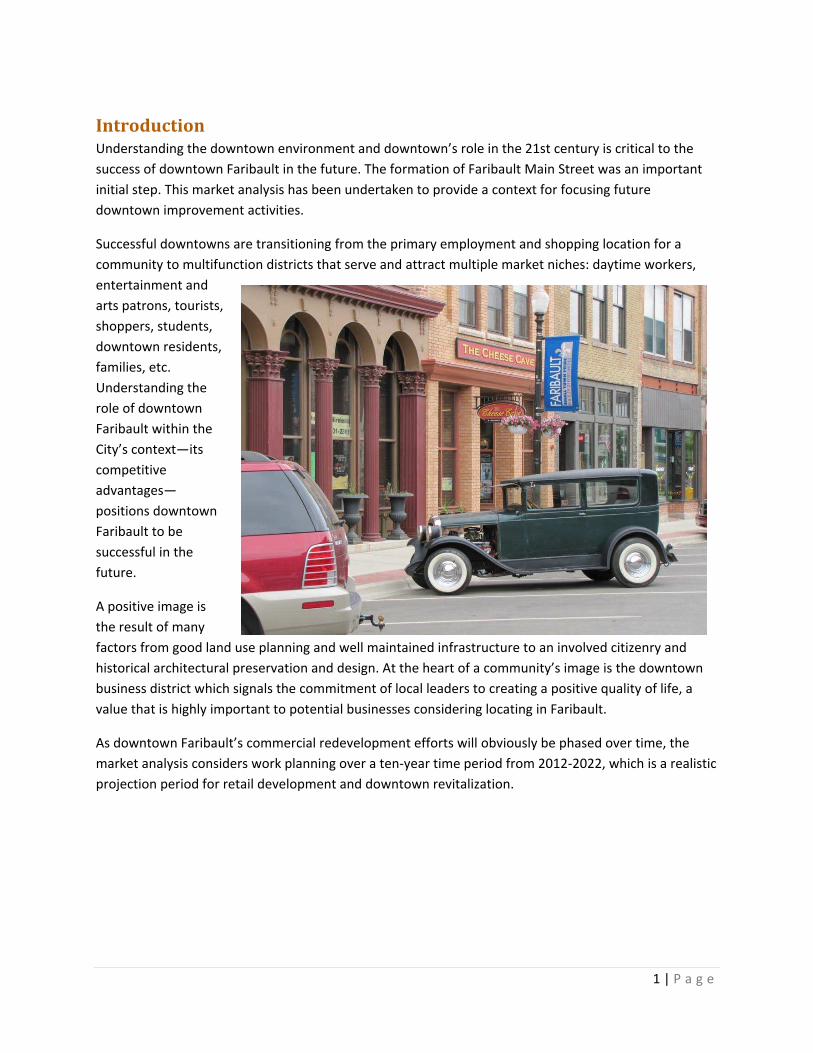
Successful downtowns are transitioning from the primary employment and shopping location for a community to multifunction districts that serve and attract multiple market niches: daytime workers, entertainment and arts patrons, tourists, shoppers, students, downtown residents, families, etc. Understanding the role of downtown Faribault within the City’s context—its competitive advantages—
positions downtown Faribault to be successful in the future.
A positive image is the result of many factors from good land use planning and well maintained infrastructure to an involved citizenry and historical architectural preservation and design. At the heart of a community’s image is the downtown business district which signals the commitment of local leaders to creating a positive quality of life, a value that is highly important to potential businesses considering locating in Faribault.
As downtown Faribault’s commercial redevelopment efforts will obviously be phased over time, the market analysis considers work planning over a ten‐year time period from 2012‐2022, which is a realistic projection period for retail development and downtown revitalization.
2 | P a g e
Methodology As part of the methodology for this assignment, IN(ALLIANCE) engaged a variety of tactics to model business development for downtown Faribault. The research (both primary and secondary) includes a statistical estimate of potential retail development, the results of a community‐wide resident survey of shopping preferences, a survey of the downtown Faribault business community, three focus groups, personal interviews with local leaders, and in‐store visits to over 20 Faribault businesses and stakeholders. The interviewees included local merchants, building owners, real estate developers, various stakeholders, and government officials. The interview comments reflected a range of opinions and perspectives about the current situation in downtown Faribault. The comments were considered in light of IN(ALLIANCE)’s experience to help frame key perceptions, issues, and realities about the community, its economic position, and near‐term implications:
The downtown area supports a mix of retail, services, restaurants and a theatre.
Downtown retailers contacted for initial interviews spoke of average sales for 2010 and holding steady for 2011, offset by a generally positive outlook for the community, with a consistent sense that the glass is half full, rather than half empty. Broader concerns related to ongoing softness in the Minnesota economy continue.
While current retail occupancies in the downtown remain stable, the amount of vacancies is alarming to the business community in general.
The steady level of office‐related growth has not paralleled the relative stable to declining growth in retail.
Interviews pointed to potential concerns regarding downtown merchants, including issues relating to inconsistent / unpredictable store hours, and occasional lapses in customer service. Ongoing comments also referred to the perceived lack of parking in the downtown.
Interviews also pointed to debate and concerns about the safety and perceptions of the growing Somali population in the downtown.
The Paradise Center for the Arts Theater was viewed as a critical element in the future of downtown, with accolades given to the management and board of directors for their vision to support more evening activity in the downtown area.
Virtually unanimous support of reopening a restaurant in the former Monte’s location at 31 3rd Street.
Moving into the analysis section of the report, IN(ALLIANCE) will focus attention on several key elements:
Understanding demand and supply relationships for retail in downtown Faribault.
Evaluating the perception of the cultural diversity in the community.
Understanding visitor market dynamics
Assessing the market for residential development in the downtown
3 | P a g e
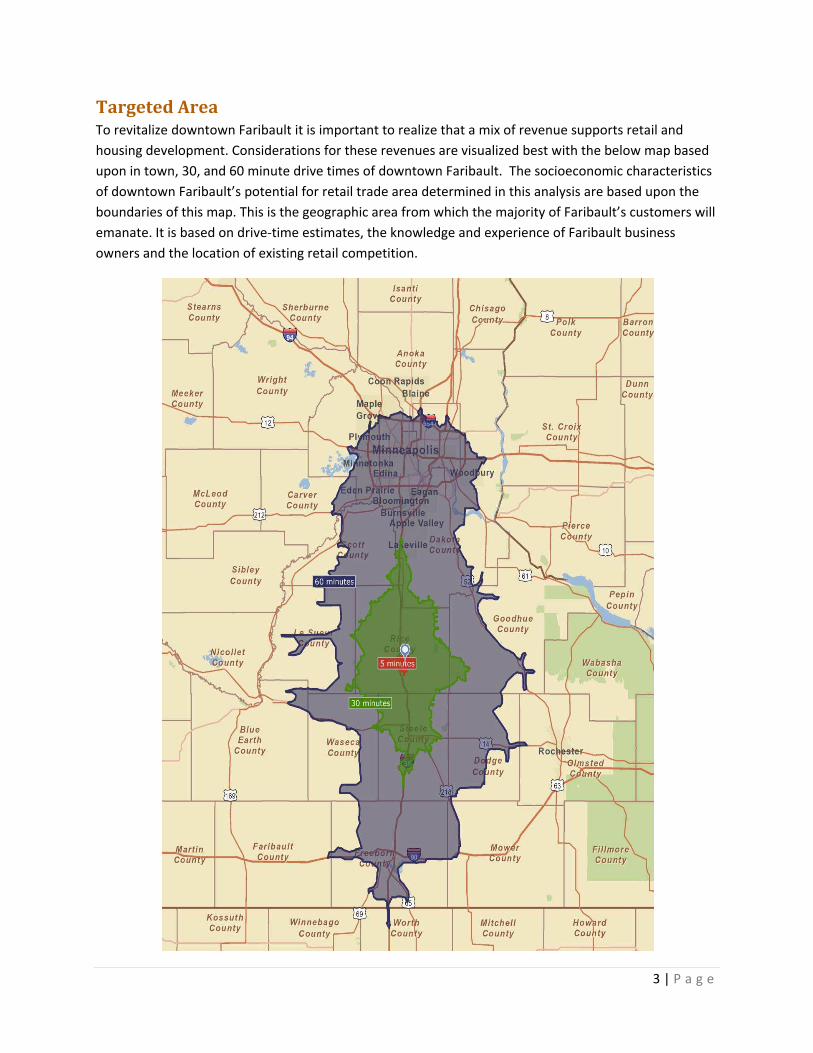
Targeted Area To revitalize downtown Faribault it is important to realize that a mix of revenue supports retail and housing development. Considerations for these revenues are visualized best with the below map based upon in town, 30, and 60 minute drive times of downtown Faribault. The socioeconomic characteristics of downtown Faribault’s potential for retail trade area determined in this analysis are based upon the boundaries of this map. This is the geographic area from which the majority of Faribault’s customers will emanate. It is based on drive‐time estimates, the knowledge and experience of Faribault business owners and the location of existing retail competition.
4 | P a g e
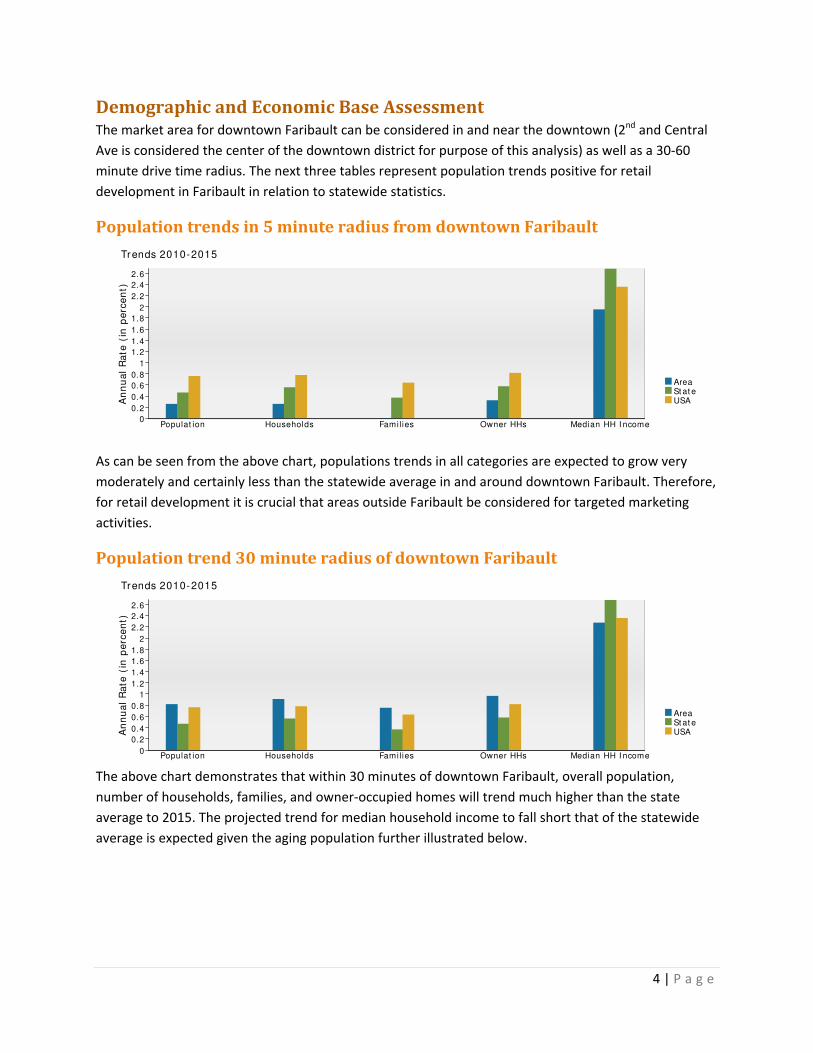
Demographic and Economic Base Assessment The market area for downtown Faribault can be considered in and near the downtown (2nd and Central Ave is considered the center of the downtown district for purpose of this analysis) as well as a 30‐60 minute drive time radius. The next three tables represent population trends positive for retail development in Faribault in relation to statewide statistics.
Population trends in 5 minute radius from downtown Faribault
As can be seen from the above chart, populations trends in all categories are expected to grow very moderately and certainly less than the statewide average in and around downtown Faribault. Therefore, for retail development it is crucial that areas outside Faribault be considered for targeted marketing activities.
Population trend 30 minute radius of downtown Faribault
The above chart demonstrates that within 30 minutes of downtown Faribault, overall population, number of households, families, and owner‐occupied homes will trend much higher than the state average to 2015. The projected trend for median household income to fall short that of the statewide average is expected given the aging population further illustrated below.
AreaSt at eUSA
Trends 2010-2015
Populat ion Households Famil ies Owner HHs Median HH I ncome
An
nu
al
Ra
te (
in p
erc
en
t)
2.6
2.4
2.2
2
1.8
1.6
1.4
1.2
1
0.8
0.6
0.4
0.2
0
AreaSt at eUSA
Trends 2010-2015
Populat ion Households Famil ies Owner HHs Median HH I ncome
An
nu
al
Ra
te (
in p
erc
en
t)
2.6
2.4
2.2
2
1.8
1.6
1.4
1.2
1
0.8
0.6
0.4
0.2
0
5 | P a g e
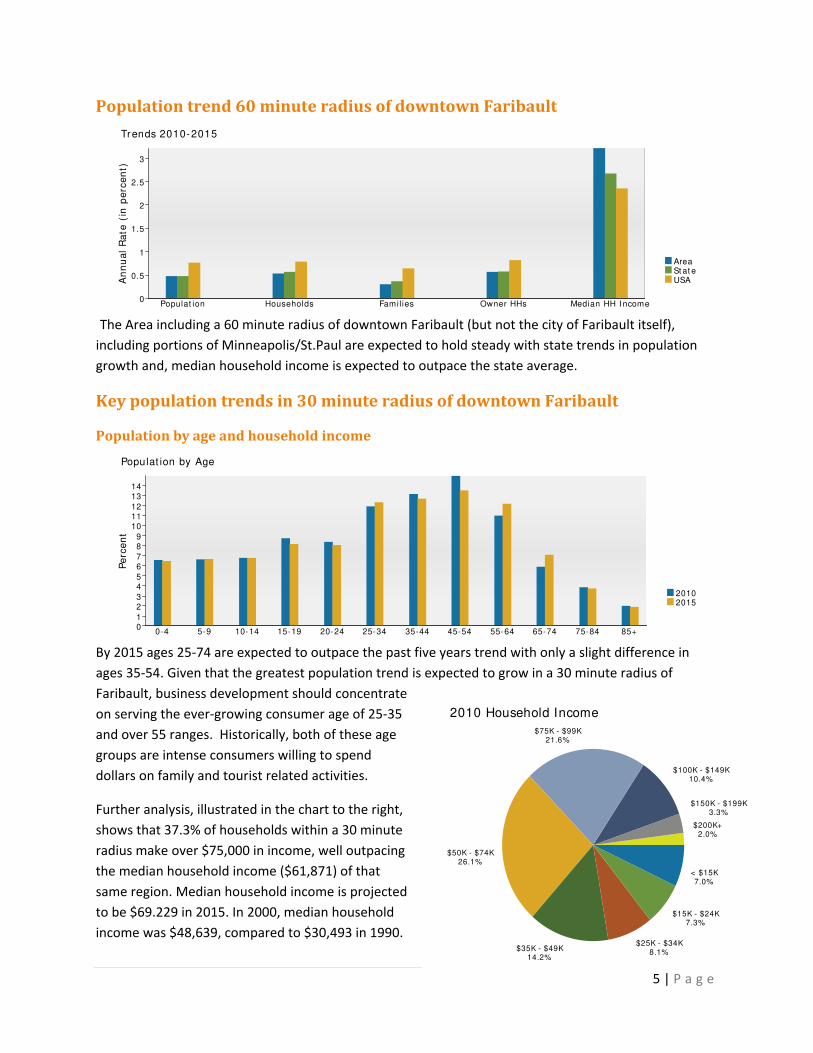
Population trend 60 minute radius of downtown Faribault
The Area including a 60 minute radius of downtown Faribault (but not the city of Faribault itself), including portions of Minneapolis/St.Paul are expected to hold steady with state trends in population growth and, median household income is expected to outpace the state average.
Key population trends in 30 minute radius of downtown Faribault
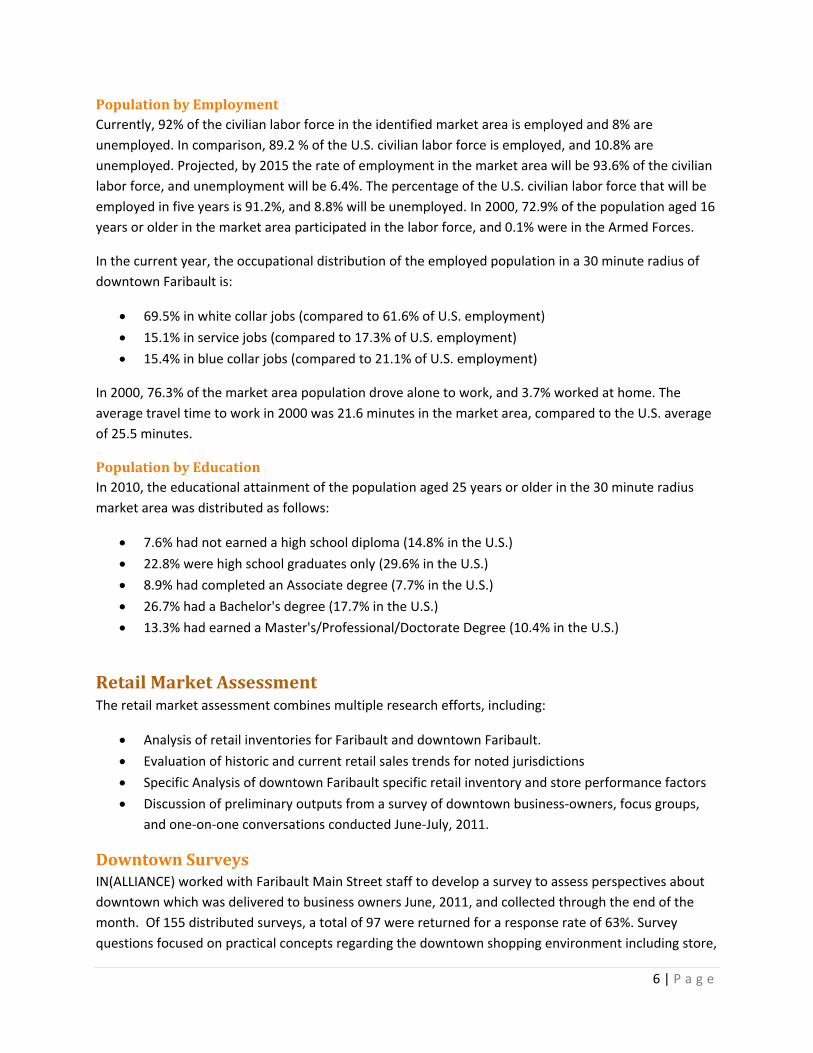
Population by age and household income
By 2015 ages 25‐74 are expected to outpace the past five years trend with only a slight difference in ages 35‐54. Given that the greatest population trend is expected to grow in a 30 minute radius of Faribault, business development should concentrate on serving the ever‐growing consumer age of 25‐35 and over 55 ranges. Historically, both of these age groups are intense consumers willing to spend dollars on family and tourist related activities.
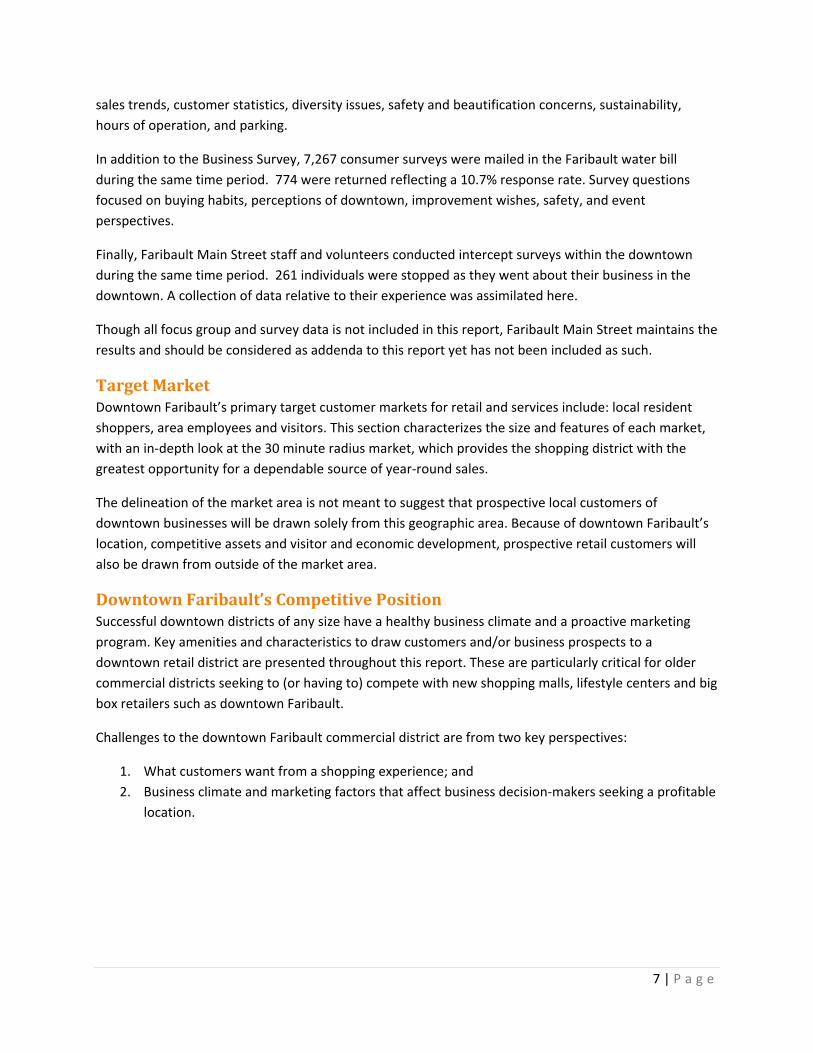
Further analysis, illustrated in the chart to the right, shows that 37.3% of households within a 30 minute radius make over $75,000 in income, well outpacing the median household income ($61,871) of that same region. Median household income is projected to be $69.229 in 2015. In 2000, median household income was $48,639, compared to $30,493 in 1990.
AreaSt at eUSA
Trends 2010-2015
Populat ion Households Famil ies Owner HHs Median HH I ncome
An
nu
al
Ra
te (
in p
erc
en
t)
3
2.5
2
1.5
1
0.5
0
20102015
Populat ion by Age
0-4 5-9 10-14 15-19 20-24 25-34 35-44 45-54 55-64 65-74 75-84 85+
Pe
rce
nt
1413
121110
98
76
54
32
10
2010 Household Income
$200K+2.0%
$150K - $199K3.3%
$100K - $149K10.4%
$75K - $99K21.6%
$50K - $74K26.1%
$35K - $49K14.2%
$25K - $34K8.1%
$15K - $24K7.3%
< $15K7.0%
6 | P a g e
Population by Employment Currently, 92% of the civilian labor force in the identified market area is employed and 8% are unemployed. In comparison, 89.2 % of the U.S. civilian labor force is employed, and 10.8% are unemployed. Projected, by 2015 the rate of employment in the market area will be 93.6% of the civilian labor force, and unemployment will be 6.4%. The percentage of the U.S. civilian labor force that will be employed in five years is 91.2%, and 8.8% will be unemployed. In 2000, 72.9% of the population aged 16 years or older in the market area participated in the labor force, and 0.1% were in the Armed Forces.
In the current year, the occupational distribution of the employed population in a 30 minute radius of downtown Faribault is:
69.5% in white collar jobs (compared to 61.6% of U.S. employment)
15.1% in service jobs (compared to 17.3% of U.S. employment)
15.4% in blue collar jobs (compared to 21.1% of U.S. employment)
In 2000, 76.3% of the market area population drove alone to work, and 3.7% worked at home. The average travel time to work in 2000 was 21.6 minutes in the market area, compared to the U.S. average of 25.5 minutes.
Population by Education In 2010, the educational attainment of the population aged 25 years or older in the 30 minute radius market area was distributed as follows:
7.6% had not earned a high school diploma (14.8% in the U.S.)
22.8% were high school graduates only (29.6% in the U.S.)
8.9% had completed an Associate degree (7.7% in the U.S.)
26.7% had a Bachelor's degree (17.7% in the U.S.)
13.3% had earned a Master's/Professional/Doctorate Degree (10.4% in the U.S.)
Retail Market Assessment The retail market assessment combines multiple research efforts, including:
Analysis of retail inventories for Faribault and downtown Faribault.
Evaluation of historic and current retail sales trends for noted jurisdictions
Specific Analysis of downtown Faribault specific retail inventory and store performance factors
Discussion of preliminary outputs from a survey of downtown business‐owners, focus groups, and one‐on‐one conversations conducted June‐July, 2011.
Downtown Surveys IN(ALLIANCE) worked with Faribault Main Street staff to develop a survey to assess perspectives about downtown which was delivered to business owners June, 2011, and collected through the end of the month. Of 155 distributed surveys, a total of 97 were returned for a response rate of 63%. Survey questions focused on practical concepts regarding the downtown shopping environment including store,
7 | P a g e
sales trends, customer statistics, diversity issues, safety and beautification concerns, sustainability, hours of operation, and parking.
In addition to the Business Survey, 7,267 consumer surveys were mailed in the Faribault water bill during the same time period. 774 were returned reflecting a 10.7% response rate. Survey questions focused on buying habits, perceptions of downtown, improvement wishes, safety, and event perspectives.
Finally, Faribault Main Street staff and volunteers conducted intercept surveys within the downtown during the same time period. 261 individuals were stopped as they went about their business in the downtown. A collection of data relative to their experience was assimilated here.
Though all focus group and survey data is not included in this report, Faribault Main Street maintains the results and should be considered as addenda to this report yet has not been included as such.
Target Market Downtown Faribault’s primary target customer markets for retail and services include: local resident shoppers, area employees and visitors. This section characterizes the size and features of each market, with an in‐depth look at the 30 minute radius market, which provides the shopping district with the greatest opportunity for a dependable source of year‐round sales.
The delineation of the market area is not meant to suggest that prospective local customers of downtown businesses will be drawn solely from this geographic area. Because of downtown Faribault’s location, competitive assets and visitor and economic development, prospective retail customers will also be drawn from outside of the market area.
Downtown Faribault’s Competitive Position Successful downtown districts of any size have a healthy business climate and a proactive marketing program. Key amenities and characteristics to draw customers and/or business prospects to a downtown retail district are presented throughout this report. These are particularly critical for older commercial districts seeking to (or having to) compete with new shopping malls, lifestyle centers and big box retailers such as downtown Faribault.
Challenges to the downtown Faribault commercial district are from two key perspectives:
1. What customers want from a shopping experience; and 2. Business climate and marketing factors that affect business decision‐makers seeking a profitable
location.
8 | P a g e
Downtown Faribault Market Potential
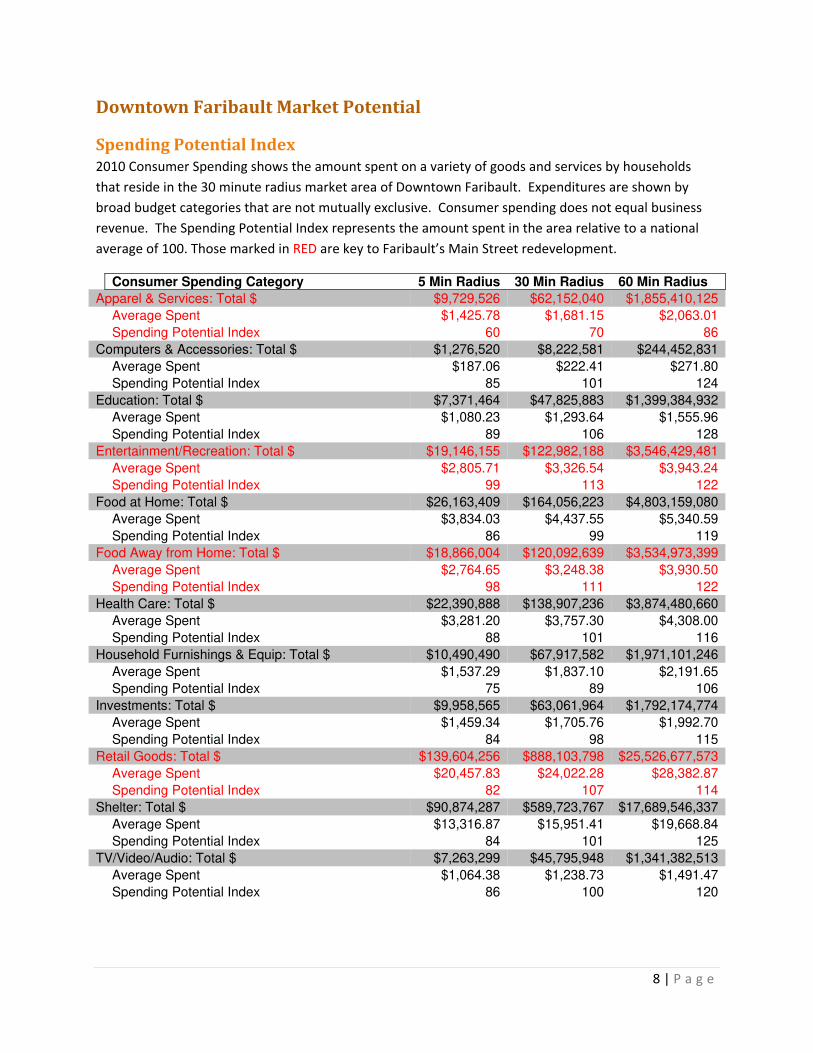
Spending Potential Index 2010 Consumer Spending shows the amount spent on a variety of goods and services by households that reside in the 30 minute radius market area of Downtown Faribault. Expenditures are shown by broad budget categories that are not mutually exclusive. Consumer spending does not equal business revenue. The Spending Potential Index represents the amount spent in the area relative to a national average of 100. Those marked in RED are key to Faribault’s Main Street redevelopment.
Consumer Spending Category 5 Min Radius 30 Min Radius 60 Min Radius
Apparel & Services: Total $ $9,729,526 $62,152,040 $1,855,410,125
Average Spent $1,425.78 $1,681.15 $2,063.01
Spending Potential Index 60 70 86
Computers & Accessories: Total $ $1,276,520 $8,222,581 $244,452,831
Average Spent $187.06 $222.41 $271.80
Spending Potential Index 85 101 124
Education: Total $ $7,371,464 $47,825,883 $1,399,384,932
Average Spent $1,080.23 $1,293.64 $1,555.96
Spending Potential Index 89 106 128
Entertainment/Recreation: Total $ $19,146,155 $122,982,188 $3,546,429,481
Average Spent $2,805.71 $3,326.54 $3,943.24
Spending Potential Index 99 113 122
Food at Home: Total $ $26,163,409 $164,056,223 $4,803,159,080
Average Spent $3,834.03 $4,437.55 $5,340.59
Spending Potential Index 86 99 119
Food Away from Home: Total $ $18,866,004 $120,092,639 $3,534,973,399
Average Spent $2,764.65 $3,248.38 $3,930.50
Spending Potential Index 98 111 122
Health Care: Total $ $22,390,888 $138,907,236 $3,874,480,660
Average Spent $3,281.20 $3,757.30 $4,308.00
Spending Potential Index 88 101 116
Household Furnishings & Equip: Total $ $10,490,490 $67,917,582 $1,971,101,246
Average Spent $1,537.29 $1,837.10 $2,191.65
Spending Potential Index 75 89 106
Investments: Total $ $9,958,565 $63,061,964 $1,792,174,774
Average Spent $1,459.34 $1,705.76 $1,992.70
Spending Potential Index 84 98 115
Retail Goods: Total $ $139,604,256 $888,103,798 $25,526,677,573
Average Spent $20,457.83 $24,022.28 $28,382.87
Spending Potential Index 82 107 114
Shelter: Total $ $90,874,287 $589,723,767 $17,689,546,337
Average Spent $13,316.87 $15,951.41 $19,668.84
Spending Potential Index 84 101 125
TV/Video/Audio: Total $ $7,263,299 $45,795,948 $1,341,382,513
Average Spent $1,064.38 $1,238.73 $1,491.47
Spending Potential Index 86 100 120
9 | P a g e
The Spending Potential Index table on the previous page reflects the optimum spending levels by the population in the distance radiuses noted. The Spending Potential Index (SPI) figures are calculated as a ratio of spending by households in the radiuses of Faribault identified compared to the spending of the average household in the U.S. in specified categories. The figures are calculated by ESRI dividing a consumer spending category for the targeted area by the corresponding figures for the U.S. A figure of 100 indicates that spending per household in the targeted area is equal to the average spending per household for the nation as a whole. A figure larger than 100 indicates that the targeted households spend more than the average U.S. household a benefit for related businesses. A figure smaller than 100, indicates that the targeted households spend less than the average U.S. household, a benefit to consumers.
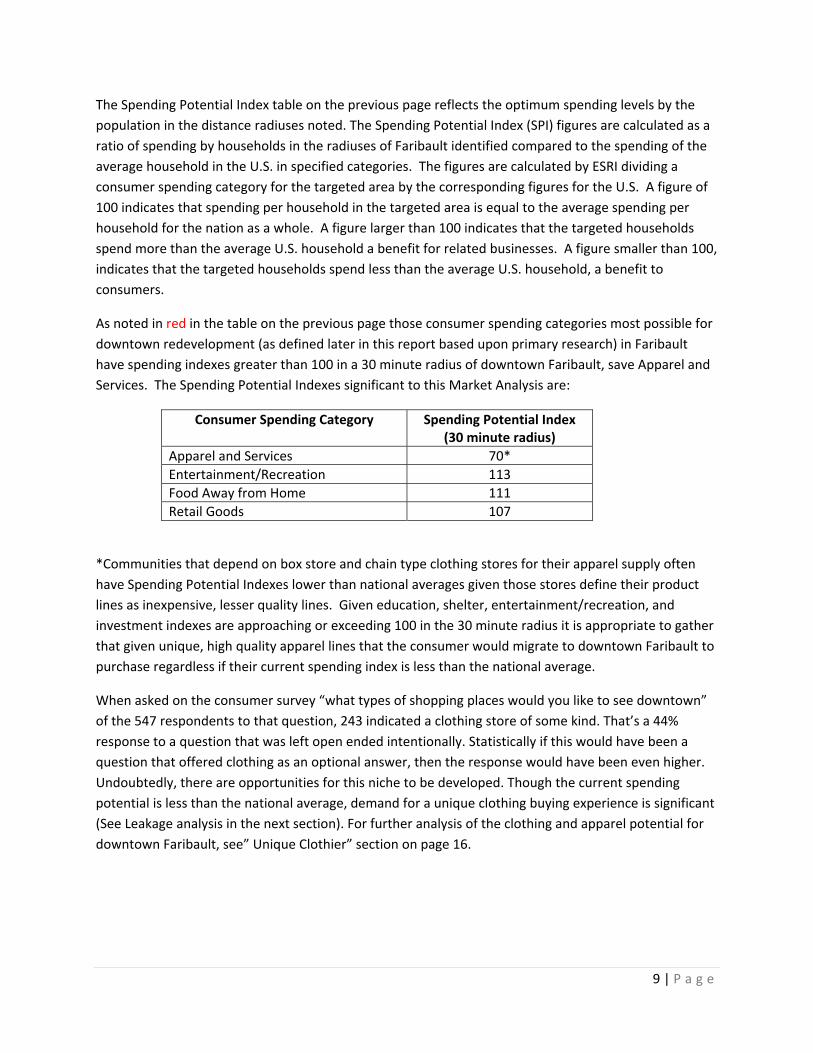
As noted in red in the table on the previous page those consumer spending categories most possible for downtown redevelopment (as defined later in this report based upon primary research) in Faribault have spending indexes greater than 100 in a 30 minute radius of downtown Faribault, save Apparel and Services. The Spending Potential Indexes significant to this Market Analysis are:
Consumer Spending Category Spending Potential Index (30 minute radius)
Apparel and Services 70* Entertainment/Recreation 113 Food Away from Home 111 Retail Goods 107
*Communities that depend on box store and chain type clothing stores for their apparel supply often have Spending Potential Indexes lower than national averages given those stores define their product lines as inexpensive, lesser quality lines. Given education, shelter, entertainment/recreation, and investment indexes are approaching or exceeding 100 in the 30 minute radius it is appropriate to gather that given unique, high quality apparel lines that the consumer would migrate to downtown Faribault to purchase regardless if their current spending index is less than the national average.
When asked on the consumer survey “what types of shopping places would you like to see downtown” of the 547 respondents to that question, 243 indicated a clothing store of some kind. That’s a 44% response to a question that was left open ended intentionally. Statistically if this would have been a question that offered clothing as an optional answer, then the response would have been even higher. Undoubtedly, there are opportunities for this niche to be developed. Though the current spending potential is less than the national average, demand for a unique clothing buying experience is significant (See Leakage analysis in the next section). For further analysis of the clothing and apparel potential for downtown Faribault, see” Unique Clothier” section on page 16.
10 | P a g e
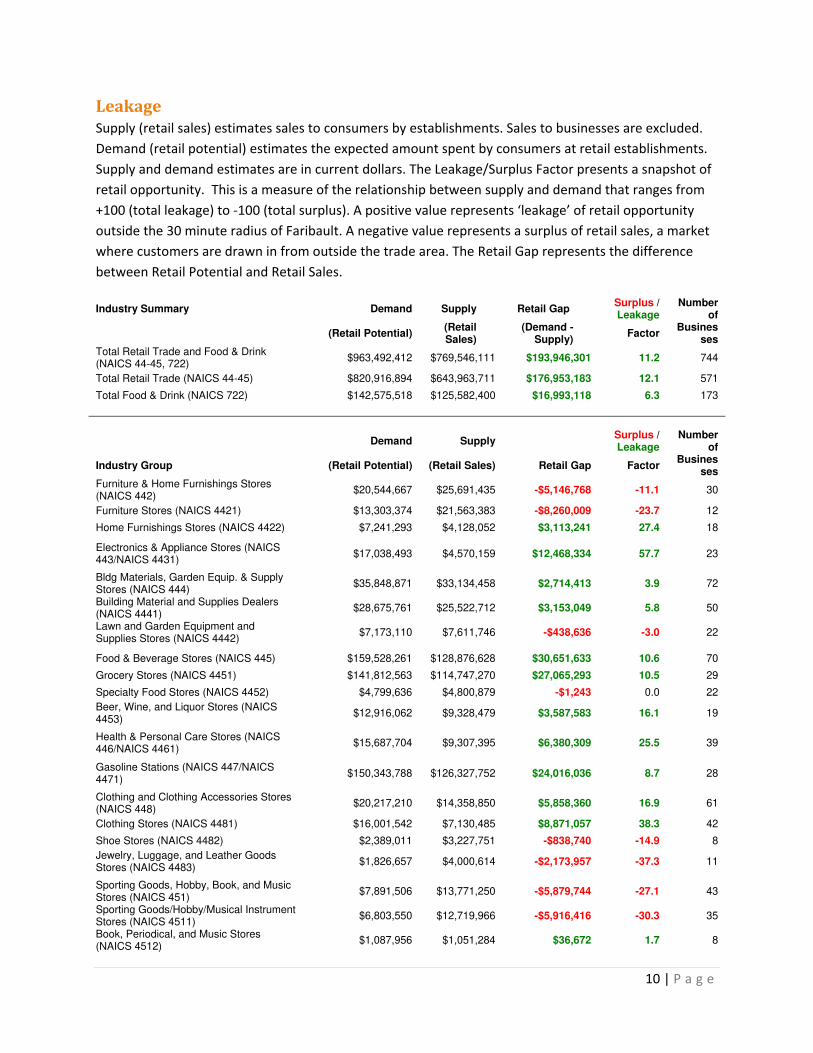
Leakage Supply (retail sales) estimates sales to consumers by establishments. Sales to businesses are excluded. Demand (retail potential) estimates the expected amount spent by consumers at retail establishments. Supply and demand estimates are in current dollars. The Leakage/Surplus Factor presents a snapshot of retail opportunity. This is a measure of the relationship between supply and demand that ranges from +100 (total leakage) to ‐100 (total surplus). A positive value represents ‘leakage’ of retail opportunity outside the 30 minute radius of Faribault. A negative value represents a surplus of retail sales, a market where customers are drawn in from outside the trade area. The Retail Gap represents the difference between Retail Potential and Retail Sales.
Industry Summary Demand Supply Retail Gap Surplus / Leakage
Number of
(Retail Potential)
(Retail Sales)
(Demand - Supply)
Factor Busines
ses Total Retail Trade and Food & Drink (NAICS 44-45, 722)
$963,492,412 $769,546,111 $193,946,301 11.2 744
Total Retail Trade (NAICS 44-45) $820,916,894 $643,963,711 $176,953,183 12.1 571
Total Food & Drink (NAICS 722) $142,575,518 $125,582,400 $16,993,118 6.3 173
Demand Supply
Surplus / Leakage
Number of
Industry Group
(Retail Potential) (Retail Sales) Retail Gap Factor Busines
ses Furniture & Home Furnishings Stores (NAICS 442)
$20,544,667 $25,691,435 -$5,146,768 -11.1 30
Furniture Stores (NAICS 4421) $13,303,374 $21,563,383 -$8,260,009 -23.7 12
Home Furnishings Stores (NAICS 4422) $7,241,293 $4,128,052 $3,113,241 27.4 18
Electronics & Appliance Stores (NAICS 443/NAICS 4431)
$17,038,493 $4,570,159 $12,468,334 57.7 23
Bldg Materials, Garden Equip. & Supply Stores (NAICS 444)
$35,848,871 $33,134,458 $2,714,413 3.9 72
Building Material and Supplies Dealers (NAICS 4441)
$28,675,761 $25,522,712 $3,153,049 5.8 50
Lawn and Garden Equipment and Supplies Stores (NAICS 4442)
$7,173,110 $7,611,746 -$438,636 -3.0 22
Food & Beverage Stores (NAICS 445) $159,528,261 $128,876,628 $30,651,633 10.6 70
Grocery Stores (NAICS 4451) $141,812,563 $114,747,270 $27,065,293 10.5 29
Specialty Food Stores (NAICS 4452) $4,799,636 $4,800,879 -$1,243 0.0 22
Beer, Wine, and Liquor Stores (NAICS 4453)
$12,916,062 $9,328,479 $3,587,583 16.1 19
Health & Personal Care Stores (NAICS 446/NAICS 4461)
$15,687,704 $9,307,395 $6,380,309 25.5 39
Gasoline Stations (NAICS 447/NAICS 4471)
$150,343,788 $126,327,752 $24,016,036 8.7 28
Clothing and Clothing Accessories Stores (NAICS 448)
$20,217,210 $14,358,850 $5,858,360 16.9 61
Clothing Stores (NAICS 4481) $16,001,542 $7,130,485 $8,871,057 38.3 42
Shoe Stores (NAICS 4482) $2,389,011 $3,227,751 -$838,740 -14.9 8
Jewelry, Luggage, and Leather Goods Stores (NAICS 4483)
$1,826,657 $4,000,614 -$2,173,957 -37.3 11
Sporting Goods, Hobby, Book, and Music Stores (NAICS 451)
$7,891,506 $13,771,250 -$5,879,744 -27.1 43
Sporting Goods/Hobby/Musical Instrument Stores (NAICS 4511)
$6,803,550 $12,719,966 -$5,916,416 -30.3 35
Book, Periodical, and Music Stores (NAICS 4512)
$1,087,956 $1,051,284 $36,672 1.7 8
11 | P a g e
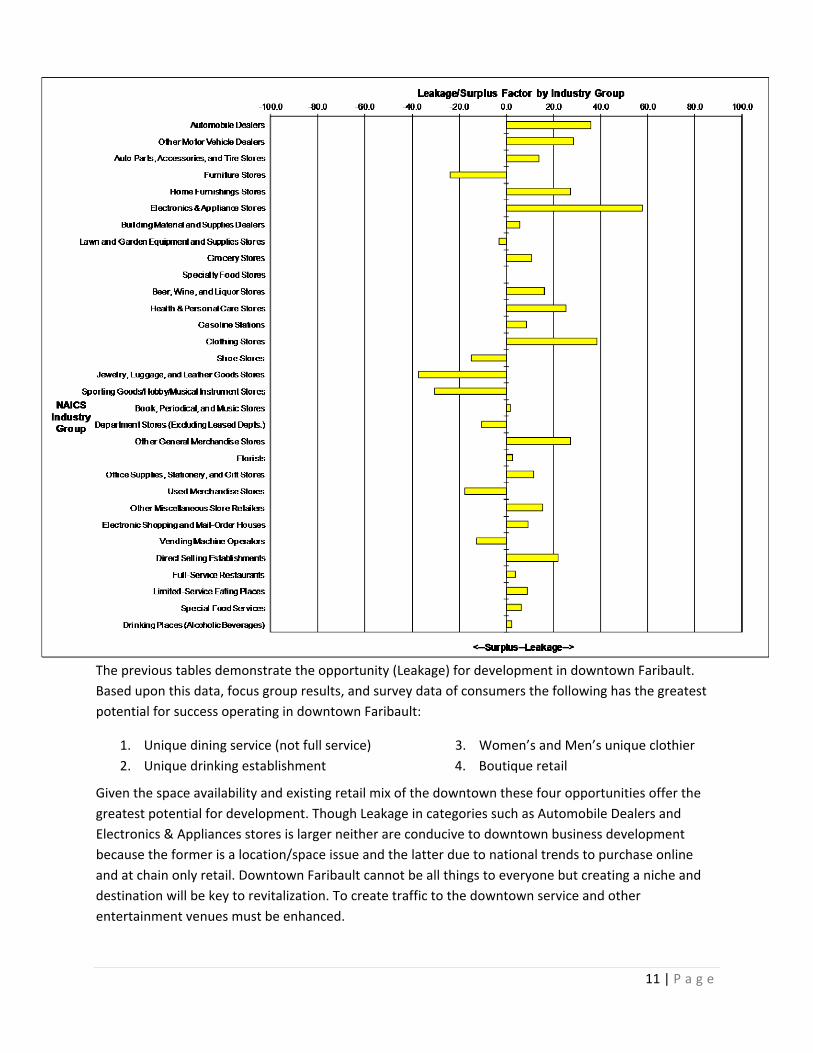
The previous tables demonstrate the opportunity (Leakage) for development in downtown Faribault. Based upon this data, focus group results, and survey data of consumers the following has the greatest potential for success operating in downtown Faribault:
1. Unique dining service (not full service) 2. Unique drinking establishment
3. Women’s and Men’s unique clothier 4. Boutique retail
Given the space availability and existing retail mix of the downtown these four opportunities offer the greatest potential for development. Though Leakage in categories such as Automobile Dealers and Electronics & Appliances stores is larger neither are conducive to downtown business development because the former is a location/space issue and the latter due to national trends to purchase online and at chain only retail. Downtown Faribault cannot be all things to everyone but creating a niche and destination will be key to revitalization. To create traffic to the downtown service and other entertainment venues must be enhanced.
12 | P a g e
Downtown Traffic Foot traffic with access for vehicular movement and parking are crucial to the downtown. Though there are some consumers and local business owners that state there is a parking problem, the research did not support this claim. It is recognized that on certain occasions parking can be an issue but relevant to the market size and layout of the downtown district, parking, overall, is adequate to handle reasonable retail and entertainment growth. In fact the Consumer Survey demonstrates that only 8% consider downtown parking poor, with 78% indicating that parking is average for their needs to excellent. 60% of existing business downtown indicated that more parking was a neutral to low priority for them.
Therefore, since the downtown can handle growth in traffic it necessary to capitalize on two areas:
1. Entertainment venues 2. Creating destinations
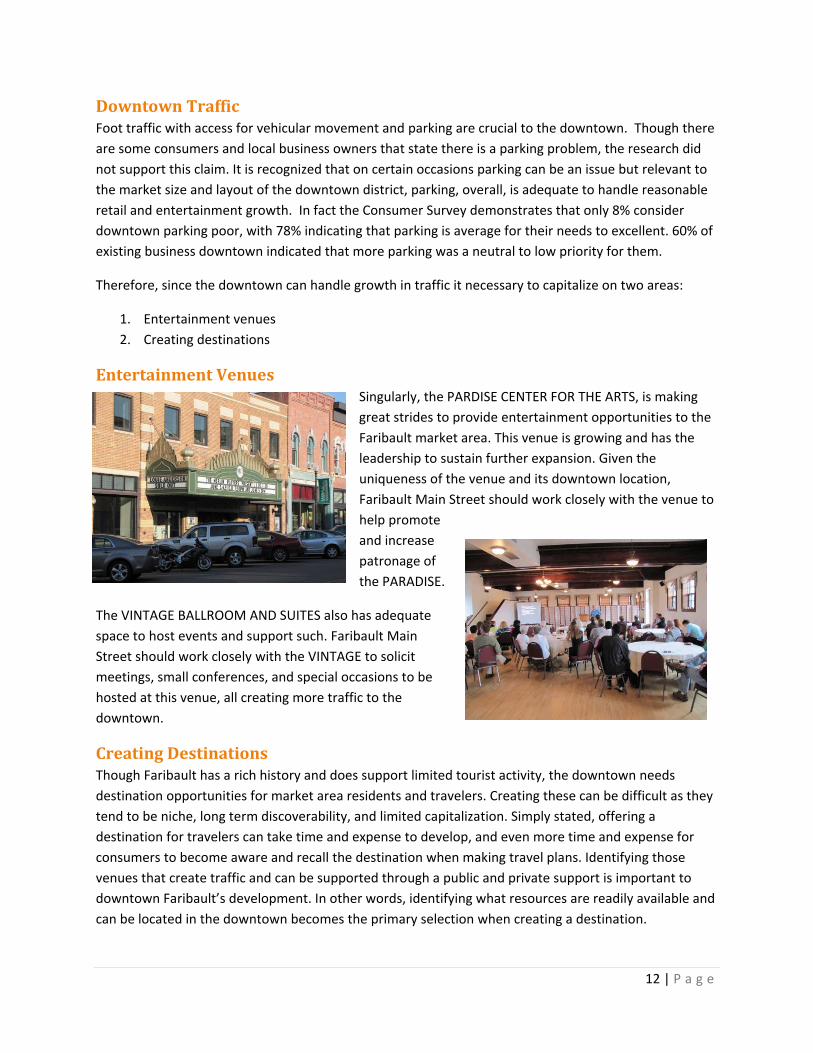
Entertainment Venues Singularly, the PARDISE CENTER FOR THE ARTS, is making great strides to provide entertainment opportunities to the Faribault market area. This venue is growing and has the leadership to sustain further expansion. Given the uniqueness of the venue and its downtown location, Faribault Main Street should work closely with the venue to help promote and increase patronage of the PARADISE.
The VINTAGE BALLROOM AND SUITES also has adequate space to host events and support such. Faribault Main Street should work closely with the VINTAGE to solicit meetings, small conferences, and special occasions to be hosted at this venue, all creating more traffic to the downtown.
Creating Destinations Though Faribault has a rich history and does support limited tourist activity, the downtown needs destination opportunities for market area residents and travelers. Creating these can be difficult as they tend to be niche, long term discoverability, and limited capitalization. Simply stated, offering a destination for travelers can take time and expense to develop, and even more time and expense for consumers to become aware and recall the destination when making travel plans. Identifying those venues that create traffic and can be supported through a public and private support is important to downtown Faribault’s development. In other words, identifying what resources are readily available and can be located in the downtown becomes the primary selection when creating a destination.
13 | P a g e
One such destination that should be explored is developing a partnership with SHATTUCK‐ST MARY’S. This private school, grades 6‐12, educates over 430 students annually with an average tuition in excess of $30,000/year. Students and their families that attend SHATTUCK‐ST MARY’S are of high middle to very high income households. With the proximity of the school to the Downtown and the spending power of its population, Faribault Main Street needs to arrange for the school to
have a presence in the downtown. Locating a key service or offering classes’ downtown would encourage their student population to frequent the downtown. Private schools, collectively, encourage the parents of their students to visit during scheduled and organized days at the school. Faribault Main Street should organize events and specials specifically catering to this population.
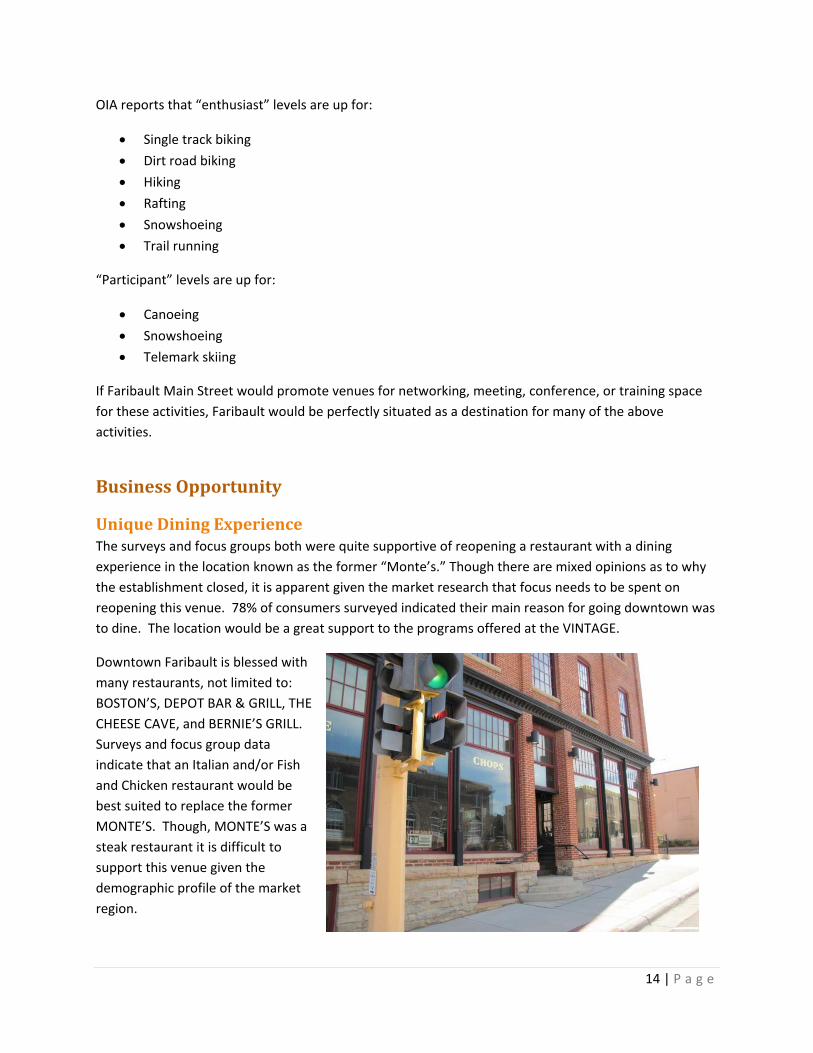
Bike path and waterway access should also be enhanced and promoted due to their proximity to downtown Faribault. Minnesota boasts 21 state bike trails and countless other private/public trails. Faribault is uniquely positioned along trails connecting Mankato and Cannon Falls with potential to link up other destinations. Biking, kayaking, and canoeing are growing outdoor adventure activities. The industry has seen steady growth since the 1990’s. “There has been a mindset shift from outdoor recreation participants being motivated by adventure and glory, to seeking peace and solitude in the outdoors.” The Outdoor Industry Association’s annual report for 2009 tracks two groups of people engaged in outdoor activities: “Enthusiasts” and “Participants.” Enthusiasts represent the core outdoor recreation market. These people purchase high priced, technical gear and engage in outdoor activities regularly. Participants are all Americans 16+ who believe they participated in the activity at least one time in the past year. “Participants” are viewed as potential, future “enthusiasts.”
14 | P a g e
OIA reports that “enthusiast” levels are up for:
Single track biking
Dirt road biking
Hiking
Rafting
Snowshoeing
Trail running
“Participant” levels are up for:
Canoeing
Snowshoeing
Telemark skiing
If Faribault Main Street would promote venues for networking, meeting, conference, or training space for these activities, Faribault would be perfectly situated as a destination for many of the above activities.
Business Opportunity
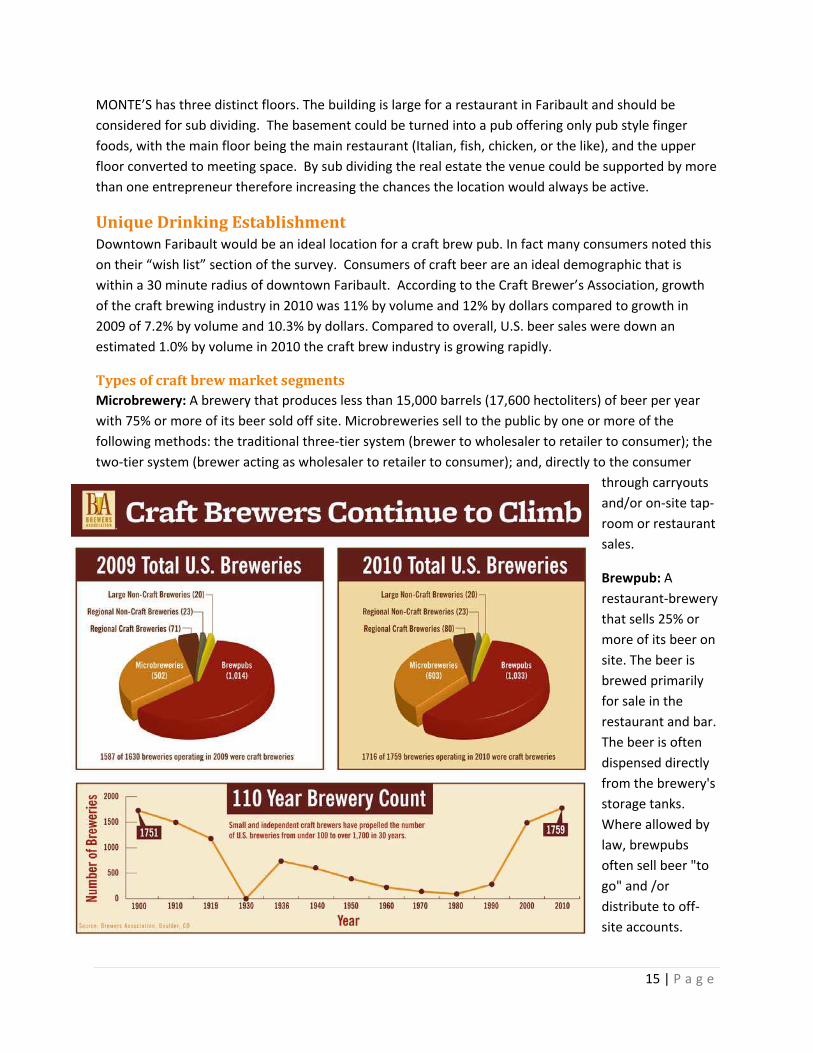
Unique Dining Experience The surveys and focus groups both were quite supportive of reopening a restaurant with a dining experience in the location known as the former “Monte’s.” Though there are mixed opinions as to why the establishment closed, it is apparent given the market research that focus needs to be spent on reopening this venue. 78% of consumers surveyed indicated their main reason for going downtown was to dine. The location would be a great support to the programs offered at the VINTAGE.
Downtown Faribault is blessed with many restaurants, not limited to: BOSTON’S, DEPOT BAR & GRILL, THE CHEESE CAVE, and BERNIE’S GRILL. Surveys and focus group data indicate that an Italian and/or Fish and Chicken restaurant would be best suited to replace the former MONTE’S. Though, MONTE’S was a steak restaurant it is difficult to support this venue given the demographic profile of the market region.
15 | P a g e
MONTE’S has three distinct floors. The building is large for a restaurant in Faribault and should be considered for sub dividing. The basement could be turned into a pub offering only pub style finger foods, with the main floor being the main restaurant (Italian, fish, chicken, or the like), and the upper floor converted to meeting space. By sub dividing the real estate the venue could be supported by more than one entrepreneur therefore increasing the chances the location would always be active.
Unique Drinking Establishment Downtown Faribault would be an ideal location for a craft brew pub. In fact many consumers noted this on their “wish list” section of the survey. Consumers of craft beer are an ideal demographic that is within a 30 minute radius of downtown Faribault. According to the Craft Brewer’s Association, growth of the craft brewing industry in 2010 was 11% by volume and 12% by dollars compared to growth in 2009 of 7.2% by volume and 10.3% by dollars. Compared to overall, U.S. beer sales were down an estimated 1.0% by volume in 2010 the craft brew industry is growing rapidly.
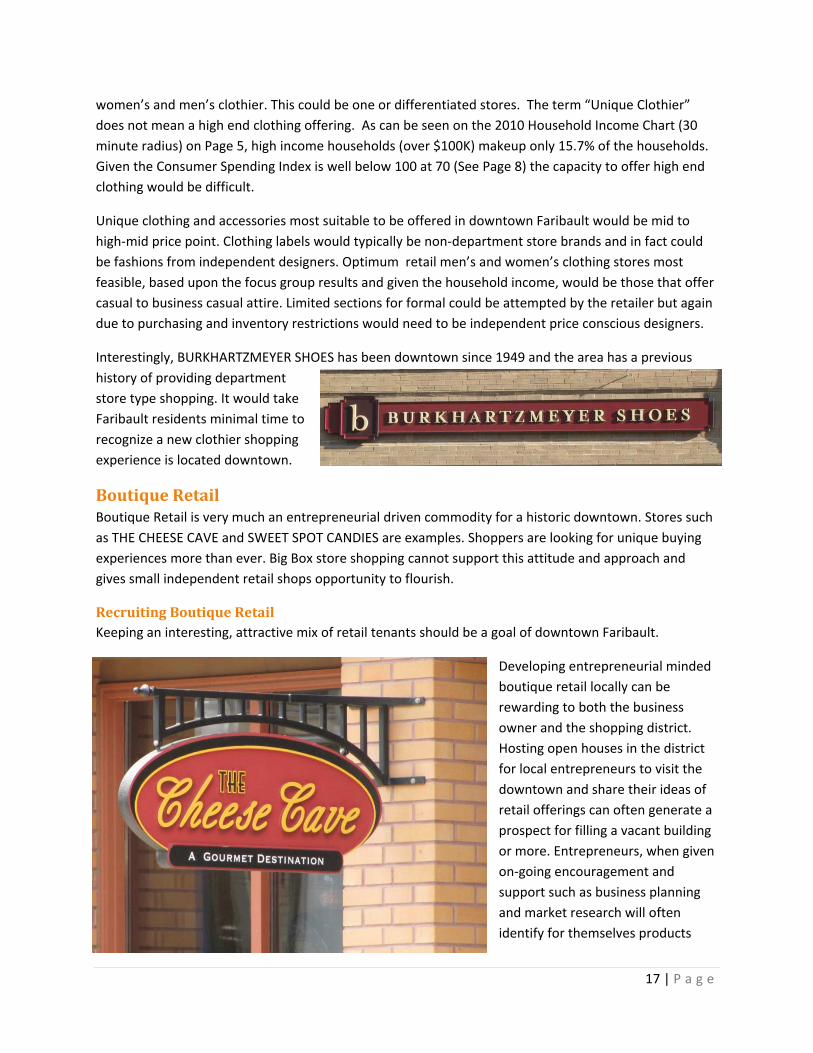
Types of craft brew market segments Microbrewery: A brewery that produces less than 15,000 barrels (17,600 hectoliters) of beer per year with 75% or more of its beer sold off site. Microbreweries sell to the public by one or more of the following methods: the traditional three‐tier system (brewer to wholesaler to retailer to consumer); the two‐tier system (brewer acting as wholesaler to retailer to consumer); and, directly to the consumer
through carryouts and/or on‐site tap‐room or restaurant sales.
Brewpub: A restaurant‐brewery that sells 25% or more of its beer on site. The beer is brewed primarily for sale in the restaurant and bar. The beer is often dispensed directly from the brewery's storage tanks. Where allowed by law, brewpubs often sell beer "to go" and /or distribute to off‐site accounts.

16 | P a g e
According to www.mnbeer.com and www.mncraftbrew.org there are over 25 craft breweries and brewpubs in Minnesota. Though they are concentrated in the twin cities, examples outside the twin cities supporting brewpubs in Minnesota are in Winona, St. Cloud, and Ely.
History of Faribault and Brewing In 1855, Ernst and Gottfried Fleckenstein opened a temporary 10 gallon brewery in St. Paul. Two years later, they moved to Faribault, where they constructed a new brewery along the bluffs at Oak and 3rd Sts. In 1872, the two brothers ended their partnership and became competitors. Ernst built his own brewery at another site in town, producing 25 barrels of beer every day. It was incorporated as the Ernst Fleckenstein Brewing Co. after 1900, at which time production had risen to 10,000 barrels per year with distribution throughout southern Minnesota. The business continued successfully, surviving Prohibition, until it closed down in 1964.
Given the history of brewing in Faribault and its consumer who is attracted to culture and history, naming a brewpub solicitation as “Fleckenstein Brew Pub” would prove to be a good promotional tool.
Unique Clothier There was overwhelming response from both the consumer focus group and the surveys that downtown Faribault needs a unique men’s and women’s clothier. The consumers in both the online survey (44%) and the intercept survey (42.6%) identified clothing stores as a top business they would patronize in downtown Faribault. The single most identified business to be developed downtown in both surveys.
Demand Supply
Surplus / Leakage
Number of
Industry Group
(Retail Potential)
(Retail Sales)
Retail Gap Factor Businesses
Clothing and Clothing Accessories Stores (NAICS 448)
$2,872,661 $1,386,421 $1,486,240 34.9 12
Clothing Stores (NAICS 4481) $2,549,056 $762,664 $1,786,392 53.9 7
According to Leakage Reports from ESRI listed in the chart above, there is $3,272,632 in excess of that spent outside Faribault by its residents on clothing and clothing accessories (NAICS Code 448 & 4481) and $14,729,417 (See table on Page 10) being spent by those in a 30 minute radius outside that boundary. Capturing a portion of this market is in downtown Faribault’s grasp. Given these leakage estimates and demand indicated by the surveys, downtown Faribault could support a unique
17 | P a g e
women’s and men’s clothier. This could be one or differentiated stores. The term “Unique Clothier” does not mean a high end clothing offering. As can be seen on the 2010 Household Income Chart (30 minute radius) on Page 5, high income households (over $100K) makeup only 15.7% of the households. Given the Consumer Spending Index is well below 100 at 70 (See Page 8) the capacity to offer high end clothing would be difficult.
Unique clothing and accessories most suitable to be offered in downtown Faribault would be mid to high‐mid price point. Clothing labels would typically be non‐department store brands and in fact could be fashions from independent designers. Optimum retail men’s and women’s clothing stores most feasible, based upon the focus group results and given the household income, would be those that offer casual to business casual attire. Limited sections for formal could be attempted by the retailer but again due to purchasing and inventory restrictions would need to be independent price conscious designers.
Interestingly, BURKHARTZMEYER SHOES has been downtown since 1949 and the area has a previous history of providing department store type shopping. It would take Faribault residents minimal time to recognize a new clothier shopping experience is located downtown.
Boutique Retail Boutique Retail is very much an entrepreneurial driven commodity for a historic downtown. Stores such as THE CHEESE CAVE and SWEET SPOT CANDIES are examples. Shoppers are looking for unique buying experiences more than ever. Big Box store shopping cannot support this attitude and approach and gives small independent retail shops opportunity to flourish.
Recruiting Boutique Retail Keeping an interesting, attractive mix of retail tenants should be a goal of downtown Faribault.
Developing entrepreneurial minded boutique retail locally can be rewarding to both the business owner and the shopping district. Hosting open houses in the district for local entrepreneurs to visit the downtown and share their ideas of retail offerings can often generate a prospect for filling a vacant building or more. Entrepreneurs, when given on‐going encouragement and support such as business planning and market research will often identify for themselves products
18 | P a g e
that can be sold in a boutique retail setting. Also, giving temporary space to foster this endeavor is gaining popularity in Pop‐Up retail (see next section).
Another, and beneficial, means to grow the boutique retail, Faribault Main Street should consider nominating or hiring a retail recruiter, and most certainly a volunteer with the Main Street Program, to jumpstart the growth through proactive recruiting methods. In some instance a local realtor might benefit from this position and be willing to work on commission with the property owner. Identifying an individual with acute shopping sensibilities, perhaps a retail background and an understanding of downtown Faribault market potential would be an ideal candidate.
Recruiting is to proactively address vacancy rates and bring in new retailers that add to the interesting, attractive mix of tenants. Seeking out potential new merchants and acting as a “cheerleader” for the community is the primary job of a recruiter. In addition to showing business owners the vacant locations that would be a good fit for their businesses, the recruiter showcases several reasons why they should locate in downtown Faribault above other communities. Making in‐store visits to businesses in communities in Minnesota will produce great results for the retail development of the downtown district.
Pop Ups Another possibility for creating innovative boutique retail is to encourage pop up shops for local entrepreneurs, expanding businesses, and craftsman. A pop up shop is a (nearly) perfect solution for businesses looking to enter the retail market, introduce themselves to a new geographical area or simply want to reach a consumer audience without the hassle (ie: expenses, staffing, inventory, etc.) of a permanent store front. This also offers a great way for landlords to gain some income on empty storefronts, while also giving businesses owners an idea of how realistic a permanent store may be for them.
Plain and simple, a pop‐up shop is a temporary store. Typically, a pop‐up shop is located in vacant, landlord owned storefronts that are rented on a short term basis, though a pop‐up shop can open practically anywhere. Many pop‐up shops open for long, 3 day weekends while some open as long as six months. But on average, a pop‐up shop opens and closes within just a couple weeks. While this may seem like a short amount of time for a lot of effort, the pop‐up shop expectations are not equal to a typical store. Merchandising, fixtures and other expected store features are set up on a temporary basis, therefore less is necessary as well as less is expected from customers.
There are a variety of reasons pop‐up shops have been successful in some historic downtown districts. Some top reasons why pop‐ups work well are listed below:
1. To gain attention for a future business. 2. To get rid of excess inventory. 3. To test new markets. 4. To try a new business idea. 5. To make money and to save money.
19 | P a g e
Observations for Downtown Faribault
Cultural diversity in downtown Faribault It is important to recognize that the cultural diversity in Faribault is and has been continuing to grow since the 1980’s. The Hispanic culture has integrated and grown substantially since that decade. Since the 1990’s the Somalia culture has steadily been growing in Faribault as a result of their native country’s political and social differences. The culture has reached out to communities across the Midwest, including Faribault, in an effort to expand their heritage and seek new opportunities in a safe and sustained environment. Statistically, Minnesota has one of the largest populations of this culture in the nation. There are many reasons Faribault was sought after as their destination and those characteristics will remain unchanged over the decades to come. Since this minority group is estimated to be greater than 3,500 in 2011, it is obvious this has occurred outside the screens of Census data. Given that this culture represents nearly 20% of the city’s population and is integrating in to the community at large and the downtown specifically, it is time for Faribault to engage their planning efforts to derive feasible outcomes for ALL inhabitants of the area.
If there is one insight that we have learned from this process, it is that Faribault is just beginning its transformational journey from being a culturally homogeneous city to a truly diverse one. Change takes time; and Faribault is clearly changing. We heard the many voices of impatience with this slowness of change, the resistance to change, and the hopelessness of finding change. But at the same time, in so many communities, such as Faribault, change does occur, and when tempered with live discussion and coordinated planning of events, programs that create recognition of the inevitability of change, community leaders can begin writing the next chapter of Faribault’s history, integrity, and place in Minnesota’s socioeconomic story. Consequently, a unanimous belief in the voices of impatience will push Faribault further and faster to embrace the multicultural differences.
Faribault, as is Minnesota, is rich in the cultural heritage of immigrants past and present. From Scandinavian, German, Czech and Irish pioneers, to the Latino and Somali immigrants of today, people from across the globe continue to arrive each day for jobs, education, safety and a better way of life. Faribault is recognizing that such transitions are never easy, not then and not now. It is important to realize that regardless of the situation, immigrating to a new community, learning a new language and deciphering a new culture is never easy. This is especially true for newcomers, such as the Somalis, who are often low income, seeking work, looking for affordable housing, have significant language barriers and who don’t fully understand American/Midwestern culture. However, Faribault is recognizing this reality and WILL establish community structures and programs to aid immigrants with this adjustment. Establishment of a welcome center, newcomer welcoming committees, assistance programs, one‐stop locations where new residents, especially those with cultural or language difficulties can receive hands‐on information and referral services. Such hands‐on assistance is greatly appreciated by those who are uncertain or confused about where services, housing or community assistance can be obtained. Printing, and making readily available, municipal documents in multiple languages, establishing cultural diversity councils and hiring cultural diversity liaisons to assist both immigrants and the majority community
20 | P a g e
members in this transition helps embrace the culture and begin the educational process of what it takes to live together as a community in Faribault.
Resources for Somali population integration Center for Rural Policy and Development 600 South Fifth Street, Suite 211 Saint Peter, Minnesota 56082 www.ruralmn.org University of Minnesota Office of the Vice President & Vice Provost for Equity & Diversity 432 Morrill Hall 100 Church St SE Minneapolis, MN 55455 www.academic.umn.edu/equity Somali American Chamber of Commerce (SACC) 1425 East Dublin Granville Road Suite 214 Columbus, Ohio 43229 www.soamcc.org Confederation of Somali Community in Minnesota 420 15th Avenue South Minneapolis, MN 55454 www.cscmn.org
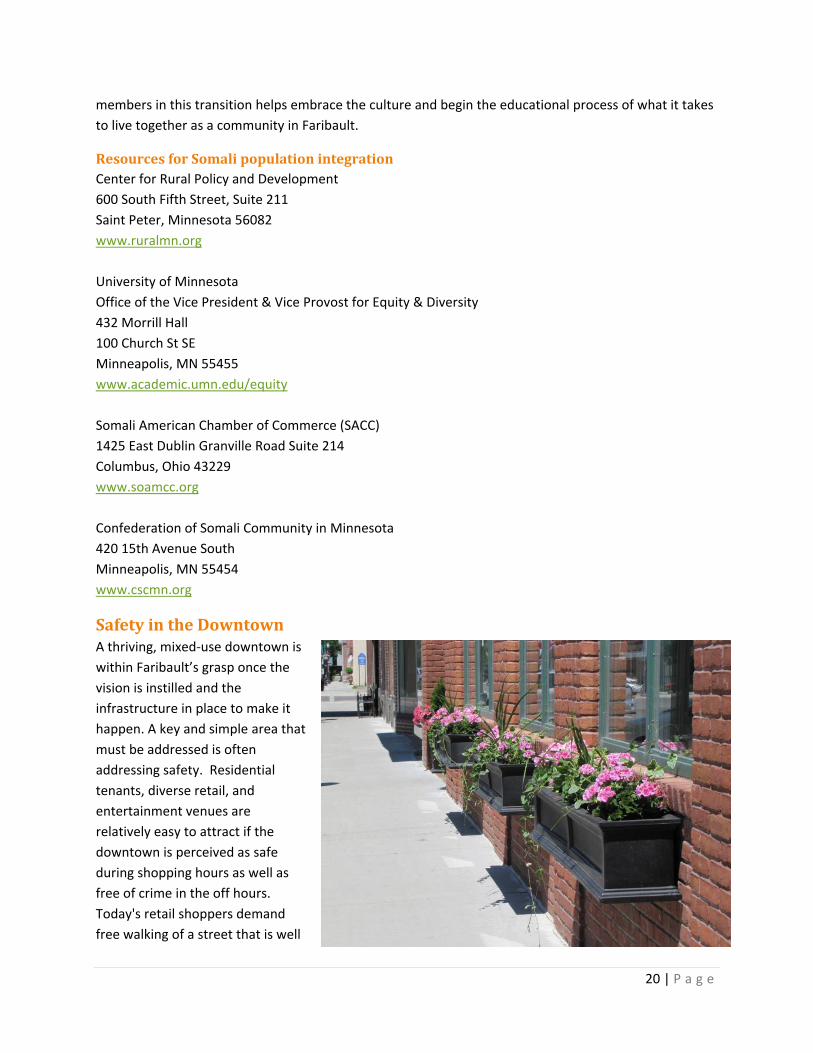
Safety in the Downtown A thriving, mixed‐use downtown is within Faribault’s grasp once the vision is instilled and the infrastructure in place to make it happen. A key and simple area that must be addressed is often addressing safety. Residential tenants, diverse retail, and entertainment venues are relatively easy to attract if the downtown is perceived as safe during shopping hours as well as free of crime in the off hours. Today's retail shoppers demand free walking of a street that is well
21 | P a g e
lit and inviting. Surveys of visitors to downtown Faribault have shown that their top two concerns are safety and convenience. 49% of the consumers surveyed said they consider the downtown unsafe and especially at night. Providing visitors the option of parking in a well‐lighted space within walking distances from the entrances of retail locations must be a top priority. The city's Police Department has indicated there is little crime in the downtown, and certainly no more than the community at large. By worked diligently to ensure that proper lighting projects are a priority and making officers visible during retail and entertainment hours of operation downtown, Faribault is sure to "brighten" the prospects for further downtown development.
To support public sector police patrols, who are constantly overwhelmed with budget woes, safety ambassadors are an up and coming way volunteers can enrich the safety services with little burden on public funding. Safety Ambassadors are on the streets six days per week, providing public safety and helpful information. They work with street level businesses, provide information to visitors, workers and residents as well as report on potential and actual emergencies that require police, fire or EMS resources. In some communities using this tool, Safety Ambassadors increase the number of eyes and ears that can focus on deterring unwanted behaviors such as loitering and quality of life issues. Safety Ambassadors may be trained in first aid, safety/police procedures, conflict management and customer relations, but ALL have a sense of community and are stakeholders in the downtown. These volunteers could be trained in simple phrases in the languages of the Hispanic and Somali people, ("hello," "how are you," "my name is __," "could you move your conversation inside or to some tables?" etc...). Hispanic and Somali people should be especially encouraged to join the ranks of Safety Ambassadors should this strategy be adopted in Faribault. They perform functions such as walking and bicycle patrols, public relations checks in downtown businesses, act as safety escorts between parking and events, answer questions about downtown amenities, welcome new businesses and pass out new business welcome packets, share information with visitors and provide event support. Downtown or block watch meetings should be held periodically to involve downtown businesses, employees and residents in their own safety. The safety team should coordinate with the Faribault Police Department to highlight safety issues of interest to the downtown community. Public relations opportunities for this service benefit the downtown immensely as the positive perception of safety heightens.
Hosting nighttime events in the downtown would greatly improve the perception of the downtown. Engaging the multicultural diversity in this endeavor would greatly bridge these perceptions.
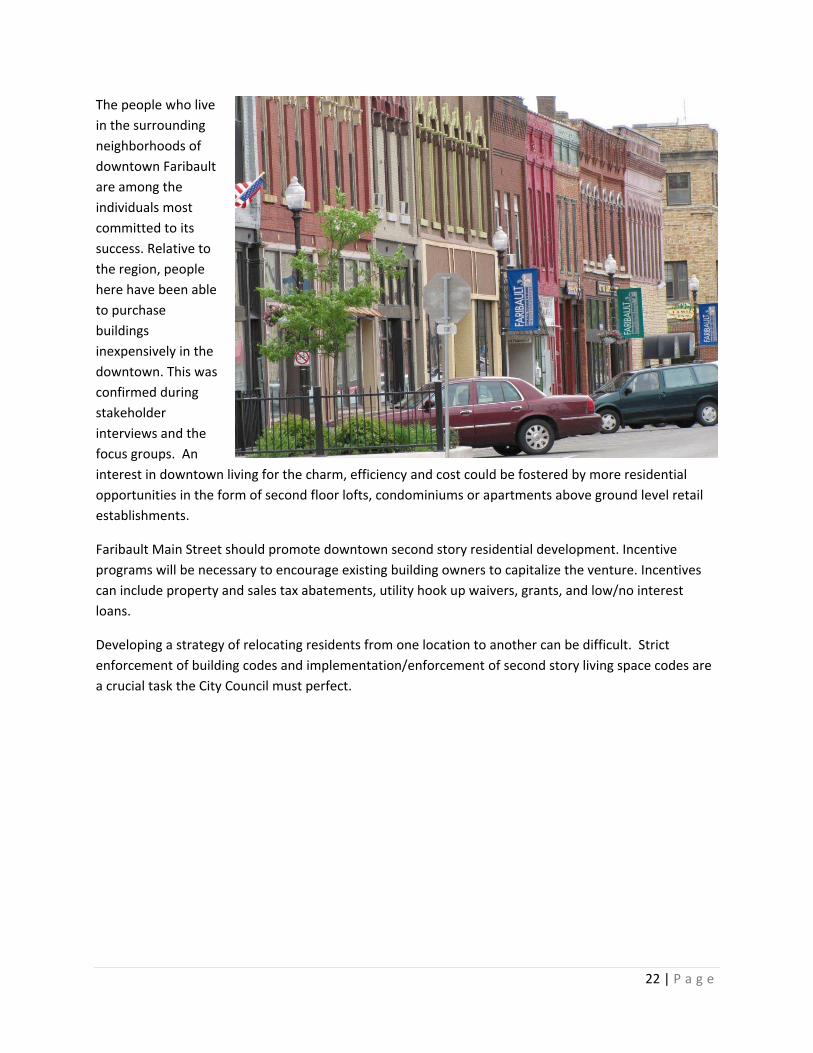
Downtown Building Improvement Currently, it is estimated that a majority of the tenants living in the downtown second story apartments are low to very low income individuals and families. Effective planning for a downtown MUST integrate housing appropriate to the consumer targeted for the area. Affordable housing and apartments suitable for living are crucial for downtown Faribault but low income and/or Section 8 type living quarters should be developed outside of the downtown district.
22 | P a g e
The people who live in the surrounding neighborhoods of downtown Faribault are among the individuals most committed to its success. Relative to the region, people here have been able to purchase buildings inexpensively in the downtown. This was confirmed during stakeholder interviews and the focus groups. An interest in downtown living for the charm, efficiency and cost could be fostered by more residential opportunities in the form of second floor lofts, condominiums or apartments above ground level retail establishments.
Faribault Main Street should promote downtown second story residential development. Incentive programs will be necessary to encourage existing building owners to capitalize the venture. Incentives can include property and sales tax abatements, utility hook up waivers, grants, and low/no interest loans.
Developing a strategy of relocating residents from one location to another can be difficult. Strict enforcement of building codes and implementation/enforcement of second story living space codes are a crucial task the City Council must perfect.
23 | P a g e
Recommendations and Implementation Based upon the findings of this market analysis, IN(ALLIANCE) makes the following recommendations for next steps as related to:
1. Organization 2. Design 3. Economic Restructuring 4. Promotion
The City of Faribault, Faribault Area Chamber of Commerce, and Faribault Main Street (Staff, Board, Committees, and Volunteers) will be responsible for leading the redevelopment of downtown Faribault. The recommendations below and the suggested work plans that follow will require many individuals to play an integral role during the implementation stage. Focusing on a singular and incremented success will not only build excitement for the process but will be a catalyst for the next success and beyond.
1. Organization At the heart of downtown Faribault’s long term success will be the ability of Faribault Main Street to offer businesses, residents and visitors an environment different from and more inspiring than what they can find elsewhere. Incremental approach is the Main Street concept and should so be embraced by Faribault Main Street
Branding the Downtown Faribault’s downtown is not unique of any downtown in terms of needing to distinguish its own identity. The downtown needs to be identified as clearly separate from the other shopping and/or entertainment district(s) in Faribault. It needs its own image distinct from Faribault, at large. Developing a common message, complete with logo, directional signage, website and various marketing materials is crucial. The local population needs to recognize the importance of historic downtown Faribault therefore being more relatable to its visitors and potential retailers and business owners. As one local business owner commented, “You can own a quality building downtown for what you can rent in the mall, and why not?, it’s such a much more unique experience, anyway?”
Commitment Bringing economic vitality back to the downtown will require a focused effort of the City of Faribault and Faribault Main Street to expand first floor commercial and second floor residential development. Though there are a variety of timing strategies that could be implemented, focusing on one block along Central Avenue, then moving down the street one block at a time can be an incremental approach to growing and expanding the downtown mix.
Central Avenue is relatively long and varies with building readiness and availability, however customer attractors such as THE CHEESE CAVE store which is opposite the PARADISE CENTER FOR THE ARTS, should be considered as starting points when setting development timelines. Both are considerably accessible from various parts of Faribault and continue to grow as destinations for the downtown. Over time, this area will spread out to include more blocks along Central Avenue and complementary streets.
24 | P a g e
The commitment of the City and Faribault Main Street to focus economic development in the downtown is a crucial aspect of these recommendations. Enforcing Zoning and Design Guidelines along the targeted area lend credibility and certainty that the City is committed to this endeavor. Continued enforcement of rules/laws that ensure the safety of those that are downtown are mandatory along with visible, friendly patrols that let everyone know the city officials stand behind the revitalization of the downtown.
2. Design
Inventory Downtown Assets Downtown Faribault is unique and different from its competing neighbors such as Mankato and Northfield. Whether it be the Main Street Design Committee or the Historic Preservation Commission it is imperative that a listing of historical assets including building and community history be inventoried. Some, if not many, of these will prove to be a recruitment tool not only for new business owners but to attract visitors from outside Faribault. In fact, the more individual buildings can be inventoried, documented and history made readily available both locally and on the web, the greater chance Faribault Main Street will be able to attract new buyers for buildings.
Building Inventory Building Inventory published to a user friendly, accessible website is crucial in addition to updates to www.MNpro.com. Include all buildings whether available for sale/lease or not. Ideally the building inventory should include:
1. Building Address 2. Building Owner’s Name 3. Current business(s) located there 4. Zoned for: 5. (If Vacant) Former business(s) that was located there 6. Realtor or Third Party Contact 7. Appropriate Contact Phone/Email /Website 8. Square Footage 9. Current availability for Rent/Lease 10. Price if known for sale/lease 11. Photo is nice but not mandatory but certainly should be included on focal properties
Second Story Residential Directly relating to the negative perception of the safety of downtown are the low income residents residing in second floor apartments who are loitering and/or congregating during peak and off‐peak hours along the retail corridor. Interviews with local business owners and focus group results also indicate that possibly living conditions in some apartments in an around Central Avenue may not be hospitable living quarters. This could not be determined at the time of this market analysis but, again, this is a prevalent perception that must be addressed soon. To necessitate a second story residential plan conducive to downtown redevelopment, the City, building owners and their tenants will need to
25 | P a g e
coordinate a housing plan to encourage habitation of those apartments/condos that mutually benefit the tenant and the downtown business community.
Pedestrian Safety The ability to walk safely, freely, and with leisure is important to the development of downtown Faribault. Perception as indicated in this Analysis indicates that nearly half of survey respondents feel the downtown is safe, however IN(ALLIANCE)’s staff walked the downtown on several separate occasions, and at various hours of the day and night, and never felt that safety was factual. However, nonetheless, the perception is prevalent and effort MUST be made to overcome this with a renewed perception based on fact that Central Avenue and complimentary streets/blocks are safe to the pedestrian.
Building Improvement and Signage Faribault business owners shared several ideas about what local businesses could do to attract more visitors and other shoppers who live out of the area:
Increase the availability of benches in the downtown so walking traffic has periodic places to rest was relayed to us during in‐store business visits. Though the survey data of businesses did not relay this it is still worth noting here as it was favorably encouraged during the visits.
79% of business survey respondents indicated rehabilitating old buildings was high to very high priority.
70% indicated businesses need to have a strong priority in beautifying their storefronts.
Explore programs that promote projected signage in the downtown to prevent the funnel effect of looking down Central Ave. As mentioned earlier, the business survey and interviews with downtown business owners indicated a discrepancy in understanding of the local signage ordinance. Ongoing educational seminars should be offered downtown to educate the building and business owners on acceptable signage guidelines.
3. Economic Restructuring Having a completed downtown building inventory will be a supreme asset to beginning the economic restructuring process. Identifying block(s) and specific building to begin with will be a result of this building inventory.
Specific steps that Faribault Main Street can take to begin work on this initiative are:
1. Review and complete the existing database/inventory of vacant downtown buildings initiated by Faribault Main Street. Be sure to include vacant and non vacant properties.
2. Systematically contact property owners, including absentee owners, to discern motives and interests in making improvements, selling the property, etc.
3. Evaluate each property based on needs, issues and readiness for occupancy or a new tenant. For example, the site formally known as Monte’s is ready physically but current owner barriers may prove difficult.
4. Identify 1‐2 properties that could be converted to a brewpub.
26 | P a g e
5. Identify properties that could be readily available for boutique retail, unique clothier, or a pop‐up business.
6. Of the ready‐to‐go locations, work diligently with the property owner or his/her designee to have available marketing materials to promote the building. Display in the window fact sheets about the property along with suggested uses for the space.
7. Further ready these properties by working with the owner to improve the storefront and/or display windows to make it appear as it is “Open for Opportunity” and not simply vacant. (i.e., lit showroom, appropriate displays in window, and/or “decals on the windows promoting a business scene”
8. Problem properties often are the responsibility of the Main Street Program or the City in an aggressive revitalization program. Consider property purchase, swap, or subdividing of at least one property to demonstrate the commitment to the redevelopment strategy.
9. In the event Faribault Main Street nor the City can take ownership of problem properties then it will be necessary to derive a more community operated approach and find ways that non‐profit organizations can take charge of the properties from the disengaged property owner(s).
Business Retention Keeping existing downtown businesses content is a necessary part of economic restructuring. Without the stability of the downtown businesses, future development strategies are null. The core of a healthy downtown business district is realizing that existing businesses serve as an anchor. As such, without the support from a healthy existing business district, downtown revitalization WILL NOT occur. When downtown business prospects arrive in Faribault, one of the first places they will visit is other downtown business owners. The conversation will most certainly include sales, traffic, and of course, perceptions. It is imperative that Faribault Main Street commit time to focus on their existing business as though they were the seed planted waiting to grow. The following are some optimum steps to bolster business retention and to demonstrate the importance of their existence:
1. From the business survey 51% of downtown business owners identified availability of on street parking as having a high to very high impact on their business. Since we identified parking is rarely an issue in downtown Faribault it is important to find ways of directing traffic to the downtown to occupy those available spaces. Improved signage along main roads to the downtown will help tremendously. 78% of business survey respondents indicated there is unnoticeable to no impact of traffic congestion on the streets leading to Main Street therefore capacity to expand automobile traffic is considerable.
2. 50% of businesses owners surveyed said they feel their facade needed to be or maybe should be improved to attract customers. The existing facade program needs to be looked at for effectiveness and tangible benefits to the building owners.
3. Virtually as many business survey respondents said yes (34%), said no (30%), said don’t know (35%) to the question “Is the City of Faribault's Signage Code adequate for your business needs/location?” It’s important that the signage code be delivered in realistic, understandable terms and approved in fairness amongst all downtown businesses.
27 | P a g e
4. Building owners/tenants during the interviews suggested that greater enforcement of building codes and deteriorating store fronts needs to be looked at by the City.
5. Continue or create a business‐to‐business marketing program that encourages downtown Faribault businesses to become well acquainted with each other’s products/services and to support each other through cross marketing and selling and ‘buying locally’ from each other.
6. Start a downtown business appreciation or kudos award program recognizing the positive contributions and investments of downtown Faribault businesses to the community. Expand the Chamber program in this regard.
7. Actively share the findings of this market study with established and emerging Faribault area businesses helping them see ways to capitalize on identified opportunities in the downtown.
8. Provide incentives (grants, revolving loans, etc) to established commercial businesses to expand. Establish criteria to qualify, such as: tenure in business, use to expand inventory, fill a market gap identified in the market analysis (such as boutique retail), etc. A portion of future Faribault Main Street marketing budgets may be used for this.
4. Promotion Given the current level of vacancies downtown, it will be a top priority of Faribault Main Street to promote the district as business ready for the next several years. 86% of business survey respondents indicated they are satisfied with their present location downtown and, in fact, 73% indicated they are planning to expand their business. Only 2% identified they were unsatisfied, with 0% indicating they are wishing to move. The balance of those surveyed remained neutral on the question. This phenomenal acceptance and satisfaction by the current businesses in the downtown to continue to reinvest in their location speaks well to the potential for other businesses to locate and succeed in downtown Faribault.
Downtown Faribault is urged to seek business owners who will complement and contribute to the business district’s success with dedication to:
Providing a good quality product at a fair price
Providing exceptional customer service
Responding to the changing needs of both trade area customers and visitors
Aggressively marketing to these target customer groups
Offering multiple, complementary product lines and/or services
Filling specific, unique niches
Having focus, imagination and a deep desire to meet the needs of the customer
To diversify its business base, as identified earlier in the Market Analysis, downtown Faribault should focus on the following opportunities:
1. Unique dining service (not full service) 2. Unique drinking establishment 3. Women’s and Men’s unique clothier 4. Boutique retail
28 | P a g e
Anchors such as the PARADISE have already demonstrated the potential for the downtown to attract a variety of consumers. Eating establishments like THE DEPOT BAR AND GRILL have shown Faribault that traveling to the downtown for quality product and exemplary service is easy to do and has grown substantially since its original design. From the focus group response and the interviews with downtown business owners there is an overwhelming shout out to reopen MONTE’s because of the unique experience remembered by its patrons.
The focus of promotion by Faribault Main Street should be to draw attention to all the unique experiences downtown Faribault affords. Downtown Faribault is the BEST place to attract and develop new business in all of Faribault in the next few years and this vision needs to have marketing materials and collateral promotion to this end. Work with the local and regional newspapers up to 60 minutes from Faribault to highlight the numerous positive changes occurring in downtown Faribault. The Chamber is doing a good job promoting the area’s visitor assets, but more awareness is needed regarding the downtown district as a whole. Faribault Main Street needs to promote the downtown District to solidify community focus and leadership of the potential and vision for downtown. As can be gathered from this Market Analysis, perception can outweigh the facts if allowed to flourish. The media needs regular public relation notices delivered to them that show the incremental successes accomplished in the district. The opening of a new business is certainly noteworthy, but as is, the readiness of a business property to showcase a new business. Volunteers actively working with building owners to decorate vacant window displays while having readily available a list of viable business opportunities for that location demonstrates to the media that Faribault Main Street is actively pursuing growth all the while garnering free publicity for the vacancies downtown.
1. Work to build a positive external image for Faribault in a 60 minute radius. 2. Entrepreneurial attraction and downtown business development often starts with a “pride in
the downtown” campaign. Downtown stakeholders including businesses, churches, organizations, etc. should all be tallied as to why they have pride in their downtown. Use their comments to foster publicity campaigns for the downtown. Volunteers can be used to generate monthly press releases to this regard.
3. Encourage volunteers to write regular letters to the editor highlighting their positive experiences downtown such as after an event or after a major shopping holiday. Be sure to include their feelings toward downtown’s safety and ease of walking.
4. Promote downtown businesses with Highlighting Events such as “Downtown Faribault Frequent Shopper” programs. Enticing local residents to shop downtown and at hours other than 9‐5PM
5. During a walk‐through of the downtown, IN(ALLIANCE) noted a variety of hours of operation of retail businesses. To effectively attract commuters and those who work out of town yet live in Faribault, it is necessary for the downtown shopping district to adopt similar hours of operation. Most importantly, simply staying open to 5:30PM would offer those who work opportunity to shop in the downtown. In many Main Street communities across the nation this is a common problem, but through proper training supported by community wide promotion of extended hours, the hours of operation will be rewarded in sales for the business owner.
29 | P a g e
6. Increase spending by visitors is a goal for all. Start by encouraging those coming to events and the PARADISE CENTER FOR THE ARTS to visit downtown Faribault stores and shops. Join with the PARADISE to provide a coupon book for special events, special discounts or other enticements. Encourage all the restaurants to offer extended hours during the downtown events and to aggressively promote those hours and dinner specials to the town’s special guests.
7. Host downtown business educational opportunities that give retailers insight on how to visually merchandise their establishments, as well as, beautify their entrances. Customer service training is valuable for new employees, also.
8. Pride in the downtown is best demonstrated when dollars are spent in the district. Implement a campaign that builds a buy loyalty program. “Main Street Bucks” are prevalent in communities who grasp this concept.

30 | P a g e
Committee Work Plans The following are IN(ALLIANCE)’s suggestion for committee work plans. In the previous section, PRODUCT READINESS, detail is given on how to approach downtown Faribault’s continued redevelopment. The recommended committees, activities, and tasks that follow in these work plans are only suggestive and certainly not all inclusive and are meant to launch greater discussion. We urge Faribault Main Street and its committees to discuss work plans in greater detail to develop understandable and feasible tasks to accomplish the goals set out in this study.
Committee: Economic RestructuringActivity: Bring back “Monte’s”
Task Responsible Individual(s) Due Date Budget
Contact building owner to devise purchase/leasing arrangements
$
Meet with local/regional restaurateurs to discuss expanding
$
Determine possibility of sub‐dividing facility
$
Host open houses at the facility and invite prospective restaurateurs
$
Committee: Economic RestructuringActivity: Shattuck‐St Mary’s presence downtown
Task Responsible Individual(s)
Due Date Budget
Identify 3‐5 key services that Shattuck‐St Mary’s should consider locating downtown
$
Identify prospective locations $ Meet with Shattuck‐St. Mary’s
$
Host and open house in the Main Street for Shattuck St. Mary’s staff and faculty
$

31 | P a g e
Committee: Economic RestructuringActivity: Brew Pub (“Fleckenstein Brew Pub”)
Task Responsible Individual(s) Due Date Budget
Determine a prospective location
$
Host a community meeting inviting home brewer’s and craft beer enthusiasts
$
Create a sub‐committee of the above individuals to lead
$
Visit brewpubs throughout MN and interview owners and key managers
$
Committee: Economic RestructuringActivity: Expand bike path and waterway
Task Responsible Individual(s) Due Date Budget
Identify current usage $ Layout plan for expansion $ Appoint a sub‐committee to attract these biking and waterway sports participants to gather downtown for networking, meeting or conference sessions
$
Promote Faribault as a bike friendly downtown
$
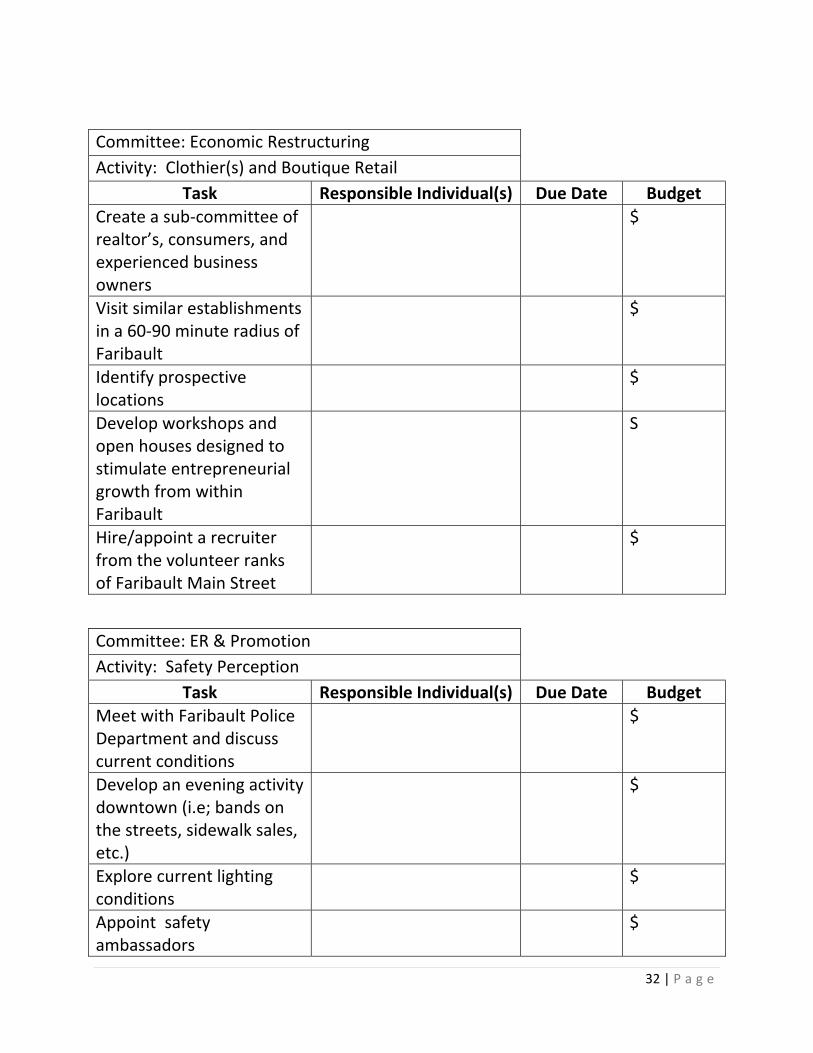
32 | P a g e
Committee: Economic RestructuringActivity: Clothier(s) and Boutique Retail
Task Responsible Individual(s) Due Date Budget
Create a sub‐committee of realtor’s, consumers, and experienced business owners
$
Visit similar establishments in a 60‐90 minute radius of Faribault
$
Identify prospective locations
$
Develop workshops and open houses designed to stimulate entrepreneurial growth from within Faribault
S
Hire/appoint a recruiter from the volunteer ranks of Faribault Main Street
$
Committee: ER & Promotion Activity: Safety Perception
Task Responsible Individual(s) Due Date Budget
Meet with Faribault Police Department and discuss current conditions
$
Develop an evening activity downtown (i.e; bands on the streets, sidewalk sales, etc.)
$
Explore current lighting conditions
$
Appoint safety ambassadors
$
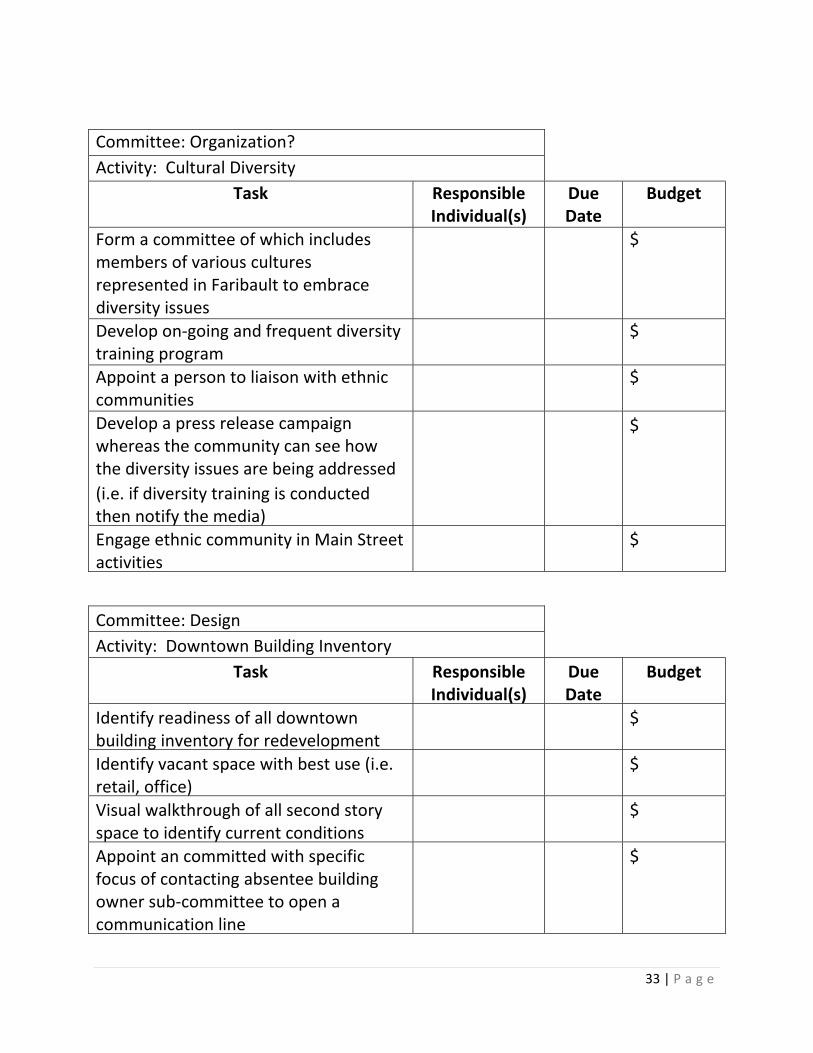
33 | P a g e
Committee: Organization? Activity: Cultural Diversity
Task Responsible Individual(s)
Due Date
Budget
Form a committee of which includes members of various cultures represented in Faribault to embrace diversity issues
$
Develop on‐going and frequent diversity training program
$
Appoint a person to liaison with ethnic communities
$
Develop a press release campaign whereas the community can see how the diversity issues are being addressed (i.e. if diversity training is conducted then notify the media)
$
Engage ethnic community in Main Street activities
$
Committee: Design Activity: Downtown Building Inventory
Task Responsible Individual(s)
Due Date
Budget
Identify readiness of all downtown building inventory for redevelopment
$
Identify vacant space with best use (i.e. retail, office)
$
Visual walkthrough of all second story space to identify current conditions
$
Appoint an committed with specific focus of contacting absentee building owner sub‐committee to open a communication line
$