drivers of human elephant interactions in coffee … · coffee agro-forestery landscapes . in ....
TRANSCRIPT

DRIVERS OF HUMAN ELEPHANT INTERACTIONS IN
COFFEE AGRO-FORESTERY LANDSCAPES IN
KODAGU (WESTERN GHATS), INDIA
An approach to understand the
Human-Elephant Conflict
By Payal Bal, Cheryl D. Nath and
Claude Garcia
October 2008
French Institute of Pondicherry
2
Acknowledgements There have been a number of people who are as much a part of this report as I have been. I
would like to acknowledge their support and encouragement.
I thank Dr. Claude Garcia for taking me on this project and for giving all guidance necessary
through the development, management and writing up stages of the research work. I thank
Dr. C.G. Kushalappa for being an integral part of the research designing and for helping with
the logistical planning of the project. I appreciate the time taken out by Cheryl D. Nath to
help me with my questions before, during and after office hours and for teaching me the
nuances of data analysis and report writing.
The work would not have been possible if not for the collaboration of the Karnataka Forest
Department. I thank Dr. Pathak (DCF Virajpet), Mr. Sudarshan (Ex-DCF Madikeri), Mr.
B.B. Mallesh (DCF –Madikeri Territorial Division), Mr. Anil Kumar (DCF – Madikeri
Wildlife Division), Mr Vinay Kumar (DCF – Hunsur Territorial Division) and Mr A.K.
Singh (DCF – Hunsur Wildlife Division). They permitted me ready access to the forest
department records that were necessary for this study.
I would like to acknowledge the help given by the office personnel at each of the offices of
the Forest Department. If it were not for the time and effort of Mr. Hallesh and Girija Madam
at the Madikeri office, Mr Giriyappa (Manager) and Mrs. Laxmi at the Virajpet office, Mr
Ashwat Narayan (Manager) at the Hunsur Territorial office and Mr. Mohan Kumar
(Manager) at the Hunsur Wildlife office, I would never have been able to make this study.
They have been the ones who helped me obtain and understand the data required, at times
offering me their lunches, their conversations in spite of the language barrier and their
patience in spite of our incessant requests. I would also like to thank Mr Ganagdhar
(Surveyor, Virajpet office) and Mr. Nandesh Kumar, Mr. Lokesh (Madikeri office). I am
sincerely grateful to the Forest Department staff.
I thank all my interviewees for their time. I thank Mr. Chittiappa, GM-Timber, TATA Coffee
for the help he offered in Pollibetta and Mr & Mrs Vijayan who made us (me and Marie) feel
right at home, providing us with everything from blankets to food when times were difficult.

3
I will never forget some of the people who I met on the field, Mr A.B. Poovaiah, Ibrahim,
Dinesh, Raju, Babajan, Subramani and the people of the Thattepara settlement. I would also
like to acknowledge the hard work of my field assistants Manu, Bopanna and Aiyappa. I am
happy to have worked with people as punctual and driven as them. I also thank Jenu for all
the tedious hours he put in for data collection and translation.
I thank Pascal and Nanaya at the FIP for their help with GIS; Pascal for being my home and
family in Pondicherry and Nanaya for his humor and for introducing us to his warm family. I
could not have got through the field work if it weren’t for my family in Coorg: Marie, Fanny,
Margaux, Lavin, Abin anna and little Trisha.
Payal Bal.
4
TABLE OF CONTENTS
CAVEAT.......................................................................................................................5 INTRODUCTION........................................................................................................6 OBJECTIVES OF THE STUDY................................................................................9 STUDY AREA............................................................................................................10 METHODS OF DATA COLLECTION ..................................................................11
ASSESSMENT OF CURRENT STATUS OF CONFLICT ...................................12 ASSESSMENT OF STAKEHOLDERS’ PERCEPTIONS.....................................12 ASSESSMENT OF HABITAT VARIABLES IN COFFEE ESTATES.................13 ASSESSMENT OF COFFEE CONSUMPTION BY ELEPHANTS......................18 DATA ANALYSIS..................................................................................................19
RESULTS ...................................................................................................................21 CURRENT STATUS OF HEC................................................................................21
A. Year wise trend ...............................................................................................21 B. Month wise trend.............................................................................................22 C. Spatial Trend ...................................................................................................23
STAKEHOLDERS’ PERCEPTIONS .....................................................................25 ESTATE CHARACTERISATION .........................................................................28 STUDIES ON COFFEE CONSUMPTION.............................................................32
DISCUSSION .............................................................................................................36 STAKEHOLDERS’ PERCEPTIONS .....................................................................39 “WHY ARE THE ELEPHANTS COMING INTO COFFEE ESTATES?” (ESTATE CHARACTERISATION STUDY)..........................................................................46 “ARE THE ELEPHANTS EATING COFFEE?” (STUDIES ON COFFEE CONSUMPTION) ...................................................................................................48
CONCLUSION ..........................................................................................................51 REFERENCES...........................................................................................................54 APPENDICES............................................................................................................58
APPENDIX 1: DETAILS OF INTERVIEWEES....................................................58 APPENDIX 2: DETAILS OF STUDY ESTATES .................................................59 APPENDIX 3: CHI-SQUARE TEST FOR COMPARING STUDY SAMPLE TO ELEPHANT CENSUS ESTIMATES......................................................................60 APPENDIX 4: QUESTIONNAIRE ........................................................................61
LIST OF FIGURES ...................................................................................................65 LIST OF TABLES .....................................................................................................66 LIST OF ABBREVIATIONS ...................................................................................66

5
CAVEAT This is a scientific report. Reference to the word forest is according to FAO’s definition
(Global Forest Resources Assessment Update 2005):
“Land spanning more than 0.5 hectares with trees higher than 5 meters and a canopy cover of
more than 10 percent, or trees able to reach these thresholds in situ. It does not include land
that is predominantly under agricultural or urban land use.
Explanatory notes
1. Forest is determined both by the presence of trees and the absence of other predominant
land uses. The trees should be able to reach a minimum height of 5 meters in situ. Areas
under reforestation that have not yet reached but are expected to reach a canopy cover of
10 percent and a tree height of 5 m are included, as are temporarily unstocked areas,
resulting from human intervention or natural causes, which are expected to regenerate.
2. Includes areas with bamboo and palms provided that height and canopy cover criteria are
met.
3. Includes forest roads, firebreaks and other small open areas; forest in national parks,
nature reserves and other protected areas such as those of specific scientific, historical,
cultural or spiritual interest.
4. Includes windbreaks, shelterbelts and corridors of trees with an area of more than 0.5 ha
and width of more than 20 m.
5. Includes plantations primarily used for forestry or protection purposes, such as
rubberwood plantations and cork oak stands.
6. Excludes tree stands in agricultural production systems, for example in fruit plantations
and agro-forestry systems. The term also excludes trees in urban parks and gardens.”
We therefore use the word forest without considering the actual land tenures or management
systems, which are of no concern to us in this work.

6
INTRODUCTION
The Asian Elephant, Elephas maximus, an integral part of many tropical landscapes, is
considered a flagship species for conservation throughout its worldwide range in Asian
countries. Ecologically vulnerable and threatened by the high market value of its ivory, the
species has been listed in Schedule 1 of the Indian Wildlife (Protection) Act, 1972; and the
International Union for Conservation of Nature (IUCN) Red list and Appendix 1 of
Convention on International Trade in Endangered Species (CITES).
Human elephant conflict (HEC) is not a new phenomenon. Humans and elephants have
shaped each others’ distribution over the years through a combination of crop-raiding and
exploitation (Nelson et al. 2003). In pre-colonial times elephants played a major role in the
distribution of arable farming (Parker & Graham 1989, Ville 1995, Barnes 1996). In the early
19th century ‘slash and burn’ subsistence farmers cultivating crops in central African forests
lost entire crops to elephants, while in other areas elephant crop-raiding caused food
shortages and displaced settlements (Barnes 1996; Graham 1973; Parker & Graham 1989;
Ville 1995).
HEC has been a two sided equation but more recently conflict has generally led to the
exclusion of elephants (Parker & Graham 1989, Hoare & Du Toit 1999). Now it is mostly
taken to mean direct conflict but it is part of a complex interaction between people and
elephants which in most countries has been going on in some form for centuries (Hoare
2001).
The broad definition of HEC adopted by the IUCN/SSC African Elephant Specialist Group
(AfESG) is "any human-elephant interaction which results in negative effects on human
social, economic or cultural life, on elephant conservation or on the environment" (Hoare,
2001). Studies on human elephant conflict in Asia (Sukumar and Gadgil 1988, Santiapillai
and Widodo 1993, Balasubramanian et al. 1995, De Silva 1998, Amirtharaj et al. 2001) and
Africa (Thouless 1994, Barnes et al. 1995, Tchamba 1996) identify crop raiding as the main
form of conflict. Nath & Sukumar (1998) define HEC as negative interactions such as crop
raiding by elephants, human injuries and deaths caused by elephants and killing of elephants
for reasons other than ivory extraction. Such interactions have also led to animosity and fear
among those sharing their land with elephants (Naughton et al. 1999), decrease in human

appreciation of wildlife and potentially severe detrimental effects for conservation (De Boer
& Baquete 1998; Nyhus et al. 2000).
THE INTERFACE The most serious issues now facing African and Asian elephants are habitat loss (through
land-use change), habitat fragmentation, ivory poaching and persecution as crop raiders
(Parker & Graham 1989, Sukumar 1991, Armbruster & Lande 1993, Barnes 1999, Nyhus,
Tilson & Sumianto 2000, FFI 2002). Associated with increasing habitat loss and
fragmentation is a concomitant increase in the human-elephant interface, and by extension an
increase in conflict (Nelson et al. 2003).
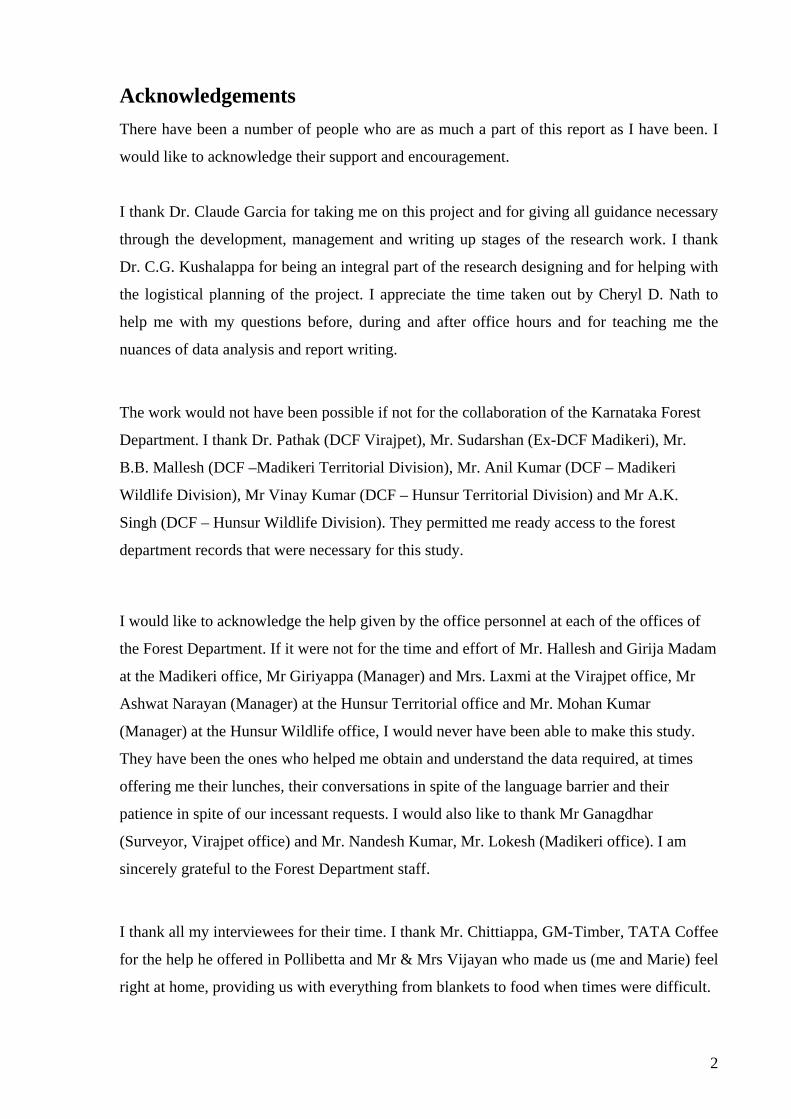
Figure 1: Former and Present Distribution of the Asian Elephant (Elephas maximus)
In the African continent, HEC is reported from most of the 37 elephant range states (Hoare
2001). In Asia it is prevalent throughout the 13 countries where the Asian elephant is
distributed. However present distribution of the Asian elephant covers only a fraction of its
former extensive range stretching from the Indian subcontinent in the west to Indochina in
the east (WWF Species Status Report 2000) (see Figure 1). Today, in southern India, the
Asian elephant occurs in the hill forests of the Western Ghats and adjacent Eastern Ghats in
the states of Karnataka, Kerala, and Tamil Nadu (Nair and Gadgil 1978; Nair et al. 1980;
Sukumar 1986, 1989). The protected areas within these states are estimated to have densities
in the range of 1 to 3 elephant per km2 (WWF Species Status Report, 2000).
7

8
India has a human population density of 311 inhabitants per square kilometre (Census of
India, 2001) and houses the largest Asian elephant population, approx. 25,000 (Amirtharaj et
al. 2001). As human and animal habitats overlap the friction results in the loss of life and
property. It is estimated that every year elephants damage 10,000 to 15,000 houses and
8,00,000 to 10,00,000 ha of crops (Kulkarni et al. 2007). The Central and State Government
spend up to 10 to 15crores of rupees every year on ex-gratia payment to victims and on
protection and control measures (Kulkarni et al. 2007). The increasing number of crop
raiding incidences has led to increasing people’s resentment towards the elephant and in
some cases led to retaliatory killing of elephants. It is estimated that every year 200 elephants
are killed in the country due to poaching, poisoning, electrocution and accidents. Human
losses are estimated to 150 to 200 annually (Bist, 2002).
The case of the Asian elephant provides an example of ecological, economical, sociological
and religious factors merging to create a complex, emotive and potentially harmful
combination for all involved parties. There is a very strong tradition of elephant worship in
most Asian countries which forms the foundation of elephant conservation initiatives in the
continent. However, the observed levels of HEC pose a major obstacle to elephant
conservation efforts in India. Conservationists must therefore find ways to raise public
tolerance of elephants and this requires a better understanding of their ecology. (Naughton et
al. 1999).
A WICKED PROBLEM: KODAGU CASE STUDY Kodagu is part of the Western Ghats of India, which are described as one of the 34 global
biodiversity hotspots (Myers et al. 2000, Gunawardene et al. 2007) due to its high level of
endemism. Situated mainly on the eastern slopes of the Western Ghats, Kodagu is a major
coffee-growing region (Figure 2) in India. It produces nearly one-third of Indian coffee,
mostly in agro-forestry systems under native tree cover. Forest is represented on 46% of the
land area of the district (Elouard 2000). Kodagu is dominated by agricultural land including
protected areas, sacred forests and patches under private tenures. Coffee estates cover 29% of
the total area of the district (Elouard 2000). The other crops that are associated with coffee
are pepper, cardamom, oranges and rice in the paddy fields. Altogether, forests and agro-
forests account for approximately 75% of the district.
Kodagu district with its surrounding protected forest belt totalling 1588km2 (39% of the
geographical area) is reported to have 1252 elephants according to the 2005 elephant census

9
of Karnataka Forest Department (as analysed by Asian Elephant Research and Conservation
Centre (AERCC), Kulkarni et al 2007).
Major landscape transformations in Kodagu during 1977-97 reduced the forest cover from
2566 km² to 1841 km² (Elouard & Guilmoto, 2000). This deforestation has occurred in
private lands, converted for coffee cultivation, whereas the reserve forests managed by the
Forest Department of Karnataka remained relatively untouched.
Studies on HEC in Kodagu (Nath and Sukumar 1998, Kulkarni et al. 2007, Bhoominathan et
al. 2008) have described the regional pattern of the conflicts and the coping strategies
developed by coffee planters and institutions (including the Karnataka Forest Department) to
tackle HEC. However, HEC relationship differs significantly across sites of human-elephant
conflict. The basis of the conflict is spatial (i.e. the distribution of and interface between
people and elephants) and temporal (i.e. seasonal), as opposed to numerical or density
dependent (i.e. how many people and elephants live together) (Barnes et al., 1995; Hoare,
1999c; Hoare & Du Toit, 1999; Smith & Kasiki, 1999). Irregular and unpredictable nature of
HEC incidents in the study area may also depend on the behavioural ecology of individual
elephant bulls (Sukumar 1991, Hoare 1996).
In this study we try to understand the specificity of the conflict in Kodagu by updating
previous studies and exploring the probable causes for elephant intrusion into coffee agro-
forestry systems. By understanding the current status of conflict, stakeholders’ perceptions
about the conflict, drivers of HEC and elephant dietary preferences to certain crops we hope
to be able to draw specific management implications for the study area. HEC calls for
adaptive management working with a combination of possible solutions since no single
method can work in isolation towards conflict alleviation (Nelson et al. 2003).
OBJECTIVES OF THE STUDY
The main objective of the study was to understand HEC in Kodagu through a
multidisciplinary approach. There were two phases to this study.
PHASE I: Assessing the spatial and temporal patterns of human/elephant conflicts at the
division level. We also identified the perceptions of the different stakeholders affected by the
HEC problem at the village level.

PHASE II: The study aims to identify the environmental factors that drive the elephants into
coffee agro-forestry systems (CAFs) at the level of the individual coffee plantation. The
question asked here is ‘Why are the elephants coming into coffee estates?’ Additionally, we
also worked on a corollary, ‘Are the elephants eating coffee?’
STUDY AREA
The study was conducted in southern part of Kodagu district (75o25’ – 76o14’ E, 12o15’ –
12o45’ N), Karnataka (Figure 2). The district has a total area of 410,200 ha and a human
population of c. 500,000. The elevation of the district ranges from 850 to 1745m (Elouard, C.
2000). The topography is varied: flatter in the east, gently rising westwards with small
valleys and isolated hillocks occurring centrally, and the Western Ghats highlands
dominating the western and south-western areas. The yearly rainfall ranges from less than
800 to more than 5000 mm (Elouard 2000). Much of this rainfall is primarily received from
the South-west monsoons (6000mm to 1000mm) from June to end of September. The North-
east monsoons bring rains from October to December but these showers are not comparable
to those in the summer. As we move eastwards, rainfall decreases and the forest type changes
correspondingly from wet evergreen to dry deciduous.
Figure 2: Location of study area and the surrounding reserve forests in Kodagu
10

The district is divided into three taluks or administrative units (Figure 2) headquartered at
Madikeri, Virajpet and Somwarpet. However administrative units used by the Forest
Department do not coincide with the taluk boundaries since they divide the district into two
divisions i.e. Madikeri, the northern half of the district inclusive of Somwarpet taluk and
Virajpet constituting the southern half. Divisions are further divided into ranges (six in
Madikeri and five in Virajpet) and ranges are broken up into sections.
METHODS OF DATA COLLECTION
PHASE I – Spatial pattern of conflict and Stakeholders’ Perceptions
SITE SELECTION: Based on discussions with key informants, we identified Virajpet
taluk1 in south Kodagu for the purpose of HEC data collection, partly because of its high
level of conflict and because the results of the study would feed into existing projects of the
French Institute of Pondicherry. Two villages in Virajpet division, Chennangi and
Channayanakote (see Figure 3), lying next to the Reserve Forest (RF) were selected for the
purpose of interviews. This work was carried out from May to July 2007.
Figure 3: Location of study villages
1 Known as the Virajpet Forest Division under jurisdiction of the Forest Department.
11
12
ASSESSMENT OF CURRENT STATUS OF CONFLICT
Records of HEC from 1997-2007 for Virajpet division villages were obtained from the
Virajpet Division Forest Department (FD) headquarters, following permission from the
Deputy Conservator of Forest. However for some villages falling within Nagarahole,
Anechowkur and Kalhalla ranges of the Rajiv Gandhi (Nagarahole) National Park (NNP),
cases have been registered at the Wildlife Division of Hunsur Forest Department. Some
villages of Coorg in the Anechowkoor and Periyapatna ranges register their HEC cases at the
office of the Territorial Division of Hunsur Forest Department. Further, there also are cases
from Srimangala Range (bordering Brahmagiri Wildlife Sanctuary) that continue to be
registered at the Madikeri Wildlife Division office.
The records were then translated and entered into a database. We also gathered additional
data from regional corporate coffee estates. The data provided information on crop
compensation and human death and injury cases. For all the cases, location and year of
occurrence were noted. Unlike for previous years, data from 2006-2007 contained details of
the month of damage and the crops damaged. We then cross-referenced our data with the
results on levels of conflict in Virajpet Division presented by Kulkarni et al, 2007.
Additional data are being gathered on crop raiding cases for Virajpet villages bordering NNP,
registered at the offices of the Wildlife and Territorial Divisions of the Hunsur Forest
Department and for those bordering Brahmagiri Wildlife Sanctuary (BWS) registered at the
office of the Madikeri Wildlife Division.
ASSESSMENT OF STAKEHOLDERS’ PERCEPTIONS
Qualitative data regarding HEC was obtained through semi-structured interviews with local
stakeholders. Our sample included private estate owners, forest watchers, Eco-Development
Committee (EDC) and Village Forest Committee (VFC) members, estate workers, tribal
inhabitants and local experts (total 20 interviews coded I.1, I.2 …. I.20; see Appendix 1 for
details). Four of the interviews were not recorded and therefore could not be used for
statistical analysis. We asked open ended questions on details of crop damage, stakeholders’
perception on the HEC and the coping strategies developed locally. The discussions were
carried out in English wherever possible, otherwise in Kannada or Kodava with the
assistance of a translator. The first five interviewees were identified from FD records of crop
compensation for the selected villages. We expanded the sample size to 20 through

13
snowballing. Interviews lasted for one to two hours and were systematically followed by a
survey of the plantation with the interviewee for elephant damage.
PHASE II – Environmental Factors and Feeding Patterns in CAFs
SITE SELECTION: Based on the preliminary survey of the conflict situation in
Virajpet Division from phase I of the study, we selected six villages, Chennangi,
Channayanakote, Mekur Hosakeri, Badaga Banangala, Hosur and Bettageri (Figure 3). The
villages extend from the RF boundary up to the middle of the district (10-11 km), along a
transect perpendicular to the boundary of the RF.
Coffee estates were randomly selected within these villages, using the contact details
corresponding to randomly selected survey numbers obtained from the respective revenue
offices. We thus covered 20 estates coded E.1, E.2 …. E.20 (see Appendix 2 for details)
between January to March 2008.
ASSESSMENT OF HABITAT VARIABLES IN COFFEE ESTATES
(Estate Characterisation Study)
We identified 10 habitat variables to characterise each of the study estates based on the
interviews conducted in phase I:
1. Area of the estate
2. Distance to Reserve Forest
3. Area under paddy cultivation
4. Number of water bodies
5. Tree density
6. Percentage of canopy cover
7. Percentage of fruit trees
8. Percentage of preferred trees2
9. Percentage of Erythrina subumbrans trees
10. Percentage of Jackfruit (Artocarpus heterophyllus) trees
Estate area, distance to RF, area under paddy cultivation and the number of water bodies
were estimated using Geographic Information System (GIS) software (ArcGis 9.1). To
measure tree species, abundance, density and canopy cover, 10 sampling points coded PQC
2 Trees that were repeatedly damaged by elephants (according to FD data and interviewees) were considered to
be preferred by the elephant while they were foraging in coffee estates.

14
(Point Quadrat Centre) were laid within each estate, after randomly generating angles for
direction and number of steps from a starting location within the estate. For large estates, 10
random points were selected using a Global Positioning System (GPS) unit (Trimble:
Geoxm, 2005 series). The coordinates for each sampling point were recorded using a GPS
(see Figure 3).
At each sampling point, 5 measure points were laid, one on the same location, and four
additional, each 10m away from the centre in the north, south, east, and west directions,
coded PQ1, PQ2, PQ3 and PQ4, respectively. Figure 4 illustrates the sampling protocol. Each
set of five points per PQC (inclusive of the PQC itself) thereby made one plot.
Information about the study estates, its management, frequency of elephant visitation in 2007
and type of damage caused was also obtained by means of questionnaires handed out to the
study estate owners (see Appendix 2).
Estate area: Due to missing information in three of the questionnaires, estate area was
estimated using GIS. For small estates this was done based on GPS marked boundaries. For
large corporate estates, the boundary was estimated by drawing a polygon whose edges were
at an average of 50 m from the outermost PQCs. GIS estimates were used for all the estates
for analysis, as the correlation between this estimator and the data recovered through
questionnaires is high (R2 = 0.85).
Distance from RF: The distance between the closest PQC to the RF and the closest edge of
the RF boundary was measured using GIS software. RF boundaries were identified using
satellite images and previously generated maps at the FIP.
Area under paddy cultivation and number of water bodies: A 500m buffer from the
boundary of the study estates was created using GIS. Area under paddy and number of water
bodies falling within the boundary of the buffer were identified by means of Remote Sensing
(RS) images and GPS locations.
Tree density: The distance between a PQC and the 10th closest tree (>30cm gbh) to the PQC
was measured and tree density was calculated using the following formula:
Tree density = 10/π r2, where ‘r’ is the distance to the furthest tree (out of the 10 recorded
trees) from the PQC. Figure 5 illustrates the method of measurement and tree density
calculation.

15
Figure 4: Sampling protocol for measurement of some of the habitat variables and a generalised depiction of layout of PQCs across study estates

Figure 5: Tree density
measurement within the coffee
estate
Canopy cover: A convex spherical densiometer (Figure 6) was used to estimate
canopy cover at each of the five points per plot. Each reading of the densiometer
comprised of four readings, N/S/E/W at the point of measurement. Coffee and pepper
leaves were not considered while taking measurements for canopy. The measure was
then converted to percentage.
(Photo credit: Decroix, M. & Chretien F.)
Figure 6: Convex spherical densiometer
16
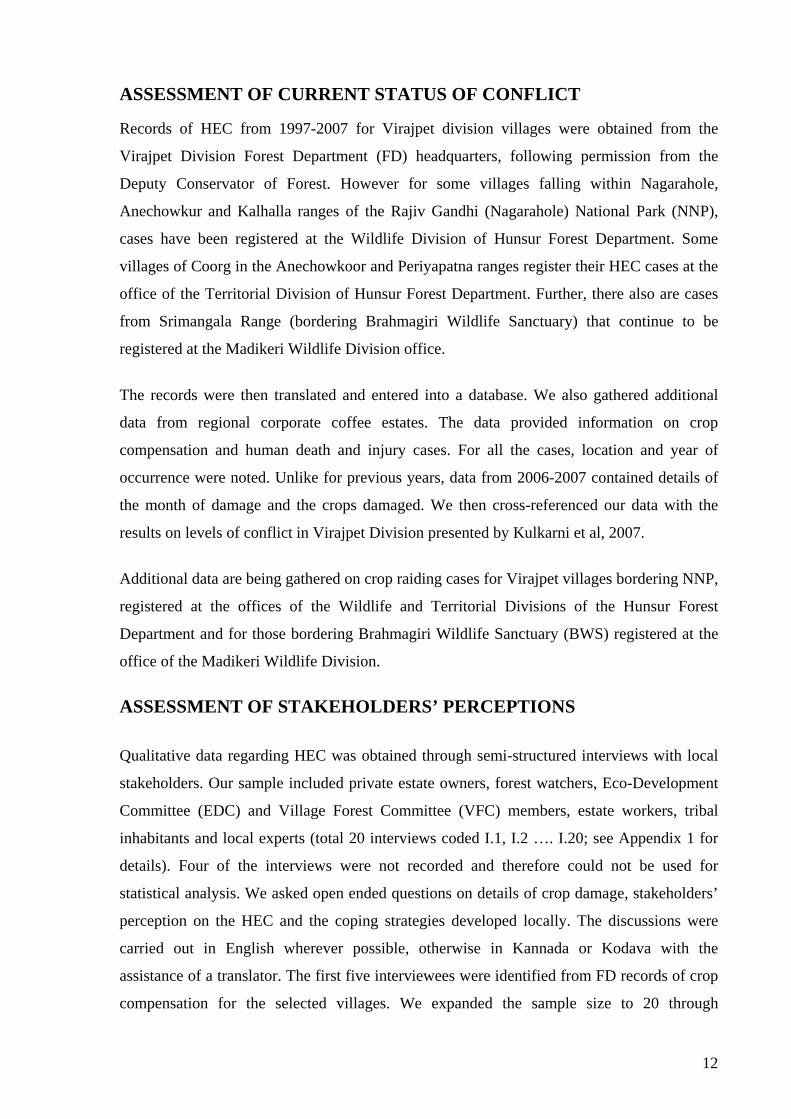
Percentage of fruit trees, preferred trees, Erythrina trees and Jackfruit trees: At
each PQC, species of the 10 closest trees to the PQC with >30 cm girth at breast
height (gbh) were noted according to the following basic classification:
a. Arecanut (Areca catechu)
b. Banana (Musa paradisiaca)
c. Coconut (Cocos nucifera)
d. Jackfruit (Artocarpus heterophyllus)
e. Orange (Citrus reticulata)
f. Wild mango (Mangifera indica)
g. Dadup (Erythrina subumbrans)
h. Silver Oak (Grevillea robusta)
i. Other species
10 trees/ plot x 10 PQC plots/estate = 100 trees/estate
Percentage of fruit trees was calculated by pooling together arecanut, banana,
coconut, jackfruit, orange and mango. Percentage of trees preferred by elephants was
calculated by pooling arecanut, banana and coconut based on the FD crop damage
data, along with jackfruit and Erythrina based on field notes and interviews.
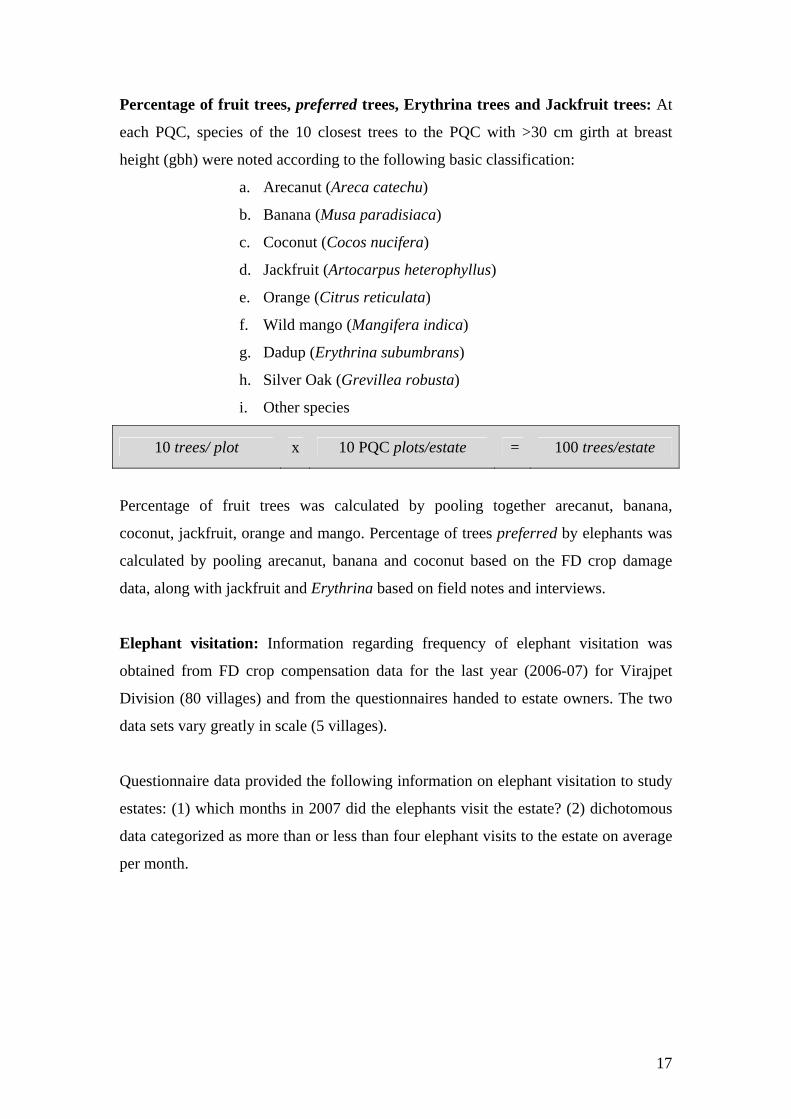
Elephant visitation: Information regarding frequency of elephant visitation was
obtained from FD crop compensation data for the last year (2006-07) for Virajpet
Division (80 villages) and from the questionnaires handed to estate owners. The two
data sets vary greatly in scale (5 villages).
Questionnaire data provided the following information on elephant visitation to study
estates: (1) which months in 2007 did the elephants visit the estate? (2) dichotomous
data categorized as more than or less than four elephant visits to the estate on average
per month.
17

ASSESSMENT OF COFFEE CONSUMPTION BY ELEPHANTS
The location of all dung piles encountered during the study was recorded with a GPS.
In addition, dung bolus3 diameter was measured and the presence of coffee seeds was
noted. A total of 209 dung piles were observed during the study period of January
2008 - March 2008. 62 of these could not be measured for size due to excessive
damage to the boli and in these cases only the number of coffee seeds and GPS
coordinates were noted. After sampling, the dung pile was destroyed to prevent
double counts. The following parameters were considered for this part of the study:
1. Age of the elephants based on measurement of bolus diameter (Sample size =
147)
2. Presence/Absence of coffee seeds in dung piles (Sample size = 209)
Age of the elephants: Bolus diameter was used as an indicator of age as these are
known to be positively correlated (Jachmann & Bell 1984, Vidya 2000, Reilly 2002,
Morgan & Lee 2003, Morrisson et al. 2005). Boli were considered ‘intact’ if there
were no apparent deformations due to impact with the ground (Morrison et al. 2005)
or trampling. The long and short axes of the cross section of a cylindrical bolus were
measured, and then the mean of these 2 measures was taken as the diameter for a
bolus. Three such readings were obtained per dung pile and averaged.
We grouped the elephant dung piles into two age classes based on bolus diameter,
juveniles and adults. Ten centimeters was used as the bolus diameter cut off for
juvenile elephants, as in previous studies (Jachmann & Bell 1984, Morgan & Lee
2003) that related this size to Asian or African elephants aged five to six years. Below
this age elephants may be considered as juvenile (Sukumar 1992). In addition, the
proportions of dung piles in the two age classes achieved with this size classification
was in accordance with the population proportions of juvenile and adult elephants in
the 2005 census by the KFD (χ2= 0.8622, N=147, df=1, p=0.3531) (see Appendix 3).
Bolus diameter < 10cm corresponds to a juvenile elephant
Bolus diameter > 10 cm corresponds to an adult and sub-adult elephant
3 An elephant dung pile consists of 2 – 4 boli, each of which is roughly cylindrical in shape with average diameters varying from 6 – 18 cm, depending on the age of the elephant.
18

Presence of coffee seeds: Number of coffee seeds (individual cotyledons) was
estimated according to the following categories:
0 coffee seeds
1-50 coffee seeds
> 50 coffee seeds
DATA ANALYSIS
Current status of conflict
Number of crop compensation and human death and injury cases was considered as an
indicator of the intensity of crop raiding in the area (Nath & Sukumar 1998; Kulkarni
et al 2007). FD crop compensation data were used to generate temporal and spatial
trends for HEC in Virajpet Division over the last 10 years. Incidence of damage and
human deaths for each year was plotted from 1997-2007 and incidence of damage for
each crop was plotted from 2006-2007. Frequency of crop damage/compensation for
each village from 1997-2007 was plotted using GIS software to generate a conflict
map.
To estimate elephant visitation to coffee estates from FD data, we made the
assumptions that (1) one application filed corresponds to one incidence or case of
crop damage/raiding by elephant and (2) that the correlation between the number of
cases and the number of visitations is linear.
1 application for crop compensation → 1 case
of crop damage/raiding → 1 visitation to the coffee estate
Stakeholders’ Perceptions
Interviews were analyzed to obtain quantitative data, in terms of number/proportion of
respondents, on the three topics emerging from the discussions: causes of HEC,
mitigation strategies and the role of FD.
Estate Characterisation
We used regression analysis to test if elephant visitation (dependent variable) to an
estate was related to the habitat variables of the estates. Estates were categorized into
two groups, more than four visits per month and less than four visits per month, based
19

on the questionnaires. T-tests were performed to find significant differences in each of
the independent variables across the study estates.
Patterns in seasonality were tested through non-parametric correlations by looking for
significant relationships between seasonal visitation of elephants and the quantity of
the seasonal resource available within the study estates. We calculated the non
parametric correlation, Kendall’s Tau-B in addition to Spearman’s correlation since
the former is preferable to the latter for small datasets with tied ranks (). The
hypothesis being tested against was that elephant visitation was expected to increase
with increase in the seasonal resource.
Study on Coffee Consumption:
Chi-square tests were conducted to look for a preference for coffee berries among the
elephants visiting the study estates. An assumption of these was that each dung pile
represents a feeding instance and not necessarily an individual elephant. Therefore the
proportion of dung piles with coffee seeds present in them, as well as the quantity of
coffee seeds per dung pile are expected to be positively related to the amount of time
spent (by an unknown number of elephants) feeding on coffee.
1 dung pile → 1 feeding instance,
Comparisons were carried out between juveniles, adults and the total sample set.
NOTE: For all statistical tests, we generally considered 0.05 as the significance level.
However, we have also mentioned results that were significant at p < 0.10.
20

RESULTS
CURRENT STATUS OF HEC A. Year4 wise trend Crop Raiding Cases: Figure 7 shows the variation across 10 years of crop raiding
data (1997-2007) for Virajpet division.
050
100150200250300350400450500
1997-98 1998-99 1999-00 2000-01 2001-02 2002-03 2003-04 2004-05 2005-06 2006-07
Year
No
of c
ases
of c
rop
dam
age
Figure 7: Year-wise trend in crop raiding for Virajpet division during 1997-2007
The above graph shows that crop damage in Virajpet fluctuates around an average of
155 cases per year from 1997-2006. Year 2006-07 shows exceptionally high conflict
as compared to previous years.
Table I: Non parametric (Spearman’s) correlation for annual number of crop raiding
cases from 1997-2007.
YEAR SPEARMAN’S CORRELATIONCOEFFIEICENT (rS) t-STATISTIC SIGNIFICANCE
(p)
1996-2006 0.80606 3.852242 0.002431
1996-2005 0.733333 2.85381 0.012277
Results (Table I) show a strong positive correlation between time and the number of
crop damage cases indicating that damage is higher in later years, as is also seen from
Figure 7 wherein cases for years before 2002 are below average.
4 A year in the FD records starts from 1st April to 31st March of the following year.
21

Human Death and Injury Cases: Number of human mortality cases was highest in
2003-04 and cases of injury were highest in 2004-05. We do not see any trend in the
data (Figure 8).
0
2
4
6
8
10
12
1997-98
1998-99
1999-2000
2000-01
2001-02
2002-03
2003-04
2004-05
2005-06
2006-07
No
of c
ases
DeathsInjuries
Figure 8: Number of human death and injury cases in Virajpet division
Therefore, on an average, the division experiences 155 cases of crop and property
damage, three cases of human death and two injury cases every year. This requires an
expenditure of over six lakhs per annum as ex-gratia5 payments by the Virajpet FD.
B. Month wise trend Figure 9 shows the monthly pattern of crops raiding incidents and the nature of the
crops raided or damaged incidentally.
5 Payments for crop damages, loss of human life, permanent disability, loss of life of domesticated
animals due to wild animals attack and damages to the property due to attack by elephants and human
injuries by the Forest Department (GO No. FEE 52 FWL 96 Bangalore dated: 12-2-2002)
22

0
10
20
30
40
50
60
70
Jan Feb Mar Apr May Jun Jul Aug Sept Oct Nov Dec
No
of in
cide
nts
CoffeeBananaArecanutCoconutOthersPaddyTotal incidents
Figure 9: Incidence of damage for each crop in Virajpet Division during 2006-07
(Other crops include orange, cardamom, ginger and pepper)
There are two peaks in crop raiding as indicated by crop compensation applications
(Figure 9):
1. June-August
2. November-January
Perennial crops like coconut, arecanut and banana exhibit similar patterns with two
peaks in crop damage annually while seasonal crops like paddy exhibit a different
behaviour altogether, starting to peak exclusively from October-January. Coffee,
though seasonal, shows a pattern similar to the perennial crops except in February
when it peaks in damage for a second time.
C. Spatial Trend The conflict map developed from 10 years worth of FD data (1997-2007) for Virajpet
division demarcates areas of higher conflict (Figure 10)6. Villages were colour coded
according to the total number of compensation cases per village for all the years. Red
areas are indicative of high conflict whereas white areas indicate no conflict.
6 The results are in the process of being updated with the additional data being gathered from forest
divisions outside the Virajpet Forest department.
23
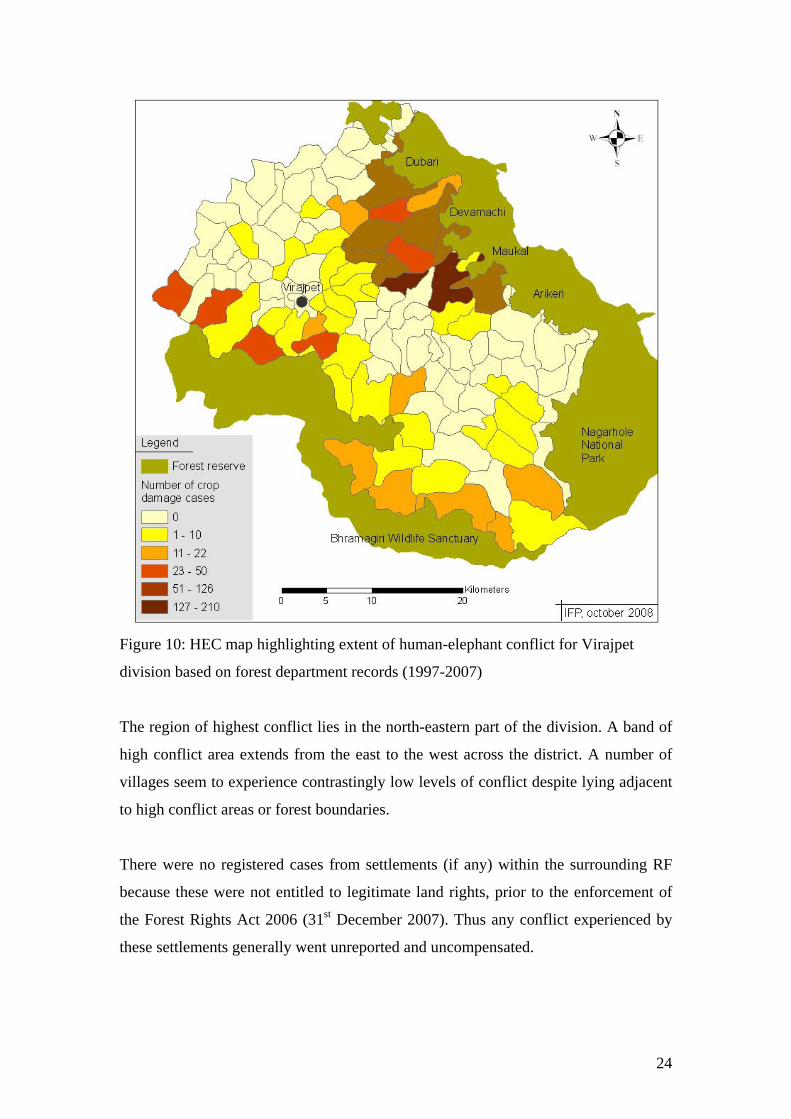
Figure 10: HEC map highlighting extent of human-elephant conflict for Virajpet
division based on forest department records (1997-2007)
The region of highest conflict lies in the north-eastern part of the division. A band of
high conflict area extends from the east to the west across the district. A number of
villages seem to experience contrastingly low levels of conflict despite lying adjacent
to high conflict areas or forest boundaries.
There were no registered cases from settlements (if any) within the surrounding RF
because these were not entitled to legitimate land rights, prior to the enforcement of
the Forest Rights Act 2006 (31st December 2007). Thus any conflict experienced by
these settlements generally went unreported and uncompensated.
24

STAKEHOLDERS’ PERCEPTIONS
The problem of HEC was reported to have started 10-20 years ago by seven of the
interviewees (I.27, I.8, I.11, I.16, I.17, I.19) and nine of the estates (E.5, E.6, E.7, E.8,
E.10, E.11, E.12, E.19, E.20). But oldest recollections went back to 30 years (I.12)8
and there were also reports of the problem having always persisted (E.14, E.17). We
assessed the stakeholders’ perceptions on the causes of the HEC and the mitigation
strategies developed by the KFD.
1. Causes of conflict
• Lack of resources in the forest: Seven respondents out of 16 believed that the
elephants came into the estates because there was nothing in the forest for them to
eat, “no green plants, no bamboo” (I.2). In comparison, “Estates are greener”
(I.19) and provide better forage, particularly jackfruit trees, paddy, banana and
even coffee (7 respondents). They also stated that the few water bodies in the
forest did not retain water even after monsoon showers unlike coffee estates
where water tanks have been established to irrigate the crop. Those water tanks
provide a perennial water supply that elephants can tap easily.
• Habitat preferences: Seven interviewees out of 16 stated that the elephants had
now marked preferences for the habitat inside coffee estates, where they would
find resources, water and shade. “They don’t like to stay in the forest. They want
to come and live in the estates because they can get everything in the estates.”
(I.11); “They are accustomed to the plantation and now they don’t want to go
back to the forest” (I. 2); “Given the area, the water sources, jackfruits, greenery
[…] why would the elephant want to go back into the forest?” (I. 17).
• Elephant population dynamics: Seven of the respondents out of 16 believed that
the elephant population in their area had increased. “The number of elephants has
certainly increased. They are breeding here (in the estates)” (I.11). The increase in
elephant population was causing an increased number of conflicts (I.17).
• Teak (Tectona grandis) plantation within the Reserve forest: Four out of 16 of
the interviewees said that teak had taken the place of the original palatable plants
in the forest, thereby causing an increase in HEC. “There is no food in the forest,
7 “From nearly 8-10 years it has started coming, otherwise it was not there” (I.2) 8 “Since 30 years I’ve been here and we have had this problem every year.” (I.12)
25

only teak which forms 75% of the forest.” (I.9). “Nothing grows under teak
plantation.” (I.13). One interviewee objected to this, indicating that the teak
plantations are much older than the onset of the HEC (I.17).
• New patterns of seasonality: According to four and six interviewees out of 16,
respectively, elephant visitation was more frequent during the jackfruit and
paddy9 seasons. However, eight interviewees out of 16 reported that the elephant
behaviour had now changed. While there used to be seasonality in their visitations
to the estates, this was no longer the case. “Elephants come into the estate
throughout the year. There used to be seasonality 5-6 years back.” (I.19); “Now
there is no season for them because they don’t like the forest anymore.” (I.11); “It
seems that the elephants are being seen even out of season.” (I.17); “Damage is
not as frequent even though the elephants are present every day.” (I.16)
• Increased aggressiveness of the elephants: This was stated by 3 out of 16 of the
interviewees. According to I.1, the elephants had become more aggressive,
particularly in the north part of Kodagu where the conflict was intense owing to
the constant disturbance and confrontation with humans. “They are not very
aggressive animals by nature but they are made aggressive.” (I.19).
• Habitual elephant movement: 2 out of 16 interviewees believed that the
elephants were merely opportunistic feeders while en-route through the estates, on
their habitual movement paths. “They are passing through my estate to go into the
forest; it is an elephant route” (I.10). Additionally, dams were said to be
restricting and channelling elephant movement (I.1).
• Habitat fragmentation: 2 out of 16 respondents suggested that the elephants
didn’t have enough space to live in since their habitat had decreased over the
years.
2. Mitigation strategies and role of Forest Department:
• Solar fences and elephant-proof trenches: All the interviewees to whom the
question was asked (12) considered solar fences and EPTs to be currently
ineffective for want of maintenance. 8 of the 16 believed solar fences would be
ineffective even if maintained properly. “It’s a useless thing to do electric fencing.
Personally, I feel it’s a waste because the elephants are too smart.” (I.2); Solar
9 “Elephants come daily During paddy harvesting” (I.8)
26

fences were said to be made of poor quality materials, had insufficient voltage
and occasional gaps owing to time lag between damage and repair in the fence. 10
out of 16 said that trenches could be a possible solution if maintained properly i.e.
if they were deep, wide, and continuous, and were re-dug periodically after rains.
“Trenches made of concrete could be effective against the elephant” (I.17).
Chilli smoke method (1 respondent) to drive away elephants; and translocation (2
respondents) and culling (2 respondents) as a means to reduce HEC were
mentioned. Radio collaring elephants to safeguard estate workers from
approaching elephants was suggested by a respondent who was of the opinion
that solutions for HEC called for larger investments; “Prevention cannot work,
unless it is on a mega-scale” (I.17).
• Attitude towards the Forest Department: There was general feeling of
discontent among the local people towards the Forest Department because of the
following stated reasons:
° No follow up on the part of the FD on the maintenance of solar fences
and EPT (3 respondents)
° Delay in providing help and support to farmers suffering crop damage
(12 respondents)
° Repeated visits to the FD offices for the application procedure (4
respondents)
° Lack of transparency and accountability. (6 respondents)
° Lack of motivation from FD staff to assist the people affected by HEC
(3 respondents)
° Lack of infrastructure and staff to deal with HEC (3 respondents)
° Ineffective use of allotted HEC funds (1 respondent).
Some attitudes were more constructive: “We cannot tell the FD that they are
slacking in their work. We cannot because we don’t know what their problems
are. But if they can join hands with us and express their problems, then we can see
where else we can find a solution. If not the FD, who else can we go to?” (1.19).
27
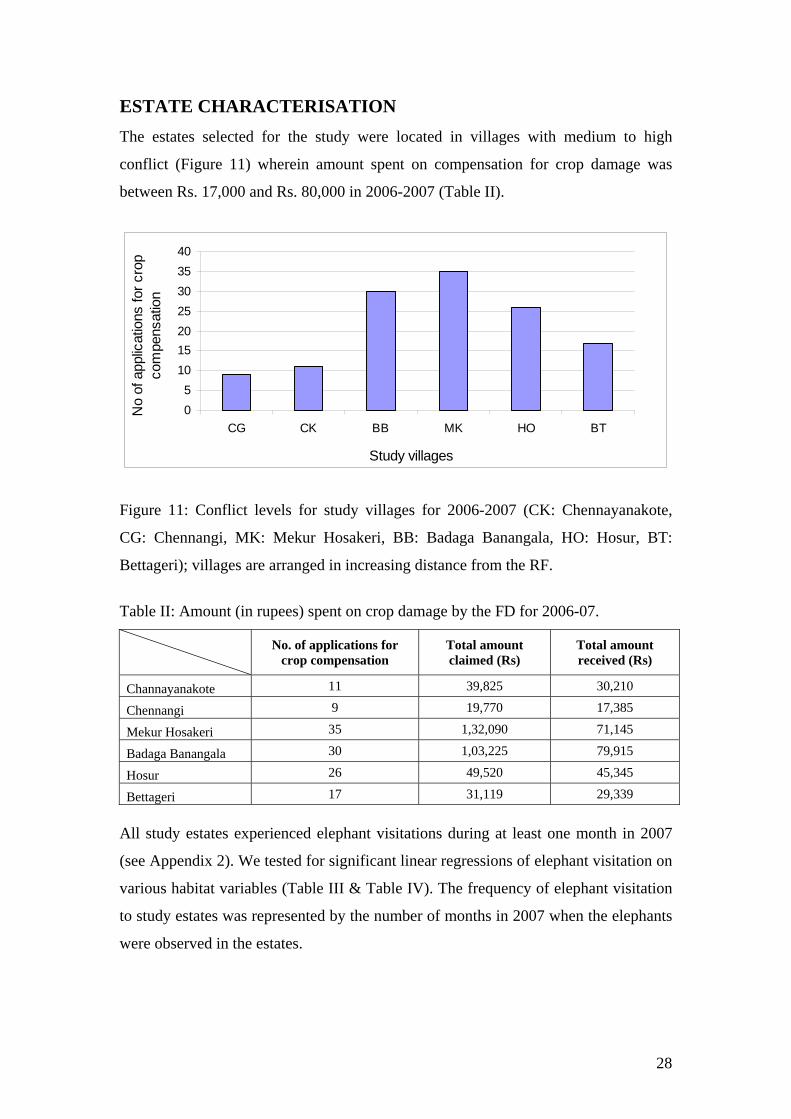
ESTATE CHARACTERISATION The estates selected for the study were located in villages with medium to high
conflict (Figure 11) wherein amount spent on compensation for crop damage was
between Rs. 17,000 and Rs. 80,000 in 2006-2007 (Table II).
05
10152025303540
CG CK BB MK HO BT
Study villages
No
of a
pplic
atio
ns fo
r cro
p co
mpe
nsat
ion
Figure 11: Conflict levels for study villages for 2006-2007 (CK: Chennayanakote,
CG: Chennangi, MK: Mekur Hosakeri, BB: Badaga Banangala, HO: Hosur, BT:
Bettageri); villages are arranged in increasing distance from the RF.
Table II: Amount (in rupees) spent on crop damage by the FD for 2006-07.
No. of applications for crop compensation
Total amount claimed (Rs)
Total amount received (Rs)
Channayanakote 11 39,825 30,210
Chennangi 9 19,770 17,385
Mekur Hosakeri 35 1,32,090 71,145
Badaga Banangala 30 1,03,225 79,915
Hosur 26 49,520 45,345
Bettageri 17 31,119 29,339
All study estates experienced elephant visitations during at least one month in 2007
(see Appendix 2). We tested for significant linear regressions of elephant visitation on
various habitat variables (Table III & Table IV). The frequency of elephant visitation
to study estates was represented by the number of months in 2007 when the elephants
were observed in the estates.
28

Table III: Details of habitat variables across the 20 study estates
S.No. HABITAT VARIABLE MIN VALUE MAX VALUE MEAN SD
1 Estate area (ha) 1.74 446.96 75.01 140.912 Distance from RF (m) 40.00 6625.00 1858.48 1954.893 Tree density (per ha) 145.07 689.93 354.85 142.424 Percentage of canopy cover 38.46 83.26 61.06 15.065 Area of paddy cultivation (ha) 0.00 58.50 17.84 14.526 No. of water bodies 1.00 18.00 7.60 5.017 Percentage of fruit trees 0.00 57.00 14.65 13.848 Percentage of preferred trees 4.00 47.00 22.50 11.709 Percentage of Erythrina 0.00 38.00 15.20 11.64
10 Percentage of Jackfruit 0.00 7.00 2.50 2.50
Table IV: Linear regression results
S.No. INDEPENDENT VARIABLE SLOPE
(B)
TEST STATISTIC
(F) SIGNIFICANCE
(p) STRENGTH
(R2) 1 Estate area 4.986 13.977 0.002 0.4372 Distance from RF 9.177E-02 4.280 0.053 0.1923 Tree density -1.71E-02 5.953 0.025 0.2494 Percentage of canopy cover 1.781E-02 0.054 0.818 0.0035 Area of paddy cultivation 6.733E-02 0.750 0.398 0.0406 No. of water bodies 0.613 11.742 0.003 0.3957 Percentage of fruit trees -0.545 0.744 0.400 0.0408 Percentage of preferred trees -0.170 3.550 0.076 0.1659 Percentage of Erythrina -0.130 1.902 0.185 0.096
Estate area, tree density and number of water bodies were significantly related to
elephant visitation (p = 0.002, 0.025, 0.003 respectively) whereas distance from RF
and percentage of preferred trees (p = 0.053, 0.076 respectively) showed a
relationship significant at p < 0.10. Tree density (B = -1.71E-02) and percentage of
preferred trees (B = -0.170) showed negative relationships with elephant visitation.
Based on the results of regression, we used parametric and non-parametric (1-tailed)
tests to look for significant differences in the habitat variables across study estates
(Table V). The estates were categorized according to dichotomous data on elephant
visitation (< 4 and > 4 visits per month). There were 10 estates in each category.
29

30
Table V: Results of T-tests
S.No. VARIABLE t
1-TAILED SIGNIFICANCE
(p) 1 Estate area -1.781 0.0472 Distance from RF -1.856 0.0403 Tree density 1.397 0.0904 Percentage of canopy cover -1.222 0.1195 Area of paddy cultivation 0.346 0.3676 No. of water bodies -2.266 0.0217 Percentage of fruit trees 1.080 0.1488 Percentage of preferred trees 1.456 0.0819 Percentage of Erythrina trees 0.959 0.175
Estate area (p = 0.047), distance from RF (p = 0.040) and number of water bodies
(p = 0.021) were significantly different in the two categories of study estates but
differences in tree density (p = 0.090) and percentage of preferred fruit trees
(p = 0.081) were significant only at p < 0.10.
According to the results on seasonality from FD data, jackfruit, preferred trees and
paddy were tested for their influence on elephant visitation. Non-parametric
correlation was used to find a relation between seasonal elephant visitation and the
corresponding seasonal resource (Table VI).
31
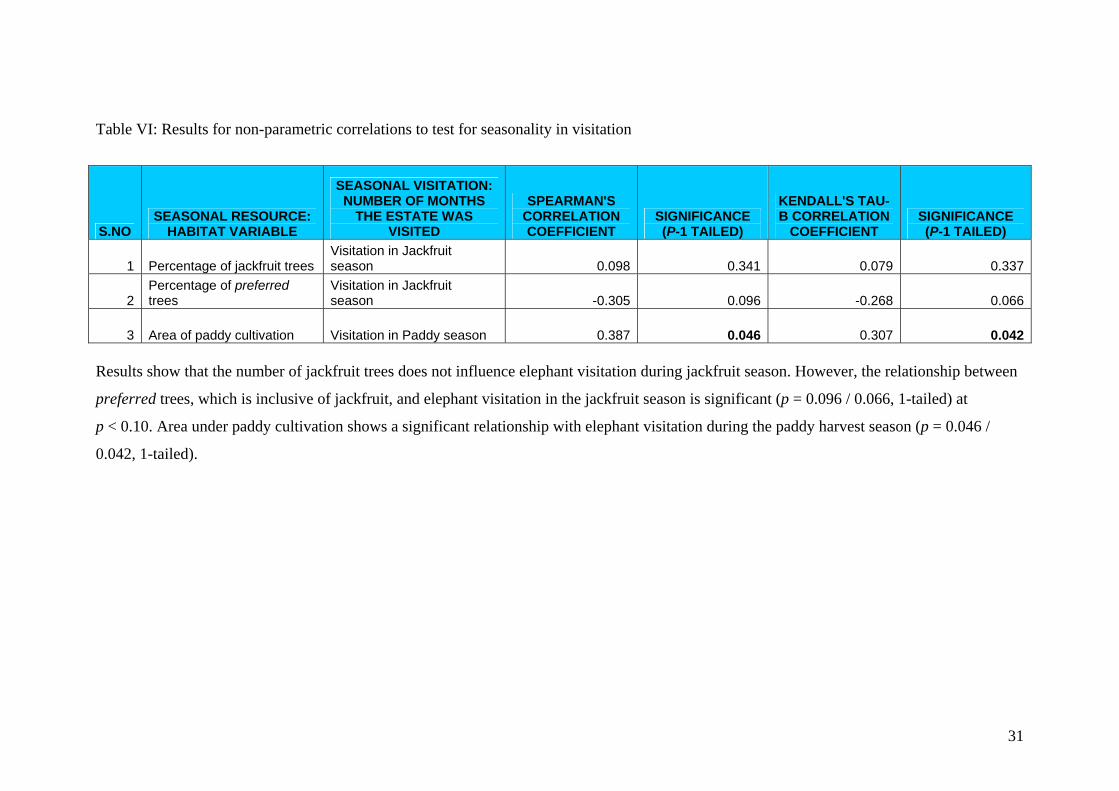
Table VI: Results for non-parametric correlations to test for seasonality in visitation
S.NO SEASONAL RESOURCE:
HABITAT VARIABLE
SEASONAL VISITATION: NUMBER OF MONTHS
THE ESTATE WAS VISITED
SPEARMAN'S CORRELATION COEFFICIENT
SIGNIFICANCE (P-1 TAILED)
KENDALL'S TAU-B CORRELATION
COEFFICIENT SIGNIFICANCE (P-1 TAILED)
1 Percentage of jackfruit trees Visitation in Jackfruit season 0.098 0.341 0.079 0.337
2 Percentage of preferred trees
Visitation in Jackfruit season -0.305 0.096 -0.268 0.066
3 Area of paddy cultivation Visitation in Paddy season 0.387 0.046 0.307 0.042 Results show that the number of jackfruit trees does not influence elephant visitation during jackfruit season. However, the relationship between
preferred trees, which is inclusive of jackfruit, and elephant visitation in the jackfruit season is significant (p = 0.096 / 0.066, 1-tailed) at
p < 0.10. Area under paddy cultivation shows a significant relationship with elephant visitation during the paddy harvest season (p = 0.046 /
0.042, 1-tailed).

STUDIES ON COFFEE CONSUMPTION The figures below represent proportional presence of different quantities of coffee
seeds10 in dung piles from the total sample (Figure 12a) and in the two age categories
of elephants (Figure 12 b and c).
CASE I
52%
12%
36%
>50 seeds1-50 seeds0 seeds
Figure 12a: Proportions of
dung piles with different
amounts of coffee seeds
(>50, 1-50, 0) from total
sample, N = 209
CASE II
49%
13%
38%
>50 seeds1-50 seeds0 seeds
Figure 12b: Proportions of
dung piles with different
amounts of coffee seeds
(>50, 1-50, 0) from sample of
juvenile elephants (bolus
diameter < 10cm), N = 24.
CASE III
47%
11%
42%
>50 seeds1-50 seeds0 seeds
Figure 12c: Proportions of
dung piles with different
amounts of coffee seeds
(>50, 1-50, 0) from sample of
adult elephants (bolus
diameter > 10cm), N = 123.
10 ‘Seed’ represents one of the two cotyledons of the coffee fruit.
32

15 (a) 15 (b)
Figure 13 (a): Elephant dung containing > 50 coffee seeds; (b) Elephant dung with
< 50 coffee seeds; cylindrical boli can be observed in the pictures.
Pie-charts show that in all three cases, close to 50% of dung piles contained more than
50 coffee seeds in them. Chi square tests (Table VII) were used to compare the
presence of coffee seeds in the three categories to determine if:
a) Seeds were eaten by chance (test to see if 5% of the dung piles have more
than one coffee seed) or
b) Seeds were present in the dung because the elephants were showing a strong
preference for inclusion of coffee in their diet (test to see if 50% of the dung
piles have more than one coffee seed).
33

Table VII: Chi-Square Conformity Test for preference for coffee; observed and
expected values are for the number of dung piles with coffee seeds (62 dung piles out of the
total sample of 209 could not me measured for bolus diameter and are therefore excluded
from the sample considered for age categorization).
SAMPLE N
OBSERVED NO. OF DUNG PILES WITH COFFEE SEEDS
OBSERVED %
EXPECTED % χ2 SIGNIFICANCE
(p)
5 1512.81 << 0.001Case I: Total 209 133 63.6450 15.54 < 0.001
5 167.05 << 0.001Case II: Juveniles 24 15 62.50
50 1.50 0.2215 719.81 << 0.001Case III: Adults 123 71 57.72
50 2.93 0.087 The test for 5% is strongly significant in all three cases. The test for 50% is significant
only for the total sample set while for adults it can be considered significant at 0.10
and for juveniles it is not significant.
However the proportion of dung piles with at least one coffee seed is seen to be the
same in juveniles and adults (χ2 = 0.1887, N = 147, df = 1, p = 0.6639) (Figure 14,
Table VIII) and thus we may conclude that adults and juveniles spend similar
amounts of time eating coffee berries.
34

0%
20%
40%
60%
80%
100%
Juveniles (N=24) Adults (N=123)Age catergory
Perc
enta
ge o
f dun
g pi
les
Coffee AbsentCoffee Present
Figure 14: Comparison of time spent on feeding on coffee by juvenile and adult
elephants.
Table VIII: Chi-Square Homogeneity Test results of time spent on feeding on coffee
by juvenile and adult elephants.
Age Category Juveniles Adults Total
Coffee present 15 71 86Presence/Absence of coffee seeds
Coffee absent 9 52 61Total 24 123 147χ2 0.1887 Degrees of freedom 1 p-value 0.6639
35

DISCUSSION
CURRENT STATUS OF HEC IN VIRAJPET HEC level in Virajpet division has increased over the past ten years. This increase is
not linear and there is high inter-annual variability maybe correlated to the local
rainfall patterns but this has yet to be explored. Our study shows a significant increase
in crop damage as time goes by (rs = 0.80606, t = 3.8522, p = 0.0024). This result
sheds new light on previous studies (Kulkarni et al. 2007) that found no significant
increase in the number of cases in the period 1992-2004 and has considerable
implications in terms of management strategies. Additional data following 2006
would show whether or not this trend is established. Monitoring must therefore
continue.
Records for the last year of data collection (2006-07) highlight seasonality in
elephant visitation to the estates. As also reported by earlier studies in Kodagu (Nath
& Sukumar 1998, Kulkarni et al 2007), there are two peaks or ‘seasons’ of high
elephant visitation to coffee estates in the first (June-August) and second monsoon
(November-January). It appears that the peaks correspond to two distinct seasonal
resources fruit tree and paddy (Table IX).
Table IX: Seasonality of some of the crop plants found in coffee estates, arranged in
decreasing order of damage cases per year.
Name of crop Fruiting/Yielding season Coffee (berry) Dec-Feb Paddy Nov-Jan Banana year round Arecanut year round Coconut year round Orange Dec-Jan & July-Sept Jackfruit* May-Sept Mango May-Aug
The first peak shows damage primarily to arecanut, banana, and coconut. However,
these are permanent crops, fruiting throughout the year and hence lead us to believe
that jackfruit (and possibly mango) might be the important seasonal attractant,
although damage to jackfruit trees is generally not reported. Interviews during the
36
initial phase also reported elephant visitation to be more frequent in the jackfruit
season (I.8, I.11, I.12 and I.19). Other crops such as orange, cardamom, ginger and
pepper could be showing a similar pattern owing to incidental damage during these
months. The observed increase in coffee damage during this season may be also
incidental due to the higher elephant intrusion into estates, as coffee does not ripen
during this time and thus is unlikely to be the primary attractant. Alternatively,
increased damage to coffee could also be due to elephants feeding on coffee leaves;
however, this has not been reported or observed till date.
Figure 15 (below) shows that the total number of crop raiding cases from February to
mid-September is primarily due to applications for damage in coffee estates while
from mid-September to January this is due to paddy damage. The second peak
therefore, distinctly corresponds to the paddy ripening and harvest season. There is
less corresponding damage to coffee during this time due to the spatial segregation of
coffee estates and paddy fields.
There is an exclusive peak particularly showing coffee damage in February which
coincides with the coffee ripening season. This indicates that coffee (Coffea robusta)
itself could also be a seasonal attractant11. The analysis of presence of coffee seeds in
the dung (see Figure 13) shows that the elephants in this region are feeding on the
berries. This is a new finding in this region, as previous studies on HEC did not report
elephants feeding on coffee (Nath & Sukumar 1998, Kulkarni et al. 2007). The fact
that coffee may not have been a part of their usual diet may explain partially the
recent increase in HEC. (Elephants’ feeding on to coffee is discussed later).
11 “We can see a lot of elephants during coffee picking season.” (I.19)
37

0
10
20
30
40
50
60
70
80
Jan Feb Mar Apr May Jun Jul Aug Sept Oct Nov Dec
Total no. of applications
Coffee
Paddy
Figure 15: Comparison between total number of applications (in blue) vs. number
of applications for coffee damage (in green) for 2006-07.
Our ability to verify the observed temporal pattern of visitation to estates and the
possible seasonal resources causing this pattern on the basis of FD data is limited.
This is because of the following reasons:
1. Five out of 16 interviewees said that they had discontinued the process of filing for
compensation after an initial incidence of damage because they felt that there was a
lack or delay in follow up action in spite of repeated visits to the FD (I.2, I.8, I.11,
I.12, I.13). This point of view is possibly shared by other estate owners in Virajpet
division such that all crop damage cases are not represented by FD applications. As
a result, we derive an underestimate of crop damage (and consequently visitation)
in the study area from the FD data.
2. Additionally, elephant visits to coffee estates without damage (field notes and
observations) are unrecorded in the FD data. Therefore, all visitations are not
represented by crop damage data, adding an additional bias (underestimation) to
elephant visitation to coffee estates.
3. Coffee is the single most important cash crop in the district. As such, damage to
coffee bushes will be recorded in the FD data much more accurately than damage
to other crops. This creates a source of bias wherein the extent of damage to non-
commercial crops may be underestimated.
38

4. Certain preferred fruit trees such as jackfruit and mango, which may be important
seasonal attractants, are not included in FD data.
5. Coffee bushes and other plants may simply be damaged because they are in their
movement path, not because they are targeted by the elephants. Incidental
damages, make it difficult to clearly establish preferences for the different seasonal
attractants.
CONFLICT MAP Extent of HEC in Virajpet division has been illustrated in the conflict map through a
mosaic of high and low conflict areas. Preliminary results show an absence of crop
damage during the last 10 years for areas in the northern, central and southeastern
parts of the division. Villages on the eastern side, lying close to the Devamachi RF,
experience high conflict levels. We suggest that the bordering deciduous forest (as
opposed to the evergreen forest on the western side) and larger corporate estates on
the eastern side contribute to higher conflict in this area. The band of higher
occurrence of crop raiding cases, if corroborated following the addition of the missing
data, suggests a corridor of elephant movement between the eastern dry deciduous and
western wet evergreen belts of the district and is congruent with previous studies
(Nath and Sukumar 1998).
STAKEHOLDERS’ PERCEPTIONS Our interviews suggest that while visitations have been occurring for a long period of
time, they became problematic 10 years ago. Intensification of HEC could mean an
increase in elephant visitation in some estates or new visitations to previously
unvisited estates, since some estates report the problem to be one or two years old
only for them (E.15, E.18). We list the stakeholders’ perceptions on the causes of this
intensification based on our study and on what is described by Nath & Sukumar
(1998), Kulkarni et al (2007) and Laval (2008),
Causes of HEC Habitat Degradation: Large scale deforestation of prime elephant habitat and
conversion of forest land for economic purposes has been proposed as a major cause
of crop raiding leading to man-animal conflict in the world (Blair et al 1979).
39

Landscape changes in Kodagu can be attributed to human population growth (Figure
16).
0
100000
200000
300000
400000
500000
1901 1911 1921 1931 1941 1951 1961 1971 1981 1991
Figure 16: Population increase in Kodagu district 1901-1991 (Source: Guilmoto 2000)
Guilmoto (2000) suggests that the resulting resource depletion (which could lead to an
increase in HEC) is not solely caused by a burgeoning human population but by
changes in agricultural practices. Laval (2008) reported that according to the people of
the area conversion of private forest ecosystems into coffee estates, felling of selected
tree species, uncontrolled cattle grazing and certain agricultural practices has added to
the degradation of elephant habitat, leading to scarcities in food and water.
40

Figure 17: Location of teak plantations and water bodies in the study villages
In addition, some stakeholders expressed the view that large scale teak plantations in
the RF of Virajpet division 100 years ago (Misra 2003) could have contributed to the
current state of habitat degradation. According to them, this has driven the elephants
into coffee estates in search of food. Misra (2003) shows that out of the total area of
11575.40 ha comprising the three RFs (Dubare, Devamachi and Mavkal RF)
neighbouring the study area, 36.17% is under teak plantations (Figure 17). On the
other hand, an NGO (Ane Mane Foundation) working on elephants in the area claims
that based on their observations, teak plantations do not hinder elephant foraging
behaviour (Gauthier, P. pers. comm.).
Even though teak could have been a cause of habitat degradation up to 1997, there has
only been a 1% increase in teak plantations in the last 30 years (P.S. Ramakrishnan
2000, FIP Survey). Therefore, it seems questionable to label it as the cause for the
conflict that has revealed itself primarily over the last decade.
41

Habitat fragmentation and a loss in tree cover over the past 30 years can primarily be
attributed to expansion of coffee within the district (Elouard, 2000, Moppert, 2000)
(Figure 18) which has been more significant along the western side of the district
(Ramakrishnan 2000, Garcia et al. 2007) as compared to the eastern side.
Figure 18: Landscape dynamics in the past 30 years (Source: French Institute of
Pondicherry)
The eastern side of the district had already been converted into coffee and teak
plantations prior to 1977. Thus, there has been no major change in land use during the
last 30 years on the eastern and south eastern side of the district, which includes our
intensive study area.
Fragmentation and loss of habitat could also be due to construction of large dams
such as Harangi and Chiklihole (Boominathan et al, 2008). FIP surveys show an
increase in area of large water bodies from 1977 to 1997 from 1km2 to 19km2
(Elouard 2000). The dams have created backwaters causing relocation of villages to
corridor areas (Boominathan, pers. com. 2007). As a result, elephant encounters and
damage inside estates may a result of migratory movements through estates as
opposed to purposeful entry for foraging. High incidences of crop raiding by
elephants in Kodagu have been recorded along the likely migration routes between
eastern deciduous and western evergreen forests (Nath and Sukumar 1998: 14) and in
42

the northern part of Kodagu i.e Kushalnagar area (Boominathan, pers. com. 2007)
which now largely consist of agricultural lands with small pockets of forest.
The problem of crop-raiding may be a result of degradation and fragmentation of
elephant habitat over the years, stemming from broader processes of landscape change
(Mahanty 2003). As a result, the phenomenon of fragmentation may not appear to be
prominent at the local scale; also probably why it was considered by only 2 of the
interviewees as a cause for HEC. However it seems significant on larger temporal and
spatial scales wherein expansion of agriculture over the past 100 years has
compressed elephant populations into smaller forest pockets (Ratnam 1984) and
interrupted established elephant movement patterns (Sukumar 1989, Nath and
Sukumar 1998).
Elephant population: According to Kulkarni et al (2007), elephant population in
Kodagu has significantly increased during 2002-2005 probably due to the strict
protection offered to the species. An increase in elephant population in a local area
could also be due to migrations from the neighbouring protected areas (Tchamba
1995).
On the other hand, it is also possible that the reduction of available habitat might have
brought the population closer to the carrying capacity of the ecosystem, forcing the
existing herds to enter estates in search of additional resources. Therefore, the
increase in population may be a perceived rather than the actual cause of increased
intrusion of elephant into estates over the last 10 years.
Elephant behaviour: Frequency and duration of elephant visitations to coffee estates
as well as aggressive behaviour of elephants, all seem to have increased according to
the people. Reports of increased aggressive behaviour have also been made in the
Mudumalai Sanctuary, Tamil Nadu, “Local adivasis have noted that animal behaviour
patterns have changed. The elephants are more angry and aggressive than ever before.
Where adivasis walked confidently through the herds, now they must be careful.”
(Thekaekara, The Hindu, 28July 2008). In addition, interviewees believed that the
elephants had acquired a preference for coffee estates due to the following reasons:
43

• Estates are greener: The coffee plantations on the eastern side (the original
“coffee belt” of the district), where the intensive study area was located, are
derived from originally moist deciduous vegetation (P.S. Ramakrishnan 2000).
It is expected, therefore that the plantations still retain some trees from the
original vegetation. A study by Bhagwat et al (2005) in the south-western part
of the district showed tree species compositions of coffee plantations and the
nearby forest reserve to be 52% similar, while coffee plantations and nearby
sacred groves were 69% similar. Moreover, coffee plantations may also
contain some useful species from the evergreen forest belt such as Artocarpus
hirsutus and A. heterophyllus, which are planted by farmers. In addition, the
use of sprinklers and fertilizers inside coffee plantations may produce better
grass growth during the dry season. By comparison, the RF in the eastern side
of the district, though originally a mixture of moist and dry deciduous forests,
is now primarily dry deciduous since most of the moist deciduous vegetation
was converted to teak and coffee plantations prior to 1977 (Elouard 2000).
• Estates provide better forage: Sukumar (1990) proposed higher palatability
and nutritive value of crops to have caused an increase in HEC in BR Hills,
Southern India. The estates in Kodagu are also abundant in fruit trees
(jackfruit, wild mangoes, banana, coconut, papaya, etc) and other seasonal and
non-seasonal resources such as paddy, arecanut, etc. The fact that coffee
estates offer a bundle of highly palatable, densely packed and easily accessible
food resources makes them more attractive, in accordance with the optimal
foraging strategy theory (Sukumar 1990). As a result, elephants are known to
visit estates throughout the year. However, we need additional data from the
study area for comparative studies looking at available resources in the estates
and the forests to substantiate the claims made by the interviewees.
• Estates have perennial water supply: Satellite imagery (Figure 17) shows that
the RF has very few water bodies compared to nearby plantations, where the
water tanks often retain water throughout the year (field notes & interviews).
Some of these claims have been further investigated in the estate characterisation
study.
44

Elephant visitation was said to have new seasonality patterns by the interviewees.
This could probably due to the cumulative effect of habitat degradation, population
increase and elephant behaviour, although visitation was still more frequent in the
paddy and jackfruit seasons. Other innate reasons for elephant intrusion into the
estates have also been proposed by previous studies such as a ‘high risk-high gain’
strategy for promoting reproductive success in males (Sukumar & Gadgil 1988). On
the other hand, local people believed that crop raids in Kodagu were mainly because
of family groups (Kulkarni et al. 2007).
Mitigation Strategies Out of the known elephant deterrent methods (translocation, culling, chilli smoke,
electric fences, EPTs, lights, loud sounds, etc) only fences and trenches were given
more weight by the interviewees. But these were considered ineffective in preventing
elephant intrusion into coffee estates. However, there are some fences which have
been maintained well and have reduced the instances of elephant intrusion (Laval
2008, Garcia pers. com.). The cooperative fence of the Tibetan settlement in Gurupura
is an example of an actively maintained, effective fence (Nath & Sukumar 1998).
Studies in Africa consider electrified fences around community enclosures to be the
most effective solution(Hoare 1995), if maintained properly, in comparison to
trenches, moats, stone walls, buffer crops, etc. (Nelson et al 2003). Other studies
recorded a 65% decrease in crop raiding incidents in Nyaminyami district, Zimbabwe
following the installation of solar fences (Taylor 1993). On the other hand no fence or
barrier was found to be completely elephant proof from studies in Kenya (Thouless &
Sakwa 1995, Smith & Kasiki 1999).
The performance of solar fences and EPTs therefore seems relative to the site, the
degree of maintenance and the nature of the man-animal conflict of the area.
Role of the Forest Department The management of HEC in Kodagu, though primarily undertaken by the FD, is also
influenced by the presence of local Non-Governmental Organisations (NGO) like the
Coorg Wildlife Society (CWS), various research projects, different land management
45
regimes, presence of a large tribal population and the awareness of the local people
regarding ongoing research. The FD in turn has therefore delegated some of its
responsibilities of prevention of HEC by forming the Eco-Development Committees
(EDC) and Village Forest Committees (VFC) as a part of the Joint Forest
Management scheme (Laval 2008). For example, one of the objectives of the EDC is
to manage HEC by closing the access between RFs and human habitations with solar
fencing set up by the FD (Laval, ibid).
But the discontent among the local people with current elephant deterrent methods
and compensation schemes offered by the FD has translated into a discontent with the
department. Due to the reasons stated for the same, some of the interviewees (I.2,
I.11, I.12, I.13) said that they had stopped approaching the FD to file claims for
compensation. In addition the interviews highlight a lack of communication between
the FD and the farmers. This directly translated into a lack of trust among the
stakeholders which is liable to hinder any strategy that is proposed to resolve the
elephant menace problem.
The local stakeholders do not seem to have yet realised the wicked nature (Conklin
2006) of the problem, thereby putting the blame solely on FD for any setbacks to
mitigation and management of HEC. FD in turn is said to be facing financial and
bureaucratic constraints at various levels of the hierarchal system due to which it is
occasionally criticized (interviews, field notes and observations). It must be noted that
the view point of the FD is missing from this study and thus our representation of the
social aspect of the problem is currently one-sided.
“WHY ARE THE ELEPHANTS COMING INTO COFFEE
ESTATES?” (ESTATE CHARACTERISATION STUDY)
Area of the coffee estate, availability of water and tree density within the estate
emerge as the proximate causes for elephant visitation, from the results of regression
analysis and t-tests. It is unexpected that our data did not show any significant
relationship between frequency of visitation and percentage of canopy cover, unlike
46
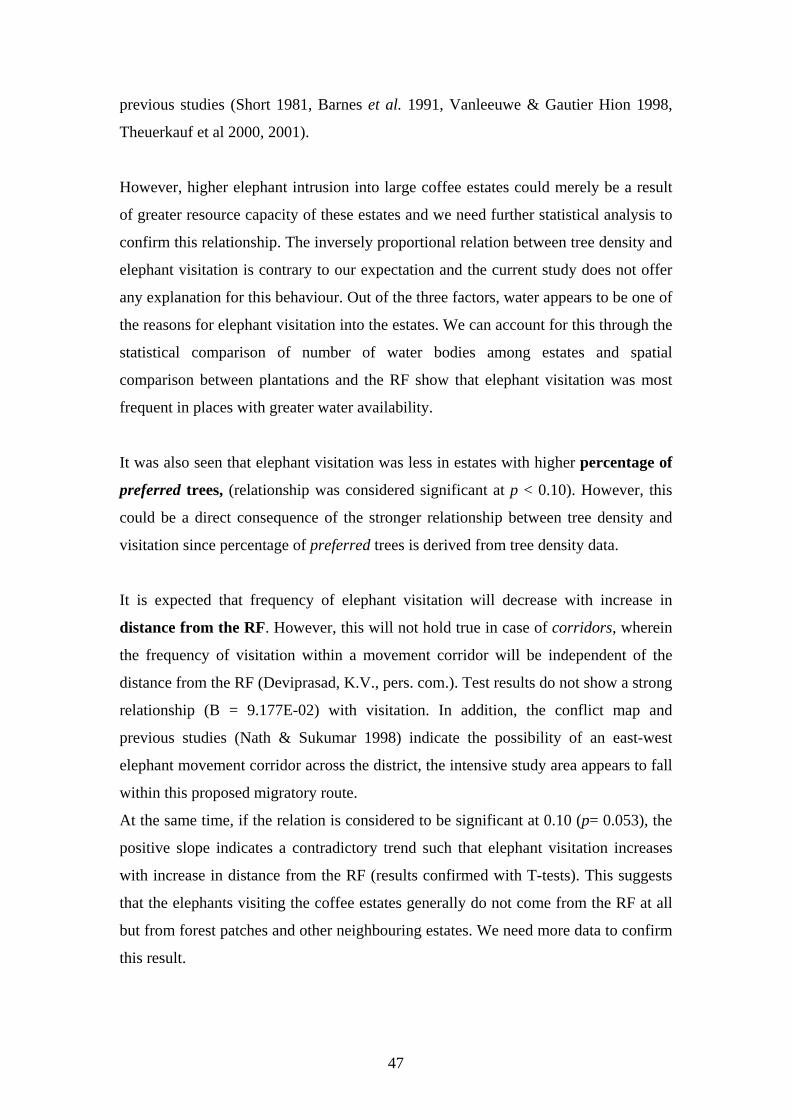
previous studies (Short 1981, Barnes et al. 1991, Vanleeuwe & Gautier Hion 1998,
Theuerkauf et al 2000, 2001).
However, higher elephant intrusion into large coffee estates could merely be a result
of greater resource capacity of these estates and we need further statistical analysis to
confirm this relationship. The inversely proportional relation between tree density and
elephant visitation is contrary to our expectation and the current study does not offer
any explanation for this behaviour. Out of the three factors, water appears to be one of
the reasons for elephant visitation into the estates. We can account for this through the
statistical comparison of number of water bodies among estates and spatial
comparison between plantations and the RF show that elephant visitation was most
frequent in places with greater water availability.
It was also seen that elephant visitation was less in estates with higher percentage of
preferred trees, (relationship was considered significant at p < 0.10). However, this
could be a direct consequence of the stronger relationship between tree density and
visitation since percentage of preferred trees is derived from tree density data.
It is expected that frequency of elephant visitation will decrease with increase in
distance from the RF. However, this will not hold true in case of corridors, wherein
the frequency of visitation within a movement corridor will be independent of the
distance from the RF (Deviprasad, K.V., pers. com.). Test results do not show a strong
relationship (B = 9.177E-02) with visitation. In addition, the conflict map and
previous studies (Nath & Sukumar 1998) indicate the possibility of an east-west
elephant movement corridor across the district, the intensive study area appears to fall
within this proposed migratory route.
At the same time, if the relation is considered to be significant at 0.10 (p= 0.053), the
positive slope indicates a contradictory trend such that elephant visitation increases
with increase in distance from the RF (results confirmed with T-tests). This suggests
that the elephants visiting the coffee estates generally do not come from the RF at all
but from forest patches and other neighbouring estates. We need more data to confirm
this result.
47

By means of the estate characterisation study we could also identify the seasonal
resources responsible for the two seasonal peaks in visitation as indicated by the FD
data. Arecanut, banana, coconut, erythrina along with jackfruit (and not jackfruit
alone) seem to act as seasonal attractants during May-Sept, which is inclusive of the
first raiding peak (June-August). Other fruit trees such as orange and mango were not
considered since damage to these is relatively less compared to other fruit crops.
Paddy was found to be the seasonal attractant for the second peak (Nov-Jan).
Therefore, the interview and estate characterisation data help in validating FD results
at a smaller scale.
The following considerations can be made to further improve the estate
characterisation study:
1. The data has a lot of variability. Some factors can be considered individually
in isolation of other factors such as estate size as it is possible that the other
variables are a function of the estate area. A residual analysis to remove area
effect could be done to improve our understanding of the estate characteristics
that attract elephants into CAFs.
2. It is also possible that none of these variables work in isolation. Instead, there
may be multiple factors that influence elephant visitation at any given time of
the year. We therefore need to look at multi-factor analysis for the data.
3. An important factor not considered in the current analysis is that all study
estates were located in high conflict region of the division. We need to expand
our study through comparative sampling in low or no conflict areas.
4. The sample size is low. Expanding the data could give more confidence to the
analysis.
“ARE THE ELEPHANTS EATING COFFEE?” (STUDIES ON
COFFEE CONSUMPTION) The results showed that coffee is present in considerable amounts (> 50 seeds) in
approximately 50% of the samples. This suggests that elephants are choosing to eat
coffee in the study area. Moreover, juvenile and adult elephants appear to feed on
coffee during at least half of their total feeding time within the estates.
48
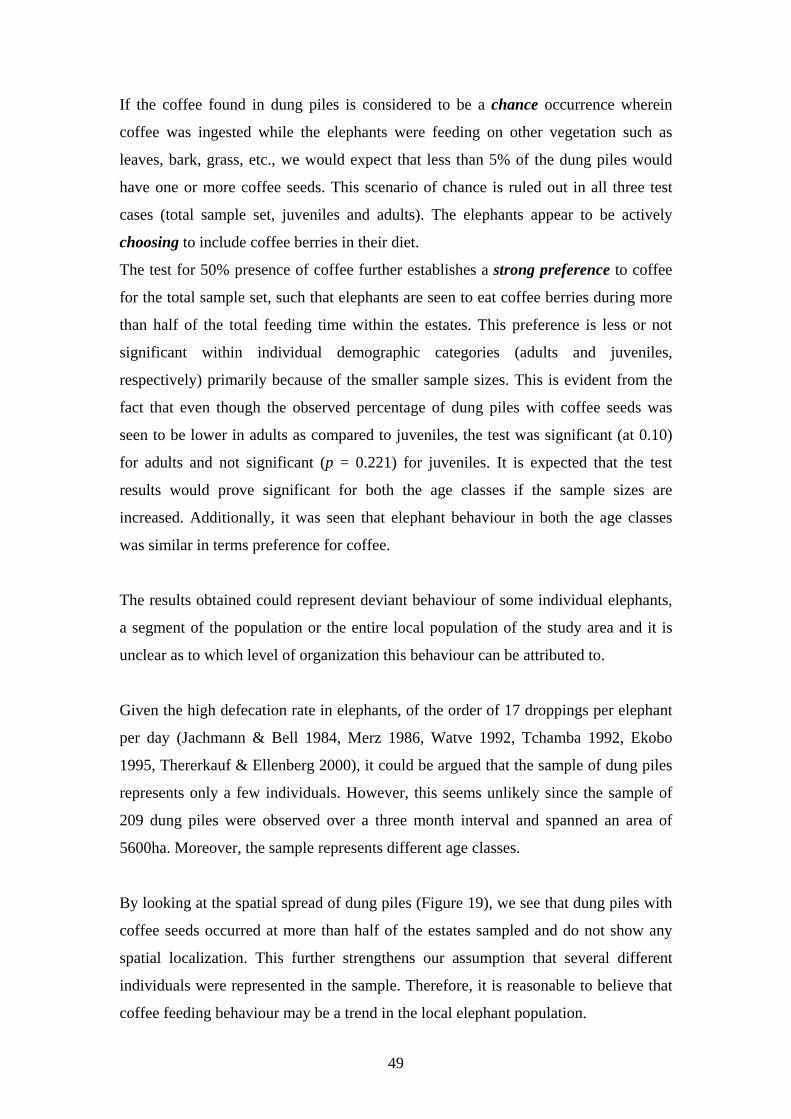
If the coffee found in dung piles is considered to be a chance occurrence wherein
coffee was ingested while the elephants were feeding on other vegetation such as
leaves, bark, grass, etc., we would expect that less than 5% of the dung piles would
have one or more coffee seeds. This scenario of chance is ruled out in all three test
cases (total sample set, juveniles and adults). The elephants appear to be actively
choosing to include coffee berries in their diet.
The test for 50% presence of coffee further establishes a strong preference to coffee
for the total sample set, such that elephants are seen to eat coffee berries during more
than half of the total feeding time within the estates. This preference is less or not
significant within individual demographic categories (adults and juveniles,
respectively) primarily because of the smaller sample sizes. This is evident from the
fact that even though the observed percentage of dung piles with coffee seeds was
seen to be lower in adults as compared to juveniles, the test was significant (at 0.10)
for adults and not significant (p = 0.221) for juveniles. It is expected that the test
results would prove significant for both the age classes if the sample sizes are
increased. Additionally, it was seen that elephant behaviour in both the age classes
was similar in terms preference for coffee.
The results obtained could represent deviant behaviour of some individual elephants,
a segment of the population or the entire local population of the study area and it is
unclear as to which level of organization this behaviour can be attributed to.
Given the high defecation rate in elephants, of the order of 17 droppings per elephant
per day (Jachmann & Bell 1984, Merz 1986, Watve 1992, Tchamba 1992, Ekobo
1995, Thererkauf & Ellenberg 2000), it could be argued that the sample of dung piles
represents only a few individuals. However, this seems unlikely since the sample of
209 dung piles were observed over a three month interval and spanned an area of
5600ha. Moreover, the sample represents different age classes.
By looking at the spatial spread of dung piles (Figure 19), we see that dung piles with
coffee seeds occurred at more than half of the estates sampled and do not show any
spatial localization. This further strengthens our assumption that several different
individuals were represented in the sample. Therefore, it is reasonable to believe that
coffee feeding behaviour may be a trend in the local elephant population.
49

Figure 19: Location of dung piles with varying amounts of coffee seeds across
the study area
It is equally likely that this behaviour can be attributed to a segment of rather than
the entire population since it has been proposed that problem elephant activity may be
caused by a proportion of individuals within the population (Hoare, 1999c; Hoare,
2000, Nelson et al 2003). We propose DNA analysis to further this study by finding
out if dung piles with coffee seeds within the study area belong to a specific set of
elephants. Hence, we will be able to establish whether only some elephants develop a
preference to coffee or it is widespread trait among the local elephant population of
the area. Even if currently confined to a few individuals, this novel behaviour could
rapidly spread through the local population via cultural transmission and learning,
which have been documented foe other behaviours by elephants (Thouless & Sakwa
1995).
50

CONCLUSION
HEC in Kodagu may be a result of localized spatial and temporal changes over the
years that have now started to become evident at the landscape level. However
besides landscape dynamics, the conflict in the district is also influenced by
environmental factors, social factors and species ecology.
The development of cultivation area over the past 40 years in the district and the
movement of elephants along migratory corridors or between forest patches and
cultivated areas have led to the present day conflict situation in the study area. In
addition established dietary preference for resources available inside coffee estates,
including ripe coffee berries, is resulting in new patterns of seasonality in crop
raiding. Limits of the existing mitigation strategies and the lack of coordinated action
between local stakeholders also seem to have led to less than optimal management of
the problem.
The multi-dimensional nature of the problem at hand makes it clear that there is no
single ‘end-all’ solution; thereby making HEC, as is termed in management sciences,
a wicked problem. Such a nature can primarily be attributed to the involvement of
multiple stakeholders, each with a different view of the problem and its possible
solution.
Thus, conflict resolution in Kodagu requires a combination of deterrent, compensating
and tolerance raising strategies and the acknowledgement by stakeholders of the true
nature of the problem at hand. We must first accept the fact that HEC is likely to be an
eternal problem, as a never-ending arms race develops between combinations of
methods and elephants’ abilities to learn and habituate (Nelson et al. 2003).
Applying this concept could further help local stakeholders to devise alternative
management strategies besides better maintenance of solar fences and trenches around
large estates or community enclosures. This study, therefore, puts forth some
suggestions in addition to those proposed by previous studies on HEC in Kodagu
(Nath & Sukumar 1998, Kulkarni et al. 2007, Bhoominathan et al. 2008);
51

• Additional research: Though the distribution and frequency of problem
elephant activity can be easily recorded, we need more precise quantitative
assessment of intensity of elephant damage (Msiska & Deodatus 1991; Lahm
1996; Wunder 1997). Therefore, we suggest the use of radio collaring of
elephants to track their movement and accurately record location and time of
damage instances. We would also like to continue the study on elephant dung
with DNA analysis studies to understand the new behavioural pattern of
elephants’ preference to coffee. In addition, to understand spatial and temporal
trends in HEC we plan to continue to update our database for the entire
district.
• Communication: Any activity that would focus on improving the
communication between the civil society and the policy makers and enforcers
is likely to help in resolving the issue since it is clear that there are problems
on either side that need to be addressed jointly. We understand that it is not a
lack in action that has led to the current status of man-animal conflict in
Kodagu but rather the wickedness (Conklin 2006) of the problem that has
made it impossible for the FD to achieve all the objectives set by them in the
past.
• Coffee label: Applying the concept of wicked problems (Conklin 2006), this
study looks at devising alternative strategies to cope with the HEC in Kodagu.
One such strategy is the development of insurance schemes or an elephant
friendly coffee label that could raise public tolerance towards elephants. We
have proposed such a label, Ane Kaapi, to the local stakeholders keeping in
mind the conservation importance and the charismatic nature of the elephant
and hence it’s marketing potential. If supported by the consumer, the label
could help compensate the planter who suffers a higher cost of production due
to damage by elephants. This can especially go a long way in helping farmers
who cannot otherwise afford to implement expensive mitigation solutions. The
label could also contribute towards organising stakeholders to look at the
management possibilities for the region such as buying land to establish new
corridors in targeted, specific areas or to jointly maintain solar fences and
EPTs, among other solutions.
52
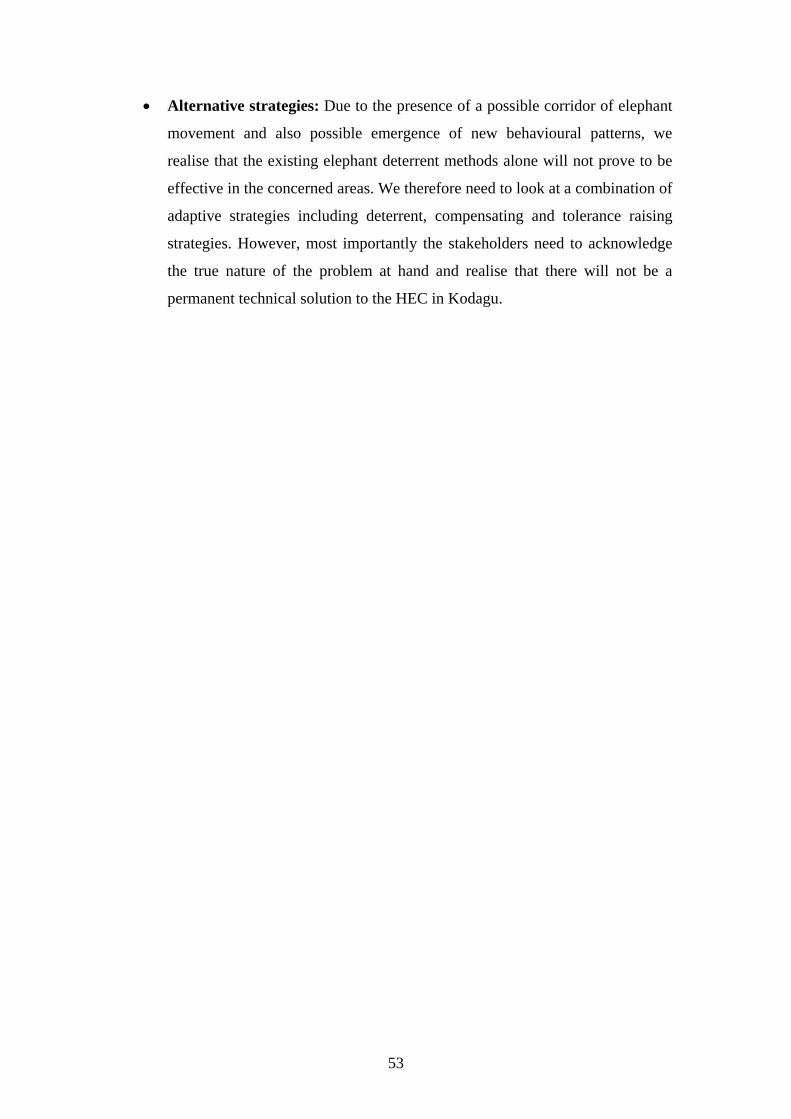
• Alternative strategies: Due to the presence of a possible corridor of elephant
movement and also possible emergence of new behavioural patterns, we
realise that the existing elephant deterrent methods alone will not prove to be
effective in the concerned areas. We therefore need to look at a combination of
adaptive strategies including deterrent, compensating and tolerance raising
strategies. However, most importantly the stakeholders need to acknowledge
the true nature of the problem at hand and realise that there will not be a
permanent technical solution to the HEC in Kodagu.
53

REFERENCES
1. Adams, W.M. & Hulme, D. 2001. If community conservation is the answer in
Africa, what is the question? Oryx, 35: 193-200.
2. Alan Cann. (2007, April 2007). Microbiology Bytes Site. Retrieved December
09, 2008, from http://www.microbiologybytes.com/maths/spss3.htm
3. Barnes, R.F.W. 1996. The conflict between humans and elephants in the
central African forests. Mammal Review, 26: 67-80.
4. Bhagwat, S., Kushalappa, C., Williams, P., Brown, N. 2005. The role of
informal protected areas in maintaining biodiversity in the Western Ghats of
India. Ecology and Society 10(1): 8. [online] URL:
http://www.ecologyandsociety.org/vol10/iss1/art8/
5. Bhoominathan, D.; Mohanraj, N.; Aziz, T.; Desai, A. 2008. Human-Elephant
conflict in Somwarpet Subdivision (Madikeri Forest Division): Final Report.
WWF-India.
6. Conklin, J. 2006. Chapter 1 of Dialogue Mapping: Building Shared
Understanding of Wicked Problems, cognexus.org
7. Dawson, S. 1995. Vietnam’s Vanishing Elephants: A Species Survival
Strategy. WWF-Indochina Programme, Hanoi, Vietnam.
8. De Boer, W.F. & Ntumi, C.P. 2001. Elephant crop damage and electric fence
construction in the Maputo Elephant Reserve, Mozambique. Pachyderm, 30:
57-64.
9. Decroix, M. & Chretien F. Caractérisation des systèmes agroforestiers à base de
café:Etude à l'échelle du bassin versant du Cauvery, district du Kodagu, Karnataka,
Inde du sud. 2007.
10. Dobias, R. 1987. Elephants in Thailand: An overview of their status and
conservation. Tigerpaper 14:19–24.
11. Douglas-Hamilton, I. 1987. Elephant population trends and their causes. Oryx,
21: 11-24.
12. Douglas-Hamilton, I., Michelmore, F. & Inamdar, A. 1992. African elephant
database. UNEP, New York.
13. FAO. 2005. Global Forest Resources Assessment Update 2005: Terms and
Definitions. FRA Working paper 83/E. Rome
54

14. Fischer, J. & Lindenmayer, D.B. 2000. An assessment of the published results
of animal relocations. Biological Conservation, 96: 1-11.
15. Garcia, C. & Pascal, J.P. Sacred forests of Kodagu. Ecological Nationalisms.
16. Garcia, C., Bhagwat, S., Kushalappa, C.G. & Nanaya, K.M. Draft. Closing the
Loop: Biodiversity and its impact on local people’s livelihoods. Examples
from South Asia.
17. Garcia, C., Marie-Vivien, D., Kushalappa, C.G., Chengappa, P.G. & Nanaya,
K.M. 2007. Geographical Indications and Biodiversity in Western Ghats,
India: Can labelling benefit producers and the environment in a mountain agro
forestry landscape? Mountain Research and Development, Vol. 27, No. 3: 206-
210
18. Graham, A.D. 1973. The gardeners of Eden. London: Allen & Unwin.
19. Hill, C.M. 2000. Conflict of interest between people and baboons: Crop
raiding in Uganda. International Journal of Primatology, 21: 299-315.
20. Hoare, R.E. 1999. Determinants of human-elephant conflict in a land-use
mosaic. Journal of Applied Ecology, 36: 689-700
21. Hoare, R.E. 1999c. Determinants of humanelephant conflict in a land-use
mosaic. Journal of Applied Ecology, 36: 689-700.
22. IUCN. 1997. Community wildlife management in southern Africa: A regional
review. Pages 38. Southern Africa: IUCN - Southern Africa Sustainable Use
Specialist Group.
23. Johnsingh, A J T and Williams, C. 1999. Elephant corridors in India: Lessons
for other elephant range countries. Oryx 33 (3). Cambridge, UK.
24. KFD Government Order: GO No. FEE 52 FWL 96 Bangalore dated: 12-2-
2002
25. Kulkarni, J., Mehta P., D. Bhoominathan and Chaudhuri S. 2007. A study of
man-elephant conflict Nagarhole National Park and surrounding areas of
Kodagu district in Karnataka, India: Final Report. Envirosearch, Pune.
26. Kushalappa, C.G, Raghuramulu, Y., Garcia, C. & Nanaya, K.M. 2007.
Elephants also like coffee: Coffee and Environmental services in the Western
Ghats of India.
27. Laval, M. 2007. People, Elephants and Forests
55
28. Merz, G. (1986) Counting elephants (Loxodonta African cyclotis) in tropical
rain forests with particular reference to the Tai national Park, Ivory Coast. Afr.
J. Ecol. 24, 61-68.
29. Millennium Ecosystem Assessment, 2005. Ecosystems and Human Well-
being: Synthesis. Island Press, Washington, DC.
30. Misra, A. 2003. Working plan of Madikeri Forest Division (Plan period: 2002-
2003 to 2011-2012)
31. Misra, A. 2003. Working plan of Virajpet Forest Division (Plan period: 2001-
2002 to 2010-2011)
32. Msiska & Deodatus 1991; Lahm 1996; Wunder 1997 Nihara R.
Gunawardene1, A. E. Dulip Daniels, I. A. U. N. Gunatilleke, C. V. S.
Gunatilleke, P. V. Karunakaran4, K. Geetha Nayak, S. Prasad, P. Puyravaud6,
B. R. Ramesh4, K. A. Subramanian7 and G. Vasanthy4 A brief overview of
the Western Ghats – Sri Lanka biodiversity hotspot Current Science, Vol. 93,
No. 11, 10 December 2007.
33. Nath, C. & Sukumar, R. 1998. Elephant-human conflict in Kodagu, Southern
India: distribution patterns, people’s perceptions and mitigation methods.
Asian Elephant Conservation Centre, Bangalore.
34. Naughton, L., Rose, R. & Treves, A. 1999. The social dimensions of human-
elephant conflict in Africa: A literature review and case studies from Uganda
and Cameroon. University of Wisconsin, Madison.
35. Nelson, A., Bidwell, P. & Sillero-Zubiri, C. 2003. A review of human elephant
conflict management strategies. People and Wildlife Initiative. Wildlife
Conservation Research Unit, Oxford University.
36. Nihara R. Gunawardene, N.R., Dulip Daniels A. E., Gunatilleke I. A. U. N.,
Gunatilleke3 C. V. S., Karunakaran P. V., Nayak K.G., Prasad S., Puyravaud
P., Ramesh B. R., Subramanian K. A. & Vasanthy G. 2007. A brief overview
of the Western Ghats – Sri Lanka biodiversity hotspot. Current Science, Vol.
93, No. 11
37. Norman Myers, Russell A. Mittermeier, Cristina G. Mittermeier, Gustavo A.
B. da Fonseca & Jennifer Kent Biodiversity hotspots for conservation
priorities Nature, Vol 403, 24 February 2000. www.nature.com
38. P.S. Ramakrishnan, U. M. C., C. Elouard, C.Z. Guilmoto, R.K. Maikhuri, K.S.
Rao, S. Sankar, K.G. Saxena (Eds.) (2000). Mountain Biodiversity, Land Use
56

Dynamics, and Traditional Ecological Knowledge. New Delhi, India,
UNESCO, Oxford and IBH Publishing Co. Pty. Ltd.
39. Parker, I.S.C. & Graham, A.D. 1989. Elephant decline: Downward trends in
African elephant distribution and numbers. Parts I & II. International Journal
of Environmental Studies, 34: 13-26 & 287-305.
40. Sanghamitra Mahanty, Insights from a Cultural Landscape: Lessons from
Landscape History for the Management of Rajiv Gandhi (Nagarahole)
National Park. Conservation and Society, 1, 1 (2003). SAGE Publications New
Delhi/Thousand Oaks/London
41. Santiapillai, C and Jackson, P. 1990. The Asian Elephant: An Action Plan for
its Conservation. IUCN, Gland, Switzerland.
42. Sukumar, R. 1990. Ecology of the Asian elephant in Southern India. II.
Feeding habits and crop raiding patterns. Journal of Tropical Ecology, Vol.6,
No. 1:33-53
43. Sukumar, R. 1991. The management of large mammals in relation to male
strategies and conflict with people. Biological Conservation 55: 93-102.
44. Thekaekara, M.M. Tiger or Science? The Hindu [natl ed] 2008 July 29; Sect
Magazine, 8
45. Thomas A. Morrison, Patrick I. Chiyo, Cynthia J. Moss and Susan C. Alberts
(2005). Measures of dung bolus size for known-age African elephants
(Loxodonta africana): implications for age estimation. Journal of Zoology, 266
, pp 89-94
46. Vidya, T. N. C., A study on the intestinal parasite loads of the Asian elephant
(Elephas maximus) in southern India. M.S. thesis submitted to the Centre for
Ecological Sciences, Indian Institute of Science, Bangalore, 2000, pp. 36–37.
47. wealth of India
48. WWF. 2000. Asian Elephants in the Wild: A WWF species Status Report.
Elizabeth Kemf and Charles Santiapillai . WWF-World Wide Fund for Nature,
Gland, Switzerland.
49. Zar, J.H. 1996. Biostatistical Analysis, 3rd ed. Prentice Hall International,
London.
57

APPENDICES
APPENDIX 1: DETAILS OF INTERVIEWEES
CODE INTERVIEWEE VILLAGE
AREA OF LAND HOLDING (approx.)
SEVERITY OF CONFLICT12
I.1 Wildlife Researcher _ _ _ I.2 Planter Badaga Banangala 18.72+ very severe I.3* Planter Badaga Banangala & Mekur Hosakeri 18+ very severe I.4* Estate worker Basavanahalli, Chennayanakote _ very severe I.5* Planter Basavanahalli, Chennayanakote 3approx. very severe I.6* Planter Basavanahalli, Chennayanakote 8 very severe I.7 Planter Basavanahalli, Chennayanakote 11 very severe I.8 Planter Basavanahalli, Chennayanakote 5+ very severe I.9 Planter Chennangi 12 severe
I.10 Planter Chennangi & Basavanahalli, Chennayanakote 14 very severe
I.11 Planter Chennangi 22 not severe I.12 Planter Chennangi 25 severe I.13 Planter Chennangi 27 severe I.14 Planter Chennangi 130 very severe I.15 Planter Chennayanakote & Abur 6 very severe I.16 Estate manager Corporate Estate 860 not severe I.17 Estate manager Corporate Estate 950 very severe I.18 Estate Workers Corporate Estate _ _ I.19 Estate manager Corporate Estate 648 _ I.20 Estate Workers Corporate Estate _ _ *Interviews not considered for analysis due to lack of proper documentation
12 Evaluation of severity was based on data obtained from the interviews and field notes of elephant damage within the estate. It is subjective estimation and is not based on cut-offs or standards.
58

APPENDIX 2: DETAILS OF STUDY ESTATES
ESTATE CODE VILLAGE
ESTATE AREA (ha)
ELEPHANT VISITATION (no. of months/year)
E.1 Badaga Banangala 20.53 12E.2 Chennangi 8.27 1E.3 Chennangi 25.10 2E.4 Mekur Hosakeri 38.49 8E.5 Badaga Banangala, Mekur Hosakeri, Chennayanakote 37.56 6E.6 Mekur Hosakeri, Chennayanakote, Chennangi 44.03 12E.7 Mekur Hosakeri 4.72 2E.8 Mekur Hosakeri 446.96 12E.9 Badaga Banangala 367.92 12E.10 Hosur 382.99 12E.11 Mekur Hosakeri, Chennayanakote 20.15 2E.12 Chennangi 7.57 2E.13 Chennangi 15.32 2E.14 Chennayanakote 9.71 4E.15 Chennayanakote 17.44 1E.16 Chennangi 3.36 1E.17 Badaga Banangala 10.06 12E.18 Badaga Banangala 1.74 1E.19 Hosur 23.43 10E.20 Bettageri 14.87 12
59

60
APPENDIX 3: CHI-SQUARE TEST FOR COMPARING STUDY
SAMPLE TO ELEPHANT CENSUS ESTIMATES.
Comparison of ratio of juvenile to adult elephants in the sample to the estimated ratio
(according to the 2005 KFD elephant census) for the population:
Age Category Juveniles Adults Total
Observed frequency 24 123 147Number of dung piles
Expected frequency (acc. To KFD census, 2005) 28.44 118.54 146.98
χ2 0.8622 Degrees of freedom 1 p-value 0.3531
The proportion of juvenile to adults in the population corresponds to that considered
in the sample.

APPENDIX 4: QUESTIONNAIRE
Date:
QUESTIONNAIRE FOR STUDY ON ELEPHANT VISITATION* TO COFFEE ESTATES
*For this particular study, visitation implies elephant entry into the estates with or without damage being caused Name: Village:
I. Details of elephant visits: 1 Are the elephants visiting your estate? Yes No 2 When was the last (most recent) visit? This week Past week Last month (Jan 2008) Last year (Jan2007-
Dec2007) 3 Details about the last visit: a Was it a direct sighting or a report? Direct sighting Reported
b How many elephants were there? Single Less than 3 More than 3
With calves Tusker Other
c What time of the day did they visit your estate? Morning Afternoon Evening Night
d How long did they stay inside your estate? Less than 2 hrs
More than 2 hrs
Overnight
Don't know
e Was this last visit different from what you've previously experienced in any way?
f Was there any damage caused? Yes No g If yes, what kind of damage was caused? Coffee Equipment Food plants of the
elephant Non-food plants of the elephant
4 Apart from the above, any visits over the last month? Yes No
61

5 Any visits over the last year (i.e. from January 2007-December 2007)? Yes No
Jan Feb Mar Apr May June 6 Please tick the months in which elephants have visited your estate?
July Aug Sept Oct Nov Dec 7 How frequent were the visits last year? More than 4/month Less than 4/month 8 Since when did the elephants start coming into your estate more
frequently? Past 1 year Past 5 years Past 10
years Past 20 years
They were always coming
9 Did the elephants eat any part of the coffee plant in your estate? Yes No Don't know 10 Have you seen calves inside your estate? Yes No 11 Were there any calves born in your estate last year? Yes No
II. Details of the estate: 1 Survey number/numbers included in the estate area
2 Size of the estate Less than 4 hectares (or 10 acres)
4-10 hectares (or 10-25 acres)
More than 10 hectares (or 25 acres)
3 Number of people working in the estate during each quarter last year
Jan-March Apr-June July-Sept Oct-Dec
Robusta Coffee Arabica Coffee Paddy
4 How many acres of each do you grow?
Cardamom
5 How many trees do you have of the following (tick the appropriate coloumn): None Less than 5 5 to 10
more than 10
a Jackfruit b Coconut c Banana
62

d Papaya e Arecanut f Orange g Guavas h Dadup (Murukke) i Teak j Balanji k Tadchil l Atti
m Pine (Pattè) Do any of your immediate neighbours have paddy fields adjoining your estate? Yes No
6
If yes, how many acres of adjoining paddy field? How many water tanks do you have inside your estate?
Size of water tank Age of water tank (years) 1) 2) 3) 4)
7 Please specify approximate size (area) and how old these water tanks are:
5) 8 Do any of these tanks have water during the dry season? Yes No 9 Do you irrigate your plantation? Yes No 10 How many times was weeding done last year in your estate? 11 What month was the last weeding done? 1 Have you used chemical weedicides? (specify month/months) This year Last year Not used
63

2 13 How many times was fertilizer application done last year? 14 What kind of fence do you have around your estate? Live plants Wire Electric/Solar I don't have any fence 15 Does the fence help reduce elephant visits? Yes No 16 Are there electric fences maintained by your immediate neighbour? Yes No
Is there a kaadu next your estate? Yes No
What type of kaadu is it? Devara-kadu Baane Urudve
Reserve Forest
Wildlife Sanctuary
National Park
17
How far is the kaadu from your estate? 18 Was there a forest fire in the nearby kadu last year? Yes No
Is there a kaadu within your estate? Yes No
What type of kaadu is it? Devara- kadu Baane Urudve
Reserve Forest
Wildlife Sanctuary
National Park
19
How big is this kadu? Is there a fence along the edge of the nearest kadu? Yes No If yes, what kind of fence is it? Live plants Wire Electric/Solar
20
Is it in working condition? Yes No 21 Is there an EPT along the boundary of the kadu? Yes No 22
What measures do you adopt/ have you adopted in the past to prevent elephant damage?
23
What measures would you like to try (if any) to prevent elephant damage?
24
Any additional details you would like to give regarding the topic
64

LIST OF FIGURES
1. Former and Present Distribution of the Asian Elephant (Elephas maximus)
2. Location of study area and the surrounding reserve forests in Kodagu
3. Location of data collection points (PQCs) in study villages
4. Sampling protocol for measurement of some of the habitat variables and a
generalised depiction of layout of PQCs across study estates
5. Tree density measurement within the coffee estate
6. Convex spherical densitometer
7. Year-wise trend in crop raiding for Virajpet division during 1997-2007
8. Number of human death and injury cases in Virajpet division
9. Incidence of damage for each crop in Virajpet Division during 2006-07 (Other
crops include orange, cardamom, ginger and pepper)
10. HEC map highlighting extent of human-elephant conflict for Virajpet division
based on forest department records (1997-2007)
11. Conflict levels for study villages for 2006-2007 (CK: Chennayanakote, CG:
Chennangi, MK: Mekur Hosakeri, BB: Badaga Banangala, HO: Hosur, BT:
Bettageri); villages are arranged in increasing distance from the RF.
12. Proportions of dung piles with different amounts of coffee seeds (>50,
1-50, 0)
a. from total sample, N = 209
b. from sample of juvenile elephants (bolus diameter < 10cm),
N = 24.
c. from sample of adult elephants (bolus diameter > 10cm), N
= 123.
13. Pictures of elephant dung containing coffee seeds; cylindrical boli can
be observed in the pictures.
14. Comparison of time spent on feeding on coffee in juvenile and adult elephants.
15. Comparison between total number of applications (in blue) vs. number of
applications for coffee damage (in green) for 2006-07.
16. Population increase in Kodagu district 1901-1991 (Source: Guilmoto 2000)
17. Location of teak plantations and water bodies in the study villages
65
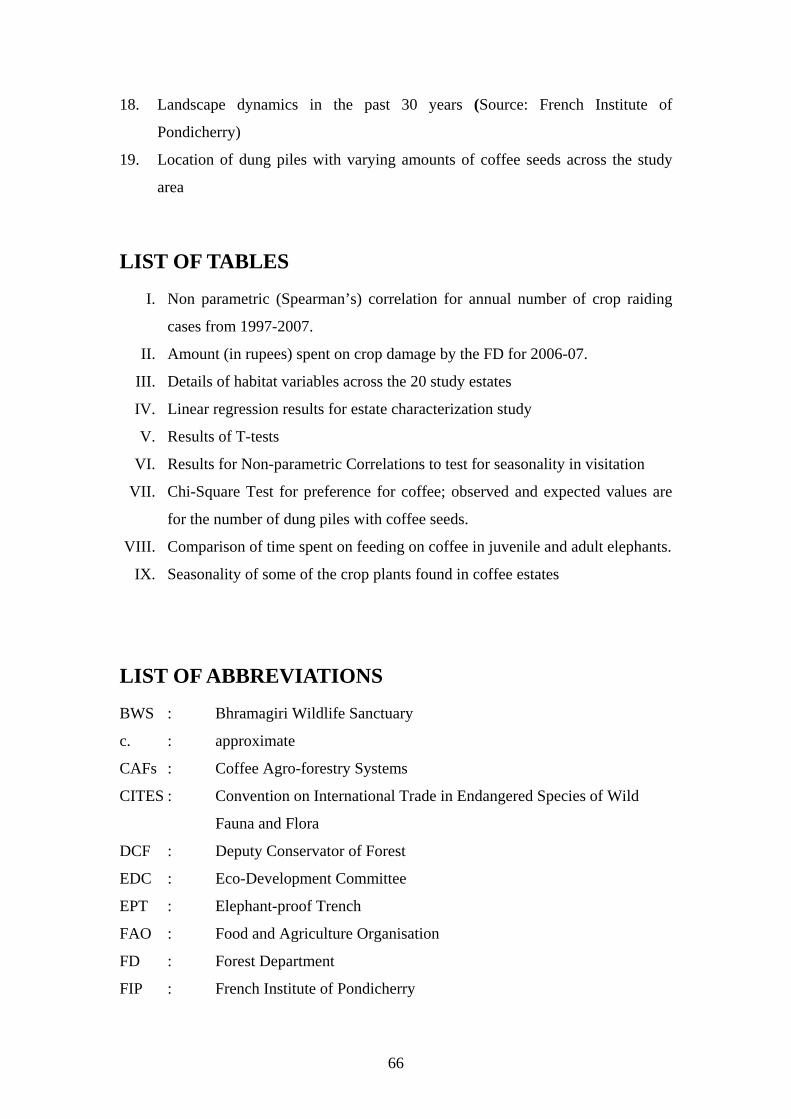
18. Landscape dynamics in the past 30 years (Source: French Institute of
Pondicherry)
19. Location of dung piles with varying amounts of coffee seeds across the study
area
LIST OF TABLES
I. Non parametric (Spearman’s) correlation for annual number of crop raiding
cases from 1997-2007.
II. Amount (in rupees) spent on crop damage by the FD for 2006-07.
III. Details of habitat variables across the 20 study estates
IV. Linear regression results for estate characterization study
V. Results of T-tests
VI. Results for Non-parametric Correlations to test for seasonality in visitation
VII. Chi-Square Test for preference for coffee; observed and expected values are
for the number of dung piles with coffee seeds.
VIII. Comparison of time spent on feeding on coffee in juvenile and adult elephants.
IX. Seasonality of some of the crop plants found in coffee estates
LIST OF ABBREVIATIONS
BWS : Bhramagiri Wildlife Sanctuary
c. : approximate
CAFs : Coffee Agro-forestry Systems
CITES : Convention on International Trade in Endangered Species of Wild
Fauna and Flora
DCF : Deputy Conservator of Forest
EDC : Eco-Development Committee
EPT : Elephant-proof Trench
FAO : Food and Agriculture Organisation
FD : Forest Department
FIP : French Institute of Pondicherry
66

gbh : girth at breast height
GIS : Global Information System
GPS : Global Positioning System
HEC : Human-elephant conflict
IUCN : International Union for Conservation of Nature
KFD : Karnataka Forest Department
NNP : Nagarhole National Park
PQC : Point Quadrat Centre (data collection point)
RS : Remote Sensing
Sp. : species
VFC : Village Forest Committee
67