dsd-int 2015 - the future of computer modeling of coastal wetland - maselhe
TRANSCRIPT
THE FUTURE OF COMPUTER
MODELING OF COASTAL WETLAND,
ESTUARINE, AND RIVERINE SYSTEMS
Ehab Meselhe November 2015

TEAM EFFORT
• The Water Institute of the Gulf – Natural Systems Modeling and Monitoring
• Ehab Meselhe
• Hoon Jung
• Ashok Khadka
• Kazi Sadid
• Katelyn Costanza
• Fei Xing
– Physical Processes and Sediment Systems • Mead Allison
• Cyndhia Ramatchandirane
• Dallon Weathers
• Brendan Yuill
– Coastal Ecology • Tim Carruthers
• Melissa Baustian
• Ann Hijuelos
• Leland Moss
• Kelly Darnell
• Caitlin Pinsonat, Blake Thompson, Dominque Henson, Kinsey Vernon, Shannon Matzke

TEAM EFFORT
• Deltares – Johannes Smits
– Bas van Maren
– Valesca Harezlak
– Michel Jeuken
• University of Louisiana-Lafayette – Scott M. Duke-Sylvester
– Jenneke M. Visser
– Mark Hester
• Louisiana State University – Sibel Bargu and Jamal Mathurin
– Dubrakvo Justic
– John White
– Sam Bentley
– Tommy Blanchard
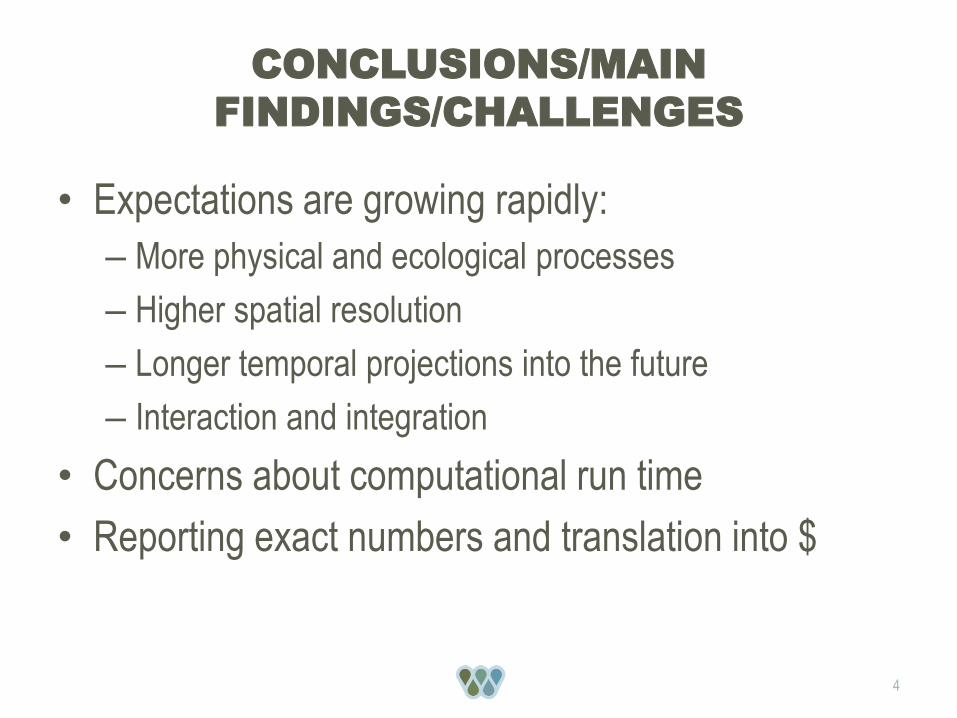
CONCLUSIONS/MAIN
FINDINGS/CHALLENGES
• Expectations are growing rapidly:
– More physical and ecological processes
– Higher spatial resolution
– Longer temporal projections into the future
– Interaction and integration
• Concerns about computational run time
• Reporting exact numbers and translation into $
4
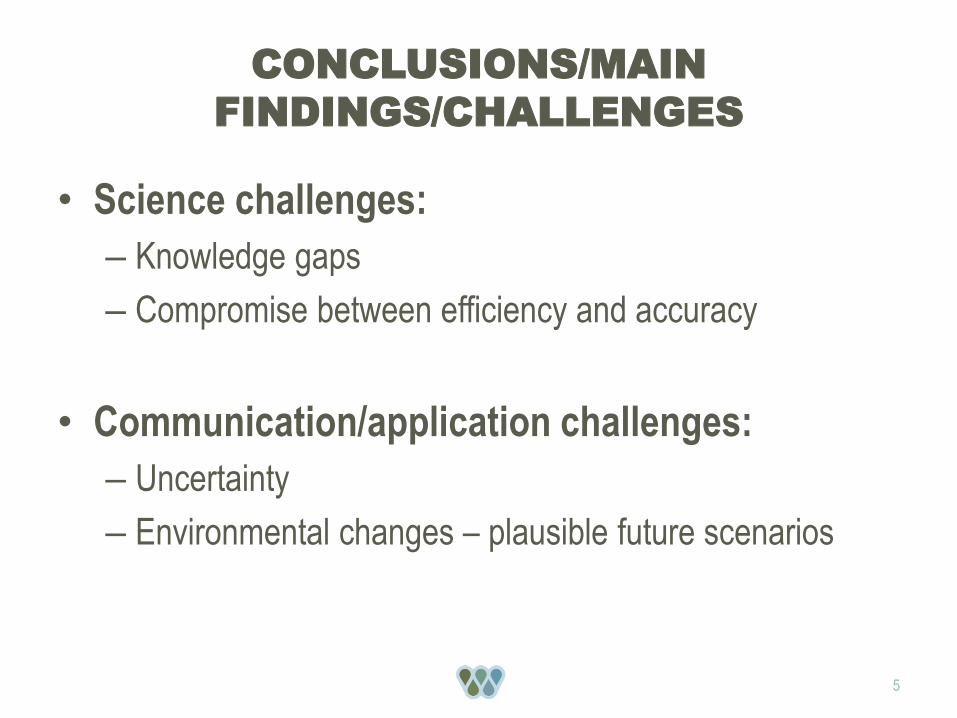
CONCLUSIONS/MAIN
FINDINGS/CHALLENGES
• Science challenges:
– Knowledge gaps
– Compromise between efficiency and accuracy
• Communication/application challenges:
– Uncertainty
– Environmental changes – plausible future scenarios
5

PROJECT GOALS
Produce a validated model capable of simulating:
Morphological processes during the creation of a
new delta and wetland areas
Nutrient effects to wetland vegetation, soil, and
estuarine primary producers of Breton Sound and
Barataria Basins.
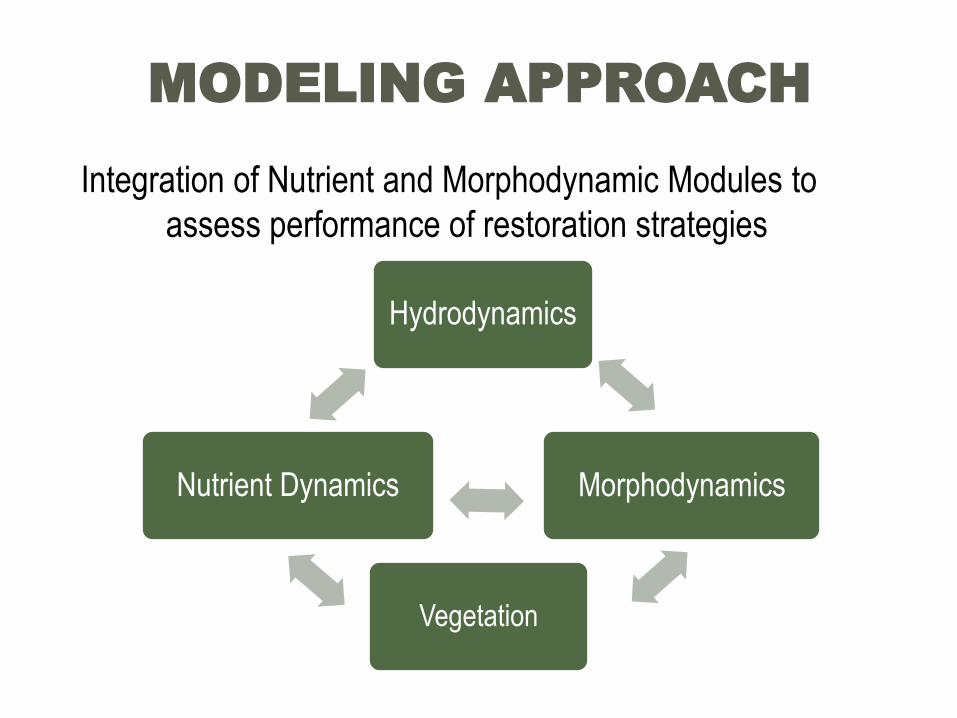
MODELING APPROACH
Hydrodynamics
Morphodynamics Nutrient Dynamics
Integration of Nutrient and Morphodynamic Modules to
assess performance of restoration strategies
Vegetation
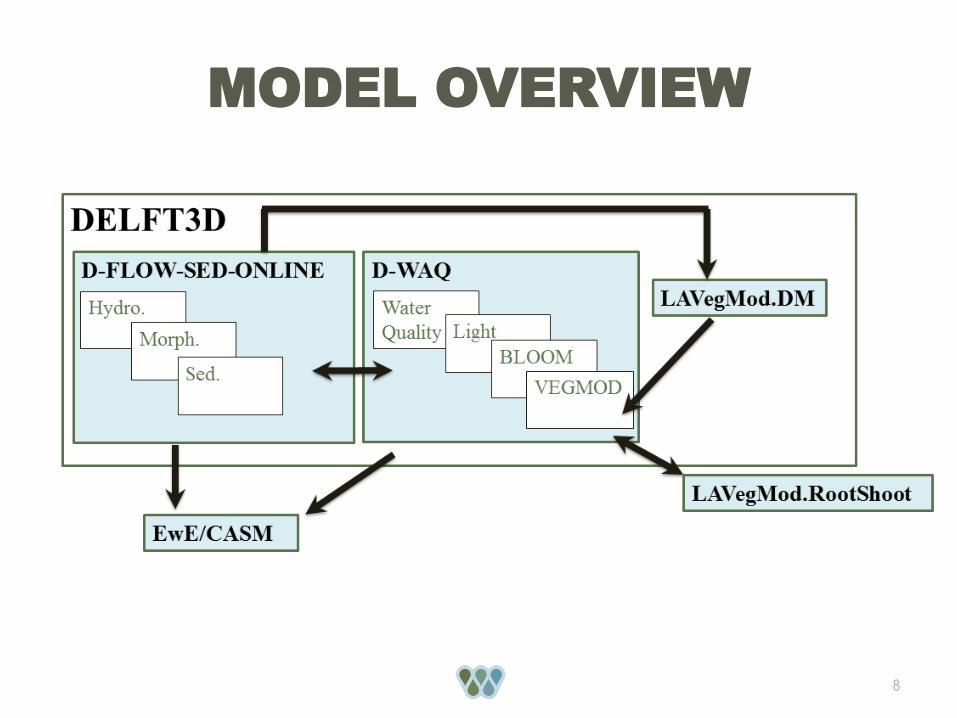
MODEL OVERVIEW
8
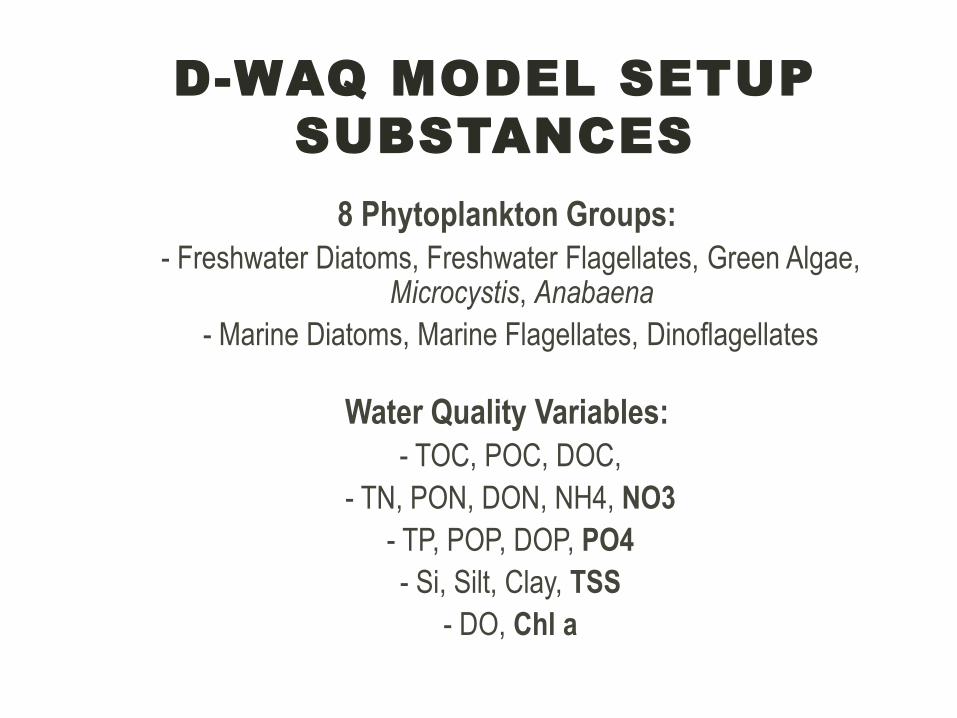
D-WAQ MODEL SETUP
SUBSTANCES
8 Phytoplankton Groups:
- Freshwater Diatoms, Freshwater Flagellates, Green Algae, Microcystis, Anabaena
- Marine Diatoms, Marine Flagellates, Dinoflagellates
Water Quality Variables:
- TOC, POC, DOC,
- TN, PON, DON, NH4, NO3
- TP, POP, DOP, PO4
- Si, Silt, Clay, TSS
- DO, Chl a

D-WAQ: SEDIMENT/SOIL LAYERS
Sediment Soil
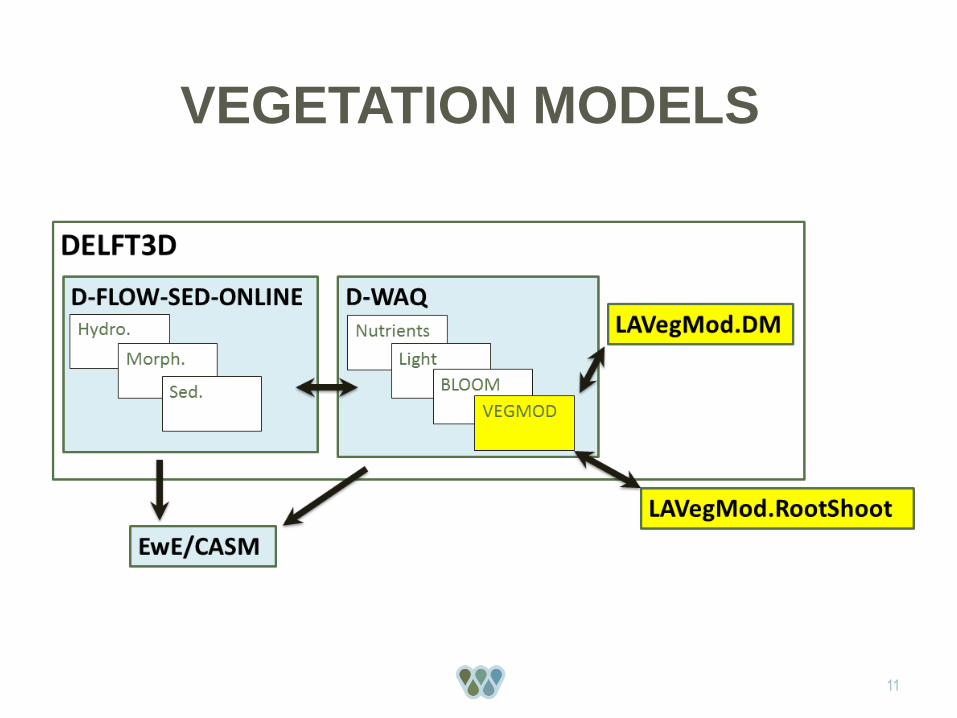
VEGETATION MODELS
11

LAVEGMOD.ROOTSHOOT AND VEGMOD
Total
Biomass
Spartina patens
Aboveground
Belowground
Biomass
Allocation POM in water
column
POM in soil
Mortality
(VEGMOD) (LaVegMod.RootShoot) (VEGMOD)
12

LAVegMod.DM & Marsh Types
Focus on 7 emergent marsh taxa:
Fresh: Sagittaria latifolia (arrowhead)
Zizaniopsis miliacea (giant cutgrass)
Intermediate: Sagittaria lancifolia (bulltongue)
Phragmites spp. (common reed)
Typha spp. (cattail)
Brackish: Spartina patens (wiregrass)
Saline: Spartina alterniflora (oyster grass)
Submerged Aquatic Vegetation (SAV)
• Generically modeled
13
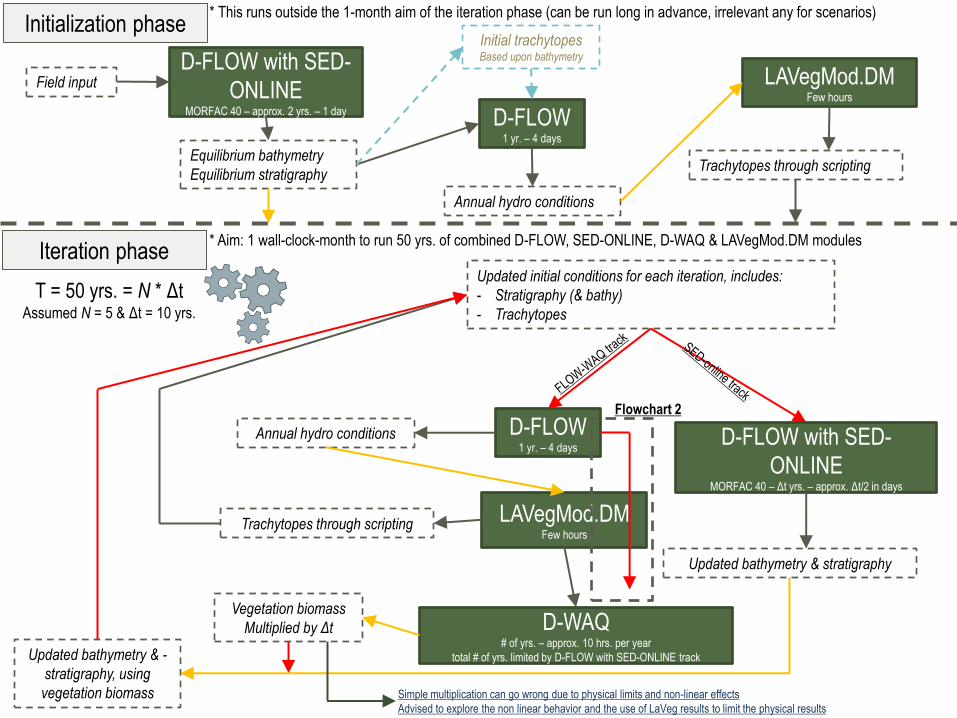
D-FLOW with SED-
ONLINE MORFAC 40 – approx. 2 yrs. – 1 day
Initialization phase
Iteration phase
* This runs outside the 1-month aim of the iteration phase (can be run long in advance, irrelevant any for scenarios)
* Aim: 1 wall-clock-month to run 50 yrs. of combined D-FLOW, SED-ONLINE, D-WAQ & LAVegMod.DM modules
Field input
Equilibrium bathymetry
Equilibrium stratigraphy
D-FLOW 1 yr. – 4 days
LAVegMod.DM Few hours
Annual hydro conditions
Trachytopes through scripting
Updated initial conditions for each iteration, includes:
- Stratigraphy (& bathy)
- Trachytopes
T = 50 yrs. = N * Δt Assumed N = 5 & Δt = 10 yrs.
D-FLOW with SED-
ONLINE MORFAC 40 – Δt yrs. – approx. Δt/2 in days
D-FLOW 1 yr. – 4 days
Updated bathymetry & stratigraphy
Annual hydro conditions
LAVegMod.DM Few hours
Trachytopes through scripting
D-WAQ # of yrs. – approx. 10 hrs. per year
total # of yrs. limited by D-FLOW with SED-ONLINE track
Vegetation biomass
Multiplied by Δt
Updated bathymetry & -
stratigraphy, using
vegetation biomass
Initial trachytopes Based upon bathymetry
Flowchart 2
Simple multiplication can go wrong due to physical limits and non-linear effects
Advised to explore the non linear behavior and the use of LaVeg results to limit the physical results
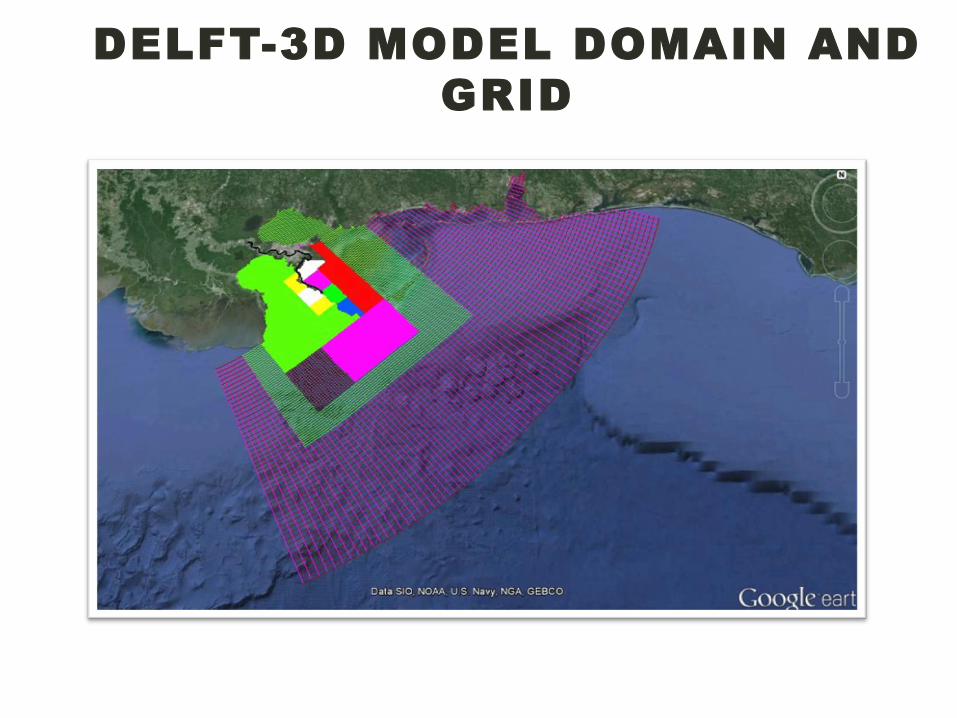
DELFT-3D MODEL DOMAIN AND
GRID
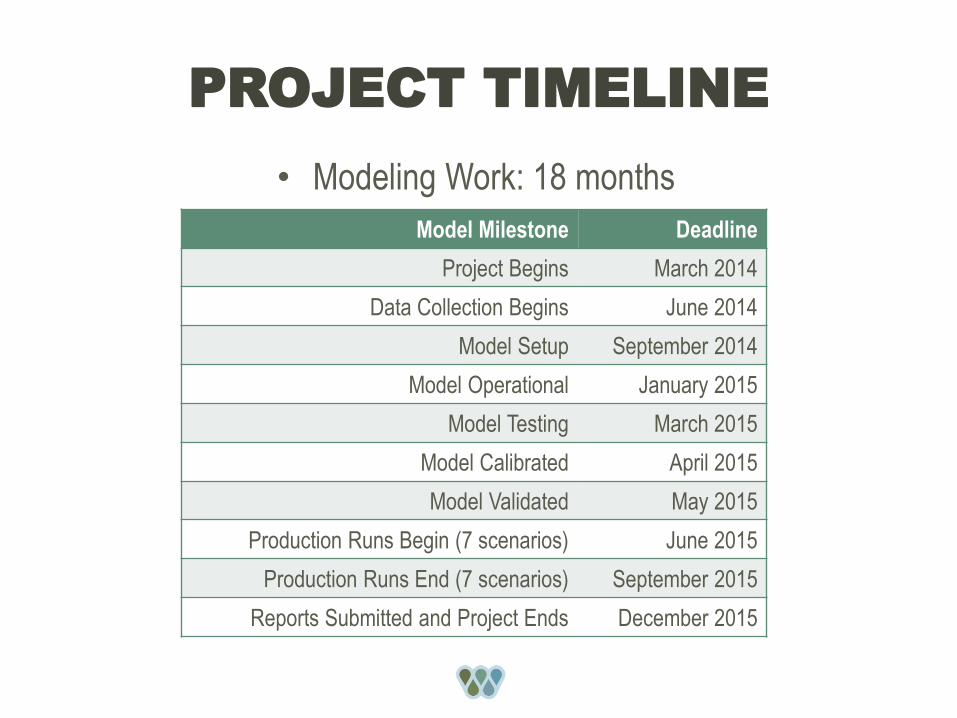
PROJECT TIMELINE
• Modeling Work: 18 months
Model Milestone Deadline
Project Begins March 2014
Data Collection Begins June 2014
Model Setup September 2014
Model Operational January 2015
Model Testing March 2015
Model Calibrated April 2015
Model Validated May 2015
Production Runs Begin (7 scenarios) June 2015
Production Runs End (7 scenarios) September 2015
Reports Submitted and Project Ends December 2015

CONTINUOUS DATA COLLECTION NETWORK
RECAP AND UPDATE
Breton Barataria

ESTUARINE TRANSECTS - 2015
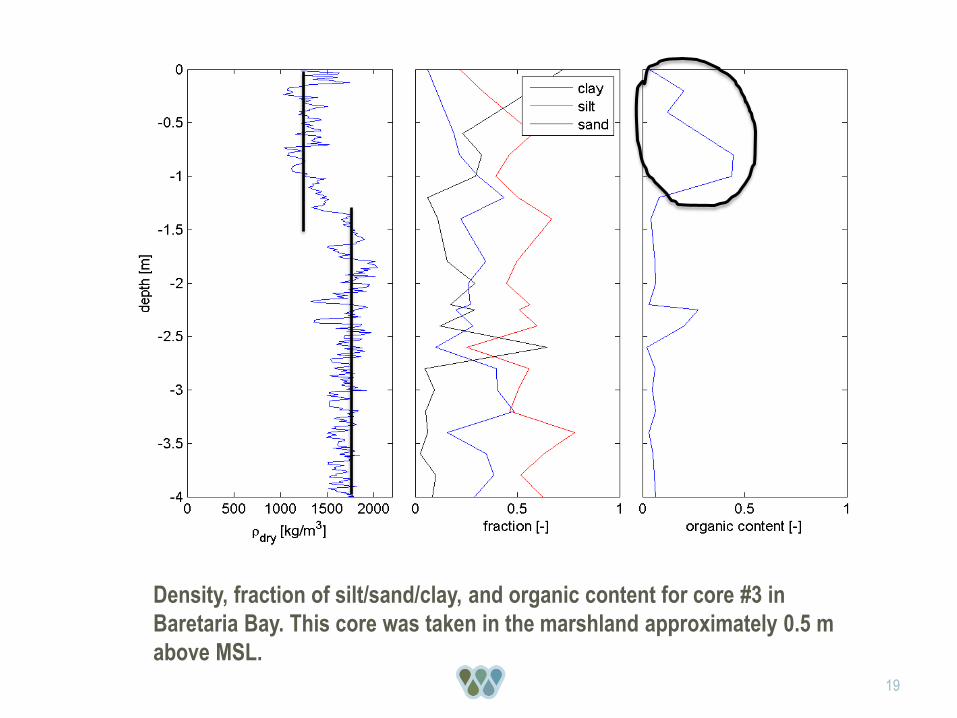
19
Density, fraction of silt/sand/clay, and organic content for core #3 in
Baretaria Bay. This core was taken in the marshland approximately 0.5 m
above MSL.

VALIDATION FOR THE RIVER:
YEAR 2014
• Suspended sediment transport rate at Belle Chasse
20

WATER LEVEL VALIDATION (BARATARIA) - 2014
CRMS4218
CRMS3617
CRMS4529

WATER LEVEL VALIDATION FOR BARATARIA BAY
AND BRETON SOUND BASINS- 2014
Daily Average
Bias (ft) Corr Coef (r) RMSE (ft) Mean -0.04 0.61 0.44
stdev 0.34 0.16 0.15
min -0.80 0.14 0.20
max 0.90 0.84 1.00
Sites, n = 95

SALINITY VALIDATION (BARATARIA) – 2014
(DAILY AVERAGE)
WATER INSITUTE STATIONS
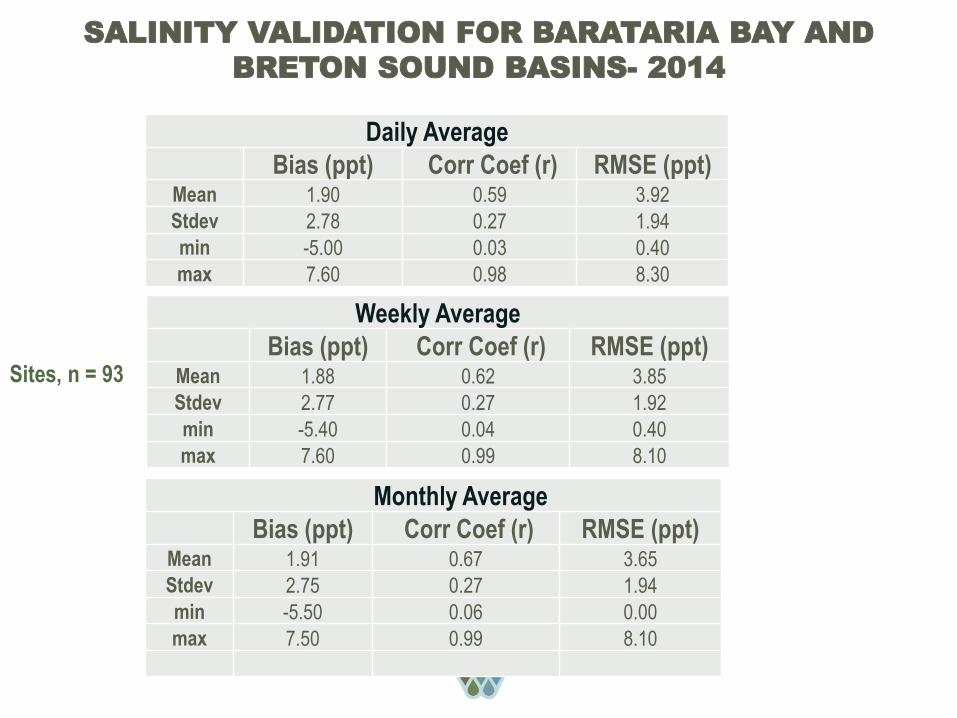
SALINITY VALIDATION FOR BARATARIA BAY AND
BRETON SOUND BASINS- 2014
Daily Average
Bias (ppt) Corr Coef (r) RMSE (ppt) Mean 1.90 0.59 3.92
Stdev 2.78 0.27 1.94
min -5.00 0.03 0.40
max 7.60 0.98 8.30
Weekly Average
Bias (ppt) Corr Coef (r) RMSE (ppt) Mean 1.88 0.62 3.85
Stdev 2.77 0.27 1.92
min -5.40 0.04 0.40
max 7.60 0.99 8.10
Monthly Average
Bias (ppt) Corr Coef (r) RMSE (ppt) Mean 1.91 0.67 3.65
Stdev 2.75 0.27 1.94
min -5.50 0.06 0.00
max 7.50 0.99 8.10
Sites, n = 93
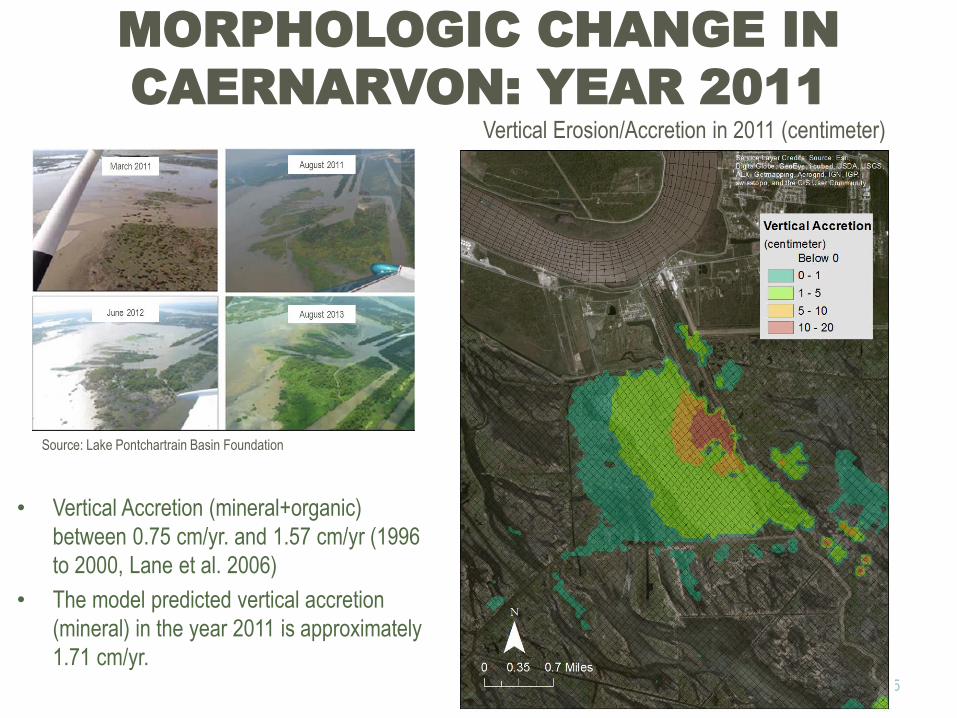
MORPHOLOGIC CHANGE IN
CAERNARVON: YEAR 2011
25
Vertical Erosion/Accretion in 2011 (centimeter)
• Vertical Accretion (mineral+organic)
between 0.75 cm/yr. and 1.57 cm/yr (1996
to 2000, Lane et al. 2006)
• The model predicted vertical accretion
(mineral) in the year 2011 is approximately
1.71 cm/yr.
Source: Lake Pontchartrain Basin Foundation

MORPHOLOGIC CHANGE IN
CAERNARVON: YEAR 2014
26
Vertical erosion/accretion in 2014 (centimeter)
• Vertical Accretion (mineral + organic) between 0.75
cm/yr and 1.57 cm/yr (Day et al., 2009, Lane et al.
2006)
• The model predicted vertical accretion (mineral) in
the year 2014 is approximately 0.85 cm/yr.
• Land building is less in 2014: The diversion was not
in operation after March 2014
Source: Lake Pontchartrain Basin Foundation
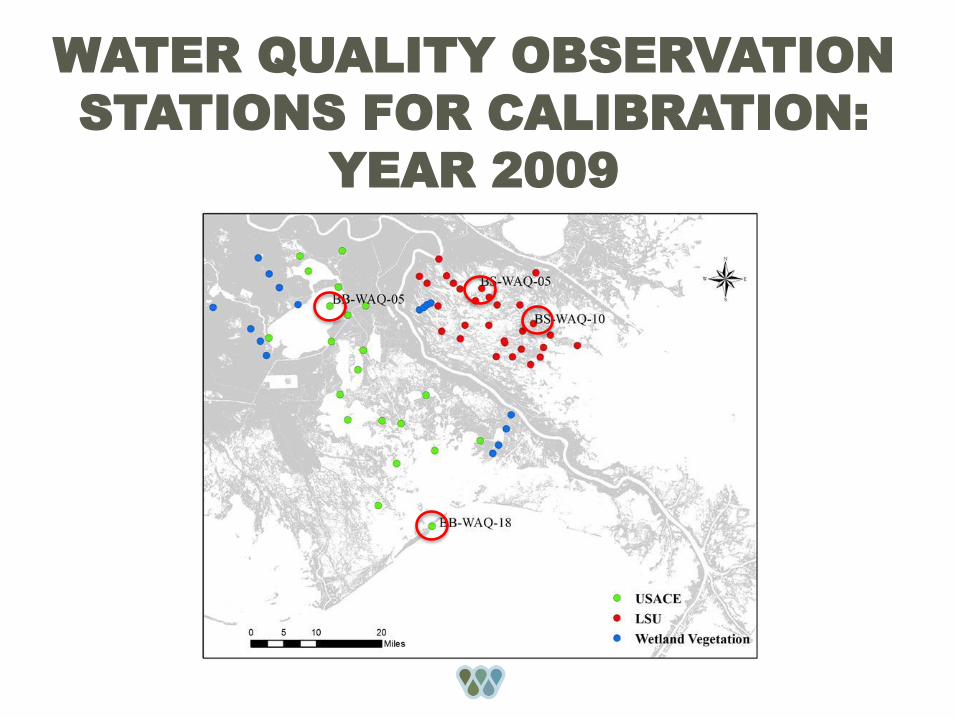
WATER QUALITY OBSERVATION
STATIONS FOR CALIBRATION:
YEAR 2009

WATER QUALITY CALIBRATION
BB-WAQ-18 (GRAND ISLE)

WATER QUALITY CALIBRATION
BS-WAQ-05 (LAKE LERY)

PHYTOPLANKTON
COMPOSITION
30
0
20
40
60
80
100
Com
posi
tion
(%)
BS1 August 2014
Modeled
Observed
0
20
40
60
80
100
Com
posi
tion
(%)
BS3 August 2014
Modeled
Observed
0
20
40
60
80
100
Com
posi
tion
(%)
BS11 August 2014
Modeled
Observed

BRETON
CRMS 0135

VEGETATION BIOMASS CHANGE
Feb. Sep. Dec.
Spartina
alterniflora
Spartina
patens
Sagittaria
lancifolia
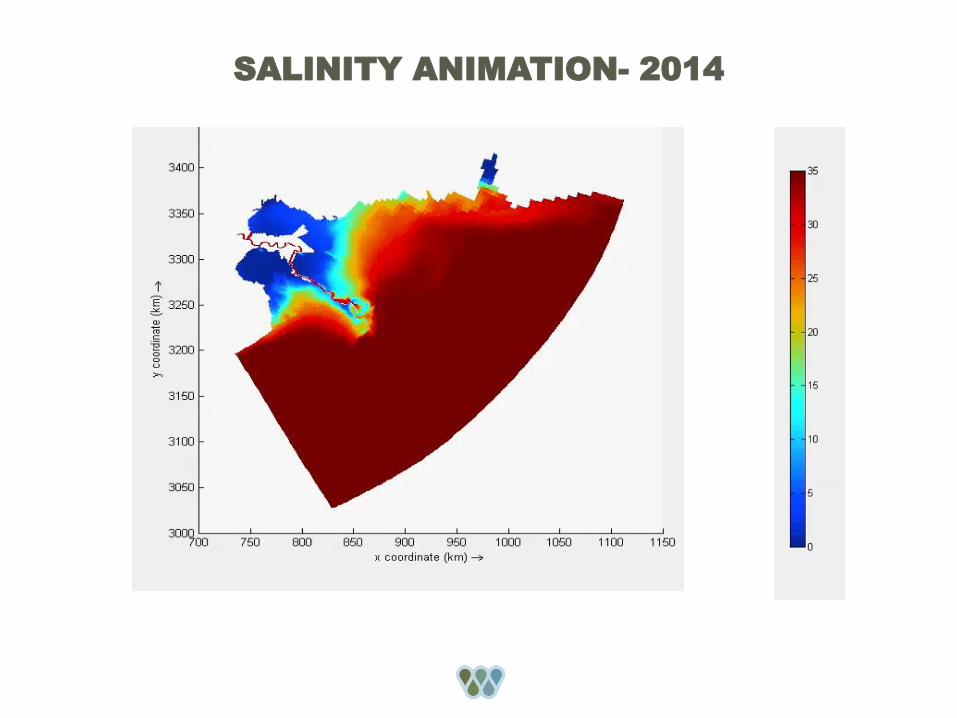
SALINITY ANIMATION- 2014

WATER QUALITY ANIMATIONS
34

35
WATER QUALITY ANIMATIONS

SEDIMENT DIVERSION
PRODUCTION RUNS (PR)
PR ID Description Operating Plan Design Discharge (cfs)
Sea Level
Rise Subsidence Rate
PR1 Mid-Barataria Less Aggressive 75K Intermediate 20% into range
FWOP/PR2 Future Without Project N/A (No Diversions)
N/A (No Diversions) Intermediate 20% into range
PR3 Mid-Breton Less Aggressive 35K Intermediate 20% into range
PR4 Lower-Breton Less Aggressive 50K Intermediate 20% into range
PR5 Lower-Barataria Less Aggressive 50K Intermediate 20% into range
PR6 All Four Diversions Less Aggressive 35K,50K,50K,75K Intermediate 20% into range
PR7 All Four Diversions Aggressive 35K,50K,50K,75K Intermediate 20% into range
PR8 Marsh Creation/Dredge Only N/A (No Diversions) N/A (No Diversions) Intermediate 20% into range
PR9 No Vegetation (20 yrs) Less Aggressive 35K,50K,50K,75K
Intermediate 20% into range
Less Aggressive = operation for 5 months
Aggressive = operation all year
PR8 = PR6 diversion footprints with sediment from 11 river bars

,0
10000,0
20000,0
30000,0
40000,0
50000,0
60000,0
70000,0
80000,0
,0
200000,0
400000,0
600000,0
800000,0
1000000,0
1200000,0
,0 1000,0 2000,0 3000,0 4000,0 5000,0 6000,0 7000,0 8000,0
Sed
imen
t D
iver
sio
n D
isch
arg
e (C
FS
)
Mis
siss
ipp
i Riv
er D
isch
arg
e (C
FS
)
Hours
Less-Aggressive Operations
MISSISSIPPI RIVER
DAVIS POND
CAERNARVON
MID-BRETON
MID-BARATARIA
LOWER-BARATARIA
LOWER BRETON
OPERATION PLAN – LESS AGGRESSIVE
July
5th
Feb
20th
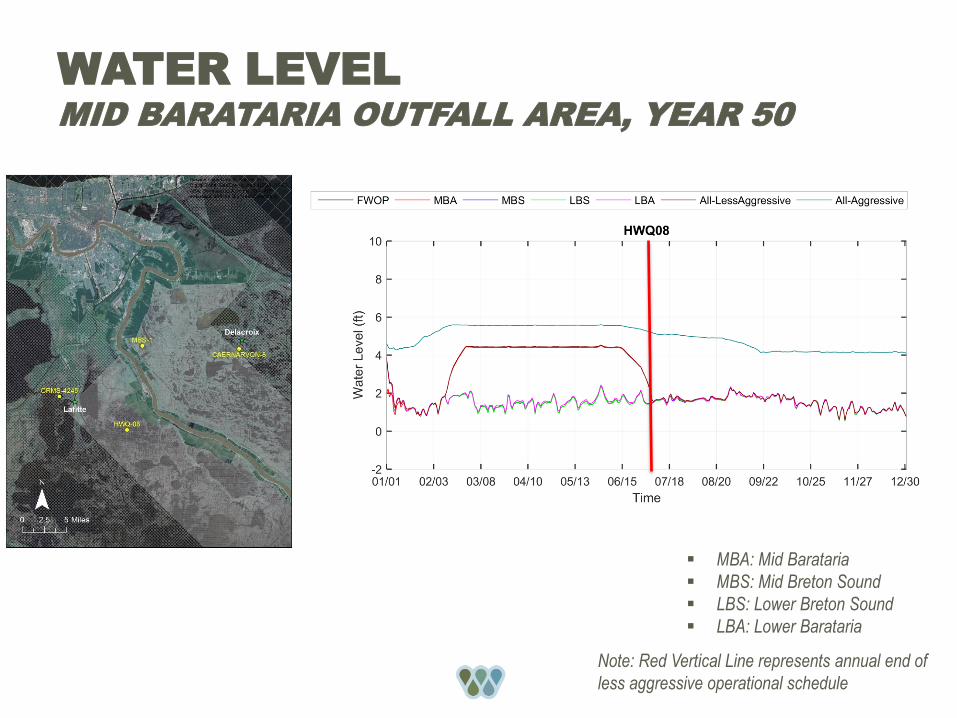
WATER LEVEL
MID BARATARIA OUTFALL AREA, YEAR 50
MBA: Mid Barataria
MBS: Mid Breton Sound
LBS: Lower Breton Sound
LBA: Lower Barataria
Note: Red Vertical Line represents annual end of
less aggressive operational schedule
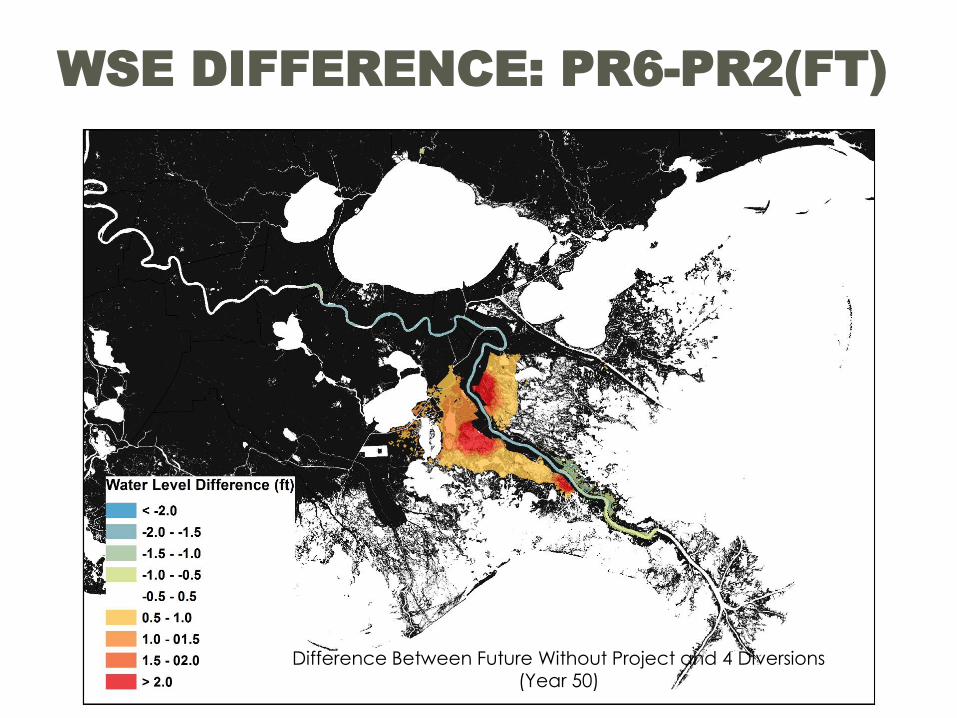
Difference Between Future Without Project and 4 Diversions (Year 50)
WSE DIFFERENCE: PR6-PR2(FT)
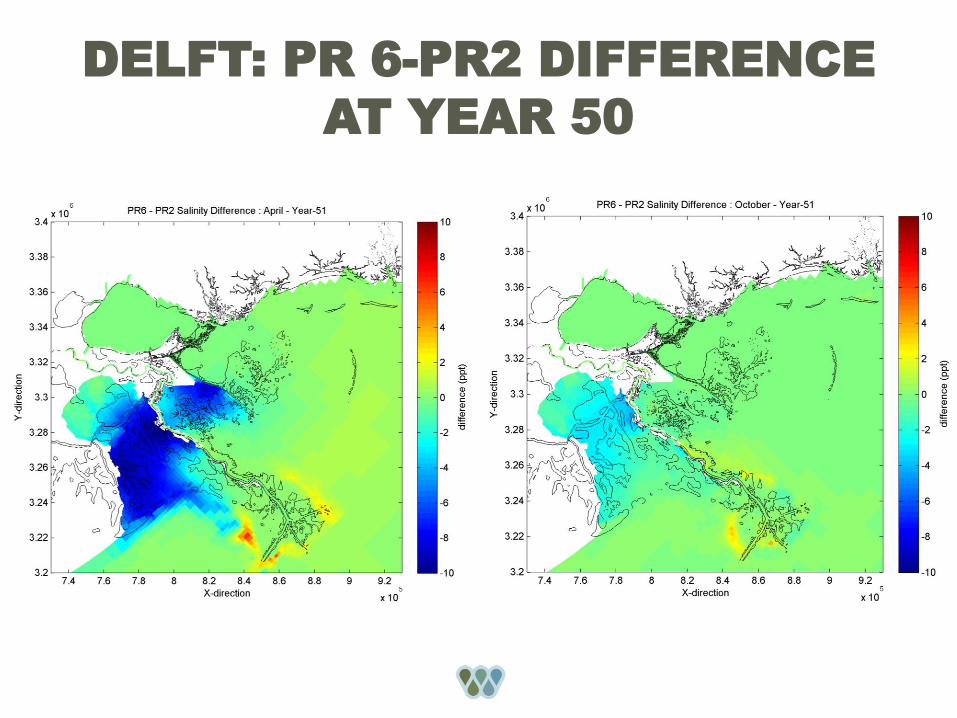
DELFT: PR 6-PR2 DIFFERENCE
AT YEAR 50
LAND BUILDING
Organic Matter + Mineral Material
41
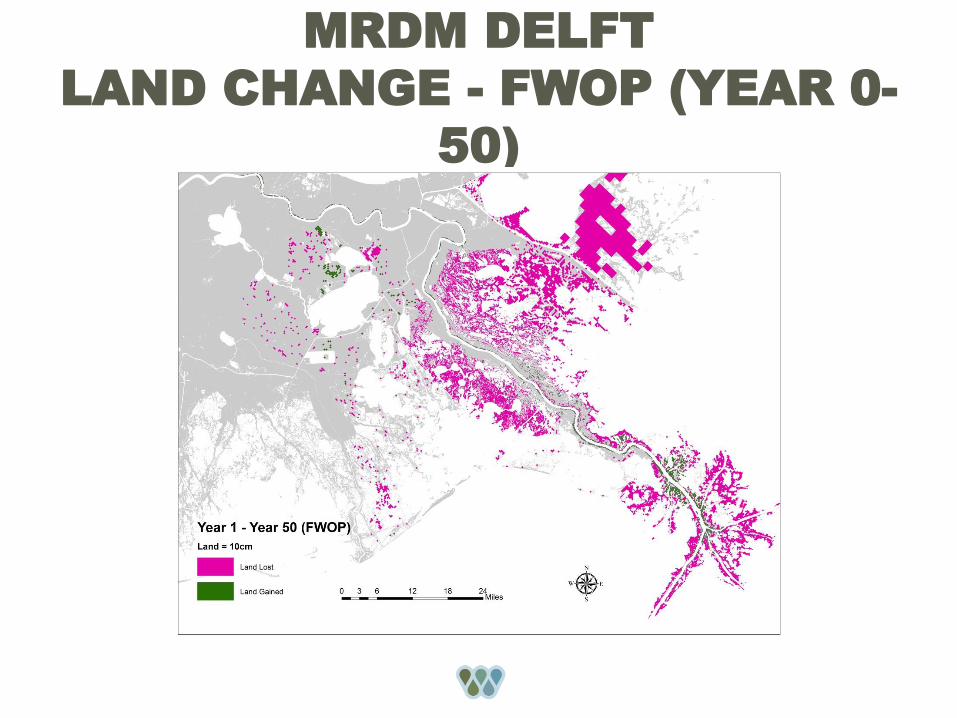
MRDM DELFT
LAND CHANGE - FWOP (YEAR 0-
50)
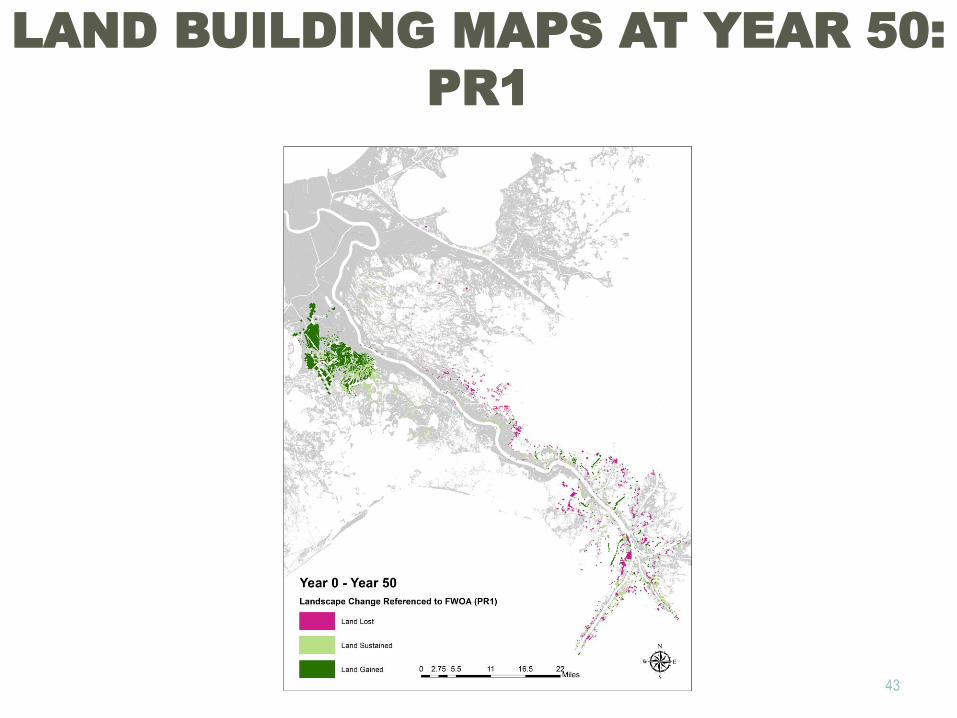
43
LAND BUILDING MAPS AT YEAR 50:
PR1
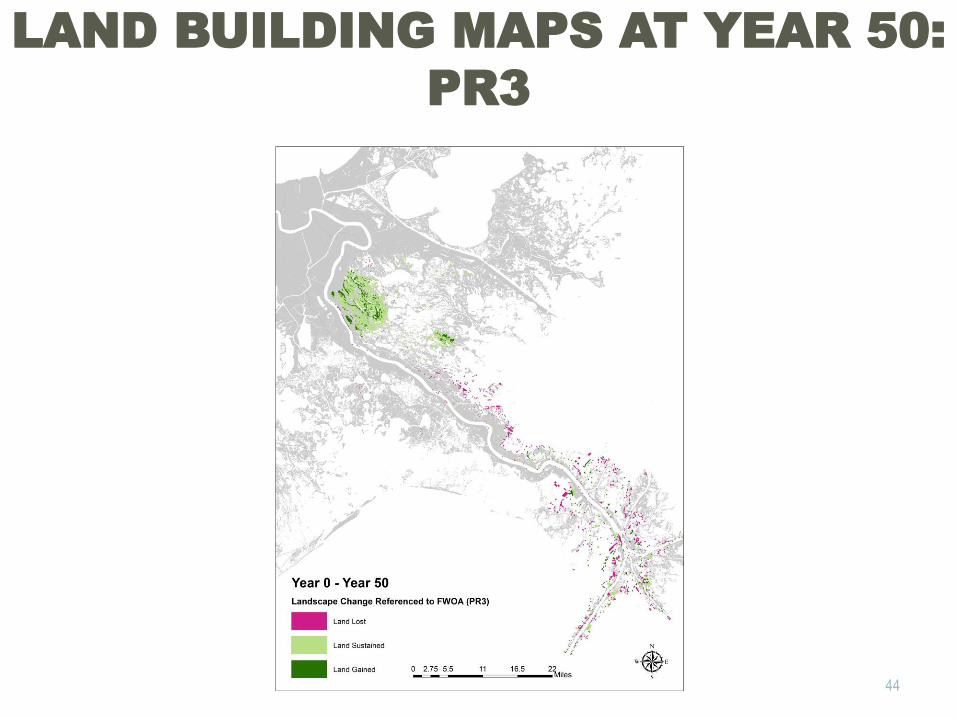
44
LAND BUILDING MAPS AT YEAR 50:
PR3
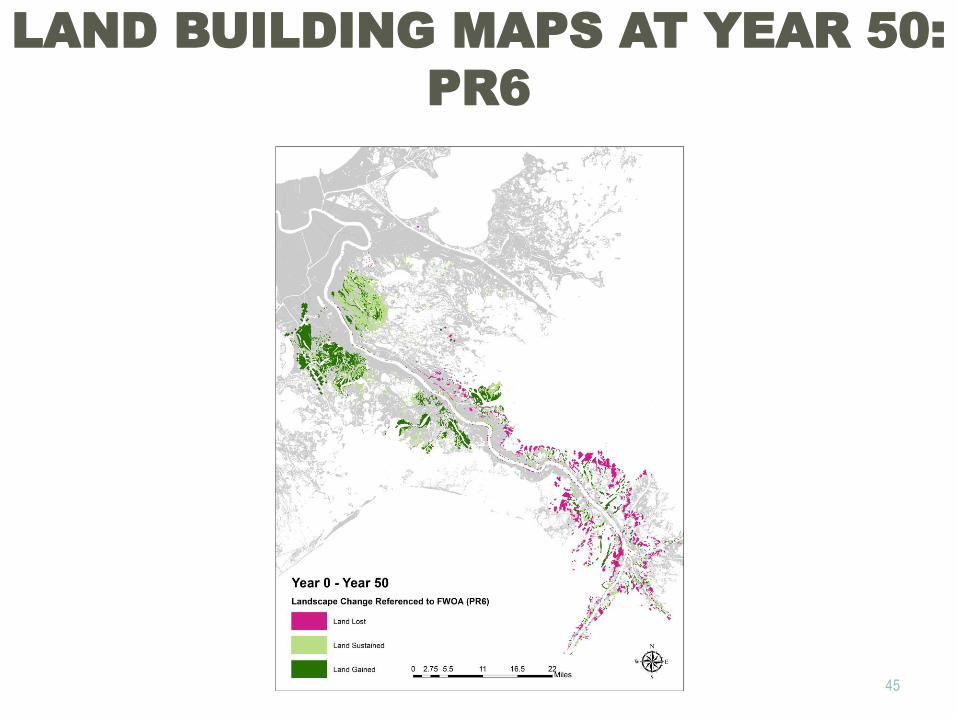
45
LAND BUILDING MAPS AT YEAR 50:
PR6
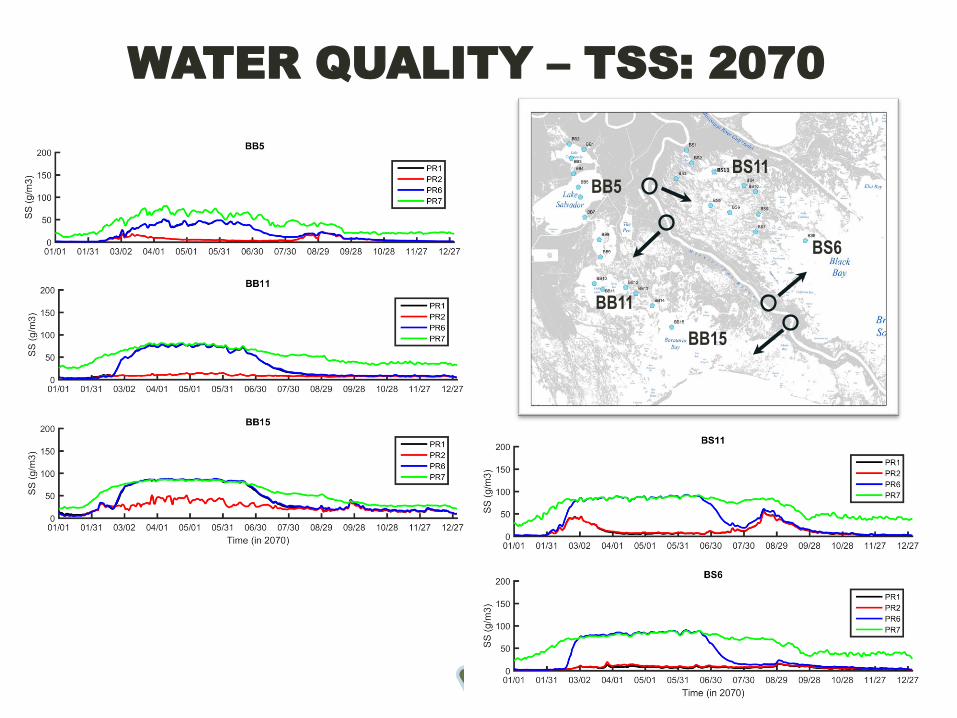
WATER QUALITY – TSS: 2070
BS11
BS6
BB15
BB11
BB5 BS11
BS6
BB15
BB11
BB5

WATER QUALITY – TSS: 2070
April
October
PR1 –PR2 PR6 –PR2 PR7 –PR2

WATER QUALITY – NO3: 2070
April
PR1 –PR2 PR6 –PR2 PR7 –PR2
October
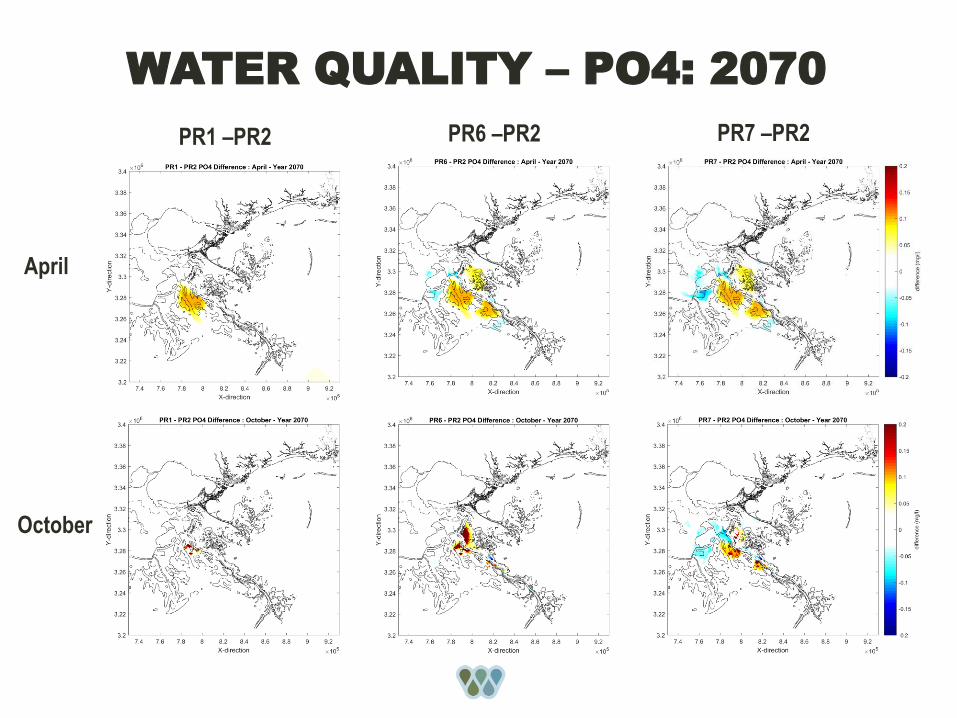
WATER QUALITY – PO4: 2070
April
PR1 –PR2 PR6 –PR2 PR7 –PR2
October

WATER QUALITY – Chl a: 2070
PR1 –PR2 PR6 –PR2
April
PR7 –PR2
October
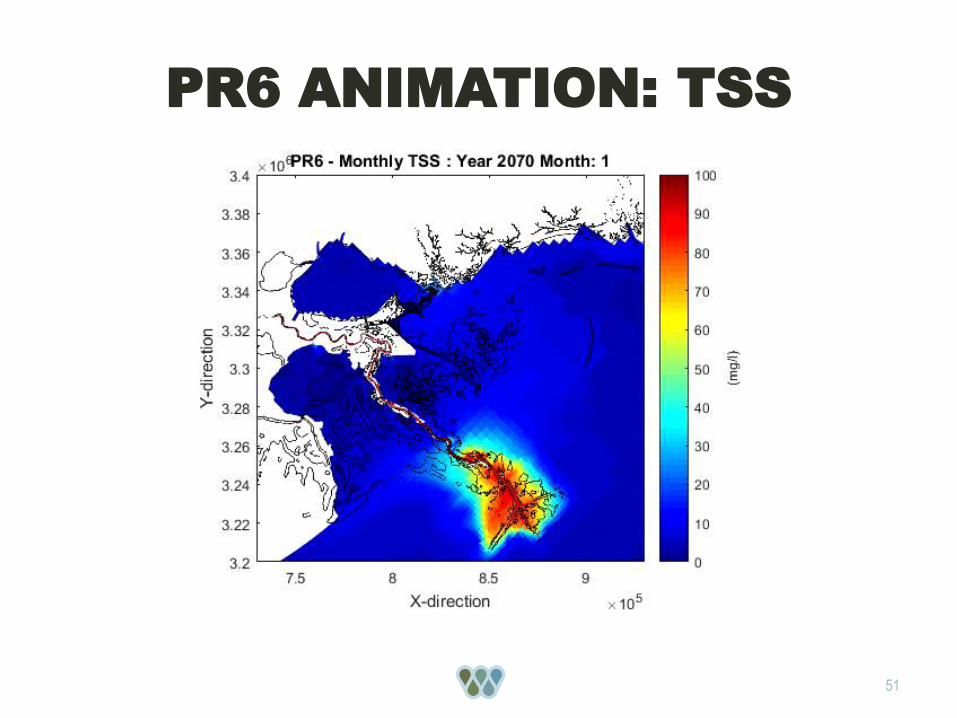
PR6 ANIMATION: TSS
51
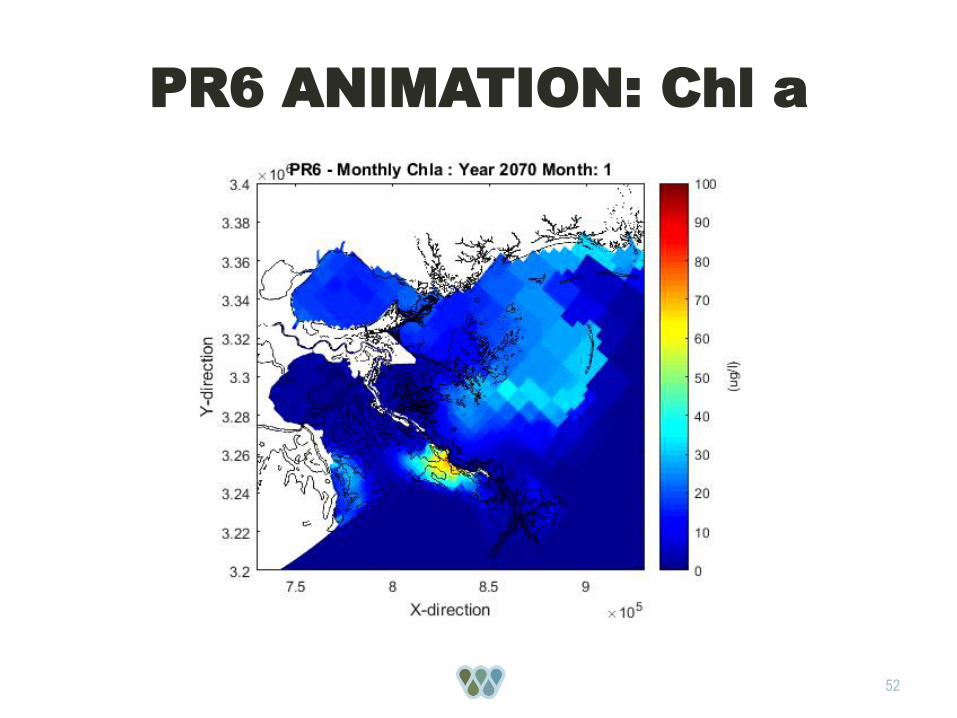
PR6 ANIMATION: Chl a
52
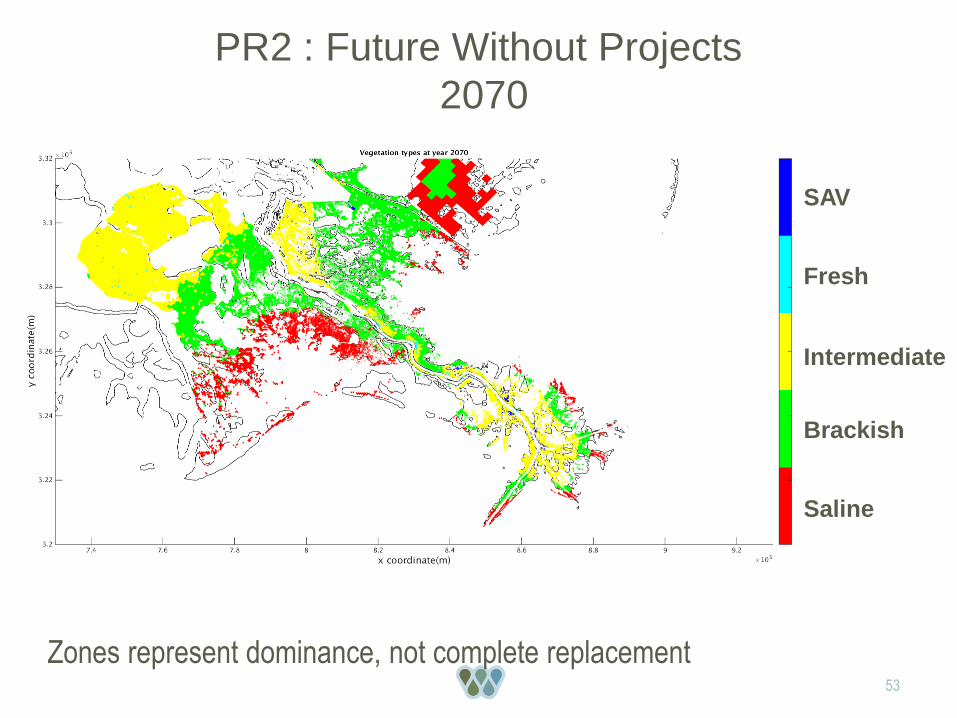
PR2 : Future Without Projects
2070
SAV
Fresh
Intermediate
Brackish
Saline
53
Zones represent dominance, not complete replacement

54
PR2
FWOA
PR6
Mid & Lower
Diversions
SAV
Fresh
Intermediate
Brackish
Saline
SAV
Fresh
Intermediate
Brackish
Saline
2070

CLOSING REMARKS
• Use modeling/analysis to identify:
– Science knowledge gaps
– Potential areas of model improvements
– Better integration techniques
– Design of data collection campaigns
• Engage and solicit input along the way from all
involved parties
• Continue to explain/communicate model
uncertainties and outcome uncertainties
55
THANK YOU
301 NORTH MAIN STREET, SUITE 2000
BATON ROUGE, LA 70825
(225) 448-2813
WWW.THEWATERINSTITUTE.ORG
@TheH2OInstitute