dwindling sulphur emissions, at what cost? dwindling sulphur emissions, at what cost? angie slavens,...
TRANSCRIPT

1
Dwindling Sulphur Emissions, at What Cost?
Angie Slavens, Lindsay Dreitzler, Saba Khan UniverSUL Consulting
Kuppuswamy Thiyagarajan (KT)
Abu Dhabi National Oil Company (ADNOC)
ABSTRACT Over the past several decades, governments world-wide have adopted increasingly strict clean air regulations on sulphur emissions from processing facilities, with a current industry benchmark of approximately 99.9% minimum recovery efficiency. However, this figure is on the rise with a greater number of facilities designing for higher sulphur removal rates, as evidenced by the World Bank Standard SO2 emission specification, which currently sits at 150 mg/Nm3 (equivalent to approximately 99.98% recovery efficiency). While striving for increasingly lower sulphur emissions may be beneficial, it does not come free of cost. As sulphur recovery efficiency increases, the energy required to remove each additional kilogram of sulphur escalates. As energy consumption increases, so too do CO2 emissions, which is an undesirable outcome in a time when carbon emissions reduction is among the top objectives for corporate environmental management programs. Not only is the environmental impact of greenhouse gas familiar and visible to the public, it also carries a high potential for future regulation. This paper explores the relationship between SO2 and CO2 emissions in sulphur recovery facilities and investigates whether there is a point at which further increases in sulphur recovery efficiency result in diminishing returns, in terms of energy consumption and associated CO2 footprint. Options for improving energy efficiency, thereby reducing carbon emissions, are discussed and views are presented regarding whether there are conditions under which carbon capture from sulphur recovery facilities can be a worthwhile endeavor. INTRODUCTION By the late 1980s, there were growing concerns that acid precipitation was damaging forests and aquatic ecosystems. As a result, governments world-wide began adopting increasingly strict clean air regulations on sulphur emissions from processing facilities. Flue gas from coal-fired power plants was, and still is, the primary source of SO2 emissions contributing to these concerns. Nevertheless, sulphur recovery facilities in refineries and gas plants also came under scrutiny to substantially reduce their SO2 impact on the environment. As a result, increased sulphur recovery emissions regulations have been imposed over the past three decades, via a stepwise approach. Initial reductions in allowable SO2 emissions from sulphur recovery facilities made a fairly significant impact on the global environmental landscape, as sulphur recovery efficiencies (SRE) increased from that which is achievable with a standard Claus sulphur plant (95-97% SRE), to

2
99% and above, which is achievable using various tail gas treating technologies. While additional SO2 emissions reduction is beneficial for reducing the potential for acid rain, there is cause to question whether striving for ever higher recovery efficiencies (in excess of 99.9%) is actually leading to diminishing returns, in terms of increased energy consumption and associated carbon emissions. The current industry recovery efficiency benchmark is around 99.9%. However, this figure is on the rise with a greater number of facilities designing for higher sulphur removal rates, as evidenced by the World Bank Standard (WBS), which currently sits at 150 mg/Nm3 (equivalent to approximately 99.98% recovery efficiency). This paper explores the relationship between SO2 and CO2 emissions in sulphur recovery facilities and sets out to establish a reasonable balance between the two by investigating answers to the following questions:
1. How does increasing SRE positively impact global SO2 emissions? 2. What is the corresponding negative impact on global CO2 emissions? 3. Is CO2 capture from SRUs a viable proposition?
GLOBAL SO2 EMISSIONS According to a recent study in the journal of Atmospheric Chemistry and Physics, global sulphur emissions peaked in the early 1970s and decreased until 2000, with an increase in recent years due to rising emissions in China, international shipping and developing countries in general.1 Figures 1 and 2 illustrate estimated global anthropogenic SO2 emissions from 1850 to 2005, by source and region, respectively. For reference, 1,000 Gg is equivalent to 1 million metric tons.
Figure 1. Global Anthropogenic SO2 Emissions, by Primary Source
Source: Smith, SJ, J van Aardenne, Z Klimont, RJ Andres, A Volke, and S Delgado Arias. (2011). Anthropogenic Sulfur Dioxide Emissions: 1850–2005, Atmospheric Chemistry and Physics, 11:1101–1116.

3
Figure 2. Global Anthropogenic SO2 Emissions, by Region
Source: Smith, SJ, J van Aardenne, Z Klimont, RJ Andres, A Volke, and S Delgado Arias. (2011). Anthropogenic Sulfur Dioxide Emissions: 1850–2005, Atmospheric Chemistry and Physics, 11:1101–1116.
Data from the referenced study do not extend beyond 2005, at which time, total SO2 emissions were in the range of 115 million tons, up about 5 million tons from a dip in 2000. For the purpose of this paper, global anthropogenic SO2 emissions are estimated at 120 million tons in 2013. Figure 3 illustrates the distribution of current SO2 emissions from the highest elemental sulphur-producing regions in the world. These regions are of particular interest due to the fact that they are some of the world’s largest SO2 emitters, while also possessing a large number of oil and gas facilities where large quantities of elemental sulphur are recovered.
Figure 3. Anthropogenic SO2 Emissions of World’s Largest Sulphur-Producing Regions in 2013

4
GLOBAL CO2 EMISSIONS Carbon dioxide is the primary greenhouse gas emitted through human activities. In 2013, CO2 accounted for about 82% of all anthropogenic U.S. greenhouse gas emissions. While CO2 is emitted from a variety of natural sources, human-related emissions are primarily responsible for the increase that has occurred in the atmosphere since the industrial revolution. Global CO₂ emissions were 150 times higher in 2011 than in 1850, as illustrated in Figure 4.2
Figure 4. Global Anthropogenic Carbon Dioxide Emissions, 1850 to 2011
Source: Friedrich, Johannes and Damassa, Thomas, “The History of Carbon Dioxide Emissions,” World Resources Institute Blog, May 21, 2014.
Figures 5 and 6 illustrate estimated historical global CO2 emissions, by source and region, respectively.
Figure 5. Global Anthropogenic CO2 Emissions, by Primary Source
5
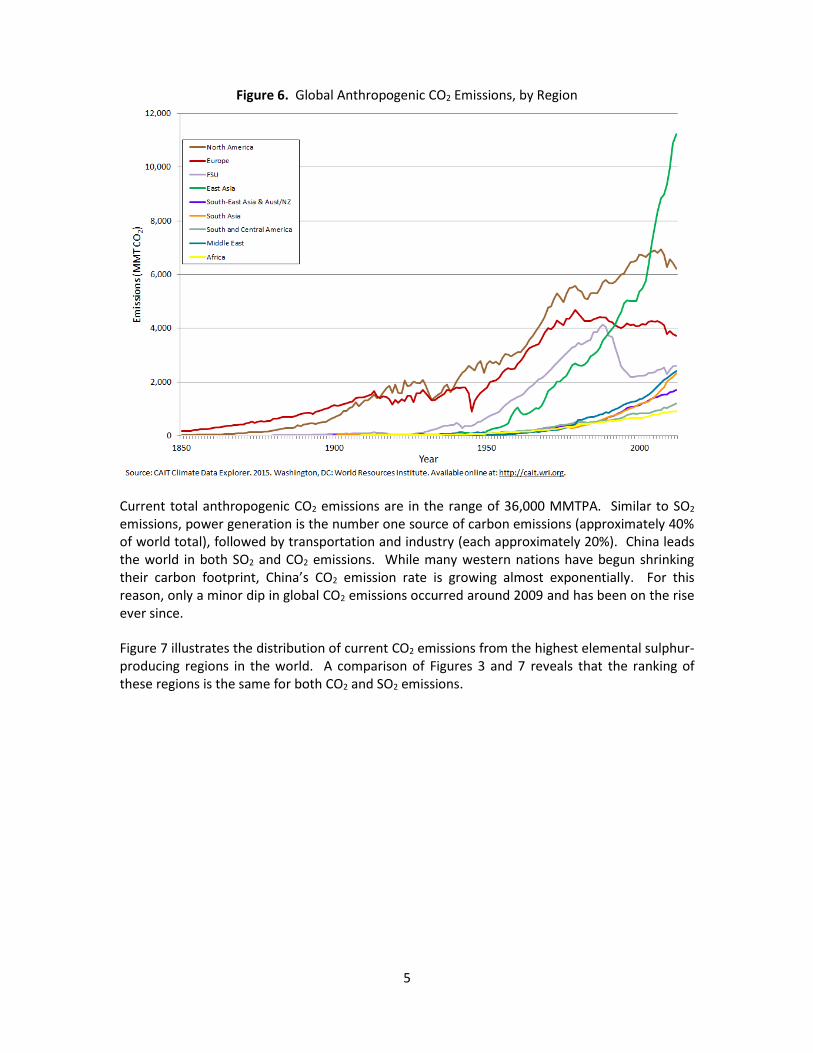
Figure 6. Global Anthropogenic CO2 Emissions, by Region
Current total anthropogenic CO2 emissions are in the range of 36,000 MMTPA. Similar to SO2 emissions, power generation is the number one source of carbon emissions (approximately 40% of world total), followed by transportation and industry (each approximately 20%). China leads the world in both SO2 and CO2 emissions. While many western nations have begun shrinking their carbon footprint, China’s CO2 emission rate is growing almost exponentially. For this reason, only a minor dip in global CO2 emissions occurred around 2009 and has been on the rise ever since. Figure 7 illustrates the distribution of current CO2 emissions from the highest elemental sulphur-producing regions in the world. A comparison of Figures 3 and 7 reveals that the ranking of these regions is the same for both CO2 and SO2 emissions.

6
Figure 7. Anthropogenic CO2 Emissions of World’s Largest Sulphur-Producing Regions in 2013
TYPICAL SULPHUR RECOVERY FACILITY To consider the impact that sulphur recovery facilities have on overall SO2 and CO2 emissions requires examination of the composition and flow of stack gas from a typical sulphur recovery unit. Thus, a hypothetical 1,000 MTPD sulphur recovery train has been considered, over a range of sulphur recovery efficiencies. Although 1,000 MTPD is larger than the typical average train size, this will not be important for the methodology utilized to evaluate impact on global emissions. Considering that most refineries produce rich acid gas (H2S > 85 mol%) and most gas plants produce relatively lean acid gas (40-50% H2S), an average global concentration of 60 mol% is assumed. Feed gas flow and composition for the hypothetical plant are provided in Table 1.
Table 1. Feedstock for Hypothetical 1,000 MTPD Sulphur Recovery Train
mol% kmol/hr
Component
H2S 60% 1,300
CO2 30% 650
Hydrocarbon (as C1) 1% 22
H2O 9% 195
Total 100% 2,166
Temperature, oC 54
Pressure, barg 0.69

7
To compare relative SO2 and CO2 emissions, simulations with this feedstock were generated for a range of sulphur recovery efficiency requirements. Sulsim®7 and ProTreat® were utilized for simulating the five SRE cases described below.
A. 97% SRE – 97% recovery is based on a conventional 3-stage Claus unit. B. 99.0% SRE – 99.0% recovery is based on a sub-dewpoint process (2-stage Claus + 2 sub-
dewpoint reactors), although it should be noted that a direct oxidation process would achieve similar SRE and stack gas flow/composition.
C. 99.3% SRE – 99.3% recovery is based on a 2-stage Claus unit + TGTU (MDEA). This SRE is just beyond the upper limit of an achievable guarantee value for sub-dewpoint and direct oxidation processes; therefore, it was investigated as the entry point for an amine based TGTU.
D. 99.9% SRE – 99.9% recovery is based on a 2-stage Claus unit + TGTU (MDEA). E. 150 mg SO2/Nm3 – The World Bank Standard case (99.98% SRE) is based on a 2-stage
Claus unit + TGTU (MDEA). A more selective solvent may be considered for this high recovery case, to reduce solvent circulation, but MDEA was used to allow consistent relative evaluation between all cases.
Process flow diagrams for the five SRE cases are provided in Figures 8-10.

8
Figure 8. Process Flow Diagram for Case A, 97% SRE
BURNERRF
SRU WH B
Acid Gas
C LAUS A IRBLO WER
Air
1 st C OND ENSER
Sulp
hu
r
1 st REH EATE R
1 st C ONVERTER
2 nd C OND ENSER
Sulp
hu
r
2 nd
REH EATE R2 nd C ONVERTER
3 r d C OND ENSER
Sulp
hu
r
3 r d
REH EATE R3 r d C ONVERTER
4 t h C OND ENSER
Sulp
hur
BURNER
IN CIN ERATOR
IN CIN ERATORWH B
IN CIN ERATORAI R BLOWER
Air
Fuel
Stack Gas
STAC K
LEGEND
POWER CONSUMER HP STEAM PRODUCER
HP STEAM CONSUMER LP STEAM PRODUCER LL P STEAM PR OD UCER
FUEL CONSUMER

9
Figure 9. Process Flow Diagram for Case B, 99.0% SRE
FUEL CONSUMER
BURNERRF
SRU WH B
Acid Gas
C LAUS A IRBLO WER
Air
1 st C OND ENSER
Su
lph
ur
1 st REH EATE R
1 st C ONVERTER
2 nd C OND ENSER
Sulp
hu
r
2 nd
REH EATE R2 nd C ONVERTER
3 r d C OND ENSER
Sulp
hur
3 r d
REH EATE R1 st C BAREAC TOR
4 t h C OND ENSER
Sulp
hur
BURNER
IN CIN ERATOR
IN CIN ERATORWH B
IN CIN ERATORAI R BLOWER
Air
Fuel
Stack Gas
STAC K
2 nd C BAREAC TOR
LEGEND
POWER CONSUMER
HP STEAM PRODUCER
HP STEAM CONSUMER
LP STEAM PRODUCER
LL P STEAM PR OD UCER

10
Figure 10. Process Flow Diagram for Cases C-E, 99.3 – 99.98% SRE
BURNERRF
SRU WH B
Acid Gas
C LAUS A IRBLO WER
Air
1 st C OND ENSER
Sulp
hur
1 st REH EATE R
1 st C ONVERTER
2 nd C OND ENSER
Sulp
hur
2 nd
REH EATE R2 nd C ONVERTER
3 r d C OND ENSER
Sulp
hur
TGTUP REHEA TER
H YD ROG ENA TIO NREAC TOR
BURNER
IN CIN ERATOR
IN CIN ERATORWH B
IN CIN ERATORAI R BLOWER
Air
Fuel
Stack Gas
STAC K
TGTUWH E
QUE NCHC OLUM N
QUE NCHP UMP
QuenchWaterPurge
ABSO RBE R REGENERAT OR
RIC H AM INEP UMP
LEA N/RIC HEXCH A NGER
LEA N AM INEP UMP
REBOI LER
REF LUXD RUM
FUEL CONSUMER
LP STEAM CONSUMER
LEGEND
POWER CONSUMER HP STEAM PRODUCER
HP STEAM CONSUMER LP STEAM PRODUCER LLP STEAM PR ODUCER

11
A standard design basis was employed for all cases to allow relative comparison on a consistent basis. Key design parameters are provided below.
Sulphur Recovery Unit o Air-only operation o HP steam (40 barg) produced in SRU waste heat boiler (WHB) o 2 Claus beds (3 for 97% SRE case) with promoted activated alumina catalyst o 2 additional sub-dewpoint beds for 99.0% SRE case o LP steam (3.5 barg) produced in 1st & 2nd sulphur condensers o LLP steam (1.0 barg) produced in 3rd & 4th sulphur condensers o HP steam (40 barg) consumed in SRU reheaters
Tail Gas Treatment Unit o HP saturated steam (40 barg) consumed in preheater o Low temperature hydrogenation catalyst o LP steam (3.5 barg) produced in TGTU waste heat exchanger (WHE) o MDEA solvent (lean temperature of 50oC for all except Case E, which was
reduced to 40oC to achieve ultra-high SRE using MDEA) o LP steam (3.5 barg) consumed in regenerator reboiler
Incinerator o Operated at 815 oC (upper limit, required for achieving <5 mg/Nm3 TRS) o 2% excess O2 in stack gas o Natural gas fired (LHV of 8,953 kcal/Nm3) o HP saturated steam (40 barg) produced in incinerator waste heat boiler o No sulphur pit ejector routed to incinerator
The SO2 and CO2 content of the incinerator stack gas were compared for the range of SRE cases, as summarized in Table 2. For the amine-based TGTU cases, amine circulation rate and TGTU absorber overhead H2S concentration are also provided for information.
Table 2. 1,000 MTPD Hypothetical Sulphur Train Process Parameters
97% SRE 99.0% SRE 99.3% SRE 99.9% SRE
150 mg SO2/Nm3
Incinerator Stack Gas Composition
mol% kmol/hr mol% kmol/hr mol% kmol/hr mol% kmol/hr mol% kmol/hr
O2 2.00% 16.97 2.00% 162.70 2.00% 123.48 2.00% 123.72 2.00% 123.73
N2 59.95% 4857.64 59.89% 4874.31 71.42% 4411.07 71.45% 4421.84 71.46% 4422.81
CO2 10.75% 870.64 10.88% 885.69 13.69% 845.35 13.75% 850.63 13.75% 851.19
SO2 0.48% 38.95 0.16% 12.97 0.15% 9.04 200 ppmv 1.24 45 ppmv 0.28
H2O 26.82% 2172.97 27.07% 2203.06 12.75% 787.60 12.78 790.93 12.78 791.20
Total 100% 8102.17 100% 8138.73 100% 6176.54 100% 6188.37 100% 6189.22
Key TGTU Process Parameters
MDEA Circ. Rate (m3/hr)
--- --- 176 264 1,026
TGTU Absorber Ovhd H2S (ppmv)
--- --- 2,609 345 74

12
When considering the carbon footprint of a sulphur recovery facility, it is important to look beyond the obvious CO2 content of the stack gas. It is also essential to take into account the equivalent CO2 emissions associated with all of the major energy producers and consumers in the facility. Table 3 summarizes the energy balance for each case. These values are used to generate equivalent CO2 values for further evaluation of the facility’s overall CO2 footprint.
Table 3. Energy Balance Information for 1,000 MTPD Hypothetical Sulphur Recovery Train
97% SRE 99.0% SRE 99.3% SRE 99.9% SRE
150 mg SO2/Nm3
Major Power Consumers
Claus Air Blowers 1,516 kW 1,520 kW 2,001 kW 2,012 kW 2,014 kW
Quench Pumps N/A N/A 75 kW 75 kW 75 kW
Amine Pumps N/A N/A 83 kW 126 kW 486 kW
Incinerator Air Blowers 246 kW 247 kW 196 kW 196 kW 196 kW
Incinerator Fuel 4,213 Nm3/hr 4,531 Nm3/hr 3,677 Nm3/hr 3,789 Nm3/hr 3,803 Nm3/hr
HP Steam Producers
SRU WHE 53,921 kW 54,044 kW 55,256 kW 55,586 kW 55,561 kW
Incinerator WHB (815oC) 40,460 kW 40,615 kW 30,379 kW 30,424 kW 30,429 kW
HP Steam Consumers
1st & 2nd SRU Reheaters 7,376 kW 7,210 kW 7,604 kW 7,638 kW 7,678 kW
3rd SRU Reheater 2,352 kW 1,350 kW N/A N/A N/A
TGTU Reactor Preheater N/A N/A 4,382 kW 4,401 kW 4,423 kW
LP/LLP Steam Producers
1st & 2nd Sulphur Condensers 19,544 kW 19,620 kW 20,255 kW 20,353 kW 20,431 kW
3rd Sulphur Condenser 4,954 kW 4,092 kW 5,282 kW 5,307 kW 5,329 kW
4th Sulphur Condenser 2,677 kW 4,185 kW N/A N/A N/A
TGTU Hydrogenation WHE N/A N/A 3,592 kW 3,609 kW 3,622 kW
LP Steam Consumers
Regenerator Reboiler N/A N/A 12,266 kW 18,610 kW 86,820 kW
Net Energy Balance
66,228 kW produced
65,082 kW produced
49,896 kW produced
42,795 kW produced
25,892 kW consumed
IMPACT OF SULPHUR RECOVERY FACILITIES ON GLOBAL SO2 & CO2 EMISSIONS While SO2 emissions have an immediate impact near the pollution source, it is believed that CO2 is more likely to have long-term effects on the global environment. Thus, local communities have strong incentives to reduce SO2 emissions from SRUs in oil and gas operating facilities but CO2 emissions are still not regulated in most parts of the world. For this reason, SO2 and CO2 emissions from sulphur recovery facilities will be explored on both a global and regional basis. Figure 11 illustrates SO2 and CO2 emissions from the hypothetical SRU for each of the cases described above. CO2 in flue gas is shown, along with a net equivalent CO2 value that is calculated based on the information provided in Table 3 (see Appendix for net CO2 equivalent calculation methodology). Because a sulphur recovery facility is normally an energy exporter, net CO2 equivalent is lower than the actual CO2 value in the flue gas for all except Case E. It is important to remember that the TGTU for the WBS case (Case E) utilizes generic MDEA, rather than a highly selective solvent. The use of proprietary selective solvents will be discussed later in this paper.

13
Figure 11. SO2 and CO2 Emissions from Hypothetical Sulphur Recovery Facility
As shown in Figure 11, SO2 emissions decrease substantially from Case A to D, while net CO2 emissions only increase by about 20%. However, in increasing sulphur recovery from Case D to the WBS specification, there is only a very minor decrease in SO2 emissions with a significant corresponding CO2 increase of more than 50%. The dramatic increase in CO2 emissions for only a marginal decrease in SO2 emissions can be more clearly illustrated with the correlations provided below. When increasing SRE from 99.0% to 99.9%:
Every 1 ton of SO2 reduction results in 5 tons of CO2 emissions, or
Every 1 ton of S reduction results in 10 tons of CO2 emissions When increasing SRE from 99.9% to 150 mg/Nm3 (99.98%):
Every 1 ton of SO2 reduction results in 240 tons of CO2 emissions, or
Every 1 ton of S reduction results in 480 tons of CO2 emissions The impact of increasing SRE to ultra-high values, in excess of 99.9%, clearly has a significant impact on energy consumption and CO2 emissions, which begs the question as to whether the minor SO2 reduction benefit is justified. This question can be addressed by looking at how the above figures for a single sulphur recovery train translate to the global SO2 and CO2 landscape. To do this, it is first necessary to review current world sulphur production figures so that the hypothetical sulphur recovery facility can be scaled up accordingly.

14
As shown in Figures 12 and 13, world elemental sulphur production in 2013 was approximately 54.3 million tons. The roughly equivalent split between sulphur from oil and natural gas validates the previous premise of 60 mol% H2S in the acid gas. Thus, the hypothetical SRU provides a reasonable basis for predicting emissions from SRUs worldwide.
Figure 12. World Production of Sulphur in All Forms (SAF) in 2013, by Source
Figure 13. World Production of Elemental Sulphur in 2013, by Source

15
Scaling up from the 1,000 hypothetical sulphur plant to a global production of 54.3 MMTPA gives SO2 and equivalent CO2 emissions (as % of world totals) as shown in Figure 14.
Figure 14. Global Contribution to SO2 and CO2 Emissions from SRUs Worldwide
Assuming a world average sulphur recovery efficiency in the range of 99.5 – 99.9%, Figure 14 illustrates that sulphur recovery facilities contribute somewhere around 0.3% of global SO2 emissions and less than 0.1% of global CO2 emissions. Increasing recovery efficiency from 99.3% to 99.9% with an amine based TGTU (Case C to Case D) only very slightly increases CO2 emissions but substantially reduces SO2 emissions. For this reason, if amine-based tail gas treating is employed, it is certainly worthwhile to design for at least 99.9% SRE, from both an energy efficiency and CO2 footprint perspective. Similar to what was observed in Figure 11, increasing SRE to greater than 99.9% achieves little benefit with respect to SO2 emissions but has a significant detrimental impact on CO2 emissions. Table 4 provides tabulated data from Figure 14, as well as SO2 and CO2 emission data for the most significant sulphur producing regions in the world. The range of actual emissions contributed by local SRUs is shaded, based upon assumed average SRE for sulphur recovery facilities in that particular region.

16
Table 4. SO2 and CO2 Emissions from Global Sulphur Recovery Facilities in 2013
World North
America Russia & FSU
Middle East
China
Elemental Sulphur Production
MMTPA 54.3 15 11 9 7
MTPD 148,767 41,096 30,137 24,658 19,178
SO2 Emissions from all SRUs (MMTPA)
If 97% SRE 3.24 0.90 0.66 0.54 0.42
If 99.0% SRE 1.08 0.30 0.22 0.18 0.14
If 99.3% SRE 0.75 0.21 0.15 0.13 0.10
If 99.9% SRE 0.10 0.03 0.02 0.02 0.01
If 150 mg/Nm3 SO2 0.02 0.01 0.005 0.004 0.003
Anthropogenic SO2 from all Sources (MMTPA) 120 15.1 10.0 5.5 32.7
SRUs Contribution to Total Global or Regional SO2 Emissions
If 97% SRE 2.70% 5.93% 6.57% 9.77% 1.28%
If 99.0% SRE 0.90% 1.98% 2.19% 3.26% 0.43%
If 99.3% SRE 0.63% 1.38% 1.53% 2.27% 0.30%
If 99.9% SRE 0.09% 0.19% 0.21% 0.31% 0.04%
If 150 mg/Nm3 SO2 0.02% 0.04% 0.05% 0.07% 0.01%
CO2 Emissions from all SRUs (MMTPA)
If 97% SRE 30.5 8.4 6.2 5.0 3.9
If 99.0% SRE 31.5 8.7 6.4 5.2 4.1
If 99.3% SRE 34.0 9.4 6.9 5.6 4.4
If 99.9% SRE 36.3 10.0 7.4 6.0 4.7
If 150 mg/Nm3 SO2 55.5 15.3 11.2 9.2 7.2
Anthropogenic CO2 from all Sources (MMTPA) 36,000 5,900 2,250 2,200 8,300
SRUs Contribution to Total Global or Regional CO2 Emissions
If 97% SRE 0.08% 0.14% 0.27% 0.23% 0.05%
If 99.0% SRE 0.09% 0.15% 0.28% 0.24% 0.05%
If 99.3% SRE 0.09% 0.16% 0.31% 0.26% 0.05%
If 99.9% SRE 0.10% 0.17% 0.33% 0.27% 0.06%
If 150 mg/Nm3 SO2 0.15% 0.26% 0.50% 0.42% 0.09%
As would be expected, SRUs located in some of the world’s most significant sulphur-producing regions contribute a greater percentage to regional SO2 and CO2 emissions than the world average, due to a high level of industrial activity in those locations. For example, contribution from Middle Eastern SRUs to local SO2 emissions is in the range of 2-3%, an order of magnitude greater than the contribution of all SRUs to the world average. Middle Eastern SRUs contribute greater than 0.2% of local CO2 emissions, approximately double the world average. China is an exception, with a lower contribution of SO2 and CO2 emissions from sulphur recovery facilities, which results from the large quantities of these pollutants emitted from coal-fired power plants. When compared to the world average, North American SRUs have a less significant impact on local SO2 emissions due to relatively high recovery efficiency requirements in the region.

17
POSSIBILITIES FOR REDUCING CO2 FOOTPRINT OF SRUs As demonstrated above, sulphur recovery facilities do not contribute a great deal to global CO2 emissions. However, in large facilities with stringent SO2 emissions specifications, it is still advantageous to minimize the quantity of CO2 emitted for every ton of SO2 removed. This is because, in addition to designing and/or operating an environmentally responsible facility, a reduction in carbon footprint also provides an improvement in energy efficiency, which translates to reduced operating cost. Some potential measures that might be considered to achieve these objectives are described below. Incinerator Operating Temperature As described above, the hypothetical sulphur plant examined in this paper has an incinerator operating temperature of 815oC, which is higher than the temperature required by most SRUs. Such a temperature would only be required when the total reduced sulphur (TRS) specification in the stack gas is extremely low (<5 mg/Nm3). Incinerator operating temperature can be optimized, depending upon various stack emission specifications. This topic is explored in detail in a paper by Sulphur Experts,3 which concludes that a range of temperatures from 650oC to 815oC may be acceptable, depending on local environmental regulations. Table 5 and Figures 15 and 16 illustrate the CO2 impact of reducing incinerator operating temperature from 815oC to 650oC, which is the minimum temperature required for H2S oxidation. Figures 15 and 16 illustrate only the CO2 footprint of the incineration system and not the entire SRU/TGTU, e.g. equivalent CO2 for: fuel consumed in burner, plus power consumed by blowers, minus HP steam produced. Figure 15 considers the employment of an incinerator WHB (as per the hypothetical SRU design) and Figure 16 considers incinerator operation without any form of waste heat recovery. Table 5. Hypothetical Sulphur Plant (99.9% SRE) – Impact of Incinerator Operating Temperature
815oC Incinerator 760oC Incinerator 650oC Incinerator
Incinerator Stack Gas Composition
mol% kmol/hr mol% kmol/hr mol% kmol/hr
O2 2.00% 123.72 2.00% 117.70 2.00% 107.38
N2 71.45% 4421.84 71.54% 4211.62 71.70% 3851.56
CO2 13.75% 850.63 14.02% 825.45 14.56% 782.30
SO2 200 ppmv 1.24 211 ppmv 1.24 231 ppmv 1.24
H2O 12.78 790.93 12.42% 731.24 11.71 629.01
Total 100% 6188.37 100% 5887.24 100% 5371.50
Key Incinerator Process Parameters Fuel Gas Consumption (Nm3/hr)
3,789 3,256 2,344
Combustion Air (kmol/hr)
2,600 2,324 1,850
HP Steam Production (kg/hr)
39,111 32,933 22,345

18
Figure 15. Impact of Varying Incinerator Operating Temperature on Hypothetical SRU w/ WHB
Figure 16. Impact of Varying Incinerator Operating Temperature on Hypothetical SRU w/o WHB

19
Figure 15 shows that when an incinerator WHB is employed, higher operating temperature is actually advantageous in terms of both energy efficiency and CO2 footprint. This is due to the higher temperature driving force in the WHB, which increases efficiency of steam production. Figure 16 shows that when a WHB is not employed, the opposite is true; energy efficiency and CO2 footprint are negatively impacted as operating temperature is increased. It is interesting to note that when an incinerator WHB is employed, the incineration system for the Claus SRU (Case A) becomes a net energy exporter with a negative CO2 footprint, due to the heating value of the H2S in the tail gas. For a sub-dewpoint or direct oxidation unit (Case B), with lower H2S concentration in the tail gas, the system is essentially energy and CO2 neutral. For amine-based tail gas treating systems, H2S content in the tail gas is low enough that the incineration system is a net energy consumer. As illustrated in Figure 16, with no WHB the incineration system is always a net energy consumer, regardless of H2S content in the tail gas, because none of the waste heat is recovered. Employment of Incinerator WHB Comparing Figures 15 and 16, it is evident that inclusion of a WHB to recover waste heat from an SRU incinerator is highly advantageous in terms of energy efficiency. Equivalent CO2 emissions are an order of magnitude greater when waste heat recovery is not employed. Thus, in general, incinerator WHBs should be considered to optimize the energy efficiency of new SRU designs. It is important to note that the efficiency of such systems is limited by the minimum allowable stack gas temperature, which is dictated by the acid dewpoint in this stream. The acid dewpoint is dependent upon the sulphur recovery efficiency of the facility; however, the TGTU bypass scenario will always dictate the maximum acid dewpoint that can be experienced in an off-design operating scenario. A typical minimum incinerator WHB outlet temperature is 315 - 350oC, although this value may be increased for large facilities and/or in cold climates where heat losses in the stack can be substantial. During turndown conditions, the WHB outlet temperature will be lower than the design value and this must be taken into account when ensuring that the stack temperature is always maintained above the acid dewpoint. Sulphur Pit Vent Recycle to SRU Reaction Furnace In many sulphur recovery facilities, sulphur pit vent and/or degassing vent streams are routed to the incinerator, where H2S in the streams is oxidized to SO2, directly impacting emissions. As an alternative, these streams can be recycled to the reaction furnace in the SRU where most of the H2S can be recovered as elemental sulfur, significantly reducing emissions. Table 6 shows the SO2 emissions impact of routing the degassing vent to the incinerator versus to the front end of the SRU and illustrates the huge benefits associated with recycle, especially as recovery efficiency requirements increase.5

20
Table 6. Contribution of Degassing Vent to Total SRU SO2 Emissions5
Sulphur Recovery Efficiency
Degassing Vent - % of Total Stack SO2 Emissions, When Routed to:
Incinerator Front of SRU
95% SRE 0.5% 0.03%
97% SRE 0.9% 0.03%
99% SRE 2.7% 0.03%
99.9% SRE 22.0% 0.03%
Such a substantial reduction in SO2 emissions can be accomplished at very little cost, in terms of CapEx, OpEx and CO2 footprint, as this is typically achieved via employment of a steam ejector which utilizes medium pressure for motive force. Thus, routing sulphur degassing vapors to the front end of the SRU should be considered as a first course of action to reduce SO2 emissions, prior to the consideration of tail gas treating options that would have a considerable impact on the facility’s energy balance and CO2 footprint. It should be noted that there are many critical safety and reliability considerations which must be taken into account when determining the location for sulphur degassing vent recycle into the front of the SRU. These considerations are discussed at length in the literature5 and will not be addressed further in this paper. Selective Solvents for Tail Gas Treating When a particular sulphur recovery application calls for ultra-high recovery efficiency (99.9%+), it is typically prudent to consider TGTU solvents which are highly selective to H2S. This is because these types of solvents reduce amine circulation rate and regeneration energy requirements due to their ability to slip a greater percentage of the CO2 in the tail gas. A recent study4 demonstrated that amine circulation rate and associated regeneration steam required for one particular proprietary solvent is roughly 50% of that required for MDEA under the same operating conditions.
Table 3 shows that the MDEA circulation rate for Case E is approximately four times that required for Case D. With the employment of a selective proprietary solvent, Case E SO2 emissions can be achieved at approximately 50% of the MDEA circulation rate, cutting the reboiler energy consumption in half. This would convert the facility into a net energy exporter, rather than consumer, with overall net energy balance of approximately 18,000 kW (produced) instead of 26,000 kW (consumed). This would result in a CO2 emissions reduction of approximately 25%. Thus, for ultra-high recovery efficiency, selective solvents should be seriously considered to achieve the optimum solution, in terms of CapEx, OpEx and CO2 footprint. Acid Gas Injection Acid gas injection (AGI) schemes are employed in some sour gas processing facilities to avoid sulphur production in relatively remote regions where sulphur handling logistics would be difficult and/or where extremely sour gas would result in enormous quantities of elemental sulphur production. Other than the CO2 that leaves with the sales gas, the injected acid gas

21
stream contains all of the CO2 in the raw gas. Thus, injecting acid gas back into the reservoir, rather than routing it through a sulphur recovery unit, will completely eliminate CO2 emissions from the process plant. Equivalent CO2 emissions associated with AGI power consumption would need to be considered, which is dependent upon the quantity of acid gas and reservoir injection pressure. However, given that CO2 in the raw gas makes up the majority of CO2 emissions from the facility (as shown in Figure 11), it is likely that acid gas injection would result in an overall carbon footprint reduction for a sour gas processing facility. It is important to note that AGI schemes require numerous HSE considerations due to the high H2S partial pressures which result from compressing acid gas to the elevated pressures required for injection into a reservoir. Depending on the reservoir and acid gas conditions, AGI may not be feasible in some cases. In summary, to optimize energy efficiency and minimize CO2 footprint of a new sulphur recovery facility, all of the above options should be evaluated. Existing facilities may consider optimizing incinerator operating temperature, routing degassing vapors to the front of the SRU and/or carrying out a TGTU solvent swap. However, the revamp of an incinerator to include waste heat recovery and/or implementation of AGI in an existing facility would be more complex options that may not be feasible. CO2 RECOVERY FROM SULPHUR RECOVERY FACILITIES – IS IT VIABLE? Because sulphur recovery units are typically energy exporters, they are actually quite responsible facilities in terms of environmental carbon impact. As a result, SRUs around the world contribute only a tiny fraction to global CO2 emissions. However, there remains interest in certain parts of the world to capture CO2 from these types of facilities. One may ask what the drivers might be. Two primary possibilities are described below. Enhanced Oil Recovery CO2 injection into partially depleted oil reservoirs has been widely accepted as an effective technique for enhanced oil recovery (EOR) for over 40 years. It is estimated that approximately 80% of the world’s reservoirs could qualify for some level of CO2 injection.6 If there is one region where EOR has the potential to be optimized and implemented on a large scale, it is likely to be the Middle East. In particular, the UAE is among the highest in the world in carbon dioxide emissions per capita and is also one of the world’s top oil producing nations. The combination of these factors would incentivize the capture of CO2 from refinery and sour gas plant SRUs for EOR. Most gas processing facilities in the region are quite large (1 BSCFD and greater) and CO2 content in the raw gas feed is substantial, potentially making them attractive candidates for CO2 capture. Improved Acid Gas Quality Sour gas processing facilities often produce acid gas with low H2S concentration, which is referred to as “lean acid gas.” Lean acid gas feed to an SRU can be problematic due to low reaction furnace temperature and a tendency for flame instability. Removing CO2 from the acid gas benefits the SRU in several ways. Higher H2S content increases reaction furnace temperature, which improves flame stability and enhances contaminant destruction. Lower CO2

22
content reduces volumetric flow through the entire SRU/TGTU, reducing the size of equipment in the case of a new facility, or providing the opportunity to debottleneck an existing unit. CO2 removal upstream of the SRU can be achieved via two principal methods:
Selective sour gas treating, followed by CO2 removal downstream
Bulk sour gas treating, followed by acid gas enrichment In either case, CO2 in the raw gas from the reservoir is removed from the acid gas that flows to the SRU. The CO2 stream may be routed to the incinerator (for subsequent emission to the atmosphere) or captured for further use, such as EOR. Methods for CO2 Capture When it comes to capturing CO2 from SRUs in sour gas treating facilities or refineries, there are 3 basic options: 1. From sour gas - As described above, where CO2 is captured upstream of the SRU/TGTU and
does not flow through the units. 2. From TGTU – CO2 is captured downstream of the low pressure TGTU absorber after flowing
through the SRU and TGTU, and the benefits described above are not realized. 3. Post Combustion – CO2 is captured downstream of the SRU/TGTU incinerator, after flowing
through the SRU/TGTU. Although the benefits of CO2 removal from acid gas are not realized, CO2 concentration is higher at this point in the process due to additional CO2 produced in the combustion reactions in the incinerator.
Generally speaking, option 1 is the most attractive means of capturing CO2 due to high operating pressure, which increases CO2 partial pressure and improves capture efficiency. This type of process would typically emit less than 1 ton of CO2 equivalent for every 10 tons of CO2 captured. Although operated at low pressure, Option 3 would typically be the next best option due to higher CO2 partial pressure than option 2. This is because CO2 formed in the combustion of natural gas in the incinerator increases its partial pressure, as well as increasing the total quantity of CO2 available for capture. This type of process would typically emit 1-2 tons of CO2 equivalent for every 10 tons of CO2 captured. Option 2 is typically the least attractive option due to lowest CO2 partial pressure. For this type of process, equivalent CO2 emission can exceed 5 tons of CO2 for every 10 tons of CO2 captured, depending on the solvent selection and process scheme employed. SUMMARY & CONCLUSIONS Revisiting the questions posed at the outset of the study gleans the following conclusions. 1. How does increasing SRE positively impact global SO2 emissions? Although SO2 emissions from sulphur recovery facilities contribute less than 5% of the global total, a significant positive impact is observed as SRE approaches 99.9%. Above 99.9%, energy consumption increases drastically for very little reduction in SO2 emissions. Even when proprietary, highly-selective solvents are employed, there is a significant energy increase required to achieve the WBS emission standard (99.98% SRE). Therefore, it is questionable whether there is good reason to consider SO2 emissions specifications in excess of 99.9%.

23
Possible exceptions may be the case of very large sulphur recovery facilities that would have substantial SO2 point source emission rates (ton per day basis) and/or facilities that are located in environmentally sensitive regions. Additionally, there may be opportunities to relax SRE requirements below 99.9% for smaller SRUs (<50 MTPD), which have only a minor point-source emission impact, even at lower SRE. This philosophy has already been adopted in some parts of the world.
2. What is the corresponding negative impact on global CO2 emissions? The study revealed that sulphur recovery facilities have an essentially inconsequential impact on global CO2 emissions. However, it would be irresponsible to unnecessarily increase the carbon footprint of the facility by not enhancing the design via the use of selective solvents, optimized incinerator design/operation or perhaps even considering acid gas injection rather than sulphur recovery. Implementing such measures would also improve energy efficiency of the facility, thereby improving overall project economics.
3. Is CO2 capture from SRUs a viable proposition? The study demonstrated that it is generally preferable to optimize the design of a sulphur recovery facility to minimize its carbon footprint rather than to incur costs associated with capturing CO2 from this source. However, some parts of the world requiring EOR may have different incentives/drivers which would make CO2 capture from sour gas processing facilities attractive. Also, in some sulphur-critical regions of the world (e.g. Middle East, Russia/FSU), sulphur plants can be extremely large in size and contribute a higher percentage to regional CO2 emissions, potentially increasing their environmental responsibility to consider CO2 capture. Although CO2 capture from power generation facilities is likely to have a greater impact on global emissions, there is often resistance toward the use of amines in these types of facilities due to lack of experience. Oil and gas processing facilities which are intimately familiar with these types of processes may therefore be more likely to consider their employment. In closing, although it is not the intent of this paper to comment on the general state of world SO2 and CO2 emissions, China’s recent surge is striking and cannot be ignored. Unfortunately, as this paper has illustrated, reduced emissions from oil and gas production facilities will not solve this growing concern. Instead, the focus will need to be directed toward power generation facilities, as already demonstrated by some western countries that have successfully begun to reduce their environmental impact by reversing the trajectory of SO2 and CO2 emissions.

24
NOMENCLATURE °C degrees Celsius mg milligram AGI acid gas injection MMT million metric tons barg bar gauge MMTPA million metric tons per annum BSCFD billion standard cubic feet per day mol% mole percent CapEx capital expenditure MTPD metric tons per day CBA Cold Bed Adsorption N2 nitrogen CO2 carbon dioxide Nm3 normal cubic meters EOR enhanced oil recovery O2 oxygen FSU Former Soviet Union OpEx operating expense Gg gigagram ppmv parts per million by volume H2O water RF reaction furnace H2S hydrogen sulphide S sulphur HP high pressure SAF sulphur in all forms hr hour SO2 sulphur dioxide HSE health, safety and environment SRE sulphur recovery efficiency kcal kilocalorie SRU sulphur recovery unit kg kilogram TGTU tail gas treating unit kmol kilomole TRS total reduced sulphur kW kilowatt UAE United Arab Emirates LHV lower heating value WBS World Bank Standard LLP low pressure WHB waste heat boiler LP low pressure WHE waste heat exchanger REFERENCES 1. Smith, S. J., van Aardenne, J., Klimont, Z., Andres, R. J., Volke, A. and Delgrado Arias, S.,
“Anthropogenic Sulfur Dioxide Emissions: 1850 – 2005,” Atmospheric Chemistry and Physics, 11:1101-1116, 2011.
2. Friedrich, Johannes and Damassa, Thomas, “The History of Carbon Dioxide Emissions,” World Resources Institute Blog, May 21, 2014.
3. Sames, J., Wakelin, A. and Kiebert, J., “Visible Plume Abatement, GHG Emissions & Energy
Conservation – A Balancing Act,” Sulphur 2012 International Conference & Exhibition, October 2012, Berlin, Germany.
4. Slavens, A. and Aikins, T., “FLEXSORB®-SE Solvent – A Guide for Deployment in the Right Applications,” SOGAT 2012, March 2012, Abu Dhabi, UAE.
5. Slavens, A., Tonjes, M. and Stevens, D., “Best Practices for Recovering Elemental Sulphur from Sulphur Pit Vent Gases,” Sulphur Magazine – Issue 308, January / February 2007.
6. Al Wahedi, F. S. A. A. and Dadach, Z. E., “Cost Effective Strategies to Reduce CO2 Emissions in
the UAE: A Literature Review,” Journal of Industrial Engineering and Management, Volume 2, Issue 4, June 2013.

25
APPENDIX Methodology for Calculating Equivalent CO2 Emissions from Fuel, Electricity and Steam Consumption and/or Production The combustion of fuel for direct heating applications, or for generating electricity and/or steam, results in the production of carbon dioxide, CO2. Due to their varying energy densities, the equivalent amount of CO2 emitted by each of the activities listed above – otherwise known as the CO2 emissions factor – will depend on the type of fuel used. For this study, natural gas is selected as the fuel of choice and it is assumed to have a composition of 100% methane, CH4. Emissions factors are reported in terms of kilograms of CO2 produced per kilowatt-hour of heat energy, electricity or steam generated (kg CO2/kWh). CO2 Emissions Factor for Direct Combustion of Natural Gas The reaction equation for the complete combustion of methane is,
CH4 + 2O2 CO2 + 2H2O and its enthalpy of combustion at standard conditions is approximately 55.5 MJ/kg. The complete combustion of 1 kg or 62.3 moles of CH4 (molar mass of 16.04 g/mol) will produce 62.3 moles or 2.74 kg of CO2 (molar mass of 44.01 g/mol). Therefore, 2.74 kg of CO2 are emitted for every 55.5 MJ of heat energy released, which is equivalent to 0.18 kg CO2/kWh of heat energy. CO2 Emissions Factor for Steam Generation from Natural Gas Natural gas can be burned in the furnace of a boiler to generate heat that is then used to boil water to produce saturated steam. However, not all of the heat that could theoretically be generated from combustion is released and not all of the heat that is generated is effectively transferred to the water. A typical steam boiler has an efficiency of about 85%, i.e. for every 1 kWh of heat energy, only 0.85 kWh of steam energy is produced. It is assumed that the boiler efficiency is the same for both low pressure and high pressure steam production. Given that 0.18 kg of CO2 are produced per kWh of heat energy from natural gas combustion,
0.18 𝑘𝑔 𝐶𝑂2
𝑘𝑊ℎ 𝑜𝑓 ℎ𝑒𝑎𝑡 𝑒𝑛𝑒𝑟𝑔𝑦
0.85 𝑘𝑊ℎ 𝑜𝑓 𝑠𝑡𝑒𝑎𝑚 𝑒𝑛𝑒𝑟𝑔𝑦𝑘𝑊ℎ 𝑜𝑓 ℎ𝑒𝑎𝑡 𝑒𝑛𝑒𝑟𝑔𝑦
= 0.21 𝑘𝑔 𝐶𝑂2
𝑘𝑊ℎ 𝑜𝑓 𝑠𝑡𝑒𝑎𝑚 𝑒𝑛𝑒𝑟𝑔𝑦
the emissions factor for steam generation is approximately 0.21 kg CO2/kWh of steam energy.

26
CO2 Emissions Factor for Electricity Generation from Natural Gas For this study, it is assumed that electricity is generated in a steam-electric power station. In this case, natural gas is burned to produce heat to convert water to steam, which in turn spins a steam turbine to generate electricity. The electrical efficiency of a conventional steam-electric power station fueled by natural gas is 33%, i.e. for every 1 kWh of heat energy, only 0.33 kWh of electrical energy is produced. Given that 0.18 kg of CO2 are produced per kWh of heat energy from natural gas combustion,
0.18 𝑘𝑔 𝐶𝑂2
𝑘𝑊ℎ 𝑜𝑓 ℎ𝑒𝑎𝑡 𝑒𝑛𝑒𝑟𝑔𝑦
0.33 𝑘𝑊ℎ 𝑜𝑓 𝑒𝑙𝑒𝑐𝑡𝑟𝑖𝑐𝑎𝑙 𝑒𝑛𝑒𝑟𝑔𝑦
𝑘𝑊ℎ 𝑜𝑓 ℎ𝑒𝑎𝑡 𝑒𝑛𝑒𝑟𝑔𝑦
= 0.55 𝑘𝑔 𝐶𝑂2
𝑘𝑊ℎ 𝑜𝑓 𝑒𝑙𝑒𝑐𝑡𝑟𝑖𝑐𝑎𝑙 𝑒𝑛𝑒𝑟𝑔𝑦
the emissions factor for electricity generation is approximately 0.55 kg CO2/kWh of electrical energy. Calculating Equivalent CO2 Emissions The amount of CO2 emitted from any of the above activities is calculated by simply multiplying the corresponding emissions factor by the amount of energy generated. For example, if the Claus Air Blower consumes electricity at a rate of 100 kW,
100 𝑘𝑊 ∗ 24 𝑘𝑊ℎ
𝑘𝑊 ∙ 𝑑𝑎𝑦∗ 0.55
𝑘𝑔 𝐶𝑂2
𝑘𝑊ℎ 𝑜𝑓 𝑒𝑙𝑒𝑐𝑡𝑟𝑖𝑐𝑎𝑙 𝑒𝑛𝑒𝑟𝑔𝑦∗
1 𝑡𝑜𝑛𝑛𝑒
1000 𝑘𝑔= 1.32 𝑇𝑃𝐷 𝐶𝑂2
it is associated with an equivalent emission of 1.32 tons per day of CO2. Some processes in the sulphur recovery unit produce steam as a byproduct that can be used elsewhere in the gas plant or refinery, lowering the load on the facility’s steam boiler. As a result, less fuel needs to be burned and less CO2 is consequently emitted. This ‘savings’ in CO2 emissions can also be calculated as shown above. For example, if the SRU waste heat boiler produces steam with a duty of 2500 kW,
2500 𝑘𝑊 ∗ 24 𝑘𝑊ℎ
𝑘𝑊 ∙ 𝑑𝑎𝑦∗ 0.21
𝑘𝑔 𝐶𝑂2
𝑘𝑊ℎ 𝑜𝑓 𝑠𝑡𝑒𝑎𝑚 𝑒𝑛𝑒𝑟𝑔𝑦∗
1 𝑡𝑜𝑛𝑛𝑒
1000 𝑘𝑔= 12.6 𝑇𝑃𝐷 𝐶𝑂2
it saves the plant from emitting an equivalent of 12.6 tons per day of CO2.