dynamic correlation analysis of us financial crisis and ... · goldfajn, 1999) focuses on providing...
TRANSCRIPT
OC12062
1
Dynamic Correlation Analysis of US Financial Crisis and Contagion:
Evidence from Four OECD countries
Hong-Ghi Mina
Department of Management Science, Korea Advanced Institute of Science and Technology,
and
Young-Soon Hwang
Busan Development Institute
This version: 9 September 2011
________________________________________________________________ a
Correspondence: E-mail: [email protected] Tel:+82-42-350-6305, Fax:+82-42-350-6339.

OC12062
2
Dynamic Correlation Analysis of US Financial Crisis and Contagion:
Evidence from Four OECD countries
This version: 9 September 2011
Abstract
By analyzing the dynamic conditional correlations (DCC) of the daily stock returns of four OECD countries with that of the US for the period of 2006-2010, we could find a process of increasing correlations (contagion) in the first phase of the US financial crisis and an additional increase of correlations (herding) during the second phase of the US financial crisis for the UK, Australia, and Switzerland. However, the impact of the US financial crisis on Japan was limited to the increase in correlation volatilities in the first phase. We also propose a new approach (DCCX-MGARCH) that allows simultaneous estimation of the DCC and their determinants, which can be used to identify channels of contagion. It is shown that an increase in VIX stock market index increases conditional correlations but an increase in the TED spread and relative stock market capitalization decrease conditional correlations of stock returns between four OECD countries and the US.
JEL classification: F31, G15
Keywords: DCCX-MGARCH, Dynamic conditional correlations, contagion, US financial
crisis, VIX index, TED spread.

OC12062
3
I. Introduction
At the beginning of the US financial crisis, which began with the failure of Lehmann
Brothers in September 2008, some economists expected that the decoupling of financial
markets could isolate the adverse impact of the US recession on the rest of the world.
However, many studies report contagion of emerging markets (Beirne et al., 2008; Dooley
and Hutchison, 2009; Kim and Kim, 2011) and advanced markets (Boyson et al., 2010;
Christensen and Ronaldo, 2010; Chudick and Fratzscher, 2011) from the US financial crisis.
Even though identifying the nature of financial market contagion is extremely
important, previous studies failed to reach a consensus on the existence of contagion with the
earlier financial crisis episodes. Forbes and Rigobon (2002) argue that most of previous
evidence of contagion (King and Wadhwani, 1990; Lee and Kim, 1993; Calvo and Reinhart,
1996) disappears when unconditional cross-market correlation coefficients are corrected for
bias. However, Corsetti et al. (2005) show that Forbes and Rigobon’s test is biased towards
the null hypothesis of no contagion and report “some contagion, some interdependence.” In
other words, for proper investigation of stock market comovement (contagion), we need to
consider heteroscedasticity and the dynamic nature of the correlations.
In this paper, we investigate the transmission of the recent US financial crisis to stock
markets in four OECD countries. In particular, we are interested in (i) finding empirical
evidence of contagion from the US stock market to those of the four OECD countries and (ii)
analyzing two phases of crisis transmission, i.e., contagion and herding. Most importantly, we
are interested in finding the channels of the transmission mechanism. To answer the first two
questions, we use Engle’s (2002) dynamic conditional correlation multivariate GARCH
(DCC-MGARCH) model. To answer the third question, we propose a new DCC-MGARCH
type model with exogenous variables (DCCX-MGARCH). This methodology can estimate

OC12062
4
both the dynamic conditional correlation and the impact of explanatory variables
simultaneously in one framework. The DCCX-MGARCH method can be useful in
identifying the channels of contagion in the stock returns of four OECD countries (United
Kingdom, Japan, Switzerland, and Australia) and that of the US. In other words, our DCCX-
MGARCH model is different from previous models in that ours can directly estimate the
effects of exogenous variables on the conditional correlations.
A number of variables can be considered important for the determination of dynamic
conditional correlations of stock returns. We include the daily sovereign CDS spread, the
VIX index, the relative stock market capitalization to the US, and the TED spread. We
include the CDS spread as a measure of the sovereign risk of each country. The VIX implied
volatility is a proxy for stock market uncertainty (Connolly et al., 2005), and it is a widely
used measure of investor fear. The TED spread is the difference between the three-month
LIBOR and the yield on the US Treasury bills with the same maturity. The TED spread is
used as a measure for the level of financial stress in the interbank market. Brunnermeier
(2009) shows that the TED spread provides a useful basis for gauging the severity of the
liquidity crisis. Finally, the ratio of stock market capitalization relative to the US is included
in the analysis as a measure of the financial independence from the US.
This paper is organized as follows. Section II reviews previous literature related to our
research questions. In Section III, we estimate the dynamic conditional correlations of four
OECD countries’ stock return with the US stock return and provide empirical evidence of
two phases (contagion and herding) of the US financial crisis on the conditional correlations
of four OECD countries. Section IV investigates the determinants of conditional correlations
using the DCCX-MGARCH model, and Section V concludes the paper.

OC12062
5
II. Literature
Studies on stock market comovement (contagion) can be grouped into three different
groups. The first group of studies (King and Wadhwani, 1990; Lee and Kim, 1993; Baig and
Goldfajn, 1999) focuses on providing evidence of a significant increase in cross-country
unconditional correlations of stock returns by employing a subsample analysis for a structural
break, with a known structural break date. However, several studies (Forbes and Rigobon,
2002; Bordo and Murshid, 2001; Basu, 2002) argue that there is no significant increase in
stock return correlations when they account for heteroscedasticity. Corsetti et al. (2005),
Froot et al. (2001) and Basu (2002) confirm the existence of the contagion effect, making the
evidence on the financial contagion inconclusive.
The second group of studies (Hamao et al., 1990; Kanas, 1998; Kim et al., 2006; Chiang
et al., 2007; Ng, 2000, Beirne et al., 2008; Frank and Hesse, 2009) utilizes a multivariate
GARCH model to account for heteroscedasticity and the dynamic nature of the correlations.
First of all, Hamao et al. (1990) utilizes the ARCH family of statistical models and report a
price volatility spillover effect among three major international stock markets. In a similar
vein, Kanas (1998), using the EGARCH model, shows reciprocal spillover effects in the
European equity markets, and Ng (2000), using multivariate GARCH model, shows that
Pacific-Basin stock markets are driven by a regional shock from Japan and a global shock
from the US. On the other hand, Connolly et al. (2005) and Kim et al. (2006) investigate the
international stock-bond return relation and report that stock market uncertainty has
important cross-market pricing influences. Furthermore, Chiang et al. (2007) investigate the
financial contagion of Asian markets during the Asian financial crisis using dynamic
correlations analysis and report evidence of contagion in this area. Finally, Frank and Hesse
(2009) use a multivariate GARCH model to investigate the extent of comovements of

OC12062
6
financial variables across markets and report that inter-linkages between funding stress and
equity markets in advanced economies and emerging market financial indicators increase
sharply during specific crisis moments. Our methodology can be classified into this second
group since we use the multivariate GARCH model to estimate dynamic conditional
correlations between the stock returns of the four OECD countries with that of the US.
The third group of studies (Bracker et al., 1999; Johnson and Soenen, 2003; Connoly et
al., 2007; Baele et al., 2009; Norden and Weber, 2009) have tried to find determinants of
stock market comovements. While Bracker et al. (1999) show that measures of bilateral
import dependence and the size deferential across markets are important determinants of
stock market integration, Johnson and Soenen (2003) report that a high share of trade with the
US has a strong positive impact on stock market comovements but that increased bilateral
exchange rate volatility and a higher ratio of stock market capitalization relative to US
contribute to lower comovement in Americas. On the other hand, Connolly et al. (2007) find
that cross-country stock return comovements tend to be stronger following high implied
volatility days. Finally, Norden and Weber (2009) investigate the comovement of credit-
default swap, bond and stock markets during 2000-2002 and they report that stock returns
lead CDS and positive stock returns are associated with negative CDS spread changes. While
the third group of studies identified a number of fundamentals that determine the
comovements of stock markets, they failed to establish a relationship between dynamic
conditional correlations and those fundamentals.
In our analysis of the DCCX-MGARCH model, we simultaneously estimate dynamic
conditional correlations and the impact of exogenous variables over time, which can be used
to identify channels of contagion.
III. The dynamic conditional correlation model

OC12062
7
3.1. The DCC-MGARCH Model
We use the dynamic conditional correlation (DCC) estimator proposed by Engle (2002).
The DCC model is a flexible yet parsimonious parametric model that has been widely
employed.
Let 1, 2,[ ]'t t ty s s= ∆ ∆ be a 2× 1 vector of the log of stock market index (si,t) in a conditional
mean equation. A VAR representation of the conditional mean equation can be written as in
Equation (1):
( ) , (0, ) 1,..... (1),t t t tA L y e where e N H t T= ∀ =�
where ( )A L is a polynomial matrix in the lag operator L and '
1 , 2[ ]t t t
e ε ε= is a vector of
innovations with a conditional variance-covariance matrix { } 1 2.t i tH h i and= ∀ = The
GARCH component of the framework can be rewritten as t t t tH D R D=,
where
, ,( )t i i t
D diag h= ,
and { }t ij tR ρ= is the time-varying correlation matrix containing
conditional correlation coefficients. The elements in tD follow the univariate GARCH (P,
Q) processes in the following manner:
2
, , ,
1 1
1, 2 (2).i iP Q
i t i ip i t p iq i t q
p q
h h iω α ε β− −= =
= + + ∀ =∑ ∑
The second component of the framework consists of a specific DCC(M, N) structure, which
can be expressed as:
( )* 1 * 1 3 ,t t t t
R Q Q Q− −=
where 1 1 1 1
(1 ) ( ' )M N M N
t m n m t m t m n t n
m n m n
Q Q Qα β α ε ε β− − −= = = =
= − − + +∑ ∑ ∑ ∑ ,
Q is the unconditional correlation matrix of ,i tε and ,j tε , *
,{ }t i i
Q diag q= is a 2 2×
diagonal matrix containing the square root of diagonal elements in tQ , and α and β are
OC12062
8
nonnegative scalars that satisfy 1α β+ p .
In this paper, our key element of interest in tR is 1,2, 1,2, 1,1, 2,2,/t t t t
q q qρ = , which
represents the conditional correlation between US stock returns and other OECD countries’
stock returns. The log-likelihood function for this model can be expressed as follows:
2 ' 2 ' 1 '
1 1
[ 1/ 2 ( log(2 ) log )] [ 1/ 2 (log )]T T
t t t t t t t t t t
t t
L n D D R Rπ ε ε ε ε ε ε− −
= =
= − + + + − + +∑ ∑. (4)
Engle (2002) proposes a two-step approach for estimating the DCC model.
3.2. Estimation of the DCC-MGARCH model
3.2.1. Data and summary statistics
We collected daily stock market indices, the TED spread1, the stock market volatility
index (VIX), and stock market capitalization from DataStream. CDS spreads were from
Bloomberg, Inc. To investigate the dynamic correlation coefficient of four OECD countries
during the US financial crisis, our sample covers from the 1st of September 2006 to the 22nd
of July 2010. Table 1 shows the summary statistics for stock market returns of four OECD
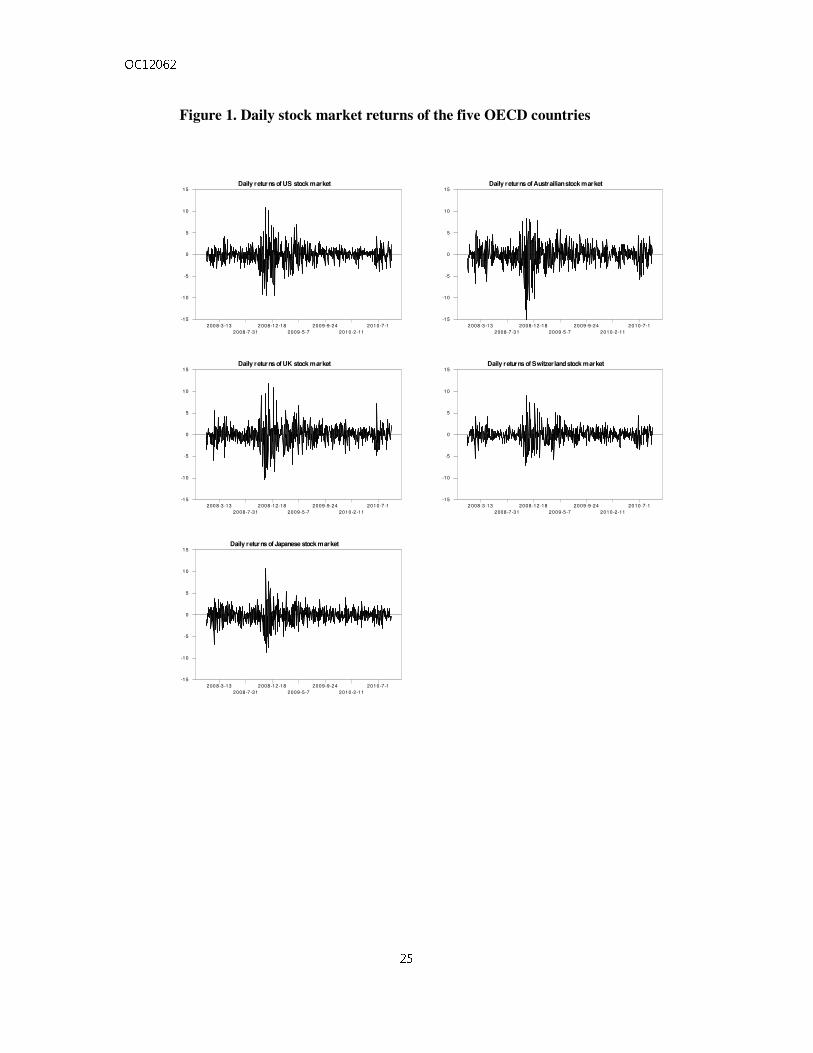
countries, and Figure 1 plots the daily stock return of the five countries.
[Table 1 about here]
From the first panel of Table 1, we can see that the average daily stock market returns
are negative for all the countries for the whole sample period (before the US financial crisis
and thereafter). The UK recorded the largest average negative return (loss) of 0.069% while
Switzerland recorded the smallest average daily loss of 0.0365%. From the JB statistics, we
can reject that all daily return series have normal distributions. In addition to this, ARCH (5)
test statistics reject the null hypnosis of homoscedasticity for all countries, and Ljung-Box Q 1 The data appendix has the detailed definitions and sources of each time series.
OC12062
9
test statistics reject the null hypothesis of no serial correlation for the United Kingdom, Japan,
and Australia.
Figure 1 shows the daily stock market returns of the five OECD countries. From Figure
1,
[Figure 1 about here]
we can see that stock return volatility is highest in Australia (standard error of 2.548) and
lowest in Switzerland (standard error of 1.675) and that all five countries’ stock return
volatility increase significantly after Lehmann Brothers’ failure. Table 2 reports the summary
statistics for the conditional correlation coefficients estimated by DCC-GARCH model
defined in
[Table 2 about here]
Equation (2). From Table 2, we can see that the mean value of DCC is highest in the United
Kingdom (as high as 0.5481) and lowest in Japan (as low as -0.0007).
3.3.2. Estimates of the DCC-GARCH model
Table 3 reports the estimates of the return and conditional variance equations. From
[Table 3 about here]
Table 3, we can see that the AR(1) term in the mean equation is significantly negative for all
five countries, and this is consistent with Antoniou et al. (2005) in terms of the presence of
positive feedback trading in advanced markets. The effects of the US stock returns on OECD
stock returns are highly significant, positive, and consistently large in magnitude, ranging
from 0.371 (Switzerland) to 0.826 (Australia). The coefficients for the lagged variance and
shock-squared terms in the variance equation are significant, and this is consistent with time-
varying volatility and confirms the appropriateness of the GARCH (1,1) specification. Note

OC12062
10
that the sum of the estimated coefficients (a+b) is quite close to unity, implying that the
volatility displays a highly persistent fashion. One advantage of using the model is the fact
that four possible pair-wise correlation coefficients for the five index returns in the sample
can be estimated in a single system equation. From Table 3, we can see that the hypothesis
that all estimated coefficients of the US return ( 2γ) are zero in the mean equation and all
estimated coefficients of the US volatility (b) in the variance equation are zero can be rejected,
and this validates our GARCH (1,1) model specifications.
3.3.3. Estimates of DCC for stock return data
Figure 2 shows estimates of DCC between the stock returns of the US and those of the
United Kingdom, Japan, Australia, and Switzerland during the period of September 2006 -
July 2010. First of all, we can see that DCCs increase sharply after Lehmann Brothers’
failures (third quarter of 2008) and reach their highest level at the end of 2008. Even though
the United Kingdom, Australia, and Switzerland were hit hard, recording large and positive
correlations, the stock returns of Japan show very low correlations with the US before the
crisis (as low as -0.07). After Lehmann Brothers’ failure, the correlations became
significantly higher and persisted at higher levels for the UK, Australia, and Switzerland,
ranging from 0.35 to 0.62. Those estimates of stock return correlations are much higher than
the estimates of Asian markets (Chiang et al., 2007).
However, the correlations of Japan increased as high as 0.217 after the crisis, but
decayed thereafter. Our study provides evidence of contagion 2 effects in OECD stock
markets in the early phase of the recent US financial crisis and then herding behavior in the
latter phase. However, the impact of the US financial crisis has had a limited impact on Japan, 2 Contagion describes the spread of shocks from one market to another with a significant increase in correlations between markets while herding is the simultaneous behavior of investors across different markets with high correlation coefficients in all markets.
OC12062
11
i.e., the US financial crisis has increased the stock return correlations of Japan, but this has
been a temporary impact.
3.3.4. Two phases of the US financial crisis
As shown in Figure 2, the pair-wise conditional correlation coefficients between the stock
returns of OECD countries are persistently higher and more volatile after Lehmann Brothers’
failure (September 15th, 2008). At the same time, it seems clear that conditional correlation
coefficients of Japan returned to the pre-crisis level after almost a year. For this reason, we
want to look into the time series behavior of correlation coefficients and identify the impact
of external shocks on their movements and volatility. We use two dummy variables for
different sub-samples to investigate the dynamic patterns of correlation coefficients.
The model is given as follows:
2
, , , ,
1 1
p
ij t p ij t p k k t ij t
p k
DM eρ φ ρ α−= =
= + +∑ ∑ , (7)
where ,ij tρ is the pair-wise correlation coefficient between the stock returns of the US and
those of the UK, Japan, Australia, and Switzerland. The lag length in Equation (7) is
determined by the AIC criterion. DM1 is a dummy for the first phase of the crisis period
(9/15/2008-9/14/2009), and DM2 is a dummy for the second phase of the crisis period
(9/15/2009-7/21/2010). Since our pre-tests using ARCH-LM statistics (Table 1) find
significant heteroscedasticity in all cases, the conditional variance equation is assumed to
follow a GARCH (1,1) specification with two dummy variables:
,
22
, 0 1 , 1 1 ,
1ij tij t ij t k k t
k
h C A h B e d DM−=
= + + +∑ . (8)
As the model implies, the significance of the estimated coefficients of the dummy variables

OC12062
12
indicates structural changes in the mean and/or variance shifts of the correlation coefficients
due to external shocks during the different phases of the crisis. The maximum likelihood
estimation of Models (7) and (8) are reported in Table 4.
[Table 4 about here]
To verify the validity of our model, we tested whether or not the estimated coefficients of
dummy variables are zero in the mean and variance equations using the likelihood ratio tests,
and we can reject the hypotheses of zero restrictions on dummy variables in the mean and
variance equations. From Table 4, we can see that all estimates of DM1,t and DM2,t in the
mean equation are significant and positive, except for Japan. This implies that the correlation
during the early phase of the crisis is significantly higher than that of the pre-crisis period,
and there are additional increases in correlations during the second phase of the crisis. This
finding is consistent with the comovement paths shown in Figure 2 and support the herding
behavior hypothesis in the early and second phase of the crisis. The herding phenomenon will
nullify the benefit of holding a diversified international portfolio in the region. All of the
lagged variance and shock-squared terms are highly significant, displaying a clustering
phenomenon. From the lower part of Table 4, the coefficients for DM1,t are positive for all
four countries while the coefficients for DM2,t are significant only for the United Kingdom.
This evidence suggests that the correlation coefficients can vary greatly, and this variability
could last for a prolonged period time for the United Kingdom but only a certain period of
time for Australia, Japan, and Switzerland. It is interesting that correlation coefficients for
Japan do not show any structural break during the different phases of crisis, but Japan only
show increased correlation variability during the first phase of the crisis.
IV. Determinants of DCC for stock market returns
4.1. The DCCX-MGARCH Model

OC12062
13
We propose a DCCX-MGARCH type model, where the conditional correlation
coefficient is determined by exogenous variables.
12, 1,1, 2,2,( )t t t th X h hρ=, (5)
where 1 ( ) 1tXρ− p p is a monotonic increasing function of tX , a 1K × vector of
economic fundamental variables that affects the size of the conditional correlation. This
approach is useful for identifying the propagation channel of stock returns comovements. We
propose the following parameterization for such a conditional correlation function:
exp ( ' )( ) 2 1,
1 exp( ' )t
t
t
XX
X
θρ
θ
= −
+ (6)
where 1 2 1 2[ , ,..., ] ' [ , ,...., ] '.k t kand X x x xθ θ θ θ= =
For exogenous variables that are supposed to determine the dynamic conditional
correlations, we include the daily sovereign CDS spread, the VIX index, relative stock market
capitalization to the US, and the TED spread. We include CDS spreads since Jorion and
Zhang (2007) show that credit event information is captured in CDS spread and Bystrom
(2005) and Norden and Weber (2009) find that positive stock returns are negatively
associated with CDS spread changes. The VIX index is included since Giot (2005) showed
that the VIX index and stock return have negative relationship. While Andersson et al. (2007)
suggest that periods of elevated stock market uncertainty lead to decoupling between stock
and bond prices, Cai et al. (2009) show that higher correlations emerge between countries
when both countries experience higher stock market volatility. We include the TED spread
since Brunnermeier (2009) shows that the TED spread provides a useful basis for gauging the
severity of the liquidity crisis. Finally, we include the ratio of stock market capitalization
relative to the US since Johnson and Soenen (2003) show that a higher ratio of stock market
capitalization relative to the US contributes to lower comovement.
OC12062
14
4.3. Estimation
The estimation results for Equation 6 are reported in Table 5. First, it is shown that
increased
[Table 5 about here]
TED spread decreases conditional correlations for all four countries under consideration.
Increased TED spread implies a worsened liquidity situation or “fear” (Lashgari, 2000:
Cheung et al., 2010) in the world capital market, and this, in turn, decreases the comovements
of stock returns among four OECD countries and that of the US. Second, it is shown that the
VIX index of a sovereign country has a significant positive effect on the conditional
correlations for three countries under investigation. This implies that uncertainty in one
countries’ stock market may spread to the US or vice versa. This is consistent with Cai et al.
(2009) and previous estimates of conditional variance function in Table 3. In Table 3, all
estimates of b in variance equations are positive and significant, implying that there are
significant volatility spillover effects in those countries. Third, the estimated coefficient of the
ratio of stock market capitalization to the US is negative and significant for all four countries,
and this finding is consistent with Johnson and Soenen (2003). A higher ratio of stock market
capitalization relative to the US implies a higher level of independence from the US stock
market, and this can decrease the conditional correlations of stock returns.
Finally, increased sovereign risk measured by the CDS spread increases the conditional
correlations for the UK and Australia. This finding is consistent with Bystrom (2005), who
found that an increase in stock price volatility is positively correlated with the CDS spread. In
other words, increased CDS spread increases stock price volatility, and this increased stock
return volatility in the UK and Australia can increase stock return correlations. However,
estimated coefficient of CDS spread for Switzerland has an unexpected negative sign.

OC12062
15
We can see that most of dummy variables are significant in Table 5 (dummy variables
are not included for Switzerland since its CDS spread data does not cover a whole range of
analysis). While dummy variables for both phases are significant and positive for the United
Kingdom and Australia, it is shown that those of Japan are negative and significant only for
the second phase of the crisis.
V. Conclusions
This paper investigated the relationship between the stock returns of four OECD markets
and that of the US. To examine stock market contagion and herding behavior, we employed
dynamic multivariate GARCH model to estimate dynamic conditional correlations using the
daily stock return data for the 2006-2010 period. Based on the estimated dynamic
conditional correlations between four OECD countries and the US, we analyzed the dynamic
behavior of stock market interactions by dividing the whole sample period into three sub-
sample periods (pre-crisis, first phase of the crisis, and second phase of the crisis). During the
first phase of the crisis, we identified a process of increasing correlations and an additional
increase of correlations during the second phase caused by herding behavior in the United
Kingdom, Australia, and Switzerland. However, the impact of the US financial crisis on
Japan was limited to the increase in correlation volatilities in the first phase, and this
disappeared during the second phase of the crisis, leaving the correlations of the Japan pre-
crisis level. Finally, we proposed a new approach that allows simultaneous estimation of the
conditional correlation coefficients and determinants of conditional correlations over time
and that can be used to identify channels of contagion. It is shown that an increase in the VIX
stock market index increases conditional correlations while increases in TED spreads and
relative stock market capitalization decrease the conditional correlations of the four OECD
countries with the US.
OC12062
16
References
Andersson, M., Krylova, E., Vahamaa, S., 2007. "Why does the correlation between stock
and bond returns vary over time?" Applied Financial Economics 18(2), 139-151.
Antoniou, A., Koutmos, G., Pericli, A., 2005. "Index futures and positive feedback trading:
Evidence from major stock exchanges." Journal of Empirical Finance 12, 219-238.
Baig, T., Goldfajn, I., 1999. "Financial market contagion in the asian crisis." IMF Staff Papers,
46, 167-195.
Basu, R., 2002. "Financial contagion and investor "learning": An empirical investigation."
IMF Working Paper 1-36.
Beirne, J., Caporale, G.M., Schulze-Ghattas, M., Spagnolo, N., 2009. "Volatility spillovers
and contagion from mature to emerging stock markets." Brunel University Working
Paper No.09-05.
Boyson, N.M., Stahel, C.W., Stulz, R.M., 2010. "Hedge fund contagion and liquidity shocks."
Journal of Finance, 65, 1789-1816.
Bracker, K., Docking, D.S., Koch, P.D., 1999. "Economic determinants of evolution in
international stock market integration." Journal of Empirical Finance, 6, 1-27.
Brunnermeier, M.K., Pedersen, L.H., 2009. "Market liquidity and funding liquidity." Review
of Financial Studies, 22, 2201-2238.
Bystrom, H., 2005. "Credit default swapss and equity prices: The itraxx cds market index."
Financial Analysts Journal, 62, 65-76.
Cai, Y., Chou, R., Li, D., "Explaining international stock correlations with CPI fluctuations
and market volatility." Journal of Banking and Finance, 2009, 33, 2026-2035.
Calvo, S., Reihart, C., 1996, "Capital flows to Latin America: Is there evidence of contagion
effect?" In. Calvo, G., Goldstein, M., Hochreiter, E., esd. Private capital flows to
emerging markets after the Mexican Crisis, Institute of International Economics.
Cheung, W., Fung, S., Tsai, S.C., 2010. "Global capital market interdependence and spillover
effect of credit risk: Evidence from the 2007-2009 global financial crisis." Applied
Financial Economics, 20, 85-103.
Chiang, T.C., Jeon, B.N., Li, H.M., 2007. "Dynamic correlation analysis of financial
contagion: Evidence from asian markets." Journal of International Money and Finance,
26, 1206-1228.
Chudick, A., Fratzscher, M., 2011, "Identifying the global transmission of the 2007-2009
OC12062
17
fiancial crisis in a GVAR model." European Economic Review, 55, 325-339.
Christiasen, C., Ranaldo, A., Soderlind, P., 2011. "The time-varying systematic risk of carry
trade strategies." Journal of Financial and Quantitative Analysis, forthcoming.
Connolly, R., Stivers, C., Sun, L.C., 2005. "Stock market uncertainty and the stock-bond
return relation." Journal of Financial and Quantitative Analysis, 40, 161-194.
Connolly, R.A., Stivers, C., Sun, L.C., 2007. "Commonality in the time-variation of stock-
stock and stock-bond return comovements." Journal of Financial Markets, 10, 192-
218.
Corsetti, G., Pericoli, M., Sbracia, M., 2005. "'Some contagion, some interdependence: More
pitfalls in tests of financial contagion." Journal of International Money and Finance,
24, 1177-1199.
Dooley, M and Hutchison, M., 2009, "Transmission of the US Subprime crisis to emerging
markets: Evidence on the decoupling o-recoupling hypothesis," Journal of
International Money and Finance, 28, 1331-1349.
Engle, R., 2002. "Dynamic conditional correlation." Journal of Business and Economic
Statistics, 20, 339-350.
Forbes, K.J., Rigobon, R., 2002. "No contagion, only interdependence: Measuring stock
market comovements." Journal of Finance, 57, 2223-2261.
Frank, N., Hesse, H., 2009. "Financial spillovers to emerging markets during the global
financial crisis. Finance a Uver-Czech." Journal of Economics and Finance, 59, 507-
521.
Froot, K., O'Connell, P., Seasholes, M.,2001. "The portfolio flows of international invesotrs,
Journal of Financial economics." 59, 151-193.
Giot, P., 2005. "Relationships between implied volatility indexes and stock index returns - are
implied volatility indexes leading indicators?" Journal of Portfolio Management, 31,
92-100.
Hamao, Y., Masulis, R.W., Ng, V., 1990. "Correlations in price changes and volatility across
international stock markets." Review of Financial Studies, 3, 281-307.
Johnson, R., Soenen, L., 2003. "Economic integration and stock market comovement in the
americas." Journal of Multinational Financial Management, 13, 85-100.
Jorion, P., Zhang, G.Y., 2007. "Good and bad credit contagion: Evidence from credit default
swaps." Journal of Financial Economics, 84, 860-883.
OC12062
18
Kanas, A., 1998. "Volatility spillovers across equity markets: European evidence." Applied
Financial Economics, 8, 245-256.
Kim, S., Moshirian, F., Wu, E., 2006, "Evolution of international stock and bond market
integration:Influence of the European Monetary Union." Journal of Banking and
Finance, 30, 1507-1534.
Kim, H., Kim, B., 2010. "Spillover effects of the US financial crisis on financial markets in
emerging Asian countries." Auburn Economics Working Paper Series, 1-39.
King, M., Wadhwani, S., 1990. "Transmission of volatility between stock markets." Review
of Financial Studies, 3, 5-33.
Lashgari, M., 2000. "The role of ted spread and confidence index in explaining behavior of
stock prices." American Business Review, 18(2), 9-11.
Lee, S., Kim, K., 1993. "Does the october 1987 crash strengthen the co-movements among
national stock markets?" Review of Financial Economics, 3, 89-102.
Ng, A., 2000. "Volatility spillover effects from japan and the us to the pacific-basin." Journal
of International Money and Finance, 19, 207-233.
Norden, L., Weber, M., 2009. "The co-movement of credit default swap, bond and stock
markets: An empirical analysis." European Financial Management, 15, 529-562.

OC12062
19
Data Appendix
Stock Index
Item Description Datastream Code
US Index S&P 500 Composit S&PCOMP(PI) UK Index UK-DS Market TOTMUK$(PI) Swiss Index Swiss-DS Market TOTMKSW(PI) Australia Index Australia-DS Market TOTMAU$(PI) Japan Index Japan-DS Market TOTMJP$(PI)
Volatility Index
Item Description Bloomberg Source
US Volatility Index for S&P 500 VIX UK Volatility Index for FTSE 100 VFTSE Swiss Volatility Index for SMI VSMI Australia Volatility Index for S&P/ASX SPAVIX Japan Volatility Index for Nikkei225 VXJ
TED Spread
Item Description Datastream Code
TED US LIBOR – US Treasury Bill 3M BOELI3M – FRTBS3M TED UK LIBOR – UK Interbank 3M BOELI3M – LDNIB3M TED Swiss LIBOR – Swiss Interbank 3M BOELI3M – SWIBK3M TED Australia LIBOR – Australian Deposit 3M BOELI3M – GSAUD3M TED Japan LIBOR – Japan Interbank 3M BOELI3M – JPIBO3M
CDS Spread
Item Description Bloomberg Source
CDS US US CDS Spread CMA New York CDS UK UK CDS Spread CMA New York CDS Swiss Swiss CDS Spread CMA New York CDS Australia Australia CDS Spread CMA New York CDS Japan Japan CDS Spread CMA New York

OC12062
20
Table 1. Descriptive statistics for stock market returns (2006/09/01-2010/07/21)
A.Entire Period
US UK Japan Australia Switzerland
Daily stock market returns ( ,i ts∆ ) Mean -0.0441 -0.069 -0.0559 -0.0584 -0.0365
Std. Error 1.9838 2.2531 1.7939 2.5481 1.6751
Normality Test
Skewness -0.1375 0.0205 -0.0074 -0.821** 0.173**
Kurtosis 5.336** 4.616** 3.8664** 4.8765** 3.715**
JB statistic 811.53** 605.68** 424.82** 752.34** 6982.6**
Heteroscedasticity test
ARCH(5) LM test
161.29** 191.393** 116.792** 307.490** 120.752**
Autocorrelations test Ljung-Box Q 68.53** 52.620** 55.611** 23.219 65.720**
Note: Double asterisks (**) denote significance at 1% critical level and single asterisk (*) at 5% critical level respectively.
B.Pre-Crisis Period
US UK Japan Australia Switzerland
Daily stock market returns ( ,i ts∆ ) Mean -0.0167 -0.03478 -0.0424 0.005498 -0.003388
Std. Error 1.0874 1.3116 1.3115 1.6685 0.9917
Normality Test
Skewness -0.382** -0.1804 -0.347** -0.377** -0.221*
Kurtosis 2.0656** 2.2960 ** 1.801** 2.243** 3.117**
Jarque-Bera 107.510** 119.739** 82.563** 124.108** 219.687**
Heteroscedasticity test
ARCH(5) LM test
7.39** 14.92** 14.09** 19.80** 12.69**
Autocorrelations test Ljung-Box Q 37.05* 30.16 37.28* 10.59 22.90
Note: Double asterisks (**) denote significance at 1% critical level and single asterisk (*) at 5% critical level respectively.
C.Post-Crisis Period
US UK Japan Australia Switzerland
Daily stock market returns ( ,i ts∆ ) Mean -0.01795 -0.02381 -0.02948 -0.000634 -0.0070
Std. Error 2.1920 2.4634 1.8482 2.7278 1.8272
Normality Test
Skewness -0.153 -0.0269 0.050 -0.973** 10.149
Kurtosis 4.696** 4.200** 4.649** 5.098** 3.242**
Jarque-Bera statistic
445.775** 335.135** 435.143** 599.137** 213.303**
Heteroscedasticity test
ARCH(5) LM test
24.71** 26.33** 39.58** 50.96** 20.47**
Autocorrelations test Ljung-Box Q 44.00** 43.41** 42.28** 20.98 55.92**
Note: Double asterisks (**) denote significance at 1% critical level and single asterisk (*) at 5% critical level respectively.

OC12062
21
Table 2: Summary statistics of estimated DCCs of 5 OECD countries: Equation (5)
, ,
, ,
, , , ,
i j t
i j t
i i t j j t
q
q qρ =
Entire Period US-UK US-Japan US-Australia US-Switzerland
Mean 0.5481 -0.0007 0.2707 0.4813
Std. Error 0.0259 0.0369 0.0368 0.0383
Skewness 1.0437 ** 2.174 ** 0.6241 ** 1.8894 **
Kurtosis 2.5225 ** 5.6123 ** 0.3809 ** 4.7100 **
Jarque-Bera statistic 304.65 ** 1432.31 ** 48.4007 ** 1036.197 **
Note: Double asterisks (**) denote significance at 1% critical level and single asterisk (*) denote significance at 5% critical level.
Pre-Crisis Period
US-UK US-Japan US-Australia US-Switzerland
Mean 0.5298 -0.02491 0.2260 0.4605
Std. Error 0.01618 0.02469 0.02162 0.01815
Skewness -1.6699** 0.4548** -0.1471 -0.6070**
Kurtosis 4.9780** 3.6973** 0.8967** 0.4881*
Jarque-Bera statistic 796.5491** 227.2236** 19.7411** 37.9653**
Note: Double asterisks (**) denote significance at 1% critical level and single asterisk (*) denote significance at 5% critical level.
Post-Crisis Period
US-UK US-Japan US-Australia US-Switzerland
Mean 0.5638 -0.004604 0.2848 0.4981
Std. Error 0.02990 0.05496 0.04221 0.04897
Skewness 1.2510** 1.7403** 0.7839** 1.3541**
Kurtosis 2.2670** 3.0890** -0.08467 2.9252**
Jarque-Bera statistic 229.4058** 435.8264** 49.6082** 319.8108**
Note: Double asterisks (**) denote significance at 1% critical level and single asterisk (*) denote significance at 5% critical level.

OC12062
22
Table 3: Estimation results from the DCC-GARCH model (2006/09/01-2010/07/21)
UK Japan Australia Switzerland US
Return equation: , ,0 ,1 , 1 2 , 1 ,i t i i i t US t i ts s sγ γ γ ε− −∆ = + ∆ + ∆ +
0γ 0.077* (0.037) -.0001* (0.029) 0.128* (0.037) 0.070* (0.037) 0.072* (0.037)
1γ -0.230* (0.020) -0.134* (0.021) -0.157* (0.021) -.197* (0.019) -.089* (0.031)
2γ 0.497* (0.033) 0.462* (0.025) 0.826* (0.035) 0.371* (0.022) -- --
Variance equation: , 1
2
, , 1 i tij t i i ij t ih c a h b ε−−= + +
c 0.029** (0.006) 0.046* (0.014) 0.137* (0.044) 0.096* (0.022) 0.022** (0.005)
a
0.929** (0.001 0.891* (0.014) 0.843* (0.019) 0.927* (0.010) 0.899* (0.012)
b
0.063** (0.007) 0.087* (0.011) 0.139* (0.019) 0.063* (0.011) 0.093* (0.011)
-Log Likelihood 7454.53
LR-test ( 2 0γ = for all countries) Chi-squared (4) = 708.94***
LR-test (b = 0 for all countries) Chi-squared (5) = 36935.3***
LR-test (b = 2 0γ = for all countries) Chi-squared (9) = 40849.54***
Notes: Values in parentheses are standard errors. Double asterisks (**) and single asterisk (*) indicate significance at the 1% and 5% critical levels, respectively.

OC12062
23
Table 4: Test of changes in DCC during different phases of US financial crisis
UK Japan Australia Switzerland
Mean equation: 2
, , , ,
1 1
p
ij t p ij t p k k t ij t
p k
DM eρ φ ρ α−= =
= + +∑ ∑
Con. 0.071** (.0001) -0.002** (.0003) .0121** (.0001) 0.0313** (0.001)
1tρ − 0.869** (.0002) 0.908** (.0104) 0.946** (.0007) 0.932** (.0005)
DM1,t 0.005** (.0005) 0.0004 (.0009) 0.004** (.0009) 0.0002* (.0009)
DM2,t 0.001** (.0004) 0.0004 (.0006) 0.001** (.0001) .0012** (.0005)
-----------------------------------------------------------------------------------------------------------------
Variance equation: ,
22
, 0 1 , 1 1 ,
1ij tij t ij t k k t
k
h C A h B e d DM−=
= + + +∑
___________________________________________________________________________
0C 1.34e-6** (2.24e-7) 2.22e-6**
4.76e-7 1.12e-6**
3.26e-7 4.77e-6**
5.69e-7
1th − 0.679** (0.018) .824** (.010) 0.783** (0.008) 0.734** (0.019)
2
1tε − 0.377** (0.022) .182** (0.013) 0.287** (0.003) 0.210** (0.025)
DM1,t 9.88e-6** (3.36e-6) 1.2e-5**
(1.7e-6) 1.18e-5**
(3.6e-6) 2.68e-5**
(6.6e-6)
DM2,t 4.16e-6** (1.18e-6) 1.16e-6 (9.83e-7)
-3.78e-7 (4.81e-7)
1.54e-7 (8.55e-7)
LR test H0 : DM1=DM2=0 in mean equation, Chi-squared (8)=71.71*** H0 : DM1=DM2=0 in variance equation, Chi-squared (8)=19019782.54*** H0 : DM1=DM2=0 in mean and variance equation, Chi-squared (16)=43866124.01***
Notes: Values in parentheses are standard errors. Double asterisks (**) and single asterisk (*) indicate significance at the 1% and 5% critical levels, respectively.

OC12062
24
Table 5: Estimation of DCCX
0 1 2 3 4
exp ( ' )( ) 2 1, [ , , , , ] '
1 exp ( ' )t
t
t
XX
X
θρ θ θ θ θ θ θ
θ
= − =
+
UK Japan Australia Switzerland
Coef. S.E. Coef. S.E. Coef. S.E. Coef. S.E.
0θ 1.298** (.087) 0.131** (0.044) 0.027 (0.079) 1.211** (0.028)
1θ 0.004** (.0001) 0.0004 (.0001) 0.0015** (.0002) -.0001 (.0008)
2θ -.037** (0.005) -0.019** (0.003) -0.141** (0.009) 1.992** (0.668)
3θ -0.829* (0.333) -.3633* (0.161) -0.351 (0.765) -.012 (0.009)
4θ 0.005** (.0006) 0.0028** (.0003) 0.0012* (.0006) 0.004** (.0006)
DM1 0.268** (.0006) -0.012 (0.012) 0.437** (0.017) --3 --
DM2 0.306** (0.019) -0.135** (0.015) 0.317** (0.022) --3 --
Log Likelihood 923.12 1018.62 597.11 600.01
Notes: 1. Values in parentheses are standard errors. Double asterisks (**) and single asterisk (*) indicate significance at the 1% and 5% critical levels, respectively. 2. X0 is a constant, X1 is the CDS spread, X2 is the TED spread, X3 is the relative stock market capitalization of four OECD countries relative to US and X4 is the VIX index for stock market. 3. Switzerland does not have sufficient observations of CDS spread data to utilize dummy variables.
OC12062
25
Figure 1. Daily stock market returns of the five OECD countries
Daily returns of US stock market
200 8-3-13
2008-7-31
2 008-12-18
2009-5-7
2009-9-24
2010-2-11
2010-7-1
-15
-10
-5
0
5
10
15
Daily returns of UK stock market
200 8-3-13
2008-7-31
2 008-12-18
2009-5-7
2009-9-24
2010-2-11
2010-7-1
-15
-10
-5
0
5
10
15
Daily returns of Japanese stock market
200 8-3-13
2008-7-31
2 008-12-18
2009-5-7
2009-9-24
2010-2-11
2010-7-1
-15
-10
-5
0
5
10
15
Daily returns of Austrailian stock market
2 008-3-13
2008-7-31
2008-12-18
2009-5-7
2009-9-24
2010-2-11
2010-7-1
-15
-10
-5
0
5
10
15
Daily returns of Switzerland stock market
2 008-3-13
2008-7-31
2008-12-18
2009-5-7
2009-9-24
2010-2-11
2010-7-1
-15
-10
-5
0
5
10
15

OC12062
26
Figure 2. Estimates of DCCs among US and four OECD countries
DCC of US with OECD countries
2008-3-13 2008-7-31 2008-12-18 2009-5-7 2009-9-24 2010-2-11 2010-7-1
-0.1
0.0
0.1
0.2
0.3
0.4
0.5
0.6
0.7
USUK
USJP
USAT
USSW