e ects of the space radiation environment in manned ... population 0.001 0.015 0.05 exposed workers...
TRANSCRIPT

Effects of the space radiation environment
in manned missions to Mars
Ana Luısa Martins de Carvalho [email protected]
Instituto Superior Tecnico, Lisboa, Portugal
June 2016
Abstract
Manned missions to Mars are the next step in human exploration of the solar system. NASA plans to senda manned mission to Mars in the decade of 2030. One of the most limiting factors to this kind of missions is theradiation hazard. To provide a better protection of the crew it is necessary to fully understand the radiationenvironment in space and its effects of human organs and tissues. In the present work, the different radiationenvironments that exist during a mission to Mars are discussed and the Geant4 simulation toolkit is used tosimulate the interaction between radiation and the anthropomorphic computation phantom (ICRU sphere) foreach spacial radiation environment. Starting with the determination of the deposited energy for each typeof particle, the exposure of the astronauts to radiation is estimated through the concepts of absorbed doseand equivalent dose, during the different phases of the three missions profiles proposed by NASA, even if noshielding is considered. The results for the absorbed dose and equivalent dose in each mission profile are notcompatible with the dose restriction values provided by NASA, if shielding is not considered. However, evenin the presence of a SEP event similar to the one of December, 2006, if spacecraft shielding is considered, themission to Mars is viable in what concerns radiation hazard to astronauts. However, harder and more intenseSEPs may exceed these limits. This calls for efforts in shielding design and trajectory optimization to reducethe radiation exposure below the dose constraints.Keywords: Radiation Environment, Mars Mission, Dose in astronauts, Manned Missions, Simulations
1. Introduction
Mars is the next step in human exploration of the SolarSystem. To make these missions viable, it is essentialto know the effects of radiation environments in humanorgans and tissues.
Astronauts on board of the International Space Sta-tion have been providing information that will improvethe radiation protection in future missions. It is alsofundamental to predict the radiation conditions in Marsto provide the best protection for the mission crew. TheCuriosity rover measured radiation levels on its way toMars and is currently measuring the radiation environ-ment on Mars surface.
NASA suggested three mission profiles for mannedmission to Mars. In each one of the mission profileswe are going to characterize the radiation environmentsand quantify its effects on astronauts, through the cal-culation of absorbed dose and equivalent dose using ananthropomorphic model representing the astronaut.
In a mission to Mars the main radiation sources aregalactic cosmic radiation (GCR), trapped particles inthe Van Allen belts and solar energetic particles (SEP)events .
Using Geant4 simulation toolkit we simulate the in-teraction between radiation and matter to obtain ab-
sorbed dose and equivalent dose values for each missionprofile.
1.1. Galactic Cosmic Radiation
Galactic cosmic radiation is an isotropic and continuousradiation source formed by nuclei of chemical elementsaccelerated to high energies. The spectrum of GCR isrepresented in figure 1.
1.2. Van Allen Radiation Belts
The Van Allen Radiation Belts are formed by two radia-tion belts around planet Earth. Each of these belts con-sists of trapped charged particles: electrons and protonsfrom GCR. There is a considerable overlap between thetwo belts. The major exposure region is located aboveEarth’s magnetic equator.
1.3. Solar Energetic Particle Events
Occasionally, in addition to the solar wind emitted con-tinuously, the Sun releases huge amounts of energy inthe form of solar flares which consist of intense electro-magnetic radiation and protons, about 10% of Heliumnuclei and 1% of heavy ions accelerated in the Sun. Insome of the most violent solar flares, coronal mass ejec-tion events (CME) can happen.
1
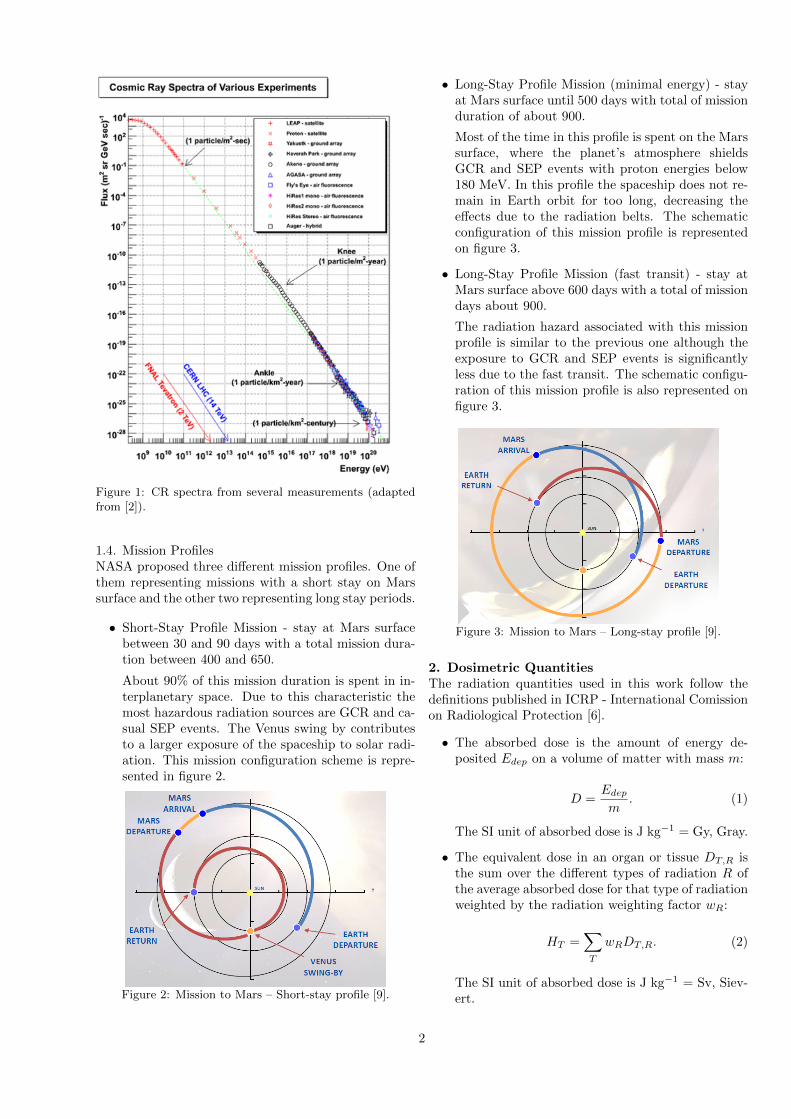
Figure 1: CR spectra from several measurements (adaptedfrom [2]).
1.4. Mission ProfilesNASA proposed three different mission profiles. One ofthem representing missions with a short stay on Marssurface and the other two representing long stay periods.
• Short-Stay Profile Mission - stay at Mars surfacebetween 30 and 90 days with a total mission dura-tion between 400 and 650.
About 90% of this mission duration is spent in in-terplanetary space. Due to this characteristic themost hazardous radiation sources are GCR and ca-sual SEP events. The Venus swing by contributesto a larger exposure of the spaceship to solar radi-ation. This mission configuration scheme is repre-sented in figure 2.
Figure 2: Mission to Mars – Short-stay profile [9].
• Long-Stay Profile Mission (minimal energy) - stayat Mars surface until 500 days with total of missionduration of about 900.
Most of the time in this profile is spent on the Marssurface, where the planet’s atmosphere shieldsGCR and SEP events with proton energies below180 MeV. In this profile the spaceship does not re-main in Earth orbit for too long, decreasing theeffects due to the radiation belts. The schematicconfiguration of this mission profile is representedon figure 3.
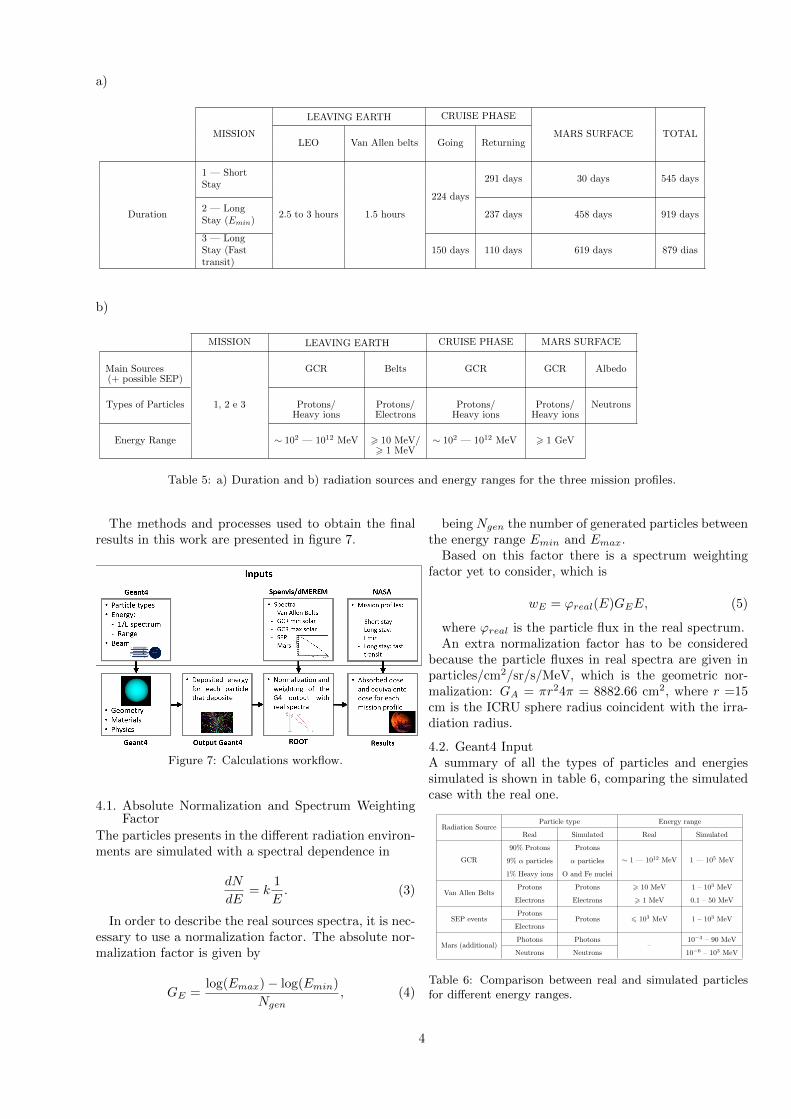
• Long-Stay Profile Mission (fast transit) - stay atMars surface above 600 days with a total of missiondays about 900.
The radiation hazard associated with this missionprofile is similar to the previous one although theexposure to GCR and SEP events is significantlyless due to the fast transit. The schematic configu-ration of this mission profile is also represented onfigure 3.
Figure 3: Mission to Mars – Long-stay profile [9].
2. Dosimetric QuantitiesThe radiation quantities used in this work follow thedefinitions published in ICRP - International Comissionon Radiological Protection [6].
• The absorbed dose is the amount of energy de-posited Edep on a volume of matter with mass m:
D =Edep
m. (1)
The SI unit of absorbed dose is J kg−1 = Gy, Gray.
• The equivalent dose in an organ or tissue DT,R isthe sum over the different types of radiation R ofthe average absorbed dose for that type of radiationweighted by the radiation weighting factor wR:
HT =∑T
wRDT,R. (2)
The SI unit of absorbed dose is J kg−1 = Sv, Siev-ert.
2

The radiation weighting factor wR is an averageover all tissues and organs and should be appliedfor low energies. Table 1 represents wR for differentradiation types. For neutrons wR varies with theparticle energy as shown in figure 4.
Radiation type Radiation weighting factor wR
Photons 1Electrons and muons 1
Protons and charged pions 2α particles and heavy ions 20
Table 1: Radiation weighting factors [6].
Figure 4: Neutron radiation weighting factor as function ofthe energy [6].
• The ICRU sphere is an anthropomorphic computa-tional phantom with 30 cm in diameter and a den-sity of 1gcm−3 formed by: 76.2% Oxygen; 11.1%Carbon; 10.1% Hydrogen and 2.6% Nitrogen.
The ICRU sphere is used in the definition of oper-ation quantities for radiation monitoring in humanbody. To use ICRU sphere calibration, we have todefine an expanded and aligned radiation field asshown in figure 5.
Figure 5: Expanded and aligned field impinging in the ICRUsphere.
3. Dose ConstraintsNeutrons, α particles (Helium nuclei), β radiation (elec-trons and positrons) and X and γ radiation are examplesof ionizing radiation. This category of radiation pro-duces hazardous effects when interacts with the cells inhuman body. GCR, SEP events and trapped particles inradiation belts are characterized as ionizing radiation.Examples of the interactions between ionizing radiationand cells are represented in figure 6.
Figure 6: Cellular damage mechanisms due to radiation[8]
Radiation dose limits depend on profession, gender,age, health and other factors. The global average an-nual dose of radiation, from all natural and artificialsources on Earth, for a person is 3.6 mSv. The inter-national standards allow dose below 50 mSv/year forspecialized exposed workers. Table 2 compares radia-tion restrictions for astronauts with limits on Earth fordifferent organs. Table 3 compares dose restrictions forastronauts in different exposure times. Table 4 repre-sents the career restrictions for astronauts by age andgender.
Annual Limits (Sv)Whole body Eyes (0.3 cm) Skin (0.01 cm)
General population 0.001 0.015 0.05Exposed workers 0.02 0.02 0.50
Astronauts 0.50 2.00 3.00
Table 2: Annual limits for general population and equivalentdose restrictions for astronauts in Sv (the radiation penetra-tion depth is represented in brackets) [1].
Exposure time Whole body Eyes (0.3 cm) Skin (0.01 cm)
Astronauts30 days 0.25 1.00 1.50Annual 0.50 2.00 3.00Career 1.00 - 4.00 4.00 6.00
Table 3: Equivalent dose restrictions for astronauts in Sv fordifferent exposure times [1].
Age (yrs) Male (Sv) Female (Sv)
25 1.50 1.00
35 2.50 1.75
45 3.25 2.50
55 4.00 3.00
Table 4: Career dose restrictions imposed by NASA, by ageand gender of the astronauts [1].
Restrictions presented in table 3 are to be comparedwith the ones determined with Geant4.
4. SimulationTable 5 a) summarizes the durations for the differentphases in each mission profile and 5 b) shows the maincharacteristics for each radiation environment.
3
a)
MISSION
LEAVING EARTH CRUISE PHASE
MARS SURFACE TOTALLEO Van Allen belts Going Returning
Duration
1 — ShortStay
2.5 to 3 hours 1.5 hours
224 days
291 days 30 days 545 days
2 — LongStay (Emin)
237 days 458 days 919 days
3 — LongStay (Fasttransit)
150 days 110 days 619 days 879 dias
b)
MISSION LEAVING EARTH CRUISE PHASE MARS SURFACE
Main Sources
1, 2 e 3
GCR Belts GCR GCR Albedo(+ possible SEP)
Types of Particles Protons/ Protons/ Protons/ Protons/ NeutronsHeavy ions Electrons Heavy ions Heavy ions
Energy Range ∼ 102 — 1012 MeV > 10 MeV/ ∼ 102 — 1012 MeV > 1 GeV> 1 MeV
Table 5: a) Duration and b) radiation sources and energy ranges for the three mission profiles.
The methods and processes used to obtain the finalresults in this work are presented in figure 7.
Figure 7: Calculations workflow.
4.1. Absolute Normalization and Spectrum WeightingFactor
The particles presents in the different radiation environ-ments are simulated with a spectral dependence in
dN
dE= k
1
E. (3)
In order to describe the real sources spectra, it is nec-essary to use a normalization factor. The absolute nor-malization factor is given by
GE =log(Emax) − log(Emin)
Ngen, (4)
being Ngen the number of generated particles betweenthe energy range Emin and Emax.
Based on this factor there is a spectrum weightingfactor yet to consider, which is
wE = ϕreal(E)GEE, (5)
where ϕreal is the particle flux in the real spectrum.An extra normalization factor has to be considered
because the particle fluxes in real spectra are given inparticles/cm2/sr/s/MeV, which is the geometric nor-malization: GA = πr24π = 8882.66 cm2, where r =15cm is the ICRU sphere radius coincident with the irra-diation radius.
4.2. Geant4 InputA summary of all the types of particles and energiessimulated is shown in table 6, comparing the simulatedcase with the real one.
Radiation SourceParticle type Energy range
Real Simulated Real Simulated
GCR
90% Protons Protons
∼ 1 — 1012 MeV 1 — 105 MeV9% α particles α particles
1% Heavy ions O and Fe nuclei
Van Allen BeltsProtons Protons > 10 MeV 1 – 103 MeV
Electrons Electrons > 1 MeV 0.1 – 50 MeV
SEP eventsProtons
Protons 6 103 MeV 1 – 103 MeVElectrons
Mars (additional)Photons Photons
–10−3 – 90 MeV
Neutrons Neutrons 10−6 – 103 MeV
Table 6: Comparison between real and simulated particlesfor different energy ranges.
4
Additionally to this simulations, photons and neu-trons were also simulated because these particles areproduced as secondary particles that result from the in-teraction of GCR with Mars’ atmosphere. So it wasneeded to do these simulations as primary particles toreach the ICRU sphere at it was placed at Mars surface.
4.3. Geant4 ImplementationIn Geant4 [4, 5] we used a PhysicsList calledQGSP BERT HP which contains the detailed descrip-tion of the physical models that describe the electro-magnetic interactions (Bertini Cascade) and hadronicinteractions as well as a detailed model that describesneutrons with energies below 20 MeV (necessary due tothe neutron thermalization process).
4.4. Geant4 OutputThe Geant4 output was chosen to be the deposited ener-gies from the different primary and secondary particlesthat have deposited energy in the ICRU sphere volume.
4.5. SPENVIS/dMEREM InputFigures 8, 9 and 10 represent the GCR spectra for min-imum and maximum solar conditions, the spectra oftrapped particles in the Van Allen belts and the spectrafor a proton SEP event, acquired from SPENVIS [3].
Figure 8: GCR spectra at the minimum and maximum solaractivity for different particles.
Figure 9: Spectrum of trapped electron and protons in theVan Allen radiation belts.
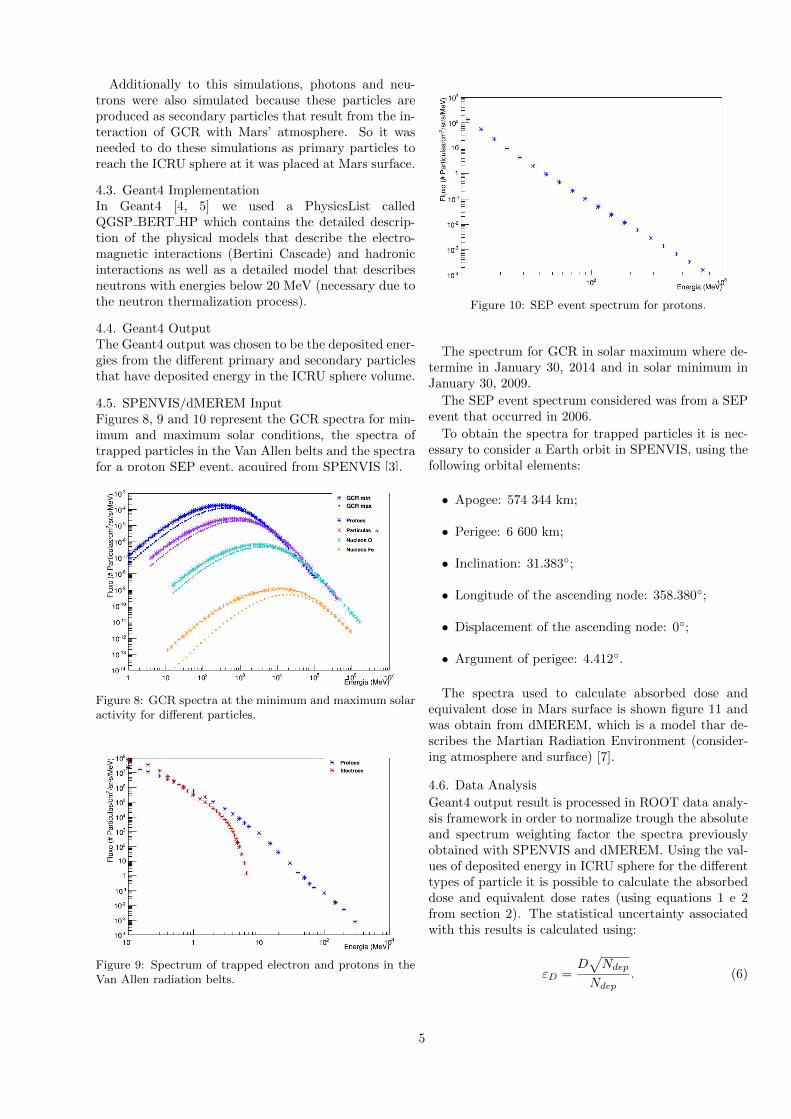
Figure 10: SEP event spectrum for protons.
The spectrum for GCR in solar maximum where de-termine in January 30, 2014 and in solar minimum inJanuary 30, 2009.
The SEP event spectrum considered was from a SEPevent that occurred in 2006.
To obtain the spectra for trapped particles it is nec-essary to consider a Earth orbit in SPENVIS, using thefollowing orbital elements:
• Apogee: 574 344 km;
• Perigee: 6 600 km;
• Inclination: 31.383◦;
• Longitude of the ascending node: 358.380◦;
• Displacement of the ascending node: 0◦;
• Argument of perigee: 4.412◦.
The spectra used to calculate absorbed dose andequivalent dose in Mars surface is shown figure 11 andwas obtain from dMEREM, which is a model thar de-scribes the Martian Radiation Environment (consider-ing atmosphere and surface) [7].
4.6. Data Analysis
Geant4 output result is processed in ROOT data analy-sis framework in order to normalize trough the absoluteand spectrum weighting factor the spectra previouslyobtained with SPENVIS and dMEREM. Using the val-ues of deposited energy in ICRU sphere for the differenttypes of particle it is possible to calculate the absorbeddose and equivalent dose rates (using equations 1 e 2from section 2). The statistical uncertainty associatedwith this results is calculated using:
εD =D√Ndep
Ndep. (6)
5
a)
b)
Figure 11: Spectra at Mars surface, obtained usingdMEREM toolkit, using GCR spectra for a) protons e b)α particles, as primary radiation.
4.7. NASA InputTo determine the total absorbed dose and equivalentdose it is necessary to multiply the rates obtained pre-viously by each phase time duration. This data is givenby NASA proposal for mission profiles and can be seenin table 5.
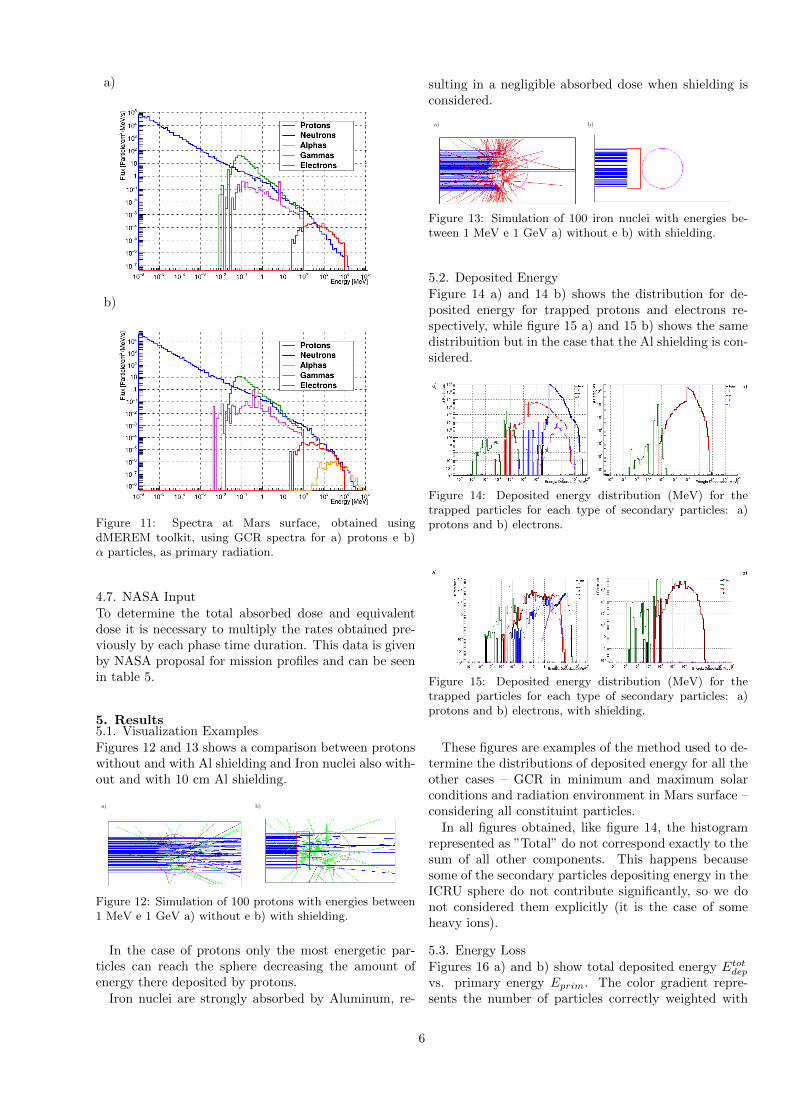
5. Results5.1. Visualization ExamplesFigures 12 and 13 shows a comparison between protonswithout and with Al shielding and Iron nuclei also with-out and with 10 cm Al shielding.
a) b)
Figure 12: Simulation of 100 protons with energies between1 MeV e 1 GeV a) without e b) with shielding.
In the case of protons only the most energetic par-ticles can reach the sphere decreasing the amount ofenergy there deposited by protons.
Iron nuclei are strongly absorbed by Aluminum, re-
sulting in a negligible absorbed dose when shielding isconsidered.
a) b)
Figure 13: Simulation of 100 iron nuclei with energies be-tween 1 MeV e 1 GeV a) without e b) with shielding.
5.2. Deposited EnergyFigure 14 a) and 14 b) shows the distribution for de-posited energy for trapped protons and electrons re-spectively, while figure 15 a) and 15 b) shows the samedistribuition but in the case that the Al shielding is con-sidered.
Figure 14: Deposited energy distribution (MeV) for thetrapped particles for each type of secondary particles: a)protons and b) electrons.
Figure 15: Deposited energy distribution (MeV) for thetrapped particles for each type of secondary particles: a)protons and b) electrons, with shielding.
These figures are examples of the method used to de-termine the distributions of deposited energy for all theother cases – GCR in minimum and maximum solarconditions and radiation environment in Mars surface –considering all constituint particles.
In all figures obtained, like figure 14, the histogramrepresented as ”Total” do not correspond exactly to thesum of all other components. This happens becausesome of the secondary particles depositing energy in theICRU sphere do not contribute significantly, so we donot considered them explicitly (it is the case of someheavy ions).
5.3. Energy LossFigures 16 a) and b) show total deposited energy Etot
dep
vs. primary energy Eprim. The color gradient repre-sents the number of particles correctly weighted with
6
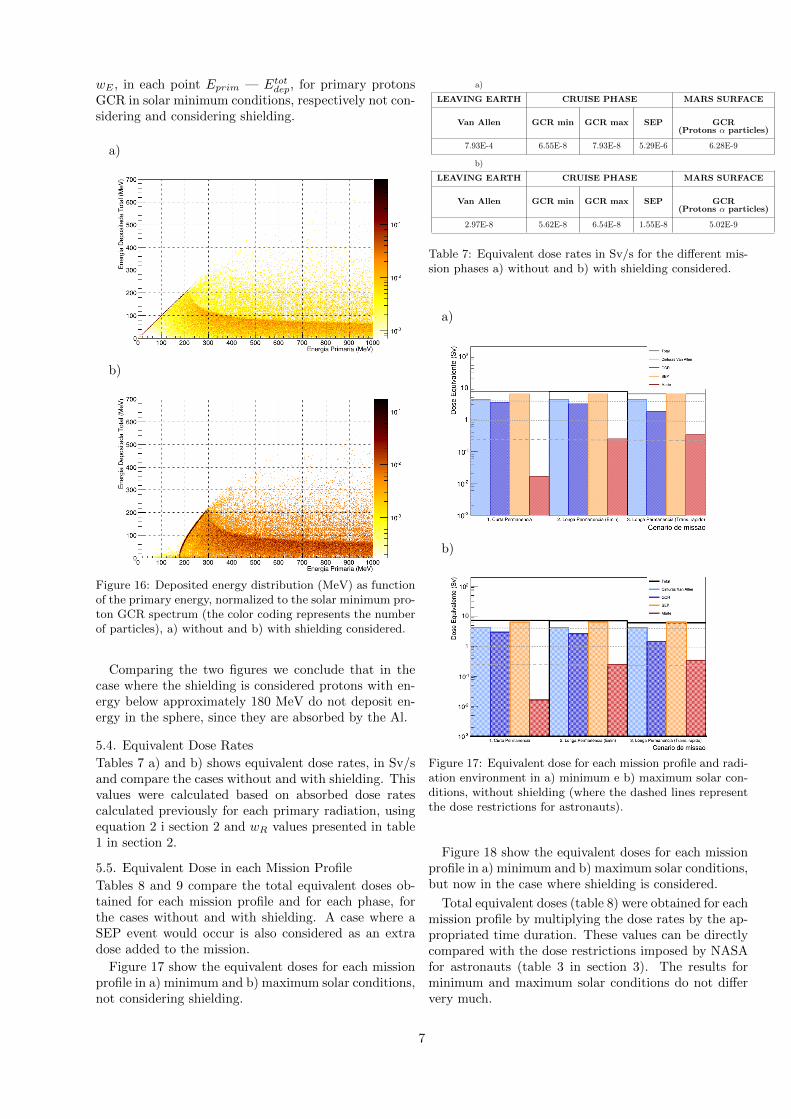
wE , in each point Eprim — Etotdep, for primary protons
GCR in solar minimum conditions, respectively not con-sidering and considering shielding.
a)
b)
Figure 16: Deposited energy distribution (MeV) as functionof the primary energy, normalized to the solar minimum pro-ton GCR spectrum (the color coding represents the numberof particles), a) without and b) with shielding considered.
Comparing the two figures we conclude that in thecase where the shielding is considered protons with en-ergy below approximately 180 MeV do not deposit en-ergy in the sphere, since they are absorbed by the Al.
5.4. Equivalent Dose Rates
Tables 7 a) and b) shows equivalent dose rates, in Sv/sand compare the cases without and with shielding. Thisvalues were calculated based on absorbed dose ratescalculated previously for each primary radiation, usingequation 2 i section 2 and wR values presented in table1 in section 2.
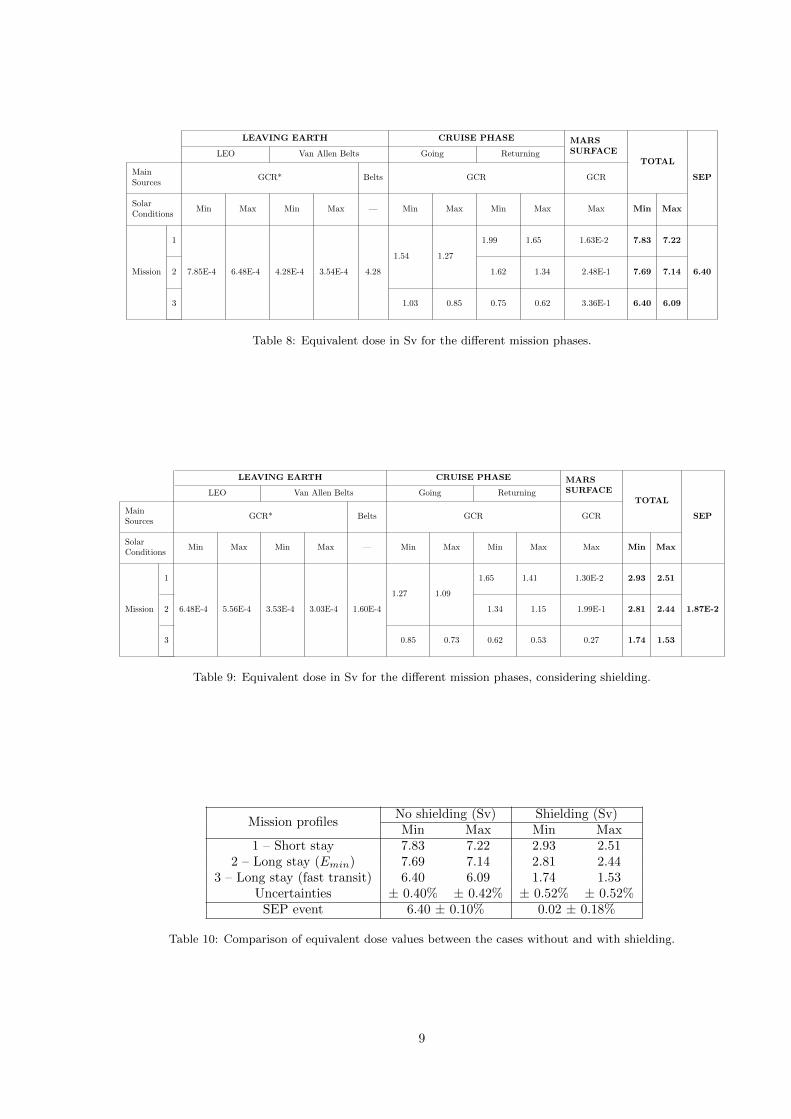
5.5. Equivalent Dose in each Mission Profile
Tables 8 and 9 compare the total equivalent doses ob-tained for each mission profile and for each phase, forthe cases without and with shielding. A case where aSEP event would occur is also considered as an extradose added to the mission.
Figure 17 show the equivalent doses for each missionprofile in a) minimum and b) maximum solar conditions,not considering shielding.
a)
LEAVING EARTH CRUISE PHASE MARS SURFACE
Van Allen GCR min GCR max SEP GCR(Protons α particles)
7.93E-4 6.55E-8 7.93E-8 5.29E-6 6.28E-9
b)
LEAVING EARTH CRUISE PHASE MARS SURFACE
Van Allen GCR min GCR max SEP GCR(Protons α particles)
2.97E-8 5.62E-8 6.54E-8 1.55E-8 5.02E-9
Table 7: Equivalent dose rates in Sv/s for the different mis-sion phases a) without and b) with shielding considered.
a)
b)
Figure 17: Equivalent dose for each mission profile and radi-ation environment in a) minimum e b) maximum solar con-ditions, without shielding (where the dashed lines representthe dose restrictions for astronauts).
Figure 18 show the equivalent doses for each missionprofile in a) minimum and b) maximum solar conditions,but now in the case where shielding is considered.
Total equivalent doses (table 8) were obtained for eachmission profile by multiplying the dose rates by the ap-propriated time duration. These values can be directlycompared with the dose restrictions imposed by NASAfor astronauts (table 3 in section 3). The results forminimum and maximum solar conditions do not differvery much.
7

a)
b)
Figure 18: Equivalent dose for each mission profile and radi-ation environment in a) minimum e b) maximum solar condi-tions, considering shielding (where the dashed lines representthe dose restrictions for astronauts).
6. Conclusions
In this work, absorbed doses and equivalent doses weredetermined for the three different mission to Mars pro-files proposed by NASA. These results were obtain fromsimulations of the relevant particles and energies presentin the radiation environments found in the three mis-sion profiles when they interact with a computationalanthropomorphic reference phantom (ICRU sphere).
The total equivalent doses (for minimum and max-imum solar activity) vary between 6.09 and 7.83Sv/mission, with an average associated uncertanty of0.41%. These results are not compatible with equivalentdose restrictions for astronauts established by NASA,which are between 1.00 and 4.00 Sv/career, depend-ing on gender and age of the astronauts. It should bepointed out that without shielding, Van Allen radiationbelts are the radiation source that contributes the mostto the total equivalent dose, with about 61% (averagevalue considering both solar conditions). Since this ra-diation source represents the highest risk for astronauts,efforts should be made to optimize the outbound trajec-tory from Earth.
Total equivalent dose values exceed maximum dose re-striction (4.00 Sv) in about 77%. The SEP event equiv-
alent dose is 6.40 Sv with an associated uncertainty of0.10%. Therefore, in the case of the occurrence of aSEP event similar to the one of December, 2006, thetotal equivalent dose exceed the maximum restrictionby a factor of 3.37. This means that if shielding is notconsidered the mission viability is compromised.
However, in a real missions astronauts are protectedby the spacecraft shielding. Therefore, the relevant re-sults for estimate the hazardous effects of radiation ex-posure are the ones obtained when a typical Aluminumshielding is considered.
Using the 10 cm Al shielding, the equivalent dose val-ues vary between 1.53 e 2.93 Sv/mission with an associ-ated uncertainty of 0.52%, corresponding (in average) toa decrease of 67%, for both solar conditions. With thisshielding the Van Allen belts contribution decreases al-most 11300 times when compared with the case withoutshielding.
The radiation environment that contribute the most,when shielding, is considered are GCR, with about 92%for an average over the three mission profiles and bothsolar conditions.
In this case, the effects from the SEP event are largelyreduced, contributing with only 0.02 Sv with an uncer-tainty of 0.18%. In this case, the SEP contributs withless than 1% to the tolatl equivalent dose, which corre-sponds to a decrease of 99.7%. This means that withthe appropriated shielding, the mission is viable even ifa SEP event similar to the one of December, 2006 wouldoccur. However, it should be noticed that in the case ofthe SEP the dose is absorbed in a short period of time,which for the studied event was of 14 days. Therefore,estimated SEP dose values should be compared with theexposure limits for short periods of time (30 day limitin table 3). The contribution from the December, 2006SEP (0.04 Sv) is under the 30 day limit for whole body,Eyes and Skin, however, harder and more intense SEPsmay exceed these limits.
In summary, table 10 represents the comparison ofequivalent dose values between the cases without andwith shielding, in both minimum and maximum solarconditions and, also the contribution in a case of a SEPevent.
In the future, should be implemented in future simu-lations a more realistic anthropomorphic phantom, nec-essary to take more detailed conclusions about doses inhuman tissues as well as other more complex shieldingstructures, with different combination of materials.
8
LEAVING EARTH CRUISE PHASE MARSSURFACE
TOTAL
SEP
LEO Van Allen Belts Going Returning
MainSources
GCR* Belts GCR GCR
SolarConditions
Min Max Min Max — Min Max Min Max Max Min Max
Mission
1
7.85E-4 6.48E-4 4.28E-4 3.54E-4 4.28
1.54 1.27
1.99 1.65 1.63E-2 7.83 7.22
6.402 1.62 1.34 2.48E-1 7.69 7.14
3 1.03 0.85 0.75 0.62 3.36E-1 6.40 6.09
Table 8: Equivalent dose in Sv for the different mission phases.
LEAVING EARTH CRUISE PHASE MARSSURFACE
TOTAL
SEP
LEO Van Allen Belts Going Returning
MainSources
GCR* Belts GCR GCR
SolarConditions
Min Max Min Max — Min Max Min Max Max Min Max
Mission
1
6.48E-4 5.56E-4 3.53E-4 3.03E-4 1.60E-4
1.27 1.09
1.65 1.41 1.30E-2 2.93 2.51
1.87E-22 1.34 1.15 1.99E-1 2.81 2.44
3 0.85 0.73 0.62 0.53 0.27 1.74 1.53
Table 9: Equivalent dose in Sv for the different mission phases, considering shielding.
Mission profilesNo shielding (Sv) Shielding (Sv)Min Max Min Max
1 – Short stay 7.83 7.22 2.93 2.512 – Long stay (Emin) 7.69 7.14 2.81 2.44
3 – Long stay (fast transit) 6.40 6.09 1.74 1.53Uncertainties ± 0.40% ± 0.42% ± 0.52% ± 0.52%
SEP event 6.40 ± 0.10% 0.02 ± 0.18%
Table 10: Comparison of equivalent dose values between the cases without and with shielding.
9
References[1] Space Flight Human-System Standard - Volume 1,
Revision A: Crew Health, NASA Technical Stan-dard, NASA-STD-300. Technical report, NASA,2015.
[2] Department of Physics and Astronomy, The Uni-versity of Utah - Updated cosmic ray spec-trum. http://www.physics.utah.edu/~whanlon/
spectrum.html, Accessed on April 2016.
[3] SPENVIS, The Space Environment InformationSystem. https://www.spenvis.oma.be, Accessedon March 2016.
[4] S. Agostinelli et. al. Geant4 - a simulation toolkit.Nucl. Instrum. Meth. A, 506:250–303, 2003.
[5] J. Allison et. al. Geant4 developments and appli-cations. IEEE Transactions on Nuclear Science,53:270–278, 2006.
[6] G. Dietze et al. Assessment of Radiation Exposureof Astronauts in Space. Technical report, The In-ternational Commission on Radiological Protection,2013.
[7] P. Goncalves et. al. The MARSREM Project: MarsRadiation Environment Models and Active Shield-ing Studies for Interplanetary Missions. The ener-getic particle radiation hazard en route to and atMars, 2013.
[8] J. Sabino. Radiation environment and effects in hu-man spaceflight: A Lunar Mission. Master Thesis,Instituto Superior Tecnico, November 2012.
[9] D. R. Williams. NASA: A Crewed Mission to Mars...http://nssdc.gsfc.nasa.gov/planetary/mars/
marsprof.html, Accessed on March 2016.
10