ecological site hx076xy107
TRANSCRIPT
Natural ResourcesConservation Service
Ecological site HX076XY107Clay Hills
Last updated: 10/29/2019Accessed: 04/08/2022
General information
MLRA notes
Classification relationships
Ecological site concept
Associated sites
Major Land Resource Area (MLRA): 076X–Bluestem Hills
MLRA 76, is located in Kansas (84 percent) and Oklahoma (16 percent). It makes up about 7,555 square miles(19,585 square kilometers). The towns of Manhattan and El Dorado, Kansas, and Pawhuska, Oklahoma, are in thisMLRA. The part of this area in Oklahoma lies between the towns of Ponca City and Bartlesville. Interstates 35 and70 cross the part of the area in Kansas. The western edge of the Potawatomi Indian Reservation and the Fort RileyMilitary Base are in the part of the area in Kansas. Most of the Osage Indian Reservation in Oklahoma is in thisarea. The area is known as the “Flint Hills” in Kansas and the “Osage Hills” in Oklahoma.
Following are the various kinds of land use in this MLRA: Cropland— private, 18 percent; Grassland—private, 69percent; Federal, 3 percent; Forest—private, 4 percent; Urban development—private, 3 percent; Water —private, 2percent; Other —private, 1 percent.
Nearly all of this area is in farms or ranches. Nearly three fourths of the area supports native grasses grazed bybeef cattle. Nearly one-fifth of the area, consisting mainly of the deeper soils in valleys and on some of the uplands,is cropland. Some winter wheat is grown as a cash crop. Other small grains, grain sorghum, alfalfa, and other kindsof hay are the major crops. These crops are also grown in small irrigated areas along the Arkansas River.
The major soil resource concerns are water erosion, surface compaction, moisture conservation, and maintenanceof the content of organic matter in the soils. Maintenance of plant health and vigor and control of noxious andinvading plants are the major management concerns on grassland.
Conservation practices on cropland generally include terraces, grassed waterways, grade-control structures,conservation tillage, and nutrient and pest management. Conservation practices on rangeland generally includebrush management, control of noxious weeds, nutrient management, and prescribed grazing.
Land Resource Region H. Central Great Plains winter wheat and range region. Major Land Resource Area (MLRA)76 Bluestem Hills.
The Clay Hills ecological site was formerly known as Clay Upland (R076XY007KS). This site occurs on summit andshoulder positions with a clay content >35 percent at depths >14 inches. The Clay Hills site has moderately deep tovery deep soils with a clay loam to silty clay surface (7 to 14 inches) over clayey subsoil. Although this site canretain large amounts of water, it is tightly held and therefore is not available in adequate amounts for the vegetationduring stress periods.

Figure 1. MLRA 76 ESD block diagram.
Table 1. Dominant plant species
Legacy ID
HX076XY115
HX076XY103
Loamy HillsThe Loamy Hills ecological site sits adjacent to and in conjunction with the Clay Hills ecological site. Thissite is made up of moderately deep to deep, moderately well to well drained upland soils. This site has afine-silty and loamy surface texture and is noncalcareous to the surface. Generally, the Loamy Hillsecological site is located on uplands with a slope range of 0 to 16 percent.
Sodic ClaypanThe Sodic Claypan ecological site sits adjacent to and in conjunction with the Clay Hills ecological site. Thisecological site is located on nearly level uplands with a slope of 3 percent or less. Most Sodic Claypan sitesare characterized by having slight depression areas often referred to as buffalo wallows occurring in thesites. The vegetation is influenced by the amount of sodium in the profile and the shallow depth to highpercent clay in the subsoil. Clay content is greater than 35 percent at a depth between 2 to 8 inches. Thissite is characterized by relatively higher amount of sodium when compared to geographically associatedsites. The amount of salts ranges from a SAR of 8 to 25, ESP of 5 to 36, and EC from .5 to 5.
Tree
Shrub
Herbaceous
Not specified
Not specified
(1) Andropogon gerardii(2) Schizachyrium scoparium
R076XY107KS
Physiographic featuresMost of MLRA 76 is in the Osage Plains Section of the Central Lowland Province of the Interior Plains. The northernend of the area is in the Dissected Till Plains Section of the same province and division. The landscape consists ofrolling hills and cuestas formed in dissected uplands that typically have narrow divides and narrow, steep-sidedvalleys where Pennsylvanian limestone bedrock is dominant. Stream valleys are less boxlike (broader) where thedominant bedrock is shale. Significant flood plains occur only along a few large streams. Elevation ranges from 980to 1,650 feet (300 to 505 meters). Local relief is generally 10 to 25 feet (3 to 8 meters), but it can be 100 to 165 feet(30 to 50 meters).
The extent of the major Hydrologic Unit Areas (identified by four-digit numbers) that make up this MLRA is asfollows: Neosho-Verdigris (1107),33 percent; Kansas (1027), 29 percent; Middle Arkansas (1103), 18 percent;Arkansas- Keystone (1106), 18 percent; and Republican (1025), 2 percent. The area has two large rivers. TheKansas River crosses the northern part of the area, and the Arkansas River runs along the southwestern edge. Thesmaller rivers that cross the area include the Vermillion, Mill, Neosho, Cottonwood, Fall, Verdigris, Grouse, Elk,Caney, and Bird Rivers.

Figure 2. MLRA 76 ESD block diagram.
Table 2. Representative physiographic features
The Clay Hills ecological site is found on nearly level or gently sloping uplands. The slope gradient ranges from 0 to7 percent.
Hillslope profile
Landforms (1) Hills > Interfluve
(2) Hills > River valley
(3) Hills > Paleoterrace
Runoff class High to
very high
Ponding frequency None
Elevation 990 – 1,650 ft
Slope 0 – 7%
Aspect Aspect is not a significant factor
(1) Summit(2) Shoulder
Climatic features
Table 3. Representative climatic features
The climate of this area is typically continental, being in the interior of a large landmass at mid latitudes. Large dailyand annual variations in temperature are common. Winters are cold because of frequent polar air masses movinginto the area from the north from December into March. Summer temperatures are warm and usually prevail forabout six months of the year. June typically has the most rainfall, and January is the driest. Most of the rainfalloccurs as high-intensity, convective thunderstorms. The annual snowfall averages 14 to 20 inches (355 to 510millimeters). Drought occurs on an average of 3 times in a 30-year period (1981-2010) in MLRA 76.
The climate data listed in the following tables represent minimum and maximum averages and ranges for theclimate stations located throughout MLRA 76. The dates referenced are from 1981-2010 (latest 30 year average).Average annual precipitation for this MLRA ranges from 32 to 40 inches (810 to 1020 millimeters). All weather datais supported by the National Oceanic and Atmospheric Administration (NOAA) 1981-2010 Climate Normals. For theaverage annual precipitation of individual climate station locations and additional climate data, access the NationalWater and Climate Center at http://www.wcc.nrcs.usda.gov
Frost-free period (characteristic range) 144-162 days
Freeze-free period (characteristic range) 177-192 days
Precipitation total (characteristic range) 34-39 in
Frost-free period (actual range) 140-171 days
Freeze-free period (actual range) 167-194 days

Figure 3. Monthly precipitation range
Figure 4. Monthly minimum temperature range
Figure 5. Monthly maximum temperature range
Precipitation total (actual range) 33-40 in
Frost-free period (average) 154 days
Freeze-free period (average) 185 days
Precipitation total (average) 36 in
0 in
2 in
4 in
6 in
8 in
Jan Feb Mar Apr May Jun Jul Aug Sep Oct Nov Dec
Characteristic range highCharacteristic range low
20 °F
40 °F
60 °F
80 °F
Jan Feb Mar Apr May Jun Jul Aug Sep Oct Nov Dec
Characteristic range highCharacteristic range low
40 °F
60 °F
80 °F
100 °F
Jan Feb Mar Apr May Jun Jul Aug Sep Oct Nov Dec
Characteristic range highCharacteristic range low

Figure 6. Monthly average minimum and maximum temperature
Figure 7. Annual precipitation pattern
Figure 8. Annual average temperature pattern
Climate stations used
20 °F
40 °F
60 °F
80 °F
100 °F
120 °F
Jan Feb Mar Apr May Jun Jul Aug Sep Oct Nov Dec
MaximumMinimum
15 in
20 in
25 in
30 in
35 in
40 in
45 in
50 in
1980 1985 1990 1995 2000 2005 2010
52 °F
53 °F
54 °F
55 °F
56 °F
57 °F
58 °F
59 °F
1980 1985 1990 1995 2000 2005 2010
(1) TUTTLE CREEK LAKE [USC00148259], Manhattan, KS(2) MANHATTAN [USC00144972], Manhattan, KS(3) WAMEGO 4 W [USC00148563], Wamego, KS(4) MANHATTAN MUNI AP [USW00003936], Manhattan, KS(5) MANHATTAN 6 SSW [USW00053974], Manhattan, KS(6) COUNCIL GROVE LAKE [USC00141867], Council Grove, KS(7) TALLGRASS PRAIRIE NP [USC00148061], Strong City, KS(8) COTTONWOOD FALLS [USC00141858], Cottonwood Falls, KS(9) FLORENCE [USC00142773], Florence, KS(10) CASSODAY 2SW [USC00141351], Cassoday, KS(11) EL DORADO [USC00142401], El Dorado, KS(12) EUREKA 1E [USC00142622], Eureka, KS(13) SMILEYBERG 1N [USC00147534], Douglass, KS(14) WINFIELD 3NE [USC00148964], Winfield, KS(15) HOWARD 1W [USC00143822], Howard, KS
Influencing water features
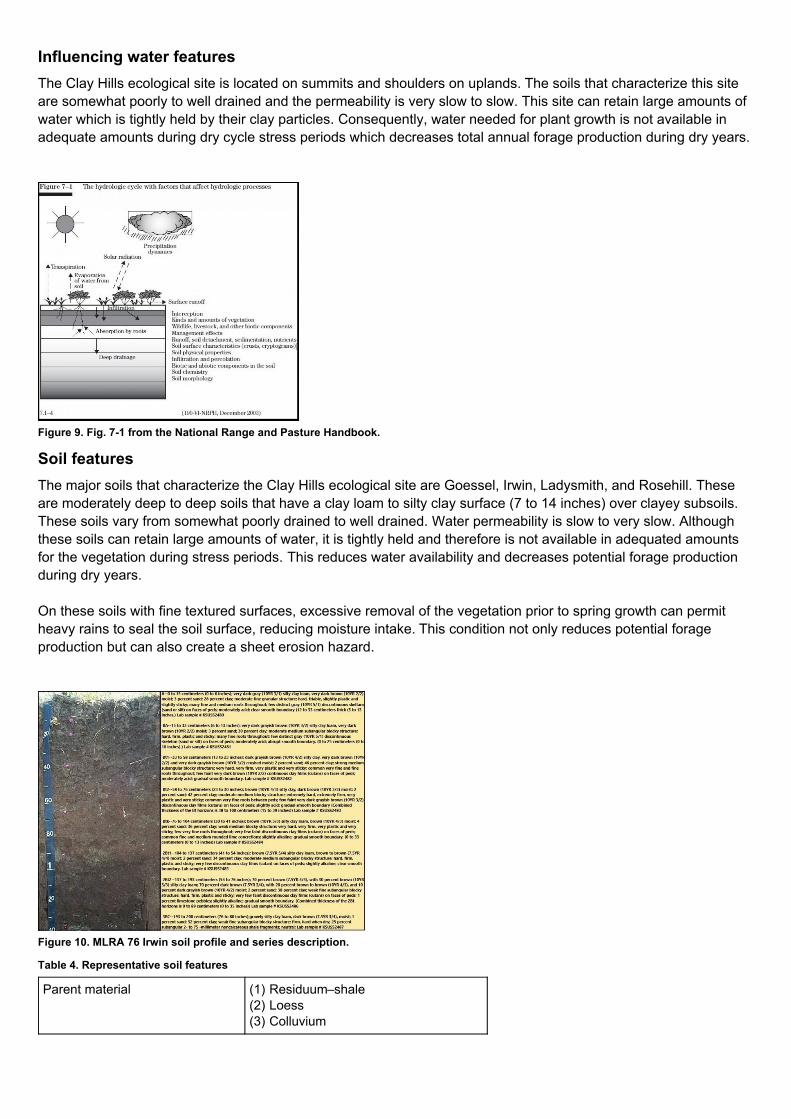
Figure 9. Fig. 7-1 from the National Range and Pasture Handbook.
The Clay Hills ecological site is located on summits and shoulders on uplands. The soils that characterize this siteare somewhat poorly to well drained and the permeability is very slow to slow. This site can retain large amounts ofwater which is tightly held by their clay particles. Consequently, water needed for plant growth is not available inadequate amounts during dry cycle stress periods which decreases total annual forage production during dry years.
Soil features
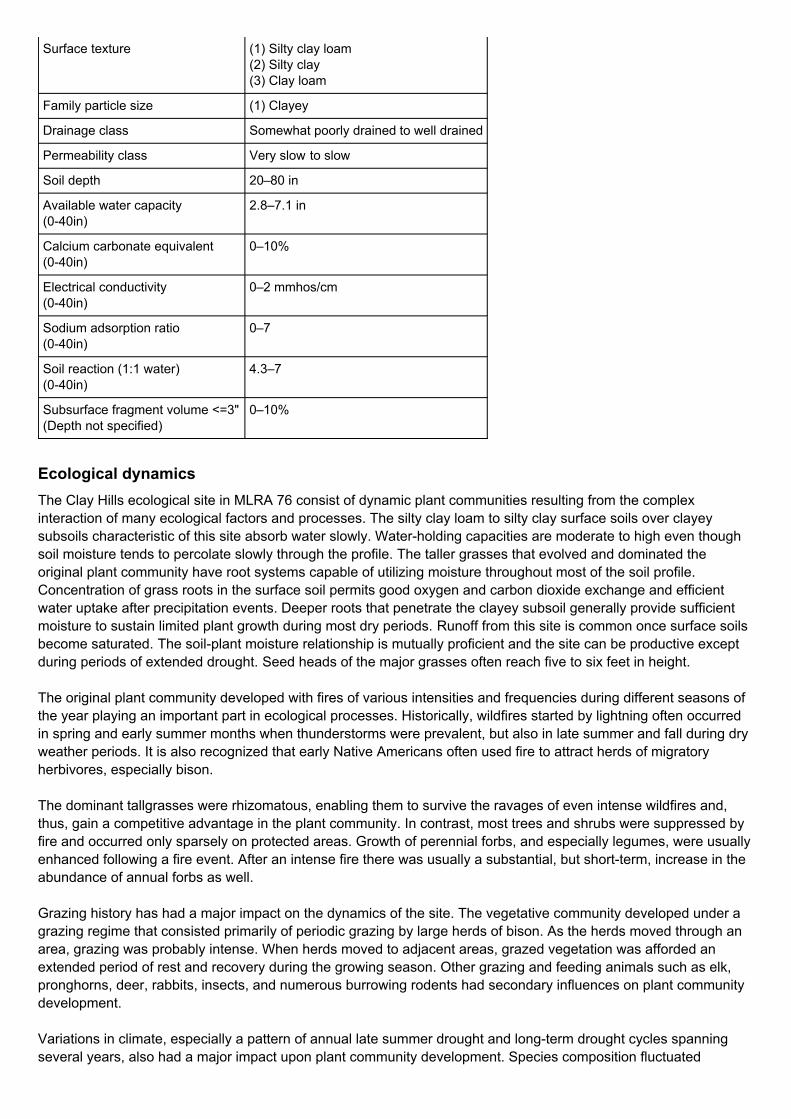
Figure 10. MLRA 76 Irwin soil profile and series description.
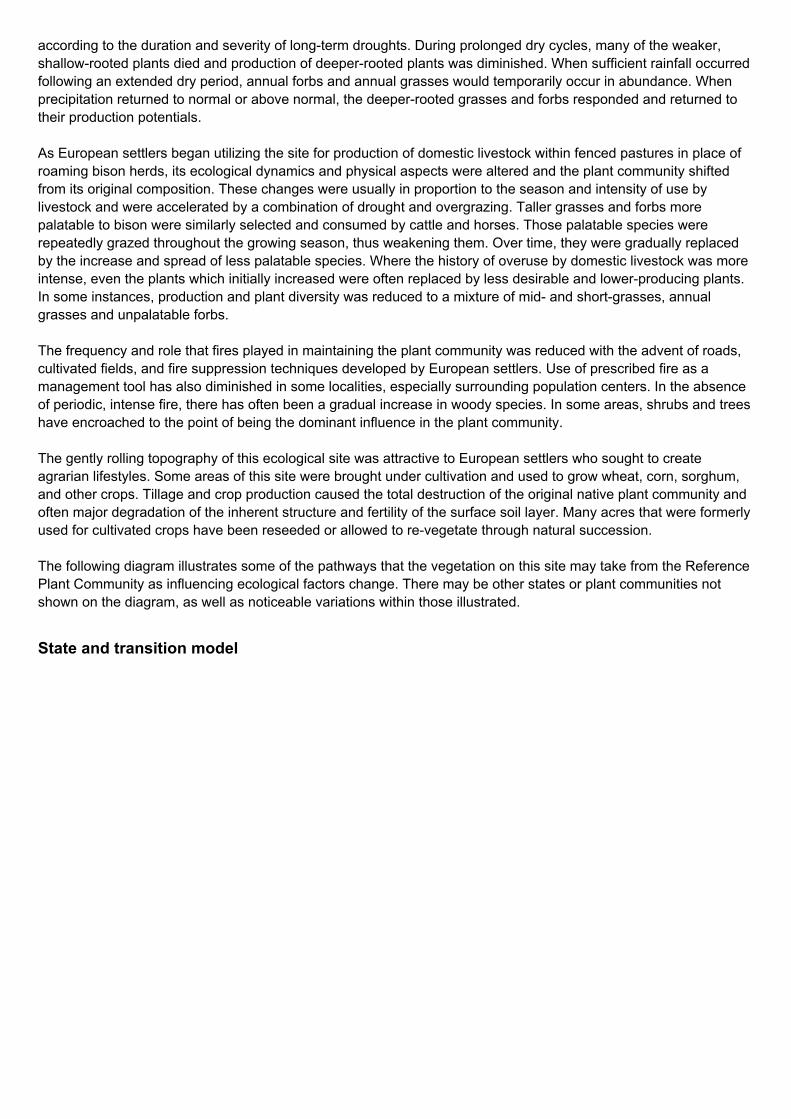
Table 4. Representative soil features
The major soils that characterize the Clay Hills ecological site are Goessel, Irwin, Ladysmith, and Rosehill. Theseare moderately deep to deep soils that have a clay loam to silty clay surface (7 to 14 inches) over clayey subsoils.These soils vary from somewhat poorly drained to well drained. Water permeability is slow to very slow. Althoughthese soils can retain large amounts of water, it is tightly held and therefore is not available in adequated amountsfor the vegetation during stress periods. This reduces water availability and decreases potential forage productionduring dry years.
On these soils with fine textured surfaces, excessive removal of the vegetation prior to spring growth can permitheavy rains to seal the soil surface, reducing moisture intake. This condition not only reduces potential forageproduction but can also create a sheet erosion hazard.
Parent material (1) Residuum – shale
(2) Loess
(3) Colluvium
Surface texture
Family particle size
Drainage class Somewhat poorly drained to
well drained
Permeability class Very slow to
slow
Soil depth 20 – 80 in
Available water capacity(0-40in)
2.8 – 7.1 in
Calcium carbonate equivalent(0-40in)
0 – 10%
Electrical conductivity(0-40in)
0 – 2 mmhos/cm
Sodium adsorption ratio(0-40in)
0 – 7
Soil reaction (1:1 water)(0-40in)
4.3 – 7
Subsurface fragment volume <=3"(Depth not specified)
0 – 10%
(1) Silty clay loam(2) Silty clay(3) Clay loam
(1) Clayey
Ecological dynamicsThe Clay Hills ecological site in MLRA 76 consist of dynamic plant communities resulting from the complexinteraction of many ecological factors and processes. The silty clay loam to silty clay surface soils over clayeysubsoils characteristic of this site absorb water slowly. Water-holding capacities are moderate to high even thoughsoil moisture tends to percolate slowly through the profile. The taller grasses that evolved and dominated theoriginal plant community have root systems capable of utilizing moisture throughout most of the soil profile.Concentration of grass roots in the surface soil permits good oxygen and carbon dioxide exchange and efficientwater uptake after precipitation events. Deeper roots that penetrate the clayey subsoil generally provide sufficientmoisture to sustain limited plant growth during most dry periods. Runoff from this site is common once surface soilsbecome saturated. The soil-plant moisture relationship is mutually proficient and the site can be productive exceptduring periods of extended drought. Seed heads of the major grasses often reach five to six feet in height.
The original plant community developed with fires of various intensities and frequencies during different seasons ofthe year playing an important part in ecological processes. Historically, wildfires started by lightning often occurredin spring and early summer months when thunderstorms were prevalent, but also in late summer and fall during dryweather periods. It is also recognized that early Native Americans often used fire to attract herds of migratoryherbivores, especially bison.
The dominant tallgrasses were rhizomatous, enabling them to survive the ravages of even intense wildfires and,thus, gain a competitive advantage in the plant community. In contrast, most trees and shrubs were suppressed byfire and occurred only sparsely on protected areas. Growth of perennial forbs, and especially legumes, were usuallyenhanced following a fire event. After an intense fire there was usually a substantial, but short-term, increase in theabundance of annual forbs as well.
Grazing history has had a major impact on the dynamics of the site. The vegetative community developed under agrazing regime that consisted primarily of periodic grazing by large herds of bison. As the herds moved through anarea, grazing was probably intense. When herds moved to adjacent areas, grazed vegetation was afforded anextended period of rest and recovery during the growing season. Other grazing and feeding animals such as elk,pronghorns, deer, rabbits, insects, and numerous burrowing rodents had secondary influences on plant communitydevelopment.
Variations in climate, especially a pattern of annual late summer drought and long-term drought cycles spanningseveral years, also had a major impact upon plant community development. Species composition fluctuated
State and transition model
according to the duration and severity of long-term droughts. During prolonged dry cycles, many of the weaker,shallow-rooted plants died and production of deeper-rooted plants was diminished. When sufficient rainfall occurredfollowing an extended dry period, annual forbs and annual grasses would temporarily occur in abundance. Whenprecipitation returned to normal or above normal, the deeper-rooted grasses and forbs responded and returned totheir production potentials.
As European settlers began utilizing the site for production of domestic livestock within fenced pastures in place ofroaming bison herds, its ecological dynamics and physical aspects were altered and the plant community shiftedfrom its original composition. These changes were usually in proportion to the season and intensity of use bylivestock and were accelerated by a combination of drought and overgrazing. Taller grasses and forbs morepalatable to bison were similarly selected and consumed by cattle and horses. Those palatable species wererepeatedly grazed throughout the growing season, thus weakening them. Over time, they were gradually replacedby the increase and spread of less palatable species. Where the history of overuse by domestic livestock was moreintense, even the plants which initially increased were often replaced by less desirable and lower-producing plants.In some instances, production and plant diversity was reduced to a mixture of mid- and short-grasses, annualgrasses and unpalatable forbs.
The frequency and role that fires played in maintaining the plant community was reduced with the advent of roads,cultivated fields, and fire suppression techniques developed by European settlers. Use of prescribed fire as amanagement tool has also diminished in some localities, especially surrounding population centers. In the absenceof periodic, intense fire, there has often been a gradual increase in woody species. In some areas, shrubs and treeshave encroached to the point of being the dominant influence in the plant community.
The gently rolling topography of this ecological site was attractive to European settlers who sought to createagrarian lifestyles. Some areas of this site were brought under cultivation and used to grow wheat, corn, sorghum,and other crops. Tillage and crop production caused the total destruction of the original native plant community andoften major degradation of the inherent structure and fertility of the surface soil layer. Many acres that were formerlyused for cultivated crops have been reseeded or allowed to re-vegetate through natural succession.
The following diagram illustrates some of the pathways that the vegetation on this site may take from the ReferencePlant Community as influencing ecological factors change. There may be other states or plant communities notshown on the diagram, as well as noticeable variations within those illustrated.
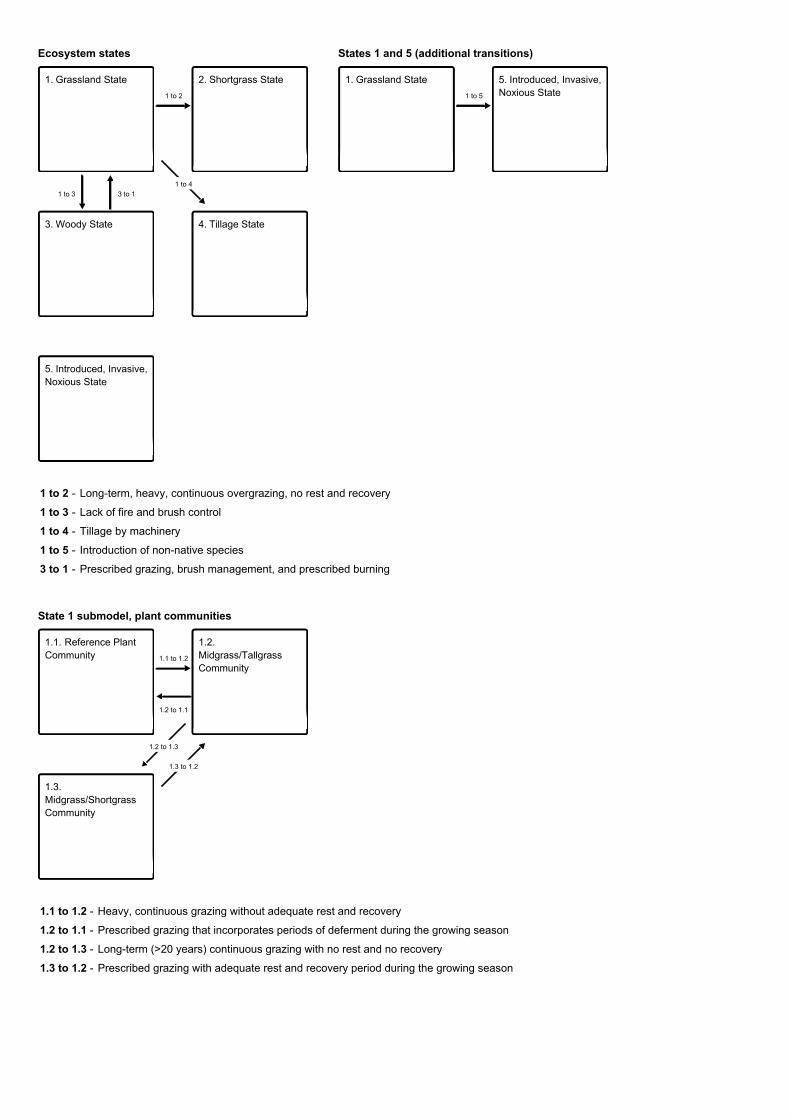
Ecosystem states States 1 and 5 (additional transitions)
1 to 2 - Long-term, heavy, continuous overgrazing, no rest and recovery
1 to 3 - Lack of fire and brush control
1 to 4 - Tillage by machinery
1 to 5 - Introduction of non-native species
3 to 1 - Prescribed grazing, brush management, and prescribed burning
State 1 submodel, plant communities
1.1 to 1.2 - Heavy, continuous grazing without adequate rest and recovery
1.2 to 1.1 - Prescribed grazing that incorporates periods of deferment during the growing season
1.2 to 1.3 - Long-term (>20 years) continuous grazing with no rest and no recovery
1.3 to 1.2 - Prescribed grazing with adequate rest and recovery period during the growing season
1 to 2
1 to 3 3 to 11 to 4
1. Grassland State 2. Shortgrass State
3. Woody State 4. Tillage State
5. Introduced, Invasive,Noxious State
1 to 5
1. Grassland State 5. Introduced, Invasive,Noxious State
1.1 to 1.2
1.2 to 1.1
1.2 to 1.3
1.3 to 1.2
1.1. Reference PlantCommunity
1.2.Midgrass/TallgrassCommunity
1.3.Midgrass/ShortgrassCommunity
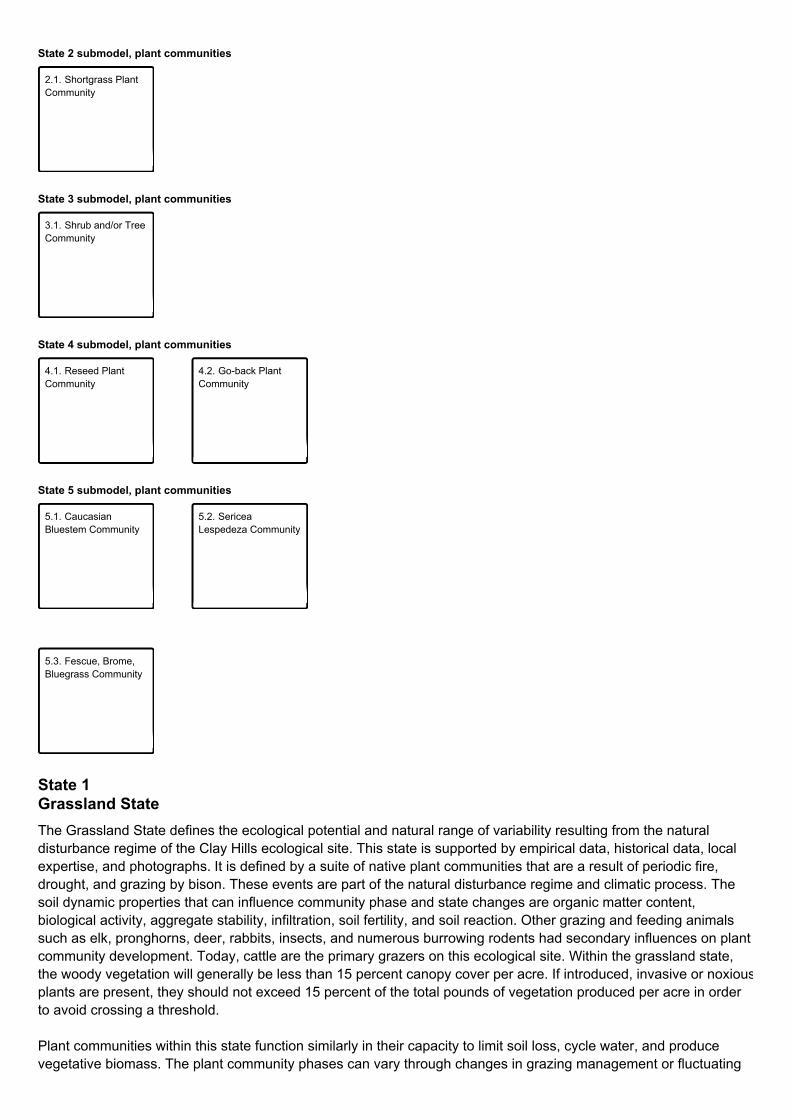
State 2 submodel, plant communities
State 3 submodel, plant communities
State 4 submodel, plant communities
State 5 submodel, plant communities
2.1. Shortgrass PlantCommunity
3.1. Shrub and/or TreeCommunity
4.1. Reseed PlantCommunity
4.2. Go-back PlantCommunity
5.1. CaucasianBluestem Community
5.2. SericeaLespedeza Community
5.3. Fescue, Brome,Bluegrass Community
State 1Grassland StateThe Grassland State defines the ecological potential and natural range of variability resulting from the naturaldisturbance regime of the Clay Hills ecological site. This state is supported by empirical data, historical data, localexpertise, and photographs. It is defined by a suite of native plant communities that are a result of periodic fire,drought, and grazing by bison. These events are part of the natural disturbance regime and climatic process. Thesoil dynamic properties that can influence community phase and state changes are organic matter content,biological activity, aggregate stability, infiltration, soil fertility, and soil reaction. Other grazing and feeding animalssuch as elk, pronghorns, deer, rabbits, insects, and numerous burrowing rodents had secondary influences on plantcommunity development. Today, cattle are the primary grazers on this ecological site. Within the grassland state,the woody vegetation will generally be less than 15 percent canopy cover per acre. If introduced, invasive or noxiousplants are present, they should not exceed 15 percent of the total pounds of vegetation produced per acre in orderto avoid crossing a threshold.
Plant communities within this state function similarly in their capacity to limit soil loss, cycle water, and producevegetative biomass. The plant community phases can vary through changes in grazing management or fluctuating

Community 1.1Reference Plant Community
Dominant plant species
Table 5. Annual production by plant type
climatic conditions. The variables that control the resilience of this grassland state are long-term grazingmanagement and frequency of fire.
Characteristics and indicators. Tallgrasses and Migrasses are dominant in the Grassland State.
Resilience management. Management strategies that will sustain this state include monitoring key forage speciesand providing a forage and animal balance.
The interpretive plant community for the Clay Hills ecological site is the Reference Plant Community, and representsthe original plant community that existed prior to European settlement. Characterized as open grassland essentiallyfree of trees and large shrubs, it is dominated by tall, warm-season grasses including big bluestem, switchgrass,and Indiangrass. Little bluestem, a midgrass, is also a major component of this community. These grasses willaccount for 70 to 80 percent of vegetation produced annually. Eastern gamagrass occasionally will occur wheresoils are moist due to underground seepage or run-in from adjacent slopes. Other prevalent midgrasses aresideoats grama, purple lovegrass, prairie junegrass, and porcupinegrass. Native shortgrasses such as buffalograssand blue grama were a minor component of this community.
The site supports a wide variety of native legumes and forbs interspersed throughout the grass sward. The mostabundant legumes are Nuttall’s sensitive-briar, compassplant, prairie bundleflower, Maximillian sunflower, blue wildindigo, and slimflower scurfpea. Other prominent forbs include Cuman ragweed, groundplum milkvetch, Americanlicorice, roundhead lespedeza, and pitcher sage.
Leadplant and Jersey tea are low-growing, fire-tolerant shrubs that occur over the site. A few small clumps ofsmooth sumac may be found in areas where they partially escape the effects of intense fires.
Resilience management. This is a stable plant community when grazing and fire are adequately managed. Aprescribed grazing program that incorporates periods of grazing rest and recovery of key forage species during thegrowing season benefits the tallgrasses as well as the more palatable forb species. Excessive grazing and livestocktrailing can quickly impact soil stability and lead to sheet and gully erosion. Because this site often occurs onsummits, shoulders, and other high elevations on the landscape, it is preferred by grazing animals during the hotdays of late summer. Cattle and other livestock commonly graze into the prevailing southerly winds and find loafingareas in this site to gain relief from heat and insects. Concentrated livestock use, such as winter feeding areas, cancause compaction of the wet, clay soils and stress the dominant tallgrasses.
big bluestem (Andropogon gerardii), grasslittle bluestem (Schizachyrium scoparium), grassIndiangrass (Sorghastrum nutans), grassswitchgrass (Panicum virgatum), grass
Plant TypeLow
(Lb/Acre)Representative Value
(Lb/Acre)High
(Lb/Acre)
Grass/Grasslike 2200 3960 5720
Forb 250 450 650
Shrub/Vine 50 90 130
Total 2500 4500 6500
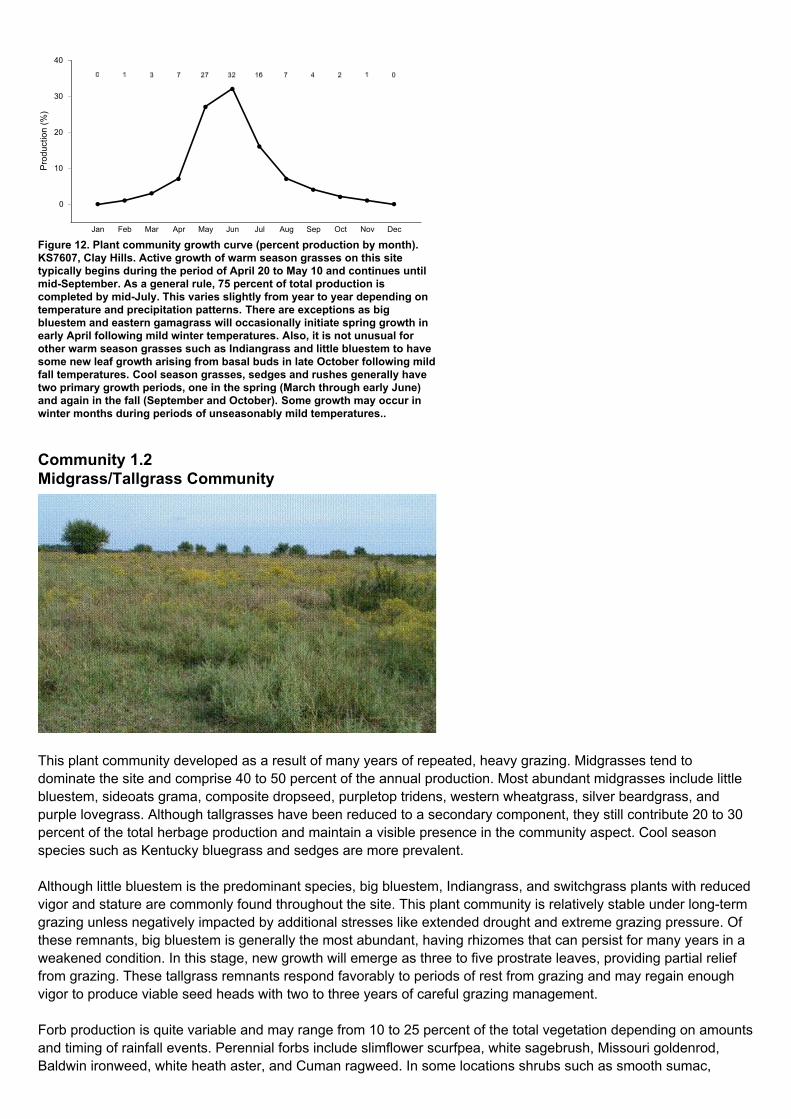
Figure 12. Plant community growth curve (percent production by month).KS7607, Clay Hills. Active growth of warm season grasses on this sitetypically begins during the period of April 20 to May 10 and continues untilmid-September. As a general rule, 75 percent of total production iscompleted by mid-July. This varies slightly from year to year depending ontemperature and precipitation patterns. There are exceptions as bigbluestem and eastern gamagrass will occasionally initiate spring growth inearly April following mild winter temperatures. Also, it is not unusual forother warm season grasses such as Indiangrass and little bluestem to havesome new leaf growth arising from basal buds in late October following mildfall temperatures. Cool season grasses, sedges and rushes generally havetwo primary growth periods, one in the spring (March through early June)and again in the fall (September and October). Some growth may occur inwinter months during periods of unseasonably mild temperatures..
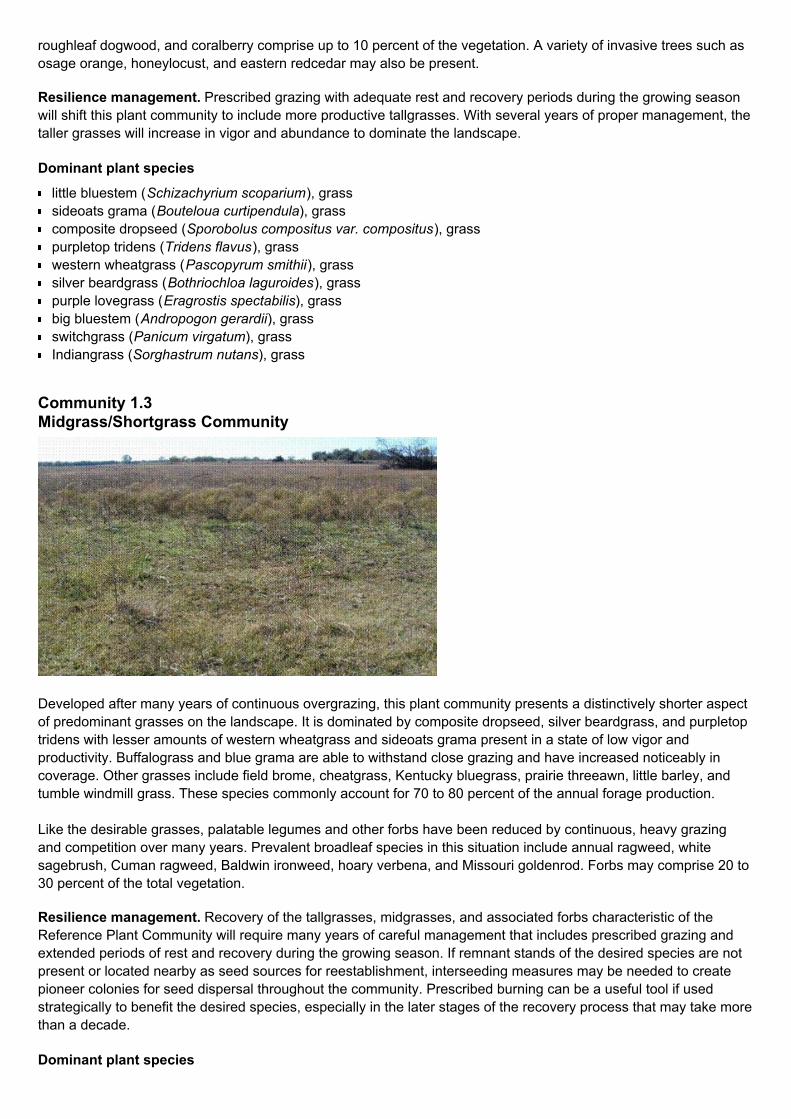
Community 1.2Midgrass/Tallgrass Community
Jan Feb Mar Apr May Jun Jul Aug Sep Oct Nov Dec
0
10
20
30
40
Pro
duct
ion
(%)
This plant community developed as a result of many years of repeated, heavy grazing. Midgrasses tend todominate the site and comprise 40 to 50 percent of the annual production. Most abundant midgrasses include littlebluestem, sideoats grama, composite dropseed, purpletop tridens, western wheatgrass, silver beardgrass, andpurple lovegrass. Although tallgrasses have been reduced to a secondary component, they still contribute 20 to 30percent of the total herbage production and maintain a visible presence in the community aspect. Cool seasonspecies such as Kentucky bluegrass and sedges are more prevalent.
Although little bluestem is the predominant species, big bluestem, Indiangrass, and switchgrass plants with reducedvigor and stature are commonly found throughout the site. This plant community is relatively stable under long-termgrazing unless negatively impacted by additional stresses like extended drought and extreme grazing pressure. Ofthese remnants, big bluestem is generally the most abundant, having rhizomes that can persist for many years in aweakened condition. In this stage, new growth will emerge as three to five prostrate leaves, providing partial relieffrom grazing. These tallgrass remnants respond favorably to periods of rest from grazing and may regain enoughvigor to produce viable seed heads with two to three years of careful grazing management.
Forb production is quite variable and may range from 10 to 25 percent of the total vegetation depending on amountsand timing of rainfall events. Perennial forbs include slimflower scurfpea, white sagebrush, Missouri goldenrod,Baldwin ironweed, white heath aster, and Cuman ragweed. In some locations shrubs such as smooth sumac,
Dominant plant species
Community 1.3Midgrass/Shortgrass Community
Dominant plant species
roughleaf dogwood, and coralberry comprise up to 10 percent of the vegetation. A variety of invasive trees such asosage orange, honeylocust, and eastern redcedar may also be present.
Resilience management. Prescribed grazing with adequate rest and recovery periods during the growing seasonwill shift this plant community to include more productive tallgrasses. With several years of proper management, thetaller grasses will increase in vigor and abundance to dominate the landscape.
little bluestem (Schizachyrium scoparium), grasssideoats grama (Bouteloua curtipendula), grasscomposite dropseed (Sporobolus compositus var. compositus), grasspurpletop tridens (Tridens flavus), grasswestern wheatgrass (Pascopyrum smithii), grasssilver beardgrass (Bothriochloa laguroides), grasspurple lovegrass (Eragrostis spectabilis), grassbig bluestem (Andropogon gerardii), grassswitchgrass (Panicum virgatum), grassIndiangrass (Sorghastrum nutans), grass
Developed after many years of continuous overgrazing, this plant community presents a distinctively shorter aspectof predominant grasses on the landscape. It is dominated by composite dropseed, silver beardgrass, and purpletoptridens with lesser amounts of western wheatgrass and sideoats grama present in a state of low vigor andproductivity. Buffalograss and blue grama are able to withstand close grazing and have increased noticeably incoverage. Other grasses include field brome, cheatgrass, Kentucky bluegrass, prairie threeawn, little barley, andtumble windmill grass. These species commonly account for 70 to 80 percent of the annual forage production.
Like the desirable grasses, palatable legumes and other forbs have been reduced by continuous, heavy grazingand competition over many years. Prevalent broadleaf species in this situation include annual ragweed, whitesagebrush, Cuman ragweed, Baldwin ironweed, hoary verbena, and Missouri goldenrod. Forbs may comprise 20 to30 percent of the total vegetation.
Resilience management. Recovery of the tallgrasses, midgrasses, and associated forbs characteristic of theReference Plant Community will require many years of careful management that includes prescribed grazing andextended periods of rest and recovery during the growing season. If remnant stands of the desired species are notpresent or located nearby as seed sources for reestablishment, interseeding measures may be needed to createpioneer colonies for seed dispersal throughout the community. Prescribed burning can be a useful tool if usedstrategically to benefit the desired species, especially in the later stages of the recovery process that may take morethan a decade.
Pathway 1.1 to 1.2Community 1.1 to 1.2
Pathway 1.2 to 1.1Community 1.2 to 1.1
Conservation practices
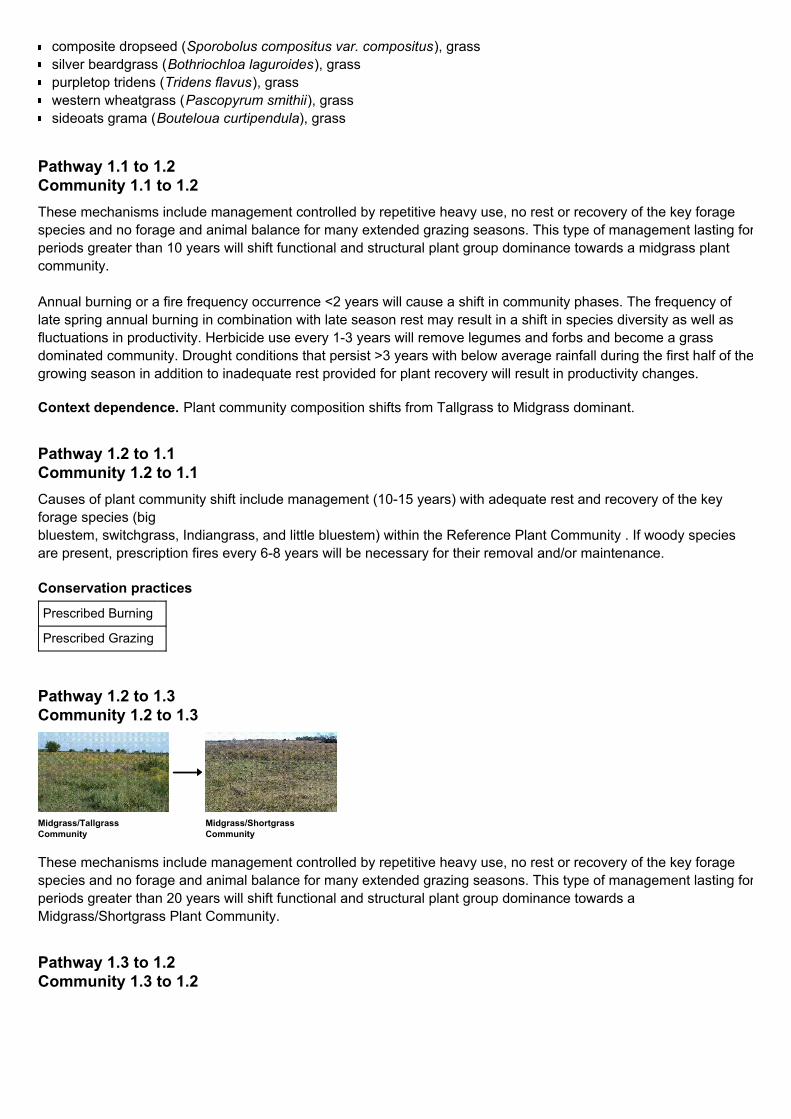
Pathway 1.2 to 1.3Community 1.2 to 1.3
Pathway 1.3 to 1.2Community 1.3 to 1.2
composite dropseed (Sporobolus compositus var. compositus), grasssilver beardgrass (Bothriochloa laguroides), grasspurpletop tridens (Tridens flavus), grasswestern wheatgrass (Pascopyrum smithii), grasssideoats grama (Bouteloua curtipendula), grass
These mechanisms include management controlled by repetitive heavy use, no rest or recovery of the key foragespecies and no forage and animal balance for many extended grazing seasons. This type of management lasting forperiods greater than 10 years will shift functional and structural plant group dominance towards a midgrass plantcommunity.
Annual burning or a fire frequency occurrence <2 years will cause a shift in community phases. The frequency oflate spring annual burning in combination with late season rest may result in a shift in species diversity as well asfluctuations in productivity. Herbicide use every 1-3 years will remove legumes and forbs and become a grassdominated community. Drought conditions that persist >3 years with below average rainfall during the first half of thegrowing season in addition to inadequate rest provided for plant recovery will result in productivity changes.
Context dependence. Plant community composition shifts from Tallgrass to Midgrass dominant.
Causes of plant community shift include management (10-15 years) with adequate rest and recovery of the keyforage species (bigbluestem, switchgrass, Indiangrass, and little bluestem) within the Reference Plant Community . If woody speciesare present, prescription fires every 6-8 years will be necessary for their removal and/or maintenance.
Prescribed Burning
Prescribed Grazing
Midgrass/TallgrassCommunity
Midgrass/ShortgrassCommunity
These mechanisms include management controlled by repetitive heavy use, no rest or recovery of the key foragespecies and no forage and animal balance for many extended grazing seasons. This type of management lasting forperiods greater than 20 years will shift functional and structural plant group dominance towards aMidgrass/Shortgrass Plant Community.

Conservation practices
State 2Shortgrass State
Community 2.1Shortgrass Plant Community
Midgrass/ShortgrassCommunity
Midgrass/TallgrassCommunity
Causes of plant community shift include management (10-15 years) with adequate rest and recovery of the keyforage species (little bluestem, sideoats grama, big bluestem, switchgrass, and Indiangrass) within theMidgrass/Tallgrass Plant Community . If woody species are present, prescription fires every 6-8 years will benecessary for their removal and/or maintenance.
Prescribed Burning
Prescribed Grazing
With heavy, continuous grazing, blue grama and buffalograss will become the dominant species and have a sod-bound appearance. Unable to withstand the grazing pressure, only a remnant population of western wheatgrassremains.
Characteristics and indicators. The Shortgrass State is characterized with specific dynamic soil propertychanges. Changes between the Grassland State and the Shortgrass State has been documented. As plantcommunity cover decreases from bunchgrasses to more of the sod grasses there is a decrease in infiltration andinterception and an increase in surface runoff (Thurow T., 2003).
Resilience management. This is a resistant and resilient state. Grazing management practice should include aforage and animal balance.
This plant community presents a distinctive shortgrass aspect on the landscape. It is dominated by blue grama andbuffalograss with notable amounts of western wheatgrass and sideoats grama present. Other grasses includeannual bromes, composite dropseed, Kentucky bluegrass, prairie threeawn, and tumble windmill grass. Thesespecies commonly account for 60 to 70 percent of the annual forage production.
Like the desirable grasses, palatable legumes and other forbs have been reduced by continuous grazing andcompetition over many years. Prevalent broadleaf species in this situation include prairie broomweed, annualragweed, white sagebrush, Cuman ragweed, interior ironweed, wavyleaf thistle, and curlycup gumweed. Forbs maycomprise 15 to 25 percent of the total vegetation.
This plant community often contains 15 to 20 percent woody species as a result of fewer fires and moreopportunities for their encroachment. Eastern redcedar, smooth and/or fragrant sumac, roughleaf dogwood, andcoralberry are representative trees and shrubs which occur on this site. Leadplant and Jersey tea may still be found,but are generally much reduced from their prominence in the Reference Plant Community.
Resilience management. This plant community can be managed as a stable shortgrass plant community. Ifrecovery of the tallgrasses, midgrasses, and associated forbs characteristic of the Reference Plant Community isdesired, however, many years of careful management that includes prescribed grazing and extended periods of restduring the growing season will be required. More study is necessary in order to document restoration processes tothe Grassland State. This site may recover faster than adjoining ones as remnant plants may be somewhatprotected by the steeper slopes and occasional surface rocks. Where remnant stands of the desired species are notavailable on or near the site, reseeding may be necessary to advance recovery. However, seeding or interseedingmay be severely limited by the steepness of slope and occasional surface rocks.
Dominant plant species
State 3Woody State
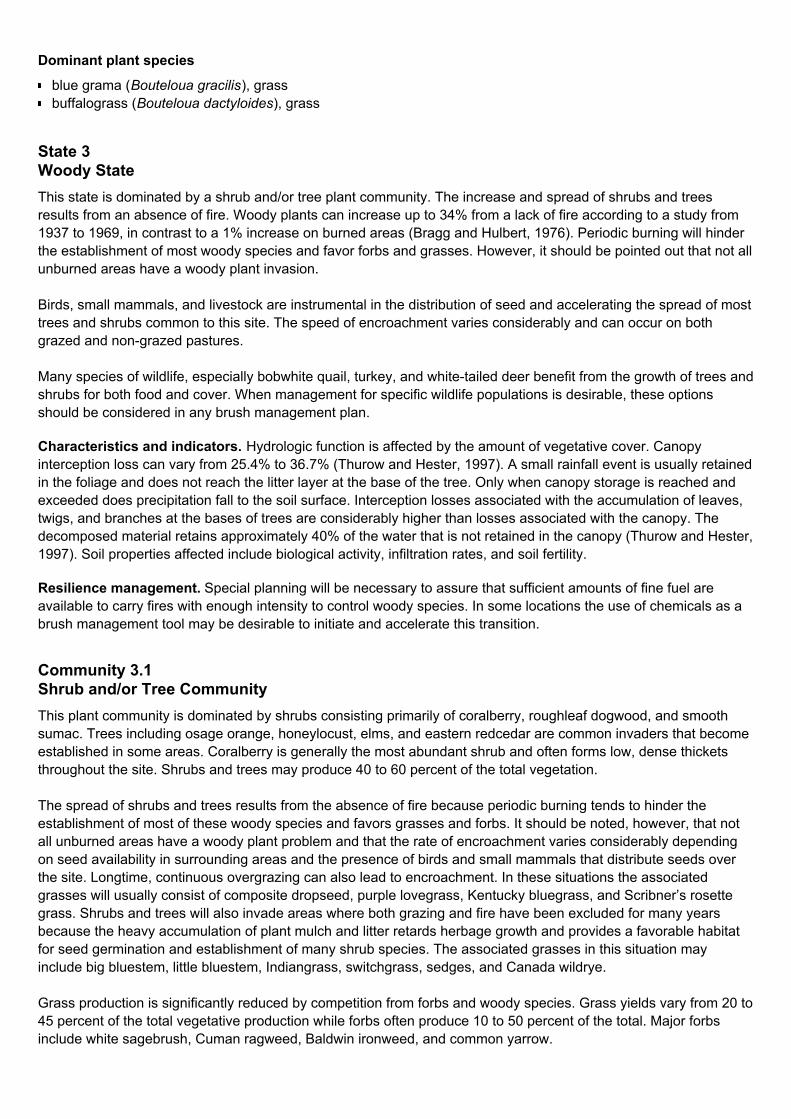
Community 3.1Shrub and/or Tree Community
blue grama (Bouteloua gracilis), grassbuffalograss (Bouteloua dactyloides), grass
This state is dominated by a shrub and/or tree plant community. The increase and spread of shrubs and treesresults from an absence of fire. Woody plants can increase up to 34% from a lack of fire according to a study from1937 to 1969, in contrast to a 1% increase on burned areas (Bragg and Hulbert, 1976). Periodic burning will hinderthe establishment of most woody species and favor forbs and grasses. However, it should be pointed out that not allunburned areas have a woody plant invasion.
Birds, small mammals, and livestock are instrumental in the distribution of seed and accelerating the spread of mosttrees and shrubs common to this site. The speed of encroachment varies considerably and can occur on bothgrazed and non-grazed pastures.
Many species of wildlife, especially bobwhite quail, turkey, and white-tailed deer benefit from the growth of trees andshrubs for both food and cover. When management for specific wildlife populations is desirable, these optionsshould be considered in any brush management plan.
Characteristics and indicators. Hydrologic function is affected by the amount of vegetative cover. Canopyinterception loss can vary from 25.4% to 36.7% (Thurow and Hester, 1997). A small rainfall event is usually retainedin the foliage and does not reach the litter layer at the base of the tree. Only when canopy storage is reached andexceeded does precipitation fall to the soil surface. Interception losses associated with the accumulation of leaves,twigs, and branches at the bases of trees are considerably higher than losses associated with the canopy. Thedecomposed material retains approximately 40% of the water that is not retained in the canopy (Thurow and Hester,1997). Soil properties affected include biological activity, infiltration rates, and soil fertility.
Resilience management. Special planning will be necessary to assure that sufficient amounts of fine fuel areavailable to carry fires with enough intensity to control woody species. In some locations the use of chemicals as abrush management tool may be desirable to initiate and accelerate this transition.
This plant community is dominated by shrubs consisting primarily of coralberry, roughleaf dogwood, and smoothsumac. Trees including osage orange, honeylocust, elms, and eastern redcedar are common invaders that becomeestablished in some areas. Coralberry is generally the most abundant shrub and often forms low, dense thicketsthroughout the site. Shrubs and trees may produce 40 to 60 percent of the total vegetation.
The spread of shrubs and trees results from the absence of fire because periodic burning tends to hinder theestablishment of most of these woody species and favors grasses and forbs. It should be noted, however, that notall unburned areas have a woody plant problem and that the rate of encroachment varies considerably dependingon seed availability in surrounding areas and the presence of birds and small mammals that distribute seeds overthe site. Longtime, continuous overgrazing can also lead to encroachment. In these situations the associatedgrasses will usually consist of composite dropseed, purple lovegrass, Kentucky bluegrass, and Scribner’s rosettegrass. Shrubs and trees will also invade areas where both grazing and fire have been excluded for many yearsbecause the heavy accumulation of plant mulch and litter retards herbage growth and provides a favorable habitatfor seed germination and establishment of many shrub species. The associated grasses in this situation mayinclude big bluestem, little bluestem, Indiangrass, switchgrass, sedges, and Canada wildrye.
Grass production is significantly reduced by competition from forbs and woody species. Grass yields vary from 20 to45 percent of the total vegetative production while forbs often produce 10 to 50 percent of the total. Major forbsinclude white sagebrush, Cuman ragweed, Baldwin ironweed, and common yarrow.

Dominant plant species
State 4Tillage State
Community 4.1Reseed Plant Community
Many species of wildlife, especially bobwhite quail, turkey, and white-tailed deer, benefit from woody growth for bothfood and cover. Conversely, the presence of trees is considered detrimental to populations of greater prairiechickens. When management for specific wildlife populations is desirable, these options should be considered inany brush management plan.
Resilience management. Usually, a well-planned burning program accompanied by prescribed grazing willgradually return the plant community to one dominated by desirable grasses and forbs. Special planning will benecessary to assure that sufficient amounts of fine fuel are available to carry fires with enough intensity to controlwoody species. Use of labeled herbicides as a brush management tool will usually be necessary to reducepopulations of fire-resistant species like osage orange and honeylocust and accelerate the recovery of desiredvegetative cover. Recently, some landowners have relied on the browsing habits of goats to suppress the woodygrowth.
Osage-orange (Maclura pomifera), treehoneylocust (Gleditsia triacanthos), treeSiberian elm (Ulmus pumila), treeeastern redcedar (Juniperus virginiana), treecoralberry (Symphoricarpos orbiculatus), shrubsmooth sumac (Rhus glabra), shrubroughleaf dogwood (Cornus drummondii), shrub
Extensive areas of the historic Clay Hills plant communities were plowed and converted to production of cultivatedcrops by the early European settlers and subsequent generations. In addition to destroying the original plantcommunity, repeated tillage commonly resulted in major changes in soil conditions. Reductions in organic matter,mineral levels, soil structure, oxygen levels, and water holding capacity, along with increased runoff/erosion andshifts in the populations of soil-dwelling organisms, were common on these sites. The extent of these changesdepended upon duration of cropping as well as crops grown and other management practices.
The Tillage State consists of abandoned cropland that has been naturally revegetated (go-back) or planted/seededto grassland. Many reseeded plant communities were planted with a local seeding mix under the ConservationReserve Program (CRP) or were planted to a monoculture of sideoats grama. Go-back communities are difficult todefine due to the variability of plant communities that can exist. Many of these communities are represented by thegenus Aristida (threeawns).
Characteristics and indicators. This is an alternative state since the energy, hydrologic, and nutrient cycles arealtered to that of the Reference State in its natural disturbance regime. Bulk density, aggregate stability, soilstructure, and plant functional and structural groups are not fully restored to that of the Reference State. Mechanicaltillage can destroy soil aggregation. Soil aggregates are an example of dynamic soil property change. Aggregatestability is critical for infiltration, root growth, and resistance to water and wind erosion (Brady and Weil, 2008).
Resilience management. This state is a result of a land use management decision.
This plant community occurs on areas that were formerly farmed and reseeded with a mixture of native speciescommon in the Reference Plant Community. Most seeding mixtures consisted of a blend of grasses that includesand bluestem, Indiangrass, switchgrass, little bluestem, sideoats grama, blue grama, and western wheatgrass. Insome locations, seed of legumes and forbs such as prairie bundleflower and Maximilian sunflower were included inthe mixture.
Once these areas become fully established, production is comparable to that of the Reference Plant Community.Total annual production ranges varies according to the species planted, established plants, and years of

Community 4.2Go-back Plant Community
State 5Introduced, Invasive, Noxious State
establishment.
When reseeded areas and areas supporting native rangeland exist in the same pasture, they seldom are utilized atthe same intensity because domestic livestock usually prefer plants growing on the native rangeland areas. Whenfeasible, reseeded plant communities should be managed as separate pastures or units.
Some seeded areas are invaded by trees and shrubs during the establishment period of the desired plants. Theseinvader species commonly include elm, common hackberry, eastern redcedar, and eastern cottonwood. Occasionalburning is effective in controlling establishment of these woody plants.
Resilience management. Following termination of cultivation, total annual production is quite variable and fullrecovery of the original plant community, including forbs and legumes, may take many decades. Additions oforganic matter and minerals, deferred grazing, prescribed burning, and related management practices describedearlier for this ecological site can be beneficial to the rehabilitation.
This plant community also occurs on areas that were formerly farmed. When tillage operations ceased, the areaswere allowed to revegetate or “go back” naturally in contrast to artificial reseeding to a selected species or group ofspecies. The go-back process is a slow, gradual transformation that requires many years and many successionalchanges or stages in the plant community.
The speed and extent of revegetation depends on the size of the area, level of grazing management and theproximity of the area to existing seed sources. In the initial stages of revegetation the site is usually dominated byannual forbs such as annual ragweed, slender snakecotton, Canadian horseweed, prairie sunflower, commonsunflower, Mexican fireweed, camphorweed, and annual buckwheat. Gradually these are replaced by annualgrasses including prairie threeawn, mat sandbur, tumblegrass, little barley, cheatgrass, and witchgrass.
As plant succession progresses the plant community gradually becomes dominated by perennials. The majorgrasses include sand dropseed, composite dropseed, thin paspalum, purple lovegrass, red lovegrass, Scribner’srosette grass, Carolina crabgrass, silver beardgrass, and tumble windmillgrass. Common forbs are Cumanragweed, white sagebrush, Carruth’s sagewort, white heath aster, Missouri goldenrod, and sand milkweed.Combinations of these plants can form a stable community. In time with prescribed grazing management, otherperennial grasses and forbs common in the Reference Plant Community return to the site.
Blue grama is a shortgrass that is very common to the native plant communities on this site. However, it seldomoccurs in go-back communities, even after 40 to 50 years of plant succession. Some go-back areas are invaded bytrees and shrubs. The more common include elm, common hackberry, eastern redcedar, eastern cottonwood, androughleaf dogwood. Occasional burning is effective in controlling these woody plants.
Total annual production varies by site. This depends on seasonal precipitation and the stage of plant succession inthe plant community.
Resilience management. Following termination of cultivation, total annual production is quite variable and fullrecovery of the original plant community, including forbs and legumes, may take many decades. Additions oforganic matter and minerals, deferred grazing, prescribed burning, and related management practices describedearlier for this ecological site can be beneficial to the rehabilitation.
This state includes three community phases which are characterized by the composition of plant species and soilfunctions that govern the ecological processes. These three plant communities occur and function independent ofone another. Species that define this state include sericea lespedeza, caucasian bluestem, tall fescue, smoothbrome, and Kentucky bluegrass. These species can and will invade rangelands without proactive control measures.sericea lespedeza and caucasian bluestem community phases are partially defined by the total productionexceeding 15% by weight on a per acre basis. Tall fescue, smooth brome, and Kentucky bluegrass are partially

Community 5.1Caucasian Bluestem Community
Dominant plant species
Community 5.2Sericea Lespedeza Community
Dominant plant species
Community 5.3Fescue, Brome, Bluegrass Community
defined by the total production exceeding 40% by weight on a per acre basis.
Characteristics and indicators. Ecological processes within this state that are affected and differ from thegrassland state are hydrologic cycle and nutrient cycle. Water content and infiltration rates are affected by thespecies.
Resilience management. The plant communities that make up this state are sustained by fertilizing species andmanaging as pastureland or by a lack of treatment measures for individual species control, maintenance, and/oreradication.
Caucasian bluestem is the dominant species that govern the ecological processes and uses of this community. Thisspecies can and will invade rangelands without proactive control measures.
Resilience management. Caucasian bluestem survives all control measures. There is no way of killing theCaucasian bluestem without killing the native rangeland. There have been cases where the native taller grassesappear to shade and out compete the Caucasian bluestem but there are ungrazed places on the Konza PrairieResearch and biological station where it was introduced from feeding livestock contaminated hay and where it nowis crowding out the native grass as its spreads. Caucasian bluestem might be the most serious threat and mostaggressive of the introduced, invasive, and noxious species of this time. Soil dynamic property changes includeinfiltration, biological activity, and soil fertility.
Caucasian bluestem (Bothriochloa bladhii), grass
Sericea lespedeza (Lespedeza cuneata) is the dominant species that govern the ecological processes and uses ofthis community. Sericea lespedeza is invasive and a statewide noxious weed in Kansas. This species will quicklyinvade rangelands without proactive control measures. It competes with the native grass community with sunlight,water, and nutrients. It also produces allelopathic compounds (toxic chemicals that negatively impact thegermination and/or growth of other plants).
Resilience management. Control measures for sericea lespedeza involve herbicide application. Followrecommended rates and chemical use according to Kansas State University Chemical Weed Control book.Conventional management practices such as prescribed grazing and fire have been less than effective inpreventing the spread of sericea lespedeza in rangelands. Some suppression of sericea lespedeza has beenobserved after mowing or burning followed by intensive early stocking with stocker cattle. Goats will provide somecontrol as they do eat it much more readily than cattle.
sericea lespedeza (Lespedeza cuneata), shrub
Tall fescue, smooth brome, and Kentucky bluegrass are the dominant species that govern the ecological processesand uses of this community. Any one or combination of these species can be considered an invaded community atlevels of >40% by total weight annual production. Once these levels are reached management choices can changeto favor these grasses and as a result land use is transitioned from rangeland to pastureland.
Resilience management. Inputs and energy in order to return species to a grassland state are greater than what isconsidered to be natural. Control measures for tall fescue, smooth brome, and Kentucky bluegrass might involveherbicide application and/or consecutive prescribed burns. Follow recommended rates and chemical use according

Dominant plant species
Transition 1 to 2State 1 to 2
Transition 1 to 3State 1 to 3
Transition 1 to 4State 1 to 4
Transition 1 to 5State 1 to 5
to State extension guidelines such as Kansas State University Chemical Weed Control publication. Soil dynamicproperty changes include biological activity and soil fertility.
Kentucky bluegrass (Poa pratensis), grasstall fescue (Schedonorus arundinaceus), grasssmooth brome (Bromus inermis), grass
Long-term management (approximately 30 years) without a forage and animal balance and heavy, continuousgrazing without adequate recovery periods between grazing events will convert the Grassland State to a ShortgrassState made up of blue grama and buffalograss sod. Drought in combination with this type of management willquicken the rate at which this transition occurs.
Constraints to recovery. The ecological processes affected are the hydrologic and nutrient cycles. There is anincrease in evaporation rate, runoff, and in bulk density. There is a decrease in infiltration, a change in plantcomposition, and the functional and structural groups have changed dominance. These are all examples of the soiland vegetation properties that have compromised the resilience of the Grassland State and therefore transitioned toa Shortgrass State.
Changes from a Grassland State to a Woody State lead to changes in hydrologic function, forage production,dominant functional and structural groups, and wildlife habitat. Understory plants may be negatively affected bytrees and shrubs by reductions in light, soil moisture, and soil nutrients. Increases in tree and shrub density and sizehave the effects of reducing understory plant cover and productivity, and desirable forage grasses often are mostseverely reduced (Eddleman, 1983). As vegetation cover changes from grasses to trees, a greater proportion ofprecipitation is lost throughout interception and evaporation; therefore, less precipitation is available for producingherbaceous forage or for deep drainage or runoff (Thurow and Hester, 1997).
Constraints to recovery. Recovery is possible through management.
This transition is triggered by a management action as opposed to a natural event. Tillage, or breaking the groundwith machinery for crop production, will move the Grassland State to a Tillage State.
Constraints to recovery. The resilience of the Reference State has been compromised by the fracturing andblending of the native virgin sod. The energy, hydrologic, and nutrient cycles are altered and vary from that of theGrassland State.
Changes from a Grassland State to an introduced, invasive and/or noxious state can lead to changes inhydrology/erosion, forage production, wildlife habitat, and soil dynamic properties. These changes will varydepending on dominance of species. This transition is usually triggered by an introduction of non-native species.The source from which the species originated from (i.e. adjacent crop field) can usually but not always be detected.A threshold is crossed once the species (sericea lespedeza and Caucasian bluestem) is established and increasesto levels of greater than 15% total annual production per acre. For cool season grasses such as tall fescue andsmooth brome that level is >40% total annual production per acre. Changes in species diversity reflect changes insoil biota activity. The introduced, invasive and noxious species are not selected and grazed and as a resultbecome increasingly dominant. Hydrology changes begin to occur with the buildup of litter and interception rates
Restoration pathway 3 to 1State 3 to 1
Conservation practices
increase as canopy increases.
Constraints to recovery. Need more documentation for recovery processes.
Restoration efforts will be costly, labor-intensive, and can take many years, if not decades, to return to a GrasslandState. Once canopy levels reach greater than 20 percent, estimated cost to remove trees is very expensive andincludes high energy inputs. The technologies needed in order to go from an invaded Woody State to a GrasslandState include but are not limited to: prescribed burning— the use of fire as a tool to achieve a managementobjective on a predetermined area under conditions where the intensity and extent of the fire are controlled; brushmanagement—manipulating woody plant cover to obtain desired quantities and types of woody cover and/or toreduce competition with herbaceous understory vegetation, in accordance with overall resource managementobjectives; and prescribed grazing—the controlled harvest of vegetation with grazing or browsing animals managedwith the intent to achieve a specified objective. In addition, to grazing at an intensity that will maintain enough coverto protect the soil and maintain or improve the quantity and quality of desirable vegetation. When a juniper tree iscut and removed, the soil structure and the associated high infiltration rate may be maintained for over a decade(Hester, 1996). This explains why the area near the dripline usually has substantially greater forage production formany years after the tree has been cut. It also explains why runoff will not necessarily dramatically increase oncejuniper is removed. Rather, the water continues to infiltrate at high rates into soils previously ameliorated byjunipers, thereby increasing deep drainage potential. In rangeland, deep drainage amounts can be 16 percent of thetotal rainfall amount per year (Thurow and Hester, 1997).
Brush Management
Prescribed Burning
Prescribed Grazing
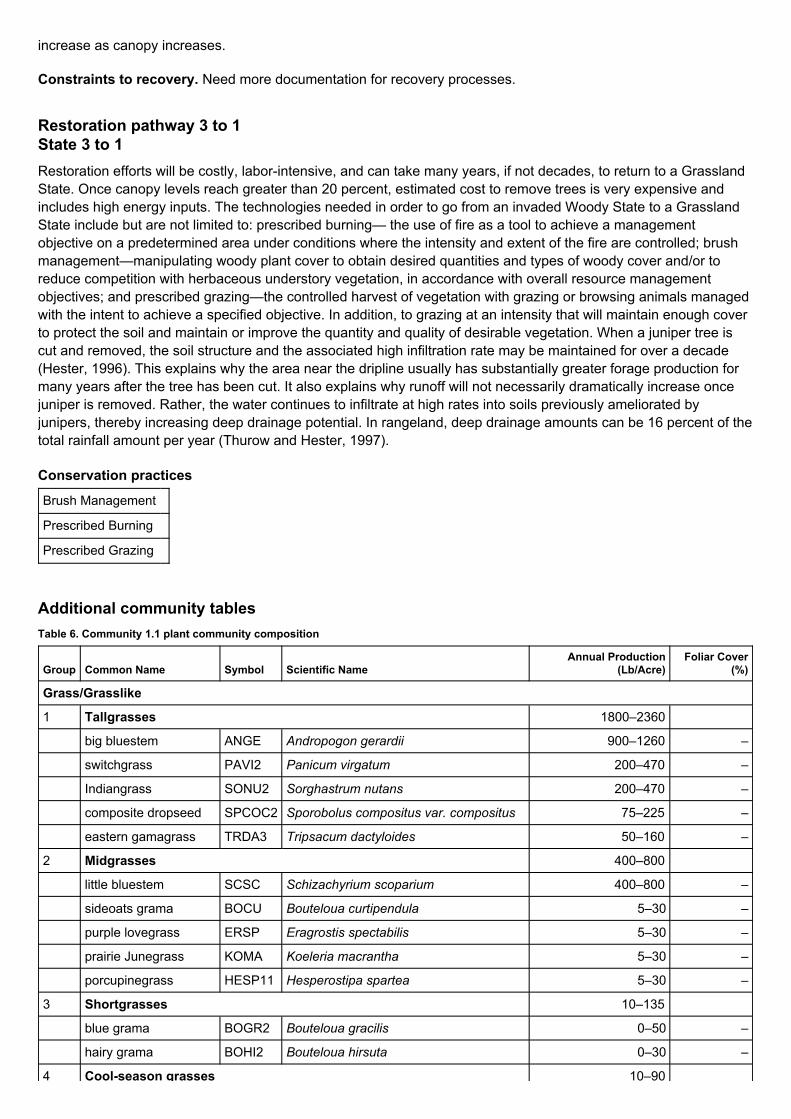
Additional community tablesTable 6. Community 1.1 plant community composition
Group Common Name Symbol Scientific NameAnnual Production
(Lb/Acre)Foliar Cover
(%)
Grass/Grasslike
1 Tallgrasses 1800–2360
big bluestem ANGE Andropogon gerardii 900–1260 –
switchgrass PAVI2 Panicum virgatum 200–470 –
Indiangrass SONU2 Sorghastrum nutans 200–470 –
composite dropseed SPCOC2 Sporobolus compositus var. compositus 75–225 –
eastern gamagrass TRDA3 Tripsacum dactyloides 50–160 –
2 Midgrasses 400–800
little bluestem SCSC Schizachyrium scoparium 400–800 –
sideoats grama BOCU Bouteloua curtipendula 5–30 –
purple lovegrass ERSP Eragrostis spectabilis 5–30 –
prairie Junegrass KOMA Koeleria macrantha 5–30 –
porcupinegrass HESP11 Hesperostipa spartea 5–30 –
3 Shortgrasses 10–135
blue grama BOGR2 Bouteloua gracilis 0–50 –
hairy grama BOHI2 Bouteloua hirsuta 0–30 –
4 Cool-season grasses 10–90

4 Cool-season grasses 10–90
Canada wildrye ELCA4 Elymus canadensis 0–25 –
western wheatgrass PASM Pascopyrum smithii 5–25 –
sedge CAREX Carex 5–25 –
Scribner's rosettegrass
DIOLS Dichanthelium oligosanthes var.scribnerianum
0–25 –
Forb
5 Forbs 150–450
Illinois bundleflower DEIL Desmanthus illinoensis 15–55 –
Maximilian sunflower HEMA2 Helianthus maximiliani 15–50 –
Nuttall's sensitive-briar MINU6 Mimosa nuttallii 15–50 –
compassplant SILA3 Silphium laciniatum 15–50 –
Baldwin's ironweed VEBA Vernonia baldwinii 0–40 –
roundhead lespedeza LECA8 Lespedeza capitata 5–40 –
slimflower scurfpea PSTE5 Psoralidium tenuiflorum 10–40 –
Cuman ragweed AMPS Ambrosia psilostachya 10–35 –
blue wild indigo BAAU Baptisia australis 10–35 –
American licorice GLLE3 Glycyrrhiza lepidota 5–30 –
groundplum milkvetch ASCR2 Astragalus crassicarpus 5–25 –
pitcher sage SAAZG Salvia azurea var. grandiflora 5–20 –
dotted blazing star LIPU Liatris punctata 5–20 –
white sagebrush ARLU Artemisia ludoviciana 0–20 –
prairie groundsel PAPL12 Packera plattensis 0–20 –
upright prairieconeflower
RACO3 Ratibida columnifera 5–20 –
longbract wild indigo BABR2 Baptisia bracteata 5–15 –
stiff goldenrod OLRI Oligoneuron rigidum 0–15 –
Missouri goldenrod SOMI2 Solidago missouriensis 0–15 –
green antelopehorn ASVI2 Asclepias viridis 0–15 –
Carolina larkspur DECAV2 Delphinium carolinianum ssp. virescens 0–10 –
tall blazing star LIAS Liatris aspera 0–10 –
aromatic aster SYOB Symphyotrichum oblongifolium 0–10 –
hoary verbena VEST Verbena stricta 0–10 –
common yarrow ACMI2 Achillea millefolium 0–10 –
Shrub/Vine
6 Shrubs 30–90
leadplant AMCA6 Amorpha canescens 15–30 –
prairie rose ROAR3 Rosa arkansana 5–30 –
Jersey tea CEHE Ceanothus herbaceus 10–30 –
Animal communityWildlife
This site is good wildlife habitat when maintained in good to excellent condition. It provides nesting sites for anumber of ground-nesting bird species including eastern and western meadowlarks and upland sandpipers. Thegreater prairie chicken often uses this site for booming grounds or “leks” where males conduct courtship displays, a

Hydrological functions
Recreational uses
truly unique spring prairie ritual. Nesting commonly occurs in nearby unburned areas.
Big game animals such as white-tailed deer, elk, pronghorn, and bison historically used this site for grazing. TheClay Hills and associated Claypan sites were favored by bison for “wallows” or depressions where they would roll inthe dust or mud, as the season dictated, to try and rid themselves of flies and gnats that were a constant nuisanceon the prairie. These depressions can still be seen on the prairie landscape.
Many small mammals, reptiles and amphibians are found on this site as well. Larger predators such as coyotes andbadgers are attracted by these smaller animals as are avian predators such as hawks and owls.
Some animals are important because of their threatened and endangered status and require special consideration.Please check the Kansas Department of Wildlife and Parks and Tourism (KDWP&T) website atwww.ksoutdoors.com for the most current listing for your county.
Grazing Interpretations
Calculating Safe Stocking Rates: Proper stocking rates should be incorporated into a grazing management strategythat protects the resource, maintains or improves rangeland health, and is consistent with management objectives.In addition to usable forage, safe stocking rates should consider ecological condition, trend of the site, past grazinguse history, season of use, stock density, kind and class of livestock, forage digestibility, forage nutritional value,variation of harvest efficiency based on preference of plant species, and/or grazing system, and site grazeabilityfactors (such as steep slopes, site inaccessibility, or distance to drinking water).
Often the current plant community does not entirely match any particular Community Phase as described in thisEcological Site Description. Because of this, a resource inventory is necessary to document plant composition andproduction. Proper interpretation of inventory data will permit the establishment of a safe initial stocking rate.
No two years have exactly the same weather conditions. For this reason, year-to-year and season-to-seasonfluctuations in forage production are to be expected on grazing lands. Livestock producers must make timelyadjustments in the numbers of animals or in the length of grazing periods to avoid overuse of forage plants whenproduction is unfavorable, and to make advantageous adjustments when forage supplies are above average.
Initial stocking rates should be improved through the use of vegetation monitoring and actual use records thatinclude number and type of livestock, the timing and duration of grazing, and utilization levels. Actual use recordsover time will assist in making stocking rate adjustments based on the variability factors. Average annual productionmust be measured or estimated to properly assess useable forage production and stocking rates.
Following are the estimated withdrawals of freshwater by use in MLRA 76: Public supply—surface water, 12.9%;ground water, 10.2% Livestock— surface water, 15.8%; ground water, 4.5% Irrigation—surface water, 53.9%;ground water, 2.7% Other—surface water, 0.0%; ground water, 0.0%
The total withdrawals average 35 million gallons per day (130 million liters per day). About 17 percent is from groundwater sources, and 83 percent is from surface water sources. The moderate precipitation provides water forpastures and crops. Much of the water for livestock is stored in small reservoirs and ponds. A small area is irrigatedwith water from the Arkansas River in Oklahoma. The surface water is generally of good quality and is suitable formost uses.
Hydrologic group C and D soils make up the Clay Hills ecological site. All are somewhat poorly to well drained andhave slow to very slow permeability. Please refer to the NRCS National Engineering Handbook Section 4 (NEH-4)for runoff quantities and hydrologic curves when making hydrology determinations.
This site provides opportunities for a variety of outdoor activities which might include bird watching, hiking,outdoor/wildlife photography, and hunting. A wide variety of plants bloom throughout the growing season andprovide much aesthetic appeal to the landscape, especially in those years with average and above rainfall. This site
Wood products
Other products
Other information
is subject to sheet erosion when mismanaged.
This site generally does not produce trees of sufficient size for commercial harvest.
Other products are generally not produced on this site.
Because of its landscape setting with broad vistas, this site may be attractive for homesites and otherdevelopments. However, the high clay content (high shrink-swell potential) of these soils can create foundationproblems and severely limit their suitability for septic systems and access roads. The seasonal water table in winterand early spring is also a concern for dwellings and other buildings with basements and concrete-slab floors.
Site Development and Testing Plan
This site went through the approval process.
Inventory data references
References
Information presented here has been derived from NRCS clipping data, numerous ocular estimates and otherinventory data. Field observations from experienced range-trained personnel was used extensively to develop thisecological site description.
NRCS contracted the development of MLRA 79 ESDs in 2005. Extensive review and improvements were made tothose foundational ESDs in 2017-2018 which provided an approved product.
Range Condition Guides and Technical Range Site Descriptions for Kansas, Clay Upland, USDA, Soil ConservationService, March, 1967.
Range Site Description for Kansas, Clay Upland, USDA-Soil Conservation Service, September, 1985.
Ecological Site Description for Kansas, Clay Upland (R076XY007KS) located in Ecological Site Information System(ESIS), 2007
Bestelmeyer, B., J.R. Brown, K.M. Havstad, B. Alexander, G. Chavez, and J.E. Herrick. 2003. Development andUse of State and Transition Models for Rangelands. Jornal of Range Management 56:114–126.
Bestelmeyer, B. and J.R. Brown. 2005. State-and-Transition Models 101: a Fresh Look at Vegetation Change.
Bestelmeyer, B.T., K. Moseley, P.L. Shaver, H. Sanchez, D.D. Briske, and M.E. Fernandez-Gimenez. 2010.Practical guidance for developing state-and-transition models. Rangelands 32:23–30.
Bestelmeyer, B.T., J.C. Williamson, C.J. Talbot, G.W. Cates, M.C. Duniway, and J.R. Brown. 2016. Improving theEffectiveness of Ecological Site Descriptions: General State-and-Transition Models and the Ecosystem DynamicsInterpretive Tool (EDIT). Rangelands 38:329–335.
Caudle, D., H. Sanchez, J. DiBenedetto, C. Talbot, and M. Karl. 2013. Interagency Ecological Site Handbook forRangelands.
Other references
Comer, P.J., D. Faber-Langendoen, R. Evans, S. Gawler, C. Josse, G. Kittel, S. Menard, M. Pyne, M. Reid, K.Schulz, K. Snow, and J. Teague. 2003 (Date accessed). Ecological Systems of the United States: A WorkingClassification of U.S. Terrestrial Systems.
Herrick J. E., J.W. Van Zee, K.M. Havstad, L.M. Burkett, and W.G. Whitford. 2005. Monitoring Manual forGrassland, Shrubland, and Savanna Ecosystems. Volume 1: Quick Start.
Herrick, J.E., J.W. Van Zee, K.M. Havstad, L.M. Burkett, and W.G. Whitford. 2005. Monitoring Manual forGrassland, Shrubland, and Savanna Ecosystems. Volume II: Design, Supplimentary Methods, andInterpretation..
National Cooperative Soil Survey (NCSS). 2018 (Date accessed). National Cooperative Soil CharacterizationDatabase. https://ncsslabdatamart.sc.egov.usda.gov/.
National Oceanic and Atmospheric Administration (NOAA). 2018 (Date accessed). Climate Data 1980-2010.https://www.ncdc.noaa.gov/data-access/land-based-station-data/find-station.
Natural Resources Conservation Service. . National Ecological Site Handbook.
. 2018 (Date accessed). Web Soil Survey (SSS NRCS WSS) . https://websoilsurvey.sc.egov.usda.gov/.
SSS NRCS OSD and . 2018 (Date accessed). Official Soil Series Descriptions.https://soilseries.sc.egov.usda.gov/osdname.aspx.
United States Department of Agriculture, . 2006. Land Resource Regions and Major Land Resource Areas of theUnited States, the Caribbean, and the Pacific Basin.
USDA, N. 2018 (Date accessed). The PLANTS Database. http://plants.usda.gov.
Brady, N. and R. Weil. 2008. The nature and properties of soils, 14th ed.
Bragg, T. and L. Hulbert. 1976. Woody plant invasion of unburned Kansas bluestem prairie. J. RangeManagement., 29:19-23.
Dyksteruis, E.J. 1958. Range conservation as based on sites and condition classes. J. Soil and Water Conserv. 13:151-155.
Eddleman, L. 1983. Some ecological attributes of western juniper. P. 32-34 in Research in rangeland management.Agric. Exp. Stan. Oregon State Univ., Corvallis Spec. Rep. 682.
Hester, J.W. 1996. Influence of woody dominated rangelands on site hydrology and herbaceous production,Edwards Plateau, Texas. M.S. Thesis, Texas A&M University, College State, TX.
Holechek, J., R. Pieper, and C. Herbel. Range Management: principles and practices.—5th ed.
Kuchler, A., A new vegetation map of Kansas. Ecology (1974) 55: pp. 586-604.

Contributors
Approval
Acknowledgments
Launchbaugh, John. Clenton Owensby. Kansas Rangelands, their management based on a half century ofresearch. Bull. 622 Kansas Agricultural Experiment Station, October, 1978.
Moore, R., J. Frye, J. Jewett, W. Lee, and H. O'Connor. 1951. The Kansas rock column. Univ. Kans. Pub., StateGeol. Survey Kans. Bull. 89. 132p.
National Climatic Data Center. Weather data. http://www.ncdc.noaa.gov/. Accessed online 04/05/2017.
Society for Rangeland Management. 1994. Rangeland cover types of the United States.
Sauer, Carl. 1950. Grassland climax, fire, and man. J. Range Manage. 3: 16-21.
Thurow, T. and J. Hester. 1997. How an increase or reduction in juniper cover alters rangeland hydrology. In: C.A.Taylor, Jr. (ed.). Proc. 1997 Juniper Symposium. Texas Agr. Exp. Sta. Tech. Rep. 97-1. San Angelo, TX: 4:9-22.
USDA-NRCS. 1997. National range and pasture handbook, , Chapter 7, rangeland and pasturelandhydrology and erosion.
Waller, S., L. Moser, P. Reece., and G. Gates. 1985. Understanding grass growth. Weaver, J. and F. Albertson.April 1940. Deterioration of midwestern ranges. Ecology, Vol. 21, No. 2. pp. 216-236.
Chris Tecklenburg
David Kraft, 10/29/2019
The ecological site development process is a collaborative effort, conceptual in nature, dynamic, and is neverconsidered complete. I thank all those who set the foundational work in the mid-2000s in regard to this ESD. I thankall those who contributed to the development of this site. In advance, I thank those who would provide insight,comments, and questions about this ESD in the future.
Non-discrimination Statement In accordance with Federal civil rights law and U.S. Department of Agriculture(USDA) civil rights regulations and policies, the USDA, its Agencies, offices, and employees, and institutionsparticipating in or administering USDA programs are prohibited from discriminating based on race, color, nationalorigin, religion, sex, gender identity (including gender expression), sexual orientation, disability, age, marital status,family/parental status, income derived from a public assistance program, political beliefs, or reprisal or retaliation forprior civil rights activity, in any program or activity conducted or funded by USDA (not all bases apply to allprograms). Remedies and complaint filing deadlines vary by program or incident.
Persons with disabilities who require alternative means of communication for program information (e.g., Braille,large print, audiotape, American Sign Language, etc.) should contact the responsible Agency or USDA’s TARGETCenter at (202) 720-2600 (voice and TTY) or contact USDA through the Federal Relay Service at (800) 877-8339.Additionally, program information may be made available in languages other than English.
To file a program discrimination complaint, complete the USDA Program Discrimination Complaint Form, AD-3027,found online at How to File a Program Discrimination Complaint and at any USDA office or write a letter addressedto USDA and provide in the letter all of the information requested in the form. To request a copy of the complaintform, call (866) 632-9992. Submit your completed form or letter to USDA by:
(1) mail: U.S. Department of Agriculture Office of the Assistant Secretary forCivil Rights 1400 Independence Avenue, SW Washington, D.C. 20250-9410;
(2) fax: (202) 690-7442; or

(3) email: [email protected].
USDA is an equal opportunity provider, employer, and lender.
Rangeland health reference sheet
Indicators
1. Number and extent of rills: There are no water flow patterns evidenced by litter, soil, or gravel redistribution, orpedestalling of vegetation or stones that break the flow of water as a result of overland flow.
2. Presence of water flow patterns: There is little, if any, evidence of soil deposition or erosion. Water generally flowsevenly over the entire landscape.
3. Number and height of erosional pedestals or terracettes: There is no evidence of pedestals or terracettes that wouldindicate the movement of soilby water and/or by wind on this site.
4. Bare ground from Ecological Site Description or other studies (rock, litter, lichen, moss, plant canopy are notbare ground): Less than 5% bare ground is found on this site. It is the remaining ground cover after accounting forground surface covered by vegetation (basal and canopy [foliar] cover), litter, standing dead vegetation, gravel/rock, andvisible biological crust (e.g., lichen, mosses, algae).
5. Number of gullies and erosion associated with gullies: No evidence of accelerated water flow resulting indowncutting of the soil.
6. Extent of wind scoured, blowouts and/or depositional areas: No wind-scoured or blowout areas where the finerparticles of the topsoil have blown away, sometimes leaving residual gravel, rock, or exposed roots on the soil surface.
Interpreting Indicators of Rangeland Health is a qualitative assessment protocol used to determine ecosystemcondition based on benchmark characteristics described in the Reference Sheet. A suite of 17 (or more) indicatorsare typically considered in an assessment. The ecological site(s) representative of an assessment location must beknown prior to applying the protocol and must be verified based on soils and climate. Current plant communitycannot be used to identify the ecological site.
Author(s)/participant(s) Chris Tecklenburg/Revision 1-17-2019 David Kraft, John Henry, Doug Spencer and Dwayne Rice/original authors 1-15-2005.
Contact for lead author State Rangeland Management Specialist for Kansas
Date 10/29/2019
Approved by David Kraft
Approval date
Composition (Indicators 10 and 12) basedon
Annual Production
Also, there are no areas of redeposited soil onto this site from another site due to the wind, i.e., depositional areas.
7. Amount of litter movement (describe size and distance expected to travel): No evidence of litter movement (i.e.,dead plant material that is in contact with the soil surface).
8. Soil surface (top few mm) resistance to erosion (stability values are averages - most sites will show a range ofvalues): Soil surfaces may be stabilized by soil organic matter which has been fully incorporated into aggregates at thesoil surface, adhesion of decomposing organic matter to the soil surface, and biological crusts. A soil stability kit willscore a range from 5-6.
9. Soil surface structure and SOM content (include type of structure and A-horizon color and thickness): IrwinOSD: A--0 to 15 centimeters (0 to 6 inches); very dark gray (10YR 3/1) silty clay loam, very dark brown (10YR 2/2) moist;3 percent sand; 28 percent clay; moderate fine granular structure; hard, friable, slightly plastic and slightly sticky; manyfine and medium roots throughout; few distinct gray (10YR 5/1) discontinuous skeltans (sand or silt) on faces of peds;moderately acid; clear smooth boundary (12 to 33 centimeters thick (5 to 13 inches.) Lab sample # KSUSS2480 BA--15to 33 centimeters (6 to 13 inches); very dark grayish brown (10YR 3/2) silty clay loam, very dark brown (10YR 2/2) moist;3 percent sand; 30 percent clay; moderate medium subangular blocky structure; hard, firm, plastic and sticky; many fineroots throughout; few distinct gray (10YR 5/1) discontinuous skeleton (sand or silt) on faces of peds; moderately acid;abrupt smooth boundary. (0 to 25 centimeters (0 to 10 inches).) Lab sample # KSUSS2481
10. Effect of community phase composition (relative proportion of different functional groups) and spatialdistribution on infiltration and runoff: Functional and structural groups are that of the Reference Plant Community.Note changes to plant communities if different than that of the Reference Plant Community.
11. Presence and thickness of compaction layer (usually none; describe soil profile features which may bemistaken for compaction on this site): There is no evidence of a compacted soil layer less than 6 inches from the soilsurface. Soil structure is similar to that described in Indicator 9. Compacted physical features will include platy, blocky,dense soil structure over less dense soil layers, horizontal root growth, and increase bulk density (measured by weighinga known volume of oven-dry soil).
12. Functional/Structural Groups (list in order of descending dominance by above-ground annual-production or livefoliar cover using symbols: >>, >, = to indicate much greater than, greater than, and equal to):
Dominant: Group 1 Tallgrass dominant 63% 2360 lbs. big bluestem 900-1260, switchgrass 200-470, Indiangrass 200-470, composite dropseed 75- 225, eastern gamagrass 50-160.
Sub-dominant: Group 2 Midgrass subdominant 20% 800 lbs. little bluestem 400-800, sideoats grama 5-30, purplelovegrass 5-30, prairie Junegrass 5-30, porcupinegrass 5-30.
Other: Group 3 Shortgrass minor 3% 135 lbs. buffalograss 10-50, blue grama 0-30, hairy grama 0-30. Group 4 Cool-season grass Trace 2% 90 lbs. Western wheatgrass 5-25 lbs. sedge 5-25, Canada wildrye 0-25, Scribner's rosette grass0-25.
Additional: Group 5 forbs Minor 10% 450 lbs. see Reference Plant community for entire list Group 6 shrub Trace 2% 90lbs. leadplant 15-30 lbs. Jersey tea 10-30, prairie rose 5-30.

13. Amount of plant mortality and decadence (include which functional groups are expected to show mortality ordecadence): Recruitment of plants is occurring and there is a mixture of many age classes of plants. The majority of theplants are alive and vigorous. Some mortality and decadence is expected for the site, due to drought, unexpectedwildfire, or a combination of the two events. This would be expected for both dominant and subdominant groups.
14. Average percent litter cover (%) and depth ( in): Plant litter is distributed evenly throughout the site. There is norestriction to plant regeneration due to depth of litter. When prescribed burning is practiced, there will be little litter thefirst half of the growing season.
15. Expected annual annual-production (this is TOTAL above-ground annual-production, not just forage annual-production): All species (e.g., native, seeded, and weeds) alive in the year of the evaluation, are included in thedetermination of total above ground production. Site potential (total annual production) ranges from 2,500 lbs in a below-average rainfall year and 6,500 lbs in an above average rainfall year. The representative value for this site is 4,500 lbsproduction per year.
16. Potential invasive (including noxious) species (native and non-native). List species which BOTH characterizedegraded states and have the potential to become a dominant or co-dominant species on the ecological site iftheir future establishment and growth is not actively controlled by management interventions. Species thatbecome dominant for only one to several years (e.g., short-term response to drought or wildfire) are notinvasive plants. Note that unlike other indicators, we are describing what is NOT expected in the reference statefor the ecological site: There are no noxious weeds present. Invasive plants make up a small percentage of plantcommunity, and invasive brush species are < 5% canopy.
17. Perennial plant reproductive capability: Plants on site exhibit the required vigor and growth to be able to reproducevegetatively or by seed. Current management activities do not adversely effect the capability of plants to reproduce.