economic analysis and environmental impact assessment of
TRANSCRIPT

energies
Article
Economic Analysis and Environmental ImpactAssessment of Heat Pump-Assisted Distillationin a Gas Fractionation Unit
Jisook Lee 1,† , Yongho Son 2,†, Kwang Soon Lee 1 and Wangyun Won 3,*1 Department of Chemical & Biomolecular Engineering, Sogang University, 35 Baekbeomro, Mapogu,
Seoul 04107, Korea; [email protected] (J.L.); [email protected] (K.S.L.)2 Department of Chemical & Biomolecular Engineering, Korea Advanced Institute of Science and
Technology (KAIST), 291 Daehakro, Yuseonggu, Daejeon 34141, Korea; [email protected] Department of Chemical Engineering, Changwon National University, 20 Changwondaehak-ro, Uichang-gu,
Changwon, Gyeongnam 51140, Korea* Correspondence: [email protected]† Equally contributed.
Received: 11 February 2019; Accepted: 27 February 2019; Published: 5 March 2019�����������������
Abstract: The depletion of fossil fuels and environmental pollution (e.g., greenhouse gas emissions)through the combustion of fossil fuels have stimulated studies on new technologies able to curtailthe energy consumption of existing fractionation units. In this regard, heat pumps have garneredsubstantial attention due to their potential to improve the process energy efficiency. This study aims toprovide extensive economic analysis and environmental impact assessment of the application of heatpumps under different conditions and scenarios. For this purpose, we first selected three importantconditions: feed composition, plant capacity, and fuel price. Then, we performed a range of analysesto identify the major costs and environmental drivers. The economics and environmental impact ofheat pump-assisted distillation was investigated and compared with those of conventional distillation.
Keywords: economics; life cycle; column; fractionation; gas separation; energy
1. Introduction
Distillation is one of the most important separation methods in the refinery, petrochemical, andgas process industries [1]. Due to the heat required for the reboiler and the heat removal required forthe condenser, the conventional distillation columns clearly involve high-energy consumption. It isreported that distillation columns contribute to over 50% of the plant operating costs. Many researchgroups have proposed technologies to reduce the energy requirements of distillation.
Heat pumps are viable technologies to recover waste heat as valuable energy, thereby reducingthe overall energy consumption. The low-quality energy released from the condenser can be upgradedto drive the reboiler using a heat pump [2]. Vapor recompression heat pumps (VRHPs), which enablesubstantial energy savings, have become the standard heat pump technology in distillation processes.Danziger [3] concluded that, for the separation of close boiling components, the energy saving ofVRHPs is over 80% compared to conventional distillation systems. Fonyo and Benko [4] provided anorientation for process engineers on the application of heat pump systems to large industrial distillationcolumns. Their results showed that (1) larger heat loads and smaller process temperature differences(∆T) provide shorter payback times, and (2) the absorption heat transformation cycles are considerableat large ∆T values if other configurations are discarded. Diez et al. [5] demonstrated the economicfeasibility of three different types of heat pumps for a C4 splitter (i.e., the distillation for the separationof a mixture of i-butane (iC4) and n-butane (nC4)). They showed that the heat pumps allowed a
Energies 2019, 12, 852; doi:10.3390/en12050852 www.mdpi.com/journal/energies
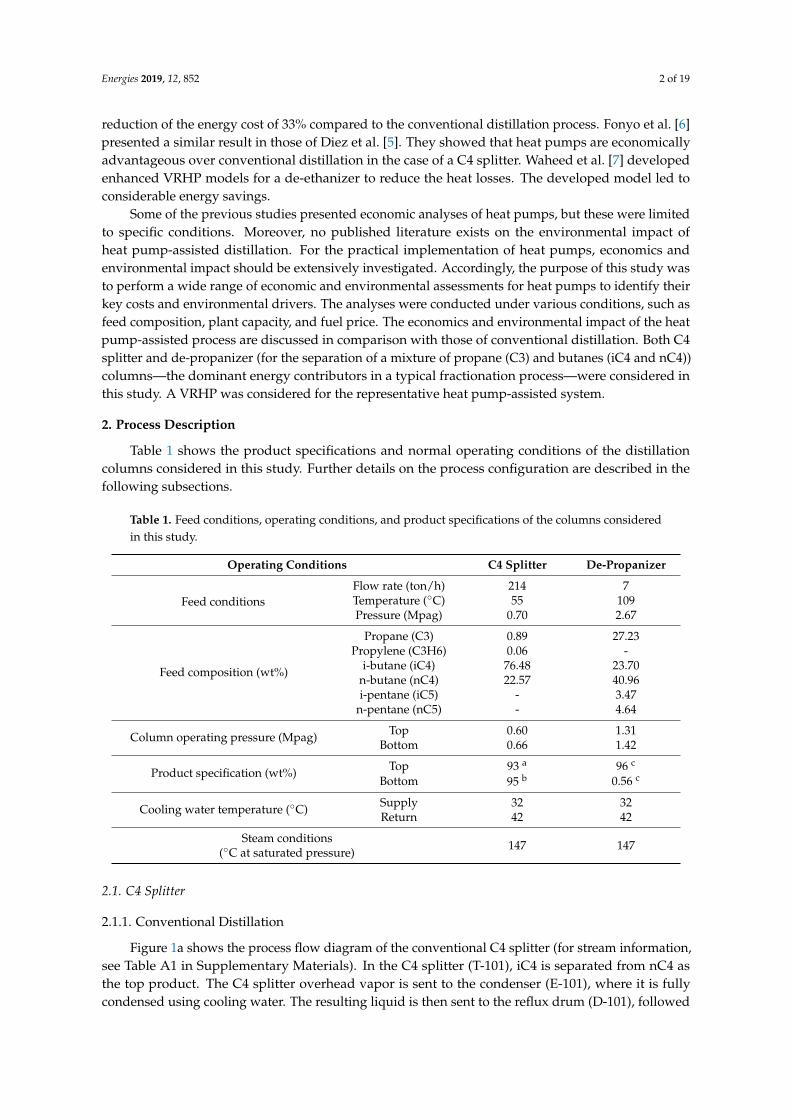
Energies 2019, 12, 852 2 of 19
reduction of the energy cost of 33% compared to the conventional distillation process. Fonyo et al. [6]presented a similar result in those of Diez et al. [5]. They showed that heat pumps are economicallyadvantageous over conventional distillation in the case of a C4 splitter. Waheed et al. [7] developedenhanced VRHP models for a de-ethanizer to reduce the heat losses. The developed model led toconsiderable energy savings.
Some of the previous studies presented economic analyses of heat pumps, but these were limitedto specific conditions. Moreover, no published literature exists on the environmental impact ofheat pump-assisted distillation. For the practical implementation of heat pumps, economics andenvironmental impact should be extensively investigated. Accordingly, the purpose of this study wasto perform a wide range of economic and environmental assessments for heat pumps to identify theirkey costs and environmental drivers. The analyses were conducted under various conditions, such asfeed composition, plant capacity, and fuel price. The economics and environmental impact of the heatpump-assisted process are discussed in comparison with those of conventional distillation. Both C4splitter and de-propanizer (for the separation of a mixture of propane (C3) and butanes (iC4 and nC4))columns—the dominant energy contributors in a typical fractionation process—were considered inthis study. A VRHP was considered for the representative heat pump-assisted system.
2. Process Description
Table 1 shows the product specifications and normal operating conditions of the distillationcolumns considered in this study. Further details on the process configuration are described in thefollowing subsections.
Table 1. Feed conditions, operating conditions, and product specifications of the columns consideredin this study.
Operating Conditions C4 Splitter De-Propanizer
Feed conditionsFlow rate (ton/h) 214 7Temperature (◦C) 55 109Pressure (Mpag) 0.70 2.67
Feed composition (wt%)
Propane (C3) 0.89 27.23Propylene (C3H6) 0.06 -
i-butane (iC4) 76.48 23.70n-butane (nC4) 22.57 40.96i-pentane (iC5) - 3.47
n-pentane (nC5) - 4.64
Column operating pressure (Mpag) Top 0.60 1.31Bottom 0.66 1.42
Product specification (wt%) Top 93 a 96 c
Bottom 95 b 0.56 c
Cooling water temperature (◦C) Supply 32 32Return 42 42
Steam conditions(◦C at saturated pressure) 147 147
2.1. C4 Splitter
2.1.1. Conventional Distillation
Figure 1a shows the process flow diagram of the conventional C4 splitter (for stream information,see Table A1 in Supplementary Materials). In the C4 splitter (T-101), iC4 is separated from nC4 asthe top product. The C4 splitter overhead vapor is sent to the condenser (E-101), where it is fullycondensed using cooling water. The resulting liquid is then sent to the reflux drum (D-101), followed

Energies 2019, 12, 852 3 of 19
by the pump (P-101). The heating requirements for the reboiler (E-102) of the C4 splitter are satisfiedby low-pressure steam.
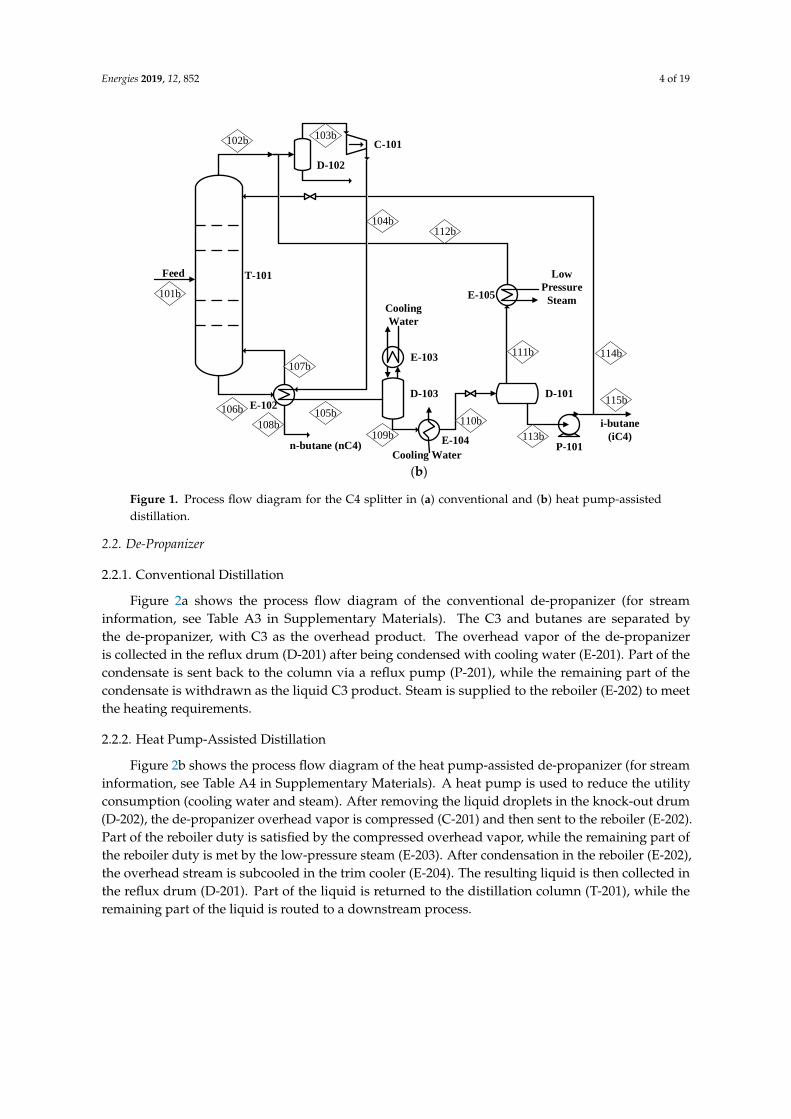
2.1.2. Heat Pump-Assisted Distillation
Figure 1b shows the process flow diagram of the heat pump-assisted C4 splitter (for streaminformation, see Table A2 in Supplementary Materials). Instead of using a steam reboiler and coolingwater condenser, a heat pump is applied to meet the heating and cooling requirements. In the process,the overhead vapor is routed to the compressor (C-101) preceded by the knock-out drum (D-102),where liquid droplets are removed. The compressed vapor is then sent to the reboiler (E-102) to satisfythe reboiler duty. In the reboiler, the vapor is partly condensed. The effluent stream from the reboilerenters the flash drum (D-103), where the remaining vapor is further condensed using cooling water(E-103). Non-condensable gases included in the effluent stream are vented at D-103. The liquid fromthe flash drum is routed to the reflux drum (D-101) after being subcooled in the trim cooler (E-104).The vapor from the reflux drum is then sent to the knock-out drum via a suction heater (E-105). Partof the effluent liquid from the reflux drum (i.e., iC4) is pumped to the distillation column, while theremaining part of the effluent liquid is pumped downstream.
Energies 2018, 11, x 3 of 19
followed by the pump (P-101). The heating requirements for the reboiler (E-102) of the C4 splitter are
satisfied by low-pressure steam.
2.1.2. Heat Pump-Assisted Distillation
Figure 1b shows the process flow diagram of the heat pump-assisted C4 splitter (for stream
information, see Table A2 in Supplementary Materials). Instead of using a steam reboiler and cooling
water condenser, a heat pump is applied to meet the heating and cooling requirements. In the process,
the overhead vapor is routed to the compressor (C-101) preceded by the knock-out drum (D-102),
where liquid droplets are removed. The compressed vapor is then sent to the reboiler (E-102) to
satisfy the reboiler duty. In the reboiler, the vapor is partly condensed. The effluent stream from the
reboiler enters the flash drum (D-103), where the remaining vapor is further condensed using cooling
water (E-103). Non-condensable gases included in the effluent stream are vented at D-103. The liquid
from the flash drum is routed to the reflux drum (D-101) after being subcooled in the trim cooler (E-
104). The vapor from the reflux drum is then sent to the knock-out drum via a suction heater (E-105).
Part of the effluent liquid from the reflux drum (i.e., iC4) is pumped to the distillation column, while
the remaining part of the effluent liquid is pumped downstream.
T-101
E-101
D-101
P-101
Reflux
i-butane (iC4)
Cooling Water
n-butane (nC4)
E-102
Low Pressure
Steam
Feed
101a
102a 103a
104a
105a
106a
109a
107a
108a
(a)
Figure 1. Cont.
Energies 2019, 12, 852 4 of 19Energies 2018, 11, x 4 of 19
T-101
D-101
P-101n-butane (nC4)
E-102
D-102
C-101
D-103
E-103
E-104
E-105
i-butane
(iC4)
Cooling Water
Cooling
Water
Low
Pressure
Steam
Feed
101b
102b103b
104b
105b106b
107b
108b109b
110b
111b
112b
113b
114b
115b
(b)
Figure 1. Process flow diagram for the C4 splitter in (a) conventional and (b) heat pump-assisted
distillation.
2.2. De-Propanizer
2.2.1. Conventional Distillation
Figure 2a shows the process flow diagram of the conventional de-propanizer (for stream
information, see Table A3 in Supplementary Materials). The C3 and butanes are separated by the de-
propanizer, with C3 as the overhead product. The overhead vapor of the de-propanizer is collected
in the reflux drum (D-201) after being condensed with cooling water (E-201). Part of the condensate
is sent back to the column via a reflux pump (P-201), while the remaining part of the condensate is
withdrawn as the liquid C3 product. Steam is supplied to the reboiler (E-202) to meet the heating
requirements.
2.2.2. Heat Pump-Assisted Distillation
Figure 2b shows the process flow diagram of the heat pump-assisted de-propanizer (for stream
information, see Table A4 in Supplementary Materials). A heat pump is used to reduce the utility
consumption (cooling water and steam). After removing the liquid droplets in the knock-out drum
(D-202), the de-propanizer overhead vapor is compressed (C-201) and then sent to the reboiler (E-
202). Part of the reboiler duty is satisfied by the compressed overhead vapor, while the remaining
part of the reboiler duty is met by the low-pressure steam (E-203). After condensation in the reboiler
(E-202), the overhead stream is subcooled in the trim cooler (E-204). The resulting liquid is then
collected in the reflux drum (D-201). Part of the liquid is returned to the distillation column (T-201),
while the remaining part of the liquid is routed to a downstream process.
Figure 1. Process flow diagram for the C4 splitter in (a) conventional and (b) heat pump-assisteddistillation.
2.2. De-Propanizer
2.2.1. Conventional Distillation
Figure 2a shows the process flow diagram of the conventional de-propanizer (for streaminformation, see Table A3 in Supplementary Materials). The C3 and butanes are separated bythe de-propanizer, with C3 as the overhead product. The overhead vapor of the de-propanizeris collected in the reflux drum (D-201) after being condensed with cooling water (E-201). Part of thecondensate is sent back to the column via a reflux pump (P-201), while the remaining part of thecondensate is withdrawn as the liquid C3 product. Steam is supplied to the reboiler (E-202) to meetthe heating requirements.
2.2.2. Heat Pump-Assisted Distillation
Figure 2b shows the process flow diagram of the heat pump-assisted de-propanizer (for streaminformation, see Table A4 in Supplementary Materials). A heat pump is used to reduce the utilityconsumption (cooling water and steam). After removing the liquid droplets in the knock-out drum(D-202), the de-propanizer overhead vapor is compressed (C-201) and then sent to the reboiler (E-202).Part of the reboiler duty is satisfied by the compressed overhead vapor, while the remaining part ofthe reboiler duty is met by the low-pressure steam (E-203). After condensation in the reboiler (E-202),the overhead stream is subcooled in the trim cooler (E-204). The resulting liquid is then collected inthe reflux drum (D-201). Part of the liquid is returned to the distillation column (T-201), while theremaining part of the liquid is routed to a downstream process.

Energies 2019, 12, 852 5 of 19
Energies 2018, 11, x 5 of 19
T-201
E-201
D-201
P-201
Reflux
Propane (C3)
Cooling Water
butanes & heaviers
E-202
Low Pressure
Steam
Feed
201a
202a 203a
204a
205a
206a
209a
207a
208a
(a)
Propane (C3)
T-201
D-201
P-201
E-202
D-202
C-201
Cooling
Water
E-203
butanes & heaviers
Feed
E-204
Low
Pressure
Steam
201b
202b203b
204b
205b
206b 207b
208b 209b
210b
211b
212b
213b
214b
215b
216b
217b
(b)
Figure 2. Process flow diagram for the de-propanizer in (a) conventional and (b) heat pump-assisted
distillation.
3. Process Simulation
3.1. Basis
We developed a process model using PRO/II® (SimSci by Schneider Electric, USA) [8], which
provides a rigorous distillation module based on the product specifications and operating conditions
given in Table 1. The Peng–Robins equation was used to calculate the thermodynamic properties.
Figure 2. Process flow diagram for the de-propanizer in (a) conventional and (b) heatpump-assisted distillation.
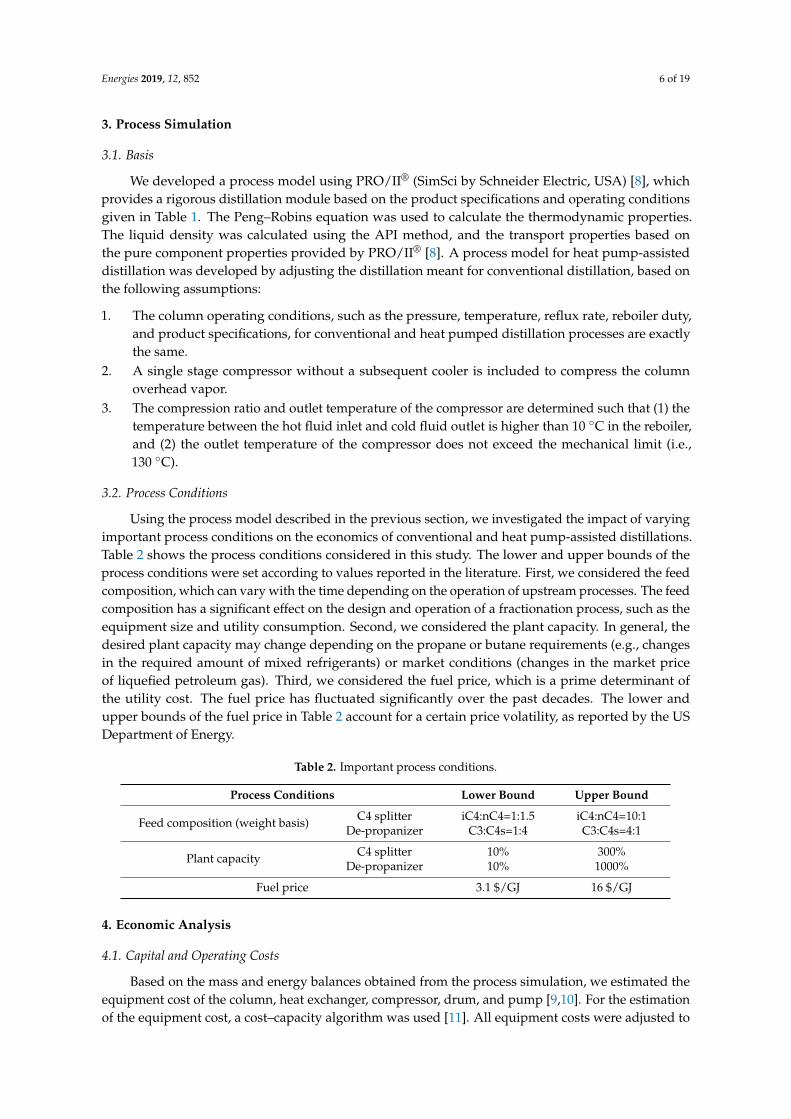
Energies 2019, 12, 852 6 of 19
3. Process Simulation
3.1. Basis
We developed a process model using PRO/II® (SimSci by Schneider Electric, USA) [8], whichprovides a rigorous distillation module based on the product specifications and operating conditionsgiven in Table 1. The Peng–Robins equation was used to calculate the thermodynamic properties.The liquid density was calculated using the API method, and the transport properties based onthe pure component properties provided by PRO/II® [8]. A process model for heat pump-assisteddistillation was developed by adjusting the distillation meant for conventional distillation, based onthe following assumptions:
1. The column operating conditions, such as the pressure, temperature, reflux rate, reboiler duty,and product specifications, for conventional and heat pumped distillation processes are exactlythe same.
2. A single stage compressor without a subsequent cooler is included to compress the columnoverhead vapor.
3. The compression ratio and outlet temperature of the compressor are determined such that (1) thetemperature between the hot fluid inlet and cold fluid outlet is higher than 10 ◦C in the reboiler,and (2) the outlet temperature of the compressor does not exceed the mechanical limit (i.e.,130 ◦C).
3.2. Process Conditions
Using the process model described in the previous section, we investigated the impact of varyingimportant process conditions on the economics of conventional and heat pump-assisted distillations.Table 2 shows the process conditions considered in this study. The lower and upper bounds of theprocess conditions were set according to values reported in the literature. First, we considered the feedcomposition, which can vary with the time depending on the operation of upstream processes. The feedcomposition has a significant effect on the design and operation of a fractionation process, such as theequipment size and utility consumption. Second, we considered the plant capacity. In general, thedesired plant capacity may change depending on the propane or butane requirements (e.g., changesin the required amount of mixed refrigerants) or market conditions (changes in the market priceof liquefied petroleum gas). Third, we considered the fuel price, which is a prime determinant ofthe utility cost. The fuel price has fluctuated significantly over the past decades. The lower andupper bounds of the fuel price in Table 2 account for a certain price volatility, as reported by the USDepartment of Energy.
Table 2. Important process conditions.
Process Conditions Lower Bound Upper Bound
Feed composition (weight basis) C4 splitter iC4:nC4=1:1.5 iC4:nC4=10:1De-propanizer C3:C4s=1:4 C3:C4s=4:1
Plant capacity C4 splitter 10% 300%De-propanizer 10% 1000%
Fuel price 3.1 $/GJ 16 $/GJ
4. Economic Analysis
4.1. Capital and Operating Costs
Based on the mass and energy balances obtained from the process simulation, we estimated theequipment cost of the column, heat exchanger, compressor, drum, and pump [9,10]. For the estimationof the equipment cost, a cost–capacity algorithm was used [11]. All equipment costs were adjusted to
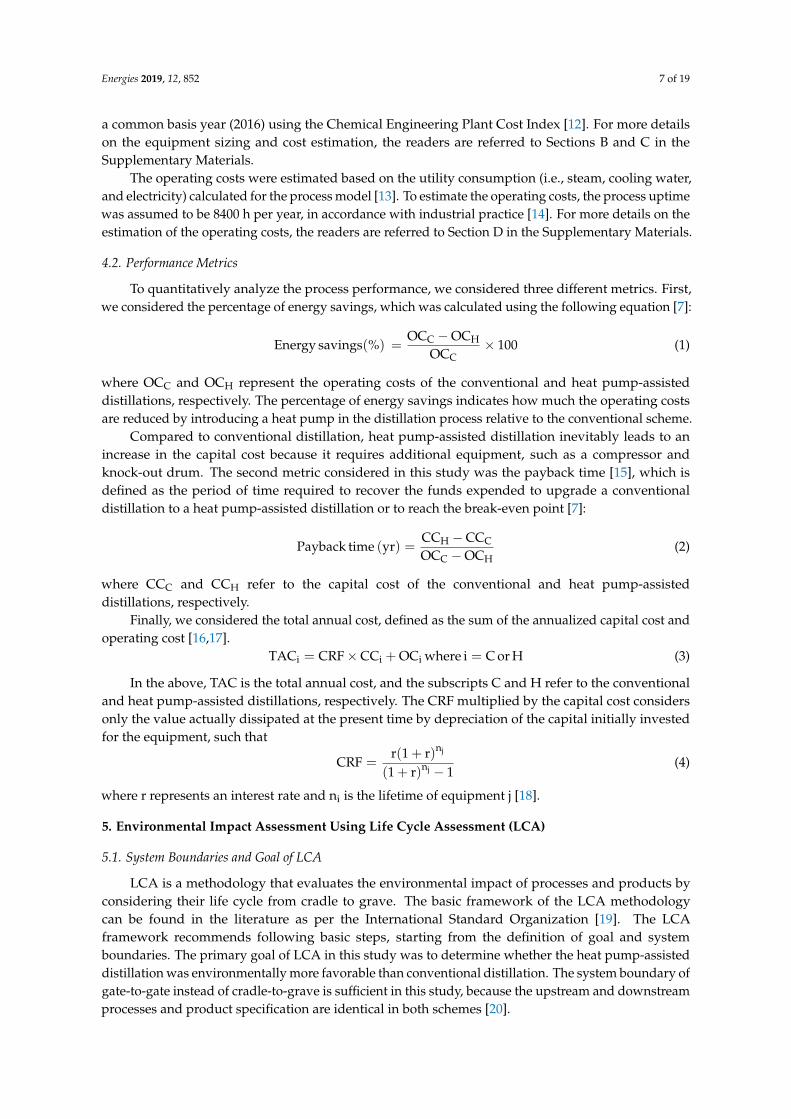
Energies 2019, 12, 852 7 of 19
a common basis year (2016) using the Chemical Engineering Plant Cost Index [12]. For more detailson the equipment sizing and cost estimation, the readers are referred to Sections B and C in theSupplementary Materials.
The operating costs were estimated based on the utility consumption (i.e., steam, cooling water,and electricity) calculated for the process model [13]. To estimate the operating costs, the process uptimewas assumed to be 8400 h per year, in accordance with industrial practice [14]. For more details on theestimation of the operating costs, the readers are referred to Section D in the Supplementary Materials.
4.2. Performance Metrics
To quantitatively analyze the process performance, we considered three different metrics. First,we considered the percentage of energy savings, which was calculated using the following equation [7]:
Energy savings(%) =OCC − OCH
OCC× 100 (1)
where OCC and OCH represent the operating costs of the conventional and heat pump-assisteddistillations, respectively. The percentage of energy savings indicates how much the operating costsare reduced by introducing a heat pump in the distillation process relative to the conventional scheme.
Compared to conventional distillation, heat pump-assisted distillation inevitably leads to anincrease in the capital cost because it requires additional equipment, such as a compressor andknock-out drum. The second metric considered in this study was the payback time [15], which isdefined as the period of time required to recover the funds expended to upgrade a conventionaldistillation to a heat pump-assisted distillation or to reach the break-even point [7]:
Payback time (yr) =CCH − CCC
OCC − OCH(2)
where CCC and CCH refer to the capital cost of the conventional and heat pump-assisteddistillations, respectively.
Finally, we considered the total annual cost, defined as the sum of the annualized capital cost andoperating cost [16,17].
TACi = CRF × CCi + OCi where i = C or H (3)
In the above, TAC is the total annual cost, and the subscripts C and H refer to the conventionaland heat pump-assisted distillations, respectively. The CRF multiplied by the capital cost considersonly the value actually dissipated at the present time by depreciation of the capital initially investedfor the equipment, such that
CRF =r(1 + r)nj
(1 + r)nj − 1(4)
where r represents an interest rate and ni is the lifetime of equipment j [18].
5. Environmental Impact Assessment Using Life Cycle Assessment (LCA)
5.1. System Boundaries and Goal of LCA
LCA is a methodology that evaluates the environmental impact of processes and products byconsidering their life cycle from cradle to grave. The basic framework of the LCA methodologycan be found in the literature as per the International Standard Organization [19]. The LCAframework recommends following basic steps, starting from the definition of goal and systemboundaries. The primary goal of LCA in this study was to determine whether the heat pump-assisteddistillation was environmentally more favorable than conventional distillation. The system boundary ofgate-to-gate instead of cradle-to-grave is sufficient in this study, because the upstream and downstreamprocesses and product specification are identical in both schemes [20].
Energies 2019, 12, 852 8 of 19
Since the main environmental concern in this study was CO2 emissions, conventional distillationand heat pump-assisted distillation were compared with respect to their global warming impact(GWI). The global warming impact is a single metric for global warming calculated as the accumulatedgreenhouse gas (GHG) emissions in CO2-equivalents (CO2-eq.) by weighting the global warmingpotential (GWP), which accounts for the capability of the GHG to absorb radiation [20].
5.2. Functional Units for the Investigated Processes
The functional units (FUs) in LCA define the functions of the investigated processes, thusbecoming a comparison basis [20]. The main functions of the conventional distillation and heatpump-assisted distillation of the C4 splitter and de-propanizer are the separation of iC4 and C3 fromeach feed stream. To quantify the main function, we chose both top and bottom products satisfyingthe product specifications as references for the functions ‘conventional C4 splitter’ (i.e., 1.0-tonvapor of 93% iC4 and 1.0-ton liquid of 95% nC4 = FUC4splitter) and ‘conventional de-propanizer’(i.e., 1.0-ton vapor of 96% C3 and 1.0-ton liquid of 0.56% C3 = FUde-propanizer). In this study, theenvironmental impact of global warming is provided in kg CO2-eq./FU (for details, see Table E1 in theSupplementary Materials).
The heat pump-assisted distillation involves more pieces of equipment, such as a compressorand heat exchanger, compared to conventional distillation. However, the additional equipment is notincluded in this LCA analysis because the environmental impact of the equipment assembly in thechemical industry is negligible [21].
6. Results
6.1. Evaluation of the Capital and Operating Costs
Figure 3 shows the results of the economic evaluation of conventional and heat pump-assisteddistillations. The annualized capital cost is lower than the annual operating cost for all systems.The annualized capital cost and annual operating cost account for 8–33% and 67–92% of the totalannual cost, respectively.
In conventional distillation, the cost of the column and steam account for a large portion of theannualized capital cost and annual operating cost. In the heat pump-assisted distillation, the costof the compressor is about 30–40% of the annualized capital cost, and the cost of electricity is about60–90% of the annual operating cost.
In the C4 splitter, the annualized capital cost for heat pump-assisted distillation is higher thanfor the conventional distillation, whereas the annual operating cost of the conventional distillationis higher than that of the heat pump-assisted distillation, as shown in Figure 3a,b. The main reasonsbehind the increase in the annualized capital cost and operating cost are the cost of the compressorand steam, respectively, in the heat pump-assisted distillation and conventional distillation. The totalannual cost of the heat pump-assisted distillation (11.69 × 10⁶ $/yr) is reduced to about 47% comparedto that of the conventional distillation (24.77 × 10 6 $/yr), led by steam cost reduction.
On the other hand, the total annual cost of the heat pump-assisted distillation is 22% higherthan that of the conventional distillation with a de-propanizer. The cost of the compressor andelectricity leads to increased annualized capital costs and annual operating costs, as shown inFigure 3c,d, respectively.
The cost of the pump did not vary with the process configuration in this study. The cost of thedrums increased in the heat pump-assisted distillation by increasing the number of required drumsin the process, as shown in Figures 1b and 2b. In Figure 3b, the heat exchanger cost for the heatpump-assisted distillation with the C4 splitter is higher than that for the conventional distillation, dueto an increase of the total required heat transfer area; however, the total required heat transfer area ofthe heat pump-assisted distillation is lower than that for the conventional distillation. Consequently,the heat exchanger cost is lower for the system with the de-propanizer column.

Energies 2019, 12, 852 9 of 19Energies 2018, 11, x 9 of 19
(a)
(b)
(c)
(d)
Figure 3. Cost contributions. The numbers in parentheses denote the costs (106 $/yr and 103 $/yr for
the C4 splitter and de-propanizer, respectively): (a) Conventional C4 splitter, (b) heat pump-assisted
C4 splitter, (c) conventional de-propanizer, and (d) heat pump-assisted de-propanizer.
24% (0.49 )
73.3% (1.49 )
CompressorDrumPumpColumnHeat Exchanger
12% (2.72 )
87% (19.86 )
Electricity
Steam
Cooling Water
Operating cost92% (22.73)
Annualized capital cost8% (2.04)
10
0%
10
0%
47.8% (1.49 )
16.3% (0.51 )
6.3% (0.20 )
29.2%(0.91)
Operating cost75% ( 9.20 )
Annualized capital cost25% (3.12 )
4% (0.38 )3% (0.32 )
92% (8.50 )
10
0%
10
0%
77% ( 73 )
13% (12 )
9% (8 )
Operating cost76% (300 )
Annualized capital cost24% (95 )
22%(67 )
77%( 231 )
10
0%
10
0%
46% (73 )
6% (9 )
9% (15 )
38 %(59 )
Operating cost67% (322 )
Annualized capital cost33% (158 )
14%(46 )
24% (76 )
62%(201 )
10
0%
10
0%
Figure 3. Cost contributions. The numbers in parentheses denote the costs (106 $/yr and 103 $/yr forthe C4 splitter and de-propanizer, respectively): (a) Conventional C4 splitter; (b) heat pump-assistedC4 splitter; (c) conventional de-propanizer; and (d) heat pump-assisted de-propanizer.
Energies 2019, 12, 852 10 of 19
6.2. Sensitivity Analysis
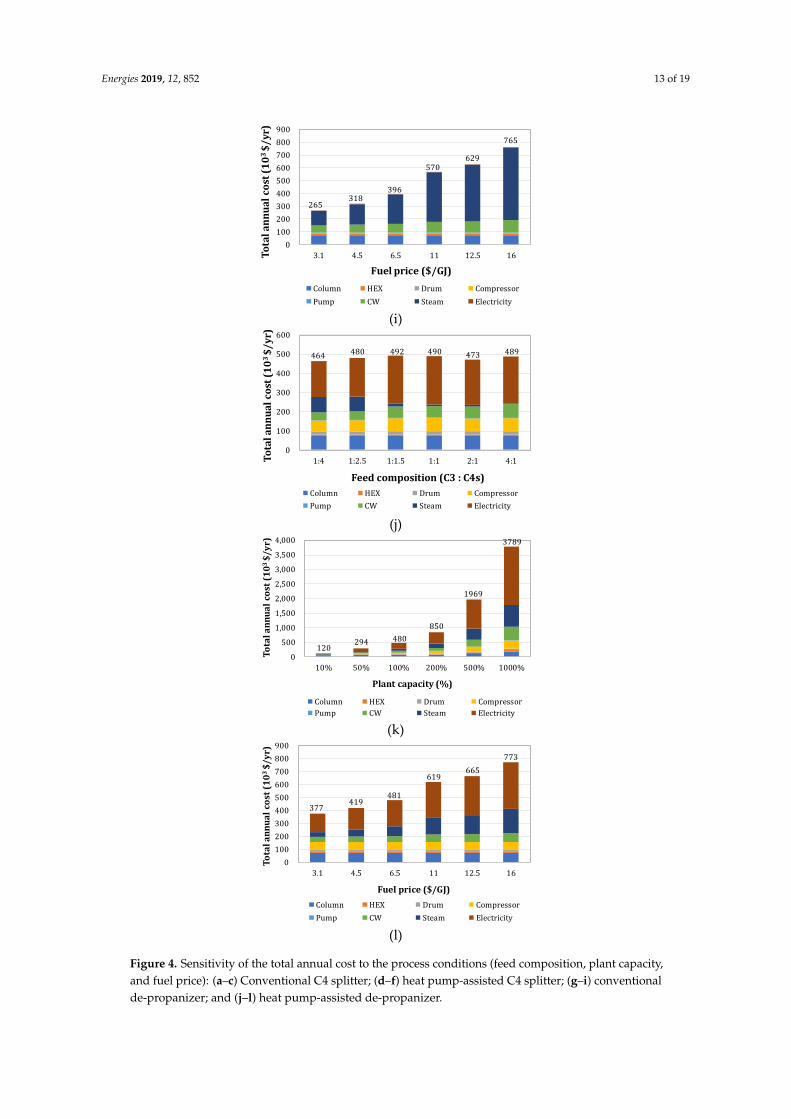
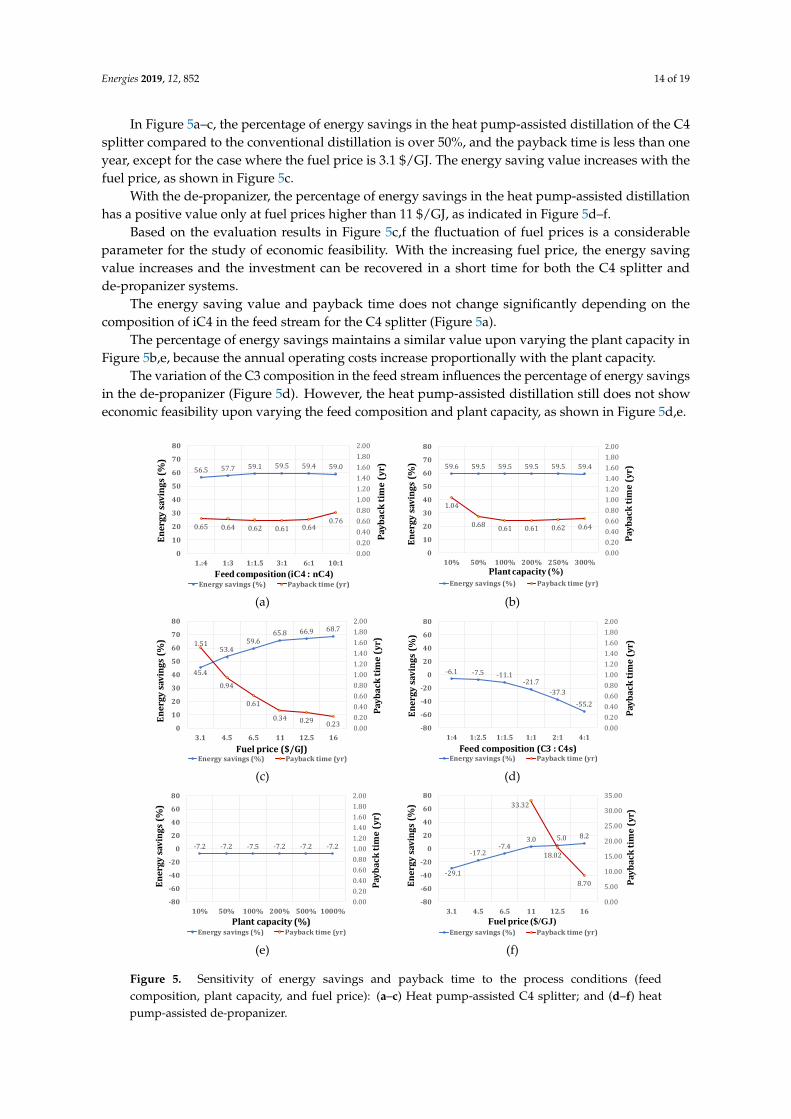
We evaluated the parameter effects on the economic feasibility by performing a sensitivity analysis.We calculated the total annual cost, percentage of energy savings of the heat pump-assisted distillationcompared to conventional distillation, and the payback time by varying the feed composition, plantcapacity, and fuel price within a specific range. The results are presented in Figures 4 and 5.
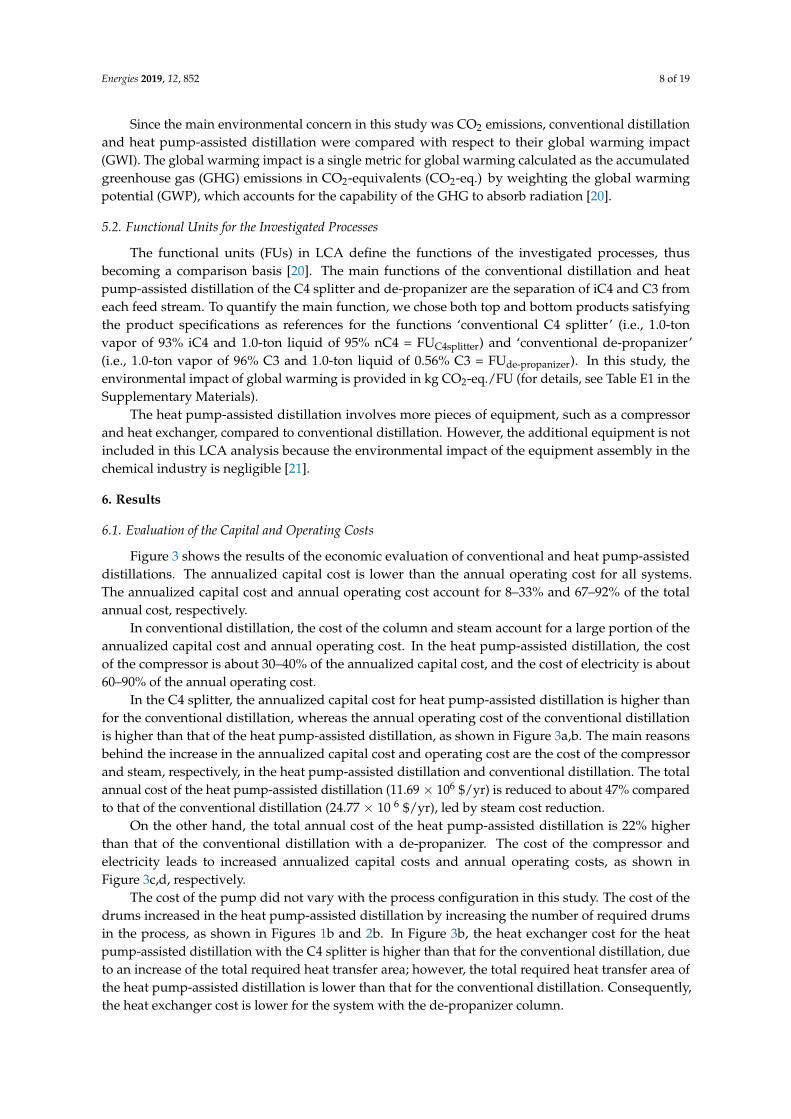
As shown in Figure 4, the total annual cost depends on the feed composition, plant capacity, andfuel price. In the C4 splitter, the total annual cost of the conventional distillation is higher than that ofthe heat pump-assisted distillation for all cases. The total annual cost tends to decrease by increasingthe iC4 composition in the feed, as shown in Figure 4a,d. By increasing the iC4 composition, thekey ratio in the column stage defined as Equation (5) [8] increases. Consequently, the separation isimproved, reducing the equipment costs and annual operating cost.
Key ratio =Light key mole fraction in liquid phase
Heavy key mole fraction in liquid phase(5)
where light key refers to the iC4 component and heavy key to the nC4 component.However, in the case of a feed composition ratio of 1:1.5 (Figure 4a), the total annual cost is
increased compared to the 1:3 feed case. In the latter, the separation is improved a little bit, but moreheat duty is required to vaporize the iC4 component from the liquid feed to the top product andto cool more products. At feed ratios above 1:3, such a separation effect starts to become more andmore prominent.
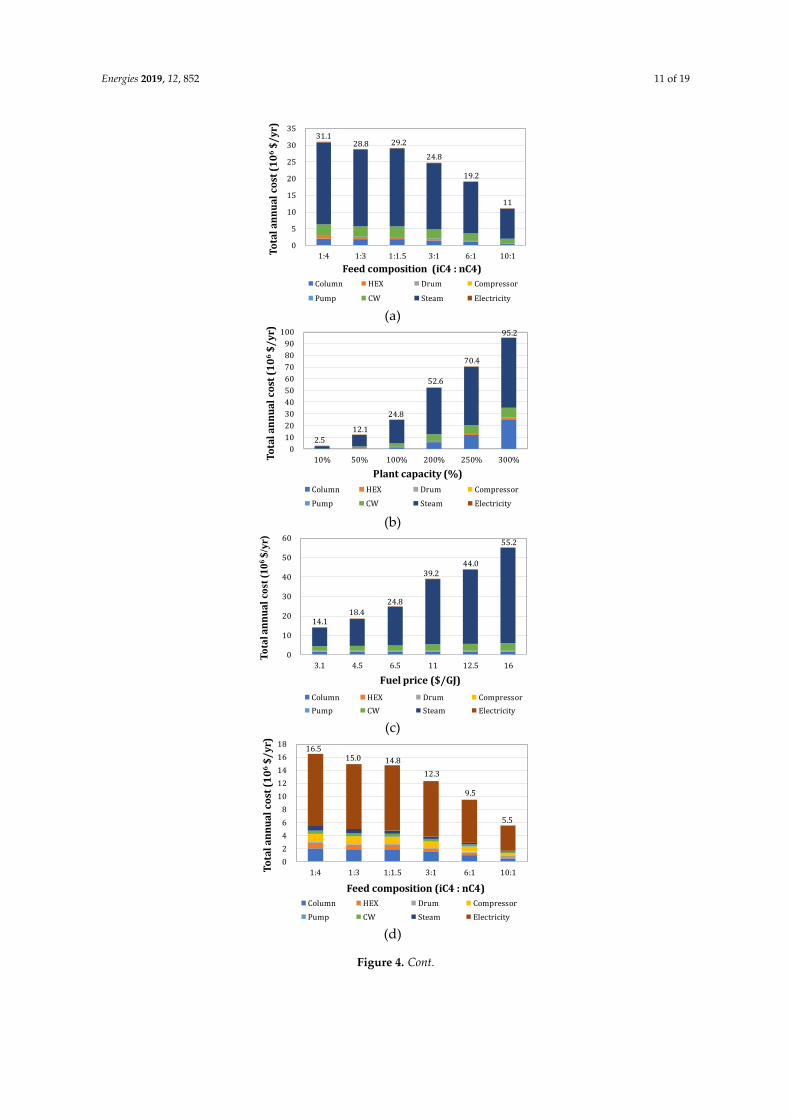
With the de-propanizer, the total annual cost of the heat pump-assisted distillation is higherthan in the conventional distillation for all cases. The cost of the compressor and electricity leads toan increase of the total annual cost, as shown in Figure 4g–l. The total annual cost of conventionaldistillation tends to decrease with the increasing C3 composition in the feed, as shown in Figure 4g. Byincreasing the C3 composition in the feed, the key ratio increases, resulting in improved separation.Consequently, the annual operating cost decreases.
Similarly, in the C4 splitter, when the feed composition ratio is 1:2.5 (Figure 4g), the total annualcost increases compared to the 1:4 feed ratio case. More heat duty is required to vaporize the C3component from the liquid feed to the top product to cool more products. Above 1:2.5 feed ratios, thisseparation effect becomes more apparent.
In contrast, by increasing the C3 composition in the feed in the heat pump-assisted distillation, thetop vapor product increases leading to increases in the compressor size and consumption of electricity.On the other hand, the consumption of steam is reduced, because the steam reboiler duty (E-203 inFigure 2b) is replaced by compression heat. Therefore, the total annual cost of the heat pump-assisteddistillation does not change significantly with variations in the feed composition in this study, asshown in Figure 4j.
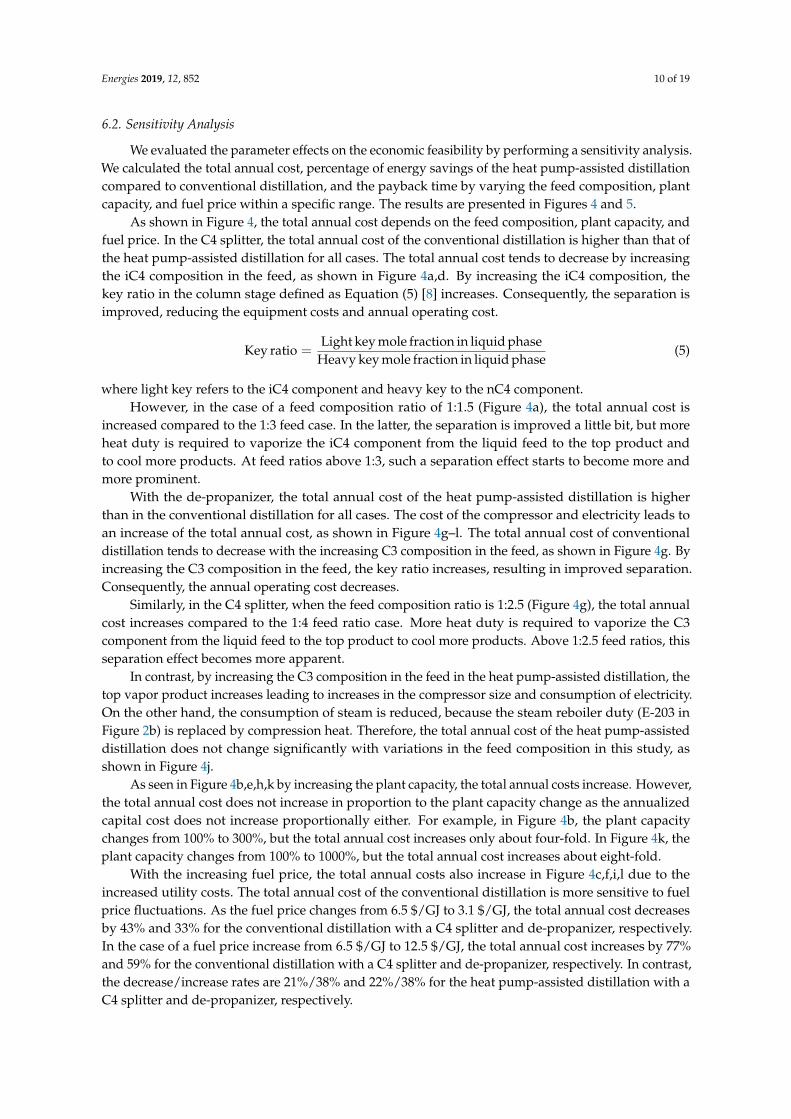
As seen in Figure 4b,e,h,k by increasing the plant capacity, the total annual costs increase. However,the total annual cost does not increase in proportion to the plant capacity change as the annualizedcapital cost does not increase proportionally either. For example, in Figure 4b, the plant capacitychanges from 100% to 300%, but the total annual cost increases only about four-fold. In Figure 4k, theplant capacity changes from 100% to 1000%, but the total annual cost increases about eight-fold.
With the increasing fuel price, the total annual costs also increase in Figure 4c,f,i,l due to theincreased utility costs. The total annual cost of the conventional distillation is more sensitive to fuelprice fluctuations. As the fuel price changes from 6.5 $/GJ to 3.1 $/GJ, the total annual cost decreasesby 43% and 33% for the conventional distillation with a C4 splitter and de-propanizer, respectively.In the case of a fuel price increase from 6.5 $/GJ to 12.5 $/GJ, the total annual cost increases by 77%and 59% for the conventional distillation with a C4 splitter and de-propanizer, respectively. In contrast,the decrease/increase rates are 21%/38% and 22%/38% for the heat pump-assisted distillation with aC4 splitter and de-propanizer, respectively.
Energies 2019, 12, 852 11 of 19
Energies 2018, 11, x 11 of 19
(a)
(b)
(c)
(d)
0
5
10
15
20
25
30
35
1:4 1:3 1:1.5 3:1 6:1 10:1To
tal
an
nu
al
cost
(1
06
$/
yr)
Feed composition (iC4 : nC4)
Column HEX Drum Compressor
Pump CW Steam Electricity
31.128.8 29.2
24.8
19.2
11
0
10
20
30
40
50
60
70
80
90
100
10% 50% 100% 200% 250% 300%To
tal
an
nu
al
cost
(1
06
$/
yr)
Plant capacity (%)
Column HEX Drum Compressor
Pump CW Steam Electricity
2.5
12.1
24.8
52.6
70.4
95.2
0
10
20
30
40
50
60
3.1 4.5 6.5 11 12.5 16
To
tal a
nn
ua
lco
st (
10
6$
/yr)
Fuel price ($/GJ)
Column HEX Drum Compressor
Pump CW Steam Electricity
14.118.4
24.8
39.244.0
55.2
0
2
4
6
8
10
12
14
16
18
1:4 1:3 1:1.5 3:1 6:1 10:1To
tal
an
nu
al
cost
(1
06
$/
yr)
Feed composition (iC4 : nC4)
Column HEX Drum Compressor
Pump CW Steam Electricity
16.515.0 14.8
12.3
9.5
5.5
Figure 4. Cont.
Energies 2019, 12, 852 12 of 19
Energies 2018, 11, x 12 of 19
(e)
(f)
(g)
(h)
0
10
20
30
40
50
60
70
10% 50% 100% 200% 250% 300%To
tal
an
nu
al
cost
(1
06
$/
yr)
Plant capacity (%)
Column HEX Drum Compressor
Pump CW Steam Electricity
1.36.0
12.3
27.7
39.4
58.1
0
5
10
15
20
25
3.1 4.5 6.5 11 12.5 16To
tal
an
nu
al
cost
(1
06
$/
yr)
Fuel price ($/GJ)
Column HEX Drum Compressor
Pump CW Steam Electricity
9.710.8
12.3
15.917
19.8
0
50
100
150
200
250
300
350
400
450
1:4 1:2.5 1:1.5 1:1 2:1 4:1To
tal
an
nu
al
cost
(1
03
$/
yr)
Feed composition (C3 : C4s)
Column HEX Drum Compressor
Pump CW Steam Electricity
386 395 385362
321300
0
500
1,000
1,500
2,000
2,500
3,000
3,500
10% 50% 100% 200% 500% 1000%To
tal
an
nu
al
cost
(1
03
$/
yr)
Plant capacity (%)
Column HEX Drum Compressor
Pump CW Steam Electricity
100238 395
712
1694
3320
Figure 4. Cont.
Energies 2019, 12, 852 13 of 19
Energies 2018, 11, x 13 of 19
(i)
(j)
(k)
(l)
Figure 4. Sensitivity of the total annual cost to the process conditions (feed composition, plant
capacity, and fuel price): (a), (b), and (c) Conventional C4 splitter; (d), (e), and (f) heat pump-assisted
C4 splitter; (g), (h), and (i) conventional de-propanizer; and (j), (k), and (l) heat pump-assisted de-
propanizer.
0
100
200
300
400
500
600
700
800
900
3.1 4.5 6.5 11 12.5 16To
tal
an
nu
al
cost
(1
03
$/
yr)
Fuel price ($/GJ)
Column HEX Drum Compressor
Pump CW Steam Electricity
265318
396
570629
765
0
100
200
300
400
500
600
1:4 1:2.5 1:1.5 1:1 2:1 4:1To
tal
an
nu
al
cost
(1
03
$/
yr)
Feed composition (C3 : C4s)
Column HEX Drum Compressor
Pump CW Steam Electricity
464 480 492 490 473 489
0
500
1,000
1,500
2,000
2,500
3,000
3,500
4,000
10% 50% 100% 200% 500% 1000%
To
tal
an
nu
al
cost
(1
03
$/y
r)
Plant capacity (%)
Column HEX Drum Compressor
Pump CW Steam Electricity
120294 480
850
1969
3789
0
100
200
300
400
500
600
700
800
900
3.1 4.5 6.5 11 12.5 16
To
tal a
nn
ua
l co
st (
10
3 $
/yr)
Fuel price ($/GJ)
Column HEX Drum Compressor
Pump CW Steam Electricity
377419
481
619665
773
Figure 4. Sensitivity of the total annual cost to the process conditions (feed composition, plant capacity,and fuel price): (a–c) Conventional C4 splitter; (d–f) heat pump-assisted C4 splitter; (g–i) conventionalde-propanizer; and (j–l) heat pump-assisted de-propanizer.
Energies 2019, 12, 852 14 of 19
In Figure 5a–c, the percentage of energy savings in the heat pump-assisted distillation of the C4splitter compared to the conventional distillation is over 50%, and the payback time is less than oneyear, except for the case where the fuel price is 3.1 $/GJ. The energy saving value increases with thefuel price, as shown in Figure 5c.
With the de-propanizer, the percentage of energy savings in the heat pump-assisted distillationhas a positive value only at fuel prices higher than 11 $/GJ, as indicated in Figure 5d–f.
Based on the evaluation results in Figure 5c,f the fluctuation of fuel prices is a considerableparameter for the study of economic feasibility. With the increasing fuel price, the energy savingvalue increases and the investment can be recovered in a short time for both the C4 splitter andde-propanizer systems.
The energy saving value and payback time does not change significantly depending on thecomposition of iC4 in the feed stream for the C4 splitter (Figure 5a).
The percentage of energy savings maintains a similar value upon varying the plant capacity inFigure 5b,e, because the annual operating costs increase proportionally with the plant capacity.
The variation of the C3 composition in the feed stream influences the percentage of energy savingsin the de-propanizer (Figure 5d). However, the heat pump-assisted distillation still does not showeconomic feasibility upon varying the feed composition and plant capacity, as shown in Figure 5d,e.
Energies 2018, 11, x 14 of 19
year, except for the case where the fuel price is 3.1 $/GJ. The energy saving value increases with the
fuel price, as shown in Figure 5c.
With the de-propanizer, the percentage of energy savings in the heat pump-assisted distillation
has a positive value only at fuel prices higher than 11 $/GJ, as indicated in Figure 5d–f.
Based on the evaluation results in Figure 5c,f the fluctuation of fuel prices is a considerable
parameter for the study of economic feasibility. With the increasing fuel price, the energy saving
value increases and the investment can be recovered in a short time for both the C4 splitter and de-
propanizer systems.
The energy saving value and payback time does not change significantly depending on the
composition of iC4 in the feed stream for the C4 splitter (Figure 5a).
The percentage of energy savings maintains a similar value upon varying the plant capacity in
Figure 5b,e, because the annual operating costs increase proportionally with the plant capacity.
The variation of the C3 composition in the feed stream influences the percentage of energy
savings in the de-propanizer (Figure 5d). However, the heat pump-assisted distillation still does not
show economic feasibility upon varying the feed composition and plant capacity, as shown in Figure
5d,e.
(a) (b)
(c) (d)
(e) (f)
56.5 57.7 59.1 59.5 59.4 59.0
0.65 0.64 0.62 0.61 0.64 0.76
0.00
0.20
0.40
0.60
0.80
1.00
1.20
1.40
1.60
1.80
2.00
0
10
20
30
40
50
60
70
80
1.:4 1:3 1:1.5 3:1 6:1 10:1
Pay
ba
ck t
ime
(y
r)
En
erg
y s
avin
gs
(%)
Feed composition (iC4 : nC4)Energy savings (%) Payback time (yr)
59.6 59.5 59.5 59.5 59.5 59.4
1.04
0.68 0.61 0.61 0.62 0.64
0.00
0.20
0.40
0.60
0.80
1.00
1.20
1.40
1.60
1.80
2.00
0
10
20
30
40
50
60
70
80
10% 50% 100% 200% 250% 300%
Pay
ba
ck t
ime
(y
r)
En
erg
y s
avin
gs
(%)
Plant capacity (%)
Energy savings (%) Payback time (yr)
45.4
53.4 59.6
65.8 66.9 68.7
1.51
0.94
0.61
0.34 0.29 0.23 0.00
0.20
0.40
0.60
0.80
1.00
1.20
1.40
1.60
1.80
2.00
0
10
20
30
40
50
60
70
80
3.1 4.5 6.5 11 12.5 16
Pay
ba
ck t
ime
(y
r)
En
erg
y s
avin
gs
(%)
Fuel price ($/GJ)Energy savings (%) Payback time (yr)
-6.1 -7.5 -11.1 -21.7
-37.3
-55.2
0.00
0.20
0.40
0.60
0.80
1.00
1.20
1.40
1.60
1.80
2.00
-80
-60
-40
-20
0
20
40
60
80
1:4 1:2.5 1:1.5 1:1 2:1 4:1
Pay
ba
ck t
ime
(y
r)
En
erg
y s
avin
gs
(%)
Feed composition (C3 : C4s)Energy savings (%) Payback time (yr)
-7.2 -7.2 -7.5 -7.2 -7.2 -7.2
0.00
0.20
0.40
0.60
0.80
1.00
1.20
1.40
1.60
1.80
2.00
-80
-60
-40
-20
0
20
40
60
80
10% 50% 100% 200% 500% 1000%
Pay
ba
ck t
ime
(y
r)
En
erg
y s
avin
gs
(%)
Plant capacity (%)Energy savings (%) Payback time (yr)
-29.1
-17.2 -7.4
3.0 5.0 8.2
33.32
18.02
8.70
0.00
5.00
10.00
15.00
20.00
25.00
30.00
35.00
-80
-60
-40
-20
0
20
40
60
80
3.1 4.5 6.5 11 12.5 16
Pay
ba
ck t
ime
(y
r)
En
erg
y s
avin
gs
(%)
Fuel price ($/GJ)Energy savings (%) Payback time (yr)
Figure 5. Sensitivity of energy savings and payback time to the process conditions (feedcomposition, plant capacity, and fuel price): (a–c) Heat pump-assisted C4 splitter; and (d–f) heatpump-assisted de-propanizer.
Energies 2019, 12, 852 15 of 19
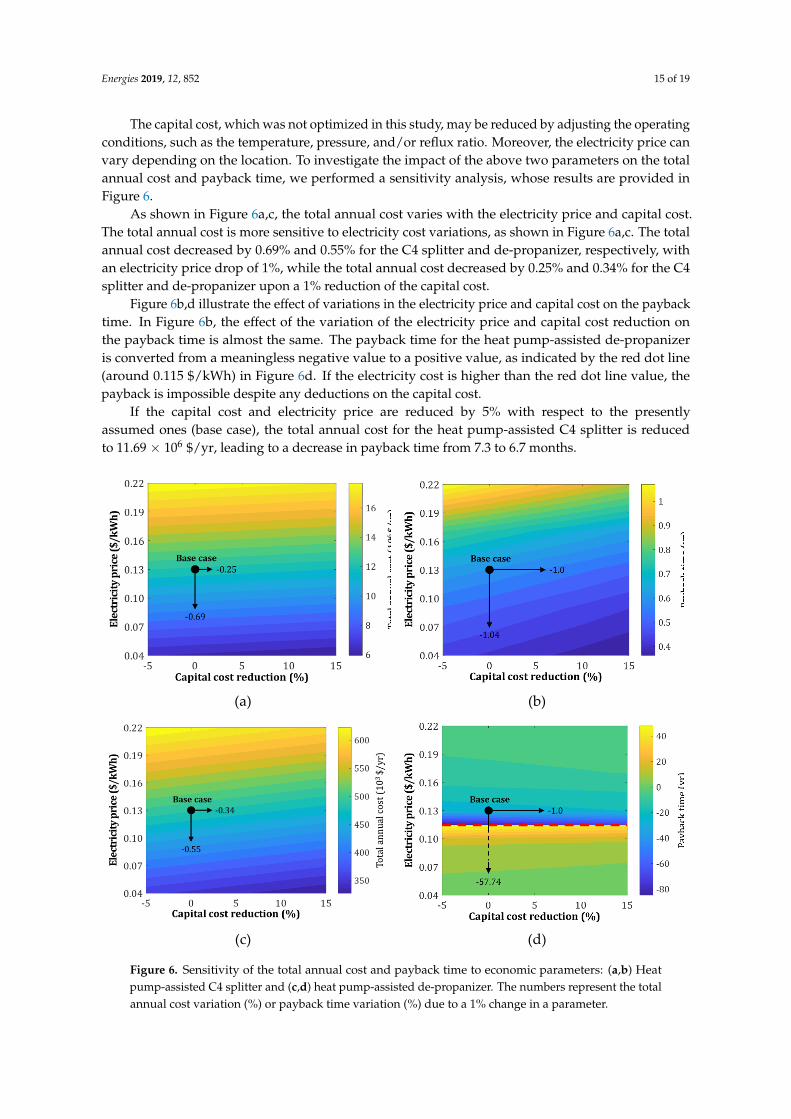
The capital cost, which was not optimized in this study, may be reduced by adjusting the operatingconditions, such as the temperature, pressure, and/or reflux ratio. Moreover, the electricity price canvary depending on the location. To investigate the impact of the above two parameters on the totalannual cost and payback time, we performed a sensitivity analysis, whose results are provided inFigure 6.
As shown in Figure 6a,c, the total annual cost varies with the electricity price and capital cost.The total annual cost is more sensitive to electricity cost variations, as shown in Figure 6a,c. The totalannual cost decreased by 0.69% and 0.55% for the C4 splitter and de-propanizer, respectively, withan electricity price drop of 1%, while the total annual cost decreased by 0.25% and 0.34% for the C4splitter and de-propanizer upon a 1% reduction of the capital cost.
Figure 6b,d illustrate the effect of variations in the electricity price and capital cost on the paybacktime. In Figure 6b, the effect of the variation of the electricity price and capital cost reduction onthe payback time is almost the same. The payback time for the heat pump-assisted de-propanizeris converted from a meaningless negative value to a positive value, as indicated by the red dot line(around 0.115 $/kWh) in Figure 6d. If the electricity cost is higher than the red dot line value, thepayback is impossible despite any deductions on the capital cost.
If the capital cost and electricity price are reduced by 5% with respect to the presentlyassumed ones (base case), the total annual cost for the heat pump-assisted C4 splitter is reducedto 11.69 × 10⁶ $/yr, leading to a decrease in payback time from 7.3 to 6.7 months.
Energies 2018, 11, x 15 of 19
(e) (f)
Figure 5. Sensitivity of energy savings and payback time to the process conditions (feed composition,
plant capacity, and fuel price): (a), (b), and (c) Heat pump-assisted C4 splitter; and (d), (e), and (f) heat
pump-assisted de-propanizer.
The capital cost, which was not optimized in this study, may be reduced by adjusting the
operating conditions, such as the temperature, pressure, and/or reflux ratio. Moreover, the electricity
price can vary depending on the location. To investigate the impact of the above two parameters on
the total annual cost and payback time, we performed a sensitivity analysis, whose results are
provided in Figure 6.
As shown in Figure 6a,c, the total annual cost varies with the electricity price and capital cost.
The total annual cost is more sensitive to electricity cost variations, as shown in Figure 6a,c. The total
annual cost decreased by 0.69% and 0.55% for the C4 splitter and de-propanizer, respectively, with
an electricity price drop of 1%, while the total annual cost decreased by 0.25% and 0.34% for the C4
splitter and de-propanizer upon a 1% reduction of the capital cost.
Figure 6b,d illustrate the effect of variations in the electricity price and capital cost on the
payback time. In Figure 6b, the effect of the variation of the electricity price and capital cost reduction
on the payback time is almost the same. The payback time for the heat pump-assisted de-propanizer
is converted from a meaningless negative value to a positive value, as indicated by the red dot line
(around 0.115 $/kWh) in Figure 6d. If the electricity cost is higher than the red dot line value, the
payback is impossible despite any deductions on the capital cost.
If the capital cost and electricity price are reduced by 5% with respect to the presently assumed
ones (base case), the total annual cost for the heat pump-assisted C4 splitter is reduced to 11.69×10⁶
$/yr, leading to a decrease in payback time from 7.3 to 6.7 months.
(a) (b)
(c) (d)
Figure 6. Sensitivity of the total annual cost and payback time to economic parameters: (a,b) Heatpump-assisted C4 splitter and (c,d) heat pump-assisted de-propanizer. The numbers represent the totalannual cost variation (%) or payback time variation (%) due to a 1% change in a parameter.

Energies 2019, 12, 852 16 of 19
6.3. LCA Results and Discussion
The gate-to-gate impact on global warming was assessed for the functional units FUC4splitter andFUde-propanizer for the C4 splitter and de-propanizer, respectively. Figure 7 shows the global warmingimpact of the C4 splitter and de-propanizer in conventional and heat pump-assisted distillations.In both the C4 splitter and de-propanizer cases, the largest contributor to the total GHG emissionsof the conventional distillation is the steam supplied to the reboiler (E-102 and E-202). By switchingto an alternative configuration using a heat pump, the GHG emissions can be reduced by 81%(C4 splitter) and 32% (de-propanizer) compared to those of conventional distillation. Major GHGemission reductions originate from lower steam consumption, which is substituted by the electricityconsumption of the heat pump (C-101 and C-201). For the de-propanizer, the heat pump-assistedcolumn has a smaller reduction effect than the C4 splitter, which can be explained by the temperaturedifference between the vapor to be compressed and the reboiler to be heated. The temperaturedifference in the de-propanizer is approximately 50 ◦C compared to the 15 ◦C of the C4 splitter, whichleads to more energy consumption of both electricity and steam to provide the required reboiler heatduty for the de-propanizer.
Energies 2018, 11, x 16 of 19
Figure 6. Sensitivity of the total annual cost and payback time to economic parameters: (a) and (b)
Heat pump-assisted C4 splitter and (c) and (d) heat pump-assisted de-propanizer. The numbers
represent the total annual cost variation (%) or payback time variation (%) due to a 1% change in a
parameter.
6.3. LCA Results and Discussion
The gate-to-gate impact on global warming was assessed for the functional units FUC4splitter and
FUde-propanizer for the C4 splitter and de-propanizer, respectively. Figure 7 shows the global warming
impact of the C4 splitter and de-propanizer in conventional and heat pump-assisted distillations. In
both the C4 splitter and de-propanizer cases, the largest contributor to the total GHG emissions of
the conventional distillation is the steam supplied to the reboiler (E-102 and E-202). By switching to
an alternative configuration using a heat pump, the GHG emissions can be reduced by 81% (C4
splitter) and 32% (de-propanizer) compared to those of conventional distillation. Major GHG
emission reductions originate from lower steam consumption, which is substituted by the electricity
consumption of the heat pump (C-101 and C-201). For the de-propanizer, the heat pump-assisted
column has a smaller reduction effect than the C4 splitter, which can be explained by the temperature
difference between the vapor to be compressed and the reboiler to be heated. The temperature
difference in the de-propanizer is approximately 50 °C compared to the 15 °C of the C4 splitter, which
leads to more energy consumption of both electricity and steam to provide the required reboiler heat
duty for the de-propanizer.
0
20
40
60
80
100
120
Conventional Heat pump-assisted
GW
I (k
g C
O2-e
q./
FU
C4
spli
tter
)
Cooling water (E-104)Cooling water (E-103)Cooling water (E-101)
Electricity (C-101)Electricity (P-101)Steam (E-105)Steam (E-102)
0
20
40
60
80
100
120
Cooling water (E-204)
Cooling water (E-201)
Electricity (C-201)
Electricity (P-201)Steam (E-203)
Steam (E-202)
81
%
red
uct
ion
Conventional Heat pump-assisted
GW
I (k
g C
O2-e
q./
FU
de-
pro
pan
izer
)
32
%
red
uct
ion
109.4
20.7
108.2
73.9
(a) (b)
Figure 7. GWI (Global warming impact) in kg CO2-equivalents (kg CO2-eq.) per functional unit (FU)
for (a) a C4 splitter in conventional distillation (left) and heat pump-assisted distillation (right), and
(b) a de-propanizer in conventional distillation (left) and heat pump-assisted distillation (right).
Figure 8 shows the effects of plant capacity and feed composition on the CO2 reduction by
introducing a heat pump in the C4 splitter and de-propanizer. CO2 reduction is defined as the
percentage difference of GWI between conventional distillation and heat pump-assisted distillation
over the GWI of conventional distillation: it is the quantitative environmental advantage against
global warming of switching to a heat pump configuration. Similar to the energy saving analysis in
Figure 5, no effect of the plant capacity was observed on the CO2 reduction in the case of heap pump-
assisted distillation. On the other hand, the feed composition exhibited a different behavior. In both
the C4 splitter and de-propanizer, the heavier component in the feed increased as well as the GWI of
the conventional distillation due to a larger reboiler heat duty. Accordingly, the GWI of the heat
pump-assisted column increased. For the C4-splitter, the CO2 reduction was almost constant over the
considered range of feed compositions. On the other hand, the CO2 reduction for the de-propanizer
reached its maximum at a feed composition of 1:1.5.
Figure 7. GWI (Global warming impact) in kg CO2-equivalents (kg CO2-eq.) per functional unit (FU)for (a) a C4 splitter in conventional distillation (left) and heat pump-assisted distillation (right), and(b) a de-propanizer in conventional distillation (left) and heat pump-assisted distillation (right).
Figure 8 shows the effects of plant capacity and feed composition on the CO2 reduction byintroducing a heat pump in the C4 splitter and de-propanizer. CO2 reduction is defined as thepercentage difference of GWI between conventional distillation and heat pump-assisted distillationover the GWI of conventional distillation: it is the quantitative environmental advantage againstglobal warming of switching to a heat pump configuration. Similar to the energy saving analysisin Figure 5, no effect of the plant capacity was observed on the CO2 reduction in the case of heappump-assisted distillation. On the other hand, the feed composition exhibited a different behavior.In both the C4 splitter and de-propanizer, the heavier component in the feed increased as well as theGWI of the conventional distillation due to a larger reboiler heat duty. Accordingly, the GWI of the heatpump-assisted column increased. For the C4-splitter, the CO2 reduction was almost constant over theconsidered range of feed compositions. On the other hand, the CO2 reduction for the de-propanizerreached its maximum at a feed composition of 1:1.5.

Energies 2019, 12, 852 17 of 19
Energies 2018, 11, x 17 of 19
0
10
20
30
40
50
60
70
80
90
100
0
20
40
60
80
100
120
10 50 100 200 250 300Plant capacity (%)
GW
I (k
g C
O2-e
q./
FU
C4
spli
tter
)
CO
2 redu
ction
(%)
GWI (conventional) GWI (heat pump-assisted)
CO2 reduction
0
10
20
30
40
50
60
70
80
90
100
0
20
40
60
80
100
120
10 50 100 200 500 1000
CO
2 redu
ction
(%)
Plant capacity (%)
GW
I (k
g C
O2-e
q./
FU
de
-pro
pan
izer
)
GWI (conventional) GWI (heat pump-assisted)
CO2 reduction (a) (b)
0
10
20
30
40
50
60
70
80
90
100
0
100
200
300
400
500
600
700
1:4 1:3 1:1.5 3:1 6:1 10:1
GW
I (k
g C
O2-e
q./
FU
C4
spli
tter
)
Feed composition (iC4:nC4)
CO
2 redu
ction
(%)
GWI (conventional) GWI (heat pump-assisted)
CO2 reduction
0
10
20
30
40
50
60
70
80
90
100
0
20
40
60
80
100
120
140
160
180
1:4 1:2.5 1:1.5 1:1 2:1 4:1Feed composition (C3:C4s)
GW
I (k
g C
O2-e
q./
FU
de
-pro
pan
izer
)
CO
2 redu
ction
(%)
GWI (conventional) GWI (heat pump-assisted)
CO2 reduction (c) (d)
Figure 8. GWI (global warming impact) in kg CO2-equivalents (kg CO2-eq.) per functional unit (FU).
(a) and (b) effect of the plant capacity on the GWI for the C4 splitter and the de-propanizer in
conventional distillations, respectively and (c) and (d) effect of the feed composition on the GWI for
the C4 splitter and the de-propanizer in heat pump-assisted distillations, respectively.
Figure 9 shows the effect of the GWI of electricity on the CO2 reduction for the heat pump-
assisted distillation compared to that for conventional distillation to gauge any potential effect of the
electricity. Since electricity will likely be generated from various sources following technology
advances in the near future or at the sites where the distillation columns are operated, this sensitivity
analysis can provide useful information. As the electricity is generated from cleaner sources, such as
renewable energy instead of fossil-based resources, the GWI of electricity decreases. The cleanest
electricity is generated from wind energy, which is approximately 0.0002 [22]. The GWI of electricity
from other sources is tabulated in the Supplementary Materials. Both the C4 splitter and de-
propanizer can reduce more their CO2 emissions as the GWI of electricity is lowered (i.e., cleaner
electricity). However, the increment of the CO2 reduction effect with respect to the unit decrement of
GWI is two times higher in the case of the de-propanizer, about 3.4 CO2 reduction (%) w.r.t. 0.01 GWI
of electricity for the de-propanizer compared to 1.7 CO2 reduction (%) w.r.t. 0.01 GWI of electricity
for the C4 splitter, as determined for coal-based electricity. Since the CO2 emission by electricity usage
in the heat pump-assisted distillation is larger in the case of the de-propanizer, the CO2 reduction
effect achieved by eliminating the electricity contribution for a lower GWI is greater than in the case
of the C4 splitter.
Figure 8. GWI (global warming impact) in kg CO2-equivalents (kg CO2-eq.) per functional unit(FU). (a) and (b) effect of the plant capacity on the GWI for the C4 splitter and the de-propanizer inconventional distillations, respectively and (c,d) effect of the feed composition on the GWI for the C4splitter and the de-propanizer in heat pump-assisted distillations, respectively.
Figure 9 shows the effect of the GWI of electricity on the CO2 reduction for the heat pump-assisteddistillation compared to that for conventional distillation to gauge any potential effect of the electricity.Since electricity will likely be generated from various sources following technology advances in thenear future or at the sites where the distillation columns are operated, this sensitivity analysis canprovide useful information. As the electricity is generated from cleaner sources, such as renewableenergy instead of fossil-based resources, the GWI of electricity decreases. The cleanest electricity isgenerated from wind energy, which is approximately 0.0002 [22]. The GWI of electricity from othersources is tabulated in the Supplementary Materials. Both the C4 splitter and de-propanizer canreduce more their CO2 emissions as the GWI of electricity is lowered (i.e., cleaner electricity). However,the increment of the CO2 reduction effect with respect to the unit decrement of GWI is two timeshigher in the case of the de-propanizer, about 3.4 CO2 reduction (%) w.r.t. 0.01 GWI of electricityfor the de-propanizer compared to 1.7 CO2 reduction (%) w.r.t. 0.01 GWI of electricity for the C4splitter, as determined for coal-based electricity. Since the CO2 emission by electricity usage in the heatpump-assisted distillation is larger in the case of the de-propanizer, the CO2 reduction effect achievedby eliminating the electricity contribution for a lower GWI is greater than in the case of the C4 splitter.

Energies 2019, 12, 852 18 of 19
Energies 2018, 11, x 18 of 19
0
10
20
30
40
50
60
70
80
90
100
0
20
40
60
80
100
120
GWI of electricity (kg CO2-eq./MJ elec.)
0
10
20
30
40
50
60
70
80
90
100
0
20
40
60
80
100
120
GWI of electricity (kg CO2-eq./MJ elec.)
CO
2 redu
ction
(%)
CO
2 redu
ction
(%)
GWI (conventional) GWI (heat pump-assisted)
CO2 reduction
GWI (conventional) GWI (heat pump-assisted)
CO2 reduction
0.11 0.09 0.07 0.06 0.05 0.03 0.01 0.00(coal) (biomass) (NG) (PV) (wind)
0.11 0.09 0.07 0.06 0.05 0.03 0.01 0.00(coal) (biomass) (NG) (PV) (wind)
GW
I (k
g C
O2-e
q./
FU
C4
spli
tter
)
GW
I (k
g C
O2-e
q./
FU
de-
pro
pan
izer
)
(a) (b)
Figure 9. GWI (global warming impact) in kg CO2-equivalents (kg CO2-eq.) per functional unit (FU).
Effect of the GWI of electricity for the (a) C4 splitter and (b) de-propanizer in conventional and heat
pump-assisted distillations.
7. Conclusions
In this study, we simulated conventional and heat pump-assisted distillations with either a C4
splitter or a de-propanizer by considering various situations. Based on the simulation results, an
evaluation of the annualized capital cost and annual operating cost was performed, and the economic
feasibility was reviewed for both distillation systems.
From the results of the sensitivity analysis, we found that the energy saving value and payback
time for heat pump-assisted distillation depend on feed composition, plant capacity, and fuel price.
Similarly to the results from other reports, heat pump-assisted distillation is economically feasible in
the case of a C4 splitter process [5,6], while, except in cases of high fuel prices or very low electricity
prices, heat pump-assisted distillation is not suitable with a de-propanizer column.
In addition, we evaluated the parameters closely related to the economic feasibility through
sensitivity analysis. The fluctuation of fuel or electricity prices was found to be a considerable
parameter on the economic feasibility in this particular study.
It is noteworthy that, although heat pump-assisted distillation is not feasible economically
except under certain conditions, the environmental impact of the heat pump with respect to global
warming is positive for both the C4 splitter and de-propanizer columns. Moreover, the use of cleaner
electricity can greatly reduce the CO2 emissions of heat pump-assisted distillation processes.
Supplementary Materials: The following are available online at www.mdpi.com/xxx/s1, Table A1: Process
stream information (from flowsheet in Figure 1 (a)), Table A2: Process stream information (from flowsheet in
Figure 1 (b)), Table A3: Process stream information (from flowsheet in Figure 2 (a)), Table A4: Process stream
information (from flowsheet in Figure 2 (b)), Table B1: Sizing results for the column base cases, Table B2: Overall
heat transfer coefficients, Table B3: Areas of the heat exchangers used in this study, Table B4 : Sizing results for
the drums used in this study, Table B5: Power requirements of the compressor, Table B6: Capacity of the pump,
Table C1: Equations for the purchased equipment cost, CE, and installation factors, Table C2: Equipment costs
for conventional distillation, Table C3: Equipment costs for heat pump-assisted distillation, Table D1: Utility cost
coefficient and unit price of utility, Table D2: Utility costs for conventional distillation, Table D3: Utility costs for
heat pump-assisted distillation, Table E1: Utility costs for heat pump-assisted distillation
Author Contributions: Conceptualization, J.L. and W.W.; Methodology, J.L. and Y.S.; Investigation, J.L. and
Y.S.; Writing-Original Draft Preparation, J.L. and Y.S.; Writing-Review & Editing, K.S.L. and W.W.; Supervision,
K.S.L. and W.W.; Project Administration, W.W.; Funding Acquisition, W.W.
Funding: This research was supported by C1 Gas Refinery Program through the National Research
Foundation of Korea (NRF) funded by the Ministry of Science, ICT & Future Planning
(2015M3D3A1A01064929).
Conflicts of Interest: The authors declare no conflict of interest.
Figure 9. GWI (global warming impact) in kg CO2-equivalents (kg CO2-eq.) per functional unit (FU).Effect of the GWI of electricity for the (a) C4 splitter and (b) de-propanizer in conventional and heatpump-assisted distillations.
7. Conclusions
In this study, we simulated conventional and heat pump-assisted distillations with either a C4splitter or a de-propanizer by considering various situations. Based on the simulation results, anevaluation of the annualized capital cost and annual operating cost was performed, and the economicfeasibility was reviewed for both distillation systems.
From the results of the sensitivity analysis, we found that the energy saving value and paybacktime for heat pump-assisted distillation depend on feed composition, plant capacity, and fuel price.Similarly to the results from other reports, heat pump-assisted distillation is economically feasible inthe case of a C4 splitter process [5,6], while, except in cases of high fuel prices or very low electricityprices, heat pump-assisted distillation is not suitable with a de-propanizer column.
In addition, we evaluated the parameters closely related to the economic feasibility throughsensitivity analysis. The fluctuation of fuel or electricity prices was found to be a considerableparameter on the economic feasibility in this particular study.
It is noteworthy that, although heat pump-assisted distillation is not feasible economically exceptunder certain conditions, the environmental impact of the heat pump with respect to global warmingis positive for both the C4 splitter and de-propanizer columns. Moreover, the use of cleaner electricitycan greatly reduce the CO2 emissions of heat pump-assisted distillation processes.
Supplementary Materials: The following are available online at http://www.mdpi.com/1996-1073/12/5/852/s1,Table A1: Process stream information (from flowsheet in Figure 1a), Table A2: Process stream information (fromflowsheet in Figure 1b), Table A3: Process stream information (from flowsheet in Figure 2a), Table A4: Processstream information (from flowsheet in Figure 2b), Table B1: Sizing results for the column base cases, Table B2:Overall heat transfer coefficients, Table B3: Areas of the heat exchangers used in this study, Table B4: Sizing resultsfor the drums used in this study, Table B5: Power requirements of the compressor, Table B6: Capacity of the pump,Table C1: Equations for the purchased equipment cost, CE, and installation factors, Table C2: Equipment costs forconventional distillation, Table C3: Equipment costs for heat pump-assisted distillation, Table D1: Utility costcoefficient and unit price of utility, Table D2: Utility costs for conventional distillation, Table D3: Utility costs forheat pump-assisted distillation, Table E1: Utility costs for heat pump-assisted distillation.
Author Contributions: Conceptualization, J.L. and W.W.; Methodology, J.L. and Y.S.; Investigation, J.L. and Y.S.;Writing-Original Draft Preparation, J.L. and Y.S.; Writing-Review & Editing, K.S.L. and W.W.; Supervision, K.S.L.and W.W.; Project Administration, W.W.; Funding Acquisition, W.W.
Funding: This research was supported by C1 Gas Refinery Program through the National Research Foundation ofKorea (NRF) funded by the Ministry of Science, ICT & Future Planning (2015M3D3A1A01064929).
Conflicts of Interest: The authors declare no conflict of interest.
Energies 2019, 12, 852 19 of 19
References
1. Won, W.; Lee, S.K.; Choi, K.; Kwon, Y. Current trends for the floating liquefied natural gas (FLNG)technologies. Korean J. Chem. Eng. 2014, 31, 732–743. [CrossRef]
2. Kiss, A.A. Advanced Distillation Technologies; John Wiley & Sons, Inc.: Hoboken, NJ, USA, 2013.3. Danziger, R. Distillation columns with vapor recompression. Chem. Eng. Prog. 1979, 75, 58–64.4. Fonyo, Z.; Benko, N. Comparison of various heat pump assisted distillation configurations. Chem. Eng.
Res. Des. 1998, 76, 348–360. [CrossRef]5. Diez, E.; Langston, P.; Ovejero, G.; Romero, M.D. Economic feasibility of heat pumps in distillation to reduce
energy use. Appl. Therm. Eng. 2009, 29, 1216–1223. [CrossRef]6. Fonyo, Z.; Kurrat, R.; Rippin, D.W.T.; Meszaros, I. Comparative analysis of various heat pump scheme
applied to C4-splitters. Comput. Chem. Eng. 1995, 19, s1–s6. [CrossRef]7. Waheed, M.A.; Oni, A.O.; Adejuyigbe, S.B.; Adewumi, B.A.; Fadare, D.A. Performance enhancement of
vapor recompression heat pump. Appl. Energy 2014, 114, 69–79. [CrossRef]8. SimSci, PRO/II. SimSci by Schneider Electric Software; SimSci, PRO/II: Lake Forest, CA, USA, 2017.9. Couper, J.R. Process Engineering Economics; Marcel Dekker, Inc.: New York, NY, USA, 2003.10. Won, W.; Maravelias, C.T. Thermal fractionation and catalytic upgrading of lignocellulosic biomass to
biofuels: Process synthesis and analysis. Renew. Energy 2017, 114, 357–366. [CrossRef]11. Walas, S.M. Chemical Process Equipment: Selection and Design; Butterworth: Wobum, MA, USA, 1988.12. Chemical Engineering Plant Cost Index (CEPCI) 2017. Available online: www.chemengonline.com/pci
(accessed on 29 January 2018).13. Won, W.; Motagamwala, A.H.; Dumesic, J.A.; Maravelias, C.T. A co-solvent hydrolysis strategy for the
production of biofuels: Process synthesis and technoeconomic analysis. React. Chem. Eng. 2017, 2, 397–405.[CrossRef]
14. Leistritz, F.L.; Hodur, N.M.; Senechal, D.M.; Stowers, M.D.; McCalla, D.; Saffron, C.M. Biorefineries usingagricultural residue feedstock in the great plains. In Proceedings of the Western Regional Science AssociationAnnual Meeting, Newport Beach, CA, USA, 21–24 February 2007.
15. Song, D.; Yoon, Y.G.; Lee, C.J. Techno-economic evaluation of the 2,3-butanediol dehydration process using ahydroxyapatite-alumina catalyst. Korean J. Chem. Eng. 2018, 35, 2348–2354. [CrossRef]
16. Kwon, S.; Won, W.; Kim, J. A superstructure model of an isolated power supply system using renewableenergy: Development and application to Jeju Island, Korea. Renew. Energy 2016, 97, 177–188. [CrossRef]
17. Won, W.; Kwon, H.; Han, J.; Kim, J. Design and operation of renewable energy sources based hydrogensupply system: Technology integration and optimization. Renew. Energy 2017, 103, 226–238. [CrossRef]
18. Han, S.; Won, W.; Kim, J. Scenario-based approach for design and comparatively analysis of conventionaland renewable energy systems. Energy 2017, 129, 86–100. [CrossRef]
19. International Standardization Organization (ISO). 14040: Environmental Management–Life CycleAssessment–Principles and Framework; British Standards Institution: London, UK, 2006.
20. Von der Assen, N.; Voll, P.; Peters, M.; Bardow, A. Life cycle assessment of CO2 capture and utilization:A tutorial review. Chem. Soc. Rev. 2014, 43, 7982–7994. [CrossRef] [PubMed]
21. Von der Assen, N.; Bardow, A. Life cycle assessment of polyols for polyurethane production using CO2 asfeedstock: Insights from an industrial case study. Green Chem. 2014, 16, 3272–3280. [CrossRef]
22. Artz, J.; Müller, T.E.; Thenert, K.; Kleinekorte, J.; Meys, R.; Sternberg, A.; Leitner, W. Sustainable conversionof carbon dioxide: An integrated review of catalysis and life cycle assessment. Chem. Rev. 2017, 118, 434–504.[CrossRef] [PubMed]
© 2019 by the authors. Licensee MDPI, Basel, Switzerland. This article is an open accessarticle distributed under the terms and conditions of the Creative Commons Attribution(CC BY) license (http://creativecommons.org/licenses/by/4.0/).