economic, environmental, community, and health impact study
TRANSCRIPT
1 Live, shop, work, play
Economic, Environmental, Community, and Health Impact Study
2Live, shop, work, play
AJO
MILE WIDE
IRVINGTON
KINNEY
IRVINGTON
VALENCIA
VALENCIA
DREXEL
22ND
STARR PASS
BROADWAY
SPEEDWAY
PIMA
GRANT
RIVER
RIVER
TANQUE VERDE
GOLF LINKS
HOUG
HTON
HOUG
HTON
FREE
MAN
HARR
ISON
KOLB
WILM
OTW
ILMOT
CRAY
CROF
T
SWAN
ALVE
RNON
COLU
MBU
S
DODG
E
CAM
PBEL
L
MOU
NTAI
N
CAM
PBEL
L
PARK
TUCS
ON
COUN
TRY C
LUB
PALO
VERD
E
ALVE
RNON
SWAN
12TH
MID
VALE
PARK
CARD
INAL
JOSE
PHMA
RKCAM
INO V
ERDE
OLD
NOGA
LES H
WY
FIRST
STON
E
ORAC
LE
ORAC
LE
COUN
TRY C
LUB
TUCS
ON
LA CA
NADA
LA CA
ÑADA
LA CH
OLLA
SHAN
NON
THOR
NYDA
LE
CORTA
RO
TANGERINETANGERINE
FIRST
SILVERBELL
EL CAMINO DEL CERRO
TWIN PEAKS
TWIN PEAKS
EL CAMINO DE M
ANANA
AVRA VALLEY
SAND
ERS
SAND
ARO
LAMBERT
NARANJA
OVERTON
MAGEE
INA
ORANGE GROVE
SAN XAVIER LOOP RITA
10
19
10
FELIZPASEOS
PARK
RoblesPass
PASCUAYAQUI
NATION
TOHONO O’ODHAM NATIONSAN XAVIER DISTRICT
TOHONOO’ODHAM
NATION
TUCSON
MARANA
ORO VALLEY
SOUTHTUCSON
SantaCruz
River
Cañadadel
OroW
ash
Rillito River
Tanque Verde Creek
PantanoW
ash
SantaCruz
River
Julian
Wash
GATES PASS
SOLD
IER TR
AIL
SKYLINE
OLD VAIL
LINDA VISTA
PICTURE ROCKS
HART
MAN
CMO
DE O
ESTE
CMO
DE O
ESTE
SUNSET
SWEETWATER
GORET
ANKLAM
CONGRESS
IRONWOOD HILL
6TH 5THGR
EASE
WOO
D
MISS
ION
KINO
HUGHES ACCESS
LOS REALES
ESCALANTE
CAM
INO
SECO
CAM
INO
SECO
PANT
ANO
PANT
ANO
TRAIL
SPANISH
OLD
29TH
SNYDER
PRINCE
FT. LOWELL
CATALIN
A HWY
BEAR
CANY
ON
MEL
POM
ENE
SABI
NO CA
NYON
CLOUD
LA CH
OLLA
Brandi FentonMemorial Park
George Mehl FamilyFoothills Park
Ft. LowellPark
Morris K. UdallRegional Center
Randolph Golf CourseDell Urich
Golf CourseGene C. Reid
Park
Children’sMemorial
Park
Gladden FarmsCommunity
Park
MaranaHeritage
Park
El RioPark
Crossroads atSilverbell
District Park
Mike JacobSports Park Ted Walker
Park
Wade McLeanPark
FlowingWells Park
CurtisPark
SweetwaterWetlands
Christopher Columbus
Park
SilverbellGolf
Course
Rillito RegionalPark and
Rillito Racetrack
Kino VeteransMemorial
Sports Complex
JamesThomas
Park
Julian WashArchaeological
ParkEl Paseo
de los Arboles
TumamocHill
Garden ofGethsemane
SentinelPeak Park
VerdugoPark
Thomas JayRegional
Park
Augie AcuñaLos Niños
Park
Pima Air andSpace Museum
MichaelPerry Park
StefanGollob
Park
AbrahamLincoln
Park
Fantasy IslandMountain Bike
Trails Park
PurpleHeartPark
Northwest YMCA-Pima County
Community Centerand Northwest
Community Park
Cañada Del OroRiverfront Park
Christina-TaylorGreen Memorial
River Park
ArthurPack
RegionalPark
Dan FelixMemorial Park
Kory Laos MemorialFreestyle BMX Park
Sun Circle
Santa Cruz Park
El RioGolf Course
Joaquin MurrietaPark
Juan JuhanPark
KERP (Kino EnvironmentalRestoration Project)
Rio VistaPark
Sam Lena Park
Aviation Pathway
CoronadoNational
Forest
SaguaroNational
Park
SaguaroNational
Park
AguaCaliente
Park
TucsonMountain
Park
CatalinaStatePark
CoronadoNational
Forest
Sabino Canyon National Recreation
Area
McDonaldPark
SweetwaterPreserve
River Park expansion denied at Tucson Mall’s request.
Completed Path
Under Design or Construction
PlanningScale in Miles
0 4.02.01.0
On-street segment
On-
stre
et se
gm
ent
On-
stre
et se
gmen
t
Future park site: Corazón de los
Tres Ríos del Norte
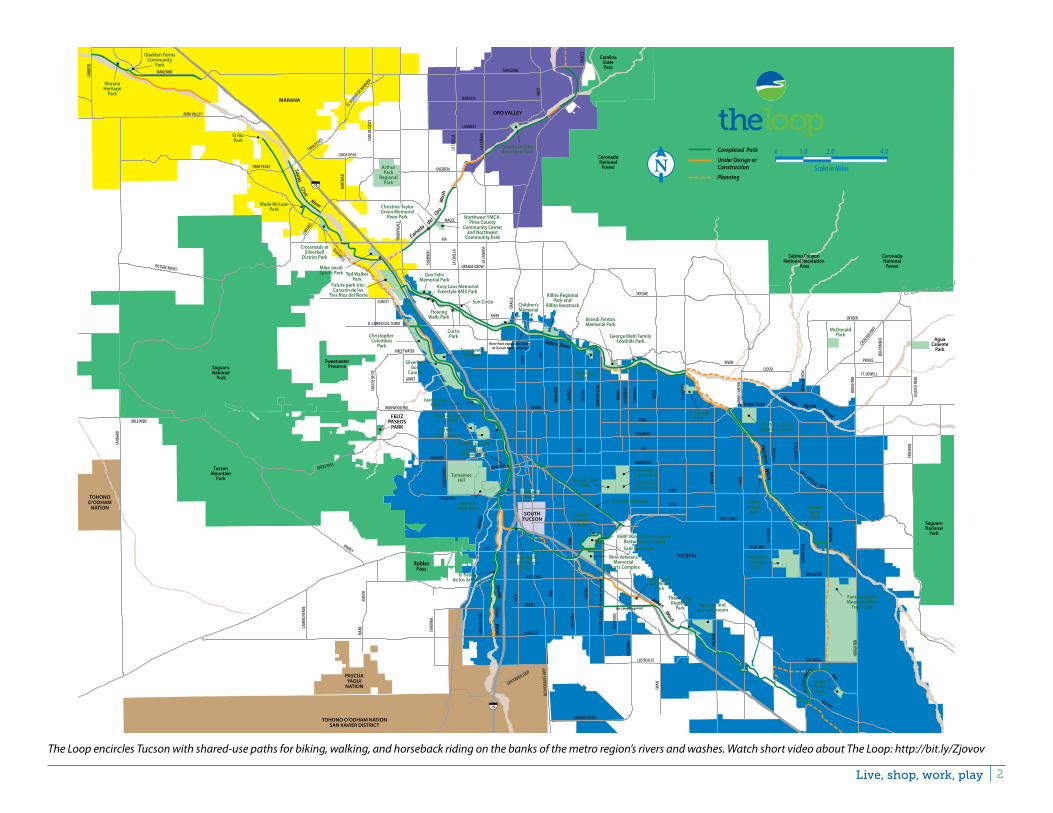
The Loop encircles Tucson with shared-use paths for biking, walking, and horseback riding on the banks of the metro region’s rivers and washes. Watch short video about The Loop: http://bit.ly/Zjovov
3 Live, shop, work, play
Background/HistoryThe Loop encompasses both banks of four major river systems or waterways. Pima County residents and visitors can enjoy biking, walking, or horseback riding along the Rillito River, the Santa Cruz River, the Pantano Wash, the Ju-lian Wash and the Harrison Greenway. The Loop also has paths along tributary washes or extensions. These include the Tanque Verde Wash and the Cañada del Oro Wash.
The Loop, a 131-mile, shared-use path, began as an infrastructure project to protect the community from potential flooding during the torrential rains of the summer monsoon. During the past 40 years, Pima County invested over $70 mil-lion toward improvements along The Loop. This report will begin to identify the benefits of those investments and quantify the return on investment.
Economic impactsEstimating the economic aspects of The Loop is challenging. Conventional evaluation techniques suggest that any bicycle facilities should be considered in the same manner as other transportation facilities (e.g., roadways, light rail, HOV lanes) or, for that matter, any major public capital investment (e.g., wastewater treatment plant, sports stadium). Doing so subjects these facilities to the same methodologies or criteria used in larger projects such as cost-benefit analysis, economic impact assessment (local, regional or state), cost-effectiveness evaluation, and financial or risk analysis. Of these approaches,
cost-benefit analysis is the most well-known and frequently used. It compares the effects of proposed policies or projects on social well-being. This approach requires identifying all project impacts (positive or negative) in the present and the future and then assigning an economic value to these impacts. Much of the data presented in this report was the result of cost-benefit analysis from a variety of sources.
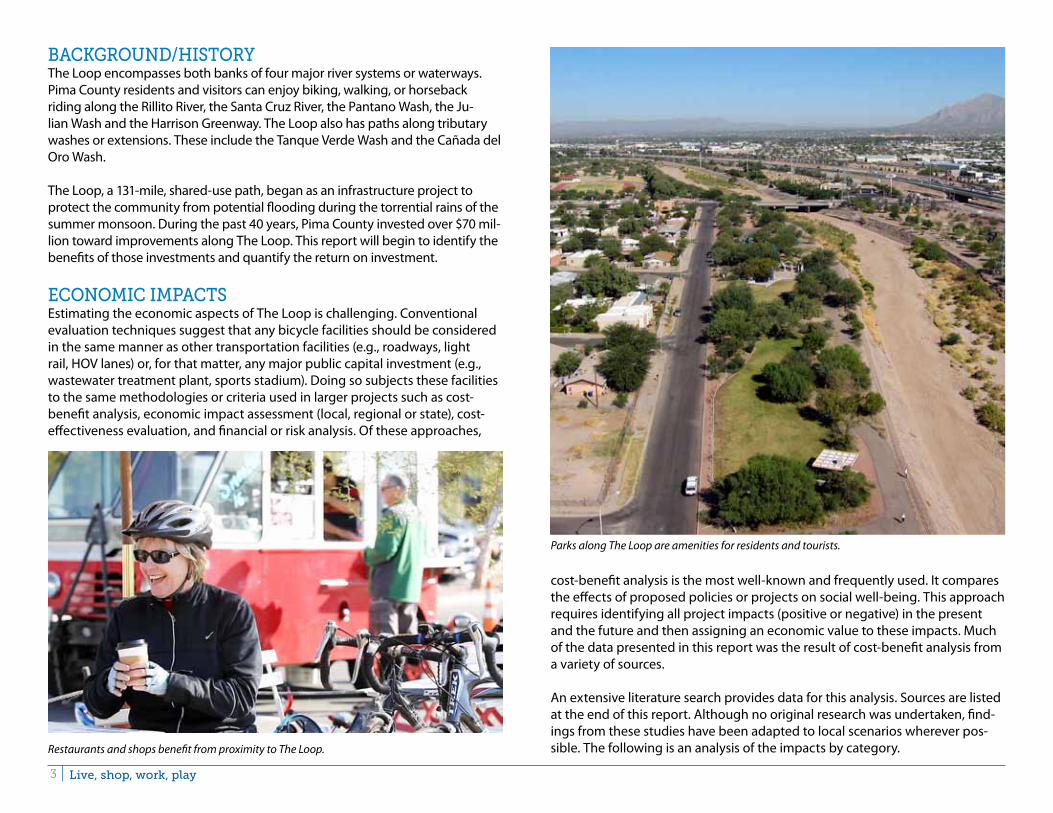
An extensive literature search provides data for this analysis. Sources are listed at the end of this report. Although no original research was undertaken, find-ings from these studies have been adapted to local scenarios wherever pos-sible. The following is an analysis of the impacts by category.Restaurants and shops benefit from proximity to The Loop.
Parks along The Loop are amenities for residents and tourists.
4Live, shop, work, play
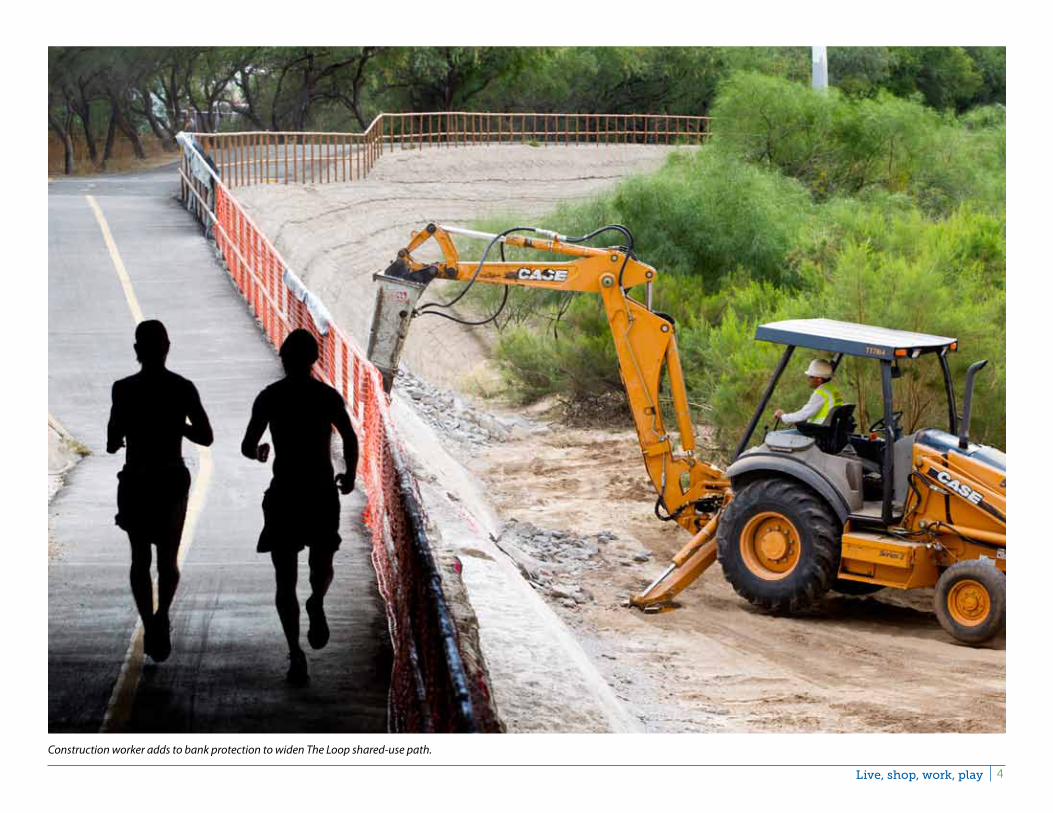
Construction worker adds to bank protection to widen The Loop shared-use path.

5 Live, shop, work, play
BusinEss/EmpLoymEntA 2011 study by the Political Economy Research Institute at the University of Massachusetts on Pedestrian and Bicycling Infrastructure showed benefits to the facility users as well as the rest of the community. The study analyzed employment that results from the design and construction of bicycle-related projects. These results were reported nationally in 2012. The study estimates the employment impacts of building and refurbishing transportation infra-structure for cyclists and pedestrians using state-specific data to estimate the number of jobs created within each state where the project is located. Researchers gathered data for this study from public works and transportation departments in 11 cities throughout the United States.
The study evaluated 58 separate projects. The findings show that bicycling infrastructure creates the most jobs for a given level of spending. The table below identifies job creation by infrastructure type.
Table 1. Jobs created per $1 million spent on infrastructure projects by type
Bicycle Only Projects 11.4 jobs
Pedestrian Only Projects 10 jobs
Multi-use Projects 9.6 jobs
Road Projects 7.8 jobs
The Loop is a multi-use bicycle and pedestrian facility that creates 9.6 jobs per $1 million of investment. To date the $70 million investment has created more than 675 jobs in Arizona. Ninety percent, or 600 jobs, have been created in Pima County.
Another study shows how businesses benefited from the Great Allegheny Passage, a 132-mile system of biking and hiking trails that connects Cumber-land, Maryland, to McKeesport, Pennsylvania. In 2006, the final segment was connected to the C & O Canal Towpath in Cumberland, creating a continuous non-motorized corridor, 318 miles long, from McKeesport to Washington, D.C. A study was commissioned to determine the economic impact that the completion of the trail has had on the adjacent towns and businesses. Busi-ness owners indicated that one-quarter of their gross revenue was directly attributed to trail users and two-thirds reported that they experienced at least some increase in gross revenue because of their proximity to the trail. Over one-quarter of all businesses that were surveyed mentioned that they have expanded or plan to expand their operations or hire additional staff because of the impact of the trail.
The Atlanta Beltline is a trail system similar to The Loop. It began as a graduate thesis in 1999 and now links 45 neighborhoods around downtown. As a result of the trail’s popularity, construction along the trail boomed. One of the recent projects is the rehabilitation of a former Sears’ distribution warehouse. This 2.1 million square foot facility is be transformed into apartments, restaurants, and a rooftop miniature golf course. Other businesses along the Beltline have experienced a tenfold increase in business since the trail opened.
Reichold Inc. relocated to Research Triangle Park, North Carolina, in 1992, ranking the “jogging trails” as the biggest attractor for their employees. The region’s greenway system is touted as its competitive advantage when attract-ing world-class companies.
Trails are often associated with open space. Such is true with The Loop. An analysis of rural western counties with more than 30 percent of their land under federal protection showed they increased jobs at a rate four times faster than rural counties with no federally protected lands (Headwaters Economics, 2012 – based on data between 1970 and 2009).
This box culvert will allow Loop users to pass safely beneath a busy roadway.
6Live, shop, work, play5
tourismTourism ranks first, second or third as the largest economic engine in every state in the nation. Outdoor recreation is a larger and more critical sector of the American economy than most people realize. As a multi-dimensional sector, the outdoor industry injects $646 billion in direct spending into the American economy. The Western Governors’ Association reports that out-door recreation in 19 western states results in $256 billion in direct spending and 2.3 million jobs; $2.4 billion of that is spent in Pima County. Outdoor recreation fuels traditional sectors like manufacturing, finance, retail trade, tourism, and travel. Outdoor recreation is often considered a recession-proof industry, growing approximately 5 percent annually between 2005 and 2011. This occurred during an economic recession when many sectors contracted.
The Loop is a key outdoor recreation draw for the region. The League of American Bicyclists’ Platinum Evaluation recommends completion, expan-sion, and promotion of The Loop as a signature “must ride” for visitors and residents alike. The Loop is used for many of the most popular segments of
outdoor recreation: trail sports (walking, running, horseback riding; bicy-cling; skating/skateboarding) and wildlife viewing (bird watching). Each segment has the potential to generate significant tourism and outdoor recre-ation dollars. For example, birders in the U.S. spent $35.7 billion on birding trips and associated equipment, which generated $10.5 billion in state and federal tax revenue. Birding supported the creation of 671,000 jobs nation-wide. Pima County is on the Pacific Flyway, a key waterfowl migration course. It is also home to the Sky Islands, which connect to the Sierra Madre Occi-dental; a 932-mile mountain range in western Mexico that is home to a high number of bird species. The Loop is regularly used by the Audubon Society for bird-watching field trips and other birding events.
Supporting the outdoor recreation economy on our public lands not only provides places to play, it also supports our businesses. Outdoor recreation is fundamental to recruiting employers and is the heart of a healthy and productive community. Open spaces and recreation draw after-work activity and tourists alike.
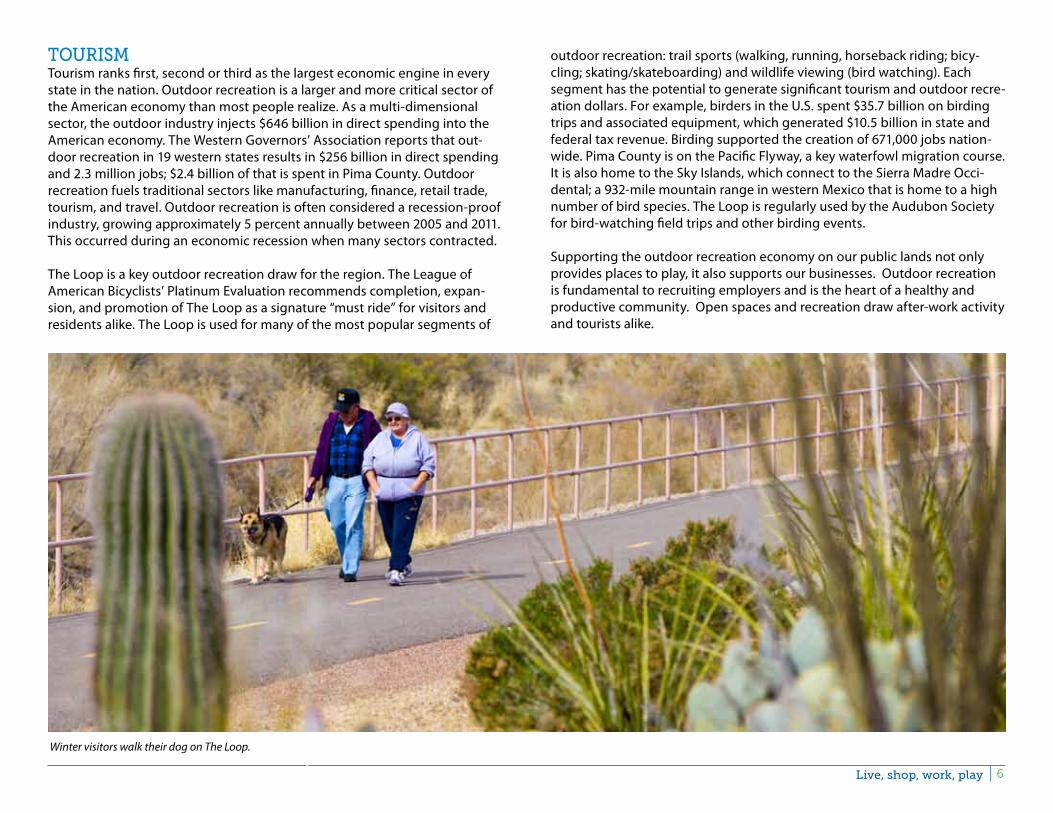
Winter visitors walk their dog on The Loop.
7 Live, shop, work, play
HousingOne of the reasons people pay a premium to live in desirable areas is that they are paying for the option to use specific facilities, whether or not they actually do. For instance people may pay a premium to live near a bike path even though they do not ride because they might want to in the future. In this respect, such proximity would be valued by current and potential users. These benefits are re-vealed through preferences that represent an elusive phenomenon to which an economic value can be attached. The National Association of Realtors and the National Association of Home Builders found that residential properties increase 10 to 20 percent in value the closer they are to green space.
Research finds that homeowners are willing to pay a premium of $9,000 on houses that are within 1,000 feet of bike paths (University of Cincinnati, 2011). Homes in Indiana sold for at least 10 percent more when located near a trail (Center for Urban Policy and the Environment, December 2003). In West Virginia, studies found that parks increase the value of a home within a census tract by $2,600. The presence of trails increased median home values by $10,600 to $11,060, increasing property values by $280 million in a community with a popu-lation of approximately 100,000 and median home value of $110,000.
Evidence from a study of the impacts of the Little Miami Scenic Trail in Ohio sug-gests that these types of infrastructure improvements result in financial benefits in terms of increased property values. With all other factors held constant, home
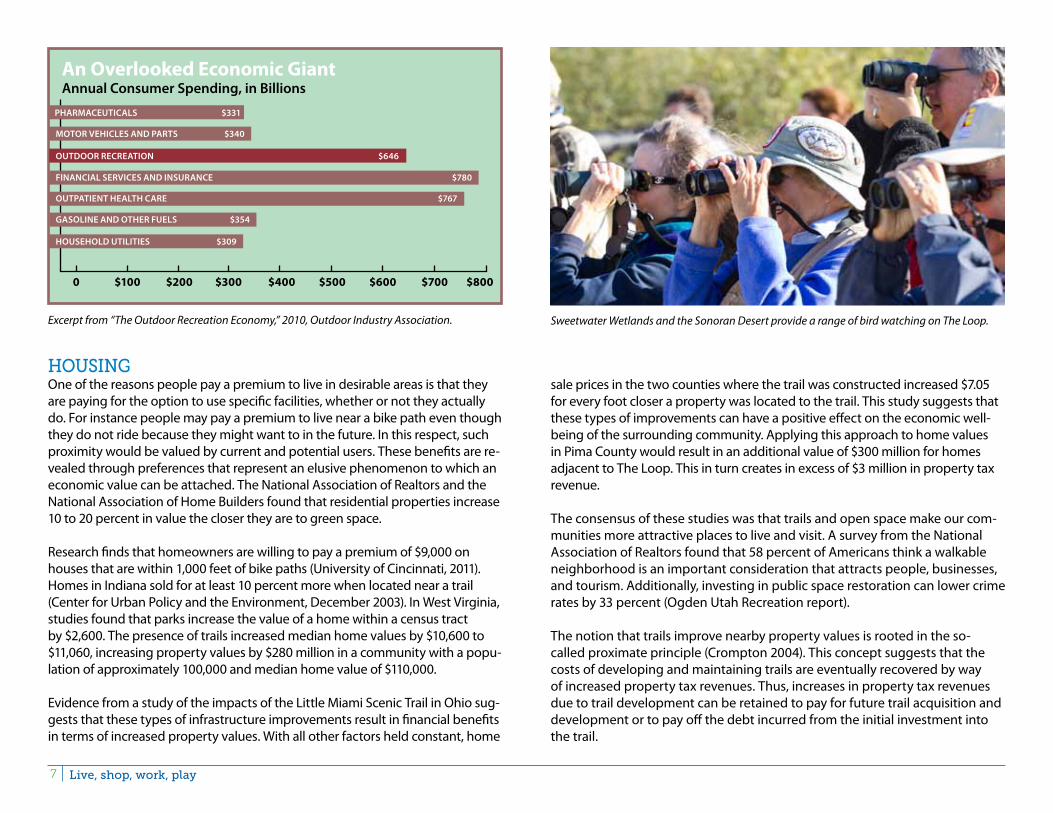
Sweetwater Wetlands and the Sonoran Desert provide a range of bird watching on The Loop.
sale prices in the two counties where the trail was constructed increased $7.05 for every foot closer a property was located to the trail. This study suggests that these types of improvements can have a positive effect on the economic well-being of the surrounding community. Applying this approach to home values in Pima County would result in an additional value of $300 million for homes adjacent to The Loop. This in turn creates in excess of $3 million in property tax revenue.
The consensus of these studies was that trails and open space make our com-munities more attractive places to live and visit. A survey from the National Association of Realtors found that 58 percent of Americans think a walkable neighborhood is an important consideration that attracts people, businesses, and tourism. Additionally, investing in public space restoration can lower crime rates by 33 percent (Ogden Utah Recreation report).
The notion that trails improve nearby property values is rooted in the so-called proximate principle (Crompton 2004). This concept suggests that the costs of developing and maintaining trails are eventually recovered by way of increased property tax revenues. Thus, increases in property tax revenues due to trail development can be retained to pay for future trail acquisition and development or to pay off the debt incurred from the initial investment into the trail.
An Overlooked Economic GiantAnnual Consumer Spending, in Billions
HOUSEHOLD UTILITIES $309
PHARMACEUTICALS $331
MOTOR VEHICLES AND PARTS $340
OUTDOOR RECREATION $646
FINANCIAL SERVICES AND INSURANCE $780
OUTPATIENT HEALTH CARE $767
GASOLINE AND OTHER FUELS $354
Excerpt from “The Outdoor Recreation Economy,” 2010, Outdoor Industry Association.
0 $100 $200 $300 $400 $500 $600 $700 $800

8Live, shop, work, play
Developers build new neighborhoods near The Loop.
9 Live, shop, work, play
aLtErnativE transportationNearly half of urban household trips in America are two miles or less. These trips can be completed within a 15-minute bike ride. A quarter of all trips are within a 20-minute walk. Yet the vast majority of these short trips are taken by automobile. Bicycling and walking can also improve public transportation by providing fast and well-planned access to it. Given the availability of safe and convenient infrastructure, more people will choose bicycling or walking for short trips and in combination with public transportation for longer trips. Further, communities conducive to bicycling and walking promote a richer and denser mix of residences and businesses.
For the price of a single mile of a four-lane urban highway, approximately $50 million, dozens of miles of bicycle and pedestrian infrastructure can be built, an investment that could complete an entire network of active transportation facilities for a mid-sized city. Reliable estimates of the costs of investment to achieve a certain mode shift towards bicycling and walking nationwide are not available because tracking of spending and travel data has been insufficient. On a local level, however, there is ample quantitative evidence from places like Portland, Minneapolis, and California, as well as from Europe and Australia that investment in safe and convenient bicycle and pedestrian infrastructure results in increased bicycling and walking. Portland, for example, has seen steady increases in bicycling to levels now five times higher than in 1990.
Improved mobility, reduced fuel consumption, reduced greenhouse gases, im-proved health, and health care savings provide significant financial benefits. In a national study reviewing a variety of scenarios for public investment in alter-nate modes, savings between $10 billion and $65 billion annually were identi-fied. These benefits dwarf historic spending for bicycling and walking, which was $453 million per year for 2005-2007 under the Safe Accountable Flexible Efficient Transportation Equity Act: A Legacy for Users (SAFETEA-LU), and only $4.5 billion in cumulative federal investment in these modes since 1992, when bicycling and walking first received documentable federal funding.
The U.S. Secretary of Transportation Ray LaHood said that when Americans across the country were asked what their communities needed, “People want alternative forms of transportation. They don’t want to own two or three cars. And they want green space, biking and walking paths….”
Given the great return on investment from active transportation, fiscally responsible federal transportation policy must strive to maximize the amount that Americans bicycle and walk.
HEaLtH BEnEfitsBicycling and walking levels fell 66 percent between 1960 and 2009, while obesity levels increased by 156 percent.
Between 1966 and 2009, the number of children who bicycled or walked to school fell 75 percent, while the percentage of obese children tripled. In general, states with the highest levels of bicycling and walking have the low-est levels of obesity, hypertension (high blood pressure), and diabetes. These same communities have the greatest percentage of adults who meet the recommended 30-plus minutes per day of physical activity.
Bicycling and walking also offer tremendous benefits for Americans’ health. Because transportation is a routine in which we all engage, active transpor-tation has great potential to increase our levels of physical activity and help reverse current obesity trends. Modest increases in bicycling and walking for short trips could provide enough exercise for 50 million inactive Americans to meet recommended activity levels, putting a sizable dent in America’s activ-ity deficit. In addition, the increase in worker productivity (due to improved health) increases economic output and benefits employers.
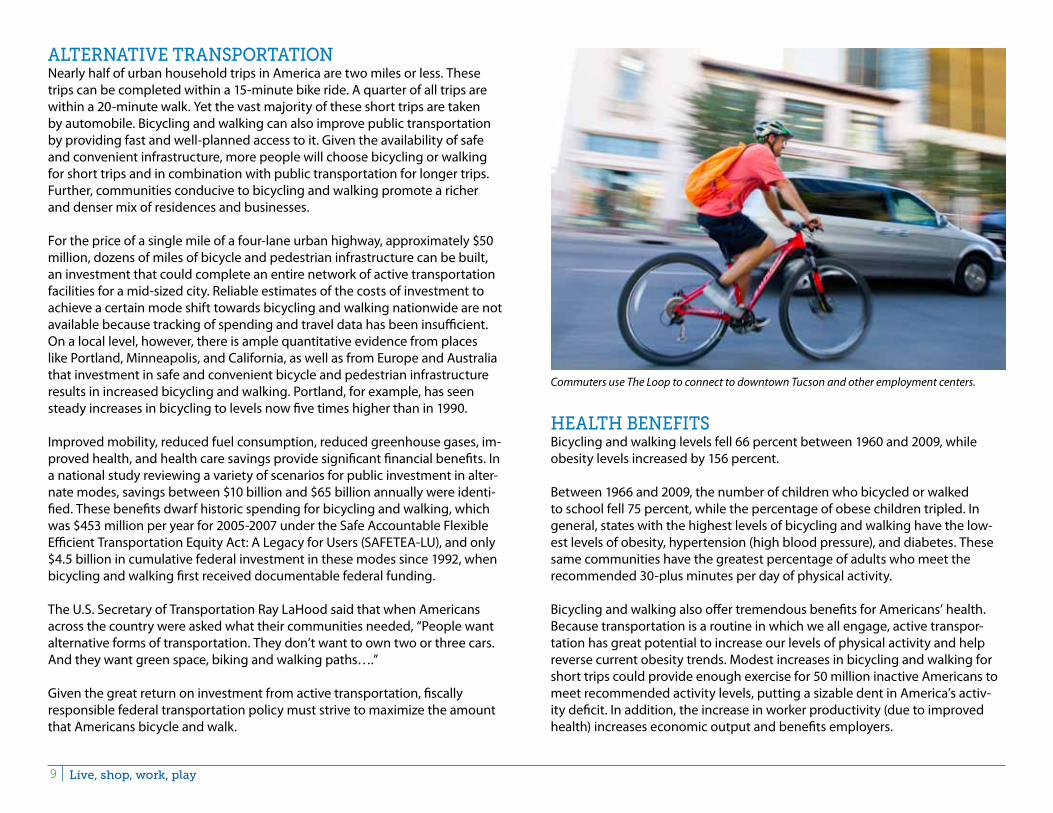
Commuters use The Loop to connect to downtown Tucson and other employment centers.
10Live, shop, work, play
Both the Surgeon General of the United States and the President’s Council on Fitness, Sports & Nutrition are encouraging communities to “build more trails.” Instead of disconnecting exercise as a separate activity that must be squeezed into a person’s busy day, exercise can be reintroduced as part of other daily routines. Biking and walking are simple activities that can be incorporated in getting from Place A to Place B every day. By leaving the vehicle at home, a
person can run errands (or commute to work or school) and be active at the same time. In Pima County, The Loop provides a safe and accessible place for healthy, active transportation.
The benefits of physical activity in enhancing overall health are well estab-lished. The task of attaching monetary amounts to levels of physical activity is a more challenging endeavor. One attempt is offered by Wang et al. (2004), who derive cost-effectiveness measures of bicycle/pedestrian trails by dividing the costs of trail development and maintenance by selected physical activity-related outcomes of the trails (e.g., number of trail users). The average annual cost to the local government for persons becoming more physically active was found to be $98 per person.
The Intertwine is an interconnected system of parks, trails and natural areas in Portland, Oregon. It is composed of the natural and built infrastructure of the system, as well as multiple amenities similar to The Loop in Pima County. In the Intertwine system there are 1,250 miles of designated bicycle and pedestrian trails, 12,000 acres of developed parks, and 24,000 acres of maintained natural area. It is estimated that 8.3 million user visits to the parks and natural areas occur each year. The Loop and CAP Trail, more than 40 miles along the Central Arizona Project canal, will have close to 200 miles of bike and walking paths once complete. The Loop connects to over 23,034 acres of green space and 41 developed parks.
The Loop, like the Intertwine, has the capacity to act as a public health re-source and contribute to a healthy sustainable community. Primarily this func-tion is served by providing opportunities for physical activity. Physical activity is useful for reducing the prevalence and risk of many common and costly chronic diseases, including cardiovascular disease, hypertension and diabetes. One of the principal ways that physical activity reduces the prevalence and risk of chronic disease is via reduction of body mass index (BMI) and subsequent occurrence of obesity.
An assessment of the physical activity that occurs in the Intertwine was a part of a larger project to assess the holistic benefits of the Intertwine, including economic and environmental benefits to the region. It is estimated that use of the Intertwine is responsible for the avoided weight gain of 17 million pounds/year for all residents of the Portland metropolitan area. In health-care dollars, this is the equivalent of $155 million in averted health-care costs every year. Using the Portland model, Loop users would show almost 3 million pounds in avoided weight gain and almost $25 million in averted health-care costs.
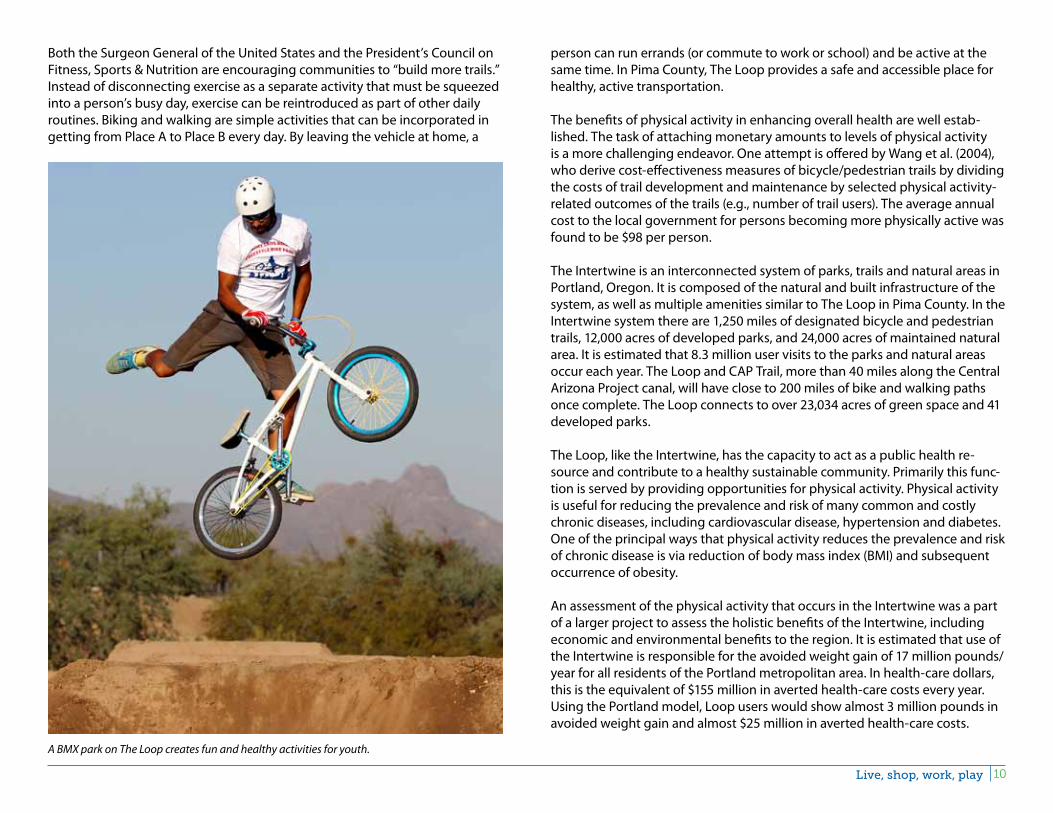
A BMX park on The Loop creates fun and healthy activities for youth.

11 Live, shop, work, play
People of all ages enjoy exercising outdoors on The Loop.

12Live, shop, work, play
The Centers for Disease Control and Prevention (CDC) reported that 26.6 per-cent of adults in Pima County were obese in 2009. This is higher than the state average of 24.7 percent, but lower than the national average of 35.7 percent. The CDC recommends 30 minutes of moderate exercise on most days, which is the equivalent of 1.5 miles of walking or 5 miles of biking at a moderate pace. Thus, as residents make use of The Loop, walking or biking for short trips instead of driving, they will receive added health benefits from a more active lifestyle.
EnvironmEntBikes are a very environmentally friendly means of transportation: no tailpipe emissions, no evaporative emissions, no emissions from gasoline pumping or oil refining, and zero carbon dioxide or other greenhouse gases that contrib-ute to global warming. Bicycling also means less water pollution (many people do not realize that motor vehicles are a significant source of water pollution as well as air pollution). And, bikes are quiet, so they do not contribute to noise pollution. Biking and walking reduces global warming emissions, which reduc-es the costs of climate change to governments, businesses, and individuals.
In eastern Pima County, 22 million miles are driven each day, according to the Pima Association of Governments (PAG). Each mile not driven reduces CO₂ emissions by one pound. So, in the four days a week example above there would be a reduction of 2,000 pounds of CO₂ emissions by bicycling.
If local residents had the opportunity to run more errands by bicycling or walking, they could save approximately 500 gallons of fuel ($1,625 in annual gasoline savings) or 10,000 pounds of CO₂ each year.
Every one mile driven in a vehicle means that one pound of carbon dioxide, a greenhouse gas, is released into the atmosphere (PAG). In 2011, daily driving in Pima County contributed 2 million pounds of carbon dioxide pounds to air pollution.
The total amount of gasoline used in eastern Pima County is approximately 1,100,000 gallons burned per day. The gasoline costs alone would be $3.85 mil-lion based on $3.50 per gallon.
A local high school on The Loop started a bicycling club.

13 Live, shop, work, play
Table 2. The Loop Return on Investment
concLusionThe advantages of bicycling and walking reach beyond transportation alone. Savings in fuel costs, a smaller carbon footprint, and a practical way to achieve recommended levels of physical activity are among the benefits that make The Loop an irresistible all-in-one package. Providing alternate transportation routes and easy commuting to and from work via The Loop and its connecting bike infrastructure helps individuals and families offset impacts of gasoline inflation and soaring health-care costs. As families save money on transportation and health care, they increase spending on retail and services benefiting the private sector. In addition, building The Loop infrastructure creates jobs and the com-pleted infrastructure increases home values nearby.
Other American communities have calculated the benefits of shared-use paths and greenways, described in this report. Table 2 illustrates these economic benefits when applied to The Loop.
Benefit to Government Benefit to Pima County Residents TotalJobs Created $5,400,000 $5,400,320Outdoor Recreation $72,000,000 $72,000,000Regional Sales Tax $57,600,000 $57,600,000Value to Homes $300,000,000 $300,000,000Property Tax Revenue $40,000,000 $40,000,000Averted Health Care Costs $465,000,000 $465,000,000Total $103,000,000 $837,000,000 $940,000,000 Final Loop Build-out, every $1invested equals: $1.03 $8.37 $9.40
Every one dollar invested in The Loop yields over nine dollars of economic benefit to Pima County residents. This includes immediate economic benefits
Art accents parks and rest areas on The Loop.
14Live, shop, work, play
Using The Loop for transportation reduces carbon emissions.
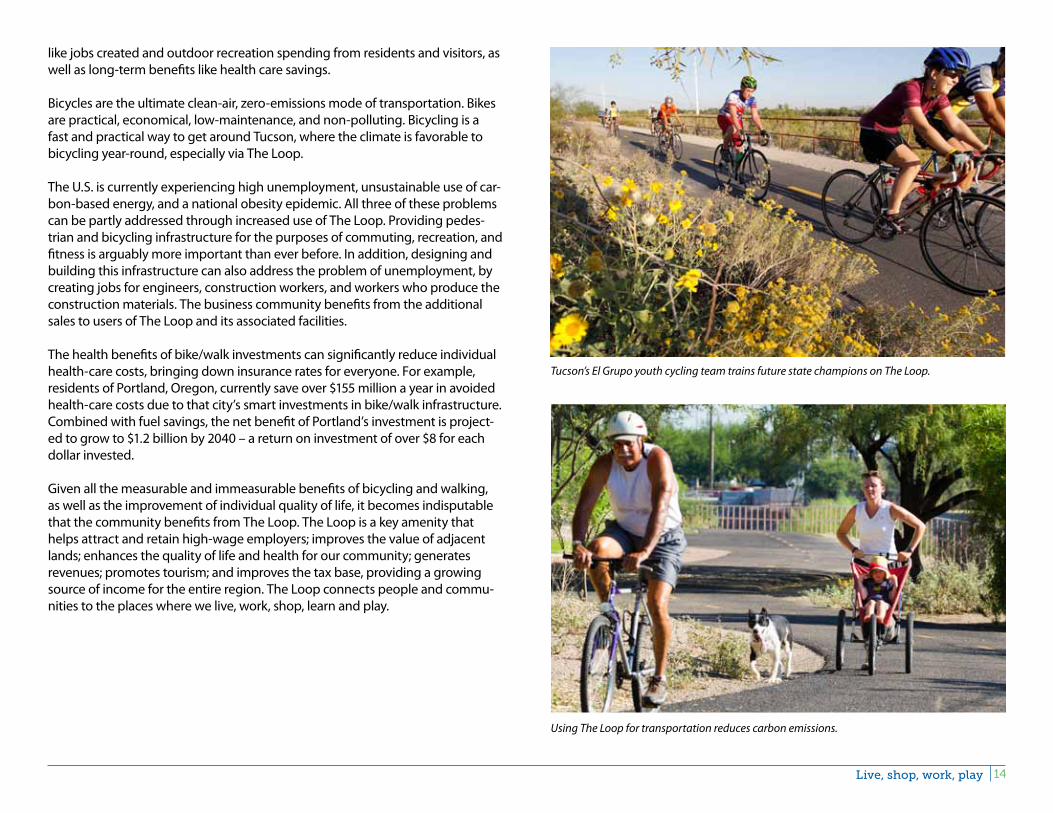
Tucson’s El Grupo youth cycling team trains future state champions on The Loop.
like jobs created and outdoor recreation spending from residents and visitors, as well as long-term benefits like health care savings.
Bicycles are the ultimate clean-air, zero-emissions mode of transportation. Bikes are practical, economical, low-maintenance, and non-polluting. Bicycling is a fast and practical way to get around Tucson, where the climate is favorable to bicycling year-round, especially via The Loop.
The U.S. is currently experiencing high unemployment, unsustainable use of car-bon-based energy, and a national obesity epidemic. All three of these problems can be partly addressed through increased use of The Loop. Providing pedes-trian and bicycling infrastructure for the purposes of commuting, recreation, and fitness is arguably more important than ever before. In addition, designing and building this infrastructure can also address the problem of unemployment, by creating jobs for engineers, construction workers, and workers who produce the construction materials. The business community benefits from the additional sales to users of The Loop and its associated facilities.
The health benefits of bike/walk investments can significantly reduce individual health-care costs, bringing down insurance rates for everyone. For example, residents of Portland, Oregon, currently save over $155 million a year in avoided health-care costs due to that city’s smart investments in bike/walk infrastructure. Combined with fuel savings, the net benefit of Portland’s investment is project-ed to grow to $1.2 billion by 2040 – a return on investment of over $8 for each dollar invested.
Given all the measurable and immeasurable benefits of bicycling and walking, as well as the improvement of individual quality of life, it becomes indisputable that the community benefits from The Loop. The Loop is a key amenity that helps attract and retain high-wage employers; improves the value of adjacent lands; enhances the quality of life and health for our community; generates revenues; promotes tourism; and improves the tax base, providing a growing source of income for the entire region. The Loop connects people and commu-nities to the places where we live, work, shop, learn and play.

15 Live, shop, work, play
Karadeniz, D. (2008). The impact of trails on single family residential property values. Re-trieved from http://www.americantrails.org/resources/economics/littlemiamipropvalue.html
Ketcham, B. and C. Komanoff, (1993) Win-Win Transportation: A No-Losers Approach to Financing Transport in New York City and the Region, Transportation Alternatives.
Krizek, K.J. (2007). Estimating the economic benefits of bicycling and bicycle facilities: An in-terpretive review and proposed methods. Retrieved from http://www.peoplepoweredmove-ment.org/site/images/uploads/Economic_Benefits_of_Bicycling
League of American Bicyclists. (2009, June). The economic benefits of bicycle infrastructure investments. Retrieved from http://www.bikeleague.org/resources/reports/pdfs/economic_benefits_bicycle_infrastructure_report.pdf
League of American Bicyclists. (2012, July). Bicycling means business: The economic benefits of bicycle infrastructure. Retrieved from http://www.advocacyadvance.org/site_images/con-tent/Final_Econ_Update(small).pdf
League of American Bicyclists. (2012). Feedback: Bicycle friendly community appli-cation: Tucson and Eastern Pima County. Retrieved from https://www.pagnet.org/documents/2012LABfeedback.pdf
League of American Bicyclists. (n.d.). Quality bike products health and wellbeing program case study. Retrieved from http://www.bikeleague.org/programs/bicyclefriendlyamerica/bicyclefriendlybusiness/pdfs/quality_bike_products_health_reward_program.pdf
Lloyd, T. (2012, October 15). Building a bastion for commuter cities the world over. Retrieved from http://www.constructiondigital.com/architectural_design/building-a-bastion-for-com-muter-cities-the-world-over
MacKenzie, James J. et al., (1992, June) The Going Rate: What It Really Costs to Drive, World Resources Institute.
National Trails Training Partnership (2007, March 16). We built it and they came. Retrieved from http://www.americantrails.org/resources/ManageMaintain/ManageMCSearns.html North Carolina Department of Transportation. (2004). Pathways to prosperity: The economic impact of investments in bicycles facilities: A case study of North Carolina northern outer banks. Retrieved from http://www.ncdot.gov/bikeped/download/bikeped_research_EIA-fulltechreport.pdf
Outdoor Industry Association. (2012, June). A snapshot of the economic impact of outdoor recreation. Retrieved from http://www.outdoorindustry.org/research/economicimpact.php?action=detail&research_id=160
Penna, C.D. (2009, March 29). Home sales near two Massachusetts rail trails. Retrieved from http://www.americantrails.org/resources/adjacent/dellapennasales.html
Rails-to-Trails Conservancy. (2012). Active transportation for America. The case for increased federal investment in bicycling and walking. Retrieved from http://www.railstotrails.org/resources/documents/whatwedo/atfa/atfa_20081020.pdf
San Diego Association of Governments. (2006, March 17). Bayshore bikeway plan. Retrieved from http://www.sandag.org/uploads/projectid/projectid_63_5152.pdf
rEfErEncEsAppalachian Trail Project Office. (1981). Comprehensive Plan for the protection, management, development and use of the Appalachian National Scenic Trail, pp. X, 5. Retrieved from http://atfiles.org/files/pdf/ATCompPlan.pdf
Arizona Office of Tourism. (2009, June). Arizona Travel impacts: 1998-2008p. Retrieved from http://www.azot.gov/documents/AZ_Travel_Impacts_2008p_final.pdf
Arkansas Department of Parks and Tourism. (2012). The economic impact of travel in Arkan-sas. Retrieved from http://www.arkansas.com/!userfiles/apt-economic-report-2012.pdf
Atlanta BeltLine, Inc. (2010). Atlanta BeltLine Annual Report 2010: A year of dedication: Bringing the vision to life. Retrieved from http://beltlineorg.wpengine.netdna-cdn.com/wp-content/uploads/2012/05/ABL-2010-Annual-Report1.pdf
Atlanta BeltLine, Inc. (2011). Atlanta Beltline Annual Report 2011: Grand openings, green foundations. Retrieved from http://beltlineorg.wpengine.netdna-cdn.com/wp-content/up-loads/2012/05/ABL-2011-Annual-Report1.pdf
Atlanta BeltLine, Inc. (2012, March 20). Quarterly briefing. Retrieved from http://beltlineorg.wpengine.netdna-cdn.com/wp-content/uploads/2012/04/Atlanta-BeltLine-Quarterly-Brief-ing_2009_Q4.pdf
Beil, K. (2011, January 21). Physical activity and the intertwine: A public health method of reducing obesity and health-care costs. Retrieved from http://bikeportland.org/wp-content/uploads/2011/02/IntertwinePAObesityAssessment.pdf
Center for Urban Policy and the Environment. (2003, December). Public choices and property values: Evidence from greenways in Indianapolis. Retrieved from http://atfiles.org/files/pdf/lindseypropvalues.pdf
Centers for Disease Control and Prevention. (2009) “Diabetes Data and Trends,” http://apps.nccd.cdc.gov/DDT_STRS2/CountyPrevalenceData.aspx
Civic Tourism. (2010). Strategies: Rethink economies. Retrieved from http://www.civictourism.org/strategies1.html
City of Raleigh Department of Tourism. (2010). Economic benefits of greenspace. Retrieved from http://www.raleighnc.gov/content/PlanUrbanDesign/Documents/LunchForums/Eco-nomic_Benefits_of_Greenspace_Presentation.pdf
Campos, Inc. (2009, August 7). The Great Allegheny Passage economic study (2007-2008). Retrieved from http://www.atatrail.org/docs/GAPeconomicImpactStudy200809.pdf
Greer, D.L. (2001). Omaha recreational trails: Their effect on property values and public safety. Retrieved from http://www.americantrails.org/resources/adjacent/OmahaStudy.html
IHS Global Insight. (2010, August) 2009 tourism satellite account. Retrieved from http://trav-elksindustry.com/DocumentCenter/Home/View/147
Kansas Department of Commerce. (2010, October 12). Kansas tourism has a $5.46 billion dollar impact, study shows. Retrieved from http://www.kansascommerce.com/CivicAlerts.aspx?aid=110

16Live, shop, work, play
The Institute for Comprehensive Community Development. (2011, December 11). Designing for healthy communities: Active living and comprehensive community development. http://www.instituteccd.org/news/3258
Tintle, Robert. (2012, August). Bicycle sharing programs: enhancing community livability. Retrieved from http://www.apwa.net/Resources/Reporter/Articles/2012/8/Bicycle-sharing-programs-enhancing-community-livability
United Nations Environment Programme. (2009). Policy recommendations on sustainable tourism development. Retrieved from http://www.unep.fr/scp/marrakech/taskforces/pdf/POLICY_RECOMMENDATIONS-ITF_STD_2009.pdf
U.S. Department of Agriculture. (2012). The outdoor recreation economy. Retrieved from http://www.fs.usda.gov/Internet/FSE_DOCUMENTS/stelprdb5389204.pdf
U.S. Department of Commerce. (2012, March 21). U.S. Commerce Department releases data showing tourism spending increased 8.1 percent in 2011, supporting an additional 103,000 tourism-related jobs. Retrieved from http://www.commerce.gov/news/press-releas-es/2012/03/21/us-commerce-department-releases-data-showing-tourism-spending-increas
U.S. Fish and Wildlife Service. (2007, October) Birding in the United States: A Demographic Economic Analysis. Retrieved from http://digitalmedia.fws.gov/cdm/ref/collection/docu-ment/id/176 Walljasper, J. (2012, April 18). Boom in biking benefits everyone, not just bicyclists. Retrieved from http://www.csmonitor.com/World/Making-a-difference/Change-Agent/2012/0418/Boom-in-biking-benefits-everyone-not-just-bicyclists
Wang, G., Macera, C.A., Scudder-Soucie, B., Schmid, T., Pratt, M., Buchner, D. (2004, February). Cost effectiveness of a bicycle/pedestrian trail development in health promotion. Retrieved from http://www.ncbi.nlm.nih.gov/pubmed/14715217
ELEctronic rEfErEncE Links By topicThe Loop www.pima.gov/theloop/Economic Impacthttp://www.peoplepoweredmovement.org/site/images/uploads/Economic_Benefits_of_Bi-cycling_and Bicycle_Facilities.pdfhttp://www.bicyclinginfo.org/bikecost/docs/Guidelines.pdf
Business/Employmenthttp://www.americantrails.org/resources/economics/businessoftrails.htmlhttp://fresh-energy.org/2011/09/energy-101-whats-the-return-on-investment-for-biking-and-walking/
Tourismhttps://www.pagnet.org/documents/2012LABfeedback.pdfhttp://www.azot.gov/documents/AZ_Travel_Impacts_2008p_final.pdfhttp://www.atatrail.org/docs/GAPeconomicImpactStudy200809.pdfhttp://www.unep.fr/scp/marrakech/taskforces/pdf/POLICY_RECOMMENDATIONS-ITF_STD_2009.pdf
http://www.fs.usda.gov/Internet/FSE_DOCUMENTS/stelprdb5389204.pdfhttp://www.outdoorindustry.org/research/economicimpact.php?action=detail&research_id=160
Housinghttp://www.americantrails.org/resources/economics/littlemiamipropvalue.htmlhttp://carbon.ucdenver.edu/~kkrizek/pdfs/Walk%20and%20bike%20demand.pdfhttp://www.peoplepoweredmovement.org/site/images/uploads/Economic_Benefits_of_Bi-cycling_and_Bicycle_Facilities.pdfhttp://www.americantrails.org/resources/economics/littlemiamipropvalue.htmlhttp://www.americantrails.org/resources/adjacent/OmahaStudy.htmlhttp://www.apwa.net/Resources/Reporter/Articles/2012/8/Bicycle-sharing-programs-en-hancing-community-livability
Alternative Transportation Modehttps://www.pagnet.org/documents/2012LABfeedback.pdfhttp://www.americantrails.org/resources/economics/businessoftrails.html
Healthhttp://fresh-energy.org/2011/09/energy-101-whats-the-return-on-investment-for-biking-and-walking/http://www.peoplepoweredmovement.org/site/images/uploads/Economic_Benefits_of_Bi-cycling_and_Bicycle_Facilities.pdfhttp://bikeportland.org/wp-content/uploads/2011/02/IntertwinePAObesityAssessment.pdfhttp://atfiles.org/files/pdf/lindseypropvalues.pdfhttp://apps.nccd.cdc.gov/DDT_STRS2/CountyPrevalenceData.aspx
Environmenthttp://fresh-energy.org/2011/09/energy-101-whats-the-return-on-investment-for-biking-and-walking/http://www.baaqmd.gov/Divisions/Communications-and-Outreach/Spare-the-Air/Bicycles-and-Air-Quality.aspx
Bicycling Studies / Case StudiesAtlanta Beltline—Georgia http://beltlineorg.wpengine.netdna-cdn.com/wp-content/uploads/2012/05/ABL-2011-An-nual-Report1.pdfhttp://beltlineorg.wpengine.netdna-cdn.com/wp-content/uploads/2012/05/ABL-2010-An-nual-Report1.pdfhttp://beltlineorg.wpengine.netdna-cdn.com/wp-content/uploads/2012/04/Atlanta-Belt-Line-Quarterly-Briefing_2009_Q4.pdfBayshore Bikeway Plan—San Diego, Californiahttp://www.sandag.org/uploads/projectid/projectid_63_5152.pdf
17 Live, shop, work, play
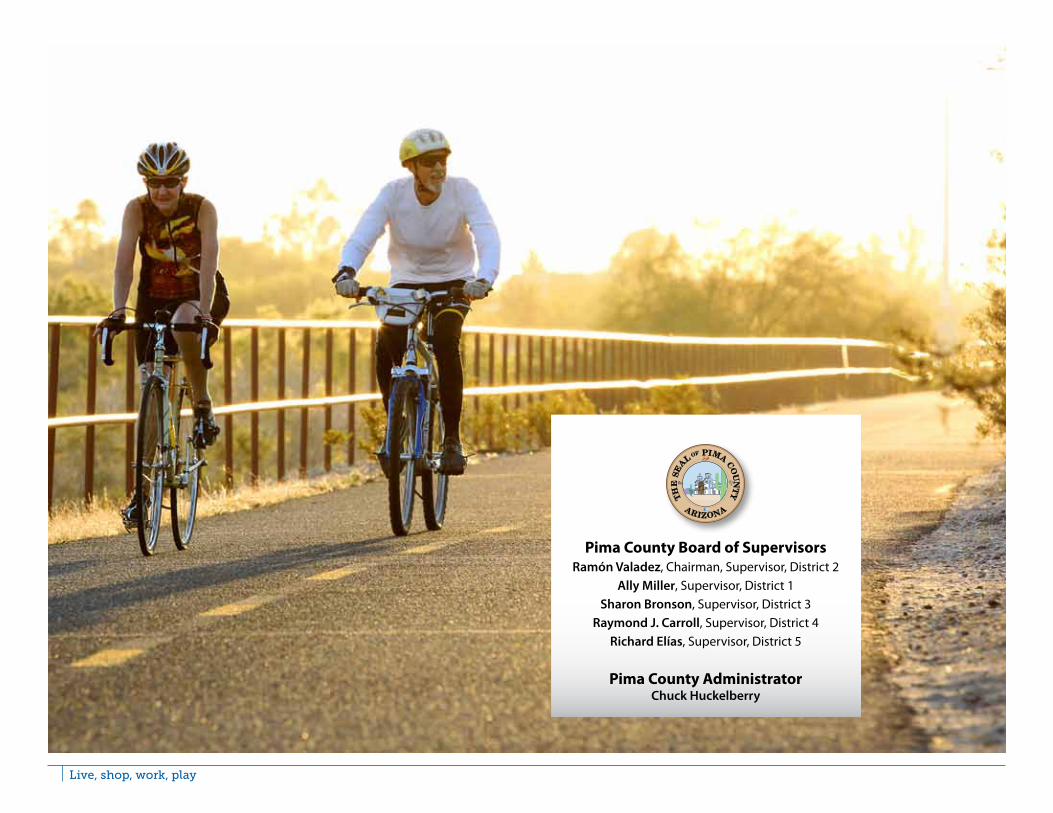
Pima County Board of SupervisorsRamón Valadez, Chairman, Supervisor, District 2
Ally Miller, Supervisor, District 1Sharon Bronson, Supervisor, District 3
Raymond J. Carroll, Supervisor, District 4Richard Elías, Supervisor, District 5
Pima County AdministratorChuck Huckelberry