economic feasibility study of the transportation and …
TRANSCRIPT
© 2011 AGDC. All Rights Reserved
ECONOMIC FEASIBILITY STUDY OF THE TRANSPORTATION AND SALE OF NATURAL GAS LIQUIDS/LP GAS FOR THE
ALASKA GASLINE DEVELOPMENT CORPORATION
June 22, 2011

This report was prepared by R. W. Beck for the sole and exclusive benefit of Alaska Gasline Development Corporation (the “Owner”) for the purpose of assisting the Owner to make preliminary assessment of the economic feasibility of the Transportation and Sale of Natural Gas Liquids (NGL) /LP Gas. R.W. Beck makes no representation or warranty and assumes no liability in respect to the use of this report by any third party and any such parties, by virtue of their acceptance and use of this report, shall be deemed to have (a) acknowledged that R.W. Beck shall not have any liability to any party other than the Owner in respect to this report and (b) waived and released R.W. Beck from any liability in connection with this report. Any use of this report by the Owner is subject to the terms and conditions of the Professional Services Agreement between R.W. Beck and the Owner.

ECONOMIC FEASIBILITY STUDY
ALASKA GASLINE DEVELOPMENT CORPORATION
TABLE OF CONTENTS
Page
i
© 2011 AGDC. All Rights Reserved
1.0 INTRODUCTION .................................................................................................................................................... 1 1.1 NGL Project ........................................................................................................................................................... 1 1.2 NGL Cases ............................................................................................................................................................. 1
1.2.3 Case 2.1........................................................................................................................................................... 1 1.2.4 Case 3.1.1........................................................................................................................................................ 1 1.2.5 Case 3.1.2........................................................................................................................................................ 1
1.3 Assumptions ........................................................................................................................................................... 2 1.4 Glossary.................................................................................................................................................................. 4
2.0 EXECUTIVE SUMMARY ...................................................................................................................................... 5 2.1 Pacific Rim LPG Supply and Demand ................................................................................................................... 5 2.2 Tide Water port Analysis ....................................................................................................................................... 5 2.3 NGL Process Facility Analysis .............................................................................................................................. 5 2.4 Cap-Ex Summary ................................................................................................................................................... 6 2.5 North Slope Pipeline Entry Netback Calculations.................................................................................................. 7 2.6 Conclusion.............................................................................................................................................................. 9
3.0 PACIFIC RIM MARKET FOR LP GAS............................................................................................................. 10 3.1 Objective .............................................................................................................................................................. 10 3.2 Overview of Pacific Rim Market ......................................................................................................................... 10
Primary Export Markets......................................................................................................................................... 10 3.2.1 Products......................................................................................................................................................... 11 3.2.2 Consumption ................................................................................................................................................. 12 3.2.3 Imports .......................................................................................................................................................... 12 3.2.4 Composition.................................................................................................................................................. 13 3.2.5 Cargo Types .................................................................................................................................................. 14 3.2.6 Global Trade in Ethane ................................................................................................................................. 17
3.3 Demand ................................................................................................................................................................ 17 3.3.1 Japan ............................................................................................................................................................. 17 3.3.2 South Korea................................................................................................................................................... 22 3.3.3 Taiwan........................................................................................................................................................... 26 3.3.4 China ............................................................................................................................................................. 28
3.4 Supply .................................................................................................................................................................. 32 3.4.1 Overview....................................................................................................................................................... 32 3.4.2 Saudi Arabia.................................................................................................................................................. 38 3.4.3 Qatar.............................................................................................................................................................. 38 3.4.4 Indonesia ....................................................................................................................................................... 39 3.4.5 Russia............................................................................................................................................................ 39 3.4.6 Australia ........................................................................................................................................................ 40 3.4.7 Canada........................................................................................................................................................... 41
3.5 FOB Alaska Pricing.............................................................................................................................................. 41 3.5.1 Methodology ................................................................................................................................................. 41 3.5.2 Commodity Price .......................................................................................................................................... 42 3.5.3 Conclusion for CIF LPG Prices in Pacific Rim ............................................................................................ 45 3.5.4 Marine Transportation Cost .......................................................................................................................... 46 3.5.5 Conclusion for Marine Transportation Cost.................................................................................................. 50

ECONOMIC FEASIBILITY STUDY
ALASKA GASLINE DEVELOPMENT CORPORATION
TABLE OF CONTENTS (continued)
Page
ii
© 2011 AGDC. All Rights Reserved
3.5.6 Pricing FOB Alaska Tidewater from CIF Import Markets for Asian Markets.............................................. 50 3.6 Pricing FOB Alaska Tidewater for Canadian Market .......................................................................................... 50
3.6.1 Conclusion for FOB Alaska Tidewater Prices .............................................................................................. 51 3.7 Market Rating of Asian Countries........................................................................................................................ 51 3.8 Conclusions .......................................................................................................................................................... 52
4.0 MARINE TERMINAL ANALYSIS...................................................................................................................... 53 4.1 Federal Regulations Governing NGL Facilities ................................................................................................... 53 4.2 Primary Federal Safety and Security Regulations ................................................................................................ 53 4.3 Exclusion Zones ................................................................................................................................................... 54 4.4 Other Regulations................................................................................................................................................. 54 4.5 Potential Tidewater Sites...................................................................................................................................... 55 4.6 Site Assessment Methodology and Rankings....................................................................................................... 57
4.6.1 Nikiski........................................................................................................................................................... 58 4.6.2 Port MacKenzie............................................................................................................................................. 63
4.7 Supplemental Capex Requirements For Port of MacKenzie ................................................................................ 65 4.8 Dredging the Port MacKenzie Shoal .................................................................................................................... 65 4.9 Installation of a Protective Breakwater ................................................................................................................ 66 4.10 Other cost factors: .............................................................................................................................................. 67
4.10.1 Port of Anchorage ....................................................................................................................................... 68 4.10.2 Other Kenai Peninsula Locations................................................................................................................ 69 4.10.3 Seward Marine Industrial Center ................................................................................................................ 69 4.10.4 Homer ......................................................................................................................................................... 70 4.11 Conclusion ..................................................................................................................................................... 72
5.0 NGL PROCESSING FACILITY SITING ANALYSIS ...................................................................................... 73 5.1 Case 3.1.1 Big Lake Extraction Facility/LPG Product Shipping from Port MacKenzie ...................................... 73 5.2 Case 3.1.2 Big Lake Extraction Facility/LPG Product Shipping from Nikiski .................................................... 79 5.3 Case 2.1 Fairbanks-Dunbar Extraction & Fractionation/LPG Product Shipping by Rail to Tidewater Port........ 79
5.3.1 The FNSB Regional Comprehensive Plan .................................................................................................... 80 5.3.2 Site Preferences and Pipeline Location......................................................................................................... 82 5.3.3 The Railroad.................................................................................................................................................. 83 5.3.4 Rail Transportation Costs.............................................................................................................................. 84 5.4 Conclusion ....................................................................................................................................................... 87
6.0 CASES EVALUATED ........................................................................................................................................... 88 6.1 Gas Composition .................................................................................................................................................. 88 6.2 Case NGL 1.2.1.................................................................................................................................................... 88 6.3 Case NGL 3.1.1 – Big Lake-Port Mackenzie ....................................................................................................... 90 6.4 Case NGL 3.1.2 – Big Lake-Nikiski .................................................................................................................... 92 6.5 Case NGL 2.1 – Dunbar-Seward.......................................................................................................................... 93 6.6 Process Flow ........................................................................................................................................................ 95
7.0 PROCESS DESIGN CONSIDERATIONS AND CAPITAL COSTS................................................................ 99 7.1 General Processing Design Considerations .......................................................................................................... 99 7.2 General Capital Cost Considerations.................................................................................................................. 100
ECONOMIC FEASIBILITY STUDY
ALASKA GASLINE DEVELOPMENT CORPORATION
TABLE OF CONTENTS (continued)
Page
iii
© 2011 AGDC. All Rights Reserved
7.3 North Slope Deethanizer .................................................................................................................................... 100 7.4 Fractionator ........................................................................................................................................................ 100 7.5 LPG Pipelines..................................................................................................................................................... 102 7.6 Liquid Product Storage....................................................................................................................................... 102 7.7 Rail Transportation............................................................................................................................................. 104
8.0 CAPITAL COST REVIEW................................................................................................................................. 105 8.1 Capital Cost Summary........................................................................................................................................ 105 8.2 Levelized Cost Determinations .......................................................................................................................... 105 8.3 North Slope Pipeline Entry Netback Calculations.............................................................................................. 107
9.0 SUPPLEMENTAL ANALYSIS .......................................................................................................................... 110 9.1 Cogeneration Options......................................................................................................................................... 110 9.2 Power Plant & Driver Concept Design............................................................................................................... 111 9.3 Power Plant Loads.............................................................................................................................................. 111 9.4 Heat Recovery Steam Generation System.......................................................................................................... 111 9.5 Incremental Operating Costs .............................................................................................................................. 111 9.6 Bus Bar Costs ..................................................................................................................................................... 112 9.7 Incremental Capital Costs................................................................................................................................... 112 9.8 Carbon Capture .................................................................................................................................................. 112
APPENDIX A - HISTORICAL WTI CRUDE OIL AND LP GAS PRICE CORRELATION ...........................A-1
APPENDIX B - GLOSSARY OF TERMS FOR THE NATURAL GAS INDUSTRY......................................... B-1

1
© 2011 AGDC. All Rights Reserved
1.0 INTRODUCTION
SAIC has been engaged by Alaska Gasline Development Corporation (“AGDC”) in accordance with Request for Proposal (“RFP”) #2010-AGDC-003 (and Addendum #1) for development of an Economic Feasibility Study (the “Study”) associated with Greenfield Natural Gas Liquids (“NGL”) Extraction, Fractionation, Storage, and Export Facility (the “NGL Process Facility”). The primary purpose of the Study is to address whether a Greenfield NGL export facility could serve as an anchor tenant for a pipeline delivering wet natural gas from the North Slope to the tidewater region of south central Alaska.
1.1 NGL Project
The NGL Study analysis follows the value chain from Pacific Rim markets, marine shipping transportation, tide water port evaluation, NGL Process Facility investigation, to NGL product net back calculation at the North Slope. The Pacific Rim market review covers both potential customers for NGL products, competitors that are currently selling NGL products to Pacific Rim customers, and projected pricing for NGL products at the customer markets. The market review identifies the main products that are traded globally, mixtures of propane and butane that are termed “LP Gas” on the world market. The marine transportation discussion includes projected pricing for shipping cargoes of LP Gas to Pacific Rim customers. The tide water port evaluation examines issues such as environmental impacts, infrastructure improvements, compatibility with local plans, safety, security, and complexity associated with receiving, loading, and discharging marine vessels. The NGL Process Facility investigation describes the type and size of equipment required for extraction and separation of NGL products from the wet gas stream. The net back calculation evaluates the different economic cases for product valuation at the North Slope.
1.2 NGL Cases
For purposes of this study, six cases were reviewed (see Section 6 for detailed descriptions of each of these cases), three of which were developed in detail, for addressing supply of NGL products to a tide water port location. The three cases are:
1.2.3 Case 2.1
A wet gas pipeline would be constructed to Dunbar where a large extraction plant is located with dry gas continuing onto the South Central area. Propane and butane products would be separated and shipped via rail to a tide water location where propane and butane products would be loaded onto ships for export as LP Gas to Pacific Rim Markets. This Case 2.1, which is one of the cases examined in detail, is also referred to as "Case NGL 2.1 – Dunbar-Seward"
1.2.4 Case 3.1.1
A wet gas pipeline would be constructed to Big Lake where a large extraction plant is located with dry gas being injected into the Beluga pipeline system. Propane and butane products would be separated and shipped via pipeline to Port MacKenzie where propane and butane products would be loaded onto ships for export as LP Gas to Pacific Rim Markets. This Case 3.1.1, which is one of the cases examined in detail, is also referred to as "Case NGL 3.1.1 – Big Lake-Port MacKenzie."
1.2.5 Case 3.1.2
A wet gas pipeline would be constructed to Big Lake where a large extraction plant is located with dry gas being injected into the Beluga pipeline system. Propane and butane products would be separated and shipped via pipeline to Nikiski where they would be loaded onto ships for export as LP Gas to Pacific Rim Markets. This Case 3.1.2, which is one of the cases examined in detail, is also referred to as "Case NGL 3.1.2 – Big Lake-Nikiski."

2 © 2011 AGDC. All Rights Reserved
1.3 Assumptions
This study includes economic assumptions (as described in the RFP) that the exported NGL products will be propane and butane (iso and normal). For purposes of this study, ethane products will be either be removed prior to receipt of the gas or remain entrained in the dry gas product leaving the NGL facility. Due to low shipping volumes, it is assumed that pentanes and other natural gasoline products will be sold into the local refining market. A limit of four benchmark locations will be selected based on refrigerated product.
The technical assumptions associated with this study are as follows:
Wet gas containing entrained volume of approximately 35,000 barrels per day of NGLs and meeting the specified criteria will be supplied the inlet of Compressor Station at MP 0;
The NGL Process Facility will be evaluated at two locations Dunbar and Big Lake. The NGL fractionation plant will be located at the most suitable tidewater location;
This Study will include a specific evaluation of regional tide water harbors at Port MacKenzie, Anchorage, Nikiski, and Seward.
For the NGL Process Facility being located at Big Lake, a dedicated NGL extraction Straddle Plant will be included as part of the Fairbanks Spur Line in order to supply dry natural gas to the City of Fairbanks. Extracted NGLs from the Straddle Plant will be re-injected into wet gas line for ultimate processing at the NGL Process Facility (Figure 1).

3 © 2011 AGDC. All Rights Reserved
Figure 1: Pipeline Routing, Facility Location, and Port Location Map

4 © 2011 AGDC. All Rights Reserved
The potential power cogeneration evaluation will be limited to converting simple cycle power and process driver equipment to combined cycle by adding heat recovery steam generators (“HRSGs”) and a central steam turbine.
Carbon mitigation analysis will be limited to comparison of carbon dioxide removed from the NGL Process Facility combustion turbines for Cook Inlet enhanced oil recovery as compared to projected carbon credit values.
AGDC provided limited capital cost estimate support associated with the wet gas pipeline, Dunbar Straddle Plant, and NGL Process Facility by providing SAIC with copies of previously performed cost analysis and other technical studies.
1.4 Glossary
This study utilizes terms associated with the natural gas industry including liquefied petroleum gas (“LPG”), natural gas liquids (NGL), LP Gas, ethane, propane, butane plus other natural gas constituents and processes. A definition of these terms is included in a glossary located in Appendix B.
5 © 2011 AGDC. All Rights Reserved
2.0 EXECUTIVE SUMMARY
2.1 Pacific Rim LPG Supply and Demand
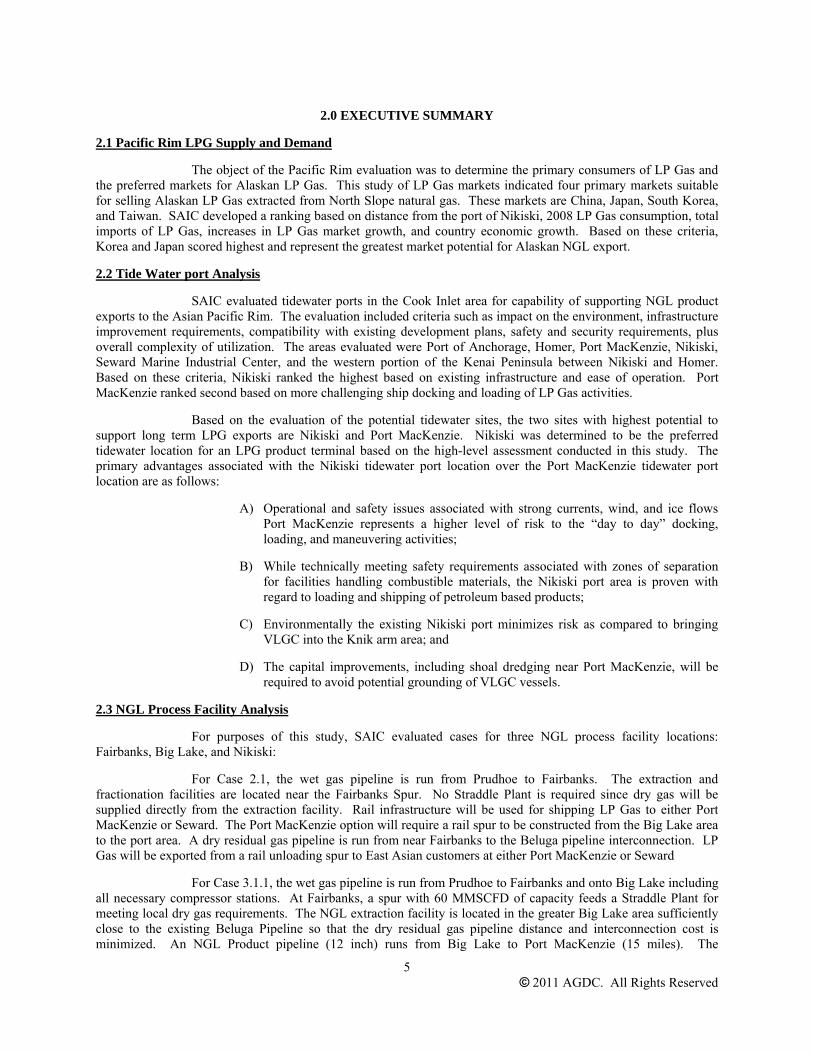
The object of the Pacific Rim evaluation was to determine the primary consumers of LP Gas and the preferred markets for Alaskan LP Gas. This study of LP Gas markets indicated four primary markets suitable for selling Alaskan LP Gas extracted from North Slope natural gas. These markets are China, Japan, South Korea, and Taiwan. SAIC developed a ranking based on distance from the port of Nikiski, 2008 LP Gas consumption, total imports of LP Gas, increases in LP Gas market growth, and country economic growth. Based on these criteria, Korea and Japan scored highest and represent the greatest market potential for Alaskan NGL export.
2.2 Tide Water port Analysis
SAIC evaluated tidewater ports in the Cook Inlet area for capability of supporting NGL product exports to the Asian Pacific Rim. The evaluation included criteria such as impact on the environment, infrastructure improvement requirements, compatibility with existing development plans, safety and security requirements, plus overall complexity of utilization. The areas evaluated were Port of Anchorage, Homer, Port MacKenzie, Nikiski, Seward Marine Industrial Center, and the western portion of the Kenai Peninsula between Nikiski and Homer. Based on these criteria, Nikiski ranked the highest based on existing infrastructure and ease of operation. Port MacKenzie ranked second based on more challenging ship docking and loading of LP Gas activities.
Based on the evaluation of the potential tidewater sites, the two sites with highest potential to support long term LPG exports are Nikiski and Port MacKenzie. Nikiski was determined to be the preferred tidewater location for an LPG product terminal based on the high-level assessment conducted in this study. The primary advantages associated with the Nikiski tidewater port location over the Port MacKenzie tidewater port location are as follows:
A) Operational and safety issues associated with strong currents, wind, and ice flows Port MacKenzie represents a higher level of risk to the “day to day” docking, loading, and maneuvering activities;
B) While technically meeting safety requirements associated with zones of separation for facilities handling combustible materials, the Nikiski port area is proven with regard to loading and shipping of petroleum based products;
C) Environmentally the existing Nikiski port minimizes risk as compared to bringing VLGC into the Knik arm area; and
D) The capital improvements, including shoal dredging near Port MacKenzie, will be required to avoid potential grounding of VLGC vessels.
2.3 NGL Process Facility Analysis
For purposes of this study, SAIC evaluated cases for three NGL process facility locations: Fairbanks, Big Lake, and Nikiski:
For Case 2.1, the wet gas pipeline is run from Prudhoe to Fairbanks. The extraction and fractionation facilities are located near the Fairbanks Spur. No Straddle Plant is required since dry gas will be supplied directly from the extraction facility. Rail infrastructure will be used for shipping LP Gas to either Port MacKenzie or Seward. The Port MacKenzie option will require a rail spur to be constructed from the Big Lake area to the port area. A dry residual gas pipeline is run from near Fairbanks to the Beluga pipeline interconnection. LP Gas will be exported from a rail unloading spur to East Asian customers at either Port MacKenzie or Seward
For Case 3.1.1, the wet gas pipeline is run from Prudhoe to Fairbanks and onto Big Lake including all necessary compressor stations. At Fairbanks, a spur with 60 MMSCFD of capacity feeds a Straddle Plant for meeting local dry gas requirements. The NGL extraction facility is located in the greater Big Lake area sufficiently close to the existing Beluga Pipeline so that the dry residual gas pipeline distance and interconnection cost is minimized. An NGL Product pipeline (12 inch) runs from Big Lake to Port MacKenzie (15 miles). The
6 © 2011 AGDC. All Rights Reserved
Fractionation Facility is located at Port MacKenzie. LP Gas is exported from Port MacKenzie to East Asian customers.
For Case 3.1.2, the wet gas pipeline is run from Prudhoe to Fairbanks and onto Big Lake including all necessary compressor stations. At Fairbanks, a spur with 60 MMSCFD of capacity feeds a Straddle Plant for meeting local dry gas requirements. The NGL extraction facility is located in the greater Big Lake area sufficiently close to the existing Beluga Pipeline so that the dry residual gas pipeline distance and interconnection cost is minimized. An NGL Product pipeline (12 inch) runs from Big Lake to Nikiski (180 miles). The Fractionation Facility is located at Nikiski. LP Gas is fractionated and exported from Nikiski to East Asian customers.
Based on the NGL Processing Facility siting analysis, the concept of locating the NGL Processing Facility at either the Big Lake or Dunbar area is technically feasible. However, based on the tidewater LPG export terminal analysis in Section 4 below, the default NGL Processing Facility location is Big Lake with the LPG fractionation and export terminal located at Nikiski.
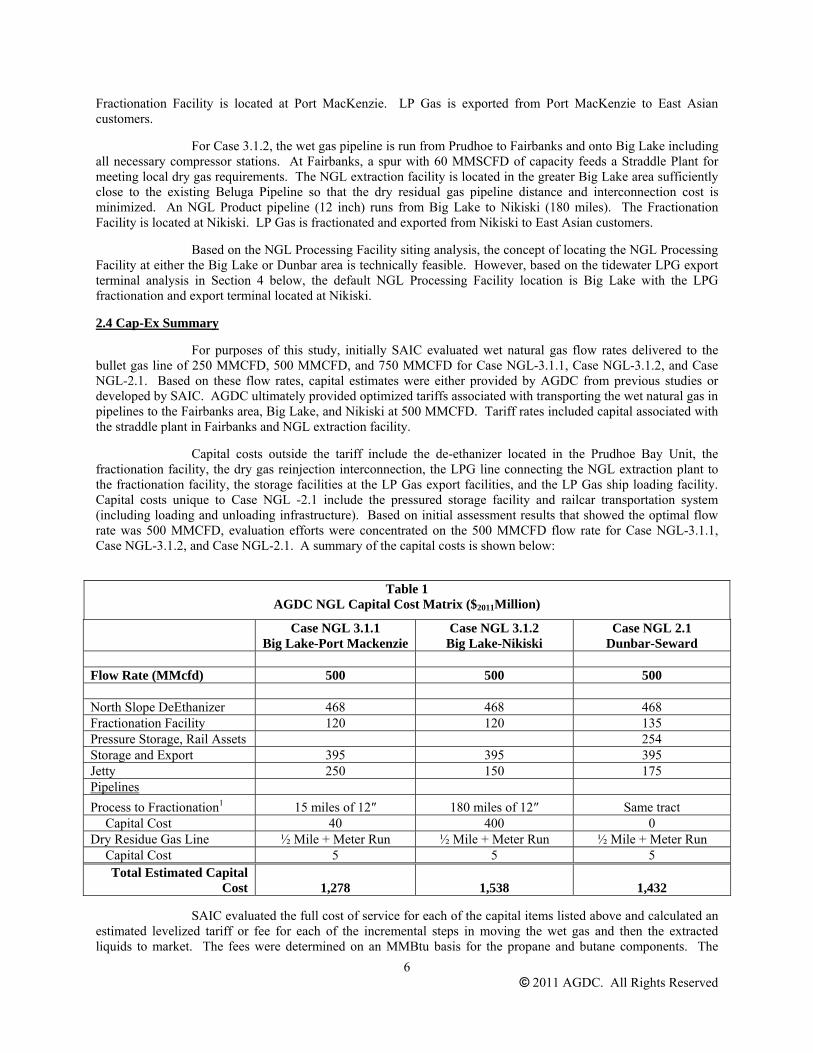
2.4 Cap-Ex Summary
For purposes of this study, initially SAIC evaluated wet natural gas flow rates delivered to the bullet gas line of 250 MMCFD, 500 MMCFD, and 750 MMCFD for Case NGL-3.1.1, Case NGL-3.1.2, and Case NGL-2.1. Based on these flow rates, capital estimates were either provided by AGDC from previous studies or developed by SAIC. AGDC ultimately provided optimized tariffs associated with transporting the wet natural gas in pipelines to the Fairbanks area, Big Lake, and Nikiski at 500 MMCFD. Tariff rates included capital associated with the straddle plant in Fairbanks and NGL extraction facility.
Capital costs outside the tariff include the de-ethanizer located in the Prudhoe Bay Unit, the fractionation facility, the dry gas reinjection interconnection, the LPG line connecting the NGL extraction plant to the fractionation facility, the storage facilities at the LP Gas export facilities, and the LP Gas ship loading facility. Capital costs unique to Case NGL -2.1 include the pressured storage facility and railcar transportation system (including loading and unloading infrastructure). Based on initial assessment results that showed the optimal flow rate was 500 MMCFD, evaluation efforts were concentrated on the 500 MMCFD flow rate for Case NGL-3.1.1, Case NGL-3.1.2, and Case NGL-2.1. A summary of the capital costs is shown below:
Table 1
AGDC NGL Capital Cost Matrix ($2011Million)
Case NGL 3.1.1
Big Lake-Port Mackenzie Case NGL 3.1.2
Big Lake-Nikiski Case NGL 2.1
Dunbar-Seward Flow Rate (MMcfd) 500 500 500 North Slope DeEthanizer 468 468 468 Fractionation Facility 120 120 135 Pressure Storage, Rail Assets 254 Storage and Export 395 395 395 Jetty 250 150 175 Pipelines Process to Fractionation1 15 miles of 12″ 180 miles of 12″ Same tract
Capital Cost 40 400 0 Dry Residue Gas Line ½ Mile + Meter Run ½ Mile + Meter Run ½ Mile + Meter Run
Capital Cost 5 5 5 Total Estimated Capital
Cost 1,278 1,538 1,432
SAIC evaluated the full cost of service for each of the capital items listed above and calculated an estimated levelized tariff or fee for each of the incremental steps in moving the wet gas and then the extracted liquids to market. The fees were determined on an MMBtu basis for the propane and butane components. The

7 © 2011 AGDC. All Rights Reserved
estimated levelized fee required calculating the following formulas for each of the 20 years of operations that was assumed to begin in July 2019, all as further explained in Section 8.2 of this report. The results of the fee analysis are shown in Table 2 for nominal values and Table 3 for values in $2011.
Table 2
NGL Levelized Fees (Nominal $/MMBtu Sold from North Slope)
Case NGL 3.1.1
Big Lake-Port Mackenzie Case NGL 3.1.2
Big Lake-Nikiski Case NGL 2.1
Dunbar-Seward Flow Rate (MMcfd) 500 500 500 North Slope Deethanizer 2.04 2.04 2.04 NGL Fractionation 0.64 0.64 0.72 NGL Storage at Fractionation, Railcar and Facility 0 0 4.20 Liquids pipeline, Storage, Ship Loading Facilities (Including Harbor Improvements) 3.48 4.78 2.90 System Fuel, Export G&A, Working Capital 0.92 1.00 0.74
Table 3
NGL Levelized Fees ($2011 /MMBtu Sold from North Slope)
Case NGL 3.1.1
Big Lake-Port Mackenzie Case NGL 3.1.2
Big Lake-Nikiski Case NGL 2.1
Dunbar-Seward Flow Rate (MMcfd) 500 500 500 North Slope Deethanizer 1.21 1.21 1.21 NGL Fractionation 0.38 0.38 0.43 NGL Storage at Fractionation, Railcar and Facility 0 0 2.51 Liquids pipeline, Storage, Ship Loading Facilities (Including Harbor Improvements) 2.07 2.86 1.73 System Fuel, Export G&A, Working Capital 0.54 0.59 0.43
Based on the estimates in Table 3, a net-back calculation was performed for each case at the 500 MMCFD flowrate to establish a value in $2011 per MMBtu for the LP Gas being exported, based on sales to the Korean market.
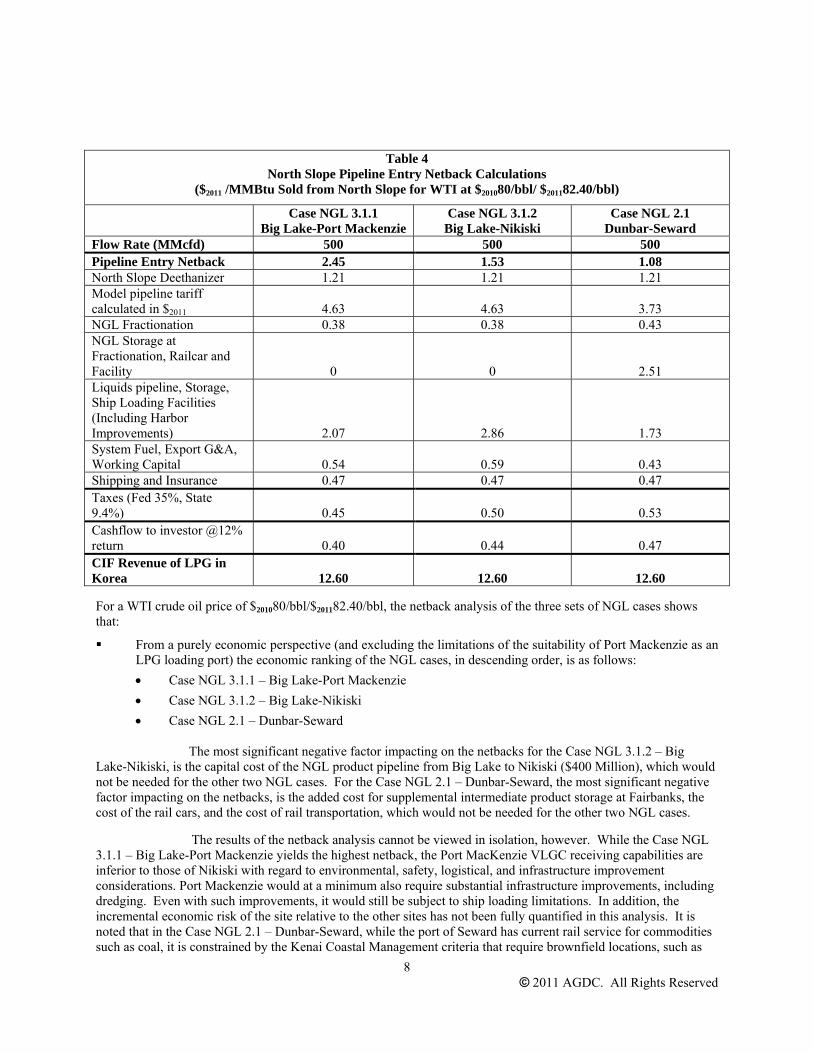
2.5 North Slope Pipeline Entry Netback Calculations
Table 4 presents the wellhead netback calculated from the Base Case Korea Propane CIF price projections for each of the cases and at the three referenced flow rates. The net back calculation utilizes tariffs supplied by AGDC for the three scenarios of Big Lake Extraction/Port MacKenzie export ($7.75 levelized nominal), Big Lake extraction/Nikiski export ($7.75 levelized nominal), and Fairbanks extraction/Port MacKenzie-Seward export ($6.25 levelized nominal) at the 500 MMSCFD gas flow rate. The tariff rates are employed on a Btu basis based on the heat content of the respective NGL stream and discounted to $2011 per the same methodology as the fee analysis in Table 3.
8 © 2011 AGDC. All Rights Reserved
Table 4
North Slope Pipeline Entry Netback Calculations ($2011 /MMBtu Sold from North Slope for WTI at $201080/bbl/ $201182.40/bbl)
Case NGL 3.1.1
Big Lake-Port Mackenzie Case NGL 3.1.2
Big Lake-Nikiski Case NGL 2.1
Dunbar-Seward Flow Rate (MMcfd) 500 500 500 Pipeline Entry Netback 2.45 1.53 1.08 North Slope Deethanizer 1.21 1.21 1.21 Model pipeline tariff calculated in $2011 4.63 4.63 3.73 NGL Fractionation 0.38 0.38 0.43 NGL Storage at Fractionation, Railcar and Facility 0 0 2.51 Liquids pipeline, Storage, Ship Loading Facilities (Including Harbor Improvements) 2.07 2.86 1.73 System Fuel, Export G&A, Working Capital 0.54 0.59 0.43 Shipping and Insurance 0.47 0.47 0.47 Taxes (Fed 35%, State 9.4%) 0.45 0.50 0.53 Cashflow to investor @12% return 0.40 0.44 0.47 CIF Revenue of LPG in Korea 12.60 12.60 12.60
For a WTI crude oil price of $201080/bbl/$201182.40/bbl, the netback analysis of the three sets of NGL cases shows that:
From a purely economic perspective (and excluding the limitations of the suitability of Port Mackenzie as an LPG loading port) the economic ranking of the NGL cases, in descending order, is as follows: • Case NGL 3.1.1 – Big Lake-Port Mackenzie • Case NGL 3.1.2 – Big Lake-Nikiski • Case NGL 2.1 – Dunbar-Seward
The most significant negative factor impacting on the netbacks for the Case NGL 3.1.2 – Big
Lake-Nikiski, is the capital cost of the NGL product pipeline from Big Lake to Nikiski ($400 Million), which would not be needed for the other two NGL cases. For the Case NGL 2.1 – Dunbar-Seward, the most significant negative factor impacting on the netbacks, is the added cost for supplemental intermediate product storage at Fairbanks, the cost of the rail cars, and the cost of rail transportation, which would not be needed for the other two NGL cases.
The results of the netback analysis cannot be viewed in isolation, however. While the Case NGL 3.1.1 – Big Lake-Port Mackenzie yields the highest netback, the Port MacKenzie VLGC receiving capabilities are inferior to those of Nikiski with regard to environmental, safety, logistical, and infrastructure improvement considerations. Port Mackenzie would at a minimum also require substantial infrastructure improvements, including dredging. Even with such improvements, it would still be subject to ship loading limitations. In addition, the incremental economic risk of the site relative to the other sites has not been fully quantified in this analysis. It is noted that in the Case NGL 2.1 – Dunbar-Seward, while the port of Seward has current rail service for commodities such as coal, it is constrained by the Kenai Coastal Management criteria that require brownfield locations, such as
9 © 2011 AGDC. All Rights Reserved
Nikiski, to be selected prior to greenfield location utilization. Nikiski, on the other hand, could theoretically begin receiving VLGC on a near term basis.
Based on these technical and logistical limitations, then, the NGL Case 3.1.2 – Big Lake-Nikiski, although second in the netback rankings, yields a positive North Slope netback for the pipeline flow rate of 500 MMCFD, and is, therefore, the preferred choice for the NGL extraction and loading facilities.
2.6 Conclusion
Alaskan LP Gas exports to the Asian Pacific Rim from the Cook Inlet area represent a potentially economically viable market for supporting increased pipeline demand for North Slope gas. The concept of NGL extraction at Big Lake with LP Gas fractination and export from Nikiski is both technically feasible and economically viable. Locating the tidewater terminal at either Port MacKenzie or Seward raises safety and environmental concerns. Higher pipeline tariffs, additional storage, and railroad transportation expenses render the option of locating the extraction and fractionation facilities at Dunbar unviable.
Based on this analysis, then, SAIC suggests that incorporating the export of LP Gas into the natural gas monetization plan, utilizing a configuration of an NGL extraction plant in the Big Lake area with a LP Gas fractionation and export loading port at Nikiski (Case NGL 3.1.2 – Big Lake-Nikiski), is potentially economically viable for crude oil prices at or above a WTI price of $201080/bbl/$201182.40/bbl.
10 © 2011 AGDC. All Rights Reserved
3.0 PACIFIC RIM MARKET FOR LP GAS
3.1 Objective
The objective of this Report is to determine the netback price of the extracted NGLs at the North Slope pipeline entry point for various Pacific Rim markets. To do so, it is important to determine what pricing can be expected for LP Gas products in the primary market countries and the competition for market share. The objective of this section is to explain how the market for LP Gas works in the Pacific Rim and to characterize and rank the various national markets. Our conclusions will identify which countries are the most likely destinations for Alaska exports of LP Gas, and what the resulting prices would be at the Alaskan Tidewater export point (“FOB Alaskan Tidewater”).
3.2 Overview of Pacific Rim Market
Primary Export Markets
The primary export markets for Alaska LP Gas that AGDC has selected for analysis are:
• Japan • South Korea • Taiwan • South China
Figure 2 shows the distances of the export markets from Alaska. These distances will be used from time to time in the analyses in the rest of the report to compute shipping costs and estimate FOB prices.

11 © 2011 AGDC. All Rights Reserved
Figure 2: Pacific Basin Shipping Distances
3.2.1 Products
To understand how the market for LP Gas works in the Pacific Rim, we will now discuss the products that are purchased, the size of the Asian market, and the competing production available to serve it.
There is considerable variability in the content of marketed products in the propane (C3) and butane (C4) groups. The leading association dedicated to propane and butane markets globally is the World LP Gas Association, which yearly updates the statistics of global propane and butane trade under the umbrella heading “LP Gas”. LP Gas is propane and butane produced both from the processing of natural gas (natural gas liquids or NGLs) production and from oil refinery operations (liquefied petroleum gases or LPGs).
The two sources of LP Gas (NGLs and LPGs) have somewhat different economic drivers and therefore it is important to be aware of their roles in making up the LP Gas markets. In 2008, global production of propane and butane (“LP Gas”) was approximately 52 percent from gas processing and 48 percent from oil refining. For this study, the five selected exporters of propane and butane into the Pacific basin trade produced approximately 80 percent of their production from gas processing (“NGL”s) in 2008. This percentage is expected to be greater than 90 percent with gas production and processing related to Russia’s Sakhalin II LNG project which started delivery to Japan in 2009. This dependence of propane and butane export availability on NGL extraction from economically stranded gas monetized by the LNG market is important in evaluating Alaska’s competitive export position in the Pacific Asia, for propane, butane, and LNG.
Alaska’s source of propane and butane is likewise tied to monetizing stranded liquids-rich gas no longer needed for Enhanced Oil Recovery (“EOR”) in the Prudhoe Bay Field. Its export availability is directly tied to its extraction value FOB Anchorage/Nikiski, entrained in LNG exports, and to its value entrained in a North Slope international export pipeline to Edmonton, Alberta.
12 © 2011 AGDC. All Rights Reserved
3.2.2 Consumption
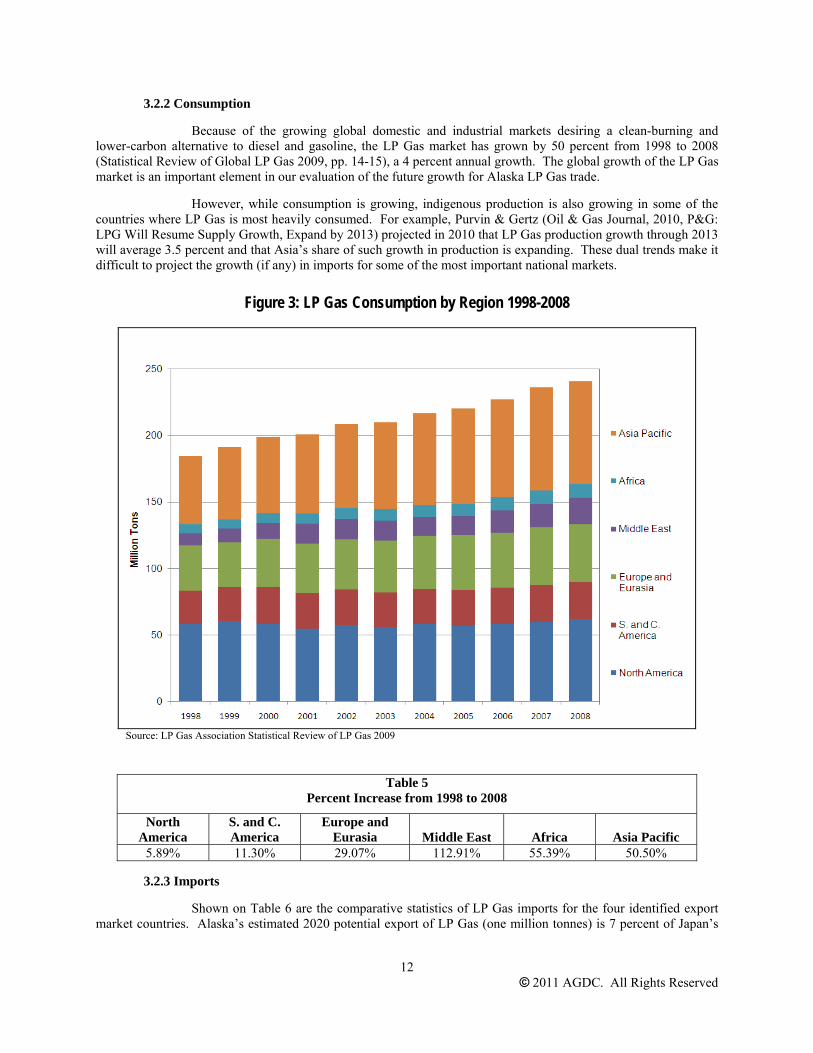
Because of the growing global domestic and industrial markets desiring a clean-burning and lower-carbon alternative to diesel and gasoline, the LP Gas market has grown by 50 percent from 1998 to 2008 (Statistical Review of Global LP Gas 2009, pp. 14-15), a 4 percent annual growth. The global growth of the LP Gas market is an important element in our evaluation of the future growth for Alaska LP Gas trade.
However, while consumption is growing, indigenous production is also growing in some of the countries where LP Gas is most heavily consumed. For example, Purvin & Gertz (Oil & Gas Journal, 2010, P&G: LPG Will Resume Supply Growth, Expand by 2013) projected in 2010 that LP Gas production growth through 2013 will average 3.5 percent and that Asia’s share of such growth in production is expanding. These dual trends make it difficult to project the growth (if any) in imports for some of the most important national markets.
Figure 3: LP Gas Consumption by Region 1998-2008
Source: LP Gas Association Statistical Review of LP Gas 2009
Table 5 Percent Increase from 1998 to 2008
North America
S. and C. America
Europe and Eurasia Middle East Africa Asia Pacific
5.89% 11.30% 29.07% 112.91% 55.39% 50.50%
3.2.3 Imports
Shown on Table 6 are the comparative statistics of LP Gas imports for the four identified export market countries. Alaska’s estimated 2020 potential export of LP Gas (one million tonnes) is 7 percent of Japan’s

13 © 2011 AGDC. All Rights Reserved
import market, 15 percent of South Korea’s imports, and more than 80 percent of Taiwan’s imports. The total 2020 market for the four countries is estimated at 25 million tonnes, of which Alaska’s projected export is 4 percent.
Table 6
Imports of LP Gas Into Targeted National Markets (2008 and estimated 2020) (Source: World LP Gas Statistical Review of Global LP Gas 2009, pp 8 -10),
Compared to Alaska Projected 2020 Exports
Country
1998 LP Gas Imports
(million tonnes)
2008 LP Gas imports (million tonnes)
Estimated 2020 LP Gas Imports
(million tonnes)
Alaska Estimated
2020 Exports, Percentage (3)
Japan(1) 14.20 14.30 14.30 7% South Korea (2) 2.43 5.40 6.85 15% Taiwan (2) 0.45 0.99 1.28 81% China (2) 1.17 2.60 3.30 32% Total 18.25 23.29 25.73 4% (1) Japan: estimated flat growth to 2020 based on 1998-2008 historical imports. (2) South Korea, Taiwan, and China: estimated 2% annual real growth based on 45% growth from 1998 to 2008 for
"Other Far East". Assume growth will dampen somewhat through 2020 as indigenous supplies are developed. (3) Assume "500 MMCFD Case" for Alaska production, yielding 2982 tonnes/day LP Gas, 350 days/year = 1,043,700
tonnes/year.
For these four market countries, for the past ten years, the source of supply has largely been the Middle East, supplying approximately 91 percent of Japan’s imports and 80 percent of “other Far East” (South Korea, Taiwan, and China). The Middle Eastern suppliers are Saudi Arabia, United Arab Emirates, Qatar, Oman, and Iran.
In 2020, the same Middle Eastern suppliers are likely to provide the majority of imports for the four targeted market nations. However, the Middle East during the next 12 years, especially Saudi Arabia and Qatar, will utilize more indigenous LP Gas for growing petrochemical industries and for gas-to-liquids, while Australia, and possibly Russia, will also likely become more prominent competitors for LP Gas imports to Japan and the other Far East importers.
3.2.4 Composition
For LP Gas, there is no standard composition bought and sold. The primary characteristic of LP Gas is its versatility to a wide variety of human needs for energy:
• Domestic (residential and commercial) • Agriculture (use within farmhouses) • Industry (gasworks, power generation, forklift trucks, fuel to chemical plants and solvent
fuel) • Transport (automotive engine fuel) • Refinery (includes LP Gas used as feedstock for oil refining processes such as alkylation) • Chemical (feedstock for olefins, MTBE, other chemical
To provide for this wide spectrum of uses, varieties of LP Gas bought and sold include products that are primarily propane, products that are primarily butane, and (primarily in the pressurized market) mixes including both propane C3H8 and butane C4H10. For pressurized sales, a typical mixture is 30 percent propane, 70 percent butane (the mixture specified for Platts LP Gaswire reports), but mixtures vary depending on the season — in winter more propane in summer more butane. The warmer the country, the higher the butane content, commonly 50/50, and sometimes reaching 75 percent butane. Furthermore, each market has its own specific requirements, depending upon the characterization of the intended use, whether for automotive use, home heating, or industrial processes.

14 © 2011 AGDC. All Rights Reserved
All LP Gas described in this section is shipped as separate product(s) and none as entrained natural gas or LNG. Within the world market for LP Gas, virtually all LP Gas is shipped separately and very little entrained in LNG.
LP Gas cannot simply be substituted for natural gas, because LP Gas has a higher calorific value (94 MJ/m3 equivalent to 26.1kWh/m³) than natural gas (methane) (38 MJ/m3 equivalent to 10.6 kWh/m3).
The compositions of propane and butane typical of world trade are shown on Table 7.
Table 7 Typical LP Gas Consumption and Relevant Conversion Factors Utilized in Global LP Gas Trade
Property Propane (C3H8) Butane (C4H10) Liquid Density 0.50-0.51 0.57-0.58 Gas Density/Air 1.40 – 1.55 1.90 – 2.10 Ratio Gas/Liquid 274 Vols 233 Vols Boiling Pt. deg C -45 -2 Latent Heat Vapn.(Kj/kg) 358 372 Specific Heat Liq. (Btu/deg) 0.60 0.57 Sulfur Content percent 0-0.02 0 – 0.02 Flammability Limit percent 2.2 – 10.0 1.8 – 9.0 Cal. Values
• Btu/ft3 2,500 3,270 • Btu/lb 21,500 21,200 • Kcal/kg 11,900 11,800 • Mj/kg 50.4 49.5
Minimum ignition temp. deg. C 460 410 Conversion Factor U.S. Gallons per tonne 521 458 Imperial gallons per tonne 433 381 Litres per tonne 1968 1732 Barrels per tonne 12.4 10.8 Therms per tonne 474 465 Tonnes per Cbm 0.582 0.600
Source: World LP Gas Association, 2009
3.2.5 Cargo Types
An authoritative public guide to the marketing standards and practices for LP Gas in the Pacific Basin is McGraw Hill’s Platts Specifications and Methodology Guide for Asian LPG, updated August, 2010. This guide contains the specifications of the data sets acquired for this study and analyzed later in this section. A brief summary of key parameters of the Asian LP Gas market as reflected in Platts’ assessments of propane and butane in LP GasWire follows.
Cargo type: large cargoes of butane and propane are transported in refrigerated tankers, while small cargoes are used to transport mixed LP Gas in pressurized ships. The prices quoted in this study are for refrigerated cargoes.
Prices: outright (fixed) and floating prices are quoted, with floating prices commonly based upon a premium or discount to the Saudi Aramco monthly export Contract Price (“CP”) for propane and butane.
Size of cargo: • Refrigerated propane and butane are sold stand alone, 11,000 tonne cargoes. • Refrigerated propane and butane are also sold combined in evenly split 22,000 tonne
cargoes.

15 © 2011 AGDC. All Rights Reserved
• Pressurized mixed cargoes of LP Gas are sold in various percentage combinations, but Platts considers 30 percent propane/70 percent butane typical.
Refrigerated delivery periods: assessments are in three half-month cycles. • 30-45 days forward • 45-60 days forward • 60-75 days forward • The half months begin on the first business day of the new month (H1), and on the first
business day after the 15th (H2)
Refrigerated Loading Periods: 20-40 days after the date of assessment.
Refrigerated freight rates: three routes are assessed ($/tonne) for shipping in Very Large Gas Carriers (VLGCs) typically carrying 44,000 tonne of LP Gas in segregated butane and propane tanks (two each, 11,000 tonne each).
• Persian Gulf (Ras Tanura) to Japan (Chiba) • Persian Gulf to South China (Guangzhou/Shenzhen) • Persian Gulf to East China (Shanghai)
Pressurized freight rates: five routes are assessed ($/tonne) for small tankers carrying between 1,000 tonne and 3,000 tonne of mixed LP Gas.
• Thailand (Map T Phut) to port of Guangzhou • Thailand to port of Guanxi • Thailand to port of Shantou • Japan (Chiba) to port of Shanghai • Korea (Ulsan/Onsan) to port of Shanghai
Table 8
Geographic Points for LP Gas Markets(1)
Product Export Point Delivery Point Refrigerated
FOB AG
Ras Tanura, Saudi Arabia; Yanbu, Saudi Arabia; any safe port, Qatar
CFR Singapore-Japan Ports from Singapore to Japan C+F Japan Kashima, Yokkaichi, and Oita C+F Korea Yeosu and Ulsan
C+F South China/Taiwan
Import terminals and floating storage vessels off Shenzhen, Zhuhai, Shantou, Mai Lio and Kaohsiung
Pressurized
C+F South China Storage terminals including Shenzhen, Zhuhai, Xiamen and Shantou
C+F East China Storage terminals including Shanghai, Ningbo and Nantong
(1) Platts prices are quoted C+F (Commodity Plus Freight). For this study, prices are required to be equivalent to CIF (Commodity Insurance Freight) to allow for direct comparison. We have increased C+F prices by 15% to include insurance costs so that the resulting costs are equivalent to CIF.
Source: Platts, Methodology and Specifications Guide, Asian LPG
China is a large producer of domestic LP Gas, and sales of Chinese LP Gas are assessed by Platts: • Waterborne: ex-refinery or ex-tank terminal into coastal vessels • Ex-truck, from the product terminals and refineries into trucks

16 © 2011 AGDC. All Rights Reserved
• Ex-barge
• At the refinery o South China – Guangzhou and Maoming o East China – Zhenhai, Shanghai, Gaoqiao, Jinling, Yangzi, Fujian o North China – Qingdao, Tianjin, Yanshan, Dagang, Cangzhou, Huabei
• Grades of LP Gas o Domestic refinery grade meeting Chinese LP Gas standards; domestic grade is
typically 10/90 propane/butane o Import grade meeting Saudi Aramco’s specifications for propane and butane;
typically 50/50 propane/butane in South China, and 70:30 propane/butane in East China
Figure 4 shows these locations.
Figure 4: Locations in China at Which LP Gas Prices are Assessed by Platts LP Gaswire
Shown on Figure 5 are the comparative statistics of LP Gas consumption for the four identified exported market countries, and for the U.S. and Canada for comparison. Consumption for each country is partially met by indigenous production, and the net requirement – imports – will be discussed below and in the sections devoted to each country.

17 © 2011 AGDC. All Rights Reserved
Figure 5: Total Annual LP Gas Consumption 2003-2008
Source: Statistical Review of Global LP Gas 2009, World LP Gas Association
3.2.6 Global Trade in Ethane
Propane and butane are the primary NGL components traded globally, but global trade in ethane is growing, primarily intra-regionally in the Middle East and North America. Growth of ethane demand is related to growth of the ethylene industry, since ethane is not used in the residential and commercial markets. Ethane is not ordinarily transported in ships from one region to another. Factors are the high cost of cryogenic shipping in ethane tankers, the limited petrochemical market, and because the regions with a petrochemical market are largely propane and butane producers from the processing of natural gas liquids (NGLS) (Middle East, U.S., Canada, China). Therefore, the very small amount of ethane that would be produced in Alaska would likely stay in Alaska.
A global liquefied ethane market has not emerged to any significant extent. Bulk marine transportation of ethane requires cryogenic vessels because of the high vapor pressure of ethane under ambient conditions. It is also noted that conventional LNG carriers cannot generally be used for to ship ethane because the higher density of ethane compared with LNG makes LNG carriers unsuitable for the purpose. Because of the logistical difficulties and the relatively small volumes of ethane being contemplated for the ASAP Project, a detailed analysis of potential export markets for Alaskan ethane has not been conducted pursuant to this study.
3.3 Demand
3.3.1 Japan
Japan is the largest importer of LP Gas among the four-country study group, importing approximately 14.3 million tons in 2008. In 2020, we project that the import volume will have remained flat and that approximately the same amount will be imported as in 2008.
Japan (Figure 6) is only 16 percent energy self sufficient. It is world’s largest importer of coal and LNG, and second largest net importer of crude oil, as well as being the world’s third largest oil consumer. Japan is the second largest LP Gas consumer in northeast Asia, and the world’s largest LP Gas importer (Otto, Ken, Purvin & Gertz, Global LPG Market Outlook, 2009, World LP Gas Association).

18 © 2011 AGDC. All Rights Reserved
Figure 6: Japan
http://www.eia.doe.gov/cabs/Japan/Background.html
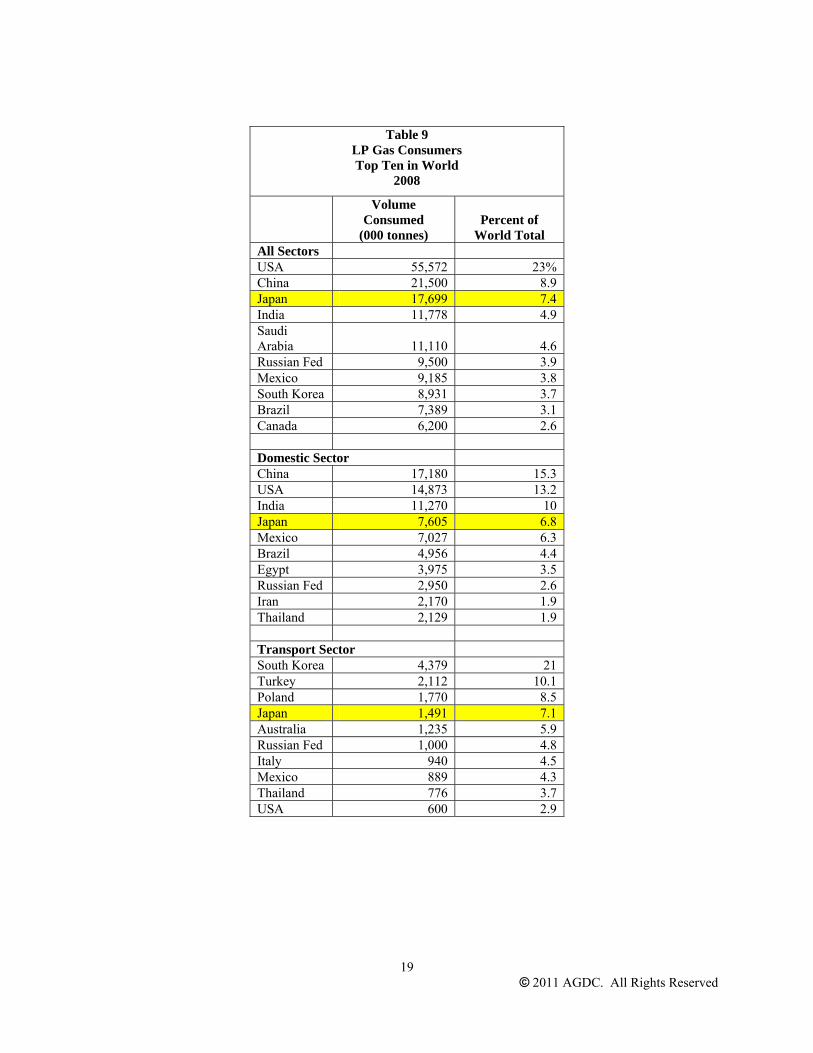
In 2008 (latest data year analyzed), Japan is the third top consumer of LP Gas (all sectors), fourth consumer in the domestic sector, and fourth in the transport sector. For all sector consumption, Japan’s consumption is 7.4 percent of the global total.
19 © 2011 AGDC. All Rights Reserved
Table 9 LP Gas Consumers Top Ten in World
2008
Volume Consumed
(000 tonnes) Percent of
World Total All Sectors USA 55,572 23% China 21,500 8.9 Japan 17,699 7.4 India 11,778 4.9 Saudi Arabia 11,110 4.6 Russian Fed 9,500 3.9 Mexico 9,185 3.8 South Korea 8,931 3.7 Brazil 7,389 3.1 Canada 6,200 2.6 Domestic Sector China 17,180 15.3 USA 14,873 13.2 India 11,270 10 Japan 7,605 6.8 Mexico 7,027 6.3 Brazil 4,956 4.4 Egypt 3,975 3.5 Russian Fed 2,950 2.6 Iran 2,170 1.9 Thailand 2,129 1.9 Transport Sector South Korea 4,379 21 Turkey 2,112 10.1 Poland 1,770 8.5 Japan 1,491 7.1 Australia 1,235 5.9 Russian Fed 1,000 4.8 Italy 940 4.5 Mexico 889 4.3 Thailand 776 3.7 USA 600 2.9

20 © 2011 AGDC. All Rights Reserved
Japan’s 2008 consumption (in 000 tonnes) of LP Gas was dominated by domestic use (43 percent of total):
Domestic Use 7605 43 percent
Agriculture 0 0 percent
Industry 5371 30 percent
Chemical 3232 18 percent
Transport 1491 8 percent
Total 17699 100 percent
Japan’s large chemical industry has the flexibility to use LP Gas in place of naphtha when the differential between expensive naphtha and cheaper LP becomes large enough. On January 10-11, 2011, for example, CFR prices of butane fell to $854/tonne, $3/tonne lower than Platts’ MOPJ naphtha February swaps assessment of $857/tonne; however that differential was not large enough to induce switching from naphtha to butane. Petrochemical producers normally consider a 10 percent discount (butane to naphtha) or a $50/tonne differential necessary to maximize LP Gas cracking instead of naphtha.
Since 1998, Japan’s consumption of LP Gas has been essentially flat, declining in 2008, and down by 1 million tonnes since 2000, reflecting its very mature developed economy which has struggled to achieve growth in recent decades.
Figure 7: Japan – Total Annual Historical Consumption of LP Gas
Source: 2009 Statistical Review of Global LP Gas
Japan has 4570 thousand tonnes of LP Gas storage terminal capacity, including 2525 thousand tonnes for propane and 2045 thousand tonnes for butane, the highest known terminal capacity for LP Gas in Asia. Japan imports the vast majority of its LP Gas from the Middle East.

21 © 2011 AGDC. All Rights Reserved
Figure 8: Japan – Total Annual LP Gas Imports, Regions of Origin
Source: 2009 Statistical Review of Global LP Gas
Japan produces some LP Gas from refinery and gas processing operations, as shown on Table 10.
Table 10 Availability of LP Gas for Local
Markets 2008 Japan, Total Annual Production
(000 tonnes)
Production Refinery 4,133
Gas Processing 335
Total 4,468 Imports 13,723 Exports 142 Consumption 17,699
Source: 2009 Statistical Review of Global LP Gas

22 © 2011 AGDC. All Rights Reserved
Table 11
Examples of Recent Contracts Involving Japan LP Gas Buyers
Date Seller Buyer Price Terms Volume Delivery
January 12, 2011
European trader
Japanese Trader
$3-4/tonne premium to Argus February Far East Index
22,000 tonnes evenly split LP Gas, refrigerated
H2 February, 2011
January 10, 2011 Various Various
Propane $864/tonne; butane $854/tonne
CFR Singapore-Japan, not specified Not specified
January Not specified
Itochu and Vitol
$12 premium to Saudi Aramco’s Feb CP for H1, and $13 for H2 22,000 propane
February (H1 and H2)
Source: Platts LP Gaswire
3.3.2 South Korea
South Korea’s forecasted imports of LP Gas of 6.85 million tonnes are approximately 50 percent of Japan’s estimated imports in 2020, but approximately twice the size of China’s imports.
Figure 9: South Korea
Source: http://www.eia.doe.gov/cabs/South_Korea/Full.html
South Korea has no international oil or natural gas pipelines, and relies exclusively on tanker shipments of LNG and crude oil. Korea is one of the top energy importers in the world. The country is the fifth largest importer of crude oil and the second largest importer of both coal and liquefied natural gas (LNG). South Korea has an advanced system of oil refineries.
Tables 12 and 13 locate South Korea within the top ten world LP Gas consumers and show that a significant portion of the country’s LP Gas is produced from its refinery sector.

23 © 2011 AGDC. All Rights Reserved
Table 12
LP Gas Consumers Top Ten in World
2008
All Sectors
Volume Consumed
(000 tonnes) Percent of
World Total USA 55,572 23% China 21,500 8.9% Japan 17,699 7.4% India 11,778 4.9% Saudi Arabia 11,110 4.6% Russian Fed 9,500 3.9% Mexico 9,185 3.8% South Korea 8,931 3.7% Brazil 7,389 3.1% Canada 6,200 2.6%
Transport Sector South Korea 4,379 21% Turkey 2,112 10.1% Poland 1,770 8.5% Japan 1,491 7.1% Australia 1,235 5.9% Russian Fed 1,000 4.8% Italy 940 4.5% Mexico 889 4.3% Thailand 776 3.7% USA 600 2.9%
Source: LP Gas Association Statistical Review of LP Gas 2009
Table 13 Availability of LP Gas for Local Markets
2008 (000 tonnes)
Production Refinery 3581 Gas Processing 0 Total 3581 Imports 5448 Exports 98 Consumption 8931
Source: LP Gas Association Statistical Review of LP Gas 2009
South Korea has a total of 1340 thousand tonnes of LP Gas storage capacity, of which 845 are for propane and 495 are for butane.
South Korea’s LP Gas consumption rose more than 50 percent between 1998 and 2008 (Figure 10).

24 © 2011 AGDC. All Rights Reserved

25 © 2011 AGDC. All Rights Reserved
Figure 10: South Korea – Total Annual LP Gas Consumption, 1998-2008
Source: LP Gas Association Statistical Review of LP Gas 2009
LP Gas consumption (thousand tonnes) increases are driven by South Korea world leadership in use of LP Gas for transportation, as well as an advanced chemical sector. For 2008, the transportation sector accounted for nearly 50 percent of South Korea LP Gas consumption.
• Domestic 1679 19 percent • Agriculture 0 0 • Industry 828 9 percent • Transport 4379 49 percent • Chemical 2045 23 percent • Total 8931 100 percent
A major driver of demand for South Korea is clearly growth of the transportation sector. A fundamental underlying driver of all energy demand in South Korea is the geopolitical future of the Korean Peninsula. Should reunification with desperately poor North Korea take place in the future, energy growth could accelerate if free market reforms are instituted.
South Korea also has a substantial petrochemical industry, of which an example is the Yeochun Naptha Cracking Center. This Center is able to produce 578,000 tonnes/ year of ethylene and 270,000 tonnes/year of propylene from naphtha supplemented with LP Gas (LPGas Wire January 18, 2011).
A January 16 contract between Petredec (one of world largest LP Gas traders) sold to Vitol 22,000 MT of propane for H2 February at a premium of $14/tonne to Saudi Aramco’s Feb LP Gas Contract price. This deal was evidence of a renewed price upswing in the spot physical market.
Another driver of LP Gas development in South Korea is the development of its new oil trading hub on its southern industrial coast (Platts LP Gaswire, January 7, 2011). South Korea’s current capacity to storage crude oil and refined products is 146 million barrels across nine storage facilities owned by KNOC (Korea National Oil Corp.), all of which is dedicated to national security. Of the total capacity, 127.5 million barrels is for crude oil, 14.1 million barrels is for refined products, and 4.4 million barrels is for LP Gas. So the new oil hub will be for

26 © 2011 AGDC. All Rights Reserved
trading, intended to initiate competition with Singapore, which government officials freely admit is far ahead of Korea.
The first phase of the oil hub plan began construction in October 2010 of an 8.9 million-barrel storage facility in Yeosu, home of GS Caltex (South Korea’s second largest refiner). This facility will open in 2012. Top refiners SK Energy and GS Caltex hold 11 percent stake (each) in this facility. The second phase involves a second facility of potentially 28 million barrels in Ulsan, home of SK Energy and the petrochemical industry. It will kick off in 2011. The hub as a whole will have a total storage capacity of 36.9 million barrels (Singapore has 135 million barrels capacity). It is uncertain how much of this capacity will be dedicated to LP Gas, but with transportation in South Korea such a growth industry for LP Gas, it can be assumed that some LP Gas capacity will be included.
Another driver of LP Gas development is evident in the reports about the new oil hub. South Korea struggles to compete with Singapore on tax policy. Singapore offers a free trade environment while South Korea has a crude oil and refined products import tax.
In late December, South Korea’s finance ministry announced changes for 2011 to the nation’s tariffs on crude oil, refined products and LP Gas.
• For crude oil imports, the tariff will remain at 3 percent • For naphtha imports, the tariff will be removed • For LP G and LNG, the tariff will be cut from 3 percent to 2 percent • For imported gasoline, diesel, kerosene and heavy fuel oil will be reduced to 3 percent
from 5 percent in 2010
3.3.3 Taiwan
Taiwan’s 2008 imports were 0.99 million tonnes and for 2020 they are estimated at 1.28 million tonnes. These volumes are the smallest of any of the four targeted LP Gas importers, and Alaska’s projected exports represents approximately 81 percent of Taiwan’s imported requirements.
Figure 11: Taiwan

27 © 2011 AGDC. All Rights Reserved
Source: EIA
Figure 12 below shows Taiwan’s consumption since 1998, compared to the consumption of the other countries we discuss in this section (Japan, South Korea, and China)
Figure 12: Annual Consumption of LP Gas 1998-2008
Source: LP Gas Association Statistical Review of LP Gas 2009

28 © 2011 AGDC. All Rights Reserved
In 2008, Taiwan produced 1564 thousand tonnes of LP Gas from refineries and exported 296 thousand tonnes:
• Produced from refineries: 1564 • Gas processing: 0 • Subtotal 1564 • Imports: 990 • Exports: 296 • Consumption: 2270
This total 2008 consumption (in thousand tonnes) of LP Gas comes primarily from the domestic and chemical sectors:
• Domestic: 1098 (48 percent) • Agriculture: 0 (0 percent) • Industry: 226 (10 percent) • Transport: 65 (3 percent) • Refinery: 0 (0 percent) • Chemical: 881 (39 percent) • Total 2270 (100 percent)
Taiwan has a total of 220 thousand tonnes of LP Gas storage capacity, of which 120 thousand tonnes are known to be dedicated to propane and 90 thousand tonnes to butane. This total capacity is just 16 percent of South Korea’s storage capacity, 5 percent of Japan’s, and 20 percent of China’s.
The LP Gas market in Taiwan, and Asia generally, is at times seriously oversupplied. The LP Gas market in Taiwan and in Asia generally was experiencing an oversupply in January leading to prices for LP Gas so low that Taiwan’s producer/refiner CPC had to cancel late December and early January tenders for pressurized product twice (LP Gaswire January 6, 10, 11) when offers failed to meet targets for price or loading date. The tender involved 2,000 tonnes of LP Gas (5 percent operational tolerance), comprising 30 percent propane and the rest butane. Bidders wanted to load the cargo in H1 February and offered prices based on February CP Saudi Aramco. CPC wanted to load in H2 January from Kaohsiung.
In October, 2010, CPC sold 2,000 tonnes of pressurized LP Gas loaded from Kaohsiung over October 11-25 at a premium of $30/tonne to Saudi Aramco’s October LP Gas CP. In November and December, CPC sold no pressurized LP Gas, choosing to divert production to the domestic market for cooking fuel and cracker feedstock.
Some analysts attributed the oversupply to “Chinese refiners exporting (LP Gas) to take advantage of the more than $100/tonne difference between domestic and international process for LP Gas, and this has pushed up supply.” The risk of the Taiwan market for international sales is that the far larger Chinese and Japanese markets create price swings and oversupply situations that impact Taiwan buyers and sellers.
Another transaction involved Taiwan’s Formosa Petrochemical (LP Gaswire December 20, 2010), which sold 1,500-2,000 tonne of pressurized LP Gas, with a propane-butane mix between 20:80 and 30:70. The cargo was transacted to load January 16-31 (H2) from Mailiao. A similar transaction for H2 December sold at a premium of approximately $35/tonne to Saudi Aramco’s December LP Gas Contract Price.
3.3.4 China
China’s 2008 imports of LP Gas were 2.6 million tonnes and for 2020 they are estimated at 3.30 million tonnes.

29 © 2011 AGDC. All Rights Reserved
Figure 13: Map of China (See also Figure 4)
Source: EIA
China is by far the largest producer of LP Gas in the Asia Pacific and the third largest in the world (after the U.S and Saudi Arabia, see Supply section). China is also by far the largest consumer in the Asia Pacific and second largest consumer of LP Gas in the world (all sectors, second after U.S.). China also leads the world in LP Gas consumption in the domestic sector, but does not take a place in the top ten in consumption of LP Gas for transport.
Table 14 Top Five Producers of LP Gas in the World
Volume (000 tonnes) Share of Global Total USA 46,807 19.4% Saudi Arabia 23,275 9.6% China 18,598 7.7% Russian Fed 10,900 4.5% Canada 9,605 4.5% Source: 2009 Statistical Review of Global LP Gas
As of 2008, all of China’s LP Gas production was reported to come from the domestic refinery sector (IHS, SRI Consulting, August 2009).
Table 15 Top Five Consumers of LP Gas in the World
All Sectors
Volume (000 tonnes) Share of Global Total USA 55,572 23.1% China 21,500 8.9% Japan 17,699 7.4% India 11,778 4.9% Saudi Arabia 11,110 4.6%
Table 16
Top Five Consumers

30 © 2011 AGDC. All Rights Reserved
Domestic Sector
Volume (000 tonnes) Share of Global Total China 17,180 15.3% USA 14.873 13.2% India 11,270 10.0% Japan 7,605 6.8% Mexico 7,027
Source: 2009 Statistical Review of Global LP Gas
31 © 2011 AGDC. All Rights Reserved
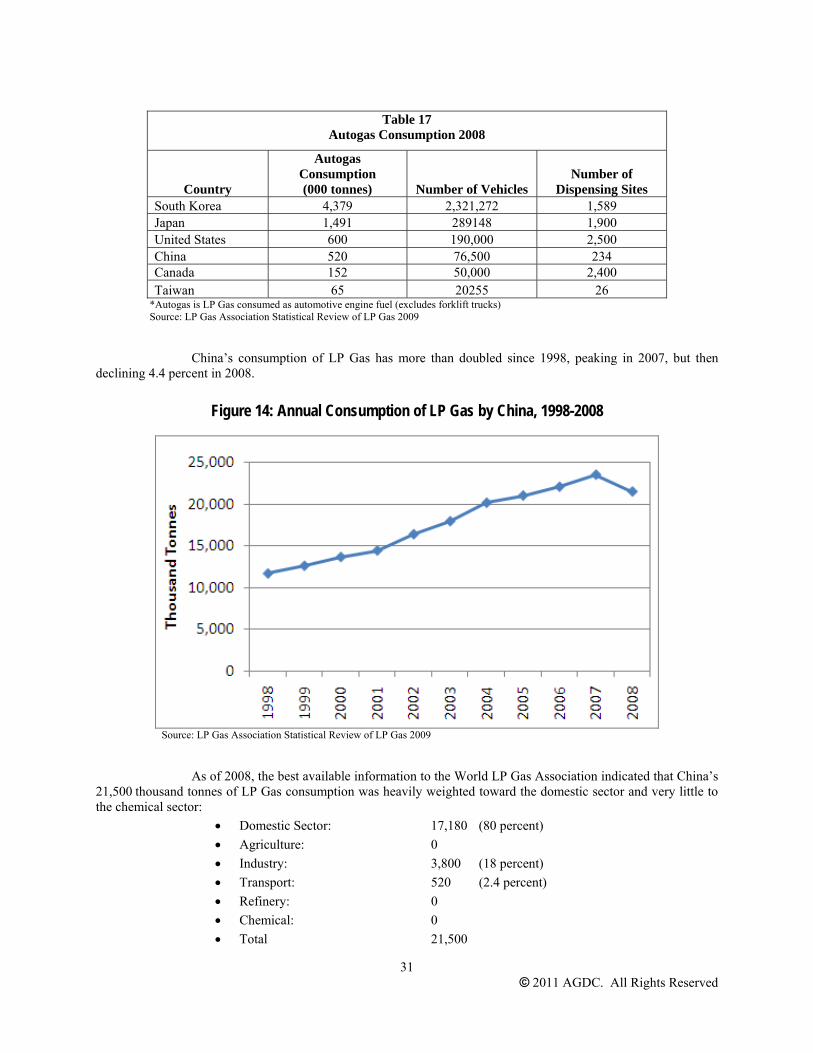
Table 17
Autogas Consumption 2008
Country
Autogas Consumption (000 tonnes) Number of Vehicles
Number of Dispensing Sites
South Korea 4,379 2,321,272 1,589 Japan 1,491 289148 1,900 United States 600 190,000 2,500 China 520 76,500 234 Canada 152 50,000 2,400 Taiwan 65 20255 26
*Autogas is LP Gas consumed as automotive engine fuel (excludes forklift trucks) Source: LP Gas Association Statistical Review of LP Gas 2009
China’s consumption of LP Gas has more than doubled since 1998, peaking in 2007, but then declining 4.4 percent in 2008.
Figure 14: Annual Consumption of LP Gas by China, 1998-2008
Source: LP Gas Association Statistical Review of LP Gas 2009
As of 2008, the best available information to the World LP Gas Association indicated that China’s 21,500 thousand tonnes of LP Gas consumption was heavily weighted toward the domestic sector and very little to the chemical sector:
• Domestic Sector: 17,180 (80 percent) • Agriculture: 0 • Industry: 3,800 (18 percent) • Transport: 520 (2.4 percent) • Refinery: 0 • Chemical: 0 • Total 21,500

32 © 2011 AGDC. All Rights Reserved
China does not make available much information about the disposition of its 1040 thousand tons of LP Gas storage capacity. The World LP Gas Association did not report on an allocation between propane and butane for this estimated capacity. If 1,040 thousand tons is the volume of Chinese capacity, such a volume would be only 25 percent of Japan’s capacity as well as being less than South Korea’s capacity by several hundred thousand tons (World LP Gas, 2009, Page 12).
Some specific transactions reported in Platts LP GasWire involving China LP Gas include the following:
• Refrigerated: A 10,000 tonne evenly split cargo for end-January delivery into South China was heard traded in a low single digit premium to February Argus Far East Index, on the same day that 22,000 tonne of evenly split LP Gas was traded to a Japanese trader for H2 February at $3-4/MT to the same index (January 13, 2011).
• Pressurized: As of December 22, 2010, Chinese refiners were exporting LP Gas to take advantage of more than 100MT of differential between domestic and international prices, pushing up global supply.
A very significant driver of LP Gas supply and demand relationships is the new supply of crude oil that is now beginning to flow (as of January, 2011) from Russia to China via a new pipeline. On January 1, Russia officially began delivering commercial supply of its ESPO crude oil (East Siberia-Pacific Ocean pipeline), pursuant to a February 2009 agreement between Rosneft, Transneft, and state-owned China National Petroleum Corp. and China Development Bank. The agreement provides for Rosneft to supply 15 million MT/year (300,000 b/d)of crude oil over 20 years starting in 2011 (LP GasWire January 4, 2011), in return for 20-year loans to Rosneft and Transneft of $15 billion and $10 billion respectively. Construction of the 300,000 b/d lateral pipeline to Daqing was completed in September 2010. The oil will be delivered to Liaoning Refinery, the Dalian refinery and the Fushun refinery will process the crude. Platts reports that an assay obtained by Platts yields 20 percent gasoil, 13.44 percent kerosene, 13.87 percent naphtha, and 0.65 percent LP Gas, with residual fuel making up the remainder.
The residential/commercial fuel sector growth will continue to drive Chinese demand for LP Gas , but growth of the petrochemical industry in the future, and any initiative to use LP Gas for automotive fuel would add demand growth in the future, given the enormous potential market for those activities in China.
3.4 Supply
3.4.1 Overview
Figure 15 illustrates 2008 world LP Gas sourcing by continent/major region. The only net exporter regions (negative net imports) are the Middle East and Africa.

33 © 2011 AGDC. All Rights Reserved
Figure 15: 2008 LP Gas Sources
Source: 2009 Statistical Review of Global LP Gas, World LP Gas Association and MCH Oil & Gas Consultancy
Table 18 shows the top 2008 LP Gas exporter countries from each of the major global geographical regions. The Middle East region has the greatest export volumes with its five key suppliers (Saudi Arabia, United Arab Emirates, Qatar, Oman and Iran).

34 © 2011 AGDC. All Rights Reserved
Table 18
2008 LP Gas - Top Exporting Nations and Regional Export Totals (thousand tonnes)
Export Volume (thousand
tonnes) % of Regional
Total USA 1,719 17.6% Canada 4,112 42.2% Other North and South America 3,916 40.2%
Total Americas 9,747 100.0%
Saudi Arabia 12,300 39.5% United Arab Emirates 6,895 22.1% Qatar 5,000 16.1% Oman 3,500 11.2% Iran 3,150 10.1% Other Middle East 301 1.0%
Total Middle East 31,146 100.0% Australia 1,291 26.5% Timor Leste 1,200 24.6% Indonesia 550 11.3% Other Asia Pacific 1,828 37.5%
Total Asia Pacific 4,869 100.0% Norway 5,250 29.5% United Kingdom 3,112 17.5% Russia 1,400 7.9% France 1,340 7.5% Other Europe and Eurasia 6,703 37.6%
Total Europe and Eurasia 17,805 100.0% Algeria 6,275 60.5% Nigeria 2,120 20.5% Angola 1,430 13.8% Other Africa 541 5.2%
Total Africa 10,366 100.0% Source: 2009 Statistical Review of Global LP Gas, World LP Gas Association and MCH Oil & Gas Consultancy
Table 19 lists the estimated 2008 LP Gas exports to the Pacific Rim by source country. The individual exporter country estimates of how much of their respective LP Gas exports go to the Far East region (and where within the Far East region) is based on limited data. See Table 19 footnotes for further information.

35 © 2011 AGDC. All Rights Reserved
Table 19
Estimated 2008 LP Gas Exports to Pacific Rim (thousand tonnes)
Estimated Exports To: Estimated Exports To Far East
Total Global
Exports Far East Other Global
Regions Japan Other Far East
Countries Saudi Arabia (1) 12,300 8,610 3,690 4,736 3,875 United Arab Emirates (2) 6,895 5,723 1,172 3,033 2,690 Qatar (2) 5,000 4,150 850 2,200 1,951 Oman (2) 3,500 2,905 595 1,540 1,365 Iran (2) 3,150 2,615 536 1,386 1,229 Other Middle East (2) 301 250 51 132 117
Total Middle East 31,146 24,252 6,894 13,026 11,226
Australia (3) 1,291 1,097 0 329 768 Timor Leste (3) 1,200 1,020 0 306 714 Indonesia (3) 550 468 0 140 327 Other Asia Pacific (3) 1,828 1,554 0 466 1,088
Total Asia Pacific 3,041 4,139 0 1,242 2,897 Total Exports to Far East 28,391 Russia (4) 1,400 0 1,400 0 0 (1) Assumed approximately 70% of Saudi Arabia total exports to Far East (p.11 of source document), approximately 50% of Middle East exports to
Far East go to Japan (p.10 of source document). (2) Assumed approximately 85% of non-Saudi Arabia total exports to Far East (p.11 of source document), approximately 50% of Middle East
exports to Far East go to Japan (p.10 of source document) - assumed same allocation for all non-Saudi Arabia Middle Eastern exporters. (3) Assumed approximately 85% of Far East countries' total exports to Far East (p.11 of source document), approximately 30% of these Far East
exports to Japan (p.10 of source document) - assumed same allocation for all Far East exporters. (4) Sakhalin Island II began LNG exports in 2009.
Source: 2009 Statistical Review of Global LP Gas, World LP Gas Association and MCH Oil & Gas Consultancy
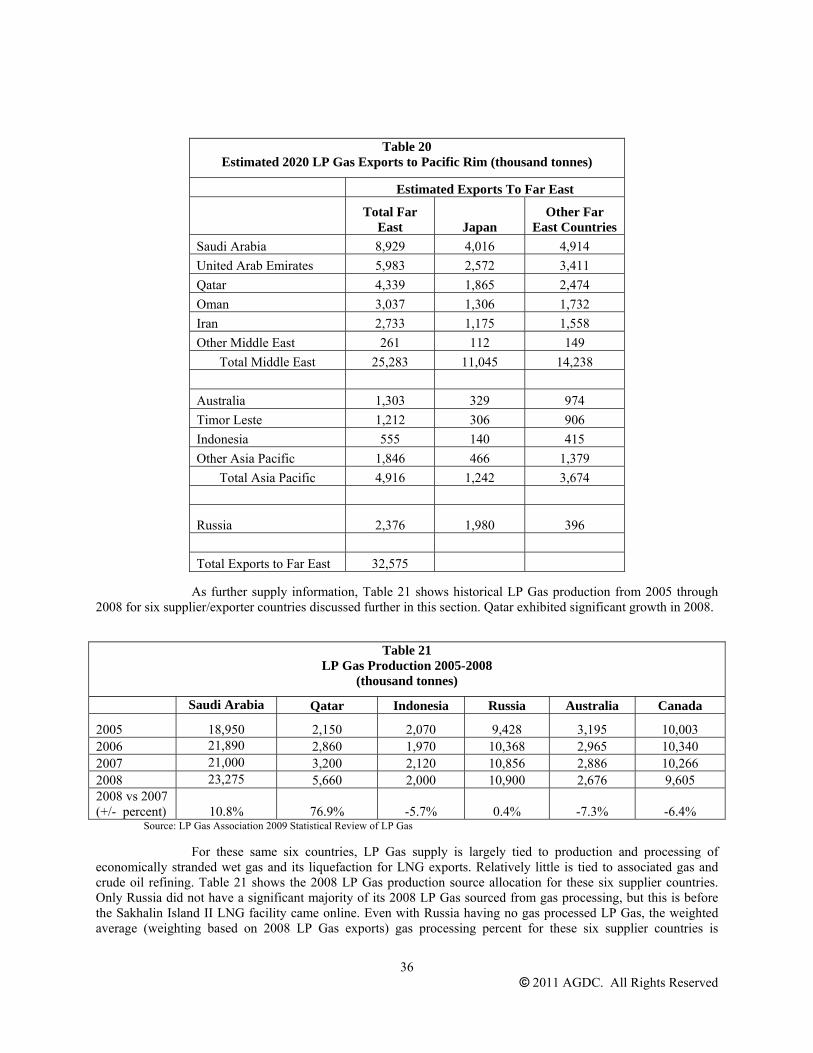
Table 20 shows SAIC’s estimated 2020 LP Gas exports to the Pacific Rim by source country. Total exports to Japan are projected to remain constant with 2008 levels with Russia displacing some Middle East export volumes to Japan. Export volumes to other Far East countries are projected to grow at an average annual 2 percent growth rate between 2008 and 2020.
36 © 2011 AGDC. All Rights Reserved
Table 20 Estimated 2020 LP Gas Exports to Pacific Rim (thousand tonnes)
Estimated Exports To Far East
Total Far
East Japan Other Far
East Countries Saudi Arabia 8,929 4,016 4,914 United Arab Emirates 5,983 2,572 3,411 Qatar 4,339 1,865 2,474 Oman 3,037 1,306 1,732 Iran 2,733 1,175 1,558 Other Middle East 261 112 149
Total Middle East 25,283 11,045 14,238
Australia 1,303 329 974 Timor Leste 1,212 306 906 Indonesia 555 140 415 Other Asia Pacific 1,846 466 1,379
Total Asia Pacific 4,916 1,242 3,674
Russia 2,376 1,980 396 Total Exports to Far East 32,575
As further supply information, Table 21 shows historical LP Gas production from 2005 through 2008 for six supplier/exporter countries discussed further in this section. Qatar exhibited significant growth in 2008.
Table 21
LP Gas Production 2005-2008 (thousand tonnes)
Saudi Arabia Qatar Indonesia Russia Australia Canada
2005 18,950 2,150 2,070 9,428 3,195 10,003 2006 21,890 2,860 1,970 10,368 2,965 10,340 2007 21,000 3,200 2,120 10,856 2,886 10,266 2008 23,275 5,660 2,000 10,900 2,676 9,605 2008 vs 2007 (+/- percent) 10.8% 76.9% -5.7% 0.4% -7.3% -6.4%
Source: LP Gas Association 2009 Statistical Review of LP Gas
For these same six countries, LP Gas supply is largely tied to production and processing of economically stranded wet gas and its liquefaction for LNG exports. Relatively little is tied to associated gas and crude oil refining. Table 21 shows the 2008 LP Gas production source allocation for these six supplier countries. Only Russia did not have a significant majority of its 2008 LP Gas sourced from gas processing, but this is before the Sakhalin Island II LNG facility came online. Even with Russia having no gas processed LP Gas, the weighted average (weighting based on 2008 LP Gas exports) gas processing percent for these six supplier countries is

37 © 2011 AGDC. All Rights Reserved
approximately 85 percent. With Sakhalin II LNG exportation now in full operational mode, the overall weighted average LP gas sourced from processing for these six supplier countries might easily exceed 90 percent.

38 © 2011 AGDC. All Rights Reserved
Table 22 2008 LP Gas Production Source
By Percent Share
2008 LP Gas Production Source Refinery Gas Processing
Saudi Arabia 5.1% 94.9% Qatar 1.8% 98.2% Indonesia 39.0% 61.0% Russia (1) 100.0% 0.0% Australia 20.6% 79.4% Canada 19.2% 80.8% (1) Sakhalin II LNG facility came online in first quarter 2009 Source: LP Gas Association 2009 Statistical Review of LP Gas
3.4.2 Saudi Arabia
Table 23 shows Saudi Arabia’s 2008 LP Gas production split into refinery (five percent) and gas processing (95 percent) sources, imports, exports and the resulting amount remaining for local market consumption. 2008 exports equate to 53 percent of its 2008 LP Gas supply.
Table 23
2008 LP Gas Supply and Exports - Saudi Arabia (thousand tonnes)
Refinery (Production) 1,185 Gas Processing (Production) 22,090 Total (Production) 23,275 Imports 0 Total Supply 23,275 100% Exports 12,300 53% Consumption (Local) 10,975 47%
Source: 2009 Statistical Review of Global LP Gas, World LP Gas Association and MCH Oil & Gas Consultancy
3.4.3 Qatar
Table 24 shows Qatar’s 2008 LP Gas production split into refinery (2 percent) and gas processing (98 percent) sources, imports, exports and the resulting amount remaining for local market consumption. 2008 exports equate to 88 percent of its 2008 LP Gas supply.

39 © 2011 AGDC. All Rights Reserved
Table 24 2008 LP Gas Supply and Exports - Qatar
(thousand tonnes)
Refinery (Production) 100 Gas Processing (Production) 5,560 Total (Production) 5,660 Imports 0 Total Supply 5,660 100% Exports 5,000 88% Consumption (Local) 660 12%
Source: 2009 Statistical Review of Global LP Gas, World LP Gas Association and MCH Oil & Gas Consultancy
3.4.4 Indonesia
Table 25 shows Indonesia’s 2008 LP Gas production split into refinery (39 percent) and gas processing (61 percent) sources, imports, exports and the resulting amount remaining for local market consumption. 2008 exports equate to 27 percent of its 2008 total LP Gas supply.
Table 25 2008 LP Gas Supply and Exports - Indonesia
(thousand tonnes)
Refinery (Production) 780 Gas Processing (Production) 1,220 Total (Production) 2,000 Imports 30 Total Supply 2,030 100% Exports 550 27% Consumption (Local) 1,480 73%
Source: 2009 Statistical Review of Global LP Gas, World LP Gas Association and MCH Oil & Gas Consultancy
3.4.5 Russia
Table 26 shows Russia’s 2008 LP Gas production split into refinery and gas processing sources, imports, exports and the resulting amount remaining for local market consumption. There was no LP Gas produced from gas processing facilities, hence, it is likely none of the 2008 production is from the Russian Pacific Rim region. No Sakhalin Island energy project (discussed in more detail below) had any operational LNG export facilities in 2008. The Sakhalin II LNG export facility made its first export shipment in early 2009 to Japan. Research has not shown exactly where LP Gas is extracted from the Sakhalin natural gas production.

40 © 2011 AGDC. All Rights Reserved
Table 26
2008 LP Gas Supply and Exports - Russia (thousand tonnes)
Refinery (Production) 10,900 Gas Processing (Production) 0 Total (Production) 10,900 Imports 0 Total Supply 10,900 100% Exports 1,400 13% Consumption (Local) 9,500 87%
Source: 2009 Statistical Review of Global LP Gas, World LP Gas Association and MCH Oil & Gas Consultancy
The Sakhalin projects are based around Sakhalin Island which is just offshore of eastern Russia and just north of the Japanese island of Hokkaido. The Sakhalin I project (owned by a consortium led by Exxon Neftgaz) focused on crude oil development and started producing crude oil and natural gas from the offshore Chayvo field in 1999 (additional production is expected from the offshore Odoptu field). Production is sent via pipeline to a mainland Russian port where natural gas is put into the local Russian gas pipeline system and crude oil is exported, mostly to East Asian markets. The Sakhalin II project (owned by a consortium consisting of Gazprom, Shell, Mitsubishi, and Mitsui) is an integrated crude oil and natural gas development also including Russia’s first LNG liquefaction facility. The offshore production comes from the Piltun-Astokhskoye and Lunskoye fields (off northeast Sakhalin Island) which come ashore to the onshore processing facility before heading to the southern end of Sakhalin Island. Most of the available LP Gas from Sakhalin II will likely be associated with gas processing of production from the Lunskoye field.
At the southern Sakhalin coast location of Prigorodnoye are the LNG plant and the crude oil export facility. The first LNG cargo from the facility was loaded in March 2009 and shipped to Japan. Most of the LNG export capacity has been contracted. About 65 percent is shipped to Japan, with most of the remainder sent to South Korea and North America (the latter to the Costa Azul regasification facility in northern Baja California, Mexico where the natural gas will be able to access markets in Mexico and the southwestern U.S.) (Gazprom website, http://www.gazprom-sh.nl/sakhalin-2/ and “Sakhalin Island Analysis Brief”, EIA, May 2008).
3.4.6 Australia
Table 27 shows Australia’s 2008 LP Gas production split into refinery (21 percent) and gas processing (79 percent) sources, imports, exports and the resulting amount remaining for local market consumption. 2008 exports equate to 40 percent of its 2008 total LP Gas supply.
Table 27 2008 LP Gas Production and Availability to Local
Markets Australia (thousand tonnes)
Refinery (Production) 550 Gas Processing (Production) 2,126 Total (Production) 2,676 Imports 515 Total Supply 3,191 100% Exports 1,291 40% Consumption (Local) 1,900 60%
Source: 2009 Statistical Review of Global LP Gas, World LP Gas Association and MCH Oil & Gas Consultancy

41 © 2011 AGDC. All Rights Reserved
3.4.7 Canada
Table 28 shows Canada’s 2008 LP Gas production split into refinery (19 percent) and gas processing (81 percent) sources, imports, exports and the resulting amount remaining for local market consumption. 2008 exports equate to 42 percent of its total 2008 LP Gas supply.
Table 28 2008 LP Gas Supply and Exports - Canada
(thousand tonnes)
Refinery (Production) 1,841 Gas Processing (Production) 7,764 Total (Production) 9,605 Imports 190 Total Supply 9,795 100% Exports 4,112 42% Consumption (Local) 5,683 58%
Source: 2009 Statistical Review of Global LP Gas, World LP Gas Association and MCH Oil & Gas Consultancy
3.5 FOB Alaska Pricing
3.5.1 Methodology
FOB Alaska Tidewater price projections were generated based on the following components: • Long-term supply/demand fundamentals • Spot CIF refrigerated price forecasts for propane and butane • Long-term estimate of the spot transportation cost for refrigerated propane and butane from
FOB Alaska Tidewater to CIF import markets • FOB Alaska Tidewater (CIF import price minus insurance cost minus spot transportation
cost) • The base case pricing assumption is WTI pricing of $2011 82.40 per barrel
To generate CIF price projections, historical C+F prices (from Platts) for four selected Asian import markets were used for regression analysis to determine the correlation factors between propane and butane Asian market prices with West Texas Intermediate (WTI) crude oil prices. CIF price projections were calculated based on these price correlations and R.W. Beck’s Q4 2010 WTI crude oil price forecast. Stochastic analysis of SAIC’s base case price forecast was used to calculate a high (P75)-low (P25) band of CIF price uncertainty. (An insurance cost equal to 15 percent of the estimated marine transportation cost was added to C+F price projections to convert them to CIF prices.)
The process to generate shipping cost projections began with a review of Platts historical shipping cost data and other industry data. This led to the assumption year 2011 unit shipping costs would be at approximately the same level as in 2010 (in 2010 dollar terms). Unit shipping cost projections were based on an assumed 50/50 split between fuel and non-fuel components. The fuel cost component was escalated at the same rate as SAIC’s Q4 2010 WTI price forecast. The non-fuel component was escalated at an average annual 0.5 percent real growth rate.
Product price High/Low probability cases in the study are based on our stochastic assessment of crude oil prices (SAIC Q4 2010 Base Case forecast). The high case is equivalent to the P75 crude oil price forecast case and the low case is equivalent to P25 crude oil price forecast case. The stochastic forecast is intended to bracket the uncertainty around the base case forecast based on the monthly historical volatility of crude oil prices.
SAIC also approximated Canadian import prices for propane and butane prices at one British Columbia port (Kitimat) with final delivery to Alberta based on SAIC’s forecast (Q4 2010) of WTI. Ethane prices were based on the forecast of Alberta hub gas prices (plus a small premium). The Canadian review included a very preliminary assessment of the pipeline cost on the proposed Enbridge Northern Gateway Pipeline from the import

42 © 2011 AGDC. All Rights Reserved
terminal at Kitimat to the Edmonton, Alberta petrochemical hub. Pipeline and shipping costs were subtracted from the Edmonton hub prices to determine the approximate FOB Alaska Tidewater-Canada price.
3.5.2 Commodity Price
Figures 16 through 19 show the historical WTI crude oil prices and CIF propane/butane prices delivered to North Asia (South Korea) plus their price correlations. Appendix A illustrates the methodology of this WTI-propane and WTI-butane price correlation.
Figure 16: Historical WTI and Propane N. Asia (S. Korea) Prices

43 © 2011 AGDC. All Rights Reserved
Figure 17: Historical WTI and Propane N. Asia (S. Korea) Price Correlation
Figure 18: Historical WTI and Butane N. Asia (S. Korea) Prices
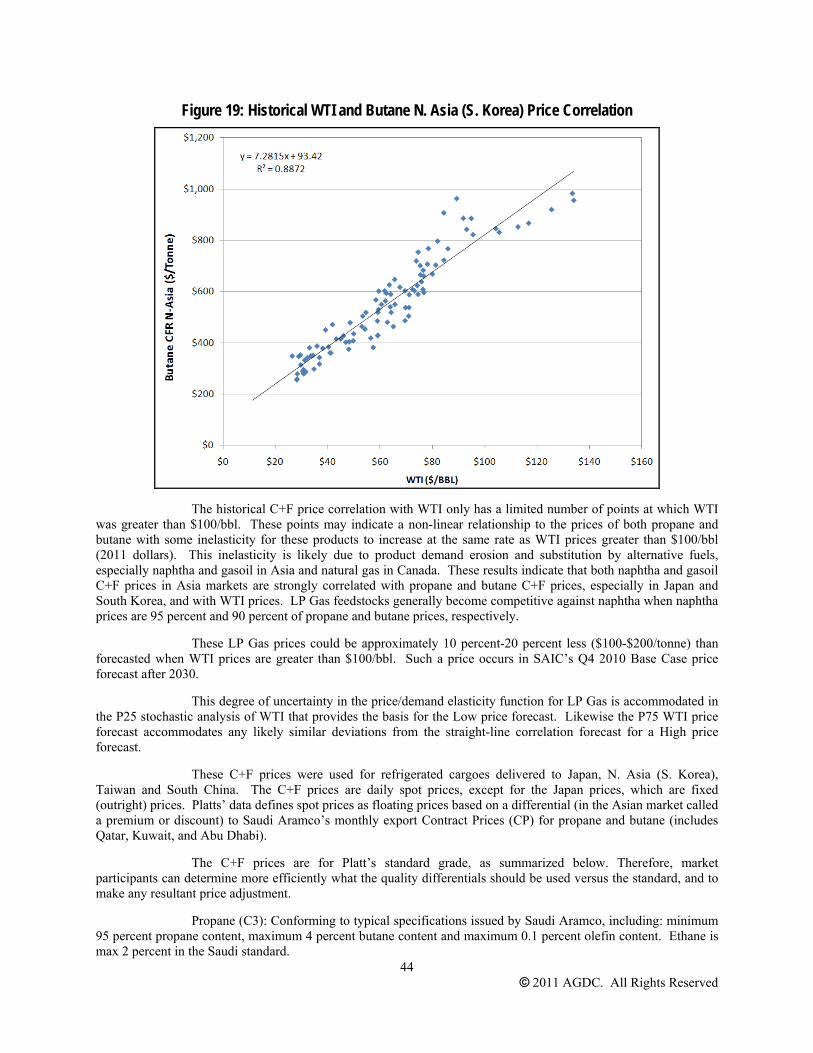
44 © 2011 AGDC. All Rights Reserved
Figure 19: Historical WTI and Butane N. Asia (S. Korea) Price Correlation
The historical C+F price correlation with WTI only has a limited number of points at which WTI was greater than $100/bbl. These points may indicate a non-linear relationship to the prices of both propane and butane with some inelasticity for these products to increase at the same rate as WTI prices greater than $100/bbl (2011 dollars). This inelasticity is likely due to product demand erosion and substitution by alternative fuels, especially naphtha and gasoil in Asia and natural gas in Canada. These results indicate that both naphtha and gasoil C+F prices in Asia markets are strongly correlated with propane and butane C+F prices, especially in Japan and South Korea, and with WTI prices. LP Gas feedstocks generally become competitive against naphtha when naphtha prices are 95 percent and 90 percent of propane and butane prices, respectively.
These LP Gas prices could be approximately 10 percent-20 percent less ($100-$200/tonne) than forecasted when WTI prices are greater than $100/bbl. Such a price occurs in SAIC’s Q4 2010 Base Case price forecast after 2030.
This degree of uncertainty in the price/demand elasticity function for LP Gas is accommodated in the P25 stochastic analysis of WTI that provides the basis for the Low price forecast. Likewise the P75 WTI price forecast accommodates any likely similar deviations from the straight-line correlation forecast for a High price forecast.
These C+F prices were used for refrigerated cargoes delivered to Japan, N. Asia (S. Korea), Taiwan and South China. The C+F prices are daily spot prices, except for the Japan prices, which are fixed (outright) prices. Platts’ data defines spot prices as floating prices based on a differential (in the Asian market called a premium or discount) to Saudi Aramco’s monthly export Contract Prices (CP) for propane and butane (includes Qatar, Kuwait, and Abu Dhabi).
The C+F prices are for Platt’s standard grade, as summarized below. Therefore, market participants can determine more efficiently what the quality differentials should be used versus the standard, and to make any resultant price adjustment.
Propane (C3): Conforming to typical specifications issued by Saudi Aramco, including: minimum 95 percent propane content, maximum 4 percent butane content and maximum 0.1 percent olefin content. Ethane is max 2 percent in the Saudi standard.

45 © 2011 AGDC. All Rights Reserved
Normal Butane (C4): Conforming to typical specifications issued by Saudi Aramco, including: maximum 2 percent propane content, maximum 29 percent iso butane content, minimum 68 percent normal butane content and maximum 0.1 percent olefin content. There is no ethane content in Saudi standard.
3.5.3 Conclusion for CIF LPG Prices in Pacific Rim
Table 29-A summarizes the mathematical relationships derived from the above analysis.
Table 29-A
Formulas To Convert WTI Price (in $/Bbl) to equivalent landed LPG Prices in the Pacific Rim
C+F Price CIF Price
$/Tonne $/MMBtu $/Tonne $/MMBtu
WTI to Propane
A-1: Japan
7.2693 * WTI + 83.947
0.1524 * WTI + 1.7599
7.2693*WTI+89.947+(Freight Alaska to Japan*0.15)
0.1524*WTI+1.7599+(Freight Alaska to Japan*0.15)
A-2: S. China
7.0830 * WTI + 96.479
0.1485 * WTI + 2.0226
7.0830*WTI+96.479+(Freight Alaska to China*0.15)
0.1485*WTI+2.0226+(Freight Alaska to China*0.15)
A-3: Taiwan
7.0842 * WTI + 97.378
0.1485 * WTI + 2.0415
7.0842*WTI+97.378+(Freight Alaska to Taiwan*0.15)
0.1485*WTI+2.0415+(Freight Alaska to Taiwan*0.15)
A-4: S. Korea
6.9817 * WTI + 104.43
0.1464 * WTI + 2.1893
6.9817*WTI+104.43+(Freight Alaska to Korea*0.15)
0.1464*WTI+2.1893+(Freight Alaska to Korea*0.15)
WTI to Butane
A-5: Japan
7.5806 * WTI + 71.336
0.1616 * WTI + 1.5210
7.5806*WTI+71.336+(Freight Alaska to Japan *0.15)
0.1616*WTI+1.5210+(Freight Alaska to Japan *0.15)
A-6: S. China
7.4623 * WTI + 79.079
0.1591 * WTI + 1.6861
7.4623*WTI+79.079+(Freight Alaska to China *0.15)
0.1591*WTI+1.6861+(Freight Alaska to China *0.15)
A-7: Taiwan
7.4610 * WTI + 80.182
0.1591 * WTI + 1.7096
7.4610*WTI+80.182+(Freight Alaska to Taiwan *0.15)
0.1591*WTI+1.7096+(Freight Alaska to Taiwan *0.15)
A-8: S. Korea
7.2815 * WTI + 93.420
0.1553 * WTI + 1.9919
6.9817*WTI+104.43+(Freight Alaska to Korea *0.15)
6.9817*WTI+104.43+(Freight Alaska to Korea *0.15)
Conversion from $/Tonne to $/MMBtu using Client preferred MMBtu / Tonne conversion factors of 47.7 and 46.9 for propane and butane, respectively.

46 © 2011 AGDC. All Rights Reserved
Table 29-B shows the CIF Pacific Rim price for propane and butane calculated in terms of equivalent MMBTU for WTI Price of $2011 82.40/bbl for Japan, South China, Taiwan, and South Korea based on the formulae shown above in Table 29-A.
Table 29-B
CIF Pacific Rim LPG Prices in $2011/MMBTU For WTI Price Of $2011 82.40/bbl
Propane Butane A-1: Japan $14.37 A-5: Japan $14.65 A-2: S. China $14.34 A-6: S. China $14.63 A-3: Taiwan $14.36 A-7: Taiwan $14.65 A-4: S. Korea $14.31 A-8: S. Korea $14.60
3.5.4 Marine Transportation Cost
This section of the report explains the forecasted estimates of the marine transportation cost of NGL that is shipped to selected destinations in Asia.
Historical transportation costs (based on Platts’ LPGas Wire transportation methodology of spot charter fixtures in the assessments, not on long-term charter rates for firm capacity) for propane and butane for the last five years were analyzed for two charter routes normalized for freight assessment from the Persian Gulf (Ras Tanura) to Japan (Port of Chiba) and Persian Gulf to East China (Port of Shanghai). During the last five years significant volatility has occurred in Platts’ spot charter fixtures in the assessment for cargo rates in the Asian Pacific basin for deliveries 20 or more days after the published date of assessment. The monthly shipping costs generally ranged from approximately $20 to $60/tonne, with some prices as low as $15/tonne and as high as $75/tonne. This cost volatility largely represents demand variations, inventory imbalances, and crude oil price volatility.
The recent historical shipping cost data for the Persian Gulf to Japan and China was used to estimate year 2011 shipping rates on a dollar per tonne-mile basis. This year 2011 unit cost was escalated by the process previously described (see FOB Methodology subsection). The resulting forecast was then applied to the respective nautical mile shipping distances from Nikiski, Alaska to four (plus Kitimat, BC for the preliminary Canadian analysis) selected LP Gas import terminals (see Table 28 for Asian shipping distances) (also note Nikiski and Anchorage have very similar shipping distances) :
• Chiba, Japan • Yeosu, South Korea • Kaosiun, Taiwan • Ghuangzhou, South China • Kitimat, BC Canada (1000 miles from Nikiski)

47 © 2011 AGDC. All Rights Reserved
Table 30 Shipping Distances (Nautical Miles)
FOB Ports Japan
(Chiba) South Korea
(Yeosu) Taiwan
(Kaosiung) S. China
(Ghungzhou) E. China
(Shanghai) Alaska • Anchorage 3338 3762 4579 4917 4173 • Nikiski 3283 3707 4524 4862 4118 Qatar (Doha) 6515 6065 5229 5151 5845 Saudi Arabia (Ras Tansua) 6608 6158 5322 5244 5938 Indonesia (Singapore) 2907 2457 1621 1543 2237 Australia • Darwin 3036 2917 2249 2424 2765 • Gorgon 3682 3510 2715 2856 3306 • Gladstone 3863 4166 3586 3885 4134 Russia (Korsakov) 1072 1075 1867 2162 1443 Source: e-ships.net
The Asian ports were selected based on Platts’ refrigerated freight assessments. These assessments are based in dollars per tonne and reflect the cost of shipping refrigerated LP Gas in Very Large Gas Carriers (VLGC). These ships typically carry 44,000 tonnes in segregated 11,000 tonne tanks; two tanks (22,000 tonnes) of propane and butane. Therefore the same shipping rate (dollars per tonne-mile) was used for both propane and butane shipping costs.
Table 31 and 32 show the base case marine transportation costs for both $2011 and Nominal $. The dollar per tonne-mile are listed along with the dollar per tonne projections to the four selected markets.
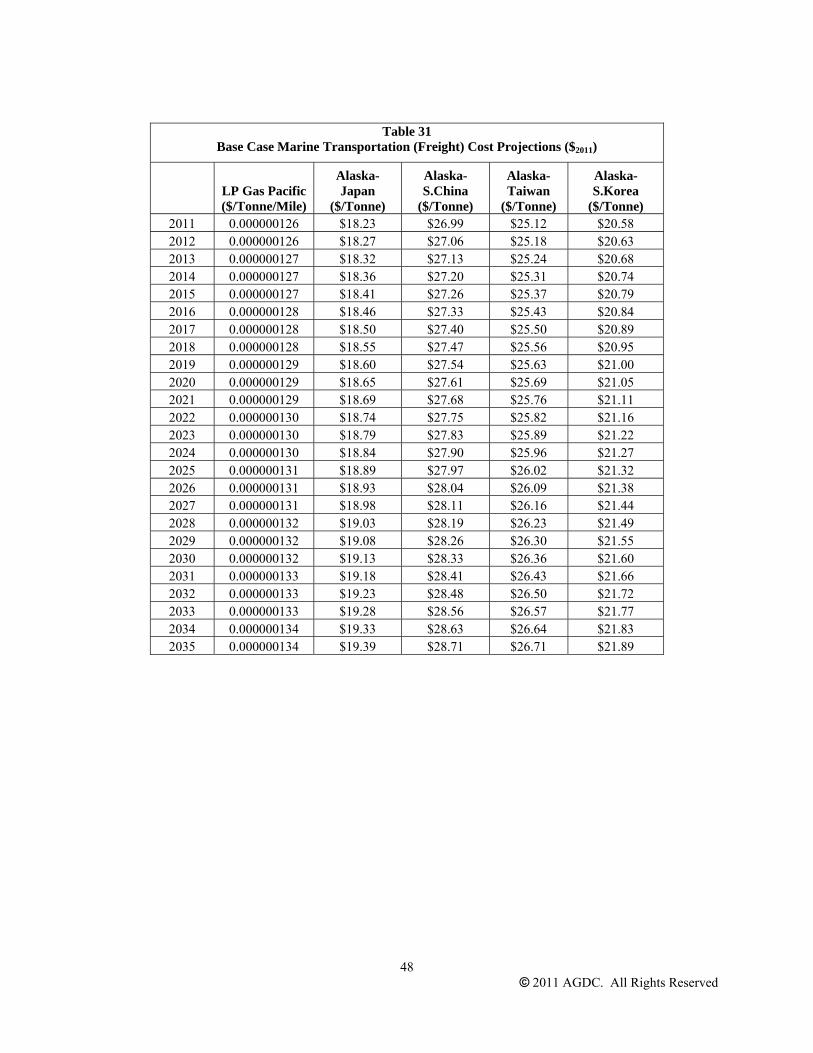
48 © 2011 AGDC. All Rights Reserved
Table 31
Base Case Marine Transportation (Freight) Cost Projections ($2011)
LP Gas Pacific ($/Tonne/Mile)
Alaska-Japan
($/Tonne)
Alaska-S.China
($/Tonne)
Alaska-Taiwan
($/Tonne)
Alaska-S.Korea
($/Tonne) 2011 0.000000126 $18.23 $26.99 $25.12 $20.58 2012 0.000000126 $18.27 $27.06 $25.18 $20.63 2013 0.000000127 $18.32 $27.13 $25.24 $20.68 2014 0.000000127 $18.36 $27.20 $25.31 $20.74 2015 0.000000127 $18.41 $27.26 $25.37 $20.79 2016 0.000000128 $18.46 $27.33 $25.43 $20.84 2017 0.000000128 $18.50 $27.40 $25.50 $20.89 2018 0.000000128 $18.55 $27.47 $25.56 $20.95 2019 0.000000129 $18.60 $27.54 $25.63 $21.00 2020 0.000000129 $18.65 $27.61 $25.69 $21.05 2021 0.000000129 $18.69 $27.68 $25.76 $21.11 2022 0.000000130 $18.74 $27.75 $25.82 $21.16 2023 0.000000130 $18.79 $27.83 $25.89 $21.22 2024 0.000000130 $18.84 $27.90 $25.96 $21.27 2025 0.000000131 $18.89 $27.97 $26.02 $21.32 2026 0.000000131 $18.93 $28.04 $26.09 $21.38 2027 0.000000131 $18.98 $28.11 $26.16 $21.44 2028 0.000000132 $19.03 $28.19 $26.23 $21.49 2029 0.000000132 $19.08 $28.26 $26.30 $21.55 2030 0.000000132 $19.13 $28.33 $26.36 $21.60 2031 0.000000133 $19.18 $28.41 $26.43 $21.66 2032 0.000000133 $19.23 $28.48 $26.50 $21.72 2033 0.000000133 $19.28 $28.56 $26.57 $21.77 2034 0.000000134 $19.33 $28.63 $26.64 $21.83 2035 0.000000134 $19.39 $28.71 $26.71 $21.89

49 © 2011 AGDC. All Rights Reserved
Table 32
Base Case Marine Transportation (Freight) Cost Projections (Nominal $)
LP Gas Pacific ($/Tonne/Mile)
Alaska-Japan
($/Tonne)
Alaska-S.China
($/Tonne)
Alaska-Taiwan
($/Tonne)
Alaska-S.Korea
($/Tonne) 2011 0.000000126 18.23 26.99 25.12 20.58 2012 0.000000130 18.76 27.79 25.86 21.19 2013 0.000000134 19.32 28.61 26.62 21.81 2014 0.000000138 19.89 29.46 27.41 22.46 2015 0.000000142 20.48 30.34 28.23 23.13 2016 0.000000146 21.10 31.24 29.07 23.82 2017 0.000000150 21.73 32.18 29.94 24.54 2018 0.000000155 22.38 33.15 30.84 25.27 2019 0.000000160 23.06 34.15 31.77 26.03 2020 0.000000164 23.75 35.18 32.73 26.82 2021 0.000000169 24.47 36.24 33.72 27.63 2022 0.000000175 25.22 37.34 34.75 28.47 2023 0.000000180 25.98 38.48 35.81 29.34 2024 0.000000185 26.78 39.66 36.90 30.24 2025 0.000000191 27.60 40.87 38.03 31.16 2026 0.000000197 28.44 42.12 39.20 32.12 2027 0.000000203 29.32 43.42 40.40 33.10 2028 0.000000209 30.22 44.76 41.65 34.13 2029 0.000000216 31.16 46.14 42.93 35.18 2030 0.000000222 32.12 47.57 44.26 36.27 2031 0.000000229 33.12 49.04 45.63 37.39 2032 0.000000236 34.15 50.57 47.05 38.56 2033 0.000000244 35.21 52.14 48.52 39.76 2034 0.000000251 36.31 53.77 50.03 41.00 2035 0.000000259 37.44 55.45 51.59 42.28
The stochastic spot shipping costs were also calculated in order to tie to the stochastic analyses of the WTI forecasts for the commodity price forecast and to provide a high-low band of FOB Alaska price uncertainty.
Table 33 shows that Alaska’s base case year 2011 shipping costs are relatively competitive to Japan, and less so to South China. Russia has a significantly lower shipping cost to Japan, approximately $5.95/tonne in 2011, approximately 65-70 percent less than Alaska. Darwin (Australia) costs to Japan are approximately $1.50/tonne less than those of Alaska. Alaska’s shipping cost to Japan is approximately $2.00/tonne to $3.00/tonne less than Gorgon and Gladstone (Australia) costs, and approximately 50 percent less than those for Qatar and Saudi Arabia.
Table 33 also shows all three Australia export terminals have lower shipping costs to South China by approximately $5.50/tonne to $13.50/tonne. Alaska’s shipping costs to South China are slightly lower those of the Mideast (Qatar and Saudi Arabia), approximately $2.00/tonne less on average.

50 © 2011 AGDC. All Rights Reserved
Table 33 LP Gas Shipping Costs to Japan (Chiba) and South China (Ghungzhou) – Year 2011
Base Case Shipping Costs to Japan Base Case Shipping Costs to South China
Shipping Route Nautical
Miles $2011/tonne Shipping Route Nautical
Miles $2011/tonne Russia to Japan 1072 5.95 Russia to South China 2162 12.00 Darwin to Japan 3036 16.86 Darwin to South China 2424 13.46 Nikiski to Japan 3283 18.23 Gorgon to South China 2856 15.86 Anchorage to Japan 3338 18.53 Gladstone to South China 3885 21.57 Gorgon to Japan 3682 20.44 Nikiski to South China 4862 26.99
Gladstone to Japan 3863 21.45 Anchorage to South China 4917 27.30
Qatar to Japan 6515 36.17 Qatar to South China 5151 28.60 Saudi Arabia to Japan 6608 36.69
Saudi Arabia to South China 5244 29.11
3.5.5 Conclusion for Marine Transportation Cost
Base case marine transportation costs for the four Asian shipping routes show a range of approximately $18/tonne (Japan) to $27/tonne (South China) for year 2011. These escalate to a range of approximately $19/tonne to $29/tonne by 2035. All costs stated in $2011 terms.
3.5.6 Pricing FOB Alaska Tidewater from CIF Import Markets for Asian Markets
Tables 34 and 35 show base case, prices for propane and butane to the four selected Asian markets. The FOB Alaska Tidewater base case prices show Japan FOB Alaska prices are the greatest for both propane and butane. North Asia (South Korea) is second although South China and Taiwan are close to South Korea prices. (It is noted, however, that even though the netbacks from Japan are slightly higher than those from Korea, Korea is the preferred market for other reasons, as outlined further in Section 3.7 below.)
Table 34
WTI $2011/bbl $/Mt $/Mt $/Mt $/Mt
WTI
Base Case FOB Propane Alaska-Japan
Base Case FOB Propane Alaska-
S.China
Base Case FOB Propane Alaska-
Taiwan
Base Case FOB Propane Alaska-
S.Korea $82.40 $664.71 $653.13 $656.00 $659.14
Table 35
WTI $2011/bbl $/Mt $/Mt $/Mt $/Mt
WTI
Base Case FOB Butane Alaska-
Japan
Base Case FOB Butane Alaska-
S.China
Base Case FOB Butane Alaska-
Taiwan
Base Case FOB Butane Alaska-
S.Korea $82.40 $677.75 $666.98 $669.85 $672.83
3.6 Pricing FOB Alaska Tidewater for Canadian Market
Table 36 is the estimated base case FOB Alaska Tidewater price for propane, butane, and ethane to the Alberta/Edmonton petrochemical hub. The ethane prices are for reference only, as ethane is being removed from the pipeline stream at the Prudhoe Bay Unit CGF for the purpose of this study.

51 © 2011 AGDC. All Rights Reserved
Table 36 FOB Alaska Tidewater (For Canadian Delivery at Alberta/Edmonton)
$2011/Tonne $2011/MMBtu Ethane Propane Butane Ethane Propane Butane 115.28 467.66 742.12 2.43 9.85 15.62
Table 37 compares base case Canadian and Japan FOB prices for propane and butane. Japan propane prices are significantly greater than Canadian prices. However, Canadian butane prices are greater than Japan. This is largely due to the value of butane as a dilutant for extraction and pipeline transportation of raw bitumen production. If this differential persists, the ultimate NGL project owner(s) will have to determine whether the higher prices in Canada justify shipments of butane only to that market.
Table 37
Propane Butane
FOB Alaska Tidewater (for Canadian Delivery at Alberta/Edmonton)
Base Case FOB Propane Alaska-
Japan
FOB Alaska Tidewater (for Canadian Delivery at Alberta/Edmonton )
Base Case FOB Butane Alaska-
Japan
$2011/Tonne 467.66 664.71 742.12 677.75
3.6.1 Conclusion for FOB Alaska Tidewater Prices
Japan’s FOB Alaska Tidewater base case propane price advantage (over the other three Asian markets) equals to approximately $5-10/tonne in year 2011.
3.7 Market Rating of Asian Countries
To derive a favorability ranking of the four Asian countries assessed as potential markets, we quantified and compared the following market criteria:
1. Distance from Alaska Tidewater 2. 2008 Consumption of LP Gas 3. Percentage of imports divided by total consumption, for 2008 4. Total imports for 2008 5. Percent LPG market growth last five years of data (2004-2008) 6. IMF current projected economic growth for 2011-2012
Our source of LPG data is the 2009 World Gas Association Statistical Review of Global LP Gas. Our source for projected 2011-2012 economic growth is the International Monetary Fund (“IMF”) website (*http://www.imf.org/external/pubs/ft/weo/2011/update/01/index.htm).
The results rank the countries: 1. South Korea 2. Japan 3. China 4. Taiwan

52 © 2011 AGDC. All Rights Reserved
Table 38
Rating Grid for Four Asian Export Countries
Japan South Korea Taiwan China
Distance from Alaska Tidewater 3300 3700 4500 4900 Rating - Distance (miles) 1 2 3 4 2008 Consumption LP Gas (000 tonnes) 17,699 8,931 2,270 21,500 Rating Consumption 2 3 4 1 Percent imports/consumption LP Gas 78% 61% 44% 12% Rating imports/consumption 2008) 1 2 3 4 Total imports LP Gas (000 tonnes) 13,723 5,448 990 2,600 Rating Total Imports 1 2 4 3 Total LP Gas market growth last five years, percent 2004-2008 0% 21% 17% 7% Rating Market Growth 3 years 4 1 2 3 Projected IMF economic growth* 1.7 5.6 5.6 9.6 Rating Economic Growth 4 2 3 1 Total 13 12 19 16 Rank 2 1 4 3
3.8 Conclusions
Based upon the results of the study, summarized in the Table 38, SAIC recommends the selection of South Korea and Japan as the first and second ranked markets of choice for Alaskan LP Gas.
We also conclude that shipments of butane or ethane from the Alaskan Tidewater to the Alberta/Edmonton petrochemical hub are not economic.
53 © 2011 AGDC. All Rights Reserved
4.0 MARINE TERMINAL ANALYSIS
The purpose of the marine terminal analysis is to provide an objective evaluation of potential tidewater (i.e., Cook Inlet and Kenai Peninsula) shipping terminal locations for LP Gas. Assessments were completed based on capital cost and operating suitability following a preliminary ranking of terminal locations based on information available on the internet, site visits and interviews with local planners. This ranking was used to adjust the preliminary rankings and identify the optimal tidewater LP Gas shipping location for the economic modeling purposes of this report.
The site selection considerations in this assessment include safety and security, pipeline path for natural gas feedstock delivery, environmental concerns, existence of adequate infrastructure, site suitability with respect to existing Borough/Coastal Master Plans, and general operational and economic feasibility. This site assessment remains at a very high level, with the goal of identifying and comparing major considerations, but not delving into a highly detailed comparison. As such, the selected sites for modeling in this report (i.e., Nikiski and northwest of Fairbanks) should be considered as reasonable sites based on a high-level analysis, but not necessarily the ultimately preferred sites. It should be noted that some potential sites were identified during our interviews that were not included in our preliminary assessment (i.e., the Tyonek dock, Nenana and Ft Knox). These sites are mentioned below, but were not further assessed.
Federal regulations considered in this siting assessment are addressed in this section.
4.1 Federal Regulations Governing NGL Facilities
This summary of Federal regulatory requirements for LP Gas export facilities and vessels is not exhaustive, but rather indicates the requirements that were considered in this siting assessment. The address below includes primary Federal safety and security regulations that address LP Gas loading facilities and vessels, a discussion on safety and security exclusion zones that are designated around NGL facilities and vessels, and closes with brief mention of some additional relevant Federal regulations.
4.2 Primary Federal Safety and Security Regulations
Both tidewater and Fairbanks sites will need to meet Federal and or State/local regulations with respect to safety and security, including, among other things, safety zones surrounding LP Gas storage. The specific regulations that apply depend on whether a facility is located on a navigable waterway and if the facility is also handling Liquid Natural Gas1. Safety and security of facilities on navigable waterways are regulated by the U.S. Coast Guard. Facilities that handle LNG that are not on navigable waterways must comply with generally similar (but not exactly the same) U.S. Department of Transportation regulations. Facilities that handle LP Gas that are not on navigable waterways must comply with U.S. Department of Transportation regulations pertaining to LP Gas piping as well as State/local regulations applying to the rest of the facility.
Facilities that also handle LP Gas that are not on navigable waters (i.e., some potential Fairbanks sites) are subject to the regulations contained in 49 CFR Part 193 which addresses both safety and security requirements. These DOT regulations incorporate National Fire Protection Association Standard 59A to address safety. In regard to security, LP Gas facilities not regulated by the Coast Guard that hold over 10,000 lbs of methane or butane (iso and normal), or 60,000 lbs of propane are also subject to the Chemical Facility Anti-Terrorism Standards in 6 CFR 27.
In contrast, LP Gas facilities built on navigable waters must comply with 33 CFR 127, administered by the U.S. Coast Guard. With respect to security, these facilities must also comply with 33 CFR 105, which calls for a risk assessment and security plan that enacts the security measures necessary to control the risk identified in the assessment.
1 Note: Under 33 CFR 127 Butane and Propane are classified as Liquefied Hazardous Gasses (LHG)

54 © 2011 AGDC. All Rights Reserved
4.3 Exclusion Zones
With respect to thermal exclusion or buffer zones that may be designated around onshore storage tanks and LP Gas tank ships (generally referred to as LPG carriers/tank ships), there are no overall distances specified in either DOT or Coast Guard regulations. Rather, the regulations call for assessments to designate these distances. Further, the determination of an exclusion zone distance may differ depending on whether safety or security is the primary interest. Differences in safety and security exclusion zones are due to differing probabilities and consequences of intentional attacks on a facility. An accident scenario with serious consequences that may be deemed a ‘less than a one in ten thousand year event’ could be reasonably ignored in an accident management program. However, a security threat scenario is controlled by intention not probability, and the serious consequences that are possible might draw the attacker to that specific target.
The products that are the subject of this report are butane and propane. They are flammable gases. When liquefied, they cannot burn until they return to a gaseous state and mix with sufficient amount of oxygen from the air. When they have returned to gas and have mixed with sufficient amounts of air they can be ignited and will burn in a fire ball radiating large amounts of heat. Likewise gases moving in a pipeline must first mix with sufficient amounts of air in order to be ignited and burn. While butane and propane do differ in their potential BTU production capability, pound for pound the difference is not significant and does not produce significantly larger thermal exclusion zones for one than another when calculated using the ALOHA2 response planning simulation program.
A common reference with respect to risk analysis and safety distances for a large LP Gas spill over water is a 2004 report by the Sandia National Laboratories.3 The Sandia report considers that the size of a breach in LP Gas containment cause by an intentional act will probably be larger than one caused by an accident. For these reasons it is possible that certain standoff distances (Thermal Exclusion Zones) may be larger for security purposes than if calculated solely on safety considerations.
As a general consideration in the siting considerations of this report, thermal exclusion zones were calculated as the distance at which a maximum heat level of 5kW/meter2 is projected to occur under a modeled security-based scenario (i.e., an intentional attack). This level of heat will produce second degree burns on a human within 60 seconds unless the person is able to move away from the heat. Use of this threshold to determine an exclusion zone is not a specific regulatory requirement, but rather, a reasonable safety level that could be used in subsequent risk assessments. Lower thresholds by reputable organizations have been suggested, for example: The American Petroleum Institute Recommended Practice (“API RP”) 521 suggests a permissible exposure to the thermal radiation from flares of 1.6 kW/meter2 in locations where personnel are continuously exposed, and The Society of Fire Protection Engineers’ (“SFPE”’s) handbook of fire protection engineering, second edition, recommends a level of 2.5kW/m2 as a public tolerance limit for exposure to radiant heat. The use of lower thermal thresholds will result in larger thermal exclusion zones. Ultimately, the US Coast Guard or US DOT determines if the thermal exclusion zone proposed for a specific project is acceptable.
4.4 Other Regulations
New LPG facilities are also required to comply with the Federal Energy Regulatory Commission (“FERC”) filing requirements contained in 18 CFR parts 153 and 157. In addition planned LPG facilities that are subject to Coast Guard jurisdiction must submit the Letter of Intent4 to the Captain of the Port no later than the date that the owner or operator files a pre-filing request with FERC under 18 CFR parts 153 and 157, but, in all cases, at least one year prior to the start of construction. As part of the submission to the Coast Guard, the facility operator must conduct and include a preliminary waterway suitability assessment (“WSA”) that must in part address; characterization of the LPGC route; risk assessment for maritime safety and security; risk management strategies; and resource needs for maritime safety, security, and response.
2 ALOHA (Areal Locations of Hazardous Atmospheres) is a modeling program that estimates threat zones associated with hazardous chemical releases, including toxic gas clouds, fires, and explosions. ALOHA was developed jointly by NOAA and the Environmental Protection Agency. 3 United States Department of Energy, Sandia National Laboratories, 2004. “Guidance on Risk Analysis and Safety Implications of a Large Liquefied Natural Gas (LNG) Spill Over Water,” Sandia Report SAND2004-6258. Available at http://fossil.energy.gov/programs/oilgas/storage/lng/sandia_lng_1204.pdf 4 For additional information refer to 33 CFR 127.007

55 © 2011 AGDC. All Rights Reserved
The final regulatory requirement included in this review applies to seismically active areas. South-central Alaska is known to be seismically active and as such all LPG terminals constructed after 1993 are required to meet the seismic design requirements as stated in 49 CFR part 41,5 regardless of whether or not they are located on navigable waterways.
4.5 Potential Tidewater Sites
Tidewater sites considered in this assessment are Nikiski, Homer, a general Greenfield port/terminal along the western coast of the Kenai Peninsula, Port MacKenzie, the Port of Anchorage, and Seward. With the exception of Seward, the sites were all located on the Cook Inlet or one of its Arms. Seward is located on Resurrection Bay. Both Cook Inlet and Resurrection Bay are environmentally significant and also support a wide array of recreational activities. Cook Inlet is approximately 192 miles long and Resurrection Bay is about 20 miles long (Figure 20). Cook Inlet is also home to a specific species of the Beluga Whale family and pending regulations would enact a mandatory management program in many parts of the Inlet and its Arms.
Figure 20: Area Reviewed for South-Central Sites
The potential sites experience tidal swings range from 10-35 feet and except for Seward, they experience strong tide-driven currents up to 8 knots in speed. While none of the sites are reported to freeze over during the winter, all of them, with the exception of Seward, are impacted by ice flows that originate along the shore or up in the Arms that extend from the Inlet propelled by the current and/or wind. When ships are at berth the ice flows (Figure 21) can press against them creating enormous strain potentially damaging the ship hulls and the piers to which the ships are berthed.
5 33CFR 127.1103 requires compliance with the requirements of 49 CFR 41.119 which apply to new building projects for which development of detailed plans and specifications begin after July 14, 1993
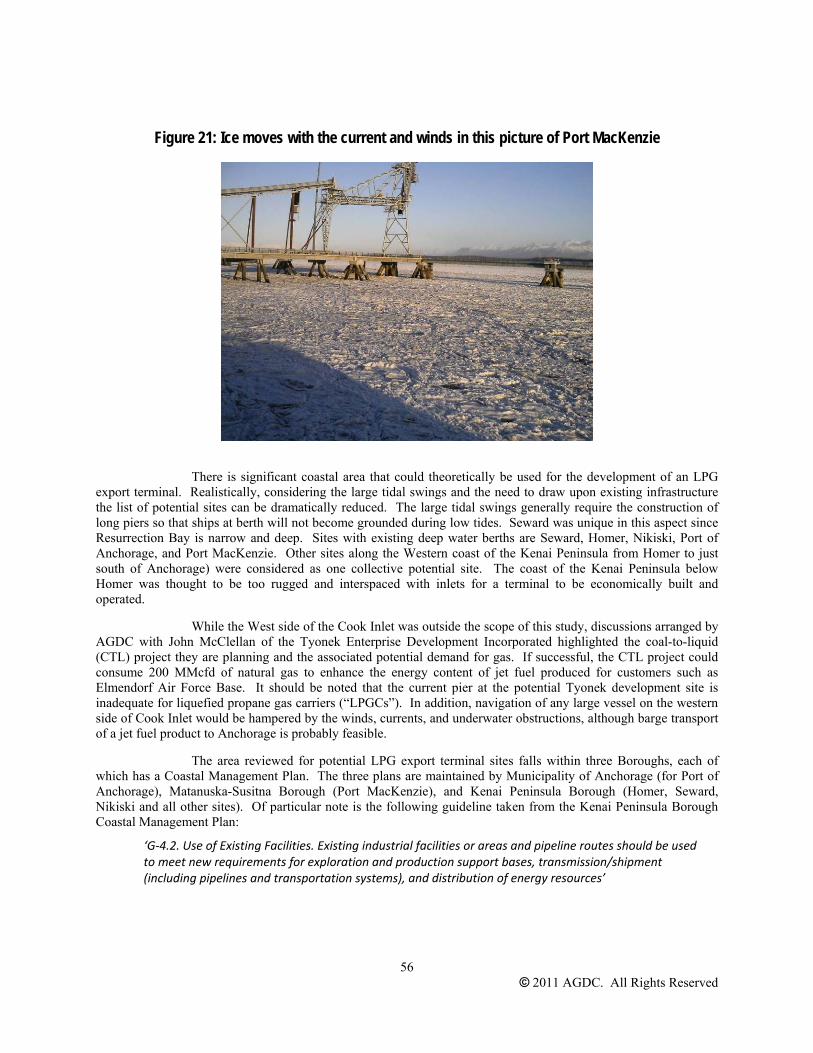
56 © 2011 AGDC. All Rights Reserved
Figure 21: Ice moves with the current and winds in this picture of Port MacKenzie
There is significant coastal area that could theoretically be used for the development of an LPG export terminal. Realistically, considering the large tidal swings and the need to draw upon existing infrastructure the list of potential sites can be dramatically reduced. The large tidal swings generally require the construction of long piers so that ships at berth will not become grounded during low tides. Seward was unique in this aspect since Resurrection Bay is narrow and deep. Sites with existing deep water berths are Seward, Homer, Nikiski, Port of Anchorage, and Port MacKenzie. Other sites along the Western coast of the Kenai Peninsula from Homer to just south of Anchorage) were considered as one collective potential site. The coast of the Kenai Peninsula below Homer was thought to be too rugged and interspaced with inlets for a terminal to be economically built and operated.
While the West side of the Cook Inlet was outside the scope of this study, discussions arranged by AGDC with John McClellan of the Tyonek Enterprise Development Incorporated highlighted the coal-to-liquid (CTL) project they are planning and the associated potential demand for gas. If successful, the CTL project could consume 200 MMcfd of natural gas to enhance the energy content of jet fuel produced for customers such as Elmendorf Air Force Base. It should be noted that the current pier at the potential Tyonek development site is inadequate for liquefied propane gas carriers (“LPGCs”). In addition, navigation of any large vessel on the western side of Cook Inlet would be hampered by the winds, currents, and underwater obstructions, although barge transport of a jet fuel product to Anchorage is probably feasible.
The area reviewed for potential LPG export terminal sites falls within three Boroughs, each of which has a Coastal Management Plan. The three plans are maintained by Municipality of Anchorage (for Port of Anchorage), Matanuska-Susitna Borough (Port MacKenzie), and Kenai Peninsula Borough (Homer, Seward, Nikiski and all other sites). Of particular note is the following guideline taken from the Kenai Peninsula Borough Coastal Management Plan:
‘G‐4.2. Use of Existing Facilities. Existing industrial facilities or areas and pipeline routes should be used to meet new requirements for exploration and production support bases, transmission/shipment (including pipelines and transportation systems), and distribution of energy resources’
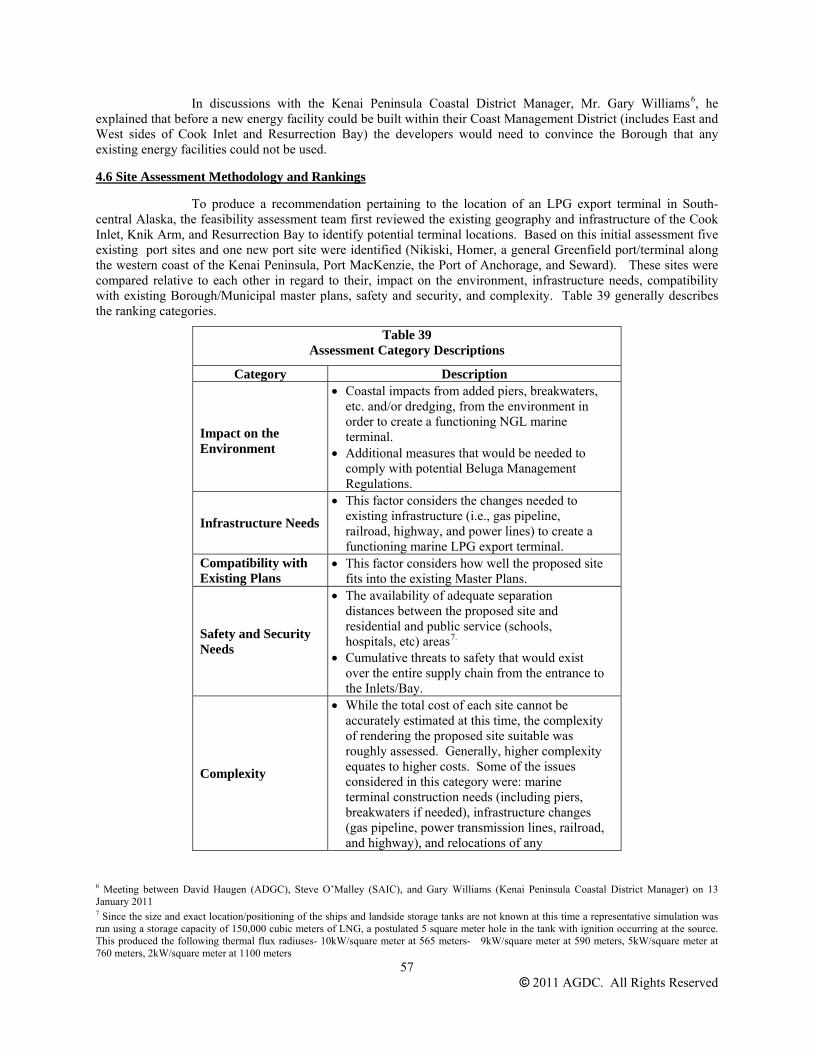
57 © 2011 AGDC. All Rights Reserved
In discussions with the Kenai Peninsula Coastal District Manager, Mr. Gary Williams6, he explained that before a new energy facility could be built within their Coast Management District (includes East and West sides of Cook Inlet and Resurrection Bay) the developers would need to convince the Borough that any existing energy facilities could not be used.
4.6 Site Assessment Methodology and Rankings
To produce a recommendation pertaining to the location of an LPG export terminal in South-central Alaska, the feasibility assessment team first reviewed the existing geography and infrastructure of the Cook Inlet, Knik Arm, and Resurrection Bay to identify potential terminal locations. Based on this initial assessment five existing port sites and one new port site were identified (Nikiski, Homer, a general Greenfield port/terminal along the western coast of the Kenai Peninsula, Port MacKenzie, the Port of Anchorage, and Seward). These sites were compared relative to each other in regard to their, impact on the environment, infrastructure needs, compatibility with existing Borough/Municipal master plans, safety and security, and complexity. Table 39 generally describes the ranking categories.
Table 39 Assessment Category Descriptions
Category Description
Impact on the Environment
• Coastal impacts from added piers, breakwaters, etc. and/or dredging, from the environment in order to create a functioning NGL marine terminal.
• Additional measures that would be needed to comply with potential Beluga Management Regulations.
Infrastructure Needs
• This factor considers the changes needed to existing infrastructure (i.e., gas pipeline, railroad, highway, and power lines) to create a functioning marine LPG export terminal.
Compatibility with Existing Plans
• This factor considers how well the proposed site fits into the existing Master Plans.
Safety and Security Needs
• The availability of adequate separation distances between the proposed site and residential and public service (schools, hospitals, etc) areas7.
• Cumulative threats to safety that would exist over the entire supply chain from the entrance to the Inlets/Bay.
Complexity
• While the total cost of each site cannot be accurately estimated at this time, the complexity of rendering the proposed site suitable was roughly assessed. Generally, higher complexity equates to higher costs. Some of the issues considered in this category were: marine terminal construction needs (including piers, breakwaters if needed), infrastructure changes (gas pipeline, power transmission lines, railroad, and highway), and relocations of any
6 Meeting between David Haugen (ADGC), Steve O’Malley (SAIC), and Gary Williams (Kenai Peninsula Coastal District Manager) on 13 January 2011 7 Since the size and exact location/positioning of the ships and landside storage tanks are not known at this time a representative simulation was run using a storage capacity of 150,000 cubic meters of LNG, a postulated 5 square meter hole in the tank with ignition occurring at the source. This produced the following thermal flux radiuses- 10kW/square meter at 565 meters- 9kW/square meter at 590 meters, 5kW/square meter at 760 meters, 2kW/square meter at 1100 meters

58 © 2011 AGDC. All Rights Reserved
operations.
Each potential terminal location was ranked 1-6 in each category (Table 40), with one indicating the proposed site that conforms best or requires the least effort to comply with the terms of the factor, and six indicating the site that requires the greatest level of effort/expense.
Table 40
Preliminary Tidewater Site Rankings
Factor Impact on the Environment
Infrastructure Needs
Compatibility with Existing
Plans
Safety and Security Needs Complexity
Overall Rank
Factor weight 0.2 0.2 0.2 0.2 0.2 Proposed Site Nikiski 1 3 1 2 2 1.8 Port MacKenzie 2 1 2 4 1 2 Seward Marine Industrial Center 5 4 3 3 4 3.8 Port of Anchorage 3 2 4 6 5 4 Western Kenai Peninsula (Greenfield sites) 6 6 6 1 3 4.4 Homer 4 5 5 5 6 5
After consultation with the ADGC the project team focused its assessment on the terminal locations that were ranked 1-3 in the initial assessment (Nikiski, Port MacKenzie, and Seward). Discussions were held with port/city/terminal management, Borough planners, maritime pilots, a tug boat operator, the U.S. Coast Guard, and others regarding these terminal locations (a complete list of interviewees is provided in Appendix A). The assessment team also visited the existing LNG terminal in Nikiski and dry bulk loading terminal in Port MacKenzie. Based on the information gained during this phase, the rank ordering of the top three facilities was adjusted taking into account the additional information obtained.
4.6.1 Nikiski
The proposed site near Nikiski is located on the Cook Inlet in the Nikiski Industrial Area. Nikiski is an unincorporated town in the Kenai Peninsula Borough. Currently there are three marine facilities at the Nikiski Industrial Area and each has a long pier capable of handling ocean going tank ships. One facility is the existing LNG terminal (Figure 22, LNG facility is the middle pier).
Figure 22: Existing Nikiski LNG Terminal (Middle Pier)
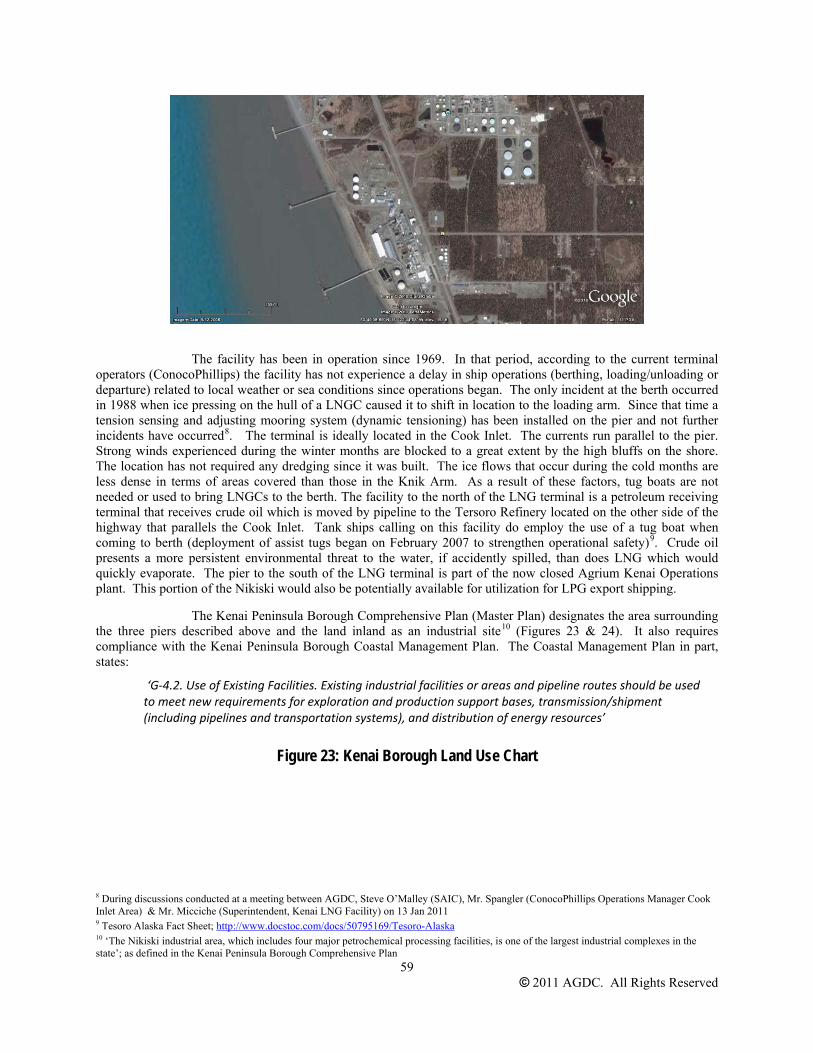
59 © 2011 AGDC. All Rights Reserved
The facility has been in operation since 1969. In that period, according to the current terminal operators (ConocoPhillips) the facility has not experience a delay in ship operations (berthing, loading/unloading or departure) related to local weather or sea conditions since operations began. The only incident at the berth occurred in 1988 when ice pressing on the hull of a LNGC caused it to shift in location to the loading arm. Since that time a tension sensing and adjusting mooring system (dynamic tensioning) has been installed on the pier and not further incidents have occurred8. The terminal is ideally located in the Cook Inlet. The currents run parallel to the pier. Strong winds experienced during the winter months are blocked to a great extent by the high bluffs on the shore. The location has not required any dredging since it was built. The ice flows that occur during the cold months are less dense in terms of areas covered than those in the Knik Arm. As a result of these factors, tug boats are not needed or used to bring LNGCs to the berth. The facility to the north of the LNG terminal is a petroleum receiving terminal that receives crude oil which is moved by pipeline to the Tersoro Refinery located on the other side of the highway that parallels the Cook Inlet. Tank ships calling on this facility do employ the use of a tug boat when coming to berth (deployment of assist tugs began on February 2007 to strengthen operational safety)9. Crude oil presents a more persistent environmental threat to the water, if accidently spilled, than does LNG which would quickly evaporate. The pier to the south of the LNG terminal is part of the now closed Agrium Kenai Operations plant. This portion of the Nikiski would also be potentially available for utilization for LPG export shipping.
The Kenai Peninsula Borough Comprehensive Plan (Master Plan) designates the area surrounding the three piers described above and the land inland as an industrial site10 (Figures 23 & 24). It also requires compliance with the Kenai Peninsula Borough Coastal Management Plan. The Coastal Management Plan in part, states:
‘G‐4.2. Use of Existing Facilities. Existing industrial facilities or areas and pipeline routes should be used to meet new requirements for exploration and production support bases, transmission/shipment (including pipelines and transportation systems), and distribution of energy resources’
Figure 23: Kenai Borough Land Use Chart
8 During discussions conducted at a meeting between AGDC, Steve O’Malley (SAIC), Mr. Spangler (ConocoPhillips Operations Manager Cook Inlet Area) & Mr. Micciche (Superintendent, Kenai LNG Facility) on 13 Jan 2011 9 Tesoro Alaska Fact Sheet; http://www.docstoc.com/docs/50795169/Tesoro-Alaska 10 ‘The Nikiski industrial area, which includes four major petrochemical processing facilities, is one of the largest industrial complexes in the state’; as defined in the Kenai Peninsula Borough Comprehensive Plan

60 © 2011 AGDC. All Rights Reserved
Figure 24: Kenai Borough Land Use Chart
In discussions with the Kenai Peninsula Coastal District Manager, Mr. Gary Williams11, he explained that before a new energy facility could be built within their Coast Management District (includes East and 11 Meeting between David Haugen (ADGC), Steve O’Malley (SAIC), and Gary Williams (Kenai Peninsula Coastal District Manager) on 13 January 2011

61 © 2011 AGDC. All Rights Reserved
West sides of Cook Inlet and Resurrection Bay) the developers would need to convince the Borough that any existing energy facilities could not be used.
The Borough appears to support locating LPG export facilities in the Borough at the existing sites in Nikiski. Within the goals and objectives section of the Kenai Peninsula Borough Comprehensive Plan the Borough states one of its objectives is ‘To strengthen the development of the Borough’s key economic sectors….Support environmentally responsible oil and gas development.’
There does not appear to be any additional zoning requirements for the Nikiski location outside of those imposed by the Borough (Figure 25).

62 © 2011 AGDC. All Rights Reserved
Figure 25: Areas with Local Zoning
Availability of land: There is a significant amount of land on the existing LNG facility that is not being used. In addition, the Agrium facility has been closed down and appears to contain sufficient land on which a NGL facility could be built. Both of these options would comply with the requirement to reuse existing facilities if possible. Most of the land in this immediate area is privately owned (Figure 26).
Figure 26: Land Ownership

63 © 2011 AGDC. All Rights Reserved
Suitability of the area: The primary advantages of Nikiski are pre-existing infrastructure and marine terminal facilities in the area. This would allow the LPG fractionation and export terminal to be co-located, eliminating the need to two storage works. Development of an LPG export terminal in the Nikiski industrial area does not seem to conflict with existing master plans and would bring welcomed jobs to the area. The proposed site is served by highway and is connected to local utilities. The Fire Department, with responsibility for this area, lists its service capability as residential, industrial, and wild fire suppression.12 The drawback of using Nikiski to site an NGL terminal is that the site would be within Zone 2 of the Beluga protection area under the proposed regulations.
4.6.2 Port MacKenzie
Port MacKenzie is located at the top of the Cook Inlet in the Knik Arm across from Anchorage, which is the largest population center in the state. This port has an existing deep water berth and has unfunded but developed plans to expand the pier. The Matanuska-Susitna Borough master plan encourages the development of an LPG export facility in the port. There is adequate space for an LPG fractionation and export facility and their safety radiuses on the landside industrial area of the port (Figure 27).
Figure 27: Port MacKenzie
12 http://www.borough.kenai.ak.us/nikiskifire/webpages/home.htm

64 © 2011 AGDC. All Rights Reserved
Figure 28: Port Mackenzie Industrial Sites
However, use of this port for an LPG export terminal would most likely conflict with proposed plans to operate a ferry boat from the port and would disrupt other vessel operations in the port when an LPGC was at berth.
The port is located in the Knik Arm, where ice forms and moves in dense ice flows driven by wind and current. The area is subject to very high winds, and any ship entering the Arm is required to maneuver extensively around a shoal and to line up with the berth. LPGCs have large sail areas and are greatly affected by wind. According to the Pilots13, the tidal currents in the Knik Arm at Port MacKenzie are cyclonic and are not parallel to the berth, therefore much greater force is applied to the ships and piers by the ice and wind14 . Based on the high winds, ice flow density, strong currents, and nature of the cargo being shipped, that periodic disruption to LPG export operations would be experienced at an unacceptable level.
13 In discussions between the President of the Southwestern Pilots Association, Captain Pierce, and Steven O’Malley of SAIC on 7 January 2011 14 If the current was parallel to the pier ice would apply maximum force at the bow or stern of the ship at berth and that strain would also be transferred to the pier. If the current is not parallel maximum force of the ice will be applied to a larger section of the hull resulting in total greater forces.

65 © 2011 AGDC. All Rights Reserved
While arguably an LPGC could be brought safely to berth with the use of 2 large tugboats 15 during ideal conditions, the planned LPGC operations will require year round operations uninterrupted or delayed by local weather or port conditions. Bringing in an LPGC into this port during adverse conditions would be unnecessarily risky and probably would not gain the approval of agencies with regulatory jurisdiction due to unnecessary risk when lower risk options exist nearby.
Long term viability of deep draft ship operations of any kind at Port MacKenzie requires continually dredging of the entry channels and portions of the Knik Arm. These costs are increasing rapidly; ‘In the 1980s and 1990s, the average annual excavation at the port was between 250,000 and 500,000 cubic yards of sediment. Starting about a decade ago, the excavation shot up to 800,000 to 1.4 million cubic yards annually16.’ There is a growing shoal that has become a major safety concern for ships entering the Arm. Currently deep draft ships entering the Knik Arm must time their arrivals at the shoals for one hour past low water. It is estimated that liquefied natural gas carriers would need to wait until 3 hours after low water to enter the Knik Arm17, and since the planned LPGCs would draw the same amount of water they would be subject to the same restrictions.
The terminal would be within Zone 1 of the Beluga protection zone under the proposed regulations. The exact impact of these regulations cannot be determined at this time since the proposed regulations are being challenged in court however an active NGL terminal would increase deep draft ship traffic by 17-25 percent depending on the size LPGC used18 .
It would be difficult to construct an argument to bring LPGCs into a water body subject to major maritime challenges that is also; the home to a major population center, a strategic port, an area of significant environmental concern, bordered by a very important commercial airport, a critical tank farm, and strategic Department of Defense bases, when lower risk options exist nearby.
4.7 Supplemental Capex Requirements For Port of MacKenzie
Port MacKenzie is not recommended for an LPG export terminal for reasons previously discussed. However if it was to be selected, certain key capital improvements would be required. Those improvements would include dredging the Port MacKenzie Shoal and installation of a protective breakwater for the ship’s berth.
4.8 Dredging the Port MacKenzie Shoal
The Port MacKenzie Shoal is growing in size and is altering and reducing the size of the existing shipping lane, as shown in Figure 29. The Shoal also impedes deep water ships from entering or leaving the port at low tide.
15 Captain Pierce anticipated that two 7,000 Hp tugs would be needed to bring in a similar sized LNGC, Captain Anderson of Cook Inlet Tug and Barge estimated two 4500-5000 Hp tugs would be needed, and Marc Van Dongen (Port MacKenzie) added that two or more tugs could be used to hold the ships at the berth during periods of high winds. 16 Dredging Today; Cook Inlet Needs Dredging (USA); May 17th, 2010 17 Meeting between Captain Anderson of Cook Inlet Tug and Barge, Steve O’Malley (SAIC), and David Haugen (AGDC) on 11 January 2011. 18 Currently Totem and Horizon Lines each have about 2 port calls a week and represent the majority of deep draft port calls. According to the Cook Inlet Vessel Traffic Study, 2006- Only about 4 tank ships call on the port a year most other oil is moved by barge or pipeline. 1.4 to 2 LPGCs are assumed for this project per month.

66 © 2011 AGDC. All Rights Reserved
Figure 29: Port MacKenzie Shoal
The cost of the dredging is unknown at this time. While Congress did authorize the Army Corps of Engineers to deepen the Upper Cook Inlet shipping lane in 2005, the Corps must conduct a study to define the problem and environmental impacts before it can begin dredging19. Funding for that study must be provided equally by the Corps and state or local entities. If the study concludes dredging is needed, the state or local governments may be required to pay a share of the costs. The estimated cost of the initial study is estimated to be $2,000,000, so the state or local governments would be required to pay $1,000,000. To date the state or local governments have not been able to commit this funding.
4.9 Installation of a Protective Breakwater
According to an Alaskan Department of Transportation Report20, “The ice season in Knik Arm generally begins in mid or late October, and ends in April or May. Knik Arm is usually ice-clogged from December through March. Ice in the Knik Arm occurs primarily as either floe ice or shore-fast ice. Floe ice forms from freezing of the water surface and may reach a maximum thickness of up to 3 feet depending on the severity of the winter. Extreme tides and currents in Knik Arm prevent floe ice from forming a continuous cover. Shore-fast ice is formed by successive flooding and draining of the tidal flats. The thickness of this ice can reach as much as 15 feet in Cook Inlet. Blocks of shore-fast ice occasionally break loose and are carried into the Inlet by currents and prevailing winds.” The Port is located at the narrowest point of the Arm, so the currents will be the higher and the ice floes more densely packed. This combined expected in Northerly winds of sustained speeds of 40 to 57 mph21 requires the construction of a breakwater to deflect the ice from pressing against a VLGC at berth as illustrated in Figure 30.
19 Anchorage Daily News; 16 May 2010; http://www.adn.com/2010/05/15/1280101/growing-shoal-near-port-narrowing.html 20 Port Mackenzie Access Road; Project No. ACHDP-SDP-0001(370)/58168; Geotechnical Report, 1999; http://www.dot.state.ak.us/stwddes/addenda/33973/58168_geotech.pdf 21 IBID 2

67 © 2011 AGDC. All Rights Reserved
Figure 30: Breakwater Illustration
Such a breakwater would be 1700 to 2000 feet long or longer depending on an engineering analysis. An environmental impact study would need to be conducted and would probably cost about as much as the Port MacKenzie Shoal removal study ($2M). The cost of the breakwater is roughly estimated to cost between and $16,00022 and $17,00023 a foot (total of $27M-$34M) depending on the type of breakwater construction determined necessary. It is unknown if an Environmental Impact Study will produce results that would allow for the construction of a breakwater or what would be the costs of mitigation measures prescribed.
4.10 Other cost factors:
1. The assumption used on the existing pier is that it was designed to handle ships of a similar size of the VLGCs planned. There would be additional cost of removing the existing conveyor loading system on the pier and installation of LPG transfer systems. The cost of the LPG transfer systems is included in the facility estimates. Cost of removing and disposing of the existing conveyor system is estimated to be $250-$400K.
2. Two tug boats (at a minimum) would be required to bring the VLGC to and from its berth. Based on posted rates for tugs with 5,000+ horsepower the cost would be24:
22 Floating Breakwater,Theoretical study of a dynamic wave attenuating system; M.W.Fousert; 15 Dec 2006; Delft University of Technology; http://www.superfloats.com/reference_library/floatingbreakwater/floating%20breakwater-theoretical%20study%20of%20a%20dynamic%20wave%20attenuating%20system.pdf 23 U.S. Army Corps of Engineers award a $4.2M contract in 2009 to extend a breakwater in Seward 250 feet. 24 http://www.crowley.com/What-We-Do/Harbor-Ship-Assist-and-Tanker-Escort/Fleet-Description/Locations/Cook-Inlet-Alaska

68 © 2011 AGDC. All Rights Reserved
Cost per hour per tug: $1850 Minimum hours: 4 Number of tugs: 2 Number of times needed per voyage: 2 Total minimum charge per voyage: $29,600*
*The cost will be higher in the winter when ice will need to be cleared from the berth or when winds are higher and a third tug is needed.
3. Operations will be disrupted when the wind speed is too high in the Knik Arm.
4.10.1 Port of Anchorage
The Port of Anchorage, located at the top of the Cook Inlet in the Knik Arm, has existing deep water berths. The port is currently being expanded (Figure 31) and will use most of the remaining industrial waterfront. A large military base bordering the port prevents further expansion. Anchorage and vicinity is the major population center in the state. While the Port of Anchorage was ultimately ranked third in preference, the raw score it received was nearly twice that of the location ranked second (lower score was better) and was not considered viable after the preliminary assessment.
Figure 31: Port Expansion Plan
The drawbacks to the Port of Anchorage as a site of an LPG export terminal are:
1. Space for the LPG fractionation facility and export terminal plus its safety radiuses would need to come from existing operations.
2. Unless container operations were disrupted each time a LPGC arrived, another deep water berth would need to be dredged.

69 © 2011 AGDC. All Rights Reserved
NOTE: The following three potential LPG export terminal locations (i.e., Seward, Homer, and “Other Kenai Peninsula Locations”) and Nikiski are located in the Kenai Borough and its Coastal Management Plan area. Since Nikiski is an existing LNG (energy) facility, other locations in Kenai Borough would be deemed unacceptable unless it could be proven that the existing LNG terminal could not be expanded to incorporate an NGL Processing Facility and shipping terminal. No engineering or other constraints were uncovered by the project team that would prevent expansion of the Nikiski facility.
3. Dredging costs in the Knik Arm are increasing dramatically, and dredging would need to continue.
4. The terminal would be within Zone 1 of the Beluga protection zone under the proposed regulations.
5. Icing, very strong currents and a shoal make navigation in the Knik Arm difficult especially when the LPGC is empty and would be greatly affected by winds (the ship would have a very high freeboard).
6. The distance a ship calling on this port would need to travel from sea to berth is the longest of the potential sites.
4.10.2 Other Kenai Peninsula Locations
There are numerous sparsely populated areas along the Kenai Peninsula between Homer and Anchorage that could conceivably be used to build a greenfield LPG fractionation facility and export terminal. Much of the northern shore of the Kenai Peninsula is part of protected areas (i.e., Kenai National Wildlife Refuge and Chugach National Forest). At locations along the western shore of the Kenai Peninsula, piers 300-500 meters long would need to be constructed, which would seem to be in conflict with the existing coastal management plan. Most of this area is in either Zone 1 or Zone 2 of the Beluga protection areas under the proposed regulations. As with Nikiski, fast currents and drifting ice present navigation hazards and threats to piers. A rural Greenfield site in these areas provides safety advantages due to the low population density. But these sites would also need more infrastructure development, and likely have greater environmental impacts due to pier construction on a relatively natural coastline.
4.10.3 Seward Marine Industrial Center
The Seward Marine Industrial Center Is located on Resurrection Bay. Resurrection Bay is only about 20 miles long, which provides the shortest distance for ships to travel from sea to berth. The Bay is ice free, and the problem of ice flows from the Knik Arm is not an issue. The Bay is also narrow and deep, eliminating the need for very long piers for deep water berths. Seward is the terminus for the Alaskan Railway and is also connected by highway to Anchorage. For purposes of the NGL processing Facility location evaluation, this is especially relevant for the Fairbanks site and a relative advantage as compared to Port MacKenzie in that railroad infrastructure is already constructed. In addition, the City of Seward appears to be looking for an economic use of its Marine Industrial Center (Figure 32). The land needed for the LPG export terminal would be on the former sawmill site. This land is for sale and is available, according to the Seward City Manager25.
25 Discussion held between David Haugen (AGDC), Steve O’Malley (SAIC), and Phillip Oats (Seward City Manger) by telephone conference on 11 January 2011.

70 © 2011 AGDC. All Rights Reserved
Figure 32: Seward Marine Industrial Center
The Drawbacks to locating an LPG export terminal in Seward Marine Industrial Center are as follows:
1. Export of LPG through this port would require development of a complex rail tank car unloading system.
2. Export of LPG would require extensive breakwater construction to prevent swells from the sea and those being reflected back by the end of the Bay.
3. The current sawmill pier would need to be enlarged.
4. Locating the LPG export terminal next to the local prison requires careful planning to avoid safety zone infractions.
5. The Kenai Coastal Management Plan states that existing facilities should be reused prior to construction of new facilities, and this would be a new facility.
4.10.4 Homer
Homer is located in the Cook Inlet is about 65 miles by ship from the entrance to the Inlet. Homer has a large natural spit of land projecting into the Inlet (Figure 33). The spit has deep water berths. Homer is served by a highway that connects it to Anchorage. The waters on the West Side of the spit are not affected by the potential Beluga Whale management regulations. Accessing the existing natural gas pipeline network would entail running a new pipeline to Soldotna, which would be about 55-60 miles long. This represents the approximate additional length of an NGL liquids pipeline to tidewater in this case compared to the Nikiski port location.

71 © 2011 AGDC. All Rights Reserved
Figure 33: Homer Spit
The drawbacks of using the Homer Spit to site an LPG export terminal are:
1. Development of a NGL Fractionation Facility and export shipping terminal does not fit into the existing master plan for the development of the Spit. The needed safety radiuses would force relocation of existing commercial operations and tourist businesses.
2. The Kenai Peninsula Borough Coast Management specifies the reuse of existing energy facilities (if they exist), and such facilities exist north of Homer in Nikiski.
3. Requires a longer NGL product pipeline to provide feedstock to the LPG fractionation plant.
Based on the tidewater evaluation criteria performed by SAIC, the following final evaluation was completed.

72 © 2011 AGDC. All Rights Reserved
Table 41 Final Tidewater Site Rankings
Factor Impact on the Environment
Infrastructure Needs
Compatibility with Existing
Plans
Safety and Security Needs Complexity
Overall Rank
Factor weight 0.2 0.2 0.2 0.2 0.2 Proposed Site Nikiski 1 1 1 1 2 1.2 Port MacKenzie 2 3 2 4 1 2.4 Port of Anchorage 3 2 6 6 4 4.2 Western Kenai Peninsula (Greenfield sites) 5 6 4 3 3 4.2 Seward Marine Industrial Center 6 5 3 2 6 4.4 Homer 4 4 5 5 5 4.6
4.11 Conclusion
Based on the evaluation of the potential tidewater sites, the two sites with highest potential to support long term LPG exports are Nikiski and Port MacKenzie. Nikiski was determined to be the preferred tidewater location for an LPG product terminal based on the high-level assessment conducted in this study. The primary advantages associated with the Nikiski tidewater port location over the Port MacKenzie tidewater port location are as follows:
E) Operational and safety issues associated with strong currents, wind, and ice flows Port MacKenzie represents a higher level of risk to the “day to day” docking, loading, and maneuvering activities;
F) While Port MacKenzie technically meets safety requirements associated with zones separation of facilities handling combustible materials, the Nikiski port area is proven with regard to loading and shipping of petroleum based products;
G) Environmentally, the existing Nikiski port minimizes risk as compared to bringing VLGC into the Knik arm area; and
H) The capital improvements, including shoal dredging near Port MacKenzie, will be required to avoid potential grounding of VLGC vessels.
Taking into consideration the items mentioned above, Nikiski is considered the superior location for the LPG fractionation facility and export terminal.

73 © 2011 AGDC. All Rights Reserved
5.0 NGL PROCESSING FACILITY SITING ANALYSIS
The objective of the NGL Processing Facility siting analysis is to determine the technical portion of the net back pricing analysis. The siting location evaluation for NGL Processing Facility is critical in order to make sure the best economic solution is also technically feasible. Based on different geographic locations, capital expenses can vary greatly.
The NGL Processing Facility can be located at the tide water shipping terminal or potentially at a remote location with NGL products being transported to the shipping terminal. NGL Processing Facility location evaluation points are Big Lake, Nikiski, and Dunbar. Regardless of the location, the NGL Processing Facility components would essentially be the same.
5.1 Case 3.1.1 Big Lake Extraction Facility/LPG Product Shipping from Port MacKenzie
For Big Lake, the main 24 inch natural gas feedstock pipeline would route from Prudhoe to the Dunbar/Nenana area, include the Fairbanks lateral and Straddle Plant, trend generally south southwest and terminate at land reserved for industrial use. This industrial area is southwest of Big Lake and will ultimately be the junction two major regional roads – the upgraded Burma Road and the South Big Lake (Figure 34). At the industrial site, the extraction and intermediate storage works would be contained within 15 acre grounds. The NGL products would be transported via pipeline to the fractionation plant and LPG storage at Port MacKenzie. By having the fractionation plant at Port MacKenzie rather than Big Lake, LPG product quality control during transportation is simplified.
Reasonable highway access can be achieved from highways (see Figure 35) to the greater Anchorage area. Rail service is currently limited; however, there are future plans by the Alaska Railroad to expand service into the area (see Figure 35). From Big Lake, the NGL products can be delivered by pipeline to the marine terminal at Port MacKenzie.
Big Lake, Alaska is an unicorportated town in the Matanuska-Susitna Borough. The geography of the area is one of mostly low rolling hills, lakes and streams. Big Lakes development is guided by the Matanuska-Susitna Borough master/strategic Plans26,27 (Figure 45) and the Big Lakes Comprehensive Plan (Figure 34)28. The area is also contained within the Southeast Susitna Area Plan administered by the Alaskan Department of Natural Resources (DNR) (Figure 34 & 35) 29. In addition the Lake, wetlands, and surrounding land within 75 feet of the ordinary high water line itself is part of the Matanuska-Susitna Coastal Management Plan30. However, since there are no plans to build upon areas contained in the Coastal Management area, this plan should have no bearing on the project.
26 Mat-Su Economic Development Strategic Plan; http://www.matsugov.us/index.php?option=com_docman&task=doc_view&gid=2806&tmpl=component&format=raw&Itemid=238 27 Matanuska-Susitna Borough Strategic Plan 2009; http://www.matsugov.us/docman/doc_view/3020-msbstrategicplan?tmpl=component&format=raw 28http://www.biglakecommunitycouncil.com/yahoo_site_admin/assets/docs/Big_Lake_Comprehensive_Plan_2009_FINAL.37212404.pdf ; Big Lake Planning Team, Matanuska-Susitna Borough and Agnew: Beck Consulting; August 2009 29 Southeast Susitna Area Plan; http://dnr.alaska.gov/mlw/planning/areaplans/ssap_prd/index.htm 30 Matanuska-Susitna Coastal Management Program is based on the Federal Coastal Zone Management Act of 1972 and the Alaska Management Act of 1978

74 © 2011 AGDC. All Rights Reserved
Figure 34: Boundary of Matanuska-Susitna Borough Master Plan

75 © 2011 AGDC. All Rights Reserved
Figure 35: Boundaries of the Big Lake Comprehensive Plan

76 © 2011 AGDC. All Rights Reserved
Figure 36: Southeast Susitna Area Plan

77 © 2011 AGDC. All Rights Reserved
Figure 37: Southeast Susitna Area Plan
Impact of State/Borough/town master planning on the construction of the proposed NGL take off facility: None of the master plans precludes the development of a NGL facility within the Big Lakes area. Numerous restrictions do apply if the facility was to be built within 75 feet of a water body or wetland; however, this is not anticipated.
There is a strong desire in the Borough and Town plans for the creation of commercial operations that would provide jobs and provide a more stable tax base. In the Matanuska-Susitna Borough Strategic Plan 2009 this is expressed in: “GOAL #5: To enhance employment and economic opportunities. Objective #1: To identify those actions that may be taken to enhance the economic and employment opportunities of our citizens and businesses in order to strengthen family and business incomes, reduce poverty, increase economic diversity, and reduce the Borough’s reliance on property taxes”. In the Big Lake plan it is discussed in Chapter 3: “Strengthen the Big Lake Economy – Improve local opportunities for jobs and businesses, to help Big Lake become a stronger, more stable year round community. Business development is encouraged to provide a stable economic financial base in addition to a more stable tax base.”
In regard to the specific location of industrial sites the Big Lake plan states “Highway-oriented commercial/light industrial uses are encouraged in two areas: the area around the existing airport and the area southwest of Big Lake that ultimately will be the junction two major regional roads – the upgraded Burma Road and the South Big Lake”. While the NGL facility may not be exclusively a highway oriented business, it would be classified as a light industrial facility. A majority of the available land is either privately owned or owned by the

78 © 2011 AGDC. All Rights Reserved
Borough. The State does own some land in this area, and its usage and availability is governed by Southeast Susitna Area Plan (“SSAP”). This plan is applicable to general state uplands, shorelands, tidelands, and submerged lands within the planning boundary. It does not apply to federal, municipal, private, University of Alaska, Alaska Department of Transportation and Public Facilities, or Mental Health Trust lands. “DNR will sell, lease, or protect for future use suitable land for private commercial and industrial uses”.
Figure 38: Burma Road Upgrade
Suitability of the area: Development of an NGL facility in the Big Lake area does not seem to conflict with existing master plans and would bring welcome jobs to the area. Care would need to be taken to ensure the facility is not near a wetland or a water body. The area is served by highways and local utilities are available. A review of the capability of the existing fire department should be conducted to determine if additional equipment or training would be prudent31.
The primary advantage of Big Lake is a shorter NGL product pipeline to Port MacKenzie than Nikiski.
31 The Central Mat-Su Fire Department website indicates that they provide ‘suburban/bedroom ‘ fire services
http://www.firehouse.com/region/departments/central-mat-su-fire-department
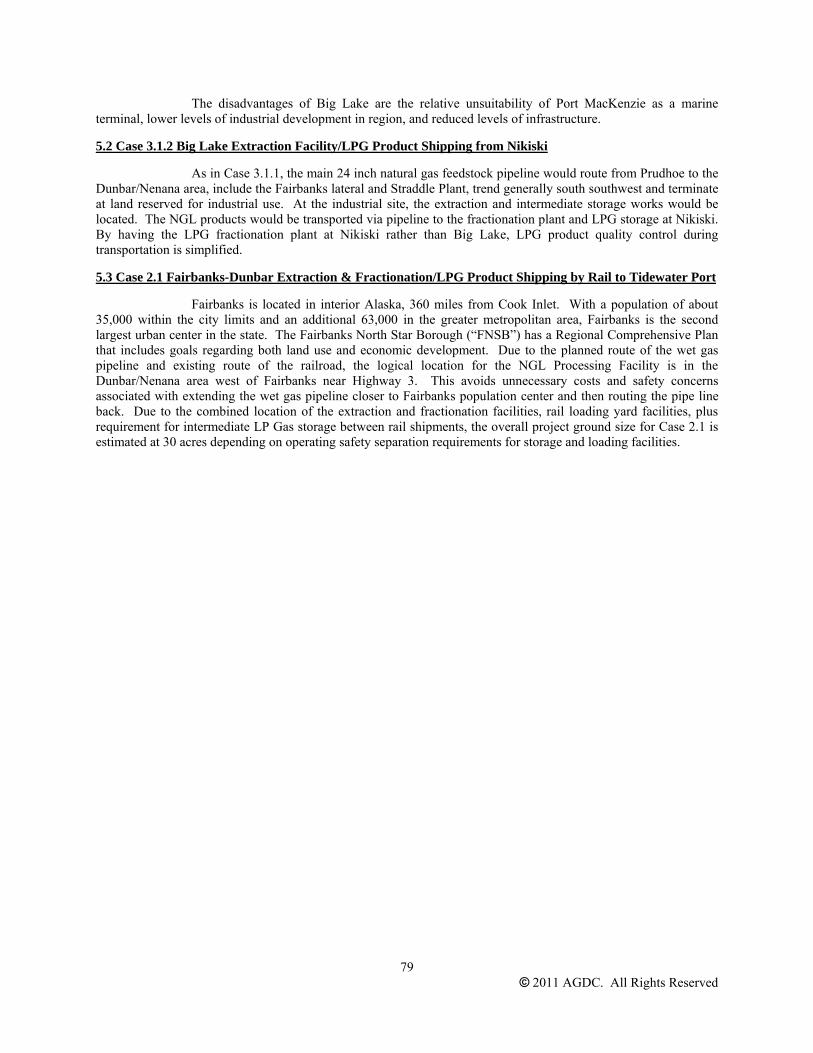
79 © 2011 AGDC. All Rights Reserved
The disadvantages of Big Lake are the relative unsuitability of Port MacKenzie as a marine terminal, lower levels of industrial development in region, and reduced levels of infrastructure.
5.2 Case 3.1.2 Big Lake Extraction Facility/LPG Product Shipping from Nikiski
As in Case 3.1.1, the main 24 inch natural gas feedstock pipeline would route from Prudhoe to the Dunbar/Nenana area, include the Fairbanks lateral and Straddle Plant, trend generally south southwest and terminate at land reserved for industrial use. At the industrial site, the extraction and intermediate storage works would be located. The NGL products would be transported via pipeline to the fractionation plant and LPG storage at Nikiski. By having the LPG fractionation plant at Nikiski rather than Big Lake, LPG product quality control during transportation is simplified.
5.3 Case 2.1 Fairbanks-Dunbar Extraction & Fractionation/LPG Product Shipping by Rail to Tidewater Port
Fairbanks is located in interior Alaska, 360 miles from Cook Inlet. With a population of about 35,000 within the city limits and an additional 63,000 in the greater metropolitan area, Fairbanks is the second largest urban center in the state. The Fairbanks North Star Borough (“FNSB”) has a Regional Comprehensive Plan that includes goals regarding both land use and economic development. Due to the planned route of the wet gas pipeline and existing route of the railroad, the logical location for the NGL Processing Facility is in the Dunbar/Nenana area west of Fairbanks near Highway 3. This avoids unnecessary costs and safety concerns associated with extending the wet gas pipeline closer to Fairbanks population center and then routing the pipe line back. Due to the combined location of the extraction and fractionation facilities, rail loading yard facilities, plus requirement for intermediate LP Gas storage between rail shipments, the overall project ground size for Case 2.1 is estimated at 30 acres depending on operating safety separation requirements for storage and loading facilities.
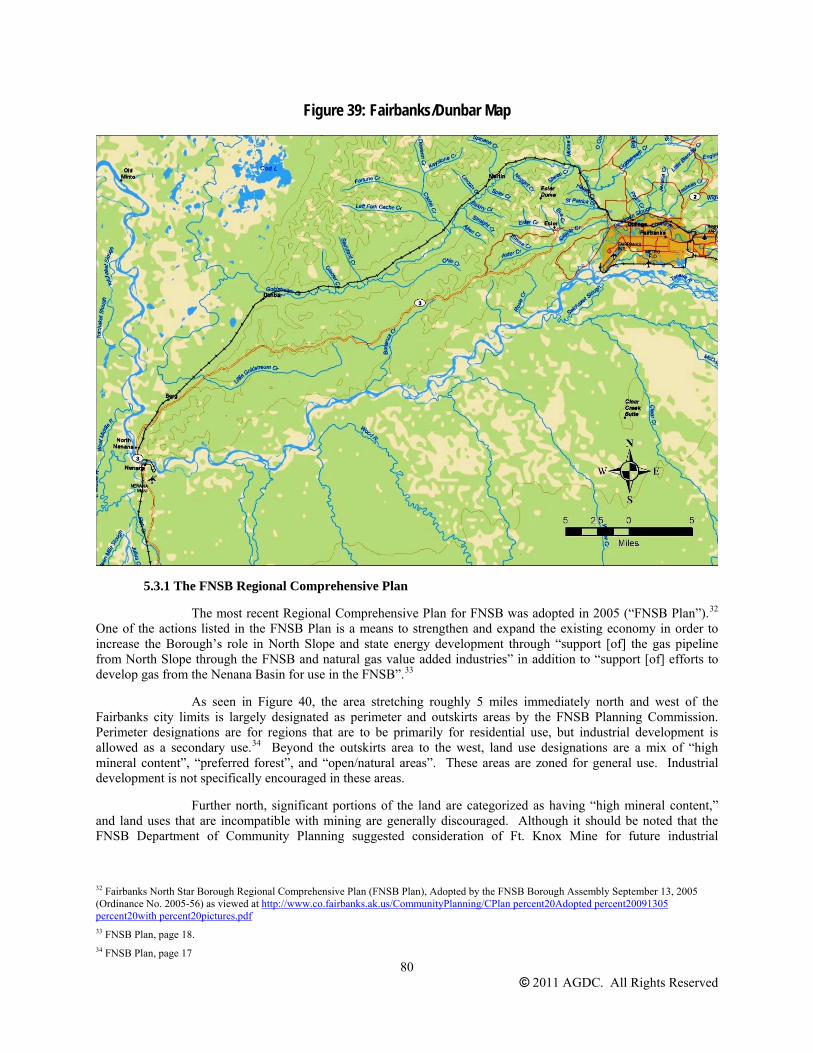
80 © 2011 AGDC. All Rights Reserved
Figure 39: Fairbanks/Dunbar Map
5.3.1 The FNSB Regional Comprehensive Plan
The most recent Regional Comprehensive Plan for FNSB was adopted in 2005 (“FNSB Plan”).32 One of the actions listed in the FNSB Plan is a means to strengthen and expand the existing economy in order to increase the Borough’s role in North Slope and state energy development through “support [of] the gas pipeline from North Slope through the FNSB and natural gas value added industries” in addition to “support [of] efforts to develop gas from the Nenana Basin for use in the FNSB”.33
As seen in Figure 40, the area stretching roughly 5 miles immediately north and west of the Fairbanks city limits is largely designated as perimeter and outskirts areas by the FNSB Planning Commission. Perimeter designations are for regions that are to be primarily for residential use, but industrial development is allowed as a secondary use.34 Beyond the outskirts area to the west, land use designations are a mix of “high mineral content”, “preferred forest”, and “open/natural areas”. These areas are zoned for general use. Industrial development is not specifically encouraged in these areas.
Further north, significant portions of the land are categorized as having “high mineral content,” and land uses that are incompatible with mining are generally discouraged. Although it should be noted that the FNSB Department of Community Planning suggested consideration of Ft. Knox Mine for future industrial
32 Fairbanks North Star Borough Regional Comprehensive Plan (FNSB Plan), Adopted by the FNSB Borough Assembly September 13, 2005 (Ordinance No. 2005-56) as viewed at http://www.co.fairbanks.ak.us/CommunityPlanning/CPlan percent20Adopted percent20091305 percent20with percent20pictures.pdf 33 FNSB Plan, page 18. 34 FNSB Plan, page 17
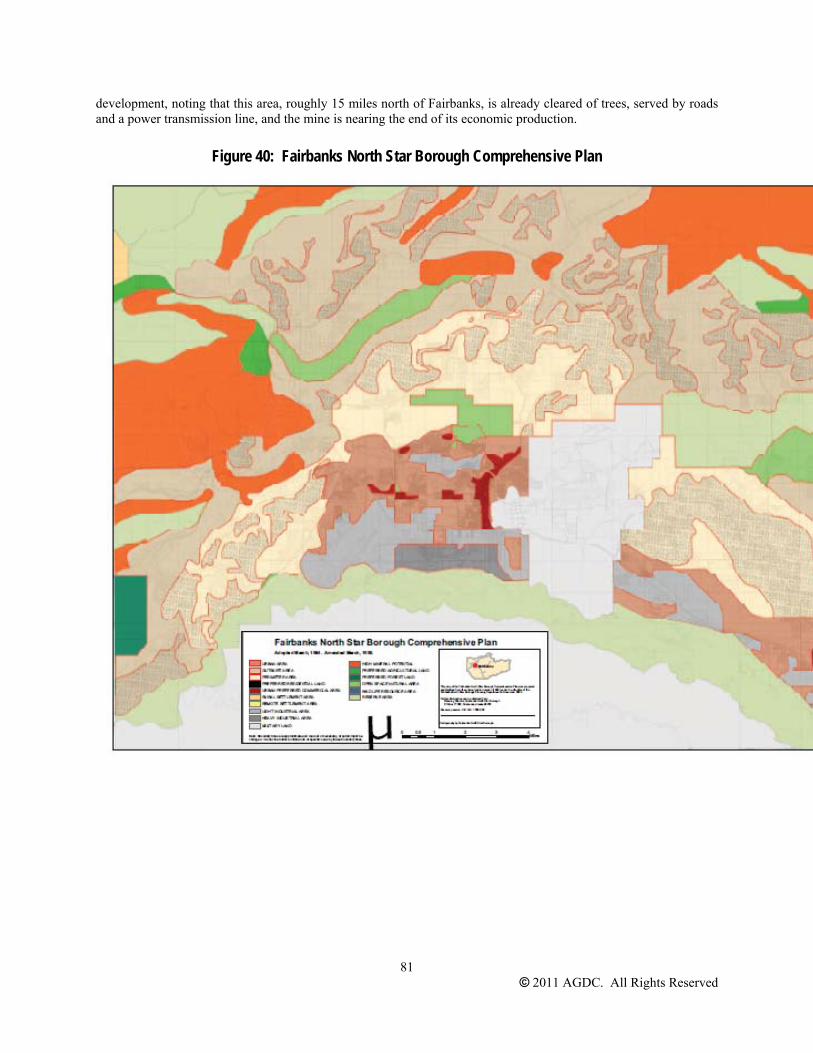
81 © 2011 AGDC. All Rights Reserved
development, noting that this area, roughly 15 miles north of Fairbanks, is already cleared of trees, served by roads and a power transmission line, and the mine is nearing the end of its economic production.
Figure 40: Fairbanks North Star Borough Comprehensive Plan
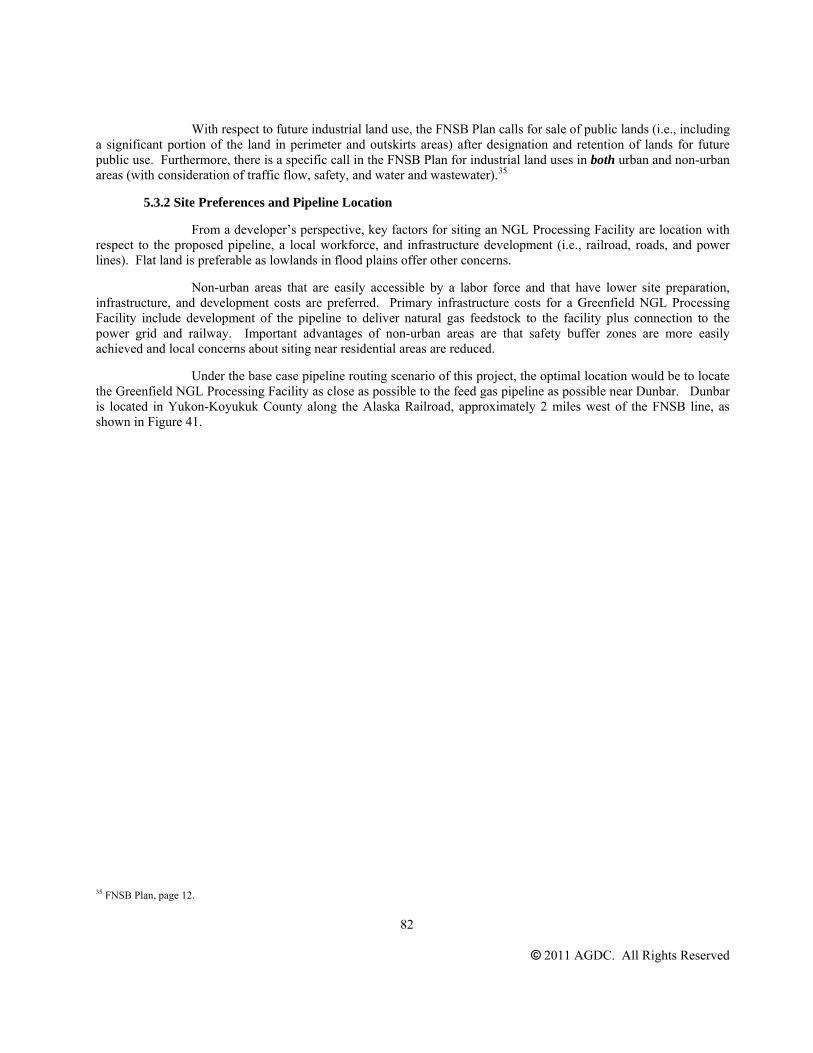
82
© 2011 AGDC. All Rights Reserved
With respect to future industrial land use, the FNSB Plan calls for sale of public lands (i.e., including a significant portion of the land in perimeter and outskirts areas) after designation and retention of lands for future public use. Furthermore, there is a specific call in the FNSB Plan for industrial land uses in both urban and non-urban areas (with consideration of traffic flow, safety, and water and wastewater).35
5.3.2 Site Preferences and Pipeline Location
From a developer’s perspective, key factors for siting an NGL Processing Facility are location with respect to the proposed pipeline, a local workforce, and infrastructure development (i.e., railroad, roads, and power lines). Flat land is preferable as lowlands in flood plains offer other concerns.
Non-urban areas that are easily accessible by a labor force and that have lower site preparation, infrastructure, and development costs are preferred. Primary infrastructure costs for a Greenfield NGL Processing Facility include development of the pipeline to deliver natural gas feedstock to the facility plus connection to the power grid and railway. Important advantages of non-urban areas are that safety buffer zones are more easily achieved and local concerns about siting near residential areas are reduced.
Under the base case pipeline routing scenario of this project, the optimal location would be to locate the Greenfield NGL Processing Facility as close as possible to the feed gas pipeline as possible near Dunbar. Dunbar is located in Yukon-Koyukuk County along the Alaska Railroad, approximately 2 miles west of the FNSB line, as shown in Figure 41.
35 FNSB Plan, page 12.
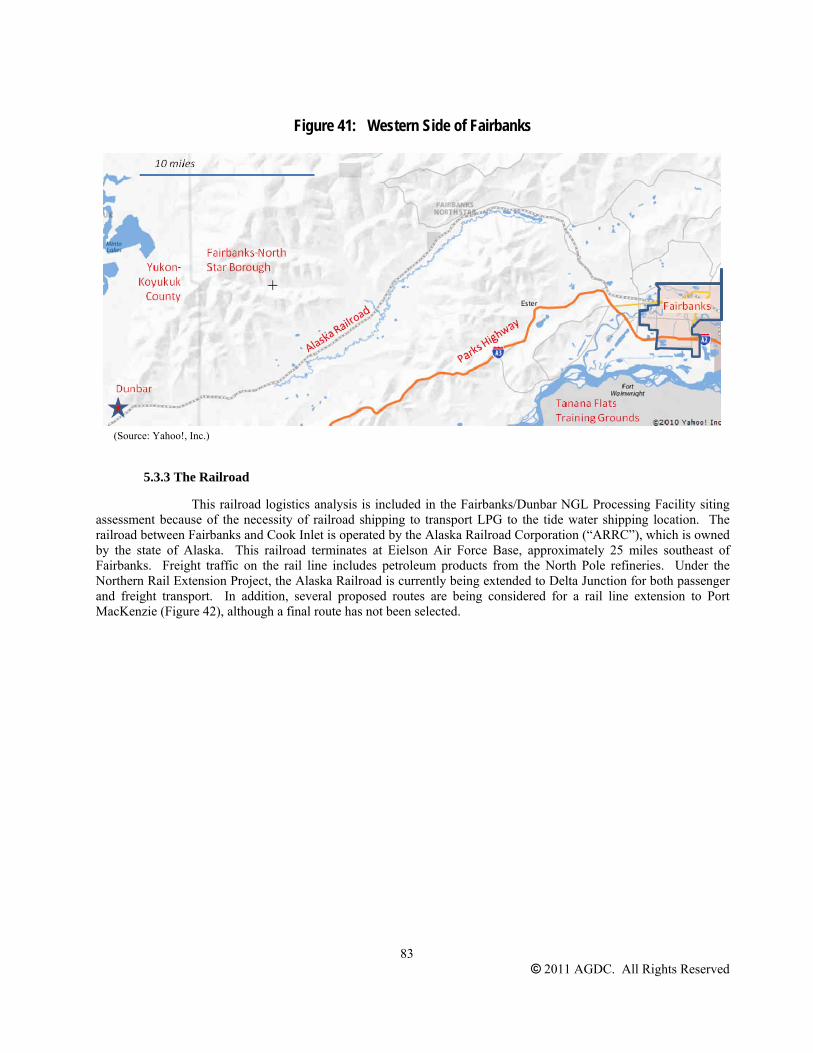
83
© 2011 AGDC. All Rights Reserved
Figure 41: Western Side of Fairbanks
(Source: Yahoo!, Inc.)
5.3.3 The Railroad
This railroad logistics analysis is included in the Fairbanks/Dunbar NGL Processing Facility siting assessment because of the necessity of railroad shipping to transport LPG to the tide water shipping location. The railroad between Fairbanks and Cook Inlet is operated by the Alaska Railroad Corporation (“ARRC”), which is owned by the state of Alaska. This railroad terminates at Eielson Air Force Base, approximately 25 miles southeast of Fairbanks. Freight traffic on the rail line includes petroleum products from the North Pole refineries. Under the Northern Rail Extension Project, the Alaska Railroad is currently being extended to Delta Junction for both passenger and freight transport. In addition, several proposed routes are being considered for a rail line extension to Port MacKenzie (Figure 42), although a final route has not been selected.

84
© 2011 AGDC. All Rights Reserved
Figure 42: Proposed Rail Extension to Port MacKenzie
Current rolling stock operating on the Alaska Railroad includes 51 locomotives, two power cab cars, 48 passenger cars, 457 fuel tankers, 350 flat cars, 460 hoppers, 31 air dumps and 14 box cars.36 An NGL facility in Fairbanks area would add 100 plus freight cars (specialized for NGL transport) for operation on this railroad, which should be manageable from an operations standpoint.
5.3.4 Rail Transportation Costs
The Alaska Railroad Corporation (“ARRC”) operates and maintains freight and passenger traffic between Fairbanks and Anchorage with continuing service to Seward (Figure 43).
36 Northern Extension Rail Project, Railway-Technology.com -- The Website for the Rail Industry, as viewed at http://www.railway-technology.com/projects/northern-rail/

85
© 2011 AGDC. All Rights Reserved
Figure 43: Alaska Railroad Route
In the case of the NGL Processing Facility being sited in Dunbar, propane and butane products would be shipped by rail to a tidewater location. Currently the Matanuska – Susitna Borough and ARRC are considering an extension from existing rail line passing to the Northwest of the Knik Arm to the Port MacKenzie district (Figure 44). This would allow rail cars of propane and butane to be transported directly to a future unloading and storage facility for export to Asian markets. Conversely, the existing ARRC rail network has a line that travels to the port city of Seward. ARRC already exports coal from the Seward port, and an evaluation of suitability for NGL export is contained in the report.

86
© 2011 AGDC. All Rights Reserved
Figure 44: Overview of Proposed Port MacKenzie Rail Extension Route Alternatives
The Fairbanks Case 2.1 requires that LPG be transported to a tide water port, so rail transportation is required from Dunbar. According to ARRC, propane and butane can be moved in 30,000 gallon capacity pressurized

87
© 2011 AGDC. All Rights Reserved
rail cars. A nominal NGL production of 37,000 barrels of propane and butane per day results in approximately 50 rail cars of product being generated per day. The ARRC quotation requires minimum train lengths of 70 cars, therefore a train arrangement of 100 cars is being utilized to generate rail transportation charges. ARRC quotation for transport to Port MacKenzie is estimated at $3,990 per car with a 12 hour one-way transit time; transport to Seward is estimated at $4,145 with a 24 hours one-way transit time. This results in a comparable fee of $1.45 and $1.51 per dekatherm respectively. (It is noted that 1 dekatherm is the same as 1 MMBTU.)
In order to obtain rail tanker car cost information, SAIC contacted the Greenbrier Companies (“Greenbrier”) of Lake Oswego, Oregon. Greenbrier is an international company that includes railcar manufacturing and leasing in its core business. For 30,000 gallon propane tank cars, Greenbrier estimated a lease rate of $850 per car per month for a five year term. Depending on rail service to Port MacKenzie or Seward, rail car needs would be 100+ plus and 200+ respectively. Greenbrier indicated an initial rail car fabrication set up time of four to five months followed by a production rate of 20 cars per week. This capital cost is included in the Fairbanks Extraction Plant scenario net back analysis.
The equivalent overall levelised rail fee (including storage, loading and transportation) over a 20 year period to transport the LPG from Dunbar to the tidewater loading port is estimated at around $20112.51/MMBTU sold from the North Slope.
5.4 Conclusion
Based on the NGL Processing Facility siting analysis, the concept of locating the NGL Processing Facility at either the Big Lake or Dunbar area is technically (as distinct from economically) feasible.
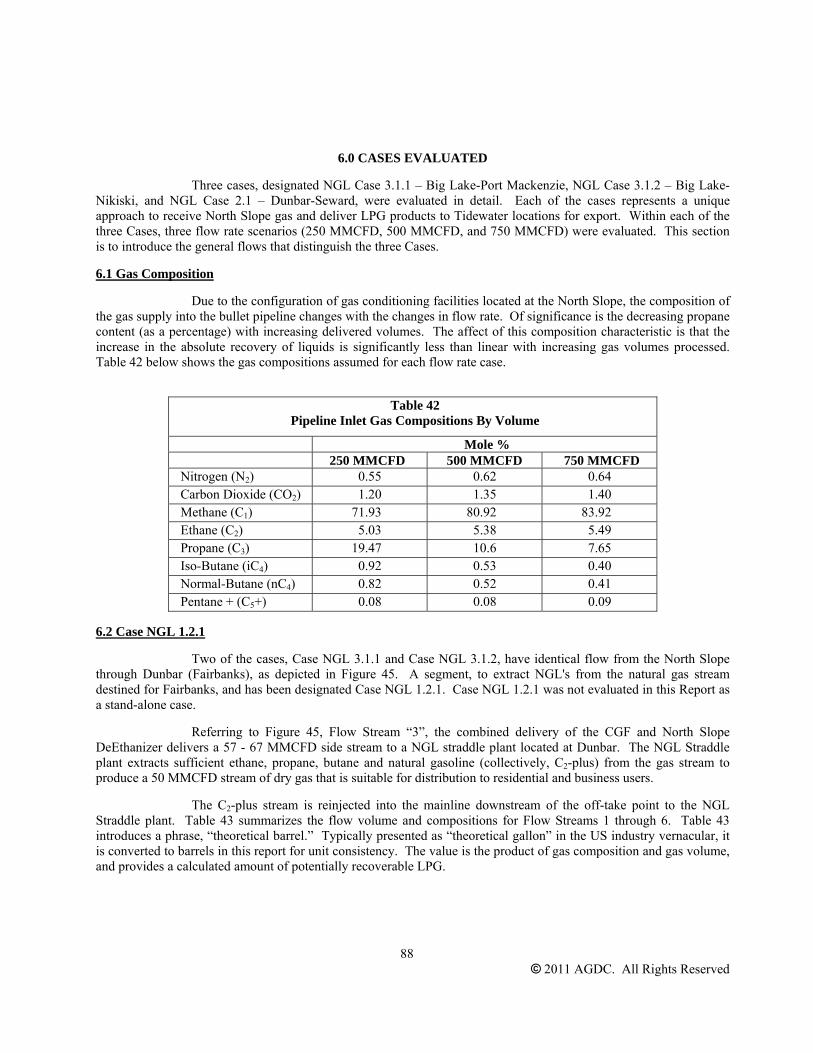
88
© 2011 AGDC. All Rights Reserved
6.0 CASES EVALUATED
Three cases, designated NGL Case 3.1.1 – Big Lake-Port Mackenzie, NGL Case 3.1.2 – Big Lake-Nikiski, and NGL Case 2.1 – Dunbar-Seward, were evaluated in detail. Each of the cases represents a unique approach to receive North Slope gas and deliver LPG products to Tidewater locations for export. Within each of the three Cases, three flow rate scenarios (250 MMCFD, 500 MMCFD, and 750 MMCFD) were evaluated. This section is to introduce the general flows that distinguish the three Cases.
6.1 Gas Composition
Due to the configuration of gas conditioning facilities located at the North Slope, the composition of the gas supply into the bullet pipeline changes with the changes in flow rate. Of significance is the decreasing propane content (as a percentage) with increasing delivered volumes. The affect of this composition characteristic is that the increase in the absolute recovery of liquids is significantly less than linear with increasing gas volumes processed. Table 42 below shows the gas compositions assumed for each flow rate case.
Table 42
Pipeline Inlet Gas Compositions By Volume
Mole % 250 MMCFD 500 MMCFD 750 MMCFD Nitrogen (N2) 0.55 0.62 0.64 Carbon Dioxide (CO2) 1.20 1.35 1.40 Methane (C1) 71.93 80.92 83.92 Ethane (C2) 5.03 5.38 5.49 Propane (C3) 19.47 10.6 7.65 Iso-Butane (iC4) 0.92 0.53 0.40 Normal-Butane (nC4) 0.82 0.52 0.41 Pentane + (C5+) 0.08 0.08 0.09
6.2 Case NGL 1.2.1
Two of the cases, Case NGL 3.1.1 and Case NGL 3.1.2, have identical flow from the North Slope through Dunbar (Fairbanks), as depicted in Figure 45. A segment, to extract NGL's from the natural gas stream destined for Fairbanks, and has been designated Case NGL 1.2.1. Case NGL 1.2.1 was not evaluated in this Report as a stand-alone case.
Referring to Figure 45, Flow Stream “3”, the combined delivery of the CGF and North Slope DeEthanizer delivers a 57 - 67 MMCFD side stream to a NGL straddle plant located at Dunbar. The NGL Straddle plant extracts sufficient ethane, propane, butane and natural gasoline (collectively, C2-plus) from the gas stream to produce a 50 MMCFD stream of dry gas that is suitable for distribution to residential and business users.
The C2-plus stream is reinjected into the mainline downstream of the off-take point to the NGL Straddle plant. Table 43 summarizes the flow volume and compositions for Flow Streams 1 through 6. Table 43 introduces a phrase, “theoretical barrel.” Typically presented as “theoretical gallon” in the US industry vernacular, it is converted to barrels in this report for unit consistency. The value is the product of gas composition and gas volume, and provides a calculated amount of potentially recoverable LPG.

89
© 2011 AGDC. All Rights Reserved
Figure 45: Case NGL 1.2.1
Case NGL-1.2.1: Straddle on Fairbanks Lateral at DunbarNo LPG Terminal - All NGL’s Re-injected
NGL Straddle FairbanksCity GateFairbanks Lateral
Re-injection of C2+
Mainline
Dunbar
North Slope Deethanizer
CGF
1
2
43
5
6

90
© 2011 AGDC. All Rights Reserved
Table 43 Case NGL 1.2.1
Gas Flow Rate and Compositions at Several Points on Pipeline
250 MMCFD 500 MMCFD 750 MMCFD Theoretical Barrels Theoretical Barrels Theoretical Barrels
Flow Streams
Gas Rate C2 C3-C5 Gas Rate C2 C3-C5 Gas Rate C2 C3-C5
1 204.7 7,440 3,020 454.7 16,525 6,708 704.7 25,611 10,396 2 45.3 542 32,313 45.3 542 32,313 45.3 542 32,313 3 250.0 7,982 35,333 500.0 17,068 39,021 750.0 26,153 42,709 4 49.9 1,641 430 49.8 1,741 209 50.0 1,778 146 5 14.2 404 9,014 6.89 194 4,386 4.9 135 3,094 6 197.2 6,247 34,879 444.8 15,143 38,565 687.8 23,953 41,989
6.3 Case NGL 3.1.1 – Big Lake-Port Mackenzie
In Case NGL 3.1.1 – Big Lake-Port Mackenzie, the gas continues south of flow point 6. The wet gas pipeline runs into Big Lake, with the NGL extraction facility sited there so as to ensure the shortest dry residual gas pipeline distance to the existing Beluga Pipeline. (See Figure 46). An NGL Product pipeline (12 inch diameter) runs from the Big Lake Extraction Plant to Tidewater at Port MacKenzie(10 – 15 miles). The Fractionation Facility is located at Port MacKenzie, along with the LPG product storage for production between export shipments. LPG is loaded at Port MacKenzie to East Asian customers (with Korea being the preferred market). Table 44 reports the volumes associated with the different flow rates. These values are not presented as a complete material balance as the numbers are net of fuel usage.
Note: Port MacKenzie will require extensive improvements in order to receive VLGC vessels.

91
© 2011 AGDC. All Rights Reserved
Figure 46: Case NGL 3.1.1 – Big Lake-Port Mackenzie
Case NGL-3.1.1: NGL Extraction Plant at Big LakeLPG Pipeline to Port MacKenzie
NGL Extraction Plant
Wet Gas MainlineNorth Slope Deethanizer
Big Lake
FractionationLPG Ship
Loading Terminal
Port MacKenzie
FOB Ship
LPG Pipeline
Beluga Pipeline DPAnchorage City Gate
Dry Gas toAnchorage
Dunbar Straddle Plant
7
8
6
Table 44 Case NGL 3.1.1-Big Lake-Port Mackenzie
Gas Flow Rate and Compositions at Several Points on Pipeline
250 MMCFD 500 MMCFD 750 MMCFD Theoretical Barrels Theoretical Barrels Theoretical Barrels
Flow Streams
Gas Rate C2 C3-C5 Gas Rate C2 C3-C5 Gas Rate C2 C3-C5
6 197.2 6,247 34,879 444.8 15,143 38,565 687.8 23,953 41,989 7 134.16 5,080 829 370.4 13,673 1,634 602.7 22,186 2,480 8 52.4 762 33,984 56.6 814 36,852 60.4 857 39,408

92
© 2011 AGDC. All Rights Reserved
6.4 Case NGL 3.1.2 – Big Lake-Nikiski
In Case NGL 3.1.2 – Big Lake-Nikiski, the wet gas pipeline runs into Big Lake with the dry residual gas flowing into the existing Beluga Pipeline, as in the previous Case NGL 3.1.1 – Big Lake-Port Mackenzie. The key difference in this case is that an NGL Product pipeline (12 inch diameter) runs from Big Lake to Nikiski (180 miles) to take advantage of Nikiski as a port for LP Gas exports. The LPG fractionation facility, along with the LPG product storage, is also located at Nikiski. LPG is fractionated and exported from Nikiski to East Asian customers (with Korea being the preferred market). Table 45 reports the volumes associated with the different flow rates. These values are not presented as a complete material balance as the numbers are net of fuel usage.
Figure 47: Case NGL 3.1.2 – Big Lake-Nikiski
Case NGL-3.1.2: NGL Extraction Plant at Big LakeLPG Pipeline to Nikiski
NGL Extraction Plant
Wet Gas MainlineNorth Slope Deethanizer
Big Lake
FractionationLPG Ship
Loading Terminal
NikiskiFOB Ship
LPG Pipeline~ 125 miles
Beluga Pipeline DPAnchorage City Gate
Dry Gas toAnchorage
Dunbar Straddle Plant
6
9
10
Table 45
Case NGL 3.1.2 – Big Lake-Nikiski Gas Flow Rate and Compositions at Several Points on Pipeline
250 MMCFD 500 MMCFD 750 MMCFD Theoretical Barrels Theoretical Barrels Theoretical Barrels
Flow Streams
Gas Rate C2 C3-C5 Gas Rate C2 C3-C5 Gas Rate C2 C3-C5
6 197.2 6,247 34,879 444.8 15,143 38,565 687.8 23,953 41,989 9 134.16 5,080 829 370.4 13,673 1,634 602.7 22,186 2,480
10 52.4 762 33,984 56.6 814 36,852 60.4 857 39,408

93
© 2011 AGDC. All Rights Reserved
6.5 Case NGL 2.1 – Dunbar-Seward
Case NGL 2.1 – Dunbar-Seward evaluates the option of combining the Dunbar Straddle Plant and the Cook Inlet extraction plant with one large extraction facility at Dunbar. The wet gas pipeline is run from Prudhoe to Dunbar (Fairbanks) as in all cases evaluated. The NGL extraction plant and fractionation facilities are located in Dunbar.
As Dunbar is remote from a tidewater location, rail infrastructure will be used for shipping NGL to either Port MacKenzie or Seward. LPGs could be exported from a tidewater loading facility at either Port MacKenzie or Seward. The Port MacKenzie option will require a rail spur to be constructed from the existing rain line in the Big Lake/Willlow/Houston area to the Port MacKenzie area as discussed previously in this report. The Seward site was assumed as the preferred destination since that rail line already exists. LPG storage is required at both Dunbar and the tidewater port due to requirements to accommodate LPG production between train loads as well as between export shipments.
A dry residual gas pipeline is run from near the Fairbanks to the Beluga Pipeline interconnection. Table 46 reports the volumes associated with the different flow rates. These values are not presented as a complete material balance as the numbers are net of fuel usage.
Figure 48: Case NGL 2.1 – Dunbar-Seward
Case NGL-2.1: NGL Extraction Plant and LPG Terminal on Mainline at Dunbar No Extraction Plant in Anchorage Area
DunbarNGL Extraction Plant
FairbanksCity Gate
Wet Gas Mainline
Fractionation Pressure StorageLPG Terminal
Railcar
Rail Delivery toExport Port (Port (MacKenzie or Seward)Dry Gas to
Anchorage
Dry GasFairbanks Lateral
Atmospheric Storage LPG Ship Loading Terminal
FOB Ship
3
12
11
13

94
© 2011 AGDC. All Rights Reserved
Table 46 Case NGL 2.1 – Dunbar-Seward
Gas Flow Rate and Compositions at Several Points on Pipeline
250 MMCFD 500 MMCFD 750 MMCFD Theoretical Barrels Theoretical Barrels Theoretical Barrels
Flow Streams
Gas Rate C2 C3-C5 Gas Rate C2 C3-C5 Gas Rate C2 C3-C5
3 250.0 7,982 35,333 500.0 17,068 39,021 750.0 26,153 42,709 11 49.9 1,641 430 49.8 1,741 209 50.0 1,778 146 12 134.16 5,080 829 370.4 13,673 1,634 602.7 22,186 2,480 13 52.4 762 33,984 56.6 814 36,852 60.4 857 39,408

95
© 2011 AGDC. All Rights Reserved
6.6 Process Flow
A process flow diagram for each of the different basic designs of the NGL Straddle Plant and the different extraction plants follow. First is the Straddle Plant, conceived to receive and process 60 MMCFD, a small portion of the full gas stream. Shown in Figure 49, the demethanizer separates and recovers sufficient ethane and all of the propane, butane, and natural gasoline into a natural gas liquids stream to produce a natural gas stream, referred to as residue gas, which meets pipeline specification for distribution to local residential and business users.
Figure 49: Fairbanks Straddle Plant – 60MMCFD

96
© 2011 AGDC. All Rights Reserved
Figure 51 and 52 illustrate the basic design of the NGL Extraction facility envisioned for Big Lake. Figure 50 is for the 250 MMSCFD case, whereas Figure 51 represents both the 500 MMSCFD and the 750 MMSCFD cases. Process requirements for the unique gas compositions forecast for the three flow rates resulted in one notable difference between the 250 MMSCFD design and the higher volumes designs. The lower rate includes a deethanizer to control the ethane recovery before the gas flows to the depropanizer and the debutanizer; whereas a combined demethanizer/deethanizer will meet the requirements of the higher rates.
Figure 50: NGL Extraction Big Lake, 250 MMCFD

97
© 2011 AGDC. All Rights Reserved
Figure 51: NGL Extraction Big Lake, 500 MMCFD and 750 MMCFD

98
© 2011 AGDC. All Rights Reserved
The Dunbar design considerations are similar to Big Lake except that the processed gas will be relatively less rich in C3-plus in the absence of the preprocessing of a nominal 60 MMSCFD stream prior to delivery to the Dunbar plant. The fractionation process for the 250 MMSCFD case versus the 500 MMSCFD and the 750 MMSCFD cases will be the same for Dunbar.
Figure 52: Dunbar, 250 MMCFD

99
© 2011 AGDC. All Rights Reserved
Figure 53: Dunbar, 500 MMCFD and 750 MMCFD
7.0 PROCESS DESIGN CONSIDERATIONS AND CAPITAL COSTS
7.1 General Processing Design Considerations
The basic concept of the NGL export plan calls for a 24 inch “wet gas” pipeline to leave the Prudhoe Bay area at a maximum operating pressure of 2500 pounds per square inch (“psi”). The pipeline will trend generally southward to a location near Nenana (approximately mile point 458), where a 12 inch tie-in will be installed to deliver gas to Dunbar. The tie-in facilities will include a Straddle Plant to remove LPG from the natural gas prior to entering a 35 mile lateral to the greater Fairbanks area. LPG removed by the Straddle Plant will re-injected into the wet gas pipeline.
The wet gas pipeline will continue to the Big Lake area, where an NGL Extraction Facility will prepare LPG (C3 and C4) for export to Asian Pacific Rim customers (South Korea base case). The temperature required to obtain high recovery of the propane in the feed gas to NGL Extraction Facility is below the freezing point of water, therefore, before the gas is sent through the liquids recovery plant, it must be dehydrated to “bone dry” conditions to prevent freezing and plugging of the pipelines and heat exchangers when the temperature of the gas is decreased.
Once the gas is dehydrated, it passes through heat recovery exchangers and in many extraction plants, passes through a propane refrigeration system in order to sufficiently reduce the temperature; however, the gas into the plant is at 30°F, eliminating the need for propane refrigeration. Once the temperature is reduced from the heat recovery exchangers, it is sent to a separator to remove the liquid that has already condensed. The vapor stream from the separator passes through the expander where the pressure is reduced from approximately 1,580 psig to 160 psig. As a result of the pressure drop, the gas is cooled from approximately -27°F to -160°F, allowing the propane and heavier components to liquefy.

100
© 2011 AGDC. All Rights Reserved
The gas/liquid stream is then sent to a distillation column where the methane and ethane are separated from the propane and heavier liquid components (propane plus). The methane and ethane exit the column as gas out the top of the column and the propane and heavier liquid components are removed from the bottom of the tower. The tower includes a reboiler at the bottom to vaporize methane and ethane entrained in the liquid stream.
The methane and ethane gas from the top of the Demethanizer/Deethanizer column is sent through heat recovery exchangers to heat the gas and then is sent to the primary compressor. The primary compressor uses the energy recovered from the pressure drop in the expander to compress the gas from approximately 155 psig up to approximately 260 psig. The gas must then be compressed further to approximately 1300 psig.
7.2 General Capital Cost Considerations
Common capital costs outside the bullet line tariff for NGL Case 3.1.1, NGL Case 3.1.2, and NGL Case NGL 2.1 include: the de-ethanizer located in the Prudhoe Bay Unit, the fractionation facility, the dry gas reinjection interconnection, the storage facilities at the LP Gas export facilities, and the LP Gas export facility. Supplemental capital costs unique to NGL Case 3.1.1 and NGL Case 3.1.2 include the LPG line connecting the NGL extraction plant to the fractionation facility. Supplemental capital costs unique to Case NGL 2.1 include the pressured LP gas storage facility for deliveries into railcars, the railcar spur facilities, and railcar leases.
Capital costs for the NGL facilities were calculated based on detailed capital costs provided to AGDC by Michael Baker, Jr., Inc (“Baker Estimates”). The Baker Estimates were adjusted by adding or removing costs based on differences in the process flow schematic and equipment requirements. The most significant adjustment to the Baker Estimates to reflect differences in unit capacity incorporated the “six-tenths” rule which utilizes the following equation: Cost = Base Cost *(Capacity/Base Capacity)0.6
Once the direct costs were adjusted, the percentage of indirect, transportation, engineering, unit operator, contingency, and preliminary design costs from the Michael Baker, Jr., Inc. was utilized to get the total unit cost.
7.3 North Slope Deethanizer
The conditioned gas stream from the North Slope Gas Conditioning Facility (CGF) provides the main supply of gas delivered to the bullet pipeline. This gas contains methane, ethane, and CO2, but is lean with little propane or heavier constituents (“propane plus”) and by itself, is less than a desirable feedstock for processing natural gas with the intent to profit from extracting LP Gas. The CGF stabilizer overhead gas provides a source of propane plus constituents to process and blend with the conditioned gas in order to enrich the resultant stream delivered to the bullet pipeline. The overhead gas will be chilled and then enter the deethanizer. The residue ethane gas will return to CGF and the propane plus liquid stream will be pumped to bullet line pressure, blended with conditioned gas stream and injected into the bullet pipeline.
The Baker Estimate for the North Slope DeEthanizer is premised on a 180 MMCFD supply from the stabilizer overhead, with a composition (mole fraction) as follows: CO2 (19.67%), methane (33.11%), ethane (20.47%), and propane plus (26.75%). The process design includes sufficient pre-chilling for the inlet stream to enter the deethanizer at 62F and propane refrigerant for a deethanizer column condenser, high pressure NGL pump. The cost estimate used a North Slope Estimate Basis.
In all flow rates reviewed for each Case, the DeEthanizer design was identical. The Baker Estimate of $468 million was used in all.
7.4 Fractionator
For the purpose of this study, we have assumed that the NGL Extraction plant will not recover an ethane stream. As discussed previously, the majority of NGL is contained within the CGF stabilizer overhead gas

101
© 2011 AGDC. All Rights Reserved
stream, while the volumetric increases from 250 MMCFD, 500 MMCFD, and 750 MMCFD is derived from the conditioned gas stream. For the 250 MMCFD flow rate case, due to the relatively higher propane concentration in the gas stream, supplemental ethane recovery is required in order to remove a greater percentage of propane so that the residue gas heating value specifications of less than 1050 British thermal units per cubic foot (“Btu/ft3”) can be maintained. Due to the relatively lower concentrations of propane plus in the 500 MMCFD and 750 MMCFD flow rates, the more efficient propane removal process (including ethane removal) is not required to meet the nominal residue gas heating value of 1050 Btu/ft3. Consequently, in order to meet the propane product specifications for the 250 MMCFD case, a separate Deethanizer column will be required to remove the ethane from the NGLs and recombine it into the residue gas. The separate Deethanizer column contains a propane refrigeration loop to cool the overhead gas and a steam reboiler for the bottom liquid.
The liquids recovered from the bottom of the Demethanizer/Deethanizer, and the liquid from the bottom of the Deethanizer in the 250 MMCFD case, are pumped to the Depropanizer, where the propane is separated from the heavier components by distillation. The Depropanizer contains an aerial cooler for the overhead condenser and a steam reboiler. The operating conditions of the Demethanizer/Deethanizer are such that only 2.3 percent of ethane remains in the propane product. Following the removal of propane from the liquid stream, it is sent to the Debutanizer, where both the iso- and normal butanes are removed from the top of the column. As with the Depropanizer, the Debutanizer includes an aerial cooler for the overhead condenser and a steam reboiler.
SAIC developed a three phase compositional model of each Case. One of the results was a forecasted, required capacity flow rate in gallons per minute (gpm) of each fractionation column. The calculated flow rate is uses as the basis to resize the Baker Estimate to use in each case.

102
© 2011 AGDC. All Rights Reserved
Table 47
Fractionator Capital Costs (in $2011 Million) For Cases NGL 3.1.1 – Big Lake-Port Mackenzie and NGL 3.2.1 – Big Lake-Nikiski
Baker Estimate 250 MMCFD 500 MMCFD 750 MMCFD DePropanizer Cost ($ Million) 89 89 89 95 DeButanizer Cost ($Million) 31 31 31 35 TOTAL CAPEX ($2011Million)
120 120 120 130
Table 48 Fractionator Capital Costs (in $2011 Million) for Case NGL 2.1-Dunbar-Seward
Baker Estimate 250 MMCFD 500 MMCFD 750 MMCFD DePropanizer Cost ($ Million) 89 101 101 106 DeButanizer Cost ($ Million) 31 34 34 39 TOTAL CAPEX ($2011Million)
120 135 135 145
7.5 LPG Pipelines
The major pipeline considered in this evaluation was a 12 inch diameter pipeline to deliver LPG from the Big Lake extraction facility to a tidewater facility at Nikiski for NGL Case 3.2.1. Assuming a lay north around Anchorage, with crossing of the Matanuska River, a lay across Turnagain Arm, and a final stretch into Nikiski, the estimate used 180 miles for total length, forty river/stream crossings and 30 miles of submarine work (to cross Turnagain Arm). SAIC estimated the costs of direct materials, labor and equipment to lay the pipeline at $275 million; the costs of engineering and construction management at $75 million; and a contingency for unknowns of $55 million; for a total of $400 million.
NGL Case 3.1.1 requires a short lay from the Processing Facility at Big Lake to the Fractionation facility at Port Mackensie. Assuming a lay of 15 miles, costs were extrapolated at $40 million.
7.6 Liquid Product Storage
The objective of this portion of the study is to determine the amount of LP Gas storage required to support the production and shipping requirements of the project. Based on design of conventional LP Gas production facilities, the storage requirements in support of exporting propane and butane to markets in Asia are assumed to be low pressure, refrigerated tanks.

103
© 2011 AGDC. All Rights Reserved
The base shipping scenario is 82,000 M3 (516,000 barrels) ship(s) to provide transportation from Cook Inlet. It is assumed the ships will be subdivided into four compartments with each capable of carrying either propane or butane. With the projected ratio of propane to butane volumes, it is anticipated that every other ship or every third ship will carry one compartment of butane with the remaining capacity being used to carry propane.
The recovered propane and butane will be stored at low temperature as LP Gas. The products will be chilled using propane refrigeration prior to introduction into the LP Gas storage tanks. By cooling the propane and butane to temperatures of -45F or lower, the hydrocarbons will remain in liquid state at atmospheric pressure.
The storage volumes are driven by the projected production volumes, the capacity of the ships and the frequency of ship loadings. The evaluated plan has three 330,000 barrels propane storage tanks for the 250 MMCFD case, three 340,000 barrels propane storage tanks for the 500 MMCFD case, and three 350,000 barrels propane storage tanks for the 750 MMCFD case. Recall that the three rates have daily propane volumes of 31,900, 34,000, and 35,800 barrels, respectively. Assuming 90 percent utilization of a ship (73,800 M3 or 464,000 barrels), the needs for propane storage include a minimum of 500,000 barrels storage to be certificated for delivery to the ship. Two of the three tanks would be used in this step. The final tank provides ten days of storage after the first two tanks are certified for delivery and isolated from additional volumes.
The current plan for butane has three 65,000 barrels propane storage tanks for the 250 MMCFD case, three 70,000 barrels propane storage tanks for the 500 MMCFD case, and three 75,000 barrels propane storage tanks for the 750 MMCFD case. Recall that the three cases have daily butane volumes of 2,750, 3,350, and 3,950 barrels, respectively. Assuming 90 percent utilization of one compartment in a ship (18,450 M3 or 116,000 barrels), the needs for propane storage include a minimum of 130,000 barrels storage to be certificated for delivery to the ship. Two of the three tanks would be used in this step. The final tank provides twenty days of storage after the first two tanks are certified for delivery and isolated from additional volumes.
Two 12,000 barrel natural gasoline storage tanks are planned with regard to the projected 100 to 500 barrel per day recovery in the three cases. It is assumed that for purposes of this study natural gasoline will be utilized in local markets.
The case whereby full extraction occurs at Dunbar presents a requirement of LP Gas storage at two locations. First the fractionated product will be stored in horizontal-pressured vessels prior to delivery to railcars with pressure vessels for transport. The liquids will be transferred to refrigerated low pressure storage at the Cook Inlet facility. Finally, the liquids will then be transferred to ships for transport to market.
The required storage volume at Dunbar is driven by production volumes, capacity of a train load and frequency of loadings. It is projected a train load will range from 50,000 to 80,000 barrels, with loading every 48 hours. The proposed storage is 85,700 barrels, or 30 120,000 gallon pressure vessels for the low flow rate. The high rate has 102,900 barrels or 36 - 120,000 gallon pressure vessels.
The refrigerated, low-pressure storage at Cook Inlet for Fairbanks extraction scenario is the same as that for the Cook Inlet processing Scenario.
A Baker Estimate for LP Gas storage was available. Included in this estimate was a scenario with two 375,000 atmospheric storage tanks, refrigeration and LP Gas loading pumps. For Case NGL 3.1.1, Case NGL 3.1.2, and Case NGL 2.1, the cost estimate was modified by a ratio of two 375,000 barrel capacity divided by the two tanks planned. The ratio was then raised to the power of 0.6. Finally, that number was multiplied by 1.5 to adjust from a two tank case to a three tank case. Similar calculations were performed for the butane atmospheric tanks. A Baker Estimate for two 12,000 barrel tanks to store natural gasoline was available and applied, unadjusted.
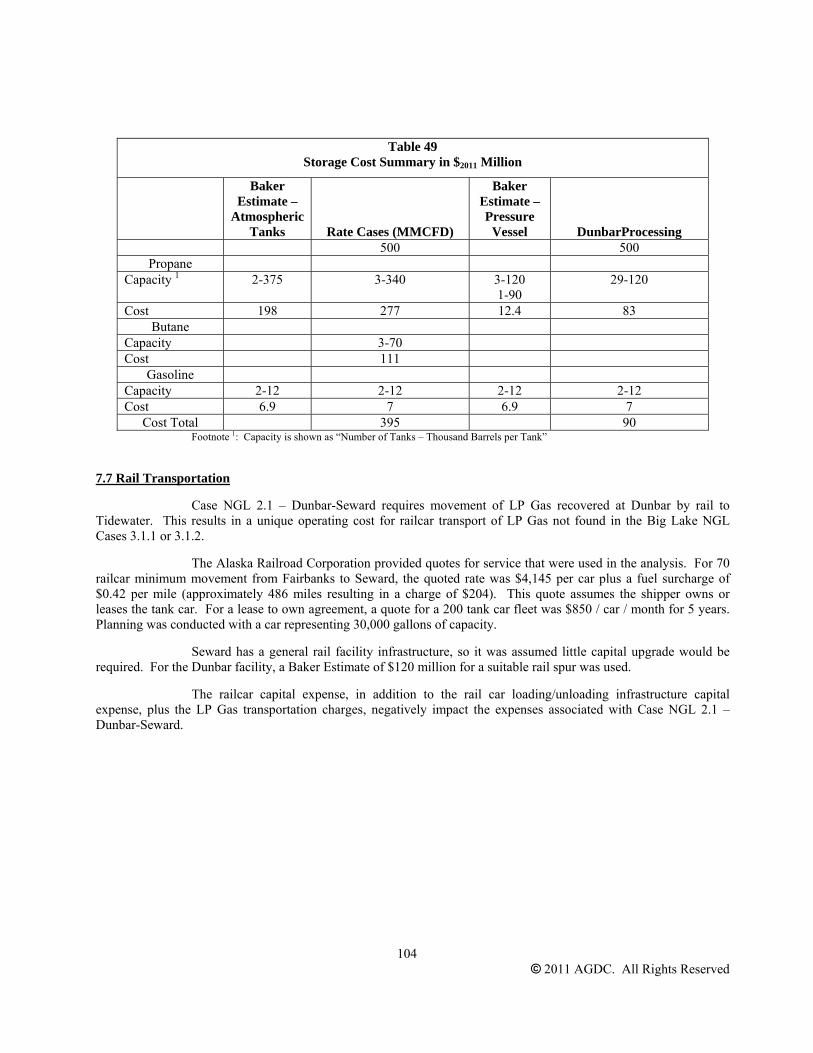
104
© 2011 AGDC. All Rights Reserved
Table 49
Storage Cost Summary in $2011 Million
Baker
Estimate – Atmospheric
Tanks Rate Cases (MMCFD)
Baker Estimate – Pressure
Vessel DunbarProcessing 500 500
Propane Capacity 1 2-375 3-340 3-120
1-90 29-120
Cost 198 277 12.4 83 Butane
Capacity 3-70 Cost 111
Gasoline Capacity 2-12 2-12 2-12 2-12 Cost 6.9 7 6.9 7
Cost Total 395 90 Footnote 1: Capacity is shown as “Number of Tanks – Thousand Barrels per Tank”
7.7 Rail Transportation
Case NGL 2.1 – Dunbar-Seward requires movement of LP Gas recovered at Dunbar by rail to Tidewater. This results in a unique operating cost for railcar transport of LP Gas not found in the Big Lake NGL Cases 3.1.1 or 3.1.2.
The Alaska Railroad Corporation provided quotes for service that were used in the analysis. For 70 railcar minimum movement from Fairbanks to Seward, the quoted rate was $4,145 per car plus a fuel surcharge of $0.42 per mile (approximately 486 miles resulting in a charge of $204). This quote assumes the shipper owns or leases the tank car. For a lease to own agreement, a quote for a 200 tank car fleet was $850 / car / month for 5 years. Planning was conducted with a car representing 30,000 gallons of capacity.
Seward has a general rail facility infrastructure, so it was assumed little capital upgrade would be required. For the Dunbar facility, a Baker Estimate of $120 million for a suitable rail spur was used.
The railcar capital expense, in addition to the rail car loading/unloading infrastructure capital expense, plus the LP Gas transportation charges, negatively impact the expenses associated with Case NGL 2.1 – Dunbar-Seward.

105
© 2011 AGDC. All Rights Reserved
8.0 CAPITAL COST REVIEW
8.1 Capital Cost Summary
For purposes of this study, SAIC evaluated wet natural gas flow rates delivered to the bullet gas line of 250 MMCFD, 500 MMCFD, and 750 MMCFD for Case NGL-3.1.1, Case NGL-3.1.2, and Case NGL-2.1. Based on these flow rates, capital estimates were either provided by AGDC from previous studies or developed by SAIC. AGDC ultimately provided optimized tariffs associated with transporting the wet natural gas in pipelines to the Fairbanks area, Big Lake, and Nikiski at 500 MMCFD. Tariff rates included capital associated with the straddle plant in Fairbanks and NGL extraction facility.
Capital costs outside the tariff include the de-ethanizer located in the Prudhoe Bay Unit, the fractionation facility, the dry gas reinjection interconnection, the LPG line connecting the NGL extraction plant to the fractionation facility, the storage facilities at the LP Gas export facilities, and the LP Gas ship loading facility. Capital costs unique to Case NGL 2.1 include the pressured storage facility and railcar transportation system (including loading and unloading infrastructure). Based on initial assessment results that showed the optimal flow rate was 500 MMCFD, evaluation efforts were concentrated on the 500 MMCFD flow rate for Case NGL-3.1.1, Case NGL-3.1.2, and Case NGL-2.1. The basis of the costs used is presented previously in this Report. A summary of the capital costs are shown below:
Table 50
AGDC NGL Capital Cost Matrix ($2011Million)
Case NGL 3.1.1
Big Lake-Port Mackenzie Case NGL 3.1.2
Big Lake-Nikiski Case NGL 2.1
Dunbar-Seward Flow Rate (MMcfd) 500 500 500 North Slope DeEthanizer 468 468 468 Fractionation Facility 120 120 135 Pressure Storage, Rail Assets 254 Storage and Export 395 395 395 Jetty 250 150 175 Pipelines Process to Fractionation1 15 miles of 12″ 180 miles of 12″ Same tract
Capital Cost 40 400 0 Dry Residue Gas Line ½ Mile + Meter Run ½ Mile + Meter Run ½ Mile + Meter Run
Capital Cost 5 5 5 Total Estimated Capital
Cost 1,278 1,538 1,432
8.2 Levelized Cost Determinations
SAIC evaluated the full cost of service for each of the capital items listed above and calculated an estimated levelized tariff or fee for each of the incremental steps in moving the wet gas and then the extracted liquids to market. The fees were determined on an MMBtu basis for the propane and butane components. The estimated levelized fee required calculating the following formulas for each of the 20 years of operations that was assumed to begin in July 2019.
Rate Base x Overall Rate of Return = Return
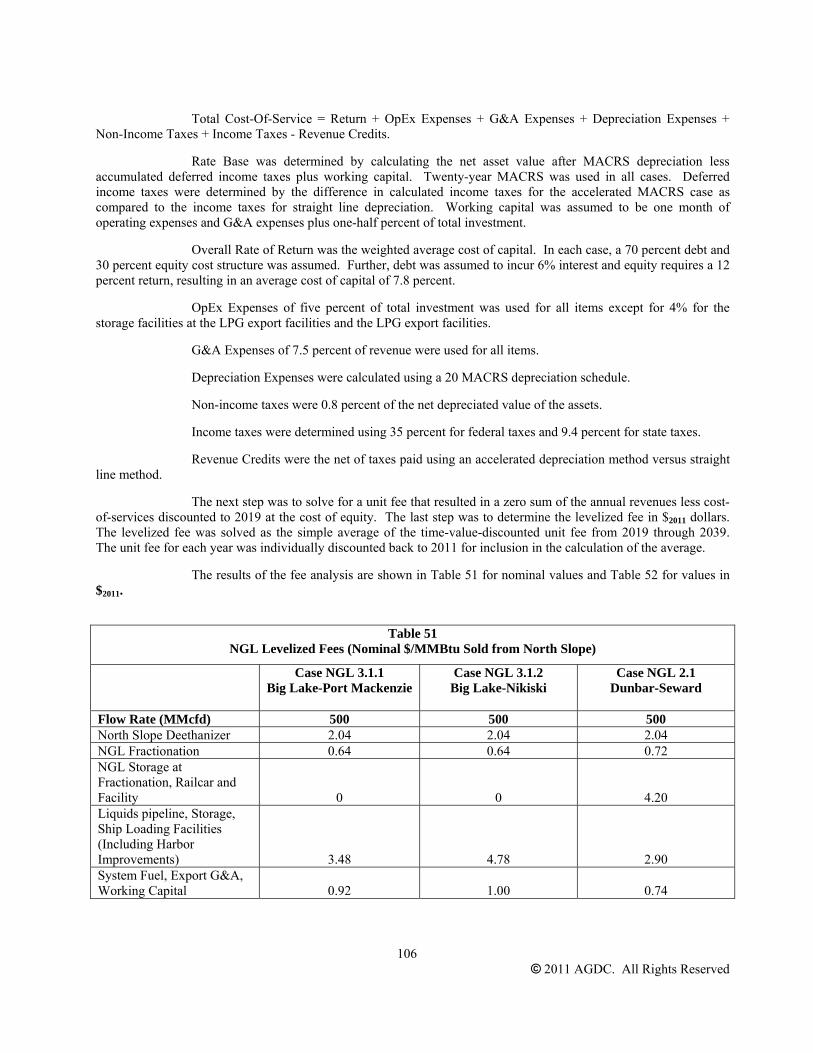
106
© 2011 AGDC. All Rights Reserved
Total Cost-Of-Service = Return + OpEx Expenses + G&A Expenses + Depreciation Expenses + Non-Income Taxes + Income Taxes - Revenue Credits.
Rate Base was determined by calculating the net asset value after MACRS depreciation less accumulated deferred income taxes plus working capital. Twenty-year MACRS was used in all cases. Deferred income taxes were determined by the difference in calculated income taxes for the accelerated MACRS case as compared to the income taxes for straight line depreciation. Working capital was assumed to be one month of operating expenses and G&A expenses plus one-half percent of total investment.
Overall Rate of Return was the weighted average cost of capital. In each case, a 70 percent debt and 30 percent equity cost structure was assumed. Further, debt was assumed to incur 6% interest and equity requires a 12 percent return, resulting in an average cost of capital of 7.8 percent.
OpEx Expenses of five percent of total investment was used for all items except for 4% for the storage facilities at the LPG export facilities and the LPG export facilities.
G&A Expenses of 7.5 percent of revenue were used for all items.
Depreciation Expenses were calculated using a 20 MACRS depreciation schedule.
Non-income taxes were 0.8 percent of the net depreciated value of the assets.
Income taxes were determined using 35 percent for federal taxes and 9.4 percent for state taxes.
Revenue Credits were the net of taxes paid using an accelerated depreciation method versus straight line method.
The next step was to solve for a unit fee that resulted in a zero sum of the annual revenues less cost-of-services discounted to 2019 at the cost of equity. The last step was to determine the levelized fee in $2011 dollars. The levelized fee was solved as the simple average of the time-value-discounted unit fee from 2019 through 2039. The unit fee for each year was individually discounted back to 2011 for inclusion in the calculation of the average.
The results of the fee analysis are shown in Table 51 for nominal values and Table 52 for values in $2011.
Table 51
NGL Levelized Fees (Nominal $/MMBtu Sold from North Slope)
Case NGL 3.1.1 Big Lake-Port Mackenzie
Case NGL 3.1.2 Big Lake-Nikiski
Case NGL 2.1 Dunbar-Seward
Flow Rate (MMcfd) 500 500 500 North Slope Deethanizer 2.04 2.04 2.04 NGL Fractionation 0.64 0.64 0.72 NGL Storage at Fractionation, Railcar and Facility 0 0 4.20 Liquids pipeline, Storage, Ship Loading Facilities (Including Harbor Improvements) 3.48 4.78 2.90 System Fuel, Export G&A, Working Capital 0.92 1.00 0.74

107
© 2011 AGDC. All Rights Reserved
Table 52
NGL Levelized Fees ($2011 /MMBtu Sold from North Slope)
Case NGL 3.1.1 Big Lake-Port Mackenzie
Case NGL 3.1.2 Big Lake-Nikiski
Case NGL 2.1 Dunbar-Seward
Flow Rate (MMcfd) 500 500 500 North Slope Deethanizer 1.21 1.21 1.21 NGL Fractionation 0.38 0.38 0.43 NGL Storage at Fractionation, Railcar and Facility 0 0 2.51 Liquids pipeline, Storage, Ship Loading Facilities (Including Harbor Improvements) 2.07 2.86 1.73 System Fuel, Export G&A, Working Capital 0.54 0.59 0.43
Based on the results in Table 52, a net-back calculation was performed for each case at the 500 MMCFD flowrate to establish a value in $2011 per MMBtu for the LP Gas being exported, based on the sales to the Korean market.
8.3 North Slope Pipeline Entry Netback Calculations
The net back calculation utilizes tariffs supplied by AGDC for the three scenarios of Big Lake Extraction/Port MacKenzie export ($7.75 levelized nominal Big Lake extraction/Nikiski export ($7.75 levelized nominal), and Fairbanks extraction/Port MacKenzie-Seward export ($6.25 levelized nominal) at the 500 MMSCFD gas flow rate. The tariff rates are employed on a Btu basis based on the heat content of the respective NGL stream, and discounted to $2011 per the same methodology as the fee analysis in Table 52.
Table 53 presents the wellhead netback calculated from the Base Case Korea – Tidewater Propane price projections for each of the cases and at the three referenced flow rates, as follows.

108
© 2011 AGDC. All Rights Reserved
Table 53
North Slope Pipeline Entry Netback Calculations ($2011 /MMBtu Sold from North Slope for WTI at $201080/bbl/ $201182.40/bbl)
Case NGL 3.1.1 Big Lake-Port Mackenzie
Case NGL 3.1.2 Big Lake-Nikiski
Case NGL 2.1 Dunbar-Seward
Flow Rate (MMcfd) 500 500 500 Pipeline Entry Netback 2.45 1.53 1.08 North Slope Deethanizer 1.21 1.21 1.21 Model pipeline tariff calculated in $2011 4.63 4.63 3.73 NGL Fractionation 0.38 0.38 0.43 NGL Storage at Fractionation, Railcar and Facility 0 0 2.51 Liquids pipeline, Storage, Ship Loading Facilities (Including Harbor Improvements) 2.07 2.86 1.73 System Fuel, Export G&A, Working Capital 0.54 0.59 0.43 Shipping and Insurance 0.47 0.47 0.47 Taxes (Fed 35%, State 9.4%) 0.45 0.50 0.53 Cashflow to investor @12% return 0.40 0.44 0.47 CIF Revenue of LPG in Korea 12.60 12.60 12.60
For a WTI crude oil price of $201080/bbl/$201182.40/bbl, the netback analysis of the three sets of NGL cases shows that:
From a purely economic perspective (and excluding the limitations of the suitability of Port Mackenzie as an LPG loading port) the economic ranking of the NGL cases, in descending order, is as follows: • Case NGL 3.1.1 – Big Lake-Port Mackenzie • Case NGL 3.1.2 – Big Lake-Nikiski • Case NGL 2.1 – Dunbar-Seward
The most significant negative factor impacting on the netbacks for the Case NGL 3.1.2 – Big Lake-
Nikiski, is the capital cost of the NGL product pipeline from Big Lake to Nikiski ($400 Million), which would not be needed for the other two NGL cases. For the Case NGL 2.1 – Dunbar-Seward, the most significant negative factors impacting on the netbacks are the added cost for supplemental intermediate product storage at Fairbanks, the cost of the rail cars, and the cost of rail transportation, which would not be needed for the other two NGL cases.
The results of the netback analysis cannot be viewed in isolation, however. While the Case NGL 3.1.1 – Big Lake-Port Mackenzie yields the highest netback, the Port MacKenzie VLGC receiving capabilities are inferior to those of Nikiski with regard to environmental, safety, logistical, and infrastructure improvement considerations. Port Mackenzie would at a minimum also require substantial infrastructure improvements, including dredging. Even with such improvements, it would still be subject to ship loading limitations. In addition, the

109
© 2011 AGDC. All Rights Reserved
incremental economic risk of the site relative to the other sites has not been fully quantified in this analysis. It is noted that in the Case NGL 2.1 – Dunbar-Seward, while the port of Seward has current rail service for commodities such as coal, it is constrained by the Kenai Coastal Management criteria that require brownfield locations, such as Nikiski, to be selected prior to greenfield location utilization. Nikiski, on the other hand, could theoretically begin receiving VLGC on a near term basis.
Based on these technical and logistical limitations, then, the NGL Case 3.1.2 – Big Lake-Nikiski, although second in the netback rankings, is economic for the pipeline flow rates of 500 MMCFD and is, therefore, the preferred choice for the NGL extraction and loading facilities.
8.4 Conclusion
Alaskan LP Gas exports to the Asian Pacific Rim from the Cook Inlet area represent a potentially economically viable market for supporting increased pipeline demand for North Slope gas. The concept of NGL extraction at Big Lake with LP Gas fractination and export from Nikiski is both technically feasible and economically viable. Locating the tidewater terminal at either Port MacKenzie or Seward raises safety and environmental concerns. Higher pipeline tariffs, additional storage, and railroad transportation expenses render the option of locating the extraction and fractionation facilities at Dunbar unviable.
Based on this analysis, then, SAIC suggests that incorporating the export of LP Gas into the natural gas monetization plan, utilizing a configuration of an NGL extraction plant in the Big Lake area with a LP Gas fractionation and export loading port at Nikiski (Case NGL 3.1.2 – Big Lake-Nikiski), is a potentially economically viable option for crude oil prices at or above a WTI price of $201080/bbl//$201182.40/bbl.

110
© 2011 AGDC. All Rights Reserved
9.0 SUPPLEMENTAL ANALYSIS
9.1 Cogeneration Options
An evaluation of supplemental power generation has been made from an initial base case assumption of simple-cycle combustion turbine (“CT”s) providing power to the NGL Processing Facility with all other major equipment drivers being electric. Some of the simple-cycle CTs were assumed to have heat recovery steam generators (“HRSG”s) included to convert waste heat from the exhaust gas of the CTs to process steam for use in the NGL Processing Facility. This base case power plant concept will be compared to converting the simple-cycle CTs, some with HRSGs, as described above to combined cycle, including the addition of HRSGs on all CTs, duct burners on all HRSGs, and steam turbines (“ST”s), with necessary auxiliary equipment, to produce additional electric power for export, which is the cogeneration case.
The conceptual design for the NGL Processing Facility includes seven options with multiple gas compressors to support recompression and refrigeration; steam supply for various process applications, and electric power supply to drive the compressors and support station load. Based on our estimates of the horsepower requirements for compression and station load we have identified a CT model to be used in each option. Our assumptions for the base case of each option are presented in the table below.
Table 54
Base Case Assumptions
Location Cook Inlet Fairbanks Facility Size, MMCFD
190 440 690 60 250 500 750
Compression Required, hp
17,700 51,150 85,000 7,000 25,400 60,000 94,500
No. of Compressors
3 3 6 2 3 3 5
Process Steam Required, lb/hr
109,000 84,500 93,750 4,750 118,000 87,000 96,000
Power Required, kW
13,900 38,500 63,900 5,800 19,700 45,200 71,000
CT Selection Solar – Taurus 60
GE - PGT16 GE – 10-1Solar – Centaur 40
Siemens - SGT300
Siemens – SGT500
Solar – Titan 130
No. of CTs 3 3 6 2 3 3 5 No. of HRSGs 2 2 2 1 3 1 2
We have assumed the same number of CTs and the same model of CTs will be used in the base case scenarios as well as the cogeneration scenarios. Further we have assumed that in the cogeneration scenario all CTs will have HRSGs, including duct burners. STs along with condensers, cooling towers and auxiliary equipment have also been added. The equipment included in the cogeneration scenarios is presented in the table below.

111
© 2011 AGDC. All Rights Reserved
Table 55
Cogeneration Scenarios
Location Cook Inlet Fairbanks Facility Size, MMCFD
190 440 690 60 250 500 750
No. of CTs 3 3 6 2 3 3 5 No. of HRSGs 3 3 6 2 3 3 5 No of STs 3 3 6 2 3 3 5 ST Capacity (each), MW
2.0 9.3 8.2 3.9 3.6 10.1 9.3
Total ST Capacity, MW
5.9 27.8 48.9 7.7 10.7 30.3 46.4
9.2 Power Plant & Driver Concept Design
The analysis for horsepower (“hp”) requirements looked at 100 percent, 67 percent, and 33 percent of “wet” natural gas flow. The difference between Cook Inlet and Fairbanks facility processing volumes is related to natural gas processed by the Straddle Plant associated with the Fairbanks gasline spur. The total number of CTs is based on the compressor requirements plus in-situ electrical generation. Due to the large capital investment associated with the NGL extraction and fractionation process, dependency on third party power supply is considered as a backup option only. The analysis includes the same number of CTs to produce electric power as the number of compressors used in the process to allow for flexibility in operations for both the base case scenarios and the cogeneration scenarios.
9.3 Power Plant Loads
Electrical demand is primarily associated with turning rotating equipment for the NGL Processing Facility for refrigeration and re-compression of the “dry” natural gas back to line pressure. By taking advantage of using expanders turning first stage compression equipment, electrical demand is reduced as compared other pressure reduction processes. Electrical demand is further reduced in some cases because a de-ethanization process is not required.
9.4 Heat Recovery Steam Generation System
Some of the CTs will have HRSG systems included in the base case design. This will create steam that is available for utilization in meeting different process requirements. In making adjustments for the cogeneration scenarios, all CTs are assumed to have HRSGs, with duct burners, to produce maximum steam over and above the process steam requirements of the base case. The excess steam is to be conveyed to STs for generation of electricity, over and above the needs of the base case, for export to the grid.
9.5 Incremental Operating Costs
Based on the additional equipment added to the base case for the cogeneration scenarios, we have developed estimates of the incremental O&M costs for each option. These costs are presented in the table below and include variable O&M, Fixed O&M, and major maintenance for the incremental equipment added for the cogeneration scenarios.
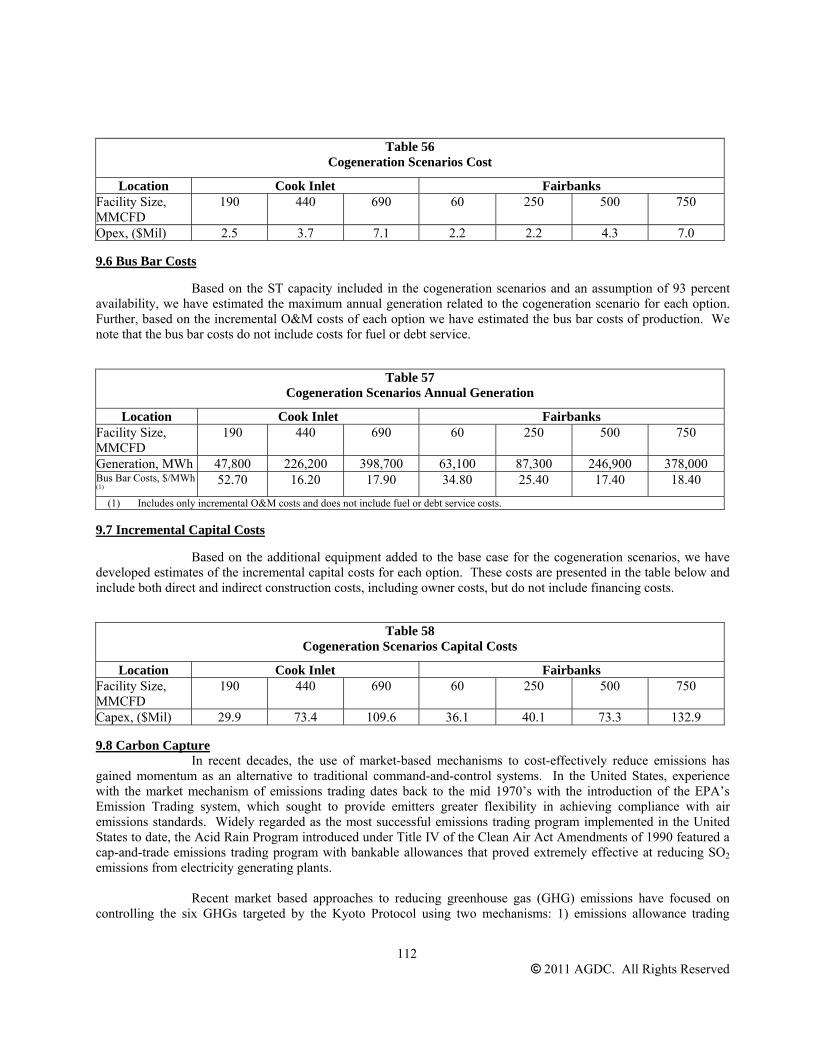
112
© 2011 AGDC. All Rights Reserved
Table 56
Cogeneration Scenarios Cost
Location Cook Inlet Fairbanks Facility Size, MMCFD
190 440 690 60 250 500 750
Opex, ($Mil) 2.5 3.7 7.1 2.2 2.2 4.3 7.0
9.6 Bus Bar Costs
Based on the ST capacity included in the cogeneration scenarios and an assumption of 93 percent availability, we have estimated the maximum annual generation related to the cogeneration scenario for each option. Further, based on the incremental O&M costs of each option we have estimated the bus bar costs of production. We note that the bus bar costs do not include costs for fuel or debt service.
Table 57
Cogeneration Scenarios Annual Generation
Location Cook Inlet Fairbanks Facility Size, MMCFD
190 440 690 60 250 500 750
Generation, MWh 47,800 226,200 398,700 63,100 87,300 246,900 378,000 Bus Bar Costs, $/MWh (1)
52.70 16.20 17.90 34.80 25.40 17.40 18.40
(1) Includes only incremental O&M costs and does not include fuel or debt service costs.
9.7 Incremental Capital Costs
Based on the additional equipment added to the base case for the cogeneration scenarios, we have developed estimates of the incremental capital costs for each option. These costs are presented in the table below and include both direct and indirect construction costs, including owner costs, but do not include financing costs.
Table 58
Cogeneration Scenarios Capital Costs
Location Cook Inlet Fairbanks Facility Size, MMCFD
190 440 690 60 250 500 750
Capex, ($Mil) 29.9 73.4 109.6 36.1 40.1 73.3 132.9
9.8 Carbon Capture In recent decades, the use of market-based mechanisms to cost-effectively reduce emissions has
gained momentum as an alternative to traditional command-and-control systems. In the United States, experience with the market mechanism of emissions trading dates back to the mid 1970’s with the introduction of the EPA’s Emission Trading system, which sought to provide emitters greater flexibility in achieving compliance with air emissions standards. Widely regarded as the most successful emissions trading program implemented in the United States to date, the Acid Rain Program introduced under Title IV of the Clean Air Act Amendments of 1990 featured a cap-and-trade emissions trading program with bankable allowances that proved extremely effective at reducing SO2 emissions from electricity generating plants.
Recent market based approaches to reducing greenhouse gas (GHG) emissions have focused on controlling the six GHGs targeted by the Kyoto Protocol using two mechanisms: 1) emissions allowance trading
113
© 2011 AGDC. All Rights Reserved
among entities with an emission cap and 2) trading in project-based GHG emission reductions. In a cap-and-trade system, a centralized authority sets an absolute limit on the quantity of emissions that can be emitted by a given pool of emitters. Within that pool, individual emitters are allocated emissions allowances (or credits), which collectively add up to the total quantity of emissions set by the cap. Individual emitters can then transfer allowances amongst themselves, enabling those entities that can more cost-effectively reduce their emissions to sell or trade their allowances to those for whom achieving reductions would be more costly. Project-based reductions provide entities an opportunity to achieve their allowance requirements by sponsoring or purchasing reductions achieved from a project that occurs outside of the pool of emitters established in the cap-and-trade program (offsets). Another option for regulating GHG emissions is a carbon tax applied to coal-, gas-, and oil-based fuels.
The 110th (2007-2009) and the 111th (2009-2011) Congress both proposed climate legislation that would have established nation-wide GHG cap-and-trade emissions trading programs. Of the legislation introduced the bill that came closest to passing was the American Clean Energy and Security Act of 2009, H.R. 2454, also known as the Waxman-Markey bill or ACES. The bill passed in the U.S. House of Representatives but did not pass in the Senate. Waxman-Markey included an economy-wide GHG cap and trade system and would have allowed a portion of the cap to be met by both domestic and international offsets. The EPA’s economic analysis of H.R. 2454 projected that allowance prices for that bill would be $13 to $24 per metric tonne CO2 equivalent (tCO2e) in 2013 and $16 to $30/tCO2e in 2020.37
A number of regional cap-and-trade programs have emerged in the U.S., including the Regional Greenhouse Gas Initiative (RGGI) in the Northeast, the Western Climate Initiative (WCI) in the western states and Canadian provinces, and the State of California’s cap-and-trade program linked to AB32, the California Global Warming Solutions Act of 2006. The latter two programs are still in development but RGGI, which sets a cap on emissions of CO2 from electric power plants (and allows for allowance trading and the limited use of offsets), holds the distinction of being the first mandatory GHG cap-and-trade program in the U.S. The value of allowances on RGGI was $3.2 per tCO2e in 2008 and $2.7 in 2009.38 The largest market-based GHG emissions trading system in operation at this time is the European Union Emissions Trading Scheme (EU ETS), which caps CO2 emissions from approximately 11,000 installations in the EU and represents about 50 percent of EU-wide CO2 emissions.39 The value of allowances on the EU ETS has fluctuated a great deal since its launch in 2005, with a value of US$32.5 tCO2e in 2008 dropping to US$18.7 in 2009.40
In previous analysis of proposed Federal GHG legislation SAIC found that the impacts of proposed legislation on the U.S. economy will be heavily dependent on the features and functionality of legislative provisions allowing market mechanisms, such as carbon offset projects and a tradable carbon allowance market. If offsets are authorized, the number of offsets available will make a very large difference in domestic economic impacts, almost as much as the choice of technologies used to curb emissions. A future price on carbon will be determined by the design of legislation to regulate greenhouse gas emissions, point of regulation, the distribution of allowances and the rules around use of offsets will all be key factors. It is difficult to predict how the regulatory environment will evolve over the next several decades.
A number of GHG intensive industries are anticipating a future cost of carbon and have begun incorporating it into their long-term decision-making. The Edison Electric Institute recently expressed support for a cap-and-trade regime and a price on carbon,41 and Exxon Mobil’s 2010 annual energy outlook report stated that the company was anticipating a carbon price of $30 per tCO2e by 2020 and $60 per tCO2e by 2030 in OECD countries.42 For the purposes of this analysis, the Exxon Mobile annual energy outlook report projections of $/ tCO2e is used assuming a linear increase from 2020 and 2030 that both pre-dates and post-dates this time period. In addition to the 37 EPA Analysis of the American Clean Energy and Security Act of 2009, H.R. 2454 in the 111th Congress, Environmental Protection Agency (EPA), June 23, 2009. 38 The World Bank. “State and Trends of the Carbon Market 2010,” May 2010 http://siteresources.worldbank.org/INTCARBONFINANCE/Resources/State_and_Trends_of_the_Carbon_Market_2010_low_res.pdf 39 European Commission Climate Action website, http://ec.europa.eu/clima/policies/ets/index_en.htm, accessed February 8, 2011. 40 The World Bank. “State and Trends of the Carbon Market 2010,” May 2010 http://siteresources.worldbank.org/INTCARBONFINANCE/Resources/State_and_Trends_of_the_Carbon_Market_2010_low_res.pdf 41 Ling, Katherine, “Utilities expect Congress to eventually set carbon price – EEI chief,” Climatewire, January 12, 2011, http://www.eenews.net/eenewspm/2011/01/12/archive/5?terms=utilities+expect+Congress+to+eventually+set+carbon+price. 42 Exxon Mobil. “2010 The Outlook for Energy: A View to 2030,” http://www.exxonmobil.com/Corporate/energy_outlook_view.aspx

114
© 2011 AGDC. All Rights Reserved
carbon price escalations projected by ExxonMobile in nominal dollars, these values are further escalated by 3 percent annually to adjust for inflation.
SAIC developed an estimate of total tonne of CO2 generated from power plant at the NGL Processing Facility. The estimate takes into account differences in power consumption at nominal wet gas flows of 250, 500, and 750 MMscfd. The primary source of CO2 is the gas turbine exhaust gas and HRSG duct burners. The amount of CO2 generated increases depending on both the amount of natural gas being processed plus the amount of excess power being exported to the local grid. The following table details the CO2 sources and relative quantities of CO2 generated based on different operating configurations.
Table 59
CO2 Sources
Natural Gas Processed CO2 Sources CO2 Tons Per Year No-Cogen 190 MMscfd 3 CTs, 2 HRSGs 137,706 440 MMscfd 3 CTs, # HRSGs 227,283 690 MMscfd 6 CTs, 6 HRSGs 415,972 Including Cogen 190 MMscfd 3 CTs, 2 HRSGs 154,428 440 MMscfd 3 CTs, # HRSGs 348,674 690 MMscfd 6 CTs, 6 HRSGs 615,010
Alternatives for CO2 disposal from the NGL Processing Facility are primarily limited to reinjection as part of an enhanced oil recovery (“EOR”) program or purchase of CO2 offsets. Participation in an EOR program will require a third party off taker to take the CO2 gas plus a compression system and pipeline to deliver the CO2 to the third party reinjection points. The CO2 offset market is not mature at this time, and only market projections are available at this time.

A-1
APPENDIX A - HISTORICAL WTI CRUDE OIL AND LP GAS PRICE CORRELATION
Figure A-1: Historical WTI and Propane Japan Price Correlation

A-2
Figure A-2: Historical WTI and Propane S. China Price Correlation
Figure A-3: Historical WTI and Propane Taiwan Price Correlation

A-3
Figure A-4: Historical WTI and Propane N. Asia (S. Korea) Price Correlation
Figure A-5: Historical WTI and Butane Japan Price Correlation

A-4
Figure A-6: Historical WTI and Butane S. China Price Correlation
Figure A-7: Historical WTI and Butane Taiwan Price Correlation

A-5
Figure A-8: Historical WTI and Butane N. Asia (S. Korea) Price Correlation

B-1
APPENDIX B - GLOSSARY OF TERMS FOR THE NATURAL GAS INDUSTRY C+F - Cost and Freight; in purchasing, the buyer pays the seller the cost of the products plus cost of transportation. CIF - Cost, Insurance, and Freight; in purchasing, the buyer pays the seller the cost of products, insurance, and freight. Ethane - Ethane is an organic compound with the chemical formula of C2H6. At room temperature it is a colorless and odorless gas. Ethane is a common feedstock for petrochemical facilities. FOB - Free on Board, delivered on board ship or other carrier without charge to the buyer to that point. Product prices “FOB Alaska Tidewater” are the prices at that export point. Gasoil – A relatively low viscosity intermediate boiling point distilled product including heatings oils and diesel fuel. GTL - Gas to liquid refers to the process by which methane is processed to form petroleum products such as transportation fuels. Iso-Butane - Iso-butane is an organic compound with the chemical formula of i-C4H10. At room temperature it is a colorless and odorless gas. Iso-butane is also a common feedstock for petrochemical facilities, plus aerosol propellant and refrigerant. LNG - Liquefied natural gas refers to a refrigerated and/or compressed form of methane with the chemical formula of CH4. The methane is liquefied for ease of transportation to end users. The liquefaction process results in a volumetric reduction of approximately 650 times. LPG - Liquefied Petroleum Gas, a mixture of gases, primarily propane, that are derived from petroleum refining. LP Gas - Liquid Propane Gas A mixture of propane and butane marketed globally for transportation, home heating, cooking, agriculture, and manufacturing. LP Gas is produced from two sources: Liquefied Petroleum Gases (LPGs) from oil refineries, and Natural Gas Liquids (NGLs) from natural gas processing. NGL - Natural gas liquids refer to the entrained liquids entrained in natural gas such as ethane, propane, normal butane, iso-butane, and pentane. Typically NGL refers to mix of liquids. Normal Butane - Normal butane is an organic compound with the chemical formula of n-C4H10. At room temperature it is a colorless and odorless gas. Normal butane is a common feedstock for petrochemical facilities, plus aerosol propellant and camping cook stove fuel. Pentane - Pentane is an organic compound with the chemical formula of C5H12. At room temperature it is a colorless liquid. Pentane is a solvent and due to the low boiling point can be used as a working fluid in binary power plants. For purposes of this study, pentane and other high molecular weight organic compounds will be assumed to be sold into the local refining market in Alaska. Propane - Propane is an organic compound with the chemical formula of C3H8. At room temperature it is a colorless and odorless gas. Propane is a common product used for transportation fuel, cutting torches, plus heating and cooking in homes. Straddle Plant - Straddle plant refers to a processing plant that removes NGLs from a natural gas pipeline producing a “dry gas” product. WTI – West Texas Intermediate, benchmark associate with Texas Light Sweet used for pricing crude oil.