economic growth and performance. measuring economic growth gdp or gnp? gdp or gnp? measures a...
TRANSCRIPT
ECONOMIC GROWTHECONOMIC GROWTHAND PERFORMANCEAND PERFORMANCE
MEASURING ECONOMIC MEASURING ECONOMIC GROWTHGROWTH
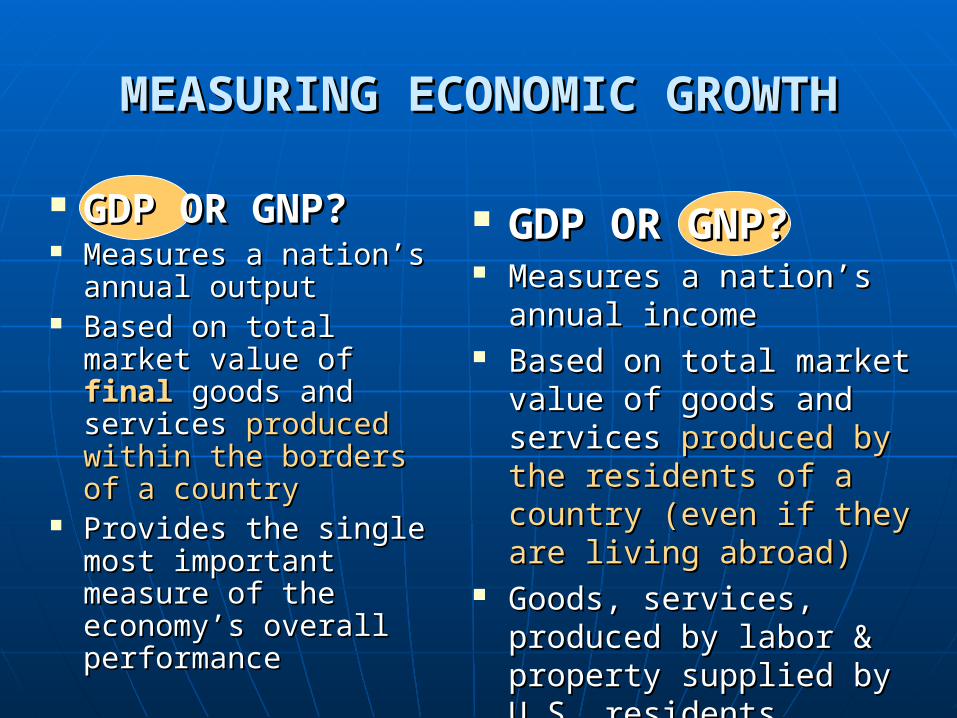
GDP OR GNP?GDP OR GNP? Measures a nation’s Measures a nation’s
annual outputannual output Based on total market Based on total market
value of value of finalfinal goods goods and services and services produced within the produced within the borders of a countryborders of a country
Provides the single Provides the single most important most important measure of the measure of the economy’s overall economy’s overall performanceperformance
GDP OR GNP?GDP OR GNP? Measures a nation’s Measures a nation’s
annual incomeannual income Based on total market Based on total market
value of goods and value of goods and services services produced by the produced by the residents of a country residents of a country (even if they are living (even if they are living abroad)abroad)
Goods, services, produced Goods, services, produced by labor & property by labor & property supplied by U.S. residentssupplied by U.S. residents
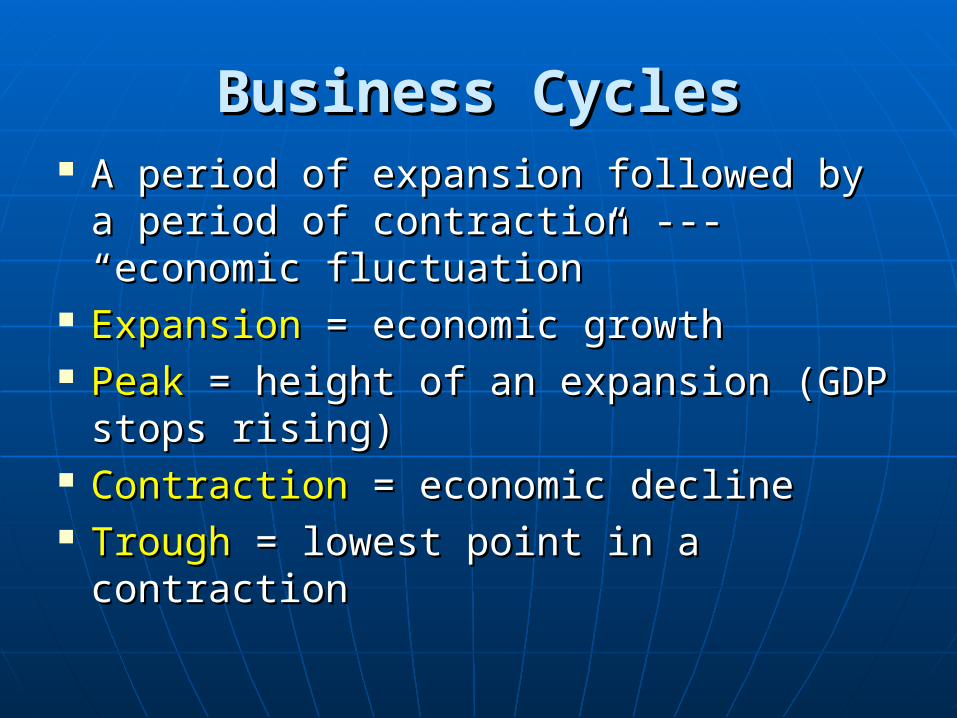
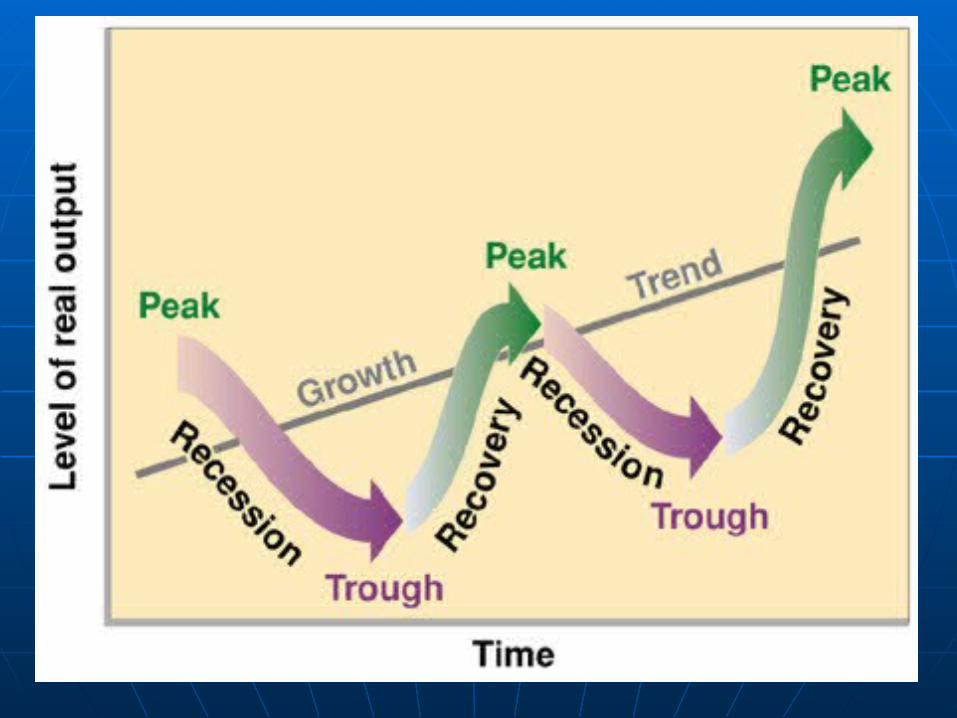
Business CyclesBusiness Cycles A period of expansion followed by a A period of expansion followed by a
period of contraction --- “economic period of contraction --- “economic fluctuation”fluctuation”
ExpansionExpansion = economic growth = economic growth PeakPeak = height of an expansion (GDP = height of an expansion (GDP
stops rising)stops rising) ContractionContraction = economic decline = economic decline Trough Trough = lowest point in a contraction= lowest point in a contraction
Recession vs. DepressionRecession vs. Depression RecessionRecession = prolonged economic contraction = prolonged economic contraction
• 6 to 18 months usually6 to 18 months usually• Unemployment 6 – 10%Unemployment 6 – 10%• The Great Recession?The Great Recession?
DepressionDepression = long, severe, deep recession = long, severe, deep recession• Lasts longerLasts longer• More unemployment; low outputMore unemployment; low output
WHY does a high unemployment rate correspond with a WHY does a high unemployment rate correspond with a recession?recession?• Because, by definition, a recession is a stage of the business cycle Because, by definition, a recession is a stage of the business cycle
that is marked by decreased productivity and a high rate of that is marked by decreased productivity and a high rate of unemployment.unemployment.
Interactive map of the Great Recession - Interactive map of the Great Recession - http://www.latoyaegwuekwe.com/geographyofarecession.htmlhttp://www.latoyaegwuekwe.com/geographyofarecession.html
Variables that affect business cycles:Variables that affect business cycles: Business investmentBusiness investment
• Expand when economy does; creates additional output Expand when economy does; creates additional output and jobsand jobs
Interest Rates and CreditInterest Rates and Credit• High rates; consumers don’t buy and businesses don’t High rates; consumers don’t buy and businesses don’t
expandexpand• Low savings rates --- no $ for loans ….Low savings rates --- no $ for loans ….
So where do businesses then go for loans?So where do businesses then go for loans? Consumer ExpectationsConsumer Expectations
• Consumers may reduce spending if expecting a downturnConsumers may reduce spending if expecting a downturn External ShocksExternal Shocks
• Droughts, oil crisis, warsDroughts, oil crisis, wars
Measuring Measuring Economic Economic GrowthGrowth
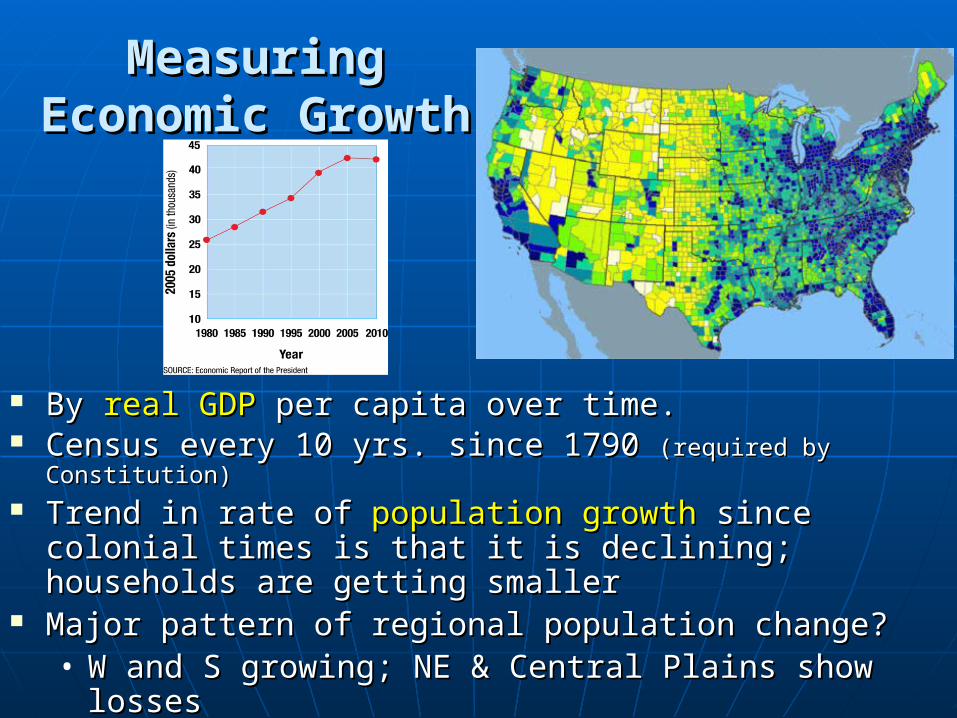
By By real GDP real GDP per capita over time.per capita over time. Census every 10 yrs. since 1790 Census every 10 yrs. since 1790 (required by Constitution)(required by Constitution) Trend in rate of Trend in rate of population growth population growth since colonial times since colonial times
is that it is declining; households are getting smalleris that it is declining; households are getting smaller Major pattern of regional population change?Major pattern of regional population change?
• W and S growing; NE & Central Plains show lossesW and S growing; NE & Central Plains show losses GDP measures GDP measures standard of living standard of living - in the U.S.?- in the U.S.? What does GDP NOT measure?What does GDP NOT measure?
Measuring Measuring Economic Economic GrowthGrowth
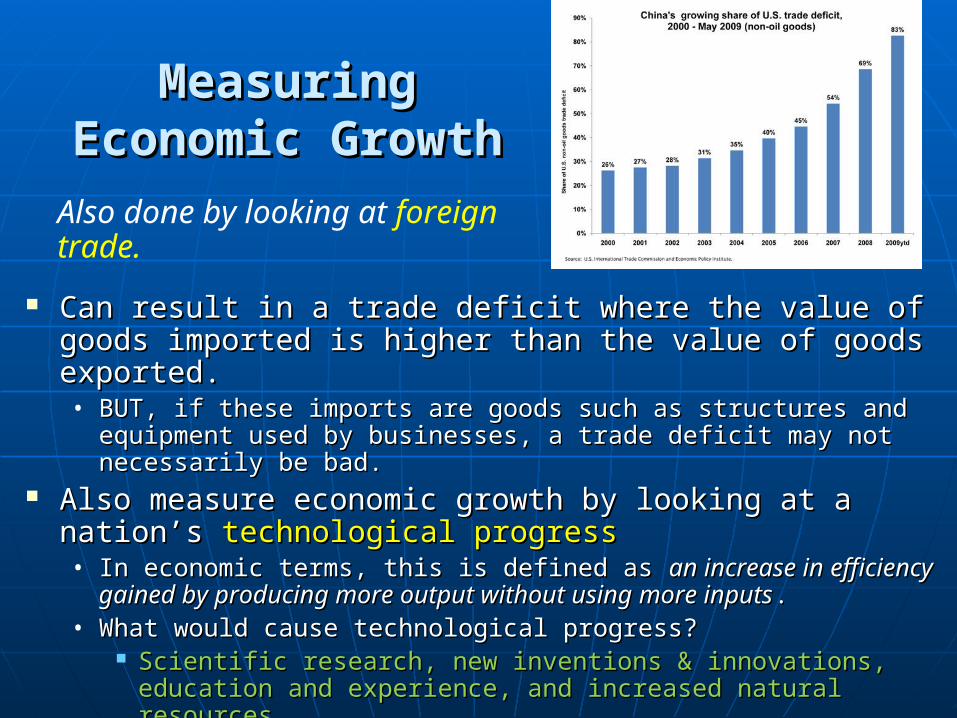
Can result in a trade deficit where the value of goods Can result in a trade deficit where the value of goods imported is higher than the value of goods exported.imported is higher than the value of goods exported.• BUT, if these imports are goods such as structures and BUT, if these imports are goods such as structures and
equipment used by businesses, a trade deficit may not equipment used by businesses, a trade deficit may not necessarily be bad.necessarily be bad.
Also measure economic growth by looking at a Also measure economic growth by looking at a nation’s nation’s technological progresstechnological progress• In economic terms, this is defined as In economic terms, this is defined as an increase in efficiency an increase in efficiency
gained by producing more output without using more inputsgained by producing more output without using more inputs..• What would cause technological progress?What would cause technological progress?
Scientific research, new inventions & innovations, Scientific research, new inventions & innovations, education and experience, and increased natural resources education and experience, and increased natural resources
Also done by looking at foreign trade.
MEASURING MEASURING UNEMPLOYMENTUNEMPLOYMENT
Number of unemployed Number of unemployed identified monthly by identified monthly by Census BureauCensus Bureau
Unemployment rate does Unemployment rate does not include dropouts and not include dropouts and makes no distinction makes no distinction between full and part time between full and part time employeesemployees
What is the difference What is the difference between frictional, between frictional, structural, cyclical, structural, cyclical, seasonal and technological seasonal and technological unemployment?unemployment?
MEASURING MEASURING UNEMPLOYMENTUNEMPLOYMENT
Frictional unemployment Frictional unemployment is is when workers are between when workers are between jobs – trying to find a job. jobs – trying to find a job.
Structural unemployment Structural unemployment happens when a change in happens when a change in the economy occurs that the economy occurs that reduces the demand for reduces the demand for workers’ skillsworkers’ skills• New technology… horses to New technology… horses to
carscars• New resourcesNew resources• Changes in consumer demandChanges in consumer demand• Globalization – companies Globalization – companies
move assembly work to Chinamove assembly work to China• Lack of education… so can’t do Lack of education… so can’t do
a good job…get fireda good job…get fired
MEASURING MEASURING UNEMPLOYMENTUNEMPLOYMENT
Seasonal unemployment Seasonal unemployment occurs as the result of occurs as the result of harvest schedules, vacations, or when industries harvest schedules, vacations, or when industries make seasonal shifts in their production schedules make seasonal shifts in their production schedules
Cyclical unemploymentCyclical unemployment: unemployment that rises : unemployment that rises during economic downturns and falls when the during economic downturns and falls when the economy improveseconomy improves
MEASURING MEASURING UNEMPLOYMENTUNEMPLOYMENT
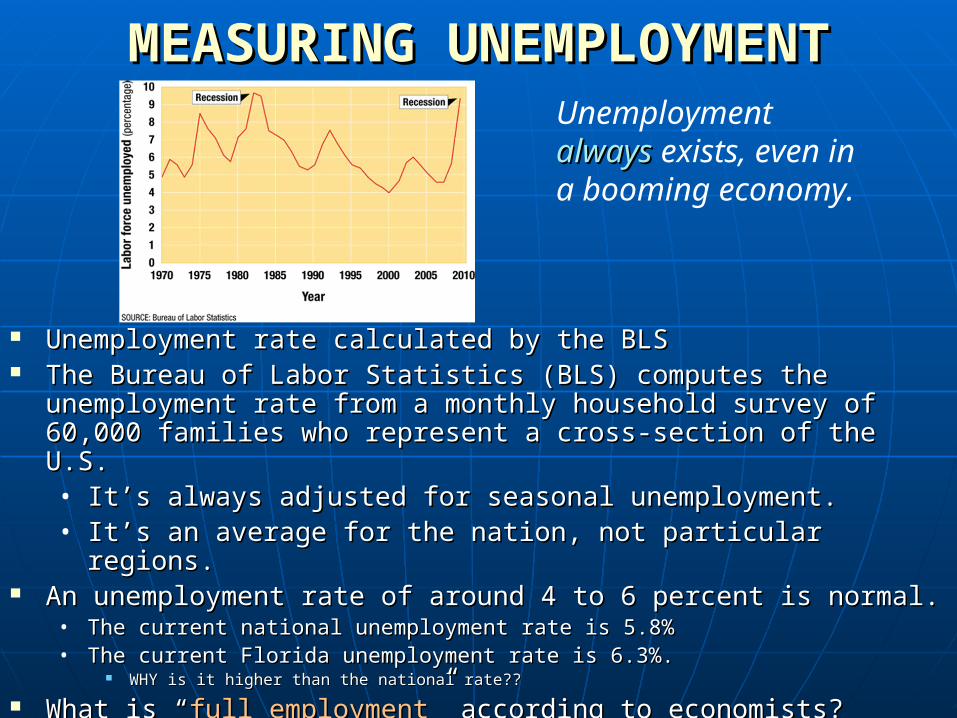
Unemployment rate calculated by the BLSUnemployment rate calculated by the BLS The Bureau of Labor Statistics (BLS) computes the unemployment The Bureau of Labor Statistics (BLS) computes the unemployment
rate from a monthly household survey of 60,000 families who rate from a monthly household survey of 60,000 families who represent a cross-section of the U.S.represent a cross-section of the U.S.• It’s always adjusted for seasonal unemployment.It’s always adjusted for seasonal unemployment.• It’s an average for the nation, not particular regions.It’s an average for the nation, not particular regions.
An unemployment rate of around 4 to 6 percent is normal.An unemployment rate of around 4 to 6 percent is normal.• The current national unemployment rate is 5.8%The current national unemployment rate is 5.8%• The current Florida unemployment rate is 6.3%.The current Florida unemployment rate is 6.3%.
WHY is it higher than the national rate??WHY is it higher than the national rate??
What is “What is “full employmentfull employment” according to economists?” according to economists?• when no cyclical unemployment existswhen no cyclical unemployment exists
Unemployment alwaysalways exists, even in a booming economy.
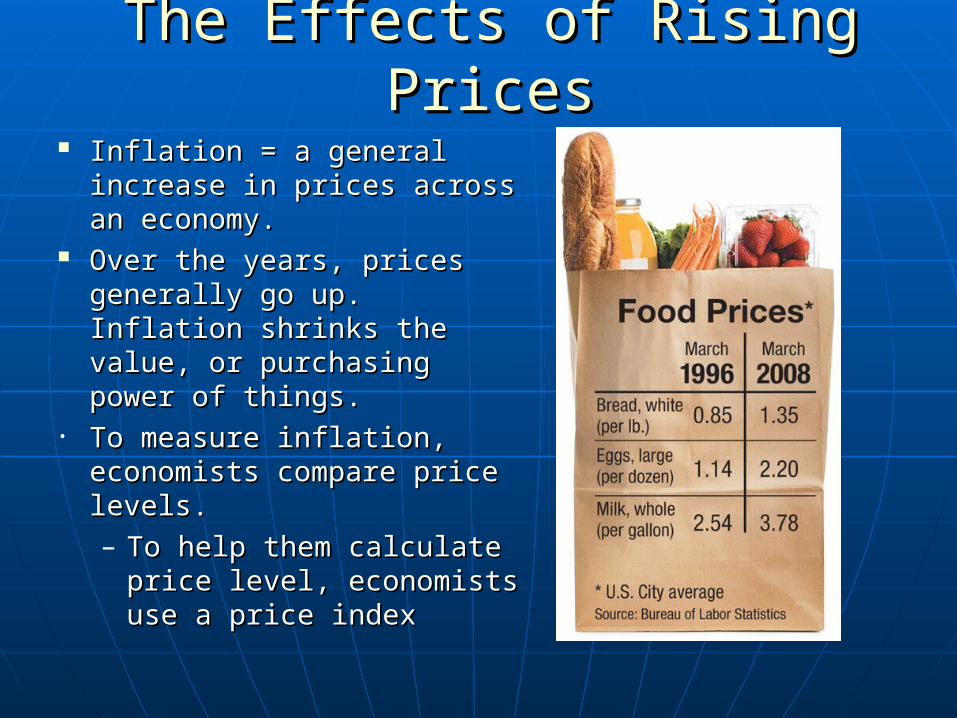
The Effects of Rising PricesThe Effects of Rising Prices Inflation = a general Inflation = a general
increase in prices across an increase in prices across an economy. economy.
Over the years, prices Over the years, prices generally go up. Inflation generally go up. Inflation shrinks the value, or shrinks the value, or purchasing power of things.purchasing power of things.
• To measure inflation, To measure inflation, economists compare price economists compare price levels. levels. – To help them calculate To help them calculate
price level, economists price level, economists use a price indexuse a price index
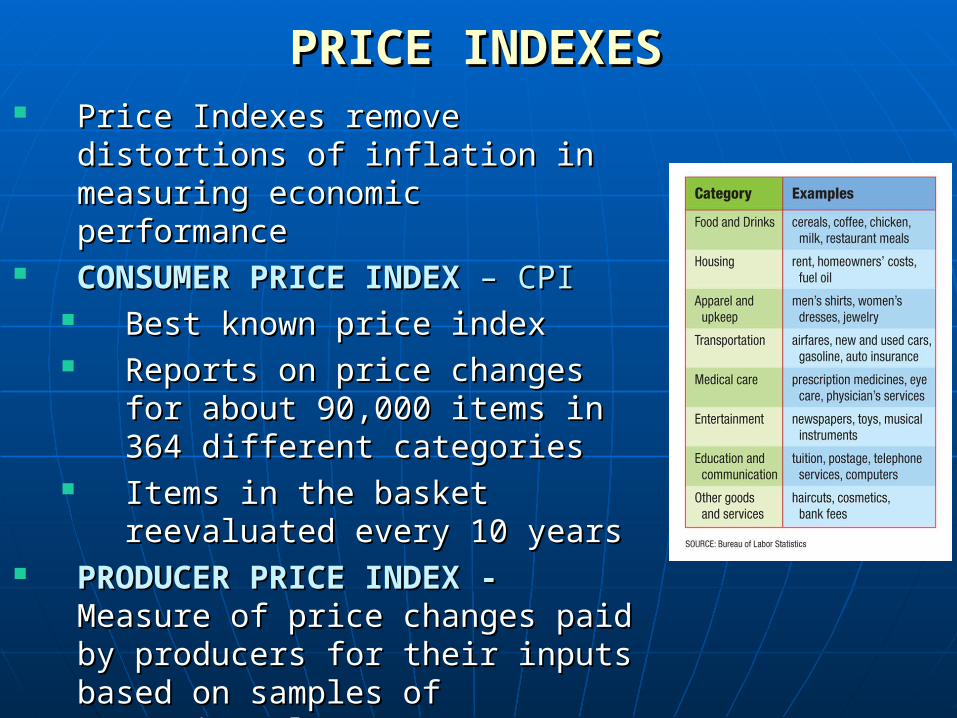
PRICE INDEXESPRICE INDEXES Price Indexes remove distortions Price Indexes remove distortions
of inflation in measuring economic of inflation in measuring economic performanceperformance
CONSUMER PRICE INDEX CONSUMER PRICE INDEX – CPI– CPI Best known price indexBest known price index Reports on price changes for Reports on price changes for
about 90,000 items in 364 about 90,000 items in 364 different categoriesdifferent categories
Items in the basket reevaluated Items in the basket reevaluated every 10 yearsevery 10 years
PRODUCER PRICE INDEX - PRODUCER PRICE INDEX - Measure of price changes paid by Measure of price changes paid by producers for their inputs based producers for their inputs based on samples of approximately on samples of approximately 100,000 different types of items100,000 different types of items
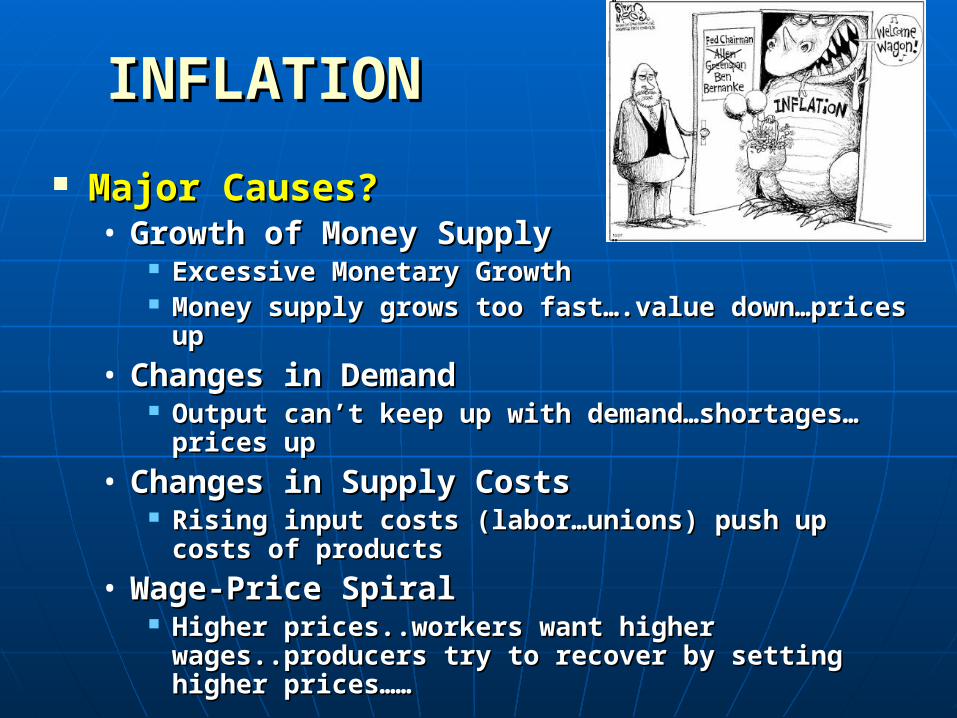
INFLATIONINFLATION
Major Causes?Major Causes?• Growth of Money SupplyGrowth of Money Supply
Excessive Monetary GrowthExcessive Monetary Growth Money supply grows too fast….value down…Money supply grows too fast….value down…
prices upprices up
• Changes in DemandChanges in Demand Output can’t keep up with demand…shortages…Output can’t keep up with demand…shortages…
prices upprices up
• Changes in Supply CostsChanges in Supply Costs Rising input costs (labor…unions) push up costs Rising input costs (labor…unions) push up costs
of productsof products
• Wage-Price SpiralWage-Price Spiral Higher prices..workers want higher Higher prices..workers want higher
wages..producers try to recover by setting wages..producers try to recover by setting higher prices……higher prices……
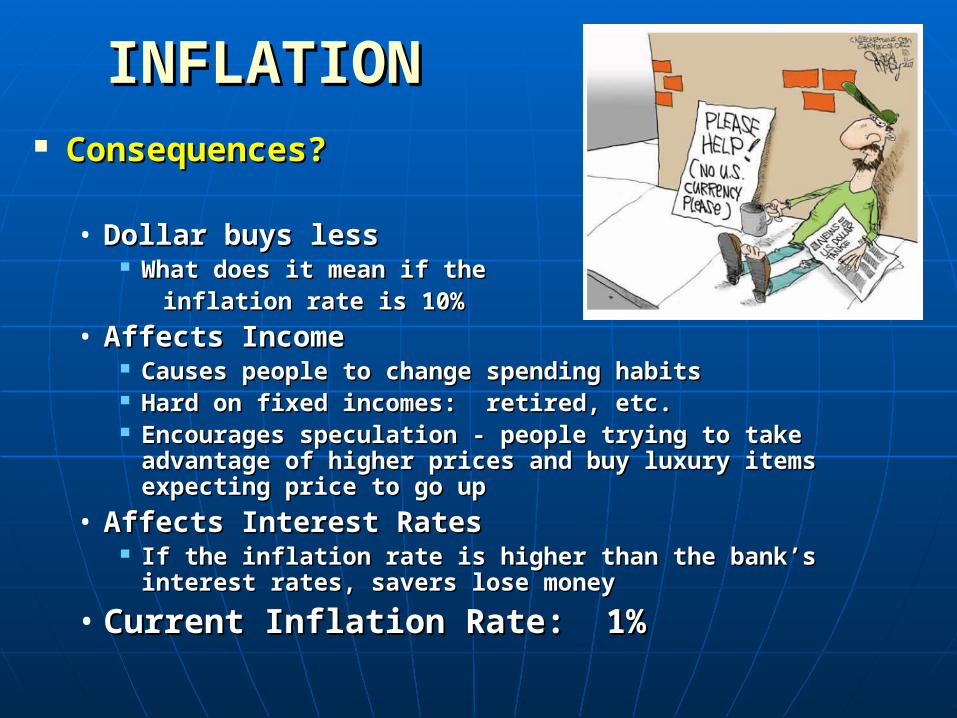
INFLATIONINFLATION Consequences?Consequences?
• Dollar buys lessDollar buys less What does it mean if theWhat does it mean if the inflation rate is 10%inflation rate is 10%
• Affects IncomeAffects Income Causes people to change spending habitsCauses people to change spending habits Hard on fixed incomes: Hard on fixed incomes: retired, etc.retired, etc. Encourages speculation - people trying to take Encourages speculation - people trying to take
advantage of higher prices and buy luxury items advantage of higher prices and buy luxury items expecting price to go upexpecting price to go up
• Affects Interest RatesAffects Interest Rates If the inflation rate is higher than the bank’s interest If the inflation rate is higher than the bank’s interest
rates, savers lose moneyrates, savers lose money
• Current Inflation Rate: 1%Current Inflation Rate: 1%
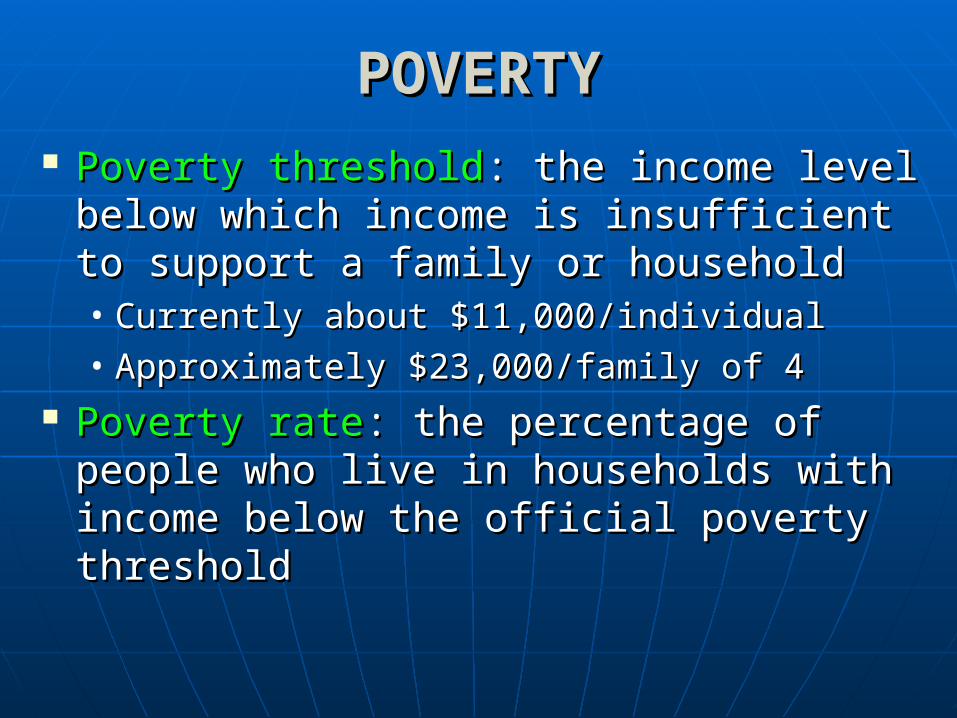
POVERTYPOVERTY Poverty thresholdPoverty threshold: the income level : the income level
below which income is insufficient to below which income is insufficient to support a family or household support a family or household • Currently about $11,000/individualCurrently about $11,000/individual• Approximately $23,000/family of 4Approximately $23,000/family of 4
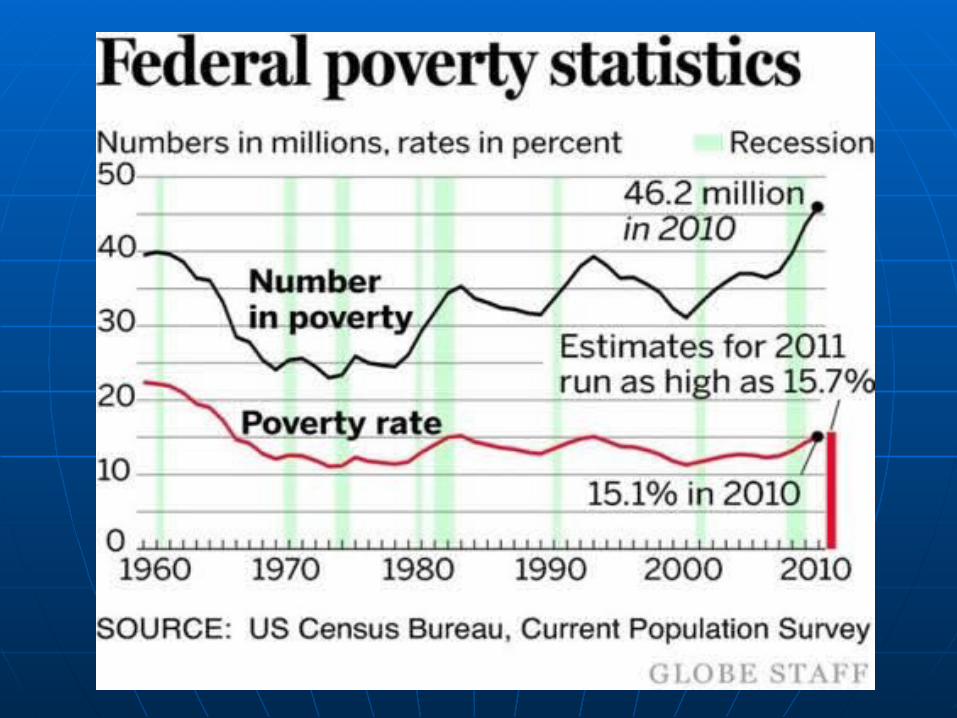
Poverty ratePoverty rate: the percentage of people : the percentage of people who live in households with income who live in households with income below the official poverty thresholdbelow the official poverty threshold
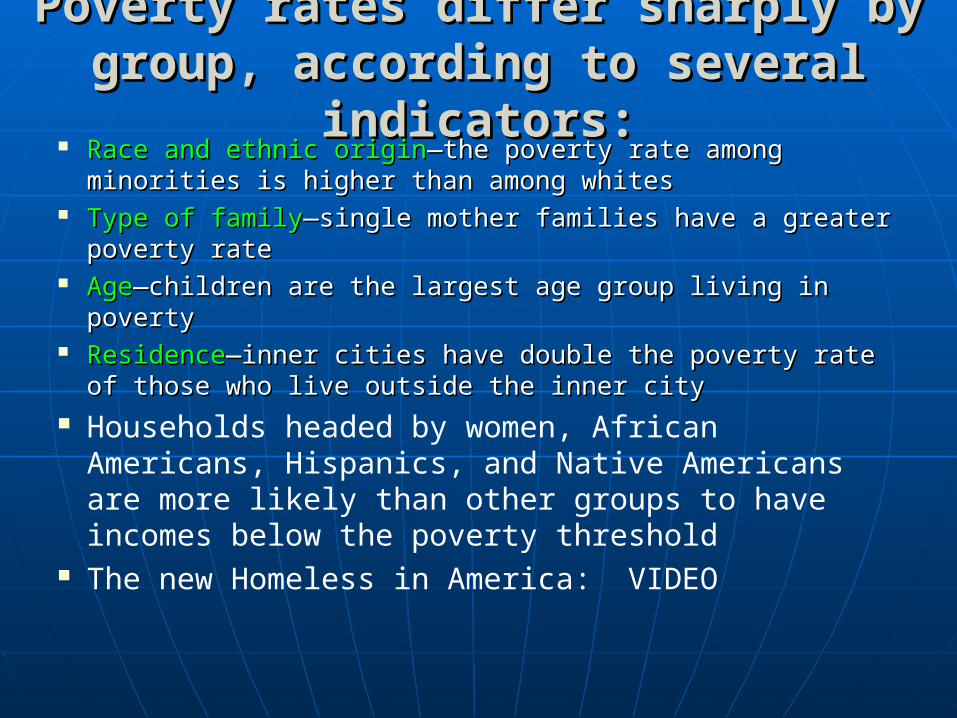
Poverty rates differ sharply by group, Poverty rates differ sharply by group, according to several indicators:according to several indicators:
Race and ethnic originRace and ethnic origin—the poverty rate among —the poverty rate among minorities is higher than among whitesminorities is higher than among whites
Type of familyType of family—single mother families have a greater —single mother families have a greater poverty ratepoverty rate
AgeAge—children are the largest age group living in poverty—children are the largest age group living in poverty ResidenceResidence—inner cities have double the poverty rate of —inner cities have double the poverty rate of
those who live outside the inner citythose who live outside the inner city Households headed by women, African Americans,
Hispanics, and Native Americans are more likely than other groups to have incomes below the poverty threshold
The new Homeless in America: VIDEO