economic impact of highly pathogenic avian influenza (hpai ... · with the recent outbreak of...
TRANSCRIPT
Economic Impact of Highly Pathogenic Avian
Influenza (HPAI) on Poultry in Iowa
Prepared For:
Prepared By:
August 2015

2
Table of Contents Executive Summary ....................................................................................................................................... 3
Background ................................................................................................................................................... 4
Methodology ............................................................................................................................................... 10
IMPLAN Model Inputs ............................................................................................................................. 10
Assumptions ............................................................................................................................................ 11
Year of Analysis ................................................................................................................................... 11
Anticipated Production ....................................................................................................................... 12
Expected Indemnities .......................................................................................................................... 12
Results ......................................................................................................................................................... 13
Top Ten Sectors Impacted ...................................................................................................................... 13
Tax Implications ...................................................................................................................................... 15
Conclusion ................................................................................................................................................... 16
3
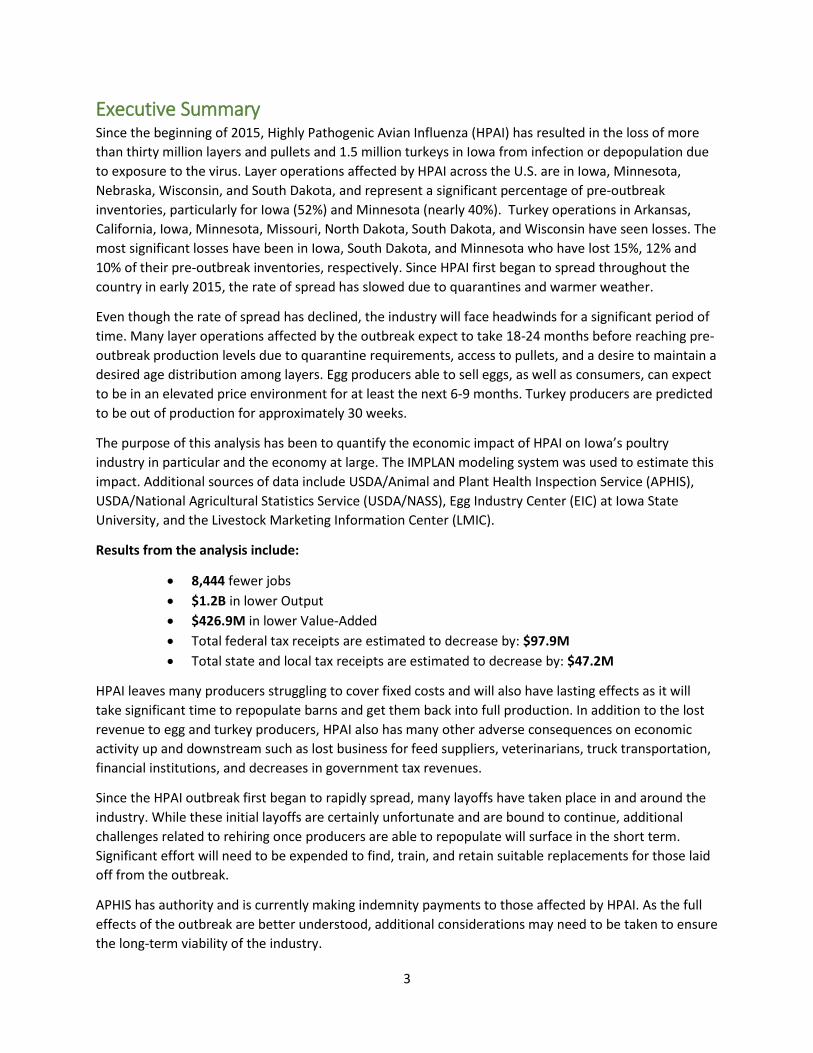
Executive Summary Since the beginning of 2015, Highly Pathogenic Avian Influenza (HPAI) has resulted in the loss of more
than thirty million layers and pullets and 1.5 million turkeys in Iowa from infection or depopulation due
to exposure to the virus. Layer operations affected by HPAI across the U.S. are in Iowa, Minnesota,
Nebraska, Wisconsin, and South Dakota, and represent a significant percentage of pre-outbreak
inventories, particularly for Iowa (52%) and Minnesota (nearly 40%). Turkey operations in Arkansas,
California, Iowa, Minnesota, Missouri, North Dakota, South Dakota, and Wisconsin have seen losses. The
most significant losses have been in Iowa, South Dakota, and Minnesota who have lost 15%, 12% and
10% of their pre-outbreak inventories, respectively. Since HPAI first began to spread throughout the
country in early 2015, the rate of spread has slowed due to quarantines and warmer weather.
Even though the rate of spread has declined, the industry will face headwinds for a significant period of
time. Many layer operations affected by the outbreak expect to take 18-24 months before reaching pre-
outbreak production levels due to quarantine requirements, access to pullets, and a desire to maintain a
desired age distribution among layers. Egg producers able to sell eggs, as well as consumers, can expect
to be in an elevated price environment for at least the next 6-9 months. Turkey producers are predicted
to be out of production for approximately 30 weeks.
The purpose of this analysis has been to quantify the economic impact of HPAI on Iowa’s poultry
industry in particular and the economy at large. The IMPLAN modeling system was used to estimate this
impact. Additional sources of data include USDA/Animal and Plant Health Inspection Service (APHIS),
USDA/National Agricultural Statistics Service (USDA/NASS), Egg Industry Center (EIC) at Iowa State
University, and the Livestock Marketing Information Center (LMIC).
Results from the analysis include:
8,444 fewer jobs
$1.2B in lower Output
$426.9M in lower Value-Added
Total federal tax receipts are estimated to decrease by: $97.9M
Total state and local tax receipts are estimated to decrease by: $47.2M
HPAI leaves many producers struggling to cover fixed costs and will also have lasting effects as it will
take significant time to repopulate barns and get them back into full production. In addition to the lost
revenue to egg and turkey producers, HPAI also has many other adverse consequences on economic
activity up and downstream such as lost business for feed suppliers, veterinarians, truck transportation,
financial institutions, and decreases in government tax revenues.
Since the HPAI outbreak first began to rapidly spread, many layoffs have taken place in and around the
industry. While these initial layoffs are certainly unfortunate and are bound to continue, additional
challenges related to rehiring once producers are able to repopulate will surface in the short term.
Significant effort will need to be expended to find, train, and retain suitable replacements for those laid
off from the outbreak.
APHIS has authority and is currently making indemnity payments to those affected by HPAI. As the full
effects of the outbreak are better understood, additional considerations may need to be taken to ensure
the long-term viability of the industry.
4
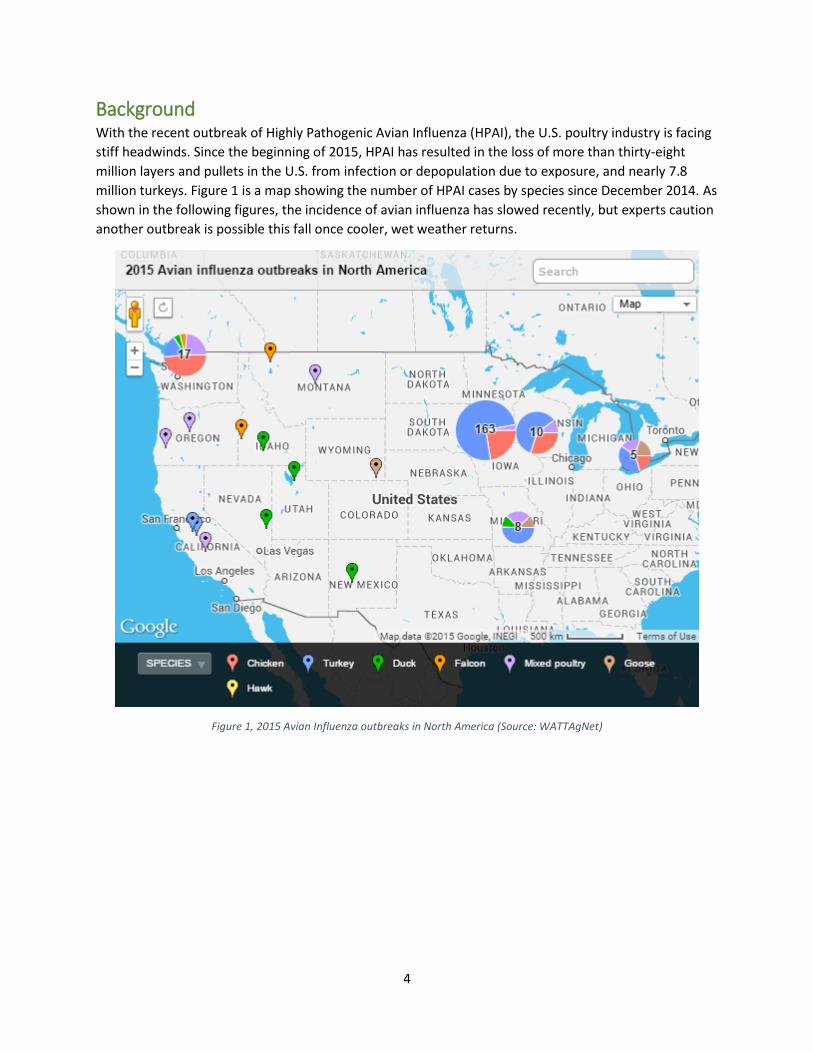
Background With the recent outbreak of Highly Pathogenic Avian Influenza (HPAI), the U.S. poultry industry is facing
stiff headwinds. Since the beginning of 2015, HPAI has resulted in the loss of more than thirty-eight
million layers and pullets in the U.S. from infection or depopulation due to exposure, and nearly 7.8
million turkeys. Figure 1 is a map showing the number of HPAI cases by species since December 2014. As
shown in the following figures, the incidence of avian influenza has slowed recently, but experts caution
another outbreak is possible this fall once cooler, wet weather returns.
Figure 1, 2015 Avian Influenza outbreaks in North America (Source: WATTAgNet)
5
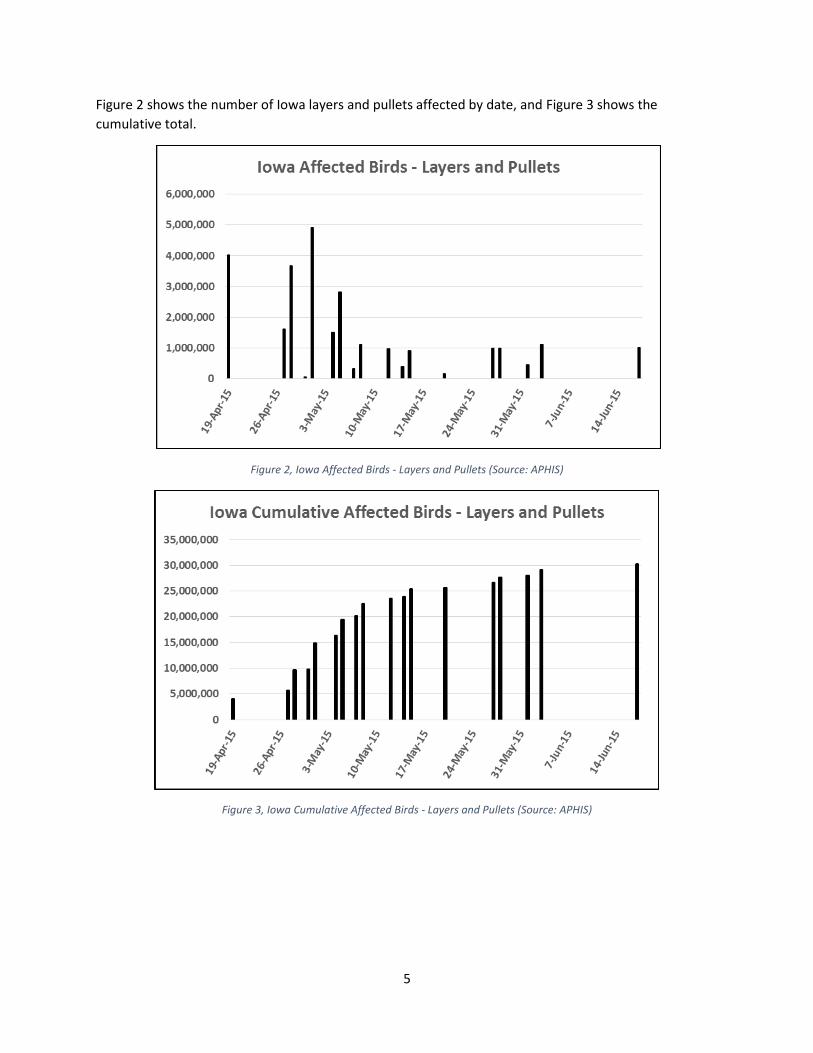
Figure 2 shows the number of Iowa layers and pullets affected by date, and Figure 3 shows the
cumulative total.
Figure 2, Iowa Affected Birds - Layers and Pullets (Source: APHIS)
Figure 3, Iowa Cumulative Affected Birds - Layers and Pullets (Source: APHIS)
6
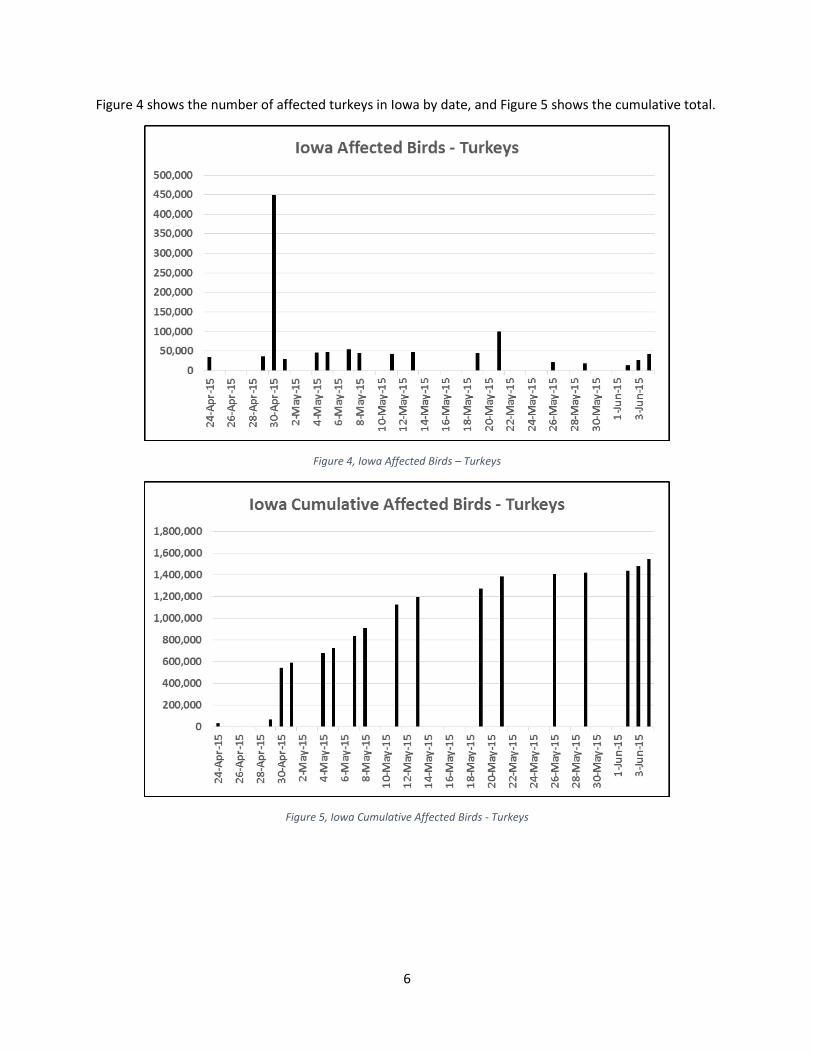
Figure 4 shows the number of affected turkeys in Iowa by date, and Figure 5 shows the cumulative total.
Figure 4, Iowa Affected Birds – Turkeys
Figure 5, Iowa Cumulative Affected Birds - Turkeys
7
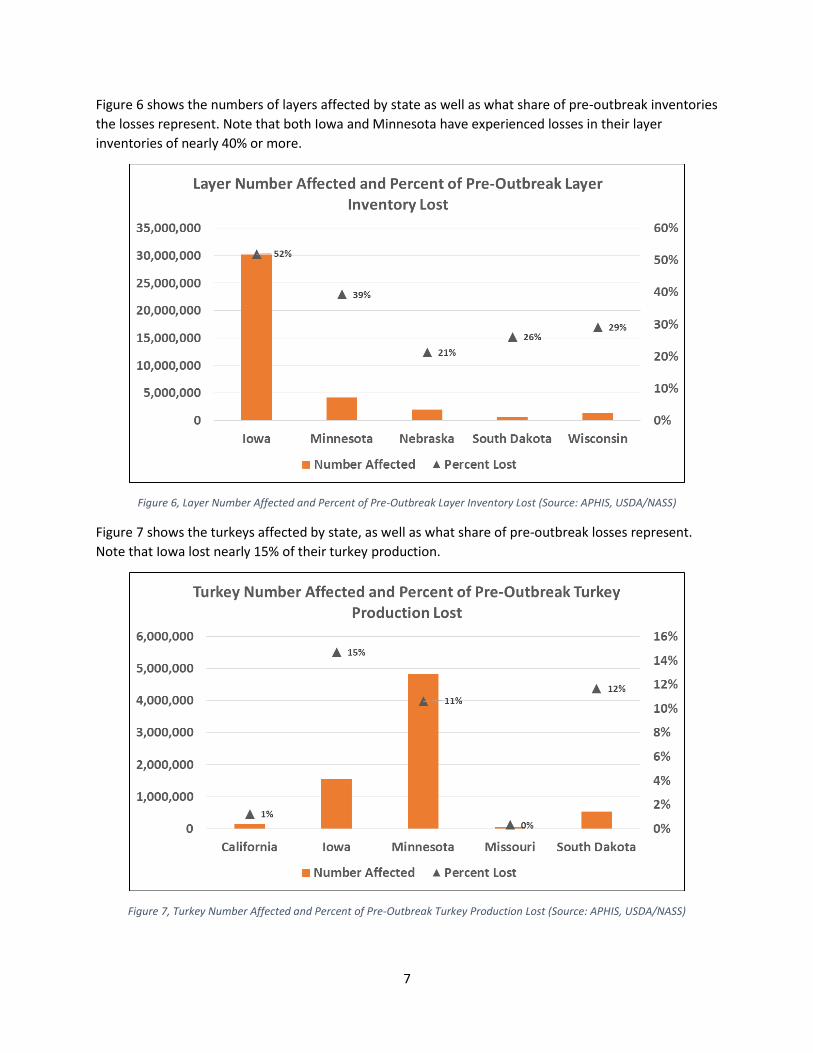
Figure 6 shows the numbers of layers affected by state as well as what share of pre-outbreak inventories
the losses represent. Note that both Iowa and Minnesota have experienced losses in their layer
inventories of nearly 40% or more.
Figure 6, Layer Number Affected and Percent of Pre-Outbreak Layer Inventory Lost (Source: APHIS, USDA/NASS)
Figure 7 shows the turkeys affected by state, as well as what share of pre-outbreak losses represent.
Note that Iowa lost nearly 15% of their turkey production.
Figure 7, Turkey Number Affected and Percent of Pre-Outbreak Turkey Production Lost (Source: APHIS, USDA/NASS)
8
One challenge as the industry moves forward is how long affected barns will be empty before being
cleared to repopulate. Further challenges arise when repopulating due to the need for staggered ages in
layers – something not a consideration for turkey producers. This means egg producers will not choose
to repopulate all farms with pullets of the same age even if obtaining sufficient numbers of pullets at
once were possible. Significant loss of pullets (nearly six million) to HPAI also contributes to the
repopulation dilemma.
While some farms may opt (due to a temporary positive change in egg production economics) to extend
egg production of unaffected layers through molting and other means, repopulation will be further
compounded by expectations of high demand for pullets once many affected farms are cleared to once
again begin producing eggs.
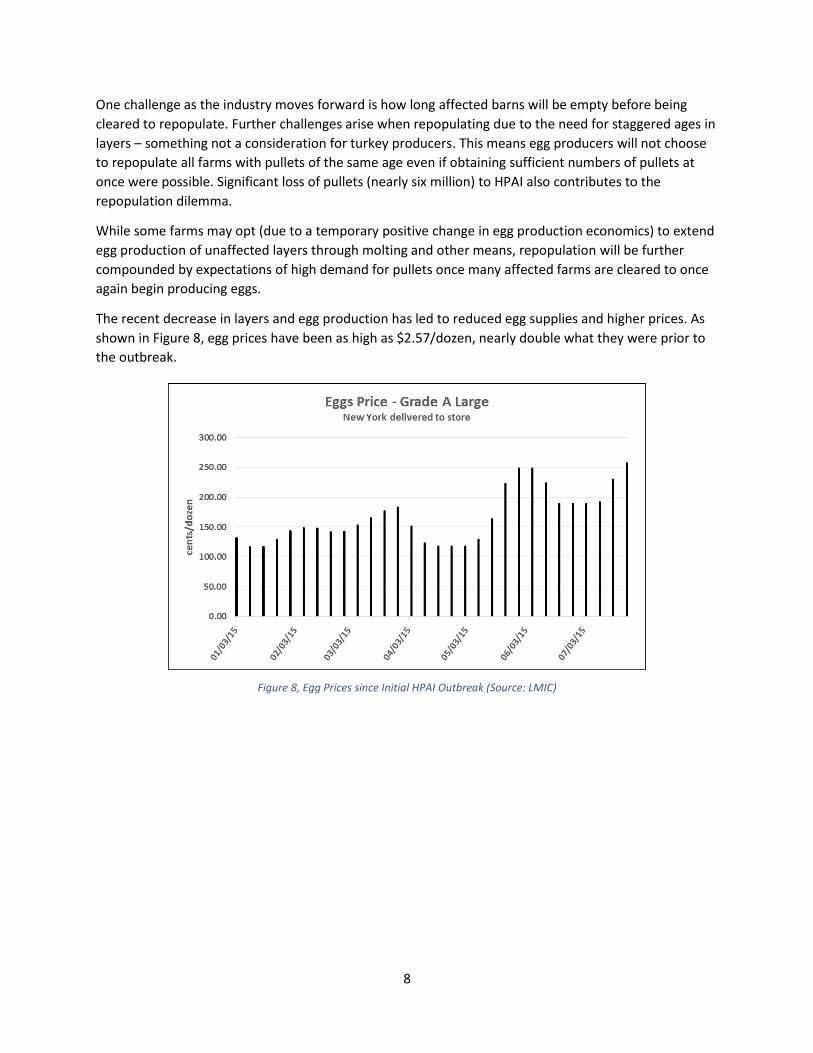
The recent decrease in layers and egg production has led to reduced egg supplies and higher prices. As
shown in Figure 8, egg prices have been as high as $2.57/dozen, nearly double what they were prior to
the outbreak.
Figure 8, Egg Prices since Initial HPAI Outbreak (Source: LMIC)
9
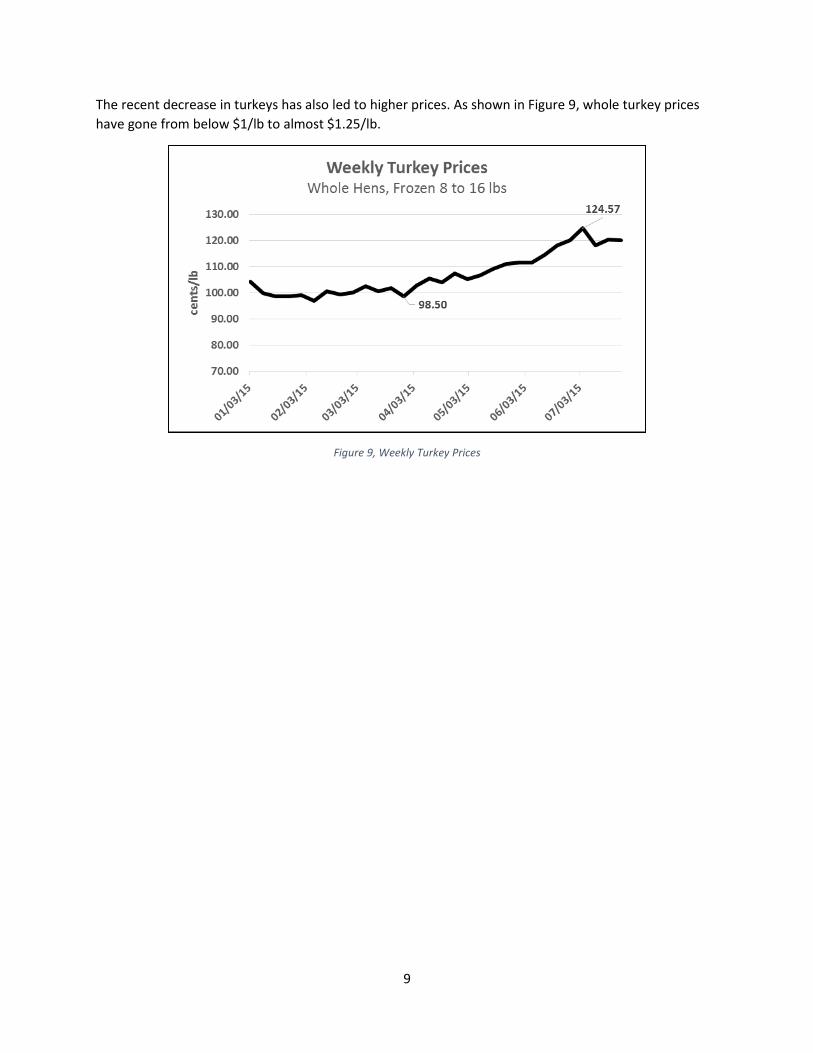
The recent decrease in turkeys has also led to higher prices. As shown in Figure 9, whole turkey prices
have gone from below $1/lb to almost $1.25/lb.
Figure 9, Weekly Turkey Prices
10
Methodology The term “economic impact study” implies a change has taken place within a local economy. The change
in an economy typically comes from one of the following sources:
Entrance/departure of a new business or industry
Expansion/contraction of an existing business or industry
In this case, we are dealing with the contraction of an existing industry; therefore we would expect a
negative economic impact from the change. Common measures of economic activity are: Employment
(jobs), Labor Income, Value Added, and Output (sales). A loss as significant as the one under study
precludes a series of economic activities from taking place. The magnitude of these economic losses is
largely related to the presence of industries that supply the inputs and process the products generated
from egg production.
Operations at an egg farm require many purchases from pullets to stock the barn, feed purchases,
veterinary services, and many other inputs to produce the eggs for sale. The direct purchases of supplies
and equipment are known as direct effects. The suppliers and vendors used by the poultry facilities then
must purchase inputs to supply the poultry facilities; these are known as indirect effects. Those who
work on the farm or for the farm’s suppliers and vendors then use their additional income to make
household purchases; these are known as household, or induced effects. Together, the sum of direct,
indirect, and induced effects are known as total effects and account for the total multiplier effect
present from the loss of birds.
When conducting economic impact analyses, an analyst following industry practice typically relies on
primary sources of data, such as the project sponsor and others with first-hand knowledge of the
project, and pertinent information obtained from independent sources. Additionally, an analyst typically
makes use of any number of software packages to understand the linkages among industries present in
the study area. These software packages rely heavily upon periodically reported government statistics
and surveys and other secondary source data. The purpose of these data sources is to identify and
quantify the inputs a particular industry must obtain in order to produce its specific good(s) and/or
service(s).
For the purpose of this analysis, we have utilized IMPLAN software1, which is software designed to
capture the total effects of a particular change in an economy. The 2013 IMPLAN national dataset was
used as a basis from which to update to 2014 USDA/NASS values. APHIS was used as the data source for
the number of birds lost.
IMPLAN Model Inputs For this analysis we assumed affected farms would remain empty and not producing eggs for a period of
12 months. Using APHIS affected layer data as of July 22, 2015, an estimate of lost egg production (in
dozens) per layer was calculated for affected layers in Iowa. This was done using an industry average
daily lay rate of 0.8. Lost egg production (in dollars) per layer was calculated by factoring the farm level
price reported by the Egg Industry Center at Iowa State University against lost dozens/layer.
1 IMPLAN is an acronym for Impact Analysis for PLANing. Please visit www.implan.com for more background information on the software and associated datasets.
11
Calculations are as follows:
Lost Production per Layer (dz eggs) = (365 days/yr * 0.8)/12
Lost Production per Layer ($) = Lost Production per Layer (dz) * $1.025
Using the above formulas yields a loss of 24.33 dozen per layer over the course of a year. Factoring the
2014 average farm price of $1.025/dz yields a loss of $24.94/layer. This loss was then multiplied by total
affected layers in Iowa through July 22, 2015 (30.2 million) – a total of $752.6M in lost direct economic
activity prior to adjusting for expected indemnities of $113.2M from APHIS (as explained in
“Assumptions” section). This results in a net direct loss to the industry of $639.3M, which is the amount
entered into the IMPLAN model created for this part of the analysis.
For the turkey portion we assume that affected farms would be out of production for approximately 1.5
turns, or 30 weeks. Using APHIS data and an average price per head of $22.50, a lost output value was
calculated. This figure was then adjusted based on the average indemnity amounts that turkey
producers have been receiving. An average indemnity amount was estimated at $14.39, using a range of
indemnities from $2.36 for a week old turkey poult to $26.41 for a 21 week turkey2. This resulted in an
adjusted net direct loss of $18.8M for the turkey portion. This value, when combined with the net direct
loss of $639.3M from the egg/layer portion, equals a total of $658.1M of lost direct economic activity as
a result of HPAI, which is the value that was entered into IMPLAN.
Assumptions In order to estimate the economic impact of HPAI we have made a series of assumptions with regard to
year of analysis, anticipated production and expected indemnities for affected poultry. Additional
information follows.
Year of Analysis The year 2014 was chosen as the basis for analysis. This is due to the fact that the HPAI outbreak had
only officially affected one flock in late 2014. It was not until April that many layer, pullet, and turkey
flocks began to be affected.
As mentioned previously, egg prices have experienced a near doubling since the HPAI outbreak first
occurred. While overall income to the industry is likely to remain at approximately the same level due to
much higher egg prices, we have chosen to model the impact of HPAI as if it were 2014, a period of
market equilibrium. The primary reason for this is if current layer inventory and prices were modeled,
the losses for those actually adversely affected by the outbreak would be masked. Additionally, using
other recent animal disease outbreaks as a guide (i.e., PEDv in hogs), current elevated prices of eggs will
likely retreat quicker than expected, returning the market to equilibrium.
Another reason for using 2014 as the year of analysis is due to the IMPLAN modeling system assuming
constant prices and therefore not fully accounting for the impact of higher prices on other sectors within
the model, even if adjustments were made to the poultry sector within the model.
2 Data source: Iowa Turkey Federation
12
Anticipated Production For this analysis we assumed affected layer farms would remain empty and not producing eggs for a
period of 12 months. Some companies who have the ability to shift pullets among both affected and
non-affected farms may be able to be up to pre-outbreak levels sooner than 12 months and still
maintain the desired age distribution. In other cases many farms may not be up and running for closer
to 18-24 months to achieve the desired age distribution of pullets placed. An industry average daily rate
of lay of 0.8 was used in estimating lost egg production and was factored against APHIS affected layer
data as of July 22, 2015.
In this analysis, it was assumed that a turkey facility would be out of production for approximately 1.5
turns, or about 30 weeks. In reality, this will vary greatly depending on how long the cleaning and
disinfecting process takes for each location, the proximity to other poultry locations that may be
infected and/or quarantined, as well as the availability of poults at the time they are cleared for re-
population.
Expected Indemnities The USDA, through APHIS, is authorized to pay indemnities for birds affected by HPAI. Using calculations
internal to APHIS, the indemnity for a 20-week layer (a newly placed pullet) is $4.22, which includes both
a “capital cost” and “loss of income” components3. Layers older than twenty weeks of age are expected
to receive a progressively lower indemnity based upon documented age in weeks. Using the assumption
that layers of all ages are uniformly distributed across the system, we reduce the portion of the total
indemnity attributed to loss of income ($0.94/layer) by 50%. This results in an average indemnity per
layer of $3.75. Factoring against all affected layers as of July 22, 2015 yields a total estimated industry-
wide indemnity of $113.2M.
Indemnity payments for turkeys vary based on the age of the bird. For example, a week old bird would
receive approximately $2.36, while a 21-week old bird would receive around $26.414. Using an average
indemnity amount of $14.39 for the 1.5 million turkeys lost in Iowa, we arrived at a total estimated
industry-wide indemnity of $33.3M for Iowa.
3 After industry input, APHIS has extended the life expectancy of a layer to 90 weeks which will yield a higher indemnity rate. In the absence of a clear indication of the new indemnity amount we have based our analysis on the prior 80 week life expectancy. 4 Data source: Iowa Turkey Federation
13
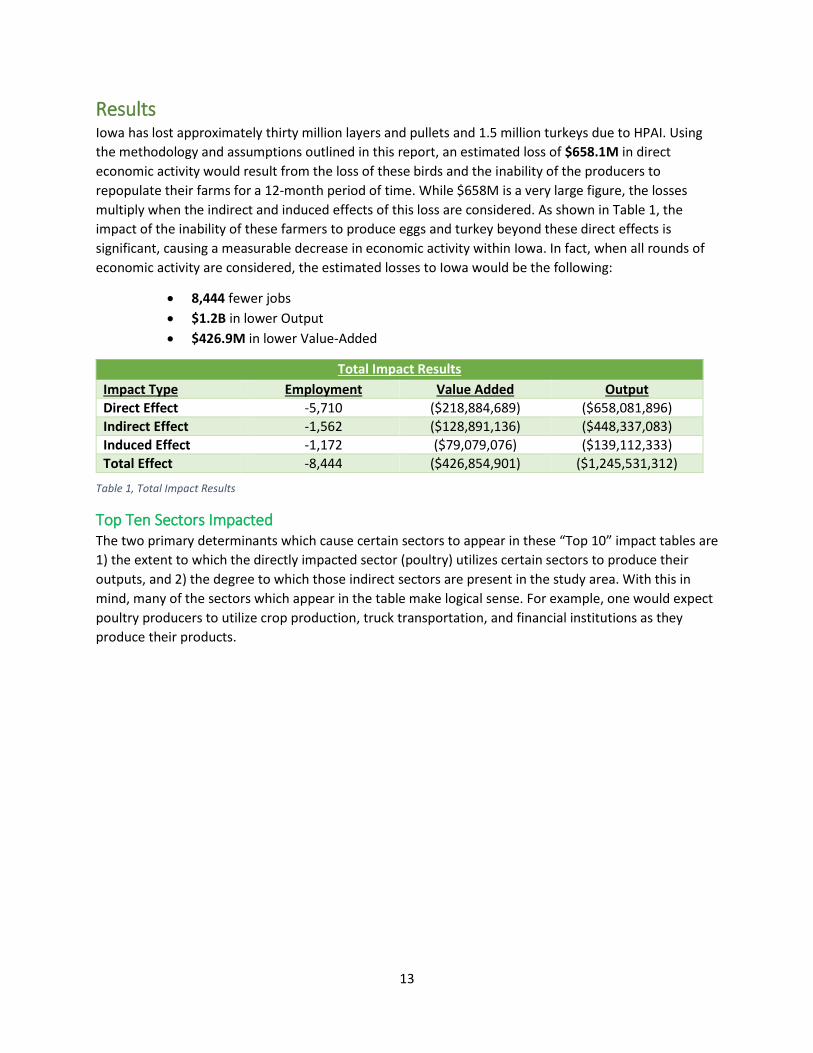
Results Iowa has lost approximately thirty million layers and pullets and 1.5 million turkeys due to HPAI. Using
the methodology and assumptions outlined in this report, an estimated loss of $658.1M in direct
economic activity would result from the loss of these birds and the inability of the producers to
repopulate their farms for a 12-month period of time. While $658M is a very large figure, the losses
multiply when the indirect and induced effects of this loss are considered. As shown in Table 1, the
impact of the inability of these farmers to produce eggs and turkey beyond these direct effects is
significant, causing a measurable decrease in economic activity within Iowa. In fact, when all rounds of
economic activity are considered, the estimated losses to Iowa would be the following:
8,444 fewer jobs
$1.2B in lower Output
$426.9M in lower Value-Added
Total Impact Results
Impact Type Employment Value Added Output
Direct Effect -5,710 ($218,884,689) ($658,081,896)
Indirect Effect -1,562 ($128,891,136) ($448,337,083)
Induced Effect -1,172 ($79,079,076) ($139,112,333)
Total Effect -8,444 ($426,854,901) ($1,245,531,312)
Table 1, Total Impact Results
Top Ten Sectors Impacted The two primary determinants which cause certain sectors to appear in these “Top 10” impact tables are
1) the extent to which the directly impacted sector (poultry) utilizes certain sectors to produce their
outputs, and 2) the degree to which those indirect sectors are present in the study area. With this in
mind, many of the sectors which appear in the table make logical sense. For example, one would expect
poultry producers to utilize crop production, truck transportation, and financial institutions as they
produce their products.

14
In terms of impacts in terms of Output, Table 2 details the top 10 sectors in the Iowa economy that are
impacted. The sum of all total Output impacts will sum to the $1.2B total in Table 1. Please note that
some industry totals may not match exactly due to rounding.
Top 10 Sectors Impacted – Output (Millions)
Sector Direct Indirect Induced Total
Poultry and egg production ($658.1) ($51.1) ($0.2) ($709.4)
Other animal food manufacturing $0.0 ($181.5) ($0.2) ($181.7)
Wholesale trade $0.0 ($48.9) ($6.3) ($55.2)
Grain farming $0.0 ($37.9) ($0.1) ($38.1)
Owner-occupied dwellings $0.0 $0.0 ($19.6) ($19.6)
Truck transportation $0.0 ($16.2) ($1.7) ($17.9)
Soybean and other oilseed processing $0.0 ($13.8) ($0.1) ($13.9)
Real estate $0.0 ($5.8) ($8.0) ($13.8)
Rail transportation $0.0 ($9.8) ($0.2) ($10.0)
Insurance carriers $0.0 ($3.6) ($5.4) ($9.0)
Table 2, Top 10 Sectors Impacted in Terms of Output ($M)
In terms of Value-Added impacts, Table 3 lists the top 10 sectors in the Iowa economy that will be
impacted. The sum of all total Value-Added impacts will sum to the $426.9M total in Table 1.
Top 10 Sectors Impacted – Value-Added (Millions)
Sector Direct Indirect Induced Total
Poultry and egg production ($218.9) ($17.0) ($0.1) ($235.9)
Wholesale trade $0.0 ($30.9) ($4.0) ($34.9)
Other animal food manufacturing $0.0 ($24.9) ($0.0) ($25.0)
Owner-occupied dwellings $0.0 $0.0 ($14.1) ($14.1)
Real estate $0.0 ($4.7) ($6.6) ($11.4)
Truck transportation $0.0 ($7.0) ($0.7) ($7.7)
Rail transportation $0.0 ($6.1) ($0.1) ($6.2)
Insurance carriers $0.0 ($2.3) ($3.5) ($5.8)
Hospitals $0.0 $0.0 ($4.0) ($4.0)
Monetary authorities and depository credit intermediation $0.0 ($1.2) ($2.1) ($3.3)
Table 3, Top 10 Sectors Impacted in Terms of Value-Added
15
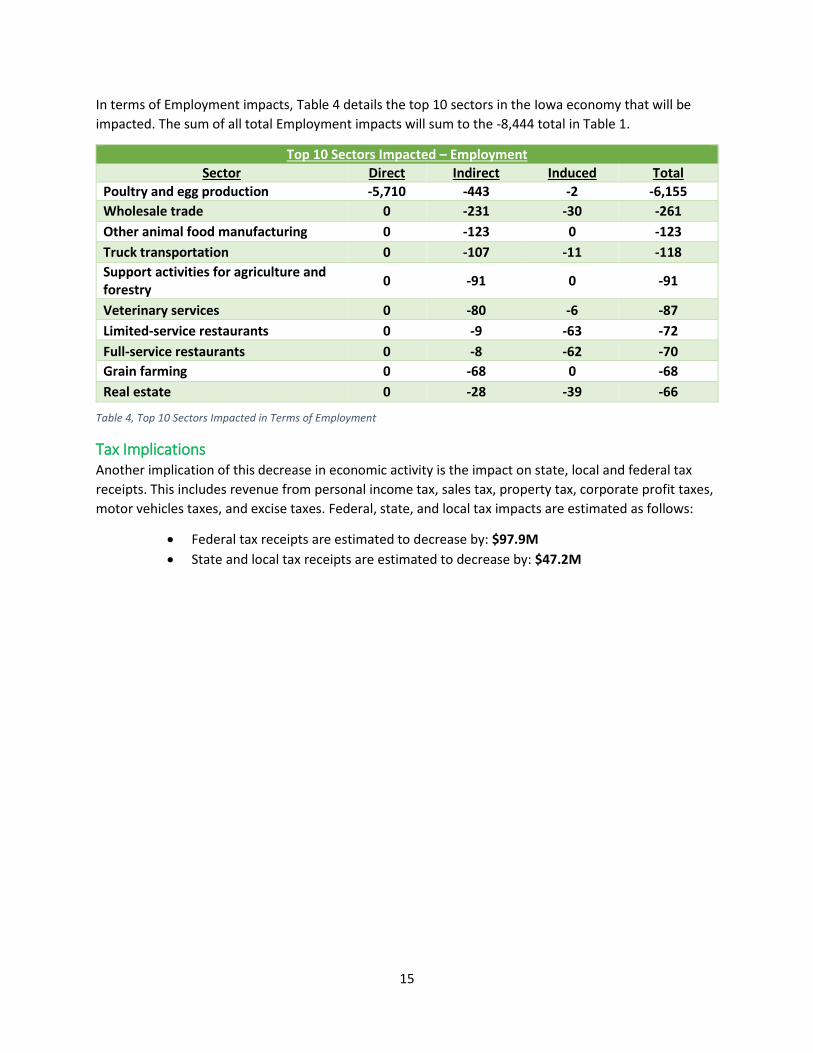
In terms of Employment impacts, Table 4 details the top 10 sectors in the Iowa economy that will be
impacted. The sum of all total Employment impacts will sum to the -8,444 total in Table 1.
Top 10 Sectors Impacted – Employment
Sector Direct Indirect Induced Total
Poultry and egg production -5,710 -443 -2 -6,155
Wholesale trade 0 -231 -30 -261
Other animal food manufacturing 0 -123 0 -123
Truck transportation 0 -107 -11 -118
Support activities for agriculture and forestry
0 -91 0 -91
Veterinary services 0 -80 -6 -87
Limited-service restaurants 0 -9 -63 -72
Full-service restaurants 0 -8 -62 -70
Grain farming 0 -68 0 -68
Real estate 0 -28 -39 -66
Table 4, Top 10 Sectors Impacted in Terms of Employment
Tax Implications Another implication of this decrease in economic activity is the impact on state, local and federal tax
receipts. This includes revenue from personal income tax, sales tax, property tax, corporate profit taxes,
motor vehicles taxes, and excise taxes. Federal, state, and local tax impacts are estimated as follows:
Federal tax receipts are estimated to decrease by: $97.9M
State and local tax receipts are estimated to decrease by: $47.2M
16
Conclusion The results of this economic impact study show that the effects of the HPAI outbreak on layers (egg) and
turkey production are significant in terms of output, value-added and employment. The total economic
impact to the Iowa economy results in an estimated:
8,444 fewer jobs
$1.2B in lower Output
$426.9M in lower Value-Added
Not only does HPAI leave many producers currently struggling to cover fixed costs, but it will also have
lasting effects as it will take significant time to repopulate the barns and get them back into full
production. In addition to the lost revenue to producers, HPAI also has many other adverse
consequences on economic activity up and downstream such as lost business for feed suppliers,
veterinarians, truck transportation, financial institutions, and decreases in government tax revenues.
Since the HPAI outbreak first began to rapidly spread, many layoffs have taken place in and around the
industry. While these initial layoffs are certainly unfortunate and are bound to continue, additional
challenges related to rehiring once producers are able to repopulate will surface in the short term. This
is due to many producers being in areas with low unemployment rates. Once employees are laid off
from working in the egg or turkey industries, they may choose to move to other employment, which in
many cases may be outside of the immediate area, effectively removing them and their skillsets from
the local labor pool. Significant effort will need to be expended to find, train, and retain suitable
replacements for those laid as a result of the outbreak.