economic impact of the florida apiculture industry · · 2010-10-21economic impact of the florida...
TRANSCRIPT

1
Economic Impact of the
Florida Apiculture Industry Economics Report 01-1
By Alan Hodges, David Mulkey, Effie Philippakos,
Malcolm Sanford and Gary Fairchild
University of Florida
Institute of Food and Agricultural Sciences
Department of Food & Resource Economics
Department of Entomology/ Nematology
Gainesville, Florida
Revised January 29, 2001
UNIVERSITY OF
FLORIDA

2
Acknowledgments
This project was sponsored by the Florida Department of Agriculture
and Consumer Services (FDACS), Gainesville, FL , under Sponsored
Program Agreement 5417 (September, 1999). Valuable assistance was
provided by Mr. Laurence Cutts, of the FDACS Bureau of Plant and
Apiary Inspection. Rich Beilock provided a peer review of the report.
3
Table of Contents
page
Acknowledgments .....................................................................................................................................2
List of Tables.............................................................................................................................................4
List of Figures............................................................................................................................................4
Executive Summary..................................................................................................................................5
Introduction ...............................................................................................................................................6
Methodology............................................................................................................................................12
Surveys .......................................................................................................................................12
Economic Impact Analysis ..........................................................................................................13
Beekeeper Survey Results .....................................................................................................................16 Response Rates..........................................................................................................................16
Honey Bee Colonies ...................................................................................................................16
Migratory Beekeeping Operations ..............................................................................................17
Honey Bee Products ...................................................................................................................17
Pollination Services Provided .....................................................................................................19
Market Channels.........................................................................................................................20
Beekeeper Revenues .................................................................................................................20
Operating Expenses ...................................................................................................................21
Assets .........................................................................................................................................22
Profitability ..................................................................................................................................23 Employment ................................................................................................................................23
Honey Bee Colony Losses .........................................................................................................24
Threats to the Florida Beekeeping Industry ...............................................................................25 Beekeeper Experience................................................................................................................26
Florida Grower Survey Results...............................................................................................................28
Response Rates .........................................................................................................................28
Fruit and Vegetable Crop Pollination..........................................................................................28
Expenses for Pollination Services ..............................................................................................29
Value of Honey Bee Pollination for Fruit and Vegetable Production .........................................30
Issues for Honey Bee Pollination Service Contracts..................................................................31
Regional Economic Impacts of the Florida Apicultural Industry.............................................................32
Discussion...............................................................................................................................................35
Literature Cited........................................................................................................................................37
Appendix A. Questionnaire for Survey of Florida Beekeepers ...........................................................39
Appendix B. Questionnaire for Survey of Florida Growers Using Pollination Services .....................42
4
List of Tables
Table page
1. Multipliers associated with the output, value-added and employment impacts of honey bee products and Florida fruit and vegetable growers....................................................15
2. Survey respondents and estimated honey bee colonies in Florida, 1999 ..............................................................................................................................16 3. Other states in which Florida honey bees are managed, 1999 .......................................................17
4. Quantity, price and value of Florida honey bee products, 1999 ......................................................18
5. Pollination services to fruit and vegetable crops by Florida beekeepers, 1999 ..............................19
6. Florida honey bee product sales by market outlet, 1999.................................................................20
7. Revenues received by Florida beekeepers for honey bee products and pollination services, 1999.............................................................................................................................21
8. Cash operating expenses for Florida beekeepers, 1999 .................................................................22
9. Value of non-current assets for Florida beekeepers, 1999..............................................................22
10. Income and expenses for Florida beekeepers by size class ($1000), 1999 ..................................23
11. Employment and number of days worked in the Florida beekeeping industry, 1999..............................................................................................................................24
12. Listed causes of Florida honey bee die offs, 1999..........................................................................25
13. Ratings of threats to the Florida beekeeping industry, 1999 ..........................................................26
14. Acres pollinated, number of honey bee colonies and cost of pollination services for Florida fruit and vegetable growers, 1999 ..............................................................29
15. Expenditures on pollination services by Florida fruit and vegetable growers, 1999 ......................30
16. Marginal value benefit of honey bee pollination services, 1999 .....................................................31
17. Importance of issues surrounding pollination contracts for Florida fruit and vegetable growers, 1999..................................................................................31
18. Sales and export value of Florida honey bee products and marginal value of pollination services to growers, 1999 .........................................................................................32
19. Total economic impacts of the Florida apicultural industry and marginal benefits to Florida fruit and vegetable growers by pollination services, 1999.............................................34
List of Figures
Figure page
1. Florida honey production, 1987-99......................................................................................................9
2. Value of Florida honey produced, 1987-99 .........................................................................................9
3. Years experience of Florida beekeepers, 1999 ................................................................................27

5
Executive Summary
This study attempted to assess the broad economic impacts of the Florida beekeeping industry
in order to support discussion of policy issues currently being considered. Results are reported
for mail surveys of Florida beekeepers and Florida growers of selected fruit and vegetable
crops, and an economic impact analysis using the IMPLAN input-output model.
Florida beekeepers managed over 258,000 honey bee colonies in 1999, nearly 150,000 of
which represented migratory beekeeping operations. Revenues from apicultural operations,
including sales of honey, beeswax, and live honey bees, totaled $17.6 million and income
received for pollination services was estimated at $1.9 million. Cash operating expenses associated with honey bee operations totaled $12.9 million. Net income (pre-tax) for all
beekeepers amounted to $1.5 million, average net income per beekeeper was $1,280, and pre-
tax net income per colony averaged $5.88. The profit margin was 7.8 percent, and return on
non-current assets was 3.03 percent. Total non-current assets amounted to $50 million and
total employment was 1,632 persons. The broad economic impacts associated with
beekeeping were $30.5 million in output, $15.2 million in value-added and 806 jobs.
Multiple threats are challenging the survival of the apicultural industry of Florida. Over 75,000
honey bee colonies have been lost during the past 5 years. The majority of beekeepers
identified natural pests including mites, beetles and the wax moth as a cause of honey bee die-
offs. Additionally, Florida beekeepers identified foreign imports of honey, low honey prices,
pests, resistance to pesticides for control of mites and the high costs of beekeeping as the most
important threats confronting the industry.
More than 31 percent of Florida fruit and vegetable growers reported contracting for pollination
services within the past 5 years and 16 percent of respondents reported that they used
pollination services but also grow some of the same crops without pollinating honey bees. In
total 34,845 acres of fruit and vegetable crops were pollinated by contracted honey bees at a
cost of $372,698. Honey bee pollination reportedly increased yields of certain crops by 20 to 62
percent. The marginal benefit of higher yields from pollination services to Florida fruit and
vegetable growers was estimated at $26.4 million. The broad economic impacts associated
with pollination services were $38.2 million in output, $20.9 million in value-added and 490 jobs.
Keywords: beekeeping, honey, pollination services, economic impact, Florida, IMPLAN.

6
Introduction
Florida has a large apiculture industry, with an estimated 240,000 honey bee colonies operated
by 700 full-time or sideline commercial beekeepers, and an additional 500 hobbyist beekeepers
(Florida Department of Agriculture and Consumer Services, 1999). All apiculture operations in
Florida are required by law to be registered with the Florida Department of Agriculture for
purposes of inspection for pests and diseases once or twice annually. Beekeeping operations are located throughout Florida, but are concentrated in the counties of Brevard, Dade, DeSoto,
Hendry, Lake, Polk, and Wakulla, where there are large areas of commercial fruit and vegetable
crops or preferred natural vegetation types (National Agricultural Statistics Service, 1999).
Because of its mild climate, Florida is the winter home to many migratory beekeeping
operations. Beekeepers bring their colonies to Florida during the September to March period to
over-winter and work the citrus and winter vegetable crops. Colonies are then moved
northward to work other crops and natural plants throughout the spring and summer months.
Florida is a top honey producer with production of 23.26 million pounds valued at $12.3 million
in 1999. Florida is ranked fourth in the United States behind California, North Dakota and
South Dakota, and represented nearly 10 percent of total U.S. value for honey in 1999 (Florida
Agricultural Statistics Service). Ninety percent of the honey produced in Florida is marketed
through several packing houses in the state, or through two large cooperatives located outside the state. A small share of honey production is packaged on-farm and sold at local
supermarkets, farmers markets or roadside stands. Other minor honey bee products that are
marketed by some producers include beeswax, propolis, royal jelly, pollen, and packaged bees
and queens which are usually shipped to beekeepers in other states. Costs for maintaining a
honey bee colony average about $100 annually, including purchased inputs of corn syrup feed,
drugs/pesticides, replacement queen bees, and equipment (Sanford, 1992a).
In addition to honey production, the beekeeping industry in Florida also provides a critical
service by pollinating many important fruit and vegetable crops, including specialty citrus,
blueberries, strawberries, cucumbers, squash, watermelons, and avocados. Beekeepers may
rent their honey bee colonies to growers of these crops for a period of several weeks or months
for $20 to $40 per colony, depending upon the time of year, the number of honey bee colonies
required to pollinate the crop, and the amount of honey production expected from the crop and other nearby nectar sources. Honey bees are generalist pollinators, able to adapt to a wide
variety of plant species. Honey bee pollination is responsible for increased yields of a variety of
fruit and vegetable crops, and the regeneration of forage crops that feed livestock (Ingram et
al., 1996). In total, the honey bee can pollinate more than 90 North American crop varieties
and over 300 worldwide (Sanford, 1998). Honey bees can reproduce quickly (Sanford, 1998).

7
They are available throughout the entire duration of the growing season and can be
concentrated on intensively managed agricultural plots (Sanford, 2000). Lastly, beekeeping
enterprises can exist across diverse geographical regions due to the ease and cost-
effectiveness involved in transporting honey bee colonies (Sanford, 1992a).
Currently, several existing and potential threats are confronting the Florida apicultural industry,
including foreign competition, product adulteration, urbanization, the Varroa mite, and Africanized honey bees. World honey prices grew dramatically during the 1970s, which
fostered increased foreign competition (Sanford, 1992a). The labor-intensive nature of honey
production gives developing nations a comparative advantage in the production of honey,
ultimately translating to lower prices for imported honey (Sanford, 1992a). Substitute
sweeteners such as high fructose corn syrup have gained strong public recognition, in part due
to aggressive marketing efforts as well as their significantly lower costs (Sanford, 1992a).
Honey adulteration by these products is also eroding markets for Florida honey products
(Sanford, 1992a; 1995). The temptation to adulterate honey leaves “pure” honey producers at
an economic disadvantage as their products compete with cheaper adulterated products,
resulting in depressed market prices for “pure” honey. The continued adulteration of honey
may also damage public perceptions of honey as a pure, natural and healthful sweetener
(Sanford, 1995).
Agricultural land scarcity in Florida has pushed agricultural operators to step up pesticide
applications in order to maintain or increase agricultural productivity. Between 1992 and 1998,
pesticide applications on honey bee-pollinated crops1 increased by 15% from 818.8 million
pounds to 968.2 million pounds2 (Florida Agricultural Statistics Service). Pesticide exposure is
detrimental to honey bee survival as it impairs the reproductive success of honey bee colonies
(Ingram et al., 1996). Additionally, urbanization has decreased the viability of locating bee
colonies to Florida during the winter season as available sources of nectar are being lost
(Ingram et al., 1996; Sanford, 1992b).
The Florida beekeeping industry has also been adversely impacted by the Varroa mite (Varroa
jacobsoni), a honey bee parasite that leads to the eventual decline and death of infested
colonies. The Varroa mite remains a potent threat to the beekeeping industry, responsible for
the destruction of many feral and managed honey bee colonies, and possibly leading to a
shortage of pollinators for crops (Sanford, 1998). It is standard practice to treat infested colonies with pesticides (Fluvalinate or Coumaphos) to control Varroa mites, which significantly
1 These crops include tomatoes, watermelons, snap beans, bell peppers, cucumbers, carrots, strawberries, eggplant, oranges, grapefruit, tangelos, tangerines and temples. 2 In order to ensure fair comparisons between 1992 and 1998, pesticide applications that were reported in one year but not the other for specific chemicals were omitted altogether for both annual periods.

8
increases management costs. Use of pesticides in honey bee colonies has also raised
concerns about possible contamination of honey and other honey bee products. Recently the
Environmental Protection Agency approved the use of CheckMite+ Bee Hive Pest Control
Strips following considerable deliberation over possible immunotoxicity and neurotoxicity to
beekeepers resulting from Coumaphos absorption, an active ingredient in the pest control
strips. Pending any reports suggesting improper pesticide application, the EPA is prepared to
revoke the pesticide’s approval, potentially leaving Florida beekeepers without control against
colony outbreaks of Varroa mites (Sanford, 2000).
The northern migration and spread of Africanized bees through the United States also poses
a threat to the apicultural industry of Florida. Honey bees (Apis mellifera) are not native to
North and South America, but rather, were introduced to the New World by European
colonists. These European honey bees thrived in the temperate regions of North America but struggled in the tropical climates of South America. The more aggressive African honey bee
was imported to Brazil from Tanzania in the belief that interbreeding African and European
honey bees would yield a docile bee that adapts well to warmer climates, and indeed they did
but inherited the aggressive nature of the African honey bees. Africanized bees escaped
from a Brazilian apiary in 1957 and since then have migrated northward, recently reaching
Arizona and Texas (Los Angeles County West Vector Control District). Florida beekeepers
fear that they will eventually reach Florida. Africanized bees deplete nectar resources
reserved for honey production by managed honey bees, however some beekeeping
authorities believe that interbreeding of Africanized bees with native honey bees may result in
genetic re-invigoration, improved resistance to pests and diseases, and increased honey
yields. The aggressive nature of Africanized honey bees is life-threatening to neighboring
workers and inhabitants, having forced the temporary abandonment of apiary establishments
in Latin America (Sanford, 1992b). It is not known if or when Africanized bees will become established in Florida.
The beekeeping industry of Florida has suffered a very high number of business shutdowns and
beekeeper retirements over the years. In the past, beekeeping attracted entrepreneurial activity
because of its low entry costs relative to other agricultural operations (Sanford, 1987). The low
returns associated with beekeeping coupled with natural threats such as mites have severely
limited the state’s ability to recruit new beekeepers. Further compounding this problem, the
United States government eliminated honey loan programs beginning fiscal year 1994. These
loan programs had been in existence since 1950 (Johnson and Ortego, 1996).
Unstable levels of honey production and honey prices are evident in Florida. Honey production
within the past ten years varied dramatically, ranging from 15 million pounds in 1989 to the
9
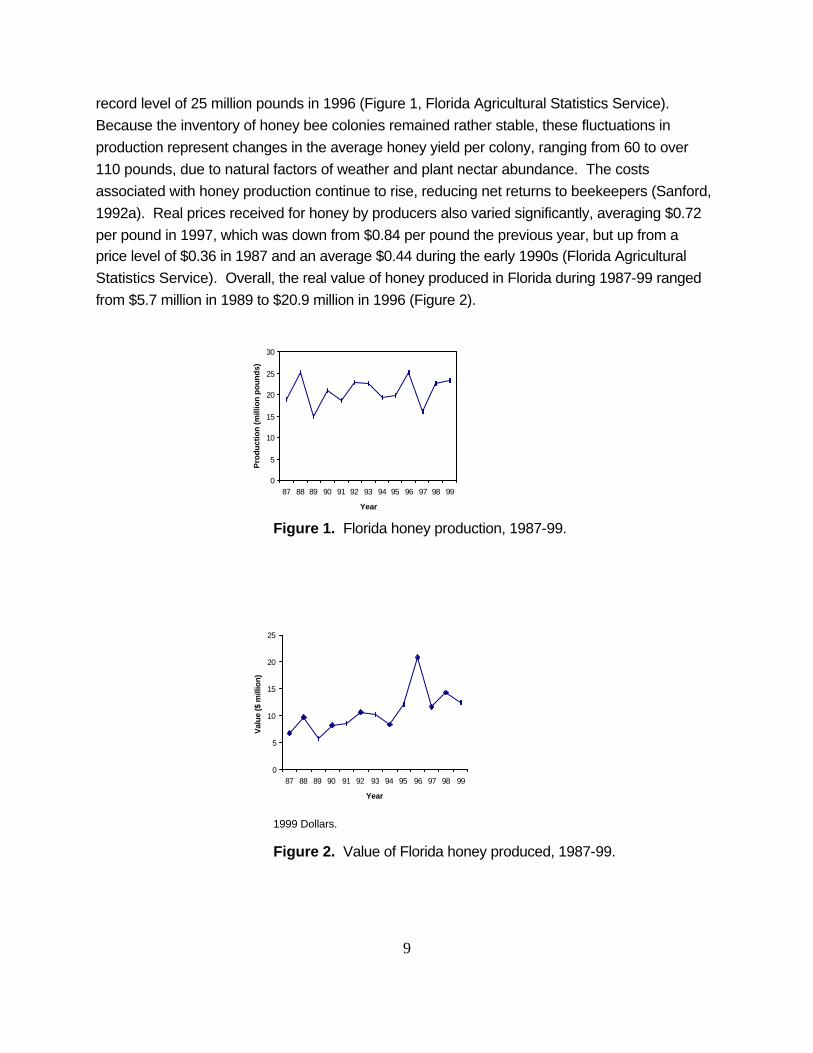
record level of 25 million pounds in 1996 (Figure 1, Florida Agricultural Statistics Service).
Because the inventory of honey bee colonies remained rather stable, these fluctuations in
production represent changes in the average honey yield per colony, ranging from 60 to over
110 pounds, due to natural factors of weather and plant nectar abundance. The costs
associated with honey production continue to rise, reducing net returns to beekeepers (Sanford,
1992a). Real prices received for honey by producers also varied significantly, averaging $0.72
per pound in 1997, which was down from $0.84 per pound the previous year, but up from a price level of $0.36 in 1987 and an average $0.44 during the early 1990s (Florida Agricultural
Statistics Service). Overall, the real value of honey produced in Florida during 1987-99 ranged
from $5.7 million in 1989 to $20.9 million in 1996 (Figure 2).
0
5
10
15
20
25
30
87 88 89 90 91 92 93 94 95 96 97 98 99
Year
Pro
du
ctio
n (m
illio
n p
ou
nd
s)
0
5
10
15
20
25
87 88 89 90 91 92 93 94 95 96 97 98 99
Year
Val
ue ($
mill
ion)
Figure 1. Florida honey production, 1987-99.
1999 Dollars.
Figure 2. Value of Florida honey produced, 1987-99.

10
Beekeeping has now become a marginal economic enterprise and a decline of the beekeeping
industry could have widespread repercussions for the agricultural sector and consumers.
Human population pressures are increasing the demand for crops and the need for honey bee
pollination services. An estimated 15.1 million individuals resided in the state of Florida in
1999. Between 1992 and 1997, Florida’s population grew by 9 percent, from 13.5 million to
14.7 million individuals (U.S. Census Bureau). Over this same period, the volume of Florida
crops dependent on insect pollination3 grew by an average 65 percent4 per crop (Florida Agricultural Statistics Service). Cash receipts for crops dependent on insect pollination 5
approximated $3.1 million in 1998 (Florida Agricultural Statistics Service). If the increasing crop
volume trends persist, the need for insect pollination services on pollination-dependent crops
will grow. There is a concern that there may be a shortage of honey bee colonies necessary to
sustain Florida crops through pollination services (Sanford, 1992b).
Preliminary attempts have been made to estimate economic values for honey bee pollination
services, although these studies were restricted to national value estimations using secondary
data sources (Morse and Calderone, 2000; Southwick and Southwick, 1992; Levin, 1983).
According to Morse and Calderone (2000), the marginal value of honey bee pollination services
in the United States was estimated at $14.6 billion, a sharply higher value than the $1.6-$8.3
billion estimate range of Southwick and Southwick (1992). Levin (1983) estimated the national
value of pollination services at $18 billion. The wide range of values estimated reflects uncertainties about yield reductions for different crops under incomplete pollination, the degree
of dependence on honey bee pollination, the magnitude of decline in honey bee populations
and the degree to which other natural pollinators, such as wild bees, wasps, and bats, may act
as alternative pollinators in the absence of honey bees. There is a need for better information
about the broad economic impacts of the beekeeping industry to better inform the policy issues
currently being considered.
3 Florida crops dependent on insect pollination include carrots, citrus, cotton, cucumbers, eggplant, green peppers, hay, peanuts, radishes, snap beans, soybeans, squash, strawberries, tomatoes and watermelons. 4 An overall volume change of honey bee pollinated crops was not estimable because volume units among differing crops were not uniformly reported. Nine of these crops (60% of total) experienced average volume declines of 22% per crop. The remaining six crops experienced average volume gains of 196%. This value is large, in part, because green peppers realized a 1011% increase in volume between 1992 and 1997. When green peppers are omitted, the percentage rate of increase becomes 33% for the remaining crops. 5 Also includes cash receipts for avocados, blueberries and lettuce that were missing in the original volume statistic due to lack of information.

11
This project sought to provide an initial assessment of the economic value of the beekeeping
industry to the economy of Florida. Specifically, this project addresses the following objectives:
1. To measure the costs and returns for apiculture operations in Florida, at different scales
of production, including income from honey and pollination services, and expenses for
employee labor and pest control.
2. To describe the market channels for honey produced by Florida beekeepers to final
consumers and other business sectors which use honey as an ingredient, to determine the share of product that is marketed locally vs. exported from the Florida state region,
and to describe the linkages to other business sectors providing inputs for beekeeping.
3. To determine the value of honey bee pollination for selected major fruit and vegetable
crops in Florida, including citrus, blueberries, strawberries, cucumbers, squash,
watermelons, and avocados.
4. To compile overall statewide economic values for honey bee products and pollination
services, including sales, value added and employment.
12
Methodology
Surveys
Primary data collection for this project consisted of two separate questionnaires mailed to
Florida beekeepers and to Florida farmers of selected fruit and vegetable crops, in order to
assess the nature of beekeeping operations and honey bee pollination services, respectively.
Both questionnaires were developed in consultation with industry experts. The beekeeper survey questionnaire elicited the following information:
• Beekeeper Experience
• Number of Honey Bee Colonies Managed
• Employment
• Other States Operated In and Months in Florida
• Honey Bee Products Produced and Prices Received
• Market Channels for Products
• Honey Bee Pollination Services Provided for 8 Specific Crops, Including Number Colonies and Prices Received
• Operating Revenues and Expenses during the 1999 Fiscal Year
• Value of Beekeeping Assets
• Honey Bee Colony Losses in the Past 5 Years
• Ranking of Threats to the Beekeeping Industry.
The questionnaire was mailed to 1,188 beekeepers in Florida, using the list of certified
beekeepers from the Florida Department of Agricultural and Consumer Services-Division of
Plant Industry. The mailing included a return-addressed, postage-paid envelope and cover
letter. In order to capture responses from non-resident beekeepers over-wintering in Florida,
three separate mailings were done during February, March, and April, 2000. In order to
maximize response rates, the beekeeper questionnaire was printed in a convenient and
attractive booklet. The cover letter, addressed by the Chief of Apiary Inspection, Florida
Department of Agriculture and Consumer Services, emphasized the importance of respondent
compliance to the apicultural industry of Florida.
The second questionnaire, administered to Florida fruit and vegetable growers, gathered
information related to:
• The Nature of Pollination Service Contracts
• Number of Honey Bee Colonies Contracted
• Prices Paid for Pollination Services
• Acres of Pollinated Crops by Honey Bees
13
• Benefits Associated with the Use of Pollination Services
• Issues for Contracting Honey Bee Pollination Services.
This questionnaire was mailed to Florida growers of cantaloupes, cucumbers, watermelons,
blueberries, strawberries, avocados, and specialty citrus. These crops were specifically
targeted because they were determined to benefit substantially from honey bee pollination
activities, on the basis of discussions with apiary experts. Addresses for approximately 2,300 growers of these crops were obtained from the Florida Agricultural Statistics Service (Orlando,
Florida). This questionnaire was mailed during May, 2000 and included a return-addressed,
postage paid envelope and cover letter.
Both questionnaires were approved by the University of Florida Institutional Review Board to
assure protection of the rights of human subjects. Although respondents to both questionnaires
were not offered cash compensation in exchange for their participation in this study, they were
given the option to receive a copy of the final report. The identity of respondent beekeeper
firms was tracked from a code number on each questionnaire. Copies of the questionnaires are
provided in the appendix of this report.
The information gathered from completed surveys was entered into spreadsheets for analysis.
In order to provide estimates for all beekeepers in the state of Florida based on results generated by the beekeeper survey, an expansion factor of 2.179 was utilized to extrapolate
population estimates from sample data based on observed survey response rates. For
respondents who indicated the number of honey bee colonies owned but failed to report an
average price for honey bee products, an industry average price-per-unit was imputed in order
to derive estimates of the total value of honey. Likewise, an industry average honey yield per
honey bee colony was imputed for commercial and sideline beekeeper respondents who did not
report the level of production of honey bee products. When allocating the proportion of sales
within and outside the state of Florida for minor honey bee products classified in the category
‘other,’ the same proportion that existed for honey products was assumed to exist for “other”
honey bee products. The value of honey bee pollination services was estimated based on
average prices per honey bee colony multiplied by the number of colonies provided for each
crop, and the value of services within Florida was estimated for migratory beekeepers based on
the share of time the colonies spent in the state.
Economic Impact Analysis
An input-output (I-O) framework was utilized to estimate the direct, indirect and induced
economic impacts of the apicultural industry in Florida. Input-output analysis is a technique that
captures the regional economic interdependence between different industries, households and

14
government institutions (Miller and Blair, 1985; Mulkey and Hodges). The premise of input-
output analysis is that the structure of the economy is technologically fixed, such that for a given
change in the final demand, output or employment for a particular industry or region there will
be predictable changes in other linked sectors of the economy. These changes are measured
by estimating the regional economic multipliers associated with the particular industry using a
matrix inversion procedure applied to the matrix of inter-industry transactions.
The input-output analysis was conducted with the IMPLAN PRO™ software package8. IMPLAN
was originally developed by the USDA Forest Service in 1979 and was subsequently privatized
in 1993 by the Minnesota IMPLAN Group (MIG, Inc., Stillwater, MN). The IMPLAN system
consists of database and software components. The database portion offers economic and
sociodemographic descriptions for all United States counties across 528 economic sectors.
The categorization of sectors relies on the US Department of Commerce's four digit Standard
Industrial Classification (SIC) system. The software component of the IMPLAN modeling
system performs calculations for a pre-defined study area to assess economic impacts to the
region. Multipliers are available from IMPLAN for economic output, total value added,
employment, employee compensation, personal income, other proprietary income, and indirect
business taxes, and are provided for direct, indirect and induced impact effects. U.S. national
data for 1997 was used to develop the complete inter-industry structural tables and coefficients.
The IMPLAN database system does not offer information specific to the apicultural industry,
which is classified under the ‘miscellaneous livestock’ category, and also includes the general
crop farms, non-dairy and non-poultry livestock, poultry and eggs not elsewhere classified,
aquaculture, and animal specialties sectors. The IMPLAN model of the Florida economy was
customized to specifically reflect characteristics of the Florida apicultural industry utilizing
operating expenditure information obtained from the beekeeper survey. The economic impacts
of the apicultural industry sector were derived by multiplying the value of domestic sales within
Florida against the direct effects multiplier and multiplying out-of-state export values against the
direct, indirect and induced effects multipliers, and subsequently summing as follows:
T = D * Md + E * Mt
where T is total impact, D is domestic sales, E is export sales, Md is the
direct effects multiplier and Mt is the total effects multiplier.
The multipliers associated with beekeeping operations, and fruit and vegetable production are
listed in Table 1. The total effects multiplier is the sum of the direct effects, indirect effects and
8 IMPLAN Professional, Version 2.0, Social Accounting and Impact Analysis Software, User’s Guide, Analysis Guide and Data Guide, 1999, MIG, Inc., Stillwater, MN.

15
induced effects multipliers. For beekeeping, the total output multiplier was $2.292 per dollar
output, the total value-added multiplier was $1.227 per dollar output, and the total employment
multiplier was $51.6 per million dollars output. The multipliers for output and value added are
stated in terms of dollars per dollar of sales to final demand, while the employment multiplier
represents jobs per million dollars of sales to final demand. The direct effects multiplier
accounted for 44 percent of the total output multiplier while the indirect and induced effects
multipliers captured 19 percent and 37 percent of the total output multiplier effects, respectively.
The relatively large induced multiplier for output, value-added and employment impacts reflects
the high labor intensity of beekeeping.
Since pollination impacts in this study were examined for eight major fruit and vegetable crops
in the state of Florida, the multipliers specific to fruit and vegetable growers ( which represent
multipliers assigned to the IMPLAN sectors ‘fruits’ and ‘vegetables and melons’) were weighted
by the proportion of pollinated crops classified as fruits or vegetables in the IMPLAN database
(Table 1). The total output multiplier for fruits and vegetables was 1.70, the total value-added
multiplier was 0.94 and the total employment multiplier was 22.90. The direct effects captured
59 percent of the total output multiplier, 55 percent of the value-added multiplier and 47 percent
of the employment multiplier. The indirect effects accounted for 23 percent of the total output
multiplier, 23 percent of the value-added multiplier and 34 percent of the employment multiplier.
The induced effects represented 18 percent of the total output multiplier, 21 percent of the
value-added multiplier and 19 percent of the employment multiplier.
Table 1. Multipliers associated with the output, value-added and employment impacts of honey bee products and Florida fruit and vegetable growers.
Multipliers Output
($/$ Output) Value-Added ($/$
Output) Employment
($/$Million Output)
Florida Beekeepers
Total Effects 2.292 1.227 51.6 Direct Effects 1.000 0.428 33.6
Indirect Effects 0.424 0.244 5.8
Induced Effects 0.855 0.555 12.2
Florida Fruit and Vegetable Growers
Total Effects 1.70 0.94 22.9
Direct Effects 1.00 0.52 10.78
Indirect Effects 0.39 0.22 7.73
Induced Effects 0.31 0.2 4.4 Source: IMPLAN, 1997.

16
Beekeeper Survey Results
Response Rates
A total of 649 beekeepers responded to the survey, yielding an overall response rate of 55
percent of all Florida beekeepers (Table 2). Responses were classified by size of beekeeper
operation. Commercial beekeepers were defined as managing 200 or more colonies during
1999, sideline beekeepers managed between 20 to 199 colonies and hobbyist beekeepers
managed 1 to 19 honey bee colonies during 1999. Seventeen percent of respondents
represented commercial beekeepers, 23 percent represented hobbyist beekeepers and 12
percent of respondents in the ‘unknown’ category did not report the number of honey bee
colonies managed. Responses observed in each class size category are roughly proportional
to the share of the Florida beekeeper population and are assumed to be representative of all
beekeepers, including non-respondents.
Honey Bee Colonies
A total of 110,737 managed honey bee colonies were reported by beekeeper respondents. In
order to estimate the total population of Florida honey bee colonies, an expansion factor was
multiplied by the number of colonies reported in the survey (Table 2). The expansion factor
was estimated by dividing the population of firms in Florida by the number of survey
respondents for each firm size class. A total of 258,696 honey bee colonies were estimated in
Florida (using the expansion factor) with 231,861 colonies (90%) managed by commercial
beekeepers, 24,135 (9%) colonies managed by sideline beekeepers and 2,701 (1%) managed
by hobbyist beekeepers. These results are somewhat higher than the total number of honey
bee colonies reported by the Florida Agricultural Statistics Service (230,000 colonies in 1998).
Table 2. Survey respondents and estimated honey bee colonies in Florida, 1999.
Size Class (Number of Colonies)
Number Respondents
(percent)
Population Firms*
Expansion Factor
Survey Number Colonies
Expanded Number Colonies
Commercial (200+) 112 (17%) 262 2.339 99,116 231,861
Sideline (20-199) 152 (23%) 362 2.382 10,134 24,135
Hobbyist (1-19) 310 (48%) 563 1.816 1,487 2,701
Unknown 75 (12%) 1
Total 649 1,188 2.179 110,737 258,696 *Source: Florida Department of Agricultural and Consumer Services, Division of Plant Industry.

17
Migratory Beekeeping Operations
Florida is an ideal location for migratory honey bee operations due to its mild winters. Some
170 respondents (27%) reported managing their beekeeping operations in other states besides
Florida in 1999 (Table 3). Survey respondents reported a total of 68,653 migratory colonies or
62 percent of the surveyed colonies in Florida. The expanded number of colonies transported to
other states was estimated at 150,000. Migratory beekeeping operators are primarily large
commercial firms that maintain an average of 858 hives. Migratory honey bee colonies
remained in the state of Florida an average of 5.9 months. The top ten other states in which
Florida beekeepers operated in are ranked in Table 3. Michigan was ranked the number one
state with 21 beekeepers followed by Georgia (20), Maine and New York (15), Pennsylvania
(14), North Dakota (7), Massachusetts (6), Wisconsin (5), Ohio (4), Mississippi and New Jersey
(3), and Alabama, North Carolina and South Dakota (2).
Table 3. Other states in which Florida honey bees are managed, 1999.
RankState Number Respondents
1 Michigan 21 2 Georgia 20 3 Maine 15 3 New York 15 4 Pennsylvania 14 5 North Dakota 7 6 Massachusetts 6 7 Wisconsin 5 8 Ohio 4 9 Mississippi 3 9 New Jersey 3 10 Alabama 2 10 North Carolina 2 10 South Dakota 2
Honey Bee Products
Florida honey bees produce products including honey, beeswax, pollen, packaged bees,
queens, queen cells, nucs (small hives), and complete hives (Table 4). Nearly 50 percent of
respondents were involved in bulk honey production, 18 percent produced retail packaged
honey, 16 percent produced beeswax, 8 percent produced live bee products, and less than 7
percent of respondents reported producing either comb honey, packaged bees, queens or nucs.
Total production in 1999 was estimated at 21.0 million pounds of bulk honey, 524,750 pounds of

18
retail packaged honey, 120,901 pounds of comb honey, and 272,417 pounds of beeswax.
Production of live honey bee products included 64,700 queen bees, 10,300 nucs, and 123,100
queen cells. Also, there was incidental production of pollen and complete hives. Prices
received for honey bee products, as reported by survey respondents, are summarized in Table
4. The price per pound averaged $2.14 for comb honey, $1.80 for retail packaged honey, $1.41
for beeswax, and $0.67 for bulk honey. For live honey bees, prices averaged $13.63 per
pound for packaged bees, $13.82 for queen bees, $1.50 for queen cells, $35.06 for nucs, and
$65 for complete hives.
The value of each product was estimated by multiplying the quantity of production against the
average price received for each surveyed beekeeper. Again, note that industry average levels
of honey yields per colony and prices were imputed for beekeeper respondents who did not
report honey production (‘unspecified honey production’). An expansion factor of 2.179 was
multiplied against beekeeper survey respondent product values to estimate the total value of
Florida honey products. Based on these expanded values, the total value of Florida honey
products was estimated at $17.6 million in 1999. Bulk honey, retail packaged honey and comb
honey were collectively valued at $12.9 million, representing 73 percent of total value, with bulk
honey accounting for the majority of this value ($11.9 million). Beeswax was valued at
$401,000. The value of all live bees sold exceeded $1 million, including $834,700 for queen
bees, $76,000 for packaged bees, and $360,800 for nucs and complete hives.
Table 4. Quantity, price and value of Florida honey bee products, 1999.
Honey Bee Products Number
Respondents (percent)
Expanded Quantity**
Average Price ($)
Expanded Value
($1000)**
Bulk honey (lbs) 321 (50%) 21,010,769 0.67 11,853
Retail packaged honey (lbs) 117 (18%) 524,750 1.80 830 Comb honey (lbs) 36 (6%) 120,901 2.14 213
Unspecified Honey Production* 43 (7%) 3,924,804 0.67 2,800 Beeswax (lbs) 102 (16%) 272,417 1.41 401
Live Bee Products 52 (8%) 86,170 63.00 1,269 Other 7 (1%) 124,606 12.72 198
Total 17,564 *Estimated production for commercial and sideline respondents not reporting production, assuming average yield of 97.6 lbs/colony **Represents 2.18 times the values reported by survey respondents.
19
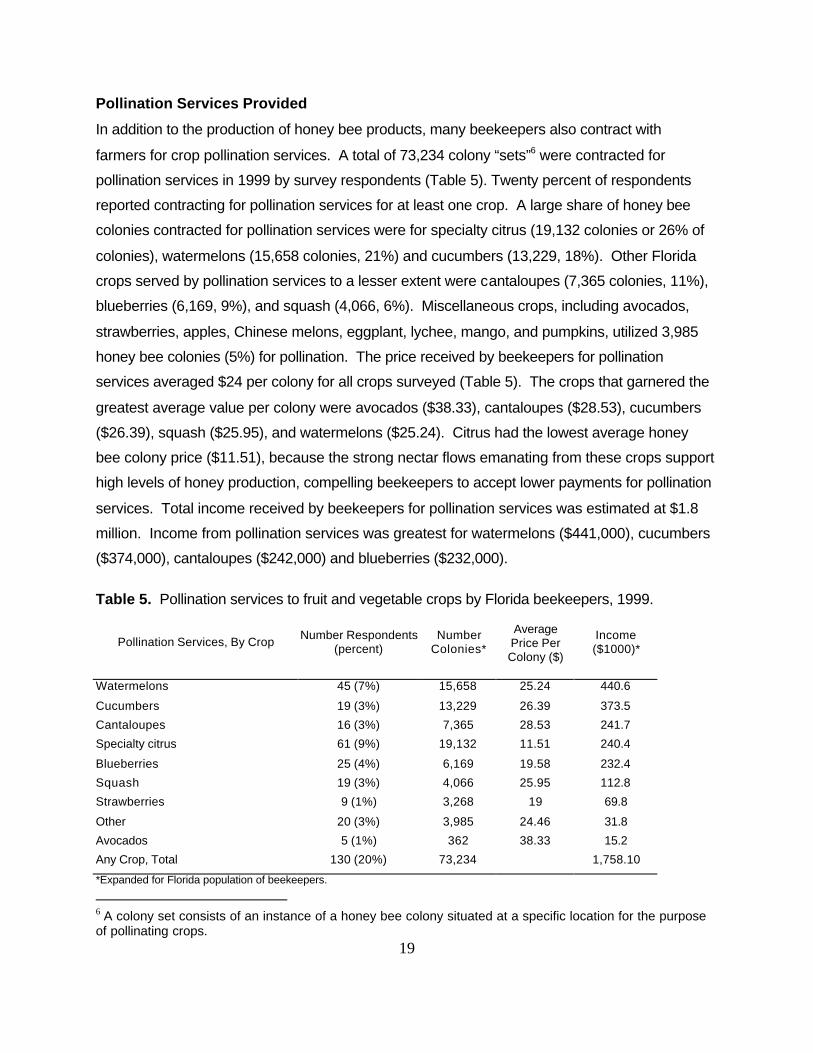
Pollination Services Provided
In addition to the production of honey bee products, many beekeepers also contract with
farmers for crop pollination services. A total of 73,234 colony “sets”6 were contracted for
pollination services in 1999 by survey respondents (Table 5). Twenty percent of respondents
reported contracting for pollination services for at least one crop. A large share of honey bee
colonies contracted for pollination services were for specialty citrus (19,132 colonies or 26% of
colonies), watermelons (15,658 colonies, 21%) and cucumbers (13,229, 18%). Other Florida
crops served by pollination services to a lesser extent were cantaloupes (7,365 colonies, 11%),
blueberries (6,169, 9%), and squash (4,066, 6%). Miscellaneous crops, including avocados,
strawberries, apples, Chinese melons, eggplant, lychee, mango, and pumpkins, utilized 3,985
honey bee colonies (5%) for pollination. The price received by beekeepers for pollination
services averaged $24 per colony for all crops surveyed (Table 5). The crops that garnered the
greatest average value per colony were avocados ($38.33), cantaloupes ($28.53), cucumbers
($26.39), squash ($25.95), and watermelons ($25.24). Citrus had the lowest average honey
bee colony price ($11.51), because the strong nectar flows emanating from these crops support
high levels of honey production, compelling beekeepers to accept lower payments for pollination
services. Total income received by beekeepers for pollination services was estimated at $1.8
million. Income from pollination services was greatest for watermelons ($441,000), cucumbers
($374,000), cantaloupes ($242,000) and blueberries ($232,000).
Table 5. Pollination services to fruit and vegetable crops by Florida beekeepers, 1999.
Pollination Services, By Crop Number Respondents
(percent) Number Colonies*
Average Price Per Colony ($)
Income ($1000)*
Watermelons 45 (7%) 15,658 25.24 440.6
Cucumbers 19 (3%) 13,229 26.39 373.5
Cantaloupes 16 (3%) 7,365 28.53 241.7
Specialty citrus 61 (9%) 19,132 11.51 240.4
Blueberries 25 (4%) 6,169 19.58 232.4
Squash 19 (3%) 4,066 25.95 112.8
Strawberries 9 (1%) 3,268 19 69.8
Other 20 (3%) 3,985 24.46 31.8
Avocados 5 (1%) 362 38.33 15.2
Any Crop, Total 130 (20%) 73,234 1,758.10
*Expanded for Florida population of beekeepers.
6 A colony set consists of an instance of a honey bee colony situated at a specific location for the purpose of pollinating crops.

20
Market Channels
Market channels for Florida honey include wholesale, commercial, cooperative and retail market
outlets. The total value of product sales in Table 6 was rationalized across market channels to
match the value estimated based on production quantities and prices in Table 4. The majority
of honey sales were transacted in wholesale markets, valued at $13.9 million or 79 percent of
total value. The non-wholesale market channels accounted for $3.7 million, or 21 percent of
total honey value, mainly concentrated in honey cooperatives and local retail stores. Honey bee
product sales within the state totaled $9.0 million, or 52 percent of total value, including all
Florida wholesale, local retail, roadside stand and friend, neighbor and associate sales.
Wholesale sales outside Florida and honey cooperative sales totaled $8.5 million (48%). For
the “other” market channel category, this sample proportion of in-state vs. export sales (52%-
48%) was assumed.
Table 6. Florida honey bee product sales by market outlet, 1999.
Market Channels for Products Number
Respondents (percent)
Value ($1000)* Percent Value
Wholesale, Florida 162 (25%) 7,463.80 42%
Wholesale, outside Florida 88 (10.5%) 6,397.90 36%
Honey cooperative 11 (1.7%) 2,068.30 12%
Local retail stores 38 (5.9%) 675.5 4%
Roadside stands/farmers markets 79 (12.2%) 471.3 3%
Friends, neighbors, and associates 213 (32.8%) 424.6 2%
Others 44 (6.8%) 62.4 <1%
Total 635 17,564.30 100% *Expanded for Florida population of beekeepers. Beekeeper Revenues
Respondents were asked to indicate the range of revenues that best characterized their income
from honey bee product sales and pollination services. The majority of responding firms had
honey bee product sales of less than $50,000 (Table 7). The revenue bracket of $10,000 to
$49,999 had the greatest total value of $2.2 million for products. Approximately 20 percent of
beekeeper respondents (130 firms) reported providing pollination services in Florida in 1999.
21
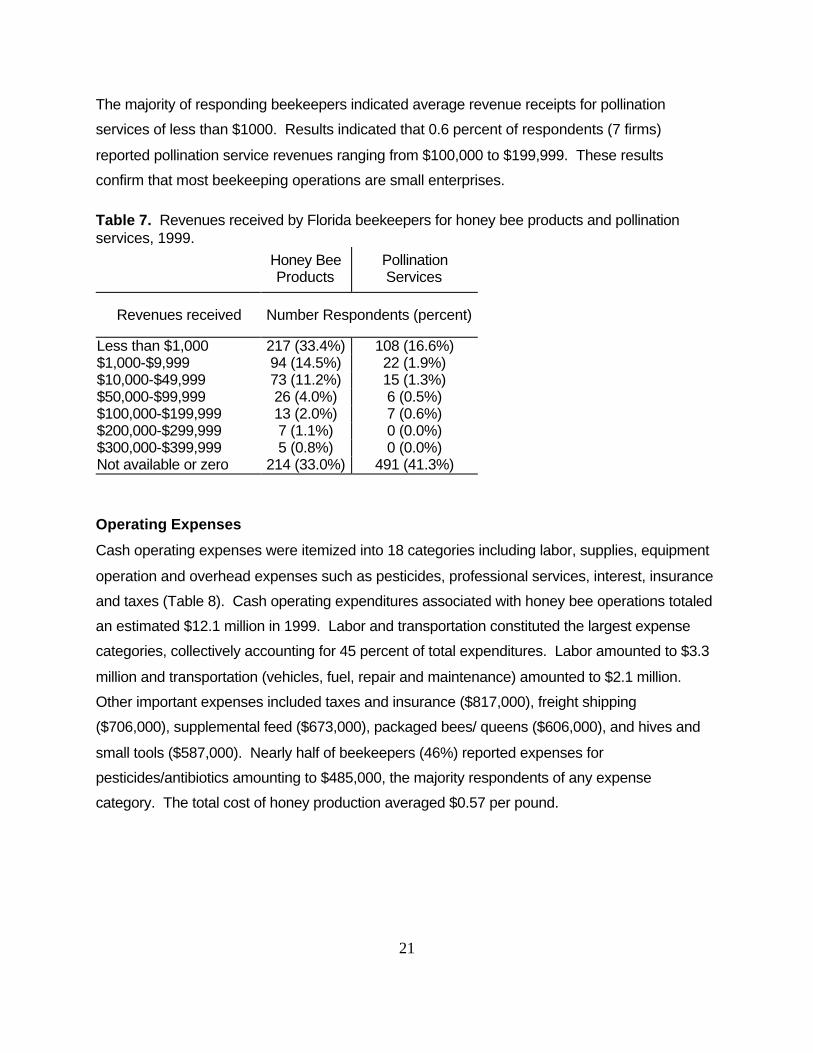
The majority of responding beekeepers indicated average revenue receipts for pollination
services of less than $1000. Results indicated that 0.6 percent of respondents (7 firms)
reported pollination service revenues ranging from $100,000 to $199,999. These results
confirm that most beekeeping operations are small enterprises.
Table 7. Revenues received by Florida beekeepers for honey bee products and pollination services, 1999.
Honey Bee Products
Pollination Services
Revenues received Number Respondents (percent)
Less than $1,000 217 (33.4%) 108 (16.6%) $1,000-$9,999 94 (14.5%) 22 (1.9%) $10,000-$49,999 73 (11.2%) 15 (1.3%) $50,000-$99,999 26 (4.0%) 6 (0.5%) $100,000-$199,999 13 (2.0%) 7 (0.6%) $200,000-$299,999 7 (1.1%) 0 (0.0%) $300,000-$399,999 5 (0.8%) 0 (0.0%) Not available or zero 214 (33.0%) 491 (41.3%) Operating Expenses
Cash operating expenses were itemized into 18 categories including labor, supplies, equipment
operation and overhead expenses such as pesticides, professional services, interest, insurance
and taxes (Table 8). Cash operating expenditures associated with honey bee operations totaled
an estimated $12.1 million in 1999. Labor and transportation constituted the largest expense
categories, collectively accounting for 45 percent of total expenditures. Labor amounted to $3.3
million and transportation (vehicles, fuel, repair and maintenance) amounted to $2.1 million.
Other important expenses included taxes and insurance ($817,000), freight shipping
($706,000), supplemental feed ($673,000), packaged bees/ queens ($606,000), and hives and
small tools ($587,000). Nearly half of beekeepers (46%) reported expenses for
pesticides/antibiotics amounting to $485,000, the majority respondents of any expense
category. The total cost of honey production averaged $0.57 per pound.

22
Table 8. Cash operating expenses for Florida beekeepers, 1999.
Operating Expenses
Number Respondents
(percent) Amount ($1000)*
Percent Amount
Labor 93 (14%) 3,313 27.4% Transportation (vehicles, fuel) 203 (31%) 2,095 17.3% Taxes, insurance 108 (17%) 817 6.8% Freight shipping 80 (12%) 706 5.8% Supplemental feed 186 (29%) 673 5.6% Packaged bees/queens 188 (29%) 606 5.0% Hives & small tools 237 (37%) 587 4.9% Building maintenance & repair 99 (15%) 495 4.1% Pesticides, antibiotics 300 (46%) 485 4.0% Honey extraction 102 (16%) 408 3.4% Office expense 105 (16%) 378 3.1% Interest 35 (5%) 349 2.9% Other 41 (6%) 321 2.7% Leasehold on land, buildings 58 (9%) 210 1.7% Product packaging an marketing 111 (17%) 205 1.7% Travel, entertainment, meetings, education 103 (16%) 201 1.7% Professional services 86 (13%) 131 1.1% Beeyard fencing 66 (10%) 111 0.9%
Total 12,090 100 *Expanded for Florida population of beekeepers.
Assets
The value of beekeeping assets in the state of Florida was estimated at $50.1 million (Table 9).
Hives accounted for the largest share of assets at $17.3 million (35%) followed by buildings at
$14.7 million (29%), trucks/trailers at $9.8 million (20%), and machinery/equipment at $8.3
million (17%). These values suggest that beekeeping enterprises require significant capital
investments. Total investment per colony averaged $183.
Table 9. Value of non-current assets for Florida beekeepers, 1999.
Assets Number
Respondents (percent)
Value ($millions)*
Percent Value
Hives 415 (64%) 17.3 35% Buildings 153 (24%) 14.7 29% Trucks/trailers 193 (30%) 9.8 20% Machinery / equipment 317 (49%) 8.3 17% Total 50.1 100% *Expanded for Florida population of beekeepers.
23
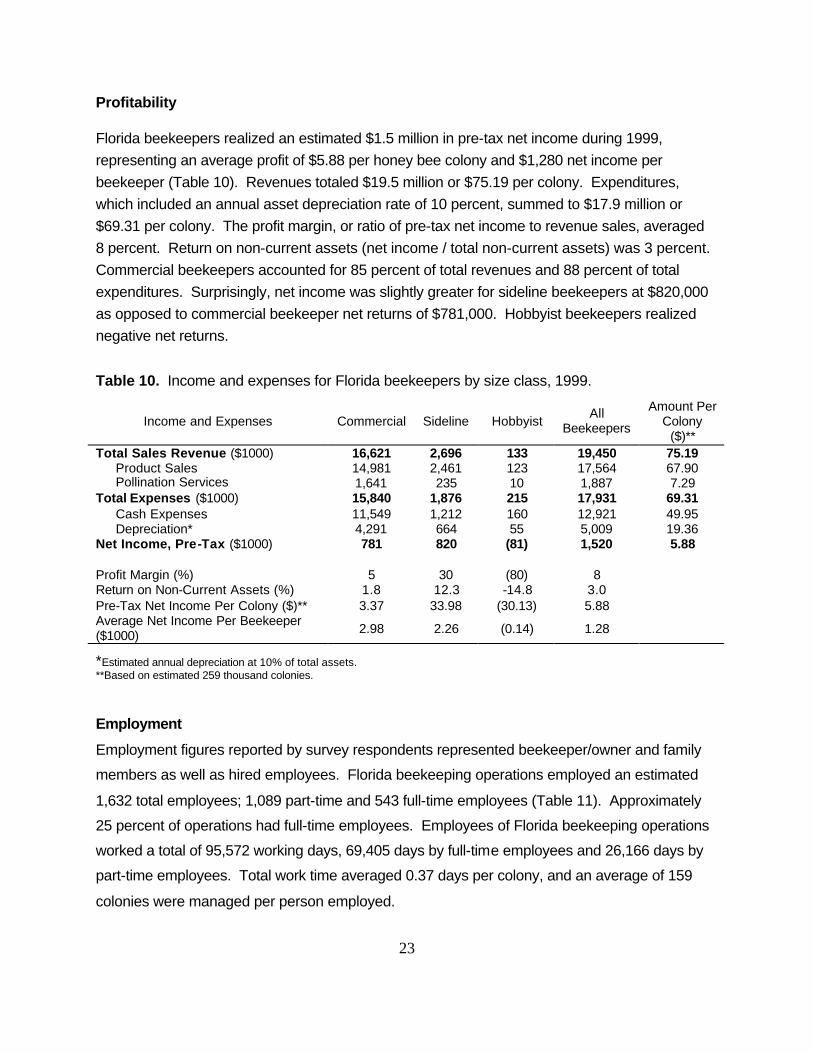
Profitability Florida beekeepers realized an estimated $1.5 million in pre-tax net income during 1999,
representing an average profit of $5.88 per honey bee colony and $1,280 net income per
beekeeper (Table 10). Revenues totaled $19.5 million or $75.19 per colony. Expenditures,
which included an annual asset depreciation rate of 10 percent, summed to $17.9 million or
$69.31 per colony. The profit margin, or ratio of pre-tax net income to revenue sales, averaged
8 percent. Return on non-current assets (net income / total non-current assets) was 3 percent.
Commercial beekeepers accounted for 85 percent of total revenues and 88 percent of total
expenditures. Surprisingly, net income was slightly greater for sideline beekeepers at $820,000
as opposed to commercial beekeeper net returns of $781,000. Hobbyist beekeepers realized
negative net returns.
Table 10. Income and expenses for Florida beekeepers by size class, 1999.
Income and Expenses Commercial Sideline Hobbyist All
Beekeepers
Amount Per Colony
($)** Total Sales Revenue ($1000) 16,621 2,696 133 19,450 75.19 Product Sales 14,981 2,461 123 17,564 67.90 Pollination Services 1,641 235 10 1,887 7.29 Total Expenses ($1000) 15,840 1,876 215 17,931 69.31 Cash Expenses 11,549 1,212 160 12,921 49.95 Depreciation* 4,291 664 55 5,009 19.36 Net Income, Pre-Tax ($1000) 781 820 (81) 1,520 5.88 Profit Margin (%) 5 30 (80) 8 Return on Non-Current Assets (%) 1.8 12.3 -14.8 3.0 Pre-Tax Net Income Per Colony ($)** 3.37 33.98 (30.13) 5.88 Average Net Income Per Beekeeper ($1000) 2.98 2.26 (0.14) 1.28 *Estimated annual depreciation at 10% of total assets. **Based on estimated 259 thousand colonies.
Employment
Employment figures reported by survey respondents represented beekeeper/owner and family
members as well as hired employees. Florida beekeeping operations employed an estimated
1,632 total employees; 1,089 part-time and 543 full-time employees (Table 11). Approximately
25 percent of operations had full-time employees. Employees of Florida beekeeping operations
worked a total of 95,572 working days, 69,405 days by full-time employees and 26,166 days by
part-time employees. Total work time averaged 0.37 days per colony, and an average of 159
colonies were managed per person employed.

24
Table 11. Employment and number of days worked in the Florida beekeeping industry, 1999.
Employment Number
Respondents (percent)
Number Persons*
Number Days Worked (percent)*
Full Time 161 (25%) 543 69,405 (72.6%) Part Time 274 (42%) 1,089 26,166 (27.4%) Total 1,632 95,572 *Expanded for Florida population of beekeepers.
Honey Bee Colony Losses
Surveyed beekeepers were asked “Have you experienced large die-offs of honey bee colonies
due to pests or other causes within the last 5 years?” Within the past 5 years, 57 percent of
respondents (373 firms) indicated experiencing honey bee die-offs. Respondents estimated
that 75,586 honey bee colonies succumbed to die-offs resulting from pests or other causes
during this time. This represented 29 percent of the colony stock in 1999, or an average annual
turnover of 5.8 percent. Thirty seven percent of beekeepers surveyed reported losing 51
percent or more of their colonies over the past 5 years, and 11 percent of respondents lost 81
percent or more, based on their 1999 colony numbers. These losses are in addition to the
normal 10 to 20 percent of colonies that are lost during overwintering. Industry experts reported
that the rate of colony losses due to pests in recent years is significantly greater than was
experienced historically.
Beekeepers were asked to state in their own words the nature of bee die-offs in their managed
colonies (Table 12). The majority of beekeepers (57%) cited mites as the cause for bee die-offs
(213 responses). In addition Florida beekeepers reported problems, with beetles (89), the wax
moth (64), pesticides (39), queen acceptance/loss (28), ants (24), foulbrood (22), mite
resistance to treatment (19), weather (16), floods (14), theft/vandalism (13) and bears (12). The
remaining listed causes of bee die-offs received less than 10 responses each.

25
Table 12. Listed causes of Florida honey bee die-offs, 1999.
Rank Reason for Loss Number
Respondents (percent)
1 Mites (Varroa, Tracheal) 213 (57%) 2 Beetles 89 (24%) 3 Wax moth 64 (17%) 4 Pesticides 39 (10%) 5 Queen acceptance/loss 28 (8%) 6 Ants 24 (6%) 7 Foulbrood 22 (6%) 8 Mite resistance to treatment 19 (5%) 9 Weather 16 (4%) 10 Floods 14 (4%) 11 Theft/vandalism 13 (3%) 12 Bears 12 (3%) 13 Poor management 9 (2%) 13 Poor care 9 (2%) 14 Fires 7 (2%) 15 Pests 5 (1%) 16 Starvation 4 (1%) 17 Weak hive 3 (1%) 17 Viruses 3 (1%) 17 Disease 2 (1%) 18 Swarming 2 (1%)
Threats to the Florida Beekeeping Industry
Beekeepers were asked to rate the most important threats confronting the Florida beekeeping
industry on a 5-point Likert scale where a score of 5 signified “extremely important” and a score
of 1 signified “unimportant” (Table 13). The 13 threats listed in the survey included low honey
prices, pesticide exposure and low recruitment of new beekeepers, among others. Seven
threats received above average scores (>3). They included foreign imports of honey (4.3), low
prices for honey (4.1), decline of honey bee populations due to pests (4.0), resistance to
pesticides for control of mites (3.9), high cost of beekeeping (3.8), losses to honey bee diseases
(3.5), and potential contamination of honey by pesticides (3.1). The threats to the Florida
beekeeping industry that the majority of respondents (>50%) assigned a score of 4 or 5 (e.g.
very important and extremely important, respectively) were low prices for honey (70.4%), foreign
imports of honey (68.2%), decline of honey bee populations due to pests (65.7%), resistance to
pesticides for control of mites (52.5%), and lack of skilled or willing workers (52.3%)(Table 13).

26
Table 13. Ratings of threats to the Florida beekeeping industry, 1999.
Threats to Beekeepers Number Respondents
Average Score*
Percent Respondents
Scored Extremely or Very Important
Foreign imports of honey 428 4.3 68.2% Low prices for honey 439 4.1 70.4% Decline of honey bee populations due to pests 452 4.0 65.7% Resistance to pesticides for control of mites 427 3.9 52.5% High cost of beekeeping 420 3.8 45.5% Losses to honey bee diseases 434 3.5 48.8% Potential contamination of honey by pesticides 379 3.1 47.0% Potential adulteration of honey by other sweeteners 359 3.0 43.5% Pesticide exposure to bees from nearby ag. operations 370 3.0 41.1% Lack of suitable bee pasturage and colony sites 360 2.9 49.7% Low recruitment of new beekeepers to the industry 345 2.7 49.6% Lack of skilled or willing workers 329 2.3 52.3% Losses to bears and other predators 338 1.9 65.4% *Scored on a scale of 1-5, with 5 being extremely important, 4 very important, 3 somewhat important, 2 slightly important, and 1 unimportant.
Beekeeper Experience
Respondents reported a mean of 16.7 years and a median of 11.5 years experience in the
beekeeping business. The number of years experience ranged from a low of 1 year to a high of
70 years. The majority of beekeeping respondents (450 or 78%) indicated between 2 to 30
years experience (Figure 3). The 2 to 5 year range received the most responses with 158
beekeepers (28% of respondents). Seventy five respondents (12%) reported no honey bee colonies and it is presumed that these beekeepers are now out of business due to complete
loss of colonies, or beekeeper retirement.

27
0
20
40
60
80
1 0 0
1 2 0
1 4 0
1 6 0
1 8 0
1 2-5 6-10 11-20 21-30 31-40 41-50 51-60 6 1 +
Years in Beekeeping
Nu
mb
er R
esp
on
den
ts
Figure 3. Years experience of Florida beekeepers, 1999.

28
Florida Grower Survey Results Response Rates The second questionnaire was administered to all Florida growers of cantaloupe, cucumber,
watermelon, blueberry, strawberry, avocado and specialty citrus. From the Florida population of
2,300 growers of these crops, 425 responded to this questionnaire yielding an overall response
rate of 18.5 percent. More than 31 percent of respondents (133 growers) reported contracting
for pollination services within the past five years while 292 growers (69% of respondents) have
not contracted within the past 5 years. Sixteen percent of respondents reported that they used
pollination services but also grow some of the same crops without. When growers were asked
to indicate the most recent year they contracted for pollination services within the past 5 years,
a total of 125 growers responded, and the vast majority of these respondents (94%) cited either
the years 1999 or 2000. Pollination contracts averaged 13.1 years, which does not necessarily
signify 13 consecutive seasons.
Fruit and Vegetable Crop Pollination
The number of acres pollinated by honey bees totaled 34,845 among all crops reported. More
acreage of specialty citrus were pollinated than any other crop in Florida (Table 14). Over
17,000 acres of specialty citrus crops (50% of surveyed acreage), 7,834 acres of watermelons
(22%), 3,207 acres of cucumbers (9%), 2,197 acres of squash (6%) and 2,072 acres of
avocados (6%) contracted for pollination services in 1999. Overall, an average of 1.89 acres
were pollinated by each honey bee colony contracted. Watermelons were pollinated by more
hives than any other crop surveyed with 6,748 honey bee colonies or 37 percent of 18,477 total
reported bee colonies contracted (Table 14). Honey bee colonies contracted included 4,034 for
specialty citrus, 3,834 for cucumber crops, and 1,431 colonies for avocado crops. The number
of colonies contracted per acre was highest for strawberries (2.57), blueberries (1.77),
cucumbers (1.20) and cantaloupe (1.01), compared to the overall average of 0.53 colonies per
acre across all crops.

29
Table 14. Acres pollinated, number of honey bee colonies and cost of pollination services for Florida fruit and vegetable growers, 1999.
Crops Pollinated Number
Respondents Acres
Pollinated Number colonies
Average Colonies Per
Acre
Average Rental Price ($/Colony)
Cost of Services
($)
Average Cost Per Acre
Pollinated ($)
Watermelons 58 7,834 6,748 .086 27.20 191,535 24.45
Cucumbers 18 3,207 3,834 1.20 22.80 90,950 28.36
Avocados 20 2,072 1,431 0.69 20.20 23,138 11.17
Squash 19 2,197 1,108 0.50 22.90 22,799 10.38
Cantaloupe 27 689 698 1.01 27.30 18,799 27.28
Specialty citrus 13 17,475 4,034 0.23 8.50 12,879 0.74
Blueberries 17 262 464 1.77 26.00 9,923 37.87
Strawberries 6 408 105 2.57 27.50 1,425 3.49
Eggplant 3 68 55 0.80 22.50 1,250 18.38
Other Miscellaneous 633 - -
Total 34,845 18,477 0.53 372,698 10.7
Expenses for Pollination Services The cost of pollination services for each crop surveyed was estimated by multiplying the number
of honey bee colonies contracted for pollination by the rental price per colony reported by each
grower. The average rental price paid by growers per honey bee colony ranged from $20.20 to
$27.50, except for specialty citrus, which had an average rental price per colony of $8.50
(Table 14). The total cost of pollination services by honey bees was $372,698 in 1999.
Watermelons had the highest cost at $191,535 (51% of total cost) followed by cucumbers
($91,950), avocados ($23,138), and squash ($22,799). Collectively these four crops accounted
for 88 percent of total pollination services costs. Dividing cost of services by the total number of
acres pollinated gives the average cost per acre pollinated (Table 14). The cost per acre
averaged to $10.70 across all fruit and vegetable crops surveyed. Blueberries commanded the
greatest cost per acre pollinated ($37.87) followed by cucumbers ($28.36), cantaloupes
($27.28), watermelons ($24.45), and eggplant ($18.38). Specialty citrus and strawberry crops
received the lowest cost per acre pollinated at $.74 and $3.49, respectively. The majority of
growers surveyed (91%) reported total pollination service expenses under $10,000 with 56% of
respondents reporting pollination service expenses under $1000 (Table 15). Less than 9
percent of respondents reported expenditures ranging between $10,000 and $99,999 and no

30
growers indicated pollination service expenses greater than $100,000. These results suggest
that pollination services constitute minor expenses for Florida farmers.
Table 15. Expenditures on pollination services by Florida fruit and vegetable growers, 1999.
Expenses per grower Number
Respondents Percent
Respondents
Less than $1,000 71 55.5% $1,000-$9,999 46 35.9% $10,000-$49,999 9 7.0% $50,000-$99,999 2 1.6% Total 128 Value of Honey Bee Pollination for Fruit and Vegetable Production
Respondents were asked to indicate the typical yield increases associated with pollination
service contracts on their crops (Table 16). Watermelon crops benefited the most from
pollination services with an estimated 60.1 percent yield increase. Additionally, pollination
services were associated with a 58.6 percent yield increase in cucumbers, a 36.4 percent
increase in cantaloupes and a 32.1 percent increase in blueberry yields. On average, the
Florida crops considered in this survey experienced a 37 percent increase in yields. Marginal
value in the present context represents the value of crop yield increases attributable to honey
bee pollination activities, in other words, the difference in value of crops with and without
pollination activity. This value was determined by taking the change in yield per acre associated
with the pollination services multiplied by the price per unit, multiplied by the number of
pollinated acres for each crop less the cost of pollination services. These results assume that
there are no market supply or price adjustments associated with marginal changes in crop
yields due to honey bee pollination. The total marginal value benefit of pollination services was
estimated at $26.4 million (Table 16). Cucumbers had the largest marginal value of pollination
at $7.4 million (28% of total) followed by watermelons at $5.9 million (22%), specialty citrus at
$5.3 million (20%), and squash at $3.7 million (14%). The marginal value for the remaining
crops totaled $3.7 million (14% of total marginal value).

31
Table 16. Marginal value benefit of honey bee pollination services, 1999.
Crop Average Yield per
Acre *
Average Percent
Increased Yield
Marginal Production
Due to Honey Bees (units/acre)
Price per unit ($)*
Cost of Pollination Services
($)
Marginal Benefit of Pollination
Services ($1000)
Cucumber (55 lb. bushel) 579 58.6 222 10.52 90,950 7,389
Watermelons (cwt) 300 60.1 113 6.9 191,535 5,899
Specialty Citrus (boxes) 208 20.3 35 8.75 12,879 5,333
Squash (42 lb. bushel) 280 65.0 110 15.25 22,799 3,673
Strawberries (12 lb. flat) 2500 27.5 539 9.72 1,425 2,137
Avocados (bushels) 149 25.3 30 18.7 23,138 1,144
Blueberries (lbs.) 1210 32.1 294 4.84 9,923 362
Eggplant (33 lb. bushel) 811 20.0 135 10.35 1,250 94
Total 26,385 *Source: Florida Agricultural Statistics Service. Issues for Honey Bee Pollination Service Contracts
Farmers surveyed were given a list of seven commercial pollination issues and asked to rate
their importance on a Likert scale of 1 to 10 where a score of 1 signifies “not important” and a
score of 10 signifies “most important” (Table 17). Respondents assigned greater than average
scores (>5.5) to the issue items “effectiveness of pollination services” (7.8), “availability of
pollination services” (7.2), “cost of pollination services” (6.2), and “constraints on pesticide
application” (6.0). The issues ‘unpredictability of timing for pollination,’ ‘reliability of other native
pollinators,’ and ‘hazard to workers in vicinity’ were perceived as much less important.
Table 17. Importance of issues surrounding pollination contracts for Florida fruit and vegetable growers, 1999.
Issues for Pollination Contracts Number
Respondents
Average Score (1-10)
Effectiveness of pollination services 106 7.8 Availability of pollination services 112 7.2 Cost of pollination services 114 6.2 Constraints on pesticide application 106 6.0 Unpredictability of timing for pollination 107 5.3 Reliability of other native pollinators 104 5.0 Hazard to workers in vicinity 105 3.5

32
Regional Economic Impacts of the Florida Apicultural Industry
Three types of regional economic impacts are associated with the apicultural industry of Florida:
direct, indirect and induced economic effects. The direct economic impacts involve output,
value-added and employment contributions directly affiliated with apicultural operations in
Florida. Purchases from other industries support additional levels of employment and wages
(indirect effects). Personal consumption purchases made by employees of the apicultural
industry and related sectors further boost the economy (induced effects). The total impact is the
sum of direct, indirect and induced effects.
The sum of product sales and pollination services for Florida beekeepers was $19.3 million
(Table 18). Product sales totaled $17.6 million with $8.4 million (48%) of sales exported from
Florida and $9.1 million (52%) of sales transacted inside Florida. The total value of pollination
services was $1.8 million with $281,000 (16%) representing out-of-state sales and $1.5 million
(84%) within-state sales. Forty five percent ($8.7 million) of aggregated product sales and
pollination services were outside of Florida while 55 percent of total sales ($10.6 million)
occurred within the state. The marginal benefit of pollination services was $26.03 million with
$17.2 million (66%) representing out-of-state export sales and $8.8 million (33%) sold within the
state.
Table 18. Sales and export value of Florida honey bee products and marginal value of pollination services to growers, 1999.
Income Source Estimated Total Value ($ million)
Export Value from Florida ($ million)
Within Florida Sales
($ million) Beekeepers
Total 19.32 8.71 10.61 Product Sales 17.56 8.43 9.13 Pollination Services 1.76 .28 1.48
Growers Marginal Benefit of Pollination Services
26.03 17.23 8.80
Total economic impacts were calculated by multiplying total industry out-of-state exports (Table
18) against the total effects multiplier (Table 1), and multiplying the value of industry sales within
Florida (Table 18) against the direct effects multiplier, then summing these two values together.
Direct effects were estimated by multiplying the sum of export and within Florida sales by the
33
direct effects multiplier. Indirect and induced effects were calculated by multiplying total export
sales by the indirect and induced effects multipliers, respectively. The employment multiplier is
expressed in terms of jobs per million dollar output so impact estimates were adjusted
accordingly to reflect this unit specification. The output and value-added multipliers are
expressed in dollars per dollar output. The proportion of domestic and export honey bee
product sales were derived from survey results while multiplier values for honey bee product
sales and pollination services, and the proportion of in-state and out-of-state export pollination
service sales were provided by the IMPLAN system for 1997. Total output impacts were $30.5
million, total value-added impacts were $15.2 million, and employment impacts were 806 jobs
(Table 19). Total output impacts averaged $118 per colony and total value-added impacts
averaged $59 per colony. The direct effect accounted for 63 percent of total output impacts, 54
percent of value-added impacts, and 81 percent of employment impacts. The indirect effect
captured 12 percent of total output impacts, 14 percent of value-added impacts, and 6 percent
of employment impacts. The induced effect accounted for 24 percent of the output impact, 32
percent of the value-added impact and 13 percent of the employment impact.
The direct, indirect and induced impacts associated with marginal benefit of pollination services
for Florida fruit and vegetable growers appear in Table 19. Total output impacts were $38.2
million, value-added impacts were $20.9 million and employment impacts amounted to 490 jobs.
The direct effects accounted for 68 percent of total output impacts, 65 percent of value-added
impacts and 57 percent of employment impacts. The indirect effects captured 18 percent of
output and value-added impacts, and 27 percent of employment impacts. The induced effects
represented 14 percent of output impacts, 17 percent of value-added impacts and 16 percent of
employment impacts.

34
Table 19. Total economic impacts of the Florida apicultural industry and marginal benefits to Florida fruit and vegetable growers by pollination services, 1999.
Multipliers Output ($ Million)
Value-Added ($ Million)
Employment (Jobs)
Florida Beekeepers Total Effects 30.46 15.23 806
Direct Effects 19.32 8.27 649 Indirect Effects 3.69 2.13 51 Induced Effects 7.45 4.83 106
Florida Fruit and Vegetable Growers Total Effects 38.17 20.85 490
Direct Effects 26.03 13.57 281 Indirect Effects 6.79 3.83 133 Induced Effects 5.35 3.45 76

35
Discussion
In total, Florida beekeepers managed over 258 thousand honey bee colonies in 1999, nearly
150 thousand of which represented migratory beekeeping operations. Revenues from
apicultural operations were generated from honey bee products (including honey, beeswax,
packaged bees, queens and nucs) and pollination service contracts. Total sales revenues
accruing to Florida beekeepers in 1999 from product sales and pollination services amounted to
$19.5 million, of which 90 percent represented honey bee product sales. Honey sales
amounted to $15.7 million or 89 percent of total product sales. The majority of product sales
(79%) were transacted in wholesale markets. Income received by beekeepers for pollination
services was estimated at $1.9 million, primarily derived from service contracts for watermelons,
cucumbers, cantaloupes and blueberries. Although more honey bee colonies were contracted
to pollinate specialty citrus than any other crop surveyed, citrus had the lowest average honey
bee colony price. Beekeepers are willing to accept lower prices for specialty citrus pollination
because the strong nectar flows associated with these crops support greater honey bee
populations, and consequently contribute to higher levels of honey production.
Cash operating expenditures associated with beekeeping operations totaled an estimated $12.9
million in 1999. Labor and transportation represented 45 percent of total expenses.
Expenditures on pesticides and antibiotics were reported by 46 percent of respondents.
Although beekeeping is a very labor-intensive enterprise, apicultural operations require
significant capital investments in hives, trucks/trailers, buildings and machinery/equipment,
which totaled $50 million in 1999. Pre-tax net income amounted to $1.5 million for all
beekeepers. Hobbyist beekeepers realized negative returns. Commercial beekeepers
(managing 200 or more colonies annually) and sideline beekeepers (managing 20-199 colonies
annually) realized similar levels of pre-tax net income. The profit margin or ratio of net income
to sales revenues for all beekeepers in 1999 was 7.8 percent, the return on non-current assets
was 3.03 percent, pre-tax net income per colony amounted to $5.88 and pre-tax net income per
beekeeper averaged $1,280.
In rating the importance of 13 threats confronting the state’s apicultural industry, the most
severe threats included foreign imports of honey, low honey prices, pests, resistance to
pesticides for control of mites and the high costs of beekeeping. Apiculturists assigned
relatively uniform rating scores to all threats, with the exception of a low concern for losses of

36
honey bee colonies to bears and other predators. Most beekeepers identified natural pests
including mites, beetles and the wax moth as a cause of honey bee die-offs. Respondents
reported a mean of 16.7 years beekeeper experience. The cumulative experience and training
of beekeepers represents a significant human capital investment. The combination of low
returns, colony losses, and other threats portrays the Florida apicultural industry as a marginal
economic enterprise.
More than 31 percent of grower respondents reported contracting for pollination services within
the past 5 years. Sixteen percent of respondents reported that they used pollination services
but also grow some of the same crops without them. In total 34,845 acres of fruit and vegetable
crops were pollinated by honey bees, consisting mostly of specialty citrus and watermelons.
The total cost of pollination services by honey bees was $372,698 in 1999, with watermelons
accounting for 51 percent of this total cost. The majority of fruit and vegetable growers (92%)
reported expenditures under $10,000, and 56 percent of respondents indicated expenditures
under $1000. This suggests that pollination service charges represent minor expense
categories for Florida fruit and vegetable growers. The marginal value benefit to growers of
using pollination services totaled $26.4 million. The combination of low expenses and high
marginal value benefit associated with pollination services suggests that growers benefit from
the surplus value of pollination services, especially for crops such as cucumbers and
watermelons, which demonstrated especially high yield responses to pollination. According to
fruit and vegetable growers, the two items rated highest in importance regarding pollination
service contracts were the effectiveness of pollination services in maintaining yields and the
availability of pollination services. This suggests that growers recognize the importance of
honey bee pollination services. The item ‘cost of pollination services’ received a slightly above
average importance rating, signifying that growers are mostly satisfied with the cost of these
services.
37
Literature Cited Florida Agricultural Statistics Service (FASS), 1998. Orlando, FL. Ingram, M., Nabhan, G. and Buchmann, S. 1996. “Our forgotten pollinators: protecting the birds and bees.” Global Pesticide Campaigner 6(4): 1-8. http://www.apicultura.com/articles/pollinators.htm
Johnson, R.G. and Ortego, A. 1996. “Sugar and honey policy.” In Ron Knutson, ed., 1995 Farm Bill Extension Papers, National Public Policy Education Committee. http://ianrwww.unl.edu/farmbill/sugar.htm.
Levin, M.D. 1983. “Value of bee pollination to U.S. agriculture.” Bull. Entomol. Soc. Am. 29:50-51. Los Angeles County West Vector Control District, Los Angeles, CA. http://www.palosverdes.com/lacwvcd/service.htm.
Miller, R.E. and P.D. Blair, 1985. Input-Output Analysis: Foundations and Extensions. Prentice-Hall, Englewood Cliffs, New Jersey, 464 p. Morse, R.A. and Calderone, N.W. 2000. “The value of honeybees as pollinators of U.S. crops in 2000.” Bee Culture 128(3):1-15.
Mulkey, W.D. and A.W. Hodges. 2000. Using IMPLAN to assess local economic impacts. University of Florida Extension FE 168. http://edis.ifas.ufl.edu. Sanford, Malcolm T. 2000. “CheckMite+ label reapproved in Florida.” Apicultural Information and Isses 18(2), University of Florida Department of Entomology and Nematology, pp. 1-2. Sanford, M.T. 1998. “Pollination, the forgotten input.” Proceedings of the Florida Agricultural Conference and Trade Show, Lakeland, FL, September 29-30, J. Ferguson, et al., eds., pp. 45-47. Sanford, M.T. 1996. “High honey prices-the fallout.” Apicultural Information and Issues 16(5), University of Florida Department of Entomology and Nematology, pp. 1. Sanford, M.T. 1995. Honey adulteration. Fact Sheet RF-AA155, University of Florida Cooperative Extension Service.
Sanford, M.T. 1993. Protecting honey bees from pesticides. Fact Sheet AA145, University of Florida Cooperative Extension Service.
Sanford, M.T., 1992a. A study in profitability for a mid-sized beekeeping operation. Fact Sheet RF-AA089, University of Florida Cooperative Extension Service.
Sanford, M.T., 1992b. Pollination of citrus by honeybees. Fact Sheet RF-AA155, University of Florida Cooperative Extension Service.

38
Sanford, Malcolm T., 1992c. “Pollination paradox—why bees are not good pollinators?” Apicultural Information and Issues,10(6), University of Florida Department of Entomology and Nematology, pp. 2-3. Southwick, E.E. and Southwick, L.S. 1992. “Estimating the economic value of honeybees as agricultural pollinators in the United States.” Journal of Economic Entomology, 85(2):621-633.
US Department of Agriculture. 1997 Census of Agriculture, Washington, DC.
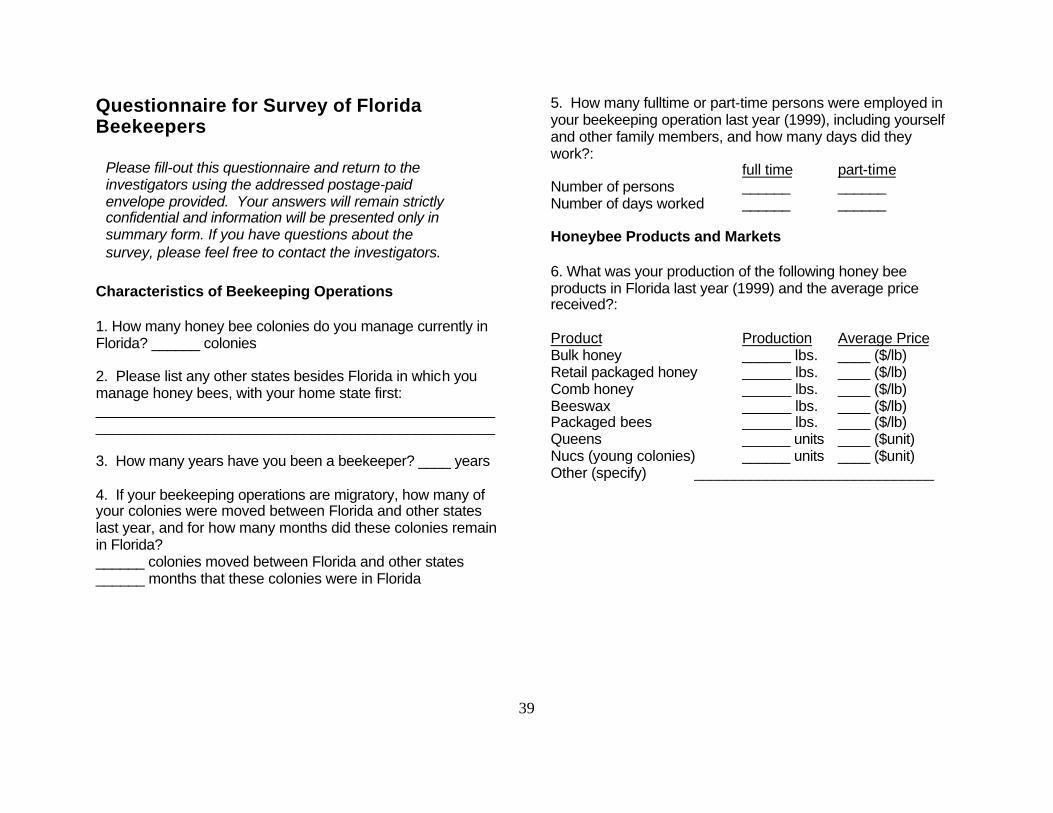
39
Questionnaire for Survey of Florida Beekeepers
Characteristics of Beekeeping Operations 1. How many honey bee colonies do you manage currently in Florida? ______ colonies 2. Please list any other states besides Florida in which you manage honey bees, with your home state first: ____________________________________________________________________________________________________ 3. How many years have you been a beekeeper? ____ years 4. If your beekeeping operations are migratory, how many of your colonies were moved between Florida and other states last year, and for how many months did these colonies remain in Florida? ______ colonies moved between Florida and other states ______ months that these colonies were in Florida
5. How many fulltime or part-time persons were employed in your beekeeping operation last year (1999), including yourself and other family members, and how many days did they work?: full time part-time Number of persons ______ ______ Number of days worked ______ ______ Honeybee Products and Markets 6. What was your production of the following honey bee products in Florida last year (1999) and the average price received?: Product Production Average Price Bulk honey ______ lbs. ____ ($/lb) Retail packaged honey ______ lbs. ____ ($/lb) Comb honey ______ lbs. ____ ($/lb) Beeswax ______ lbs. ____ ($/lb) Packaged bees ______ lbs. ____ ($/lb) Queens ______ units ____ ($unit) Nucs (young colonies) ______ units ____ ($unit) Other (specify) ______________________________
Please fill-out this questionnaire and return to the investigators using the addressed postage-paid envelope provided. Your answers will remain strictly confidential and information will be presented only in summary form. If you have questions about the survey, please feel free to contact the investigators.

40
7. Please indicate the percentage of your total honey sales last year to each of the following market outlets: wholesale honey packer in Florida _____% wholesale honey packer outside Florida _____% honey cooperative _____% commercial sweetener users in Florida _____% commercial sweetener users outside Florida _____% local retail stores _____% roadside stands/farmers markets _____% friends, neighbors and associates _____% other (specify _____________________) _____% 100% Honeybee Pollination Services 8. Did you provide crop pollination services in Florida last year (1999)? (circle one): yes no 9. If you did provide crop pollination services, how many colonies were contracted for each of the following crops and what was the average rental price per colony?: Number. Avg. price Crop colonies ($/colony) specialty citrus _____ _____ cucumbers _____ _____ squash _____ _____ watermelons _____ _____ cantalopes _____ _____ blueberries _____ _____ strawberries _____ _____ avocados _____ _____ other (specify ______________) _____ _____ other (specify ______________) _____ _____
Operating Expenses and Assets 10. What were your cash operating expenses last year for the following cost categories?: labor (incl. taxes, insurance and fringe benefits) $______ packaged bees/queens $______ supplemental feed $______ beeyard fencing $______ pesticides, antibiotics $______ hives & small tools $______ transportation (fuel, repair & maintenance) $______ freight shipping $______ honey extraction $______ product packaging & marketing $______ building maintenance & repair $______ office expense (telephone, computer, etc.) $______ leasehold on land, buildings $______ professional services (legal, accounting) $______ taxes, insurance $______ travel, entertainment, meetings, education $______ interest $______ depreciation $______ other (specify _________________________) $______ other (specify _________________________) $______ 11. What is the the current value of your beekeeping assets? Item Value Trucks/trailers $______ Buildings $______ Machinery/equipment $______ Hives $______

41
Honeybee Colony Losses and Threats to the Industry 12. Have you experienced large die-offs of honey bee colonies due to pests or other causes within the last 5 years? (circle one): yes no 12a. If yes, how many colonies were lost? _____ colonies 12b. Please explain briefly the nature of you losses: __________________________________________________ ____________________________________________________________________________________________________ 13. In your opinion, what are the most important threats facing the beekeeping industry in Florida? Please rate the following possible threats on a scale of 1 to 5, with 5 being "very important" and 1 being "unimportant": _____ low prices for honey _____ foreign imports of honey _____ high cost of beekeeping _____ potential adulturation of honey by other sweeteners _____ potential contamination of honey by pesticides _____ pesticide exposure to bees from nearby agric. operations _____ decline of honey bee populations due to pests _____ losses to honey bee diseases _____ losses to bears and other predators _____ resistence to pesticides for control of mites _____ lack of skilled or willing workers _____ low recruitment of new beekeepers to the industry _____ lack of suitable bee pasturage and colony sites _____ other (specify ____________________)
Total Income 14. What were your total revenues from sale of honey bee products and pollination services last year? (check appropriate category for each): Honey bee Products Pollination Services _____ Less than $1,000 ____ Less than $1,000 _____ $1,000 to $9,999 ____ $1,000 to $9,999 _____ $10,000 to $49,999 ____ $10,000 to $49,999 _____ $50,000 to $99,999 ____ $50,000 to $99,999 _____ $100,000 to $199,999 ____ $100,000 to $199,999 _____ $200,000 to $299,999 ____ $200,000 to $299,999 _____ $300,000 to $399,999 ____ $300,000 to $399,999 _____ $400,000 to $499,999 ____ $400,000 to $499,999 _____ $500,000 or more ____ $500,000 or more Please check here if you wish to receive a copy of the final project report ______ Thank you for completing this questionnaire. Please insert in the addressed postage-paid envelope provided and mail. Revised January 7, 2000
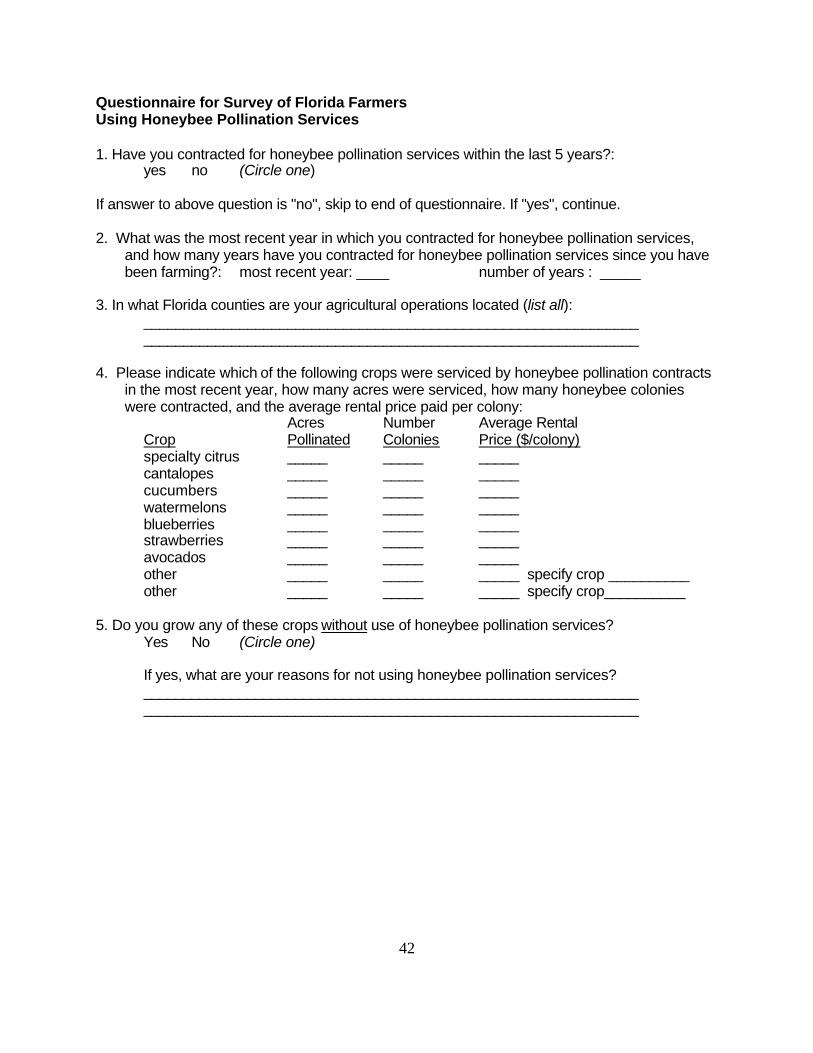
42
Questionnaire for Survey of Florida Farmers Using Honeybee Pollination Services 1. Have you contracted for honeybee pollination services within the last 5 years?: yes no (Circle one) If answer to above question is "no", skip to end of questionnaire. If "yes", continue. 2. What was the most recent year in which you contracted for honeybee pollination services,
and how many years have you contracted for honeybee pollination services since you have been farming?: most recent year: ____ number of years : _____
3. In what Florida counties are your agricultural operations located (list all): ______________________________________________________________ ______________________________________________________________ 4. Please indicate which of the following crops were serviced by honeybee pollination contracts
in the most recent year, how many acres were serviced, how many honeybee colonies were contracted, and the average rental price paid per colony:
Acres Number Average Rental Crop Pollinated Colonies Price ($/colony) specialty citrus _____ _____ _____ cantalopes _____ _____ _____ cucumbers _____ _____ _____ watermelons _____ _____ _____ blueberries _____ _____ _____ strawberries _____ _____ _____ avocados _____ _____ _____ other _____ _____ _____ specify crop __________ other _____ _____ _____ specify crop__________ 5. Do you grow any of these crops without use of honeybee pollination services? Yes No (Circle one) If yes, what are your reasons for not using honeybee pollination services? ______________________________________________________________ ______________________________________________________________
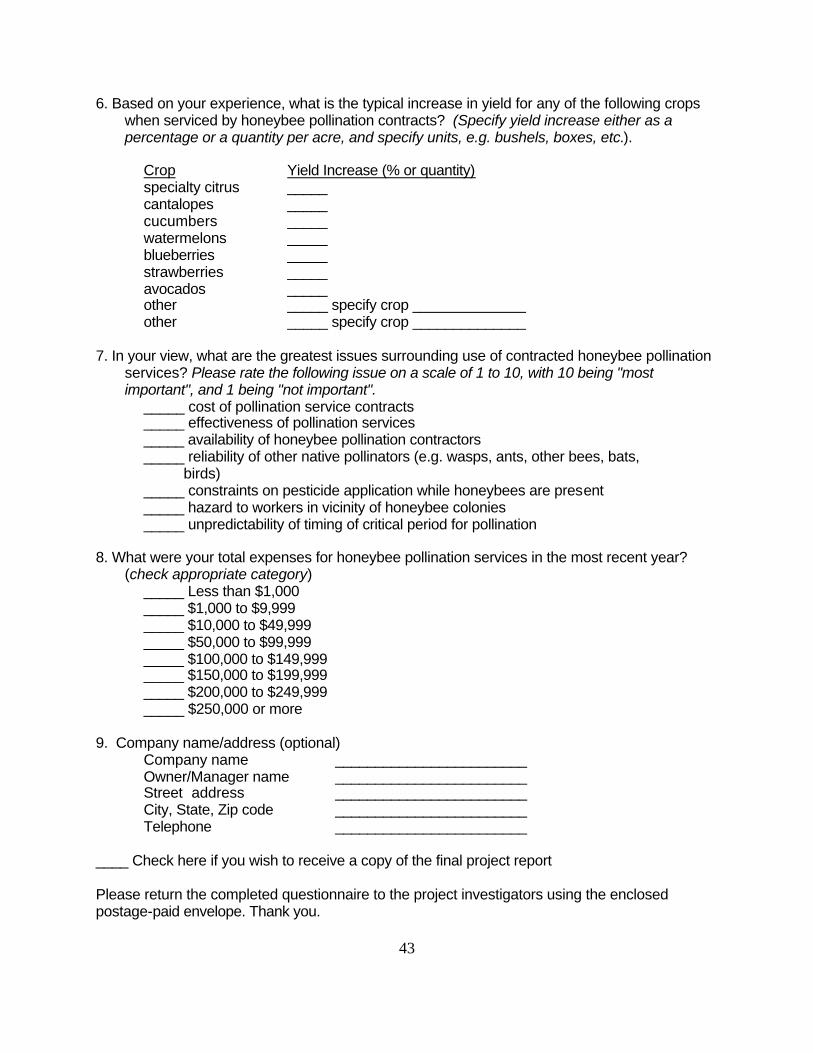
43
6. Based on your experience, what is the typical increase in yield for any of the following crops when serviced by honeybee pollination contracts? (Specify yield increase either as a percentage or a quantity per acre, and specify units, e.g. bushels, boxes, etc.).
Crop Yield Increase (% or quantity) specialty citrus _____ cantalopes _____ cucumbers _____ watermelons _____ blueberries _____ strawberries _____ avocados _____ other _____ specify crop ______________ other _____ specify crop ______________ 7. In your view, what are the greatest issues surrounding use of contracted honeybee pollination
services? Please rate the following issue on a scale of 1 to 10, with 10 being "most important", and 1 being "not important".
_____ cost of pollination service contracts _____ effectiveness of pollination services _____ availability of honeybee pollination contractors _____ reliability of other native pollinators (e.g. wasps, ants, other bees, bats, birds) _____ constraints on pesticide application while honeybees are present _____ hazard to workers in vicinity of honeybee colonies _____ unpredictability of timing of critical period for pollination 8. What were your total expenses for honeybee pollination services in the most recent year?
(check appropriate category) _____ Less than $1,000 _____ $1,000 to $9,999 _____ $10,000 to $49,999 _____ $50,000 to $99,999 _____ $100,000 to $149,999 _____ $150,000 to $199,999 _____ $200,000 to $249,999 _____ $250,000 or more 9. Company name/address (optional) Company name ________________________ Owner/Manager name ________________________ Street address ________________________ City, State, Zip code ________________________ Telephone ________________________ ____ Check here if you wish to receive a copy of the final project report Please return the completed questionnaire to the project investigators using the enclosed postage-paid envelope. Thank you.