edge user guide
TRANSCRIPT

[Type text]
International Finance Corporation
EDGE User Guide
Version 2.1 Last Modified 2019.05.02
Corresponds to EDGE Software Version 2.1
Includes All Building Types

[Type text]
© International Finance Corporation 2019. All rights reserved. EDGE User Guide 2
Page intentionally left blank

TABLE OF CONTENTS
© International Finance Corporation 2019. All rights reserved. EDGE User Guide 3
TABLE OF CONTENTS
TABLE OF CONTENTS ............................................................................................................................. 3
LIST OF FIGURES .................................................................................................................................. 5
LIST OF TABLES .................................................................................................................................... 6
CHANGE LOG .......................................................................................................................................11
LOCATE MEASURE DESCRIPTIONS ..........................................................................................................11
ACRONYMS ..........................................................................................................................................14
INTRODUCTION ...................................................................................................................................15
EDGE CERTIFICATION GUIDANCE ...........................................................................................................18
DESIGN PAGE GUIDANCE ......................................................................................................................24
GREEN MEASURES OVERVIEW ...............................................................................................................44
INDIVIDUAL MEASURES IN EDGE ...........................................................................................................50
ENERGY EFFICIENCY MEASURES ............................................................................................................52
E01* - REDUCED WINDOW TO WALL RATIO ............................................................................................53
E02 – EXTERNAL SHADING DEVICES ......................................................................................................56
E03 - REFLECTIVE PAINT/TILES FOR ROOF ...........................................................................................62
E04 – REFLECTIVE PAINT FOR EXTERNAL WALLS .....................................................................................65
E05* – INSULATION OF ROOF ................................................................................................................69
E06* – INSULATION OF EXTERNAL WALLS ..............................................................................................74
E07 – LOW-E COATED GLASS ................................................................................................................79
E08 – HIGH THERMAL PERFORMANCE GLASS ...........................................................................................83
E09 – INSULATION FOR COLD STORAGE ENVELOPE .................................................................................86
E10 – NATURAL VENTILATION ...............................................................................................................88
E11 – CEILING FANS.............................................................................................................................95
E12* – AIR CONDITIONING SYSTEM .......................................................................................................98
E13* – AIR CONDITIONING WITH AIR COOLED CHILLER ......................................................................... 102
E14* – AIR CONDITIONING WITH WATER COOLED CHILLER .................................................................... 106
E15* – VARIABLE REFRIGERANT FLOW (VRF) COOLING SYSTEM .............................................................. 109
E16 – ABSORPTION CHILLER POWERED BY WASTE HEAT ........................................................................ 113
E17 – AIR ECONOMIZERS DURING FAVORABLE OUTDOOR CONDITIONS ................................................... 116
E18 – CO2 SENSOR/DEMAND-CONTROLLED VENTILATION FOR FRESH AIR INTAKE .................................... 118
E19 – EARTH AIR TUNNEL SYSTEM TO PRE-CONDITION SUPPLY AIR INTAKE ............................................. 121
E20 – VARIABLE SPEED DRIVES ON THE FANS ON COOLING TOWERS ...................................................... 125
E21 – VARIABLE SPEED OR FREQUENCY DRIVES (VSD OR VFD) IN AHUS ................................................. 128
E22 – VARIABLE SPEED DRIVE PUMPS .................................................................................................. 130
E23* – GROUND SOURCE HEAT PUMP ................................................................................................... 132
E24 – RADIANT HEATING AND COOLING SYSTEM .................................................................................. 136
E25 – SENSIBLE HEAT RECOVERY FROM EXHAUST AIR ........................................................................... 138
E26 – HIGH EFFICIENCY CONDENSING BOILER FOR SPACE HEATING ....................................................... 141

TABLE OF CONTENTS
© International Finance Corporation 2019. All rights reserved. EDGE User Guide 4
E27 – RECOVERY OF WASTE HEAT FROM THE GENERATOR FOR SPACE HEATING ....................................... 144
E28 – HIGH EFFICIENCY BOILER FOR WATER HEATING .......................................................................... 147
E29 – ELECTRIC HEAT PUMP FOR HOT WATER ....................................................................................... 150
E30 – PREHEAT WATER USING WASTE HEAT FROM THE GENERATOR ....................................................... 153
E31 – HEAT RECOVERY FROM GREY WATER .......................................................................................... 155
E32 – HEAT RECOVERY FROM LAUNDRY WASTE WATER .......................................................................... 158
E33 – ENERGY SAVING LIGHT BULBS ................................................................................................... 161
E34 – LIGHTING CONTROLS ................................................................................................................ 166
E35 – SKYLIGHT(S) TO PROVIDE DAYLIGHT TO 50% OF TOP FLOOR AREA ............................................... 171
E36 – VARIABLE SPEED HOODS WITH AUTOMATED FAN CONTROLS ........................................................ 175
E37 – ENERGY EFFICIENT REFRIGERATORS AND CLOTHES WASHING MACHINES ...................................... 178
E38 – HIGHER EFFICIENCY REFRIGERATED CASES ................................................................................. 180
E39 – IMPROVED COOLING SYSTEM FOR COLD STORAGE ....................................................................... 184
E40 – SMART METERS ........................................................................................................................ 185
E41 – SOLAR HOT WATER COLLECTORS ............................................................................................... 188
E42 – SOLAR PHOTOVOLTAICS ............................................................................................................ 191
E43 – OTHER RENEWABLE ENERGY FOR ELECTRICITY GENERATION ........................................................ 193
E44 – OFFSITE RENEWABLE ENERGY PROCUREMENT .............................................................................. 195
E45 – CARBON OFFSET ....................................................................................................................... 197
WATER EFFICIENCY MEASURES ........................................................................................................... 199
W01* – LOW FLOW SHOWERHEADS ..................................................................................................... 200
W02* – LOW FLOW FAUCETS FOR WASHBASINS ................................................................................... 202
W03* – WATER-EFFICIENT WATER CLOSETS ......................................................................................... 204
W04* – WATER-EFFICIENT URINALS .................................................................................................... 206
W05* – WATER-EFFICIENT KITCHEN FAUCETS ...................................................................................... 208
W06 – LOW FLOW PRE-RINSE SPRAY VALVES FOR DISHWASHING ........................................................... 210
W07 – WATER-EFFICIENT DISHWASHERS ............................................................................................. 212
W08 – WATER-EFFICIENT FRONT-LOADING WASHING MACHINES ........................................................... 214
W09 – LAUNDRY RINSE WATER RECLAMATION SYSTEM .......................................................................... 216
W10 – CONDENSATE WATER RECOVERY SYSTEM ................................................................................... 218
W11 – WATER-EFFICIENT LANDSCAPING .............................................................................................. 220
W12 – SWIMMING POOL COVER .......................................................................................................... 222
W13 – RAINWATER HARVESTING SYSTEM............................................................................................. 224
W14 – GREY WATER TREATMENT AND RECYCLING SYSTEM .................................................................... 226
W15 – BLACK WATER TREATMENT AND RECYCLING SYSTEM ................................................................... 228
MATERIALS EFFICIENCY MEASURES ..................................................................................................... 230
M01* – FLOOR SLABS ......................................................................................................................... 232
M02* – ROOF CONSTRUCTION ............................................................................................................ 236
M03* – EXTERNAL WALLS ................................................................................................................... 242
M04* – INTERNAL WALLS ................................................................................................................... 250
M05* – FLOORING ............................................................................................................................. 257

TABLE OF CONTENTS
© International Finance Corporation 2019. All rights reserved. EDGE User Guide 5
M06* – WINDOW FRAMES ................................................................................................................... 260
M07 & M08 – INSULATION ................................................................................................................... 262
REFERENCES ..................................................................................................................................... 265
APPENDIX 1. COUNTRY SPECIFIC CONSIDERATIONS .............................................................................. 271
APPENDIX 2. LIGHTING ASSUMPTIONS IN EDGE ................................................................................. 275
APPENDIX 3. RECORD OF POLICY UPDATES IN THE USER GUIDE .......................................................... 287
* Indicates a required measure
LIST OF FIGURES
Figure 1. The admissible range of areas that can be represented by a single unit type in an EDGE residential
model ........................................................................................................................................ 20
Figure 2. Building orientation ................................................................................................................ 38
Figure 3. Sample Energy chart from the Home typology ........................................................................... 46
Figure 4. Sample Water Chart from the Retail typology ............................................................................ 48
Figure 5. Sample Materials Chart from the Offices typology ...................................................................... 49
Figure 6. Screenshot of energy saving measures of one building type in the EDGE App ................................ 52
Figure 7. Illustration of the dimensions used to calculate the shading factor ............................................... 56
Figure 8. Recommended position of the low-e coating for double-pane glass ............................................... 80
Figure 9. Auto shut-off control for air-conditioning based on natural ventilation ........................................... 89
Figure 10. Components of an air economizer system ............................................................................... 116
Figure 11. Energy savings due to CO2 sensors. Source23 .......................................................................... 119
Figure 12. Interaction of soil with Earth Air tunnel system ....................................................................... 122
Figure 13. Schematic of cooling tower and VSDs system ......................................................................... 126
Figure 14. Typical Sources of Waste Heat and Recovery Options .............................................................. 145
Figure 15. Daylight zone configuration .................................................................................................. 167
Figure 16. Daylight zone under roof skylights ......................................................................................... 172
Figure 17. Daylight zone under a vertical skylight (roof monitor) with a flat top ......................................... 173
Figure 18. Daylight zone under a vertical skylight (roof monitor) with a sloping top .................................... 173

TABLE OF CONTENTS
© International Finance Corporation 2019. All rights reserved. EDGE User Guide 6
Figure 19. Savings with use of VSD on kitchen hoods ............................................................................. 175
Figure 20. Home screen to of smart meter with display options to inform home users ................................. 186
Figure 21. Screenshot of water saving measures in EDGE for Homes ........................................................ 199
Figure 22. Schematic of the system to recover rinse water in laundry facilities ........................................... 216
Figure 23. Screenshot of Materials saving measures in EDGE for Hospitality .............................................. 230
Figure 24. SANS alerts for SA are given at the end of the EE measures when project meets EDGE standard of
20% energy saving but does not meet SANS requirements. This alert is specific to South Africa. ......... 271
LIST OF TABLES
Table 1. Look-up table for Energy Measures in the EDGE App mapped to the Location in the User Guide ......... 12
Table 2. Look-up table for Water Measures in EDGE App mapped to the Location in the User Guide ................ 13
Table 3. Look-up table for Materials Measures in EDGE App mapped to the Location in the User Guide............ 13
Table 4: Area Details in Homes .............................................................................................................. 29
Table 5: Area Details in Hospitality ......................................................................................................... 31
Table 6: Area Details in Retail ................................................................................................................ 32
Table 7: Area Details in Offices .............................................................................................................. 34
Table 8: Area Details in Hospitals ........................................................................................................... 35
Table 9: Area Details in Education buildings ............................................................................................. 37
Table 10: Base Case System Type Selection ............................................................................................ 41
Table 11: Base Case System Description ................................................................................................. 42
Table 12: Required versus voluntary measures in EDGE ............................................................................ 44
Table 13: Shading factors for horizontal shading devices at different latitudes for each orientation ................. 57
Table 14: Shading factors for vertical shading devices at different latitudes for each orientation .................... 58
Table 15: Shading factors for combined shading devices (both horizontal and vertical) at different latitudes for
each orientation ........................................................................................................................... 58
Table 16: Typical shading devices .......................................................................................................... 59

TABLE OF CONTENTS
© International Finance Corporation 2019. All rights reserved. EDGE User Guide 7
Table 17: Shading strategies for different orientations at the design stage. ................................................ 59
Table 18: Solar reflectivity values for typical roofing materials .................................................................. 63
Table 19: Solar reflectivity of typical wall finishes .................................................................................... 67
Table 20: Thickness of insulation required to achieve a U-value of 0.45 W/m² K ......................................... 71
Table 21. Insulation types and typical conductivity range ......................................................................... 72
Table 22: Thickness of insulation required to achieve a U-value of 0.45 W/m² K ......................................... 76
Table 23. Insulation types and typical conductivity range ......................................................................... 77
Table 24: Approximate SHGC and U-values for different glazing types ....................................................... 81
Table 25: Approximate SHGC and U-values for different glazing types ....................................................... 84
Table 26: Areas to be Naturally Ventilated, by Building Type ..................................................................... 88
Table 27: Types of natural ventilation .................................................................................................... 90
Table 28: Depth of floor to ceiling height ratios for different room configurations......................................... 91
Table 29: Minimum area of opening as a proportion of floor area for different heat gain ranges. ................... 92
Table 30: Minimum Required Spaces to be Provided with Ceiling Fans, by Building Type .............................. 95
Table 31: Minimum fan size (in meters)/Number of ceiling fans required for different room sizes. ................. 96
Table 32. Examples of current minimum COPs for different types of air conditioning systems ....................... 100
Table 33. Examples of current minimum COPs for different types of air conditioning systems, with the air-cooled
chiller highlighted ....................................................................................................................... 104
Table 34: Examples of current minimum COPs for different types of air conditioning systems, with VRF
highlighted. ............................................................................................................................... 111
Table 35: Factors affecting thermal conductivity of the soil ...................................................................... 122
Table 36: Design parameters to be considered for Earth Air tunnel system ................................................ 123
Table 37: Benefits and limitations of VSD motors for pumps .................................................................... 130
Table 38: Types of Ground Source Heat Pumps. ..................................................................................... 134
Table 39: Types of Condensing Boiler.................................................................................................... 142
Table 40: Recovery technology options ................................................................................................. 145

TABLE OF CONTENTS
© International Finance Corporation 2019. All rights reserved. EDGE User Guide 8
Table 41: Types of High Efficiency Hot Water Boilers .............................................................................. 148
Table 42: Grey Water Heat Recovery Solutions ...................................................................................... 156
Table 43: Grey Water Heat Recovery Solutions ...................................................................................... 159
Table 44: Indoor spaces required to have efficient lighting, by Building Type ............................................. 161
Table 45: Outdoor spaces required to have efficient lighting, by Building Type ........................................... 162
Table 46: Description of technologies (lamp types) ................................................................................. 163
Table 47: Typical range of efficacies for different lamp types ................................................................... 164
Table 48: Lighting Control Requirements by Building Type ...................................................................... 166
Table 49: Types of controls for lighting and other equipment ................................................................... 168
Table 50: Types of refrigerated cases ................................................................................................... 181
Table 51: Efficiency measures for Refrigerated cases .............................................................................. 182
Table 52: Types of solar water collectors ............................................................................................... 189
Table 53: Indoor lighting power density [LPD] assumptions for the base case and improved case for Homes . 275
Table 54: Outdoor lighting power density [LPD] assumptions for the base case and improved case for Homes
............................................................................................................................................... 275
Table 55: Indoor lighting power density [LPD] assumptions for the base case and improved case for Hospitality
............................................................................................................................................... 275
Table 56: Outdoor lighting power density [LPD] assumptions for the base case and improved case for Hospitality
............................................................................................................................................... 276
Table 57: Indoor lighting power density [LPD] assumptions for the base case and improved case for Retail –
Department Store ...................................................................................................................... 276
Table 58: Indoor lighting power density [LPD] assumptions for the base case and improved case for Retail –
Shopping Mall ............................................................................................................................ 276
Table 59: Indoor lighting power density [LPD] assumptions for the base case and improved case for Retail –
Supermarket ............................................................................................................................. 277
Table 60: Indoor lighting power density [LPD] assumptions for the base case and improved case for Retail –
Small Food Retail ....................................................................................................................... 277

TABLE OF CONTENTS
© International Finance Corporation 2019. All rights reserved. EDGE User Guide 9
Table 61: Indoor lighting power density [LPD] assumptions for the base case and improved case for Retail –
Non-Food Big Box Retail.............................................................................................................. 278
Table 62: Indoor lighting power density [LPD] assumptions for the base case and improved case for Retail –
Light Industry ............................................................................................................................ 278
Table 63: Indoor lighting power density [LPD] assumptions for the base case and improved case for Retail –
Warehouses .............................................................................................................................. 279
Table 64: Outdoor lighting power density [LPD] assumptions for the base case and improved case for Retail
buildings ................................................................................................................................... 279
Table 65: Indoor lighting power density [LPD] assumptions for the base case and improved case for Offices . 279
Table 66: Outdoor lighting power density [LPD] assumptions for the base case and improved case for Offices280
Table 67: Indoor lighting power density [LPD] assumptions for the base case and improved case for Hospitals –
Nursing Home ............................................................................................................................ 280
Table 68: Indoor lighting power density [LPD] assumptions for the base case and improved case for Hospitals –
Private Hospital.......................................................................................................................... 280
Table 69: Indoor lighting power density [LPD] assumptions for the base case and improved case for Hospitals –
Public Hospital ........................................................................................................................... 281
Table 70: Indoor lighting power density [LPD] assumptions for the base case and improved case for Hospitals –
Multi-Specialty Hospital ............................................................................................................... 282
Table 71: Indoor lighting power density [LPD] assumptions for the base case and improved case for Hospitals –
Clinics (Outpatient) .................................................................................................................... 282
Table 72: Indoor lighting power density [LPD] assumptions for the base case and improved case for Hospitals –
Diagnostic Center ....................................................................................................................... 283
Table 73: Indoor lighting power density [LPD] assumptions for the base case and improved case for Hospitals –
Teaching Hospital ....................................................................................................................... 283
Table 74: Indoor lighting power density [LPD] assumptions for the base case and improved case for Hospitals –
Eye Hospital .............................................................................................................................. 284
Table 75: Indoor lighting power density [LPD] assumptions for the base case and improved case for Hospitals –
Dental Hospital .......................................................................................................................... 284
Table 76: Outdoor lighting power density [LPD] assumptions for the base case and improved case for Hospitals
............................................................................................................................................... 285

TABLE OF CONTENTS
© International Finance Corporation 2019. All rights reserved. EDGE User Guide 10
Table 77: Indoor lighting power density [LPD] assumptions for the base case and improved case for Education
............................................................................................................................................... 285
Table 78: Outdoor lighting power density [LPD] assumptions for the base case and improved case for Education
............................................................................................................................................... 286

TABLE OF CONTENTS
© International Finance Corporation 2019. All rights reserved. EDGE User Guide 11
CHANGE LOG
V2.1
This is the first version of the Combined User Guide for all EDGE building types. The organization of the User
Guide has been altered to accommodate some new information.
This User Guide contains the complete list of efficiency measures available in EDGE. In the Energy and Water
categories, the measures are listed in a new order to accommodate all building types. No change has been
made to the order of the Materials measures which are common to all building types.
Previous versions of the User Guide contained an Appendix with details of Materials. This Appendix has been
removed from this version; and is now located in a separate document called the ‘EDGE Materials Reference
Guide’.
The last Appendix contains a list of recent policy changes in EDGE; it will be updated periodically to reflect any
new policy changes going forward. This Appendix replaces the User Guide Supplement.
LOCATE MEASURE DESCRIPTIONS
This Combined User Guide contains all the EDGE measures for all building types from the EDGE software; the
measure number from the EDGE software is included under each measure name. The search function can be
used to locate the description of any measure from the EDGE software in this User Guide by searching for its
respective measure number (e.g. HTE11). Or, the measures can be located using the look-up tables on the
following pages.
How to use the look-up tables:
1. Note the Measure Number in the EDGE App for the specific building type that you wish to review.
2. Go to the ‘Look-Up Tables’ on the following pages and find that Measure Number and the
corresponding user guide Measure Code next to it.
3. Locate the user guide Measure Code from the Table of Contents.
For example, to view the measure description for HTE11 for Hospitality (previously referred to as Hotels), see
Measure E14 in this User Guide. This example is highlighted in the look-up table on the next page.

TABLE OF CONTENTS
© International Finance Corporation 2019. All rights reserved. EDGE User Guide 12
Table 1. Look-up table for Energy Measures in the EDGE App mapped to the Location in the User Guide
HOMES HOSPITALITY RETAIL OFFICES HOSPITALS EDUCATION EDGE
App Measure#
User
Guide Location
App Measure#
User Guide Location
EDGE App Measure#
User Guide Location
EDGE
App Measure#
User
Guide Location
EDGE
App Measure#
User
Guide Location
EDGE
App Measure#
User
Guide Location
ENERGY EFFICIENCY MEASURES
HME01 E01 HTE01 E01 RTE01 E01 OFE01 E01 HSE01 E01 EDE01 E01
HME02 E03 HTE02 E02 RTE02 E03 OFE02 E03 HSE02 E03 EDE02 E03
HME03 E04 HTE03 E05 RTE03 E04 OFE03 E04 HSE03 E04 EDE03 E04
HME04 E02 HTE04 E06 RTE04 E02 OFE04 E02 HSE04 E02 EDE04 E02
HME05 E05 HTE05 E07 RTE05 E05 OFE05 E05 HSE05 E05 EDE05 E05
HME06 E06 HTE06 E08 RTE06 E06 OFE06 E06 HSE06 E06 EDE06 E06
HME07 E07 HTE07 E10 RTE07 E07 OFE07 E07 HSE07 E07 EDE07 E07
HME08 E08 HTE08 E10 RTE08 E10 OFE08 E08 HSE08 E08 EDE08 E10
HME09 E10 HTE09 E15 RTE09 E17 OFE09 E10 HSE09 E10 EDE09 E10
HME10 E11 HTE10 E13 RTE10 E15 OFE10 E11 HSE10 E10 EDE10 E11
HME11 E12 HTE11 E14 RTE11 E13 OFE11 E15 HSE11 E10 EDE11 E15
HME12 E26 HTE12 E23 RTE12 E14 OFE12 E13 HSE12 E17 EDE12 E13
HME13 E28 HTE13 E16 RTE13 E23 OFE13 E14 HSE13 E15 EDE13 E14
HME14 E29 HTE14 E27 RTE14 E16 OFE14 E23 HSE14 E13 EDE14 E23
HME15 E37 HTE15 E20 RTE15 E27 OFE15 E16 HSE15 E14 EDE15 E16
HME16 E33 HTE16 E22 RTE16 E20 OFE16 E24 HSE16 E23 EDE16 E27
HME17 E33 HTE17 E25 RTE17 E21 OFE17 E27 HSE17 E16 EDE17 E20
HME18 E34 HTE18 E26 RTE18 E22 OFE18 E20 HSE18 E27 EDE18 E21
HME19 E41 HTE19 E28 RTE19 E25 OFE19 E21 HSE19 E20 EDE19 E22
HME20 E42 HTE20 E36 RTE20 E18 OFE20 E22 HSE20 E21 EDE20 E25
HME21 E40 HTE21 E30 RTE21 E26 OFE21 E25 HSE21 E22 EDE21 E26
HME22 E43 HTE22 E31 RTE22 E28 OFE22 E26 HSE22 E25 EDE22 E28
HME23 E44 HTE23 E32 RTE23 E33 OFE23 E17 HSE23 E19 EDE23 E33
HME24 E45 HTE24 E29 RTE24 E33 OFE24 E33 HSE24 E26 EDE24 E33
HTE25 E33 RTE25 E33 OFE25 E33 HSE25 E28 EDE25 E34
HTE26 E33 RTE26 E34 OFE26 E34 HSE26 E30 EDE26 E34
HTE27 E33 RTE27 E38 OFE27 E34 HSE27 E31 EDE27 E34
HTE28 E34 RTE28 E41 OFE28 E34 HSE28 E32 EDE28 E34
HTE29 E34 RTE29 E42 OFE29 E34 HSE29 E33 EDE29 E41
HTE30 E41 RTE30 E35 OFE30 E42 HSE30 E33 EDE30 E42
HTE31 E42 RTE31 E43 OFE31 E43 HSE31 E33 EDE31 E43
HTE32 E43 RTE32 E44 OFE32 E44 HSE32 E34 EDE32 E44
HTE33 E44 RTE33 E45 OFE33 E45 HSE33 E34 EDE33 E45
HTE34 E45 RTE34 E09 HSE34 E34
RTE35 E39 HSE35 E41
HSE36 E42
HSE37 E43
HSE38 E44
HSE39 E45

TABLE OF CONTENTS
© International Finance Corporation 2019. All rights reserved. EDGE User Guide 13
Table 2. Look-up table for Water Measures in EDGE App mapped to the Location in the User Guide
HOMES HOSPITALITY RETAIL OFFICES HOSPITALS EDUCATION User
Guide
Location App
Measure#
User
Guide
Location EDGE App
Measure# User Guide
Location EDGE App
Measure#
User
Guide
Location App
Measure#
User
Guide
Location
EDGE
App
Measure#
User
Guide
Location
EDGE
App
Measure#
WATER EFFICIENCY MEASURES
HMW01 W01 HTW01 W01 RTW01 W03 OFW01 W02 HSW01 W01 EDW01 W01
HMW02 W05 HTW02 W02 RTW02 W04 OFW02 W03 HSW02 W02 EDW02 W02
HMW03 W02 HTW03 W03 RTW03 W02 OFW03 W04 HSW03 W03 EDW03 W03
HMW04 W03 HTW04 W08 RTW04 W05 OFW04 W05 HSW04 W04 EDW04 W04
HMW05 W03 HTW05 W04 RTW05 W07 OFW05 W10 HSW05 W07 EDW05 W05
HMW06 W13 HTW06 W03 RTW06 W06 OFW06 W13 HSW06 W06 EDW06 W10
HMW07 W14 HTW07 W02 RTW07 W11 OFW07 W14 HSW07 W05 EDW07 W13
HMW08 W15 HTW08 W07 RTW08 W10 OFW08 W15 HSW08 W09 EDW08 W11
HTW09 W06 RTW09 W13 HSW09 W11 EDW09 W12
HTW10 W05 RTW10 W14 HSW10 W10 EDW10 W14
HTW11 W11 RTW11 W15 HSW11 W13 EDW11 W15
HTW12 W12 HSW12 W14
HTW13 W10 HSW13 W15
HTW14 W13
HTW15 W14
HTW16 W15
Table 3. Look-up table for Materials Measures in EDGE App mapped to the Location in the User Guide
HOMES HOSPITALITY RETAIL OFFICES HOSPITALS EDUCATION
User
Guide
Location
App
Measure#
User
Guide
Location
EDGE App
Measure#
User Guide
Location
EDGE App
Measure#
User
Guide
Location
App
Measure#
User
Guide
Location
EDGE
App
Measure#
User
Guide
Location
HMM01 M01 HTM01 M01 RTM01 M01 OFM01 M01 HSM01 M01 EDM01 M01
HMM02 M02 HTM02 M02 RTM02 M02 OFM02 M02 HSM02 M02 EDM02 M02
HMM03 M03 HTM03 M03 RTM03 M03 OFM03 M03 HSM03 M03 EDM03 M03
HMM04 M04 HTM04 M04 RTM04 M04 OFM04 M04 HSM04 M04 EDM04 M04
HMM05 M05 HTM05 M05 RTM05 M05 OFM05 M05 HSM05 M05 EDM05 M05
HMM06 M06 HTM06 M06 RTM06 M06 OFM06 M06 HSM06 M06 EDM06 M06
HMM07 M07 HTM07 M07 RTM07 M07 OFM07 M07 HSM07 M07 EDM07 M07
HMM08 M08 HTM08 M08 RTM08 M08 OFM08 M08 HSM08 M08 EDM08 M08

ACRONYMS
© International Finance Corporation 2019. All rights reserved. EDGE User Guide 14
ACRONYMS
AHU Air Handling Unit
ARI Air-conditioning and Refrigeration Institute
ASHRAE American Society of Heating Refrigerating and Air-conditioning Engineers
Btu British thermal unit
cfm Cubic feet per minute (ft³/min)
COP Coefficient of Performance
EDGE Excellence in Design for Greater Efficiencies
HVAC Heating, Ventilation and Air-conditioning
kW Kilowatt
kWh Kilowatt-hour
ppm Parts per million
SC Shading Coefficient
SHGC Solar Heat Gain Coefficient
sqm Square Meter
STP Sewage Treatment Plant
TR Tonnage of Refrigeration
VLT Visible Light Transmission
VAV Variable Air Volume
VFD Variable Frequency Drive
VSD Variable Speed Drive
W Watt
Wh Watt-hour
WFR Window-to-Floor Ratio
WWR Window-to-Wall Ratio

INTRODUCTION
© International Finance Corporation 2019. All rights reserved. EDGE User Guide 15
INTRODUCTION
About EDGE (“Excellence in Design for Greater Efficiencies”)
EDGE is a green buildings platform that includes a green building standard, a software application, and a
certification program for more than 150 countries. The platform is intended for anyone who is interested in the
design of a green building, whether an architect, engineer, developer or building owner.
EDGE empowers the discovery of technical solutions at the early design stage to reduce operational expenses
and environmental impact. Based on the user’s information inputs and selection of green measures, EDGE
reveals projected operational savings and reduced carbon emissions. This overall picture of performance helps
to articulate a compelling business case for building green.
The suite of EDGE building types includes Homes, Hospitality, Retail, Offices, Hospitals, and Education buildings.
EDGE can be used to certify buildings at any stage of their life cycle; this includes concept, design, new
construction, existing buildings, and renovations.
EDGE is an innovation of IFC, a member of the World Bank Group.
A Global Green Standard
To achieve the EDGE standard, a building must demonstrate a 20% reduction in projected operational energy
consumption, water use and embodied energy1 in materials as compared to typical local practices. EDGE defines
a global standard while contextualizing the base case to the building functions and its location.
Only a handful of measures are required for better building performance that result in lower utility costs,
extended equipment service life, and less pressure on natural resources.
The EDGE Perspective
Rather than relying on complex simulation software and processes to predict resource use, EDGE has an easy-
to-use interface that runs on a powerful building physics engine with region-specific data. Through user inputs,
the data can be further refined to create a nuanced set of calculations that have greater accuracy when
predicting future building performance. EDGE focuses intently on resource efficiency and climate change
mitigation, recognizing that too wide of a focus leads to disparate results.
The intent of EDGE is to democratize the green buildings market, which was previously reserved for higher-end
buildings standing in relative isolation in primarily industrialized nations. Government regulations in emerging
economies rarely require resource-efficient building practices. EDGE aims to create a new path for green growth
by proving the financial case in a practical, action-oriented way that emphasizes a quantitative approach. This
approach closes the gap between non-existent or weakly-enforced green building regulations and expensive
international standards. It realizes the potential to lower utility costs while reducing GHG emissions.
1 Embodied energy is the energy required to extract and manufacture the materials required to construct and maintain the
building.

INTRODUCTION
© International Finance Corporation 2019. All rights reserved. EDGE User Guide 16
EDGE Methodology
At the heart of EDGE is a performance calculation engine that harnesses a set of mathematical equations based
on the principles of climatology, heat transfer and building physics. Upon receiving design inputs, the calculator
charts a building’s potential performance in the areas of energy, water and materials. As markets mature, the
underlying data in the calculator will be further sharpened, ensuring EDGE becomes more granular and up-to-
date.
Energy consumption is predicted using a quasi-steady state model (refer to the EDGE Methodology). The quasi-
steady state calculation methodology is based on the European CEN standards and ISO 13790. A similar
approach has been taken by energy efficiency building codes (e.g. COMcheck in the U.S., Simplified Building
Energy Model [SBEM] and SAP in the UK) and Energy Performance Certificates (EPCs in the EU) to find a quick
and cost-effective way to benchmark buildings and to quantify carbon emission reductions. In the future,
accredited dynamic simulation models will also be an acceptable means of demonstrating compliance with the
EDGE standard.
To determine the base case parameters for efficiency in each of the required areas, EDGE relies on information
on typical building practices and national building performance codes, where they exist. For example, if an
energy efficiency code (EEC) is enforced in a certain country, such as China or South Africa, then it is used to
support the base case calculation. Typical efficiencies for heating, ventilation and air conditioning systems are
based on the ASHRAE 90.1-2007 standard without amendments.
This quasi-steady-state model considers thermal mass within the calculation, using the method detailed in ISO
13790:2008(E), Section 12.3.1.1, in which the heat capacity of the building (J/ºK) is calculated by summing the
heat capacities of all the building elements facing directly into the interior of the building. However, this
calculation is not a detailed thermal mass calculation (as might be possible using hourly simulation software).
Rather than suggesting a perfect or prescribed scenario, EDGE provides users with a set of best-practice options
to explore to identify an optimum design solution. In this way, the user determines which bundle of technical
measures is the best choice for their building to reach required efficiency levels.
The purpose of EDGE is to produce consistent and reliable evaluations of resource demand for building
certification purposes. While EDGE assists the design process, it is first and foremost a model for directional
financial comparisons. It should not be used for making decisions that require a finer level of detail. If the
performance of a particular feature is critical to the project, then using an appropriate modelling tool would be
prudent. For example, EDGE should not be used for system sizing, or precise payback calculations for financial
decision-making.
EDGE uses the best available information on global or local averages as default values. The EDGE database is
updated on an ongoing basis as new and better information becomes available. To share updates with the EDGE
Team, such as local rates for energy and water, please send relevant documentation to [email protected].
EDGE Certification
EDGE certification is awarded if the required minimum efficiencies are achieved. A simple pass/fail system
indicates whether the building project has demonstrated the minimum 20% savings in operational energy,
water and embodied energy in materials compared to the base case model. Actual percentage savings for each
project can be seen on the EDGE certificate as well as in project case studies on the EDGE website.

INTRODUCTION
© International Finance Corporation 2019. All rights reserved. EDGE User Guide 17
Requirements for EDGE compliance, at both the design and post-construction phases, are specified for each
measure in this guide, and include such deliverables as design drawings, manufacturers’ data sheets,
calculations, proof of delivery and photographs. A design review is required for preliminary certification and a
site audit is required for the final EDGE certification, with both conducted by an accredited EDGE Auditor.
Certification is awarded by a licensed EDGE certification provider. EDGE certification makes a statement of
corporate excellence and environmental responsibility.
EDGE Software (Version 2) is optimized for the following:
▪ Browser (the following versions or higher): IE10, Firefox 30, Chrome 35 or Safari 5.1
▪ Operating System: Windows 7 or higher, or Mac OS
▪ Screen Resolution: Viewed best at 1680 X 1050 pixels
▪ Limited functionality is available on iPhones, Androids, and tablets
An Innovation of IFC
EDGE is an innovation of IFC, a member of the World Bank Group.
IFC
2121 Pennsylvania Avenue, NW
Washington, DC 20433
www.edgebuildings.com

EDGE CERTIFICATION GUIDANCE
© International Finance Corporation 2019. All rights reserved. EDGE User Guide 18
EDGE CERTIFICATION GUIDANCE
Project Team/EDGE Experts
The project team or EDGE Experts demonstrate that the specifications for individual measures meet the
minimum performance required for the improved case by providing the following:
▪ A brief explanation of the relevant system or product specified/installed.
▪ Calculations that have been used to assess and demonstrate compliance.
▪ Manufacturer’s data sheets, with the information required to demonstrate compliance highlighted.
▪ Proof that the specified system or product has been installed.
From the perspective of their interaction with the EDGE software, four distinct user roles are typical within an
EDGE project team. A Project Owner is the designated owner or owner’s representative responsible for the
entire project. This person can assign or remove any user role and create/edit/delete projects in the EDGE
software. A Project Admin is the EDGE Expert or a trained EDGE user who manages the certification flow of the
project on behalf of the client. A Project Editor is typically someone from the design team who can edit the
project details and documentation. A Project Viewer can track the project progress without the ability to edit.
EDGE Auditors
The EDGE auditor verifies that the design/construction team has interpreted the EDGE requirements correctly
and that all compliance requirements have been fulfilled. The supporting evidence provided is reviewed to
ensure it matches the data used in the assessment. Auditors must verify 100% of the floor area for a unique
design for any building type. In the case of repetition in design, an auditor must verify the following at a
minimum:
• Homes: (square root of the number of units) +1 for each type
• Hospitality or Health: (square root of the number of rooms) +1 for each type
• Retail, Offices or Education: 40% of similar areas for a project
• Multiple buildings of same type: (square root of the number of buildings) +1 for each type
Photographs used as evidence must be taken by the auditor during the site visit and include a date stamp.
EDGE Certifiers
The certification process involves auditing of the project documentation submitted by the project team, followed
by the award of the certificate. Designated EDGE certifiers oversee the auditors and issue the EDGE certificates.
Certification is done through the EDGE software online. The project team must apply for certification online
through the EDGE software application. To begin, the project administrator or their consultant EDGE Expert may
‘Express Interest’ to request a quote from local auditor(s) and the certification provider via the EDGE buildings
website. Or, a project may choose to ‘Register’ in the EDGE App. More information on the certification steps is
available on the ‘Certify’ page at www.edgebuildings.com.

EDGE CERTIFICATION GUIDANCE
© International Finance Corporation 2019. All rights reserved. EDGE User Guide 19
EDGE Assessment and Certification Definitions
▪ A building is defined as a conditioned (heated or cooled) or naturally ventilated structure with at
least one full time equivalent occupant, and a minimum building area of 200m².
▪ A single home is a detached single-family home. There is no minimum area requirement.
▪ A single building is a physically separate structure. If two buildings are connected by a
conditioned space, then they can be considered as a single building.
▪ Area limits for mixed-use buildings: If a building has more than one use and the secondary use
occupies less than 10% of the floor area up to a maximum of 1,000m², the entire building can be
certified under the primary use of the building. If the area of secondary use is more than 10% of
the floor area or more than 1,000m2, then that portion must be certified separately. For example,
if a 10,000m² residential building has a retail portion of 1,200m² located within the ground floor,
the building areas must be certified separately under the Homes and Retail typologies.
▪ Multiple buildings: When one project (such as a housing development) with a single owner
consists of several buildings, buildings of less than 10% of the floor area of the project up to a
maximum of 1,000m2 with the same use may be clustered together as a single building. Buildings
larger than 10% of the project floor area or more than 1,000m2 must be considered as separate
buildings. In residential projects, however, each individual unit would receive an EDGE
certificate, not the overall building. When multiple types of units are present, each unit type in the
project is assessed separately.
▪ Project: A Project is defined as the whole building or development submitted for EDGE
certification with the same certifier and owner. For example, a Project may be a residential
building with two towers, a mixed-use building with offices and retail space, or multiple buildings
with the same specifications in a city or country. The information in the Project section in EDGE is
the top-level information that applies to the whole project.
▪ Subproject: A Subproject is each portion of the Project modeled individually in EDGE. The
information contained in the Subproject section applies only to the portion being modeled in that
file. For example, a Subproject may be Unit Type 1 in a residential building, the retail space in a
mixed-use tower, or an individual location for a chain of stores.
Grouping Logic for Residential Units (the 10% rule)
The 10% rule governs which residential units can be grouped together and modeled as a single unit type in
EDGE.
RULE: For any representative residential unit in EDGE, the actual area of the represented unit must be within
10% of the modeled area (± 10%). If the area of a unit differs from the average by more than 10%, it must be
modeled separately.
Example 1: Half the units in a project are Unit Type A (85 m2) and the other half are Unit Type B (95 m2). The
average area of these two is 90 m2/unit. The areas of Unit Types A and B are within 10% of 90 m2, so Unit
Types A and B can be modeled together in EDGE as, say, Unit Type 1 with an area of 90 m2/unit.
EDGE CERTIFICATION GUIDANCE
© International Finance Corporation 2019. All rights reserved. EDGE User Guide 20
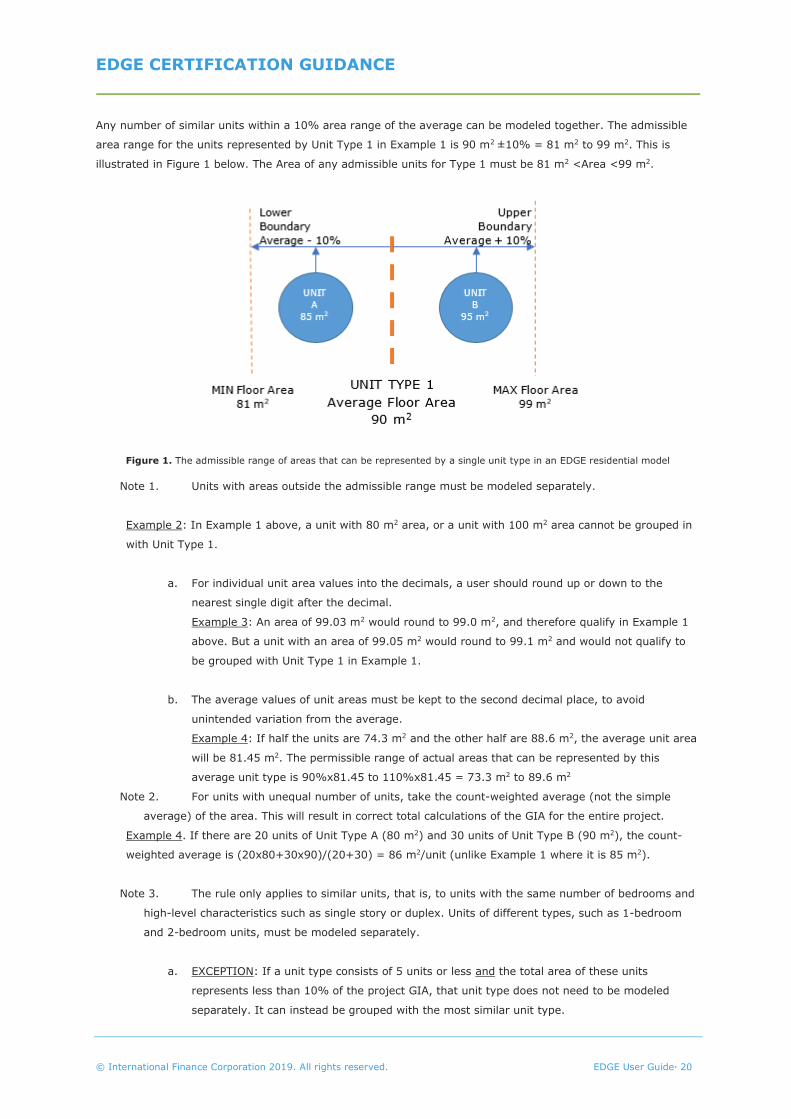
Any number of similar units within a 10% area range of the average can be modeled together. The admissible
area range for the units represented by Unit Type 1 in Example 1 is 90 m2 ±10% = 81 m2 to 99 m2. This is
illustrated in Figure 1 below. The Area of any admissible units for Type 1 must be 81 m2 <Area <99 m2.
Figure 1. The admissible range of areas that can be represented by a single unit type in an EDGE residential model
Note 1. Units with areas outside the admissible range must be modeled separately.
Example 2: In Example 1 above, a unit with 80 m2 area, or a unit with 100 m2 area cannot be grouped in
with Unit Type 1.
a. For individual unit area values into the decimals, a user should round up or down to the
nearest single digit after the decimal.
Example 3: An area of 99.03 m2 would round to 99.0 m2, and therefore qualify in Example 1
above. But a unit with an area of 99.05 m2 would round to 99.1 m2 and would not qualify to
be grouped with Unit Type 1 in Example 1.
b. The average values of unit areas must be kept to the second decimal place, to avoid
unintended variation from the average.
Example 4: If half the units are 74.3 m2 and the other half are 88.6 m2, the average unit area
will be 81.45 m2. The permissible range of actual areas that can be represented by this
average unit type is 90%x81.45 to 110%x81.45 = 73.3 m2 to 89.6 m2
Note 2. For units with unequal number of units, take the count-weighted average (not the simple
average) of the area. This will result in correct total calculations of the GIA for the entire project.
Example 4. If there are 20 units of Unit Type A (80 m2) and 30 units of Unit Type B (90 m2), the count-
weighted average is (20x80+30x90)/(20+30) = 86 m2/unit (unlike Example 1 where it is 85 m2).
Note 3. The rule only applies to similar units, that is, to units with the same number of bedrooms and
high-level characteristics such as single story or duplex. Units of different types, such as 1-bedroom
and 2-bedroom units, must be modeled separately.
a. EXCEPTION: If a unit type consists of 5 units or less and the total area of these units
represents less than 10% of the project GIA, that unit type does not need to be modeled
separately. It can instead be grouped with the most similar unit type.

EDGE CERTIFICATION GUIDANCE
© International Finance Corporation 2019. All rights reserved. EDGE User Guide 21
Example 5: A building has 300 units of which 297 units are 2-bedroom units of assorted sizes,
and only 3 units are one-bedroom units. In this case, the one-bedroom units may be grouped
with the most similar 2-bedroom units.
Steps to Calculate and Test the Average Unit Area
Step 1 Calculate the weighted average.
Example 6. A project has 40 units of 3 different types as shown in the table below.
The weighted average area per unit is:
𝑛1𝐴1 + 𝑛2𝐴2 + 𝑛3𝐴3
𝑛1 + 𝑛2 + 𝑛3
or
(10x86+20x92+10x100)/(10+20+10) = 92.5 m2/unit
Step 2 Calculate the acceptable range to determine whether the units can be grouped together.
In Example 6 above, the acceptable range can be determined as follows:
Minus 10% from the average value of 92.5 m2 equals 90% x 92.5 = 83.3 m2
Plus 10% to the average value of 92.5 m2 equals 110% x 92.5 = 101.8 m2
83.3 ≤ 86, 92, and 100 ≤ 101.8 is TRUE
Conclusion: Type A, Type B and Type C units in Example 6 are larger than 83.3 m2 and smaller than
101.8 m2. Therefore, they are within the acceptable range and can be grouped as one Unit type in
EDGE.
Example 7. Type A units are 10 units of 80 m2, and Type B are 10 units of 100 m2
Average = (10x80+10x100)/(10+10) = 90 m2
Acceptable range of unit areas:
Minus 10% from 90 m2 equals 90% x 90 = 81 m2
Plus 10% of 90 m2 equals 110% x 90 = 99 m2
81 ≤ 80 and 100 ≤ 99 is FALSE
Conclusion: The areas of Type A and Type B units are outside the acceptable range and therefore the
units cannot be grouped together in EDGE.
Unit Count (n) Unit Area (A) (m2)
Unit A 10 86
Unit B 20 92
Unit C 10 100

EDGE CERTIFICATION GUIDANCE
© International Finance Corporation 2019. All rights reserved. EDGE User Guide 22
Note: The related input for the ‘External Wall Length /Unit’ has a significant impact on results and must be
represented correctly. It must be calculated by taking a weighted average of the exterior wall lengths for the
units being modeled together.
Core and Shell Projects
Core and Shell projects are projects where the owner is responsible for the building exterior (“shell”) and the
core facilities (“core”), but the interior areas are constructed by the tenants (“fit out”). For Core and Shell
projects, measures such as interior lighting for which the tenants are responsible can be claimed in EDGE only if
a “tenant fit-out guide” is included in the lease agreement and signed between the tenants and owners. This
tenant fit-out guide must define the requirements to be fulfilled by the tenants for each measure, and be
included in the EDGE submission. If all tenants have not signed a lease at the time of EDGE certification, the
building owner must show EDGE compliance by providing the template of the lease agreement accompanied by
a signed letter stating that the tenant fit-out guide in the template lease agreement will be included in all tenant
lease agreements signed for the building.
This type of agreement is typically applied to spaces for rent. However, the same principle can be applied to
projects for sale in certain conditions. For example, when there is a local requirement for the developer to
provide a warranty to the new owners along with a User Manual, the developer can specify the efficiency
requirements of electric fixtures and appliances in the User Manual as a condition for maintaining the warranty.
Existing Building Projects
Existing buildings may apply for EDGE certification. The same standards apply to existing buildings as for new
construction. Materials in existing buildings that are being retained in the building or re-used and are older than
five years may be claimed as “re-used”. (This applies to re-use of materials older than five years in new
construction as well). To claim a building as existing and/or to claim re-use of materials, the project team must
provide documentation from the formal local source that shows the date when the building was constructed or
last modified. For example, the formal source in a location may be a building department and the documents
may be drawings stamped by the building department. Pictures of the existing building and materials should
also be provided as evidence. Guidance on inputs for Existing Buildings in specific fields in the EDGE App is
provided in the description of the respective fields. This guidance may be viewed by conducting a text search for
the word ‘existing’ in this User Guide.
Partial Building Projects
A part of a building may apply for EDGE certification. For example, a store in a mall or an office in an office
building can apply for EDGE certification. If that space is served by a central HVAC system, the EDGE
application can document the specifications of the whole building HVAC systems. If the space is served by a
stand-alone system, only that system must be documented. For the envelope, the wall lengths, materials, and
WWR ratio should represent the actual space applying for certification. Only those exterior facades must be
included that are directly in contact with/enclosing the part of the building applying for the EDGE certification.
For example, if there is no exterior façade on the east side because the applicant part of the building is attached
to the rest of the building on that side, then, the east façade length must be marked as 0.01 m. The same logic
applies all the way around. It is possible to have a portion of a building with No exterior walls apply for EDGE, in

EDGE CERTIFICATION GUIDANCE
© International Finance Corporation 2019. All rights reserved. EDGE User Guide 23
which case All exterior facades will be marked as 0.01. This will ensure that the heat transfer and therefore,
energy performance of the applicant building portion is calculated correctly.
Social Housing Projects
Social housing projects are at times provided without finished floors or bathrooms fittings in second bathrooms.
For such projects, EDGE makes the following exceptions: (1) Unfinished floor areas can use the EDGE default
flooring (ceramic tile), and (2) Bathrooms without fixtures can be ignored for Water measures. However, the
bathrooms that do have fittings must have low-flow fixtures to claim the corresponding EDGE measures, as is
normally the case. In addition, EDGE encourages developers to provide literature (such as product brochures)
on low-flow fittings to prospective apartment buyers through the sales office.
Special Ruling Request (SRR)
A Special Ruling Request (SRR) is a mechanism for project development teams to request a Special Ruling from
the Certifier on the eligibility of a method or procedure not outlined in the EDGE App to determine the
compliance of a measure. This is applicable for situations where project development teams may want to (1)
use an alternative method to comply with the intent of an EDGE Measure, or (2) use innovative strategies not
included in the available EDGE Measures to reduce resource consumption in Energy, Water or Materials. The
SRR form formally documents for audit purposes that a project development team has received special
permission from IFC’s EDGE team to use an out-of-the-norm procedure for claiming measure savings in the
EDGE App. Actual compliance with the intent of the measure will still be subject to an audit.
Note that the SRR is a means of formal documentation for audit purposes only. In general, the EDGE User
Guides and the Frequently Asked Questions available on the EDGE website serve as a starting point for
questions related to the EDGE certification of projects. Further questions about EDGE project measures and
certification can be directed to the respective EDGE Certification Provider selected for the project. In addition,
the IFC EDGE team is available to help at [email protected].
When a project team has gone through the steps above and still needs documentation of approval for an
atypical approach to its project, it can request a Special Ruling Request form from the certifier. In other words,
the intent of the SRR is quite specific to special cases or alternate methods to achieve compliance with the
intent of a measure -- that is, a method that is not covered in the User Guide, or an innovative measure not
available in the EDGE measures list. For example, an SRR would be required for using an alternate tool outside
EDGE to calculate the Average Annual Shading Factor (AASF) or to calculate the savings from an evaporative
cooler or a VRF system with heat recovery. It is project specific. When the content is universally applicable, it
will be added to the User Guide and not require an SRR for compliance anymore.

DESIGN PAGE GUIDANCE
© International Finance Corporation 2019. All rights reserved. EDGE User Guide 24
DESIGN PAGE GUIDANCE
The EDGE software opens in the Homes building type by default. Select the appropriate building type for your
model from the top-level tabs.
Start from the Design section to build the base case for the building.
Saving a Project
Users may save their projects within the EDGE software to retrieve upon login. A user account is required to
save a project file. Fields marked with an asterisk* are also required to save the project file.
EDGE can be accessed via handheld devices such as iPhones, Androids and tablets. Exercise caution when
accessing saved projects via handheld devices as EDGE automatically saves changes to projects every three
minutes.
If a user is not active on EDGE for 20 minutes, the system will log the user out and any unsaved changes will be
lost.
To create multiple versions of a project with different combinations of measures, it is best to retain your inputs
by downloading the data into separate PDFs and saving the documents on your computer (File > Download
PDF). In this way, you maintain one project file for your building within EDGE.
Project Details
A Project is defined as the whole building or development submitted for EDGE certification with the same
certifier and owner. For example, a Project may be a residential building with two towers, a mixed-use building
with offices and retail space, or multiple buildings with the same specifications in a city or country. The
information in the Project section in EDGE is the top-level information that applies to the whole project.
This section contains the top-level information about the Project, such as owner name and contact information,
and is shared across a Project’s Subprojects. Changes to the Project Details section are automatically reflected
in Subproject files. This section must be completed to submit the project for audit and certification.
▪ Project Name* – The name of the development. Note that this is a required field that serves as the
project identifier. To edit the project name after saving, go to File > Rename on the Design tab.
▪ Number of Distinct Buildings – The number of physical buildings that make up the whole project. This
field is part of the project description that helps an auditor or reviewer understand the physical make-
up of a project. This field helps account for the “number of buildings” certified by EDGE in a client’s or
auditor’s portfolio. This value will be 1 for a single building, or for towers with a shared podium level.
The value in this field is for information purposes only and is intended to help visualize the building
during the quotation and certification process. The value does not get multiplied by the Gross Internal
Area, unlike the “Subproject Multiplier for the Project” (see the description of that field below under
Subproject Details).
▪ Number of EDGE Subprojects Associated – The total number of files associated with the Project. EDGE
calculates this automatically based on the associations established by the user; therefore, this field is
not editable by the user.

DESIGN PAGE GUIDANCE
© International Finance Corporation 2019. All rights reserved. EDGE User Guide 25
▪ Total Project Floor Area – The total square meters of internal area of the Project, including any indoor
parking. The Total Project Floor area does not include areas outside the building(s) envelope, such as
landscaped areas (gardens, patios, etc.) or outdoor parking areas. This is the sum of the Gross
Internal Areas of all the associated Subprojects within the Project. EDGE calculates this automatically
based on the areas and the multipliers (explained under “Subproject Multiplier for the Project”)
assigned to each Subproject by the user; therefore, this field is not editable by the user.
▪ Project Owner Name* – The name of the key contact from the company/organization that
commissioned the EDGE assessment.
▪ Project Owner Email* – The email address of the key contact from the company/organization that
commissioned the EDGE assessment.
▪ Project Owner Phone* – The phone number of the key contact from the company/organization that
commissioned the EDGE assessment.
▪ Address Line 1 – Primary street address of the project.
▪ Address Line 2 – Any additional details for the street address, such as the building number.
▪ City – The city where the project is located.
▪ State/Province – The state or province where the project is located.
▪ Postal Code – The postal code where the project is located.
▪ Country – The country where the project is located.
▪ Project Number – This will be a system-assigned number, similar to the File Number currently in use.
▪ Upload project-level documents – This links to a space to upload whole project-level documents, for
example, a site plan of the project.
▪ Download project audit documents – Clicking on this link downloads the entire set of project
documents that have been uploaded thus far. Documents for individual measures are placed in their
respective folders. This allows a project team member to access any project document from one
central location. This link is also used by the EDGE Auditor for project documentation review.
▪ “Register” button – The Register button in the Project section in the Design tab now allows a whole
project to be registered as one entity and triggers a quotation to be sent.
▪ “Associated Subprojects” – This link in the Project Details section expands to show all the Subprojects
associated with that Project in addition to the Subproject currently open in the EDGE App.

DESIGN PAGE GUIDANCE
© International Finance Corporation 2019. All rights reserved. EDGE User Guide 26
Subproject Details
A Subproject is each portion of the Project modeled individually in EDGE. The information contained in the
Subproject section applies only to the portion being modeled in that file. For example, a Subproject may be Unit
Type 1 in a residential building, the retail space in a mixed-use tower, or an individual location for a chain of
stores.
This section contains fields associated only with the portion of the Project being described in the current file.
▪ Subproject Name* – The portion of the project being modeled. For example, Residential tower, office,
or warehouse. This is a required field.
▪ (Building) Name* – The name of the building being modeled. The field name varies by building type.
For example, in Homes it is the ‘House or Apartment Block Name’ and in Hospitality, it is the ‘Property
Name’. This is a required field.
▪ Subproject Multiplier for the Project – This input represents the number of times the building portion
modeled in a file is repeated in the Project. For example, consider that a residential development has
forty (40) identical detached 2-bedroom homes (Home Type 1), and two identical towers with twenty
five (25) similar-sized 3-bedroom apartments each (Home Type 2). The Subproject file for Home Type
1 will contain the information – such as physical characteristics including the average area and exterior
wall lengths – of only one 2-bedroom home; the “Subproject Multiplier for the Project” in this case
must have the value “40” to account for the total floor area in the project. Similarly, the Subproject file
for Home Type 2 will contain the information – such as physical characteristics including the average
area and exterior wall lengths – of only one tower which includes 25 3-bedroom units; the “Subproject
Multiplier for the Project” in this case must have the value “2” to correctly account for the project’s
total floor area. These values are critical to correctly capture the “Total Project Area.”
▪ Certification Stage* – The stage of certification of the project. Enter “Preliminary” for projects in the
design stage of new construction or renovation. Enter “Post-Construction” for new construction or
renovation projects that have completed construction and are ready for the final verification phase of
certification. For existing buildings applying for certification, enter “Post-Construction” from the very
beginning of the certification process, regardless of the length of time elapsed since construction. For
example, an existing project built one month ago, or ten years ago, would both enter “Post-
Construction”. This is a required field.
▪ Do you intend to certify?* – Select Yes, No, or Not Sure, to indicate the intent regarding certification of
the Subproject.
▪ Status – This information field displays the status of the project lifecycle. For example, self-review,
registered etc.
▪ Auditor – This information field displays the Auditor assigned to the project.
▪ Certifier – This information field displays the Certification Provider for the project.

DESIGN PAGE GUIDANCE
© International Finance Corporation 2019. All rights reserved. EDGE User Guide 27
Subproject Address: This is the address that will go on the EDGE certificate. The Subproject Address may or
may not be the same as the Project Address. For example, if a Project has Subprojects in several locations
around a city, each Subproject may have its own address.
▪ Address Line 1* – Primary street address of the subproject.
▪ Address Line 2 – Any additional details for the street address, such as the building number.
▪ City* – The city where the subproject is located.
▪ State/Province – The state or province where the subproject is located.
▪ Postal Code – The postal code where the subproject is located if applicable.
▪ Country* – The country where the subproject is located.
▪ Subproject Type – The stage in the lifecycle of the building. “New Building” must be selected for new
construction and “Existing Building” for existing buildings and renovations.
▪ Year of Construction – This field only applies to Existing buildings. Enter the year the project was
completed, that is, the year the project received the occupancy permit. If the project was completed
before the earliest year available in EDGE, select the earliest year available and add a note in the
Project Narrative section.
Building Utility Data
This section only applies to Existing building projects. The intent of this section is to track the energy
performance and water usage of the existing building that is applying for EDGE certification. The values can be
taken from the most recent past year with full occupancy.
▪ Annual Measured Electricity Consumption – The recorded annual electricity usage of the subproject
being modeled, expressed in kWh/year.
▪ Annual Measured Water Consumption – The recorded annual water usage of the subproject being
modeled, expressed in m3/year.
▪ Annual Measured Natural Gas Consumption – The recorded annual natural gas usage of the subproject
being modeled, expressed in m3/year.
▪ Annual Measured Diesel Consumption – The recorded annual diesel usage of the subproject being
modeled, expressed in kL/year.
▪ Annual Measured LPG Consumption – The recorded annual usage of liquefied petroleum gas (LPG) of
the subproject being modeled, expressed in kg/year.

DESIGN PAGE GUIDANCE
© International Finance Corporation 2019. All rights reserved. EDGE User Guide 28
Location Data
▪ Country – The country in which the project is located. If the actual country of the project location is not
in the EDGE drop-down list, select a country and city that is most similar in climate from the available
options.
▪ City – The city in which the project is located. If the building is in a city which is not included in the
EDGE drop-down list, select the city that is closest in terms of climate. If necessary, overwrite the
defaults under Advanced Settings > Key Assumptions for the Base Case > “Monthly Average Outdoor
Temperature (deg. C)”, “Latitude (deg.)” and “Average Annual Rainfall (mm)”
Basic Parameters
These vary by the building type being modeled. They are described together with the Building Data section
below.
Building Data and Area Details
Building Data fields capture the physical make-up of the buildings in terms of activities, floors and areas by
space type. The fields depend on the building type and may be listed under the sections Basic Parameters or
Building Data.
The Area Details section in the software indicates the area breakdown by activity type. The types of spaces
available in a model also depend on the building type. The comprehensive list of space types is provided below
in alphabetical order for each building type in EDGE. Descriptions are provided only when necessary.
EDGE assigns to each space type in a model a default value (in m²) as a percentage of the gross internal area
based on the type and sub-type of building selected. If the actual area for any space type differs from the
default value, it can be overwritten by providing a value in the “User Entry” field. Please note that zero (0) is
not an acceptable value in EDGE. If a space type does not exist, use a minimal value such as 0.01m² to
overwrite the default.
Homes
▪ Income Category – The income category of the target market for the project. The selected income
category will determine the assumptions EDGE makes on usage patterns, equipment levels, and room
sizes.
▪ Type of Unit –Type of dwelling, i.e. flats/apartments or house
▪ Average Unit Area (m²) – Average internal area of a residential unit including occupied spaces, utility,
balcony, and service shaft attached to a unit. This does not include common areas or external walls,
and partition walls between individual units.
▪ Bedrooms/Unit – Number of bedrooms in a unit.
▪ Floors – Number of floors for the entire area of building that is covered by the assessment. For projects
being modeled in sections with multiple EDGE models, the Floors field must only show the number of

DESIGN PAGE GUIDANCE
© International Finance Corporation 2019. All rights reserved. EDGE User Guide 29
Floors that section represents. For example, if residential units are being modeled separately, the
Floors field must show only the number of Floors for that unit. If a unit type appears on 10 floors, the
value must be 10. If a unit is a duplex, 2 floors must be entered per unit. If the duplex unit appears on
3 floors, the number of floors must be 6.
▪ Units –Number of units within the building that are covered by the assessment. This will be the total
number of units per typology being represented by that model. In the case of identical buildings that
can use the same model, use the multiplier to represent the total units in the Project.
▪ Occupancy (People/Unit) – Average number of people that would typically reside in each dwelling. If
this is unknown, use number of bedrooms + 1. For example, for a 3-bedroom unit, use 3+1 = 4.
Table 4: Area Details in Homes
Homes Indoor Space Type Description
Bedroom A default value (m2) is provided based on the selected income category. If the actual area differs from the default, then enter it here.
Kitchen A default value (m2) is provided based on the selected income category. If the actual area differs from the default, then enter it here.
Living and Dining A default value (m2) is provided based on the selected income category. If the actual area differs from the default, then enter it here.
Bathroom Bathrooms and toilets
Utility, Balcony, Service Shaft The Utility, Balcony, Service Shaft (m²) field is equal to the remaining space required to total the Gross Internal Area (m²). This value is automatically calculated and cannot be overwritten.
Gross Internal Area The Gross Internal Area (m²) field is the sum of the room areas listed directly above, and must equal the Average Unit Area (m²) that the user entered in the Building Data section. If the user’s inputs total a greater amount, then a negative number will appear in the “Utility, Balcony, Service Shaft” which must be corrected by the user. The total area (m²) must be measured from the inside of the external walls. Distances to interior walls are measured on center. This value impacts savings calculations.
External Wall Length (m/Unit) This length is provided by default assuming a ratio of 1.5:1 for the floor length to width. The value represents the average length of the exterior wall of all the similar units being represented in that model. The length must be measured from the inside of the external walls. This value has a significant impact on savings and must be calculated carefully and cross-checked.
Roof Area/Unit (m2) The input for this value is the average roof area for all the units being modeled. For example, if a Subproject file represents 50 units, and only 5 of them have an exterior roof of 100 m2 each, the Roof Area/Unit = (5x100)/50 = 10m2. If a set of units includes only interior units with no exposed roof area, this value should be zero (input 0.01 m2 in EDGE as it does not accept zero)
Window-to-Floor Ratio EDGE calculates a default value for the window to floor ratio. To change this percentage, HME01 in the Energy section must be selected and altered.

DESIGN PAGE GUIDANCE
© International Finance Corporation 2019. All rights reserved. EDGE User Guide 30
Homes Indoor Space Type Description
Common area/Unit (m2) These are the shared spaces in buildings with apartments or multifamily units. For example, corridors, lobby, gymnasium and community rooms. This area is not part of the GIA of the unit type, but contributes to the total project area. The common area of the entire Project should be calculated, divided by the total units in the Project, and the same value input for each Subproject. Parking is not included.
Hospitality
▪ Property Type – Specific type of property, that is hotel or resort or a serviced apartment, based on site
configuration. Hotels assume shorter stays and business use, while Resorts assume longer stays and
vacationer use. Serviced apartments are residential-style furnished apartments with included services
such as maintenance, regular cleaning and laundry for the residents.
▪ Average Occupancy Rate – Annual average percentage of nights that the rooms or units within the
property are occupied by guests.
▪ No. of Units – These fields only apply to Serviced Apartments. The number of units of each type based
on number of bedrooms, or penthouse apartments.
▪ Select the type of amenities and services that the property provides (Irrigated area, laundry, banquet
/conference, breakfast area only (no restaurant), health spa, swimming pool.)
▪ Star Rating of the Hotel – This field only applies to Hotels and Resorts. Industry standard star rating of
the hotel or resort.
▪ Resort Type – Only applies to resorts which may be a single building or spread out over multiple
buildings.
▪ Floors Above Ground – Total number of floors above the ground level.
▪ Floors Below Ground – Total number of floors below the ground level.
▪ Total Guest/Bed Rooms – Total number of guest rooms in the hotel or resort or the number of
bedrooms in a Serviced Apartment.
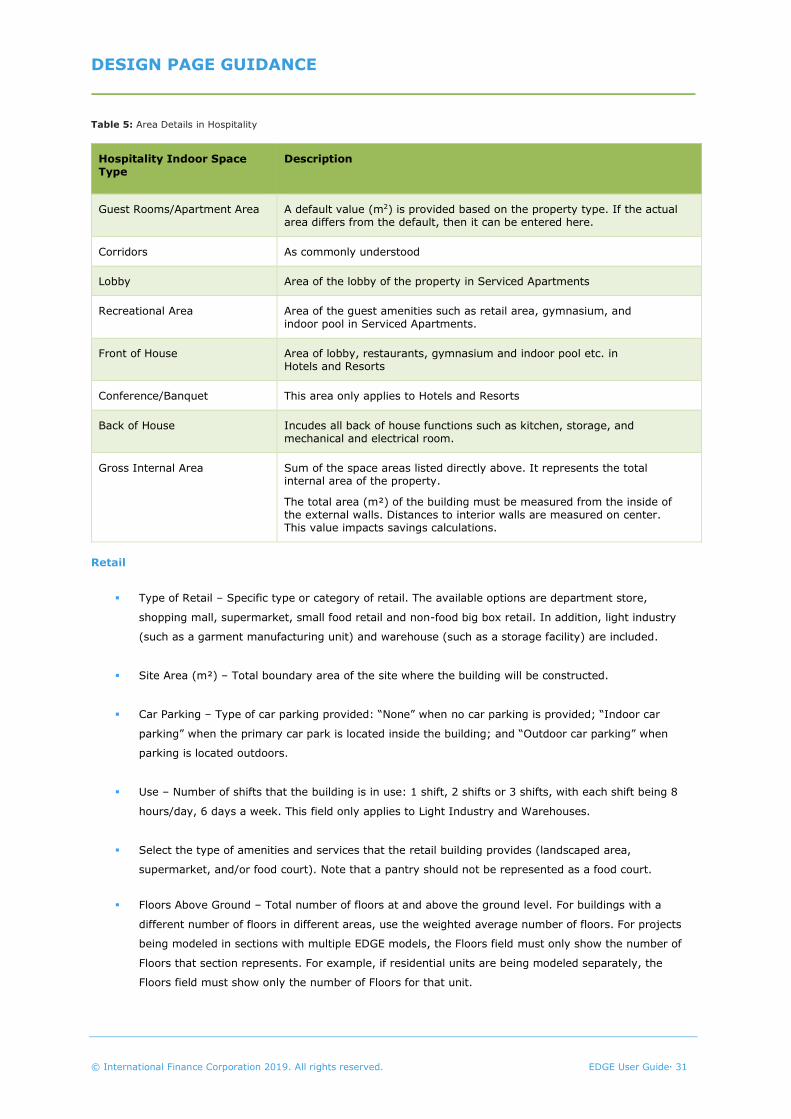
DESIGN PAGE GUIDANCE
© International Finance Corporation 2019. All rights reserved. EDGE User Guide 31
Table 5: Area Details in Hospitality
Hospitality Indoor Space Type
Description
Guest Rooms/Apartment Area A default value (m2) is provided based on the property type. If the actual area differs from the default, then it can be entered here.
Corridors As commonly understood
Lobby Area of the lobby of the property in Serviced Apartments
Recreational Area Area of the guest amenities such as retail area, gymnasium, and indoor pool in Serviced Apartments.
Front of House Area of lobby, restaurants, gymnasium and indoor pool etc. in Hotels and Resorts
Conference/Banquet This area only applies to Hotels and Resorts
Back of House Incudes all back of house functions such as kitchen, storage, and mechanical and electrical room.
Gross Internal Area Sum of the space areas listed directly above. It represents the total internal area of the property.
The total area (m²) of the building must be measured from the inside of the external walls. Distances to interior walls are measured on center. This value impacts savings calculations.
Retail
▪ Type of Retail – Specific type or category of retail. The available options are department store,
shopping mall, supermarket, small food retail and non-food big box retail. In addition, light industry
(such as a garment manufacturing unit) and warehouse (such as a storage facility) are included.
▪ Site Area (m²) – Total boundary area of the site where the building will be constructed.
▪ Car Parking – Type of car parking provided: “None” when no car parking is provided; “Indoor car
parking” when the primary car park is located inside the building; and “Outdoor car parking” when
parking is located outdoors.
▪ Use – Number of shifts that the building is in use: 1 shift, 2 shifts or 3 shifts, with each shift being 8
hours/day, 6 days a week. This field only applies to Light Industry and Warehouses.
▪ Select the type of amenities and services that the retail building provides (landscaped area,
supermarket, and/or food court). Note that a pantry should not be represented as a food court.
▪ Floors Above Ground – Total number of floors at and above the ground level. For buildings with a
different number of floors in different areas, use the weighted average number of floors. For projects
being modeled in sections with multiple EDGE models, the Floors field must only show the number of
Floors that section represents. For example, if residential units are being modeled separately, the
Floors field must show only the number of Floors for that unit.

DESIGN PAGE GUIDANCE
© International Finance Corporation 2019. All rights reserved. EDGE User Guide 32
▪ Floors Below Ground – Total number of floors below the ground level. The same logic applies as for
Floors Above Ground (see immediately above) for a different number of floors in different areas.
▪ Floor-to-Floor height – Total floor-to-floor height, including the height of the slab. In the case of floors
with false ceilings, this height is floor-to-ceiling. Use a weighted average for buildings with varying
floor heights.
▪ Gross Internal Area Including Car Parking (m²) – Total internal area of all the spaces of the retail store. This includes the sales area, storage area, corridors, offices, food court, bathrooms, mechanical and electrical rooms and indoor car parking. Calculate and enter the total area (m²) of the building, which must be measured from the inside of the external walls. Distances to interior walls are measured on center. This value impacts savings calculations.
Table 6: Area Details in Retail
Retail Indoor Space Type Description
Anchor Store Area (Supermarket)
Area of the supermarket. For any other type of anchor store, use the next field.
Anchor Store Area (Other) Area of the anchor store for any anchor store type except a supermarket.
Atrium An entrance hall or central court with a high ceiling. Many shopping mall layouts have an atrium to ventilate and provide natural light to the common areas and corridors of the mall.
Bakery Sales and preparation area including ovens for baked goods.
Bathrooms As commonly understood
Bulk Storage As commonly understood
Car Parking As commonly understood
Cold Storage Area As commonly understood
Controlled Storage Conditioned storage area
Corridors and Lobby As commonly understood
Dispatcher Dispatch area
Dry Storage As commonly understood
Electronics Area Sales area for electronics
Food Court Includes seating area for customers to dine in
Food Sales As commonly understood
Frozen Section Frozen displays
Frozen Storage Frozen back storage
General Sales Area As commonly understood
In-line Store Area Shops in a row in a mall

DESIGN PAGE GUIDANCE
© International Finance Corporation 2019. All rights reserved. EDGE User Guide 33
Retail Indoor Space Type Description
Inventory Area Storage area
Inventory Control Area for checking inventory before it goes to storage
Leisure & Entertainment As commonly understood
Mall Area (Communal Corridors)
Includes the communal corridors in a shopping mall
Mechanical & Electrical Room As commonly understood
Offices Office area
Office Space(s) Area of the offices in the “light industry” and “warehouse” models
Package Assembly As commonly understood
Package Disassembly As commonly understood
Production Area As commonly understood
Rack Storage As commonly understood
Receiving Area As commonly understood
Receiving and Shipping As commonly understood
Refrigerated Area As commonly understood
Shipping Area As commonly understood
Supermarket This option appears in the “department store” model, the “small food retail” model, and the “non-food big box retail” model, and refers to a supermarket within a retail complex. When the entire retail building is a supermarket, the “supermarket” model should be selected instead. In shopping malls, the supermarket is an option as the anchor store.

DESIGN PAGE GUIDANCE
© International Finance Corporation 2019. All rights reserved. EDGE User Guide 34
Offices
▪ Gross Internal Area Excluding Car Parking – The total internal area of the office building. This includes
the offices, conference rooms, corridors, lobby, bathrooms, M&E rooms and food court. Calculate and
enter the total area (m²) of the building, which must be measured from the inside of the external
walls. Distances to interior walls are measured on center. This value impacts savings calculations.
▪ Floors Above Grade – The total number of floors above the ground level.
▪ Floor-to-Floor Height – The total floor-to-floor height, including the height of the slab. Use a weighted
average for buildings with varying floor heights.
▪ Occupancy Density – The typical full-time equivalent occupancy during the occupied hours.
▪ Operational Hours – The typical weekday operational hours.
▪ Working Days – The days of week that the building will be functional.
▪ Holidays - The average number of holidays (not including weekends) during the year.
▪ Food Court – Select if the building has a Food Court. Note that an office pantry does not qualify in this
category.
▪ Cellular Office – Select if the building does not have an open plan system and employees work in
separate rooms.
Table 7: Area Details in Offices
Office Indoor Space Type Description
Open Plan Office (m²) A default value (m2) is provided. If the actual area differs from the default, then enter it here.
Cellular Office (m²) As commonly understood
Corridors (m²) As commonly understood
Conference Rooms (m²) As commonly understood
Lobby (m²) As commonly understood
Bathrooms (m²) As commonly understood
M&E Rooms, Store ** (m²) This field is equal to the remaining space required to total the Gross Internal Area (m²). This value is automatically calculated and cannot be overwritten.

DESIGN PAGE GUIDANCE
© International Finance Corporation 2019. All rights reserved. EDGE User Guide 35
Hospitals
▪ Type of Hospital – Enter the specific type or category of the hospital. Common types of hospitals are
nursing home, private, public and teaching hospitals, multi-specialty hospital, clinic (outpatient),
diagnostic center, eye and dental hospital.
▪ Average Occupancy Rate – Enter the average percentage of rooms within the hospital that are
occupied by patients.
▪ Select the type of amenities and services that the hospital facility provides:
o Irrigated Area - Check the box if the project contains planted area(s) to be irrigated. Enter the
area that needs irrigation.
o Laundry
o Kitchen
▪ Floors Above Grade – Enter the total number of floors above the ground level.
▪ Floors Below Grade – Enter the total number of floors below the ground level.
▪ Floor-to-Floor Height - The total floor-to-floor height, including the height of the slab. Use a weighted
average for buildings with varying floor heights.
▪ Beds - Enter the total number of beds available in the hospital. This does not apply for outpatient
hospitals, such as nursing home, clinic (outpatient), diagnostic center, eye and dental hospital.
▪ Gross Internal Area (m²) – Enter the internal area of all the spaces of the hospital, including patient
areas, operating and consultation rooms, offices, corridors, special rooms (i.e. ICU), mechanical and
electrical and services (i.e. kitchen or dining). The total area (m²) of the building must be measured
from the inside of the external walls. Distances to interior walls are measured on center. This value
impacts savings calculations. This only applies to outpatient hospitals, such as nursing home, clinic
(outpatient), diagnostic center, eye and dental hospital.
Table 8: Area Details in Hospitals
Hospitals Indoor Space Type Description
Patient Areas - General (m²) As commonly understood
Patient Areas - Specialty Wards (m²)
As commonly understood
Intensive Care Units (ICUs) (m²) As commonly understood
Pre- & Post-Operating Rooms (m²) As commonly understood
Operating Rooms (m²) As commonly understood
Consultation Rooms (m²) As commonly understood
Therapy Rooms (m²) As commonly understood
Diagnostic Services (m²) As commonly understood

DESIGN PAGE GUIDANCE
© International Finance Corporation 2019. All rights reserved. EDGE User Guide 36
Hospitals Indoor Space Type Description
Offices (m²) As commonly understood
Corridors (m²) As commonly understood
Central Sterile Supply Department (m²)
As commonly understood
Mechanical & Electrical Rooms (m²)
As commonly understood
Bathrooms/Storage (m²) As commonly understood
Kitchen & Food Preparation (m²) As commonly understood
Laundry (m²) As commonly understood
Car Parking(m²) As commonly understood
Dining (m²) As commonly understood
Waiting Areas (m²) As commonly understood
Education/Auditorium (m²) As commonly understood
Education
▪ Type of Educational Facility – The specific type or category of educational facility. The available options
are pre-school, school, university, sport facilities and other educational facilities.
o ‘Pre-school’ refers to informal play schools.
o ‘School’ refers to formal schools from elementary to senior years.
o ‘University’ refers to higher education institutions following the school years, such as colleges
and university campuses.
o ‘Sport facilities’ include stadiums and stand-alone gymnasiums.
o ‘Other educational facilities’ may include training centers or places of worship.
▪ Occupancy Density – The ratio of the total enclosed area to the number of students at the facility,
expressed in m2/student.
▪ Operational Hours – The number of hours that the facility is operational on a working day, expressed in
hours per day.
▪ Working Days – The number of days in a typical working week that the facility is operational,
expressed in days per week.
▪ Holidays – The number of days in a year that the facility is closed for holidays, not including weekends.
▪ Select the type of amenities and services that the educational facility provides (irrigated area, and/or
swimming pool).
▪ Floors Above Grade – The total number of floors at and above the ground level.

DESIGN PAGE GUIDANCE
© International Finance Corporation 2019. All rights reserved. EDGE User Guide 37
o For buildings with a different number of floors in different areas, use the weighted average
number of floors.
o For projects being modeled in sections with multiple EDGE models, the Floors field must only
show the number of Floors that section represents. For example, if residential units are being
modeled separately, the Floors field must show only the number of Floors for that unit.
▪ Floors Below Grade – The total number of floors below the ground level. The same logic applies as for
Floors Above Ground (see immediately above) for a different number of floors in different areas.
▪ Floor-to-Floor height – The total floor-to-floor height, including the height of the slab. Use a weighted
average for buildings with varying floor heights.
▪ Gross Internal Area (m²) – The total internal area of all the spaces of the educational facility.
o Calculate and enter the total area (m²) of the building, which must be measured from the
inside of the external walls. Distances to interior walls are measured on center. This value
impacts savings calculations.
o This includes all the spaces covered under the Area Details, such as classrooms, play rooms,
meeting rooms, labs, offices/administration rooms, staff rooms, auditoriums, library,
computer rooms, worship places, corridors, sports room, changing rooms, workshops,
restrooms, cafeteria, other space types, and indoor car parking.
Table 9: Area Details in Education buildings
Education Indoor Space Type Description
Auditoriums As commonly understood
Cafeteria As commonly understood
Changing Rooms Rooms adjacent to the gymnasium or swimming pool for changing clothes, often equipped with showers
Classrooms As commonly understood
Computer Rooms As commonly understood
Corridors As commonly understood
Indoor Car Parking Covered parking area that is part of the educational facility being modeled
Labs Laboratories such as a chemistry lab
Library As commonly understood
Meeting Rooms Area of the rooms used for occasional meetings or conferences
Offices/Administration Rooms Administrative spaces
Other Space Types Any indoor areas not covered by the other categories provided

DESIGN PAGE GUIDANCE
© International Finance Corporation 2019. All rights reserved. EDGE User Guide 38
Play Rooms As commonly understood
Restrooms Area with toilets and washbasins
Sports Rooms Areas for indoor sports such as indoor gymnasiums
Staff Rooms Area for staff to gather for meetings, lunch or events
Workshops Area of the rooms used as workshops such as for carpentry or theater
Worship Places As commonly understood
Building Orientation
This section does not apply to Homes or Hospitality in EDGE version 2. This section applies to Retail, Offices,
Hospitals and Education building types.
The parameters “floor plan depth” and “main orientation” described below are used to estimate the dimensions
and orientation of a building, which will have a direct effect on the energy consumption of the building.
▪ Floor plan depth (m) – This is the average width of the building measured perpendicular to the main
façade of the building. A default value is provided based on a typical aspect ratio. If the actual floor
plan depth differs from the default, then enter it in the User Entry provided.
▪ Main orientation – This is the direction that the longest façade of the building faces. Select the
direction that the building’s longest façade faces from the drop-down menu. EDGE predicts the solar
heating loads based on this orientation, which is reflected as cooling or heating energy in the energy
chart. If the exact details of the dimensions and orientation are available, then complete the User Entry
fields in the Building Lengths section.
▪ Building lengths – Based on the earlier selections and entered total area, the building lengths in each
orientation are provided by default. For most buildings, it is recommended that the user fields under
“building lengths” should be left blank to let the software use default values. The exception is if the
building is a regular box shape with no angles or cut-outs and actual values are known. Then, they can
be entered under Building Lengths in the “User Entry” section. All façade lengths in one orientation
should be added up, e.g. if there are three north facing exterior wall segments, they should be added
up before entering here.
The direction of any façade is the direction that its windows face to the outside when seen from above;
in other words, if a line is drawn perpendicular to the length of the wall with the arrow pointing to the
outside in Plan View, the direction in which the arrow is pointing defines the orientation. For example,
a wall whose windows look out to the north-east has a north-east orientation.
Figure 2. Building orientation

DESIGN PAGE GUIDANCE
© International Finance Corporation 2019. All rights reserved. EDGE User Guide 39
Note that when the building orientation is changed in EDGE, the default Building Lengths are also
swapped automatically. However, if these fields contain User Entries, the Building Lengths are not
swapped automatically; they should be corrected manually if changing the orientation.
Building Systems
The information in this section is used to calculate the improved case performance for the project building.
▪ Does the building design include an AC system? – Select “Yes” if the building will be delivered with an
air conditioning (AC) system, or “No” if air conditioning system will NOT be installed at the time of final
EDGE certification. Air conditioning systems include roof-top units, through-the-wall unitary air
conditioners, packaged air conditioning units and chillers. They do not include ceiling fans or natural
ventilation.
If “No” is selected but EDGE predicts that the building is likely to require cooling, then the cooling load
will be reflected as virtual energy. This is described in the Building Systems section of the Design Page
Guidance.
Does building design include space heating? – Select “Yes” if the building will be delivered with a space
heating system at the time of final EDGE certification, or “No” if heating system will NOT be installed.
Space heating in EDGE refers to building-wide heating systems such as underfloor, radiant, heat-
exchangers, permanent gas heaters, etc. and includes appliance heaters using gas or electricity. Space
heating does not include wood or fossil fuel burning fireplaces.
If “No” is selected but EDGE predicts that the building is likely to require heating, then the heating load
will be reflected as virtual energy. As mentioned previously, this is described in the Building Systems
section of the Design Page Guidance.

DESIGN PAGE GUIDANCE
© International Finance Corporation 2019. All rights reserved. EDGE User Guide 40
Advanced Settings: Key Assumptions for the Base Case
The default values shown under the key assumptions are used to calculate the base case performance of a
building.
EDGE uses the best available information for default values. Since energy and water rates can change with time
or location, EDGE provides users with the ability to update the default values for a project. If any of the values
are overwritten, justification must be provided in the form of supporting documentation, including a link to any
relevant local standards.
It should be noted that certain baseline definition values are locked for general users and only accessible to
admin users. For example, the baseline value for the heating system efficiency is visible but locked. These
values can be updated if a different minimum efficiency is required by the building and energy codes or local
mandates are in place applicable to the project. Please contact the EDGE Team to adjust these values, with
relevant documentation to support the request.
▪ Fuel Used for Electric Generator – The actual fuel used in the project must be selected from the
dropdown menu.
▪ Fuel Used for Hot Water Generation – The actual fuel used in the project must be selected from the
dropdown menu. If a hot water system is not part of the project, “None” must be selected.
▪ Fuel Used for Cooking – The actual fuel used in the project must be selected from the dropdown menu.
▪ Fuel Used for Space Heating – The actual fuel used in the project must be selected from the dropdown
menu. If no space heating is being provided, this selection must be “Electricity.”
▪ % of Electricity Generation Using Diesel – This is the percentage of the annual average electricity
consumption for the building that uses a diesel generator as the source for electricity. Update the value
if the actual electricity generation from diesel is different than the default.
▪ Cost of Electricity – Annual average cost of electricity per kilowatt-hour. The default cost for electricity
appears for the selected country. Update the value if more accurate data is available.
▪ Cost of Diesel Fuel – Annual average cost of diesel per liter.
▪ Cost of LPG/Natural Gas – Annual average cost of natural gas per liter.
▪ Cost of Water – Annual average cost of water per kilo-liter.
▪ CO2 Emissions from Electricity Generation – EDGE provides a default emissions value in grams per
kilowatt-hour (g/kWh) based on World Bank Group-approved emissions factors. Update the value if
better data is available for the electricity grid serving the project location.
▪ Window to Wall Ratio – The proportion of total glazed area including frames to the gross area of the
exterior wall. Glazed area may include windows, doors and curtain walls. Note that the window to wall
ratio in the Key Assumptions reflects local building regulations or typical practice in the selected city.
This value is locked. Contact the EDGE Team to update this baseline percentage if a specific window to
wall ratio is encouraged or required for the project by code.

DESIGN PAGE GUIDANCE
© International Finance Corporation 2019. All rights reserved. EDGE User Guide 41
▪ Solar Reflectivity for Paint – Wall – Also known as albedo, this is the percentage of the full solar
spectrum that is reflected by the exterior wall finish on average over the year. The default baseline
value is 0.3 or 30%. Contact the EDGE Team to update this baseline percentage if a different minimum
albedo is required for the project by code.
▪ Solar Reflectivity for Paint – Roof – Also known as albedo, this is the percentage of the full solar
spectrum that is reflected by the roof finish on average over the year. The default baseline value is 0.3
or 30%. Contact the EDGE Team to update this baseline percentage if a different minimum albedo is
required for the project by code.
▪ Roof U-value – The conductance of the baseline roof. Contact the EDGE Team to update this value if
local standards or regulations stipulate a different maximum U-value for the roof.
▪ Wall U-value – The conductance of the baseline wall. Contact the EDGE Team to update this value if
local standards or regulations stipulate a different maximum U-value for the walls.
▪ Glass U-value – The conductance of the baseline glazing (not including the frame). Contact the EDGE
Team to update this value if local standards or regulations stipulate a different maximum U-value for
the windows.
▪ Glass SHGC – The solar heat gain coefficient of the glazing (not including the frame). Contact the
EDGE Team to update this value if local standards or regulations stipulate a different maximum Solar
Heat Gain Coefficient (SHGC) for the glazing.
▪ Cooling System – This is the default cooling system assigned by EDGE based on the selected building
type and size and heating fuel as per ASHRAE guidelines (see Table 10).
▪ AC System Efficiency – This is the baseline COP value of the air conditioning system. It is based on the
default efficiency of the assigned system as per Section 6.4 of the ASHRAE standard 90.1-2007.
Contact the EDGE Team to update this value if a different level of performance is required by code.
Table 10: Base Case System Type Selection2
2 Source: ASHRAE 90.1 2007. Table G3.1.1A
Building Type Fossil Fuel, Fossil/Electric Hybrid, and Purchased
Heat
Electric and other
1. Residential System 1 - PTAC System 2 - PTHP
2. Nonresidential and 3 floors or less and <2,300m2 System 3 – PSZ-AC System 4 – PSZ-HP
3. Nonresidential and 4 or 5 floors and <2,300m2 or
5 floors or less and 2,300m2 to 14,000m2
System 5 - Packaged VAV with reheat System 6 – Packaged
VAV with PFP boxes
4. Nonresidential and more than 5 floors or
>14,000m2
System 7 - VAV with reheat System 8 – VAV with PFP
boxes

DESIGN PAGE GUIDANCE
© International Finance Corporation 2019. All rights reserved. EDGE User Guide 42
Table 11: Base Case System Description3
▪ Heating System – This is the default heating system assigned as per ASHRAE guidelines (Table 11
above) based on the selected building type and size and heating fuel as per ASHRAE guidelines (see
Table 10).
▪ Heating System Efficiency – This is the baseline COP value of the heating system assigned in the field
directly above. It is based on the default efficiency of the assigned system as per Section 6.4 of the
ASHRAE standard 90.1-2007. Contact the EDGE Team to update this value if a different level of
performance is required by code.
▪ Monthly Average Outdoor Temperature (deg. C) – The monthly average outdoor temperature has only
been included for the cities listed for each country. If the project site is not within a listed city, then
enter the average monthly temperatures for the actual location. Additionally, for cities included in
EDGE, due to microclimates, it is understood that the monthly temperatures for the project site may
vary from the average temperatures for the city. For EDGE certification, the source for any
temperature inputs must be submitted for compliance purposes. The following weather data sources
are acceptable:
o A Test Reference Year (TRY) if the building location is within 50km of a TRY location; or,
o In the absence of local TRY weather data, an actual year of recorded weather data from a
location within 50km of the building location; or,
3 Source: ASHRAE 90.1 2007. Table G3.1.1B
System No. System Type Fan Control Cooling Type
Heating Type
1. PTAC Packaged Terminal Air
Conditioner
Constant Volume Direct expansion Hot water fossil fuel boiler
2. PTHP Packaged Terminal Heat Pump Constant Volume Direct expansion Electric heat pump
3. PSZ-AC Packaged Rooftop Air
Conditioner
Constant Volume Direct expansion Fossil fuel furnace
4. PSZ-HP Packaged Rooftop Heat Pump Constant Volume Direct expansion Electric heat pump
5. Packaged VAV
with Reheat
Packaged Rooftop VAV with
Reheat
VAV Direct expansion Hot water fossil fuel boiler
6. Packaged VAV
with PFP
Boxes
Packaged Rooftop VAV with
Reheat
VAV Direct expansion Electric resistance
7. VAV with
Reheat
Packaged Rooftop VAV with
Reheat
VAV Chilled water Hot water fossil fuel boiler
8. VAV with PFP
Boxes
VAV with Reheat VAV Chilled water Electric resistance

DESIGN PAGE GUIDANCE
© International Finance Corporation 2019. All rights reserved. EDGE User Guide 43
o In the absence of TRY or actual weather data within 50km, interpolated data based upon
three points within 250km of the building location.
o Weather data can be obtained using sources such as Meteonorm or Weather analytics.
▪ Latitude – The latitude for the selected city is provided by default. If the building is outside of the
selected city, then the actual latitude of the site can be entered here.
▪ Average Annual Rainfall – The average annual rainfall for the selected city is provided by default.
Update these values if better data is available for the project location.

GREEN MEASURES OVERVIEW
© International Finance Corporation 2019. All rights reserved. EDGE User Guide 44
GREEN MEASURES OVERVIEW
This section provides an overview of the policies related to efficiency measures in EDGE.
Required Measures
In EDGE, required measures are defined differently from the typical understanding of a required measure.
Required measures in EDGE do not mean that EDGE requires that the measures must be implemented, or that
the improved case must meet or exceed the baseline case. Rather, it means that the actual performance of the
measure is required to be entered in EDGE if that measure is present in the project. If the performance of the
installed components varies across the project for any reason, then a weighted average of the performance
metric must be used. If the measure is not present in the project, then the requirement does not apply. For
example, if a residential project has air-conditioners, the actual COP of the air-conditioners is required to be
entered. If the COP varies from one room to another, a weighted average COP must be used. For buildings with
an air-conditioning system, at least one of the air-conditioning options must be selected (but not all of them).
But if the project does not include air-conditioning, then the measure can be left blank.
The examples in Table 12 explain how to address the measures in EDGE that are required and marked with an
asterisk (*), versus those that are not.
Table 12: Required versus voluntary measures in EDGE
Measure ID How to address in software How to address at audit
E01*
*(asterisk) indicates that the input is Required
Required to be selected and filled, regardless of whether the measure generates savings or affects the project in a negative way.
Exceptions:
1. If a measure is not present in the project
2. In the case of walls and roof, the measure is only required when the U-value of the base case is less than 0.5 W/m2K; and in the case of windows, when the U-value of the base case is less than 3 W/m2K. Higher base case values indicate that the local standards are not strict, therefore the measure becomes voluntary in EDGE.
Must be reviewed in all projects to ensure that it has been selected and the actual value as per design or construction has been entered.
E02
Optional; to be selected only if targeted for savings
Only reviewed if selected
Results
The Results bar is a summary of the Key Performance Indicators (KPIs) calculated by EDGE. To calculate
performance against these indicators, EDGE makes assumptions on how the building will be used by the

GREEN MEASURES OVERVIEW
© International Finance Corporation 2019. All rights reserved. EDGE User Guide 45
occupants. Since the actual usage patterns may differ depending on occupant consumption, the water and
energy usage and subsequent costs may vary from EDGE predictions. The KPIs include:
▪ Final Energy Use – the energy consumption (in kWh/month) for the project is calculated
automatically by EDGE, based on the data entered in the Design section and any reduction
achieved through the selection of efficiency measures.
▪ Final Water Use – the water consumption (in kL/month) for the project is calculated automatically
by EDGE, based on the data entered in the Design section and any reduction achieved through the
selection of water efficiency measures.
▪ Operational CO2 Savings – EDGE automatically calculates the CO2 savings (in tCO2/year) based on
the final energy use multiplied by the CO2 emission factor for the generation of grid electricity. The
default value for the selected country’s CO2 emissions is shown in the Design section but can be
overwritten if evidence can be provided to support it. The evidence must be from a reliable source
such as a peer-reviewed publication from an international organization or a specialized
government-approved study.
▪ Embodied Energy Savings – EDGE automatically calculates the embodied energy savings (in mega
joules) from the building dimensions and the materials selected in the Materials section.
▪ Base Case Utility Cost – EDGE projects the monthly cost (in USD/month or local currency in
specific countries) for energy and water use.
▪ Utility Costs Reduction – EDGE projects the monthly savings (in USD/month or local currency in
specific countries) in utility bills.
▪ Incremental Cost – Additional cost of implementing the selected efficiency measures (in USD or
local currency in specific countries). Certain building measures may contribute to a lower overall
cost compared to the baseline. Therefore, negative incremental costs are possible. EDGE cost data
is based on average global data and is continuously being refined. It is only meant as a guidance
tool for comparison between measures. If specific local data is available, the use of it in a more
specific financial model is encouraged for making financial decisions.
▪ Payback in Years – Number of years to repay the incremental cost compared to the cost savings of
utilities. The method used is simple payback based on the capital cost of the measure.
Energy and Water
The selection of energy and water efficiency measures can have a significant impact on the resource demand of
a building. When measures are selected, EDGE makes default assumptions on the typical improved performance
over the base case. Note that the default must be overwritten with actual values where applicable by editing the
user input fields.
While onsite renewable energy and the collection of rainwater are not technically efficiency measures, they will
reduce the use of grid electricity and treated potable water respectively, contributing to the 20% efficiency
savings target required to reach the EDGE standard. Other innovative measures impacting energy or water
savings can be reported using a proxy measure (by selecting a substitute from the options available in EDGE)
and will be evaluated on a case by case basis.

GREEN MEASURES OVERVIEW
© International Finance Corporation 2019. All rights reserved. EDGE User Guide 46
EDGE currently uses delivered energy (i.e., that paid for by the consumer) as the measure of efficiency, as it is
a more consistent global indicator. The carbon dioxide emissions (global warming potential) related to delivered
energy use is a more accurate measure of the impact of a building on the environment, so future versions of
EDGE may consider using this alternative indicator.
The results for both energy and water are shown in charts that compare the base case building with the
improved case.
Energy
The energy chart shows a breakdown of the end uses that consume energy. The units are kWh/m2/year. This
includes the energy from all fuels – including electricity, natural gas and diesel – converted to kilowatt-hours.
Hovering on the bar graph sections displays more information about each section. Note that Figure 3 shows
‘Virtual Energy’ for cooling and fans because the building does not include a cooling system.
Virtual Energy
The use of Virtual Energy is a key concept in EDGE. When there are no plans for HVAC to be installed in a
building at the time of certification, EDGE calculates the energy that will be required to ensure human comfort
on the premise that if the building design does not provide proper internal conditions and the space is
uncomfortably hot or cold, eventually mechanical systems will be added to the building (in the form of individual
air conditioning units, for example) to compensate for the lack of a space-conditioning system. This future
required energy for comfort is demonstrated in EDGE as “virtual energy,” articulated separately for ease of
understanding.
While this virtual energy is not reflected in the utility costs, it is used by EDGE to determine the 20%
improvement in energy efficiency required by EDGE. Therefore, virtual energy must be reduced in the same
way that actual energy is reduced.
Figure 3. Sample Energy chart from the Home typology

GREEN MEASURES OVERVIEW
© International Finance Corporation 2019. All rights reserved. EDGE User Guide 47
The categories in the Energy Chart vary depending on the building type. A description of the categories follows.
▪ Heating Energy, Cooling Energy and Fan Energy: These reflect the energy used in the space
conditioning systems. When a cooling or heating system is not specified, but the building requires
it to maintain comfort, the estimated heating or cooling energy and its related fan energy show up
as “virtual energy” on the Energy Chart. An example of virtual cooling and related fan energy is
shown in Figure 3.
▪ Catering: (Hospitality, Hospitals) Includes cooking equipment, refrigerator, kitchen equipment and
extractor hoods
▪ Equipment, Lift, STP, Water Pumps: (Hospitals) Includes plug loads, miscellaneous equipment,
elevators, and sewage treatment plant (STP), and water pumps.
▪ Food Court: Includes cooking equipment, refrigerator, kitchen equipment and extractor hoods, as
well energy required for the hot water for cooking.
It is only displayed if the ‘food court’ space type is selected as a facility in the design section. This
space type only applies to professional kitchens and should not be made for small pantries such as
those on office floors.
▪ Home Appliances: (Homes) Plug loads from common appliances
▪ Hot Water: Energy consumed by the hot water system. Heating with any fuel type is converted to
kWh.
▪ Laundry: This is the energy involved in washing and drying clothes.
▪ Lighting: This is the energy used for the lights.
▪ Pump Energy: Only includes pumps dedicated to the HVAC system.
▪ Refrigeration: (Retail) This is the energy involved in keeping the food refrigerated.
▪ Other: This includes plug loads, miscellaneous equipment, elevators, sewage treatment plant
(STP) and water pumps.
▪ Common Amenities: (Homes) These include the sewage treatment plant (STP), water treatment
plant (WTP), grey water treatment plant, water pumps for recreational facilities (such as a
swimming pool), and the lift.

GREEN MEASURES OVERVIEW
© International Finance Corporation 2019. All rights reserved. EDGE User Guide 48
Water
The water chart shows a breakdown of the end uses that consume water. The units are cubic meters per day.
Hovering on the bar graph sections displays more information about each section.
The categories in the Water Chart vary depending on the building type. A description of the categories follows.
▪ Cafeteria: (Hospitality) This includes dishwashers, pre-rinse spray valves, kitchen sink, and water
used for cooking and drinking in professional kitchens.
▪ Food Court / Kitchenette: (Offices) This includes dishwasher, pre-rinse valve, kitchen sink, water
for drinking and cooking in professional kitchens.
It is only displayed if the ‘food court’ space type is selected as a facility in the design section. This
space type only applies to professional kitchens and should not be made for small pantries such as
those on office floors.
▪ HVAC: (Retail, Offices, Hospitals, Education) This includes the water used for cooling and/or
heating equipment.
▪ Kitchen: (Retail, Hospitals) This includes dishwashers, pre-rinse spray valves, kitchen sink, water
used for cooking and drinking.
▪ Landscaping
▪ Laundry: (Hospitality, Hospitals) This includes cleaning the building, washing clothes, and car
washing.
Figure 4. Sample Water Chart from the Retail typology

GREEN MEASURES OVERVIEW
© International Finance Corporation 2019. All rights reserved. EDGE User Guide 49
▪ Other: (Offices) This includes water for cleaning the building.
▪ Public Area: (Hospitality) This includes the water closets, urinals and faucets of the banquet hall,
and employees and public areas of the hotel.
▪ Water Closets and Urinals
▪ Water Faucets
▪ Shower
▪ Swimming Pool
Materials
A list of relevant specifications for each building element (roof, external walls, internal walls, floor finishes, etc.)
appears in the Materials section. For each building element, a specification must be selected from the drop-
down list that is most similar to the specification used in the design. Where there are multiple specifications for
each building element, the predominant specification should be selected. Thicknesses must be indicated for floor
slabs, roof construction, external walls and internal walls.
Figure 5. Sample Materials Chart from the Offices typology
As seen in Figure 5, the indicator used to measure materials efficiency is the embodied energy of the
specifications used. The embodied energy of a product is the primary energy demand for its production. As with
energy efficiency measures, future versions of EDGE may consider using carbon dioxide (global warming
potential) as an indicator of materials efficiency as this more closely reflects the impact of the building on the
environment.

INDIVIDUAL MEASURES IN EDGE
© International Finance Corporation 2019. All rights reserved. EDGE User Guide 50
INDIVIDUAL MEASURES IN EDGE
The Individual Measures Section in the user guide describes each measure included in EDGE, indicating why the
measure has been included, how it is assessed, and what assumptions have been made to calculate the base
case and improved case. The guidance for each EDGE measure contains the subsections described below:
Requirement Summary
A brief summary of the system or level of performance required before the measure can be claimed.
Intention
What the measure aims to achieve and why it is measured in the way that it is.
Approach/Methodologies
The different approaches, which can be used to assess the design, are provided with an explanation of the
calculations and terminology used.
Potential Technologies/Strategies
The possible solutions and technologies that might be considered by the design team to meet measure
requirements.
Relationship to Other Measures
EDGE predicts energy, water and materials efficiencies by taking a holistic view of the information that has been
provided about the building project. The strong relationship between certain measures is revealed to clarify
EDGE calculations and support the overall design process.
Assumptions
EDGE makes assumptions for a base case building. The base case is taken from either typical practice or
performance levels required by applicable local codes and standards. An assumption is also made for the
improved case, so that when a measure is selected the predicted performance of the building is improved. Often
it is possible to override improved case assumptions with more accurate levels of predicted performance for the
actual building design. This allows improvements to be recognized if the assumed improved case level is not
met and calculates additional reductions if the design exceeds the improved case.

INDIVIDUAL MEASURES IN EDGE
© International Finance Corporation 2019. All rights reserved. EDGE User Guide 51
Compliance Guidance
The compliance guidance provided for each measure indicates the documentation that will be required to
demonstrate compliance, should the project owner be striving for EDGE certification. Specific documentation
varies according to the technology being assessed.
Because available evidence depends on the current stage in the process, EDGE provides compliance guidance
for each measure at both the design and post-construction stages. If the required evidence is not available
during the design stage, a signed declaration of intent can be provided by the project administrator. Note that
at the post-construction stage, this declaration must be signed by the client or a designated client
representative as defined in the certification agreement. During the post-construction stage, more rigorous
documentation is required. However, a common-sense approach is recommended to verify that the measure
has indeed been installed as per the specifications claimed. For example, some measures require a bill of
quantities to demonstrate compliance. This would be the document used in the tendering of construction,
comprising a list of the materials required for the works and their estimated quantities. If that document is not
available, similar locally used documents such as drawings or invoices may be used instead to verify the
construction details.
In the case of EDGE projects that are going directly into Post-Construction phase, the compliance requirements
of both design and post-construction stages are expected to be met, except where a post-construction
requirement replaces the design stage requirement.
In most cases, a minimum of 90% of a particular specification must comply for certification, unless specifically
stated. If the auditor has reason to believe that a measure should be recognized, then proper justification
should be provided for the certifier’s review. Approval of such justification is at the discretion of the certifier.

ENERGY EFFICIENCY MEASURES
© International Finance Corporation 2019. All rights reserved. EDGE User Guide 52
ENERGY EFFICIENCY MEASURES
Energy efficiency is one of the three main resource categories that comprise the EDGE standard. To comply for
certification purposes, the design and construction team must review the requirements for selected measures as
indicated and provide the information.
Note: Efficiency values used in this User Guide to describe a measure are global baseline assumptions and may
differ from values used in EDGE for countries in which it has been calibrated.
The following pages explain each energy efficiency measure by relaying the intention, approach, assumptions
and compliance guidance requirements.
Figure 6. Screenshot of energy saving measures of one building type in the EDGE App

ENERGY EFFICIENCY MEASURES
© International Finance Corporation 2019. All rights reserved. EDGE User Guide 53
E01* - REDUCED WINDOW TO WALL RATIO
Corresponds to HME01, HTE01, RTE01, OFE01, HSE01, EDE01
Requirement Summary
Window-to-Wall Ratio (WWR) should be selected and the WWR value entered in the EDGE App in all cases,
irrespective of the value. Savings can be achieved if the Window to Wall Ratio is lower than the local base case
as set out in the Key Assumptions for the Base Case in the Design section. EDGE will calculate the impact of any
improvement beyond the base case.
Intention
The sun is the most powerful light source but is also a source of significant heat gain. Therefore, it is important
to balance lighting and ventilation benefits of glazing against the impacts of heat gain on cooling needs and/or
passive heating. Finding the correct balance between the transparent (glass) and the opaque surfaces in the
external façades helps to maximize daylight while minimizing unwanted heat transfer, resulting in reduced
energy consumption. The design goal should be to meet minimum illumination levels without significantly
exceeding the solar heat gains in temperate and warm climates, as well as to make the most of passive heating
in cold climates in winter time.
Windows generally transmit heat into the building at a higher rate than walls do. In fact, windows are usually
the weakest link in the building envelope as glass has much lower resistance to heat flow than other building
materials. Heat flows out through a glazed window more than 10 times faster than it does through a well-
insulated wall. While glazed areas are desirable to admit solar radiation in cold climates during the day,
windows in warmer climates can significantly increase the building’s cooling loads.
Approach/Methodologies
This measure uses the Window to Wall Ratio (WWR), which is defined as the ratio of the total area of the
window or other glazing area (including mullions and frames) divided by the gross exterior wall area.
The WWR is calculated with the following equation: WWR (%) = ∑ Glazing area (m2)
∑ Gross exterior wall area (m2)
Glazing area is the area of glass on all façades regardless of orientation. Gross exterior wall area is the sum of
the area of the exterior façades in all orientations, which includes walls, windows and doors. To calculate the
exterior wall area, the interior surface of the exterior wall must be used to determine the lengths.
The actual WWR for the design case must be entered in the system. While a higher WWR may have a negative
impact on energy savings, it can be compensated for by other energy saving measures.
The improved case WWR must be calculated and entered for each façade separately, i.e. for the North Façade
the % WWR of the North façade only should be entered. This will impact the solar gain in each façade and
impact the cooling and heating load.
For projects with multiple subprojects with multiple EDGE files, the recommended method is to calculate an
average WWR for the whole building and use that in every subproject. Modeling each subproject with its own

ENERGY EFFICIENCY MEASURES
© International Finance Corporation 2019. All rights reserved. EDGE User Guide 54
WWR is also acceptable, but unless a significant difference exists between the subprojects with some containing
double height spaces or very different glass areas, this approach is not recommended. For example, if the
average WWR of a residential building is 35%, that will be used for all unit types regardless of their individual
WWR. (However, individual window opening sizes will be considered for the natural ventilation measure).
Windows and walls facing internal courtyards or gaps between buildings (open to outside air) should be included
in the WWR calculations.
Spandrel panels (opaque insulated glass panels) should be included as external walls in the WWR calculations.
The following examples should be excluded from the calculations of WWR:
a) Walls with windows/ventilation openings into interior shafts only (for example, as seen for bathrooms
in residential projects in India)
b) Any external wall that is not directly exposed to the environment. For example, underground walls,
earth-bermed walls or walls in direct contact with another building
c) Walls that do not enclose interior spaces. This includes walls that have more than 30% of the area as a
permanent opening for ventilation. The next enclosing wall should be used instead.
d) Openings that are only ventilation openings (without glazing)
Potential Technologies/Strategies
A building with a higher WWR will transfer more heat than a building with a lesser WWR. If the WWR is higher
than the default value, then other measures such as shading or a lower solar heat gain coefficient (SHGC) of the
glass should be considered to offset the energy loss. In cold climates, when the WWR is higher than the default,
the insulation of glass using double or triple glazing should be considered.
With regards to daylight, two basic strategies are available for using the sun for lighting while minimizing heat
gain. The first is to use a small window opening (15% WWR) to illuminate a surface inside the space that then
spreads the light out over a large area. The second is to use a moderately sized window (30% WWR) that
“sees” an exterior reflective surface but is shaded from the direct sun. To increase the daylight availability, the
selection of higher visible light transmittance (VLT>50) for the glass is also important.
Relationship to Other Measures
Envelope heat transfer is a function of the thermal resistance of the external materials, the area of the building
façade, and the temperature difference between the exterior and interior of the building. The primary causes of
heat transfer are infiltration and windows. The size, number and orientation of windows have a significant effect
on the building’s energy use for thermal comfort purposes (heating or cooling).
In cold climates, direct solar radiation passes through the glass during the day, passively heating the interior. If
sufficient thermal mass is used, this heat is then released, helping to keep the room comfortable later in the
day. In this climate type, the glass placement that is most desirable is at the elevation with the greatest
exposure to sunlight. However, in warm and temperate climates, the WWR should be lower as the reduction of
glass leads to a reduction in the overall cooling load and reduced need for air conditioning.
It is important to consider that lighting and cooling energy use can be reduced by the use of daylighting. This
should be balanced with the corresponding solar and convective heat gains.

ENERGY EFFICIENCY MEASURES
© International Finance Corporation 2019. All rights reserved. EDGE User Guide 55
Assumptions
The base case for the WWR is included in the Key Assumptions for the Base Case in the Design section. The
base case varies by building type, and can also vary by location. The default assumptions for the improved case
for the WWR may vary from country to country. If the actual WWR is different than the default, the actual WWR
value for the improved case must be entered manually.
Compliance Guidance
At the post-construction stage, it is important to ensure that the WWR has been maintained to achieve the
energy savings indicated in the EDGE results. Compliance is achieved when the design team can demonstrate
that the WWR in all elevations is equal or lower than the claimed specification, using the formula explained in
“Potential Technologies/Strategies” above.
Design Stage Post-Construction Stage
At the design stage, the following must be used to
demonstrate compliance:
Calculation of “Glazing Area” and “Gross Exterior Wall
Area” for each façade of the building and the average
area weighted WWR; and
All façade elevation drawings showing glazing
dimensions and general building dimensions.
At the post-construction stage, the following must be
used to demonstrate compliance:
Updated WWR calculations if necessary, or
confirmation that the design WWR is still valid; and,
either
As-built façade drawings; or
External and internal photographs of the building
showing all the elevations

ENERGY EFFICIENCY MEASURES
© International Finance Corporation 2019. All rights reserved. EDGE User Guide 56
E02 – EXTERNAL SHADING DEVICES
Corresponds to HME04, HTE02, RTE04, OFE04, HSE04, EDE04
Requirement Summary
This measure can be claimed if external shading devices are provided on the building’s exterior.
Intention
External shading devices are provided on the building façade to protect the glazed elements (glass windows and
doors) from direct solar radiation to reduce glare and to reduce radiant solar heat gain in cooling dominated
climates. This method is more effective than internal shading devices such as blinds, because radiant solar gain
occurs in the form of short wavelengths that can pass through glass. However, reflected wavelengths are longer
and can no longer pass through glass to exit the space. This phenomenon is known as the greenhouse effect.
Approach/Methodologies
If this measure is selected, EDGE uses a default shading factor
equivalent to that of a shading device that is 1/3 of the height of the
window and 1/3 of the width of the window on all windows of the
building. However, if shading devices are provided that are different
from EDGE assumptions, then a different shading factor should be
used. The shading factor varies according to the latitude and the
orientation of the windows, as well as the size of the shading device,
and can be calculated using the built-in calculator. Figure 7 illustrates
the dimensions used to calculate the shading factor.
Table 13, Table 14, and Table 15 show the relationship between the Dh and Dv (depth of horizontal and vertical
shading) H (window height) and W (window width) to determine the shading factor.
This measure is assessed using an Annual Average Shading Factor, which is represented by one minus the ratio
of solar radiation transmitted by a protected window (with external shading devices), compared to that
transmitted by an unprotected window.
Annual Average Shading Factor (AASF) is defined by following equation:
AASF = 1 −Total annual solar heat gain from a window with shading (kWh)
Total annual solar heat gain from a window without shading (kWh)
The shading factor is expressed as a decimal value between 0 and 1. The higher the shading factor, the greater
is the shading capability of the shading device.
Figure 7. Illustration of the dimensions used to
calculate the shading factor

ENERGY EFFICIENCY MEASURES
© International Finance Corporation 2019. All rights reserved. EDGE User Guide 57
Table 13, Table 14, and Table 15 indicate the shading factors for different orientations, latitudes, and shading
device proportions. The last column of Table 15 lists the average shading factor for the combined type, which is
used as the default improved case by EDGE.
The project AASF is the area-weighted average of the shading factors of all the external windows. When
conducting calculations, all windows should be accounted for. If a window has a vertical and a horizontal
overhang with different depths, select the more conservative (smaller factor) overhang depth for the
calculation. If any windows do not have an overhang, they must still be included in the calculation and use the
appropriate values for ‘No Overhang.’ The total Window Area must match the total External Window Area used
in WWR calculations.
Table 13: Shading factors for horizontal shading devices at different latitudes for each orientation
*The shading factors have been derived using a solar modelling tool
HORIZONTAL - SHADING FACTOR* (Shading Coefficient) N (North), NE (North East), E (East), SE (South East), S (South), SW (South West), W (West), NW (North West)
Latitude Shading Proportion
Shading Factor
Northern Hemisphere
N NE E SE S SW W NW Average
Southern
Hemisphere
S SE E NE N NW W SW
0º - 9º Dh=H/1 0.49 0.46 0.49 0.50 0.50 0.52 0.52 0.48 0.50
Dh =H/2 0.44 0.39 0.39 0.40 0.46 0.43 0.41 0.41 0.42
Dh =H/3 0.39 0.34 0.32 0.33 0.39 0.36 0.34 0.35 0.35
Dh =H/4 0.35 0.29 0.27 0.28 0.33 0.31 0.28 0.30 0.30
10º - 19º Dh=H/1 0.47 0.44 0.47 0.51 0.51 0.52 0.49 0.47 0.48
Dh =H/2 0.42 0.38 0.38 0.40 0.43 0.42 0.41 0.41 0.40
Dh =H/3 0.36 0.33 0.31 0.32 0.35 0.35 0.34 0.35 0.34
Dh =H/4 0.32 0.29 0.26 0.27 0.30 0.30 0.30 0.32 0.29
20º - 29º Dh=H/1 0.47 0.44 0.47 0.50 0.51 0.52 0.50 0.46 0.48
Dh =H/2 0.41 0.38 0.37 0.39 0.41 0.41 0.40 0.41 0.40
Dh =H/3 0.36 0.33 0.31 0.32 0.34 0.34 0.34 0.35 0.33
Dh =H/4 0.31 0.28 0.26 0.26 0.29 0.29 0.28 0.31 0.29
30º - 39º Dh=H/1 0.47 0.43 0.46 0.49 0.51 0.51 0.49 0.46 0.48
Dh =H/2 0.41 0.37 0.36 0.38 0.40 0.40 0.39 0.40 0.39
Dh =H/3 0.36 0.32 0.29 0.30 0.33 0.32 0.33 0.35 0.32
Dh =H/4 0.31 0.28 0.25 0.25 0.28 0.27 0.28 0.31 0.28
40º - 49º Dh=H/1 0.46 0.39 0.40 0.43 0.46 0.46 0.45 0.44 0.44
Dh =H/2 0.40 0.34 0.31 0.33 0.36 0.36 0.37 0.39 0.36
Dh =H/3 0.35 0.29 0.25 0.26 0.29 0.29 0.30 0.33 0.30
Dh =H/4 0.31 0.25 0.21 0.21 0.23 0.24 0.26 0.29 0.25
50º - 60º Dh=H/1 0.33 0.30 0.34 0.38 0.40 0.39 0.36 0.32 0.35
Dh =H/2 0.24 0.23 0.24 0.26 0.28 0.26 0.25 0.24 0.25
Dh =H/3 0.18 0.18 0.18 0.19 0.20 0.19 0.19 0.19 0.19
Dh =H/4 0.15 0.14 0.14 0.15 0.16 0.15 0.15 0.15 0.15

ENERGY EFFICIENCY MEASURES
© International Finance Corporation 2019. All rights reserved. EDGE User Guide 58
Table 14: Shading factors for vertical shading devices at different latitudes for each orientation
VERTICAL - SHADING FACTOR* (Shading Coefficient) N (North), NE (North East), E (East), SE (South East), S (South), SW (South West), W (West), NW (North West)
Latitude Shading
Proportion Shading Factor
Northern
Hemisphere
N NE E SE S SW W NW
Average
Southern
Hemisphere
S SE E NE N NW W SW
0º - 9º Dv=W/1 0.23 0.23 0.18 0.22 0.23 0.20 0.18 0.21 0.21
Dv=W/2 0.21 0.19 0.15 0.18 0.22 0.17 0.15 0.18 0.18
Dv=W/3 0.19 0.16 0.12 0.15 0.19 0.14 0.12 0.15 0.15
Dv=W/4 0.16 0.14 0.11 0.12 0.16 0.12 0.11 0.13 0.13
10º - 19º Dv=W/1 0.21 0.24 0.20 0.20 0.23 0.18 0.20 0.21 0.21
Dv=W/2 0.19 0.21 0.16 0.16 0.21 0.15 0.17 0.19 0.18
Dv=W/3 0.17 0.18 0.14 0.13 0.17 0.14 0.15 0.16 0.15
Dv=W/4 0.15 0.16 0.12 0.11 0.15 0.12 0.13 0.15 0.13
20º - 29º Dv=W/1 0.22 0.25 0.20 0.21 0.24 0.19 0.20 0.22 0.21
Dv=W/2 0.19 0.21 0.16 0.17 0.20 0.16 0.17 0.19 0.18
Dv=W/3 0.17 0.18 0.13 0.14 0.17 0.14 0.14 0.17 0.15
Dv=W/4 0.15 0.15 0.12 0.11 0.14 0.12 0.12 0.15 0.13
30º - 39º Dv=W/1 0.21 0.26 0.22 0.21 0.24 0.19 0.21 0.23 0.22
Dv=W/2 0.19 0.22 0.17 0.16 0.19 0.16 0.18 0.20 0.19
Dv=W/3 0.17 0.19 0.14 0.13 0.16 0.14 0.15 0.17 0.16
Dv=W/4 0.15 0.16 0.12 0.11 0.14 0.11 0.13 0.15 0.13
40º - 49º Dv=W/1 0.23 0.28 0.24 0.24 0.25 0.23 0.22 0.24 0.24
Dv=W/2 0.20 0.23 0.19 0.17 0.20 0.18 0.19 0.21 0.20
Dv=W/3 0.18 0.19 0.15 0.14 0.16 0.15 0.16 0.17 0.16
Dv=W/4 0.16 0.16 0.13 0.11 0.14 0.13 0.14 0.15 0.14
50º - 60º Dv=W/1 0.26 0.30 0.27 0.27 0.27 0.26 0.27 0.28 0.27
Dv=W/2 0.20 0.22 0.20 0.18 0.20 0.19 0.21 0.21 0.20
Dv=W/3 0.16 0.17 0.16 0.14 0.15 0.15 0.16 0.16 0.16
Dv=W/4 0.13 0.14 0.13 0.11 0.12 0.12 0.13 0.13 0.13
Table 15: Shading factors for combined shading devices (both horizontal and vertical) at different latitudes for each orientation
COMBINED - SHADING FACTOR (Shading Coefficient) N (North), NE (North East), E (East), SE (South East), S (South), SW (South West), W (West), NW (North West)
Latitude Shading proportion Shading Factor
Northern
Hemisphere
N NE E SE S SW W NW
Average
Southern Hemisphere
S SE E NE N NW W SW
0º - 9º Dh=H/1 & Dv=W/1 0.72 0.69 0.67 0.72 0.74 0.73 0.70 0.70 0.71
Dh=H/2 & Dv=W/2 0.65 0.59 0.54 0.58 0.68 0.60 0.56 0.60 0.60
Dh=H/3 & Dv=W/3 0.58 0.50 0.45 0.48 0.58 0.51 0.47 0.51 0.51
Dh=H/4 & Dv=W/4 0.51 0.43 0.38 0.41 0.50 0.43 0.39 0.44 0.44
10º - 19º Dh=H/1 & Dv=W/1 0.69 0.69 0.67 0.71 0.74 0.70 0.70 0.68 0.70
Dh=H/2 & Dv=W/2 0.60 0.59 0.54 0.56 0.64 0.57 0.59 0.60 0.59
Dh=H/3 & Dv=W/3 0.53 0.51 0.45 0.45 0.53 0.49 0.50 0.52 0.50
Dh=H/4 & Dv=W/4 0.47 0.45 0.39 0.38 0.45 0.42 0.43 0.46 0.43
20º - 29º Dh=H/1 & Dv=W/1 0.69 0.69 0.68 0.71 0.75 0.71 0.70 0.69 0.70
Dh=H/2 & Dv=W/2 0.61 0.59 0.54 0.56 0.62 0.57 0.57 0.60 0.58
Dh=H/3 & Dv=W/3 0.53 0.51 0.44 0.46 0.51 0.48 0.48 0.52 0.49
Dh=H/4 & Dv=W/4 0.47 0.44 0.38 0.38 0.43 0.41 0.41 0.46 0.42
30º - 39º Dh=H/1 & Dv=W/1 0.69 0.69 0.68 0.71 0.75 0.70 0.70 0.69 0.70
Dh=H/2 & Dv=W/2 0.60 0.59 0.53 0.55 0.60 0.56 0.57 0.61 0.58
Dh=H/3 & Dv=W/3 0.53 0.51 0.44 0.44 0.49 0.47 0.48 0.52 0.48
Dh=H/4 & Dv=W/4 0.47 0.44 0.37 0.36 0.41 0.39 0.41 0.46 0.41
40º - 49º Dh=H/1 & Dv=W/1 0.69 0.68 0.64 0.68 0.71 0.69 0.68 0.68 0.68
Dh=H/2 & Dv=W/2 0.61 0.57 0.50 0.50 0.56 0.54 0.56 0.59 0.55
Dh=H/3 & Dv=W/3 0.53 0.49 0.41 0.40 0.45 0.44 0.47 0.51 0.46
Dh=H/4 & Dv=W/4 0.47 0.42 0.35 0.32 0.37 0.37 0.40 0.45 0.39
50º - 60º Dh=H/1 & Dv=W/1 0.62 0.63 0.63 0.66 0.68 0.66 0.65 0.62 0.64
Dh=H/2 & Dv=W/2 0.53 0.51 0.48 0.48 0.51 0.49 0.51 0.53 0.50
Dh=H/3 & Dv=W/3 0.43 0.42 0.38 0.37 0.39 0.38 0.41 0.43 0.40
Dh=H/4 & Dv=W/4 0.36 0.34 0.31 0.29 0.31 0.30 0.34 0.36 0.33

ENERGY EFFICIENCY MEASURES
© International Finance Corporation 2019. All rights reserved. EDGE User Guide 59
Potential Technologies/Strategies
Three basic types of solar shading are used: horizontal, vertical, and combined (egg crate).
Table 16: Typical shading devices
Shading Type Image Description
Horizontal shading
devices
(overhangs):
These are useful for building façades where the sun’s
rays are at a high angle of incidence, in short, where the
sun appears high in the sky.
Examples include summer mid-day sun on either the
northern or southern façades of a building for higher
latitudes, or east and west façades for equatorial
latitudes.
Vertical shading
devices (fins):
These applications are useful where the sun’s rays are at
a low angle of incidence (where the sun appears low in
the sky).
Examples include eastern sun on eastern façades,
western sun on western façades, and winter sun on
southern or northern façades in high latitudes.
Combined shading
devices (egg crate):
“Egg crate” devices are used for conditions where
different times of the year warrant different shading
needs.
Moveable shading
devices – louvres or
shutters
These devices are used to control sunlight during the day
as well as reduce heat losses at night. They are moveable
and can be mechanical or manual. They often provide
maximum shading as they fully cover the window.
These shading devices also protect from inclement
weather (hail, wind, or rain) as well as provide privacy
and security.
The effectiveness of a shading device varies depending on the location towards the equator (latitude) and the
orientation of the window.
Table 17 gives an early indication of the appropriate type of shading device for each orientation.
Table 17: Shading strategies for different orientations at the design stage.
ORIENTATION EFFECTIVE SHADING
Equator-facing Fixed Horizontal Device
East Vertical Device/Louvres (moveable)
Pole-facing Not required
West Vertical Device/Louvres (moveable)

ENERGY EFFICIENCY MEASURES
© International Finance Corporation 2019. All rights reserved. EDGE User Guide 60
Example:
An office building in Istanbul (Turkey) has 1-meter deep horizontal shading on 3 meters high windows in all
directions. What is the shading factor for these windows?
The shading factor can be calculated with the built-in calculator in the EDGE software online. If calculating the
factor manually, use the following steps:
Step one is to determine the latitude of Istanbul (41 N) from the EDGE online tool design tab, under “Key
Assumptions for the Base Case”.
Step two is to use the table provided for Horizontal shading (Table 13)and look for the matching latitude
category which is “40o to 49o”. As the shading is 1/3rd of the window height, “Dv=H/3” should be selected. The
average shading factor is 0.30.
Step three is to select external shading measure in the EDGE App and input 0.30 in to the average annual
shading factor (AASF) field.
Relationship to Other Measures
External shading reduces the heat gain through solar radiation, therefore a glazing type with a higher solar heat
gain coefficient can be selected without a significant negative impact. As external shading cuts the solar heat
before it hits the glazed element, it reduces radiative heat gain compared to a treated glass without shading,
thus offering better thermal comfort conditions.
Shading reduces heat gain and, therefore, cooling loads. The extent of the savings achieved in cooling energy
from shading will be impacted by the efficiency of the cooling system. With a more efficient cooling system, the
magnitude of savings from shading alone will be less, even though the combined savings will be greater.
In heating mode, the heating consumption may be increased when external shading is incorporated, due to the
reduction of solar heat gains in winter, if shading is not well designed. Well-designed shading cuts out the
summer sun but allows in the winter sun which is at a lower altitude.
Assumptions
For the base case, EDGE assumes that no solar shading is present. For the improved case, EDGE assumes a
shading factor equivalent to shading devices with a proportion of 1/3 of the height and the width of the window,
fitted to all windows. The shading factor is the annual average of eight orientations as shown in the last column
of Table 13, Table 14, and Table 15, which is a combination of both vertical and horizontal solar shading.
Compliance Guidance
The information required to demonstrate compliance will depend on the design solution adopted. The simplest
design approach is the installation of egg crate shading devices (depth of 1/3 the height and the width) on all
windows on all façades. Design teams may prefer to specify the shading device according to the orientation.
Table 13, Table 14, Table 15, and Table 16 can be used as guidelines for different sizes and types of shading
devices and orientation. Compliance is achieved when the design team has correctly entered the average of the

ENERGY EFFICIENCY MEASURES
© International Finance Corporation 2019. All rights reserved. EDGE User Guide 61
shading factor of all orientations. In the case of external movable shades, the design team can select a
Combined Overhang with the greatest projection (W/1 and H/1). In the instance that the building has a more
complex shading design, the design team can use specialized software that uses the AASF equation given in the
approach section above, to demonstrate that average shading factors have been achieved.
Design Stage Post-Construction Stage
At the design stage, the following must be used to
demonstrate compliance:
All façade elevation drawings highlighting the
provision of horizontal and vertical shading devices;
and
Window details clearly showing the depth of the
shading device and the calculation of the proportion.
At the post-construction stage, the following must be
used to demonstrate compliance:
Photographs of the shading devices on all
façades; or
As-built façade drawings showing the shading
devices that have been installed; or
Update of shading factor calculations when
changes have occurred in the design stage.

ENERGY EFFICIENCY MEASURES
© International Finance Corporation 2019. All rights reserved. EDGE User Guide 62
E03 - REFLECTIVE PAINT/TILES FOR ROOF
Corresponds to HME02, RTE02, OFE02, HSE02, EDE02
Requirement Summary
This measure can be claimed if the solar reflectivity (albedo) of the roof is greater than the local base case as
set out in the Key Assumptions for the Base Case in the Design section. EDGE will calculate the impact of any
improvement beyond the base case.
Intention
Specifying a reflective finish for the roof can reduce the cooling load in air-conditioned spaces and improve
thermal comfort in non-air-conditioned spaces. Due to the reduction in surface temperature, the service life of
the finish also improves, and the impact on the urban heat island effect4 can be reduced.
Approach/Methodologies
EDGE uses the solar reflectivity (albedo) of the roof finish as the indicator of best practice. This is the part of
the total incident solar radiation that is reflected back from a surface. Unlike Visible Solar Reflectance, it
includes the full solar spectrum. It does not include the effect of emittance which is reflected in a metric such as
Solar Reflectance Index (SRI).
The solar reflectivity for a specific roofing material and finish can be acquired from the product manufacturer. It
is often indicated in the product data sheet or laboratory test results published on manufacturers’ websites.
Solar reflectivity is expressed as a fractional value between 0 and 1, or as a percentage.
By subtracting the solar reflectivity from the total level of solar radiation that falls on the roof surface, EDGE
calculates the portion of solar radiation that is transferred into the building.
To model more than one roof type, use weighted average values.
To specify a green roof, adjust the solar reflectivity of the roof (use the default of 70% if the actual value is not
available), and the insulation of the roof (U-value) to define the green roof condition. Also select the insulation
type used in the roof assembly in the Materials tab, under Roof Insulation.
Table 18 provides an indication of the values for different roof finishes, but is meant only as a guide.
Manufacturers’ published values must be used in the EDGE assessment. If manufacturer data is not available,
the EDGE reference values may be used.
4 A city’s core temperature is often significantly higher than its surrounding area due to the retention of heat from the built
environment.
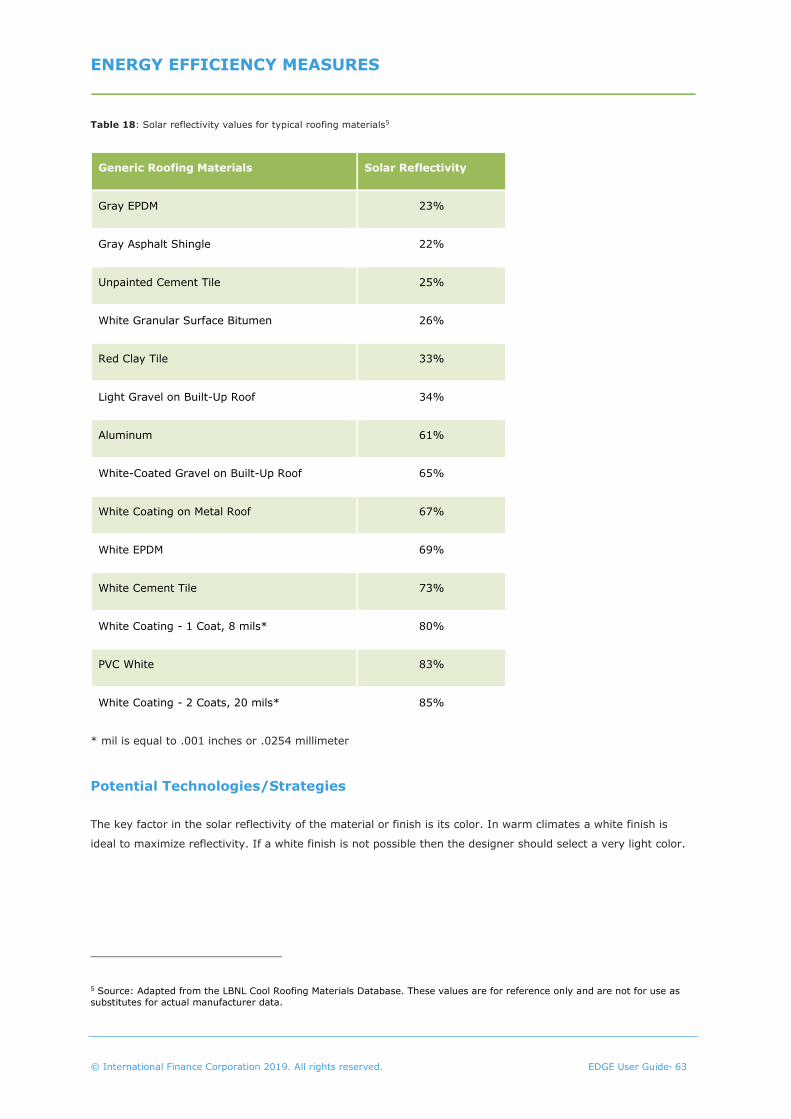
ENERGY EFFICIENCY MEASURES
© International Finance Corporation 2019. All rights reserved. EDGE User Guide 63
Table 18: Solar reflectivity values for typical roofing materials5
Generic Roofing Materials Solar Reflectivity
Gray EPDM 23%
Gray Asphalt Shingle 22%
Unpainted Cement Tile 25%
White Granular Surface Bitumen 26%
Red Clay Tile 33%
Light Gravel on Built-Up Roof 34%
Aluminum 61%
White-Coated Gravel on Built-Up Roof 65%
White Coating on Metal Roof 67%
White EPDM 69%
White Cement Tile 73%
White Coating - 1 Coat, 8 mils* 80%
PVC White 83%
White Coating - 2 Coats, 20 mils* 85%
* mil is equal to .001 inches or .0254 millimeter
Potential Technologies/Strategies
The key factor in the solar reflectivity of the material or finish is its color. In warm climates a white finish is
ideal to maximize reflectivity. If a white finish is not possible then the designer should select a very light color.
5 Source: Adapted from the LBNL Cool Roofing Materials Database. These values are for reference only and are not for use as
substitutes for actual manufacturer data.
ENERGY EFFICIENCY MEASURES
© International Finance Corporation 2019. All rights reserved. EDGE User Guide 64
Relationship to Other Measures
The impact that the solar reflectivity of the roof has on the energy consumption of a building is dependent upon
the insulation levels and the approach used to cool the building, as well as the efficiency of any cooling systems.
The solar reflectivity of the roof finish has a decreased effect on the internal heat gains as the insulation levels
are increased. Super-insulated buildings may not benefit significantly from roof finishes with a high solar
reflectivity. Higher solar reflectivity values will have no effect on the energy consumption in passively cooled
buildings, but may have an impact on virtual energy and, therefore, EDGE results due to occupant comfort.
As the efficiency of the cooling system increases, the solar reflectivity will have a decreasing impact on energy
consumption.
If the roof area is a useable area (i.e. for roof activities), then the use of bright white colors is not
recommended as they can cause glare and discomfort.
Assumptions
The base case for solar reflectivity may vary in different countries. The base case assumption can be seen in the
Design tab under Advanced Settings: Key Assumptions for the Base Case. The typical default value is 30%. The
improved case has a default value of 70% which can be adjusted by the user. The actual solar reflectance /
reflectivity provided by the manufacturer must be provided for certification.
Compliance Guidance
At both the design and post-construction stage, it is important to ensure that the value obtained for the roof
material/finish is the solar reflectivity of the finish rather than an alternative indicator of performance. Solar
reflectivity is also referred to as solar reflectance (R). Other values that may be provided by a manufacturer
include the solar reflectance index (SRI), visible solar reflectance, the emittance, or gloss units, which are not
the same as solar reflectivity.
Design Stage Post-Construction Stage
At the design stage, the following must be used to
demonstrate compliance:
Building design drawings showing the roof
material and roof finish; or
Roof specification with solar reflectivity of the
roof surface indicated; or
Bill of quantities with the roof finish clearly
marked.
At the post-construction stage, the following must be
used to demonstrate compliance:
Photographs of the roof materials and finish (where
the finish is white, this can be awarded without
further evidence); and, either
A product data sheet for the materials and finish
(including the solar reflectivity value); or,
Delivery note and purchase documents indicating
that the specified roof finish has been delivered to
the construction site.

ENERGY EFFICIENCY MEASURES
© International Finance Corporation 2019. All rights reserved. EDGE User Guide 65
E04 – REFLECTIVE PAINT FOR EXTERNAL WALLS
Corresponds to HME03, RTE03, OFE03, HSE03, EDE03
Requirement Summary
This measure can be claimed if the solar reflectivity (albedo) of the external wall finish is greater than the local
base case as set out in the Key Assumptions for the Base Case in the Design section. EDGE will calculate any
improvement beyond the base case.
Intention
Specifying a reflective finish for the walls can reduce the cooling load in air-conditioned spaces and improve
thermal comfort in non-mechanically cooled spaces. Due to the reduction in surface temperature, the service
life of the finish can also be improved and the impact on the urban heat island effect6 can be reduced.
Approach/Methodologies
EDGE uses the solar reflectivity of the wall finish as the indicator of best practice. This is the part of the total
incident solar radiation that is reflected back from a surface. Unlike Visible Solar Reflectance, it includes the full
solar spectrum, but does not include the effect of emittance which is reflected in a metric such as Solar
Reflectance Index (SRI).
The solar reflectivity for specific wall finishes can be acquired from the product manufacturer. It is often
indicated in the product datasheet or laboratory test results published on manufacturers’ websites.
6 A city’s core temperature is often significantly higher than its surrounding area due to the retention of heat from the built
environment.

ENERGY EFFICIENCY MEASURES
© International Finance Corporation 2019. All rights reserved. EDGE User Guide 66
Table 19 provides an indication
of the ranges for different
materials but is meant only as a
guide. Manufacturers’ published
values must be used in the
EDGE assessment. If
manufacturer data is not
available, the EDGE reference
values may be used as an
exception.
Generic Wall Materials
Solar Reflectivity
New concrete 35-45%
New white Portland cement concrete 70-80%
Unpainted concrete masonry unit 40%
White Plaster 90%
White acrylic paint 70%
Light-colored acrylic paint (shades of white) 65%
Medium-colored acrylic paint (green, red, brown)
45%
Dark-colored acrylic paint (dark brown, blue) 25%
Dark blue, Black acrylic paint 15%
Fired clay bricks 17-56%
Red Brick 40%

ENERGY EFFICIENCY MEASURES
© International Finance Corporation 2019. All rights reserved. EDGE User Guide 67
Table 19: Solar reflectivity of typical wall finishes7
Potential Technologies/Strategies
The key consideration of the material used on the façade is its color and potential solar reflectivity.
Relationship to Other Measures
The impact that the solar reflectivity of the walls has upon the energy consumption in a building is dependent
on the insulation levels, as well as the approach used to cool the building and the efficiency of any cooling
systems.
The solar reflectivity of the wall finish has a decreased effect on the internal heat gains as the insulation levels
are increased. Super-insulated buildings may not benefit significantly from wall finishes with a high solar
7 Ranges are taken from various manufacturers’ websites.
Generic Wall Materials
Solar Reflectivity
New concrete 35-45%
New white Portland cement concrete 70-80%
Unpainted concrete masonry unit 40%
White Plaster 90%
White acrylic paint 70%
Light-colored acrylic paint (shades of white) 65%
Medium-colored acrylic paint (green, red, brown)
45%
Dark-colored acrylic paint (dark brown, blue) 25%
Dark blue, Black acrylic paint 15%
Fired clay bricks 17-56%
Red Brick 40%

ENERGY EFFICIENCY MEASURES
© International Finance Corporation 2019. All rights reserved. EDGE User Guide 68
reflectivity. Higher solar reflectivity values will have no effect on the energy consumption in passively cooled
buildings, but may have an impact on the EDGE rating due to occupant comfort.
As the efficiency of the cooling systems increases, the solar reflectivity will have a decreasing impact on
reducing the energy consumption.
A highly reflective surface might cause glare and should be taken into consideration by the design team.
Assumptions
The base case for solar reflectivity may vary in different countries. The base case assumption can be seen in the
Design tab under Advanced Settings: Key Assumptions for the Base Case. The typical default value is 30%. The
improved case has a default value of 70% which can be adjusted by the user. The actual solar reflectance /
reflectivity provided by the manufacturer must be provided for certification.
Compliance Guidance
At both the design and post-construction stage it is important to ensure that the value obtained for the wall
material/finish is the solar reflectivity of the finish rather than an alternative indicator of performance. Other
values that may be provided by a manufacturer include the solar reflectance index (SRI), visible solar
reflectance, the emittance or gloss units, which are not the same as solar reflectivity.
Design Stage Post-Construction Stage
At the design stage, the following must be used to
demonstrate compliance:
Building design drawings showing the wall finish;
or
Wall specification with solar reflectivity of the wall’s
surface indicated; or
Bill of quantities with the wall finish clearly marked.
At the post-construction stage, the following must be
used to demonstrate compliance:
Photographs of the wall materials and finish (where
the finish is white, this can be awarded without
further evidence); and, either
A product data sheet for the wall finish (including
the solar reflectivity value); or
A delivery note and purchase documents indicating
that the specified wall finish has been delivered to
the construction site.

ENERGY EFFICIENCY MEASURES
© International Finance Corporation 2019. All rights reserved. EDGE User Guide 69
E05* – INSULATION OF ROOF
Corresponds to HME05, HTE03, RTE05, OFE05, HSE05, EDE05
Requirement Summary
This measure refers to the U-value or thermal conductivity of materials as the indicator of performance, in
which the use of insulation improves the U-value. The user must select the measure for ‘Insulation of the Roof’
in the Energy tab in all cases except when the measure is not marked with an asterisk, or when the project U-
value is better than the baseline and a project chooses not to take credit for it (an auditor must verify this). The
U-value must be entered following the guidelines in the Approach/Methodologies section. Note that the measure
for ‘Roof insulation’ must also be selected in the Materials tab, and the actual insulation type and thickness
entered.
Savings from the measure can be claimed if the U-value of the roof is lower than the base case U-value listed in
the Key Assumptions for the Base Case in the Design section.
Intention
Insulation is used to prevent heat transmission from the external environment to the internal space (for warm
climates) and from the internal space to the external environment (for cold climates). Insulation aids in the
reduction of heat transmission by conduction8, so more insulation implies a lower U-value and better
performance. A well-insulated building has lower cooling and/or heating energy requirements.
Please note that many modern insulating materials, such as certain foam-based insulations, as well as air
cavities that improve the sustainability and energy efficiency of buildings also spread fire more easily compared
to traditional materials such as concrete and wood. The project team is encouraged to take proper fire safety
precautions in the selection of these materials and the associated design details such as fire stops.
Approach/Methodologies
This measure uses U-value, which is defined as the quantity of heat that flows through a unit area in unit time,
per unit difference in temperature; it is expressed in Watts per square meter Kelvin (W/m²K). U-value is an
indication of how much thermal energy (heat) is transmitted through a material (thermal transmittance). The U-
value, which is the performance indicator of this measure, is the reciprocal of the total thermal resistance9
(1/∑R) of the roof, which is calculated from the individual thermal resistance of each component/layer of the
roof.
If the default improved case is used, the design team must demonstrate that the U-value of the roof does not
exceed the U-value assumed by EDGE (see assumptions below). This can be obtained by the manufacturer or
8 Conduction is the process by which thermal energy moves within an object or between connected objects.
9 Thermal resistance is a measure of how much heat loss is reduced through the given thickness of a material. Thermal
resistance is expressed as the R, which is measured in square meters Kelvin per Watt (m²K/W).

ENERGY EFFICIENCY MEASURES
© International Finance Corporation 2019. All rights reserved. EDGE User Guide 70
by the “simple method” calculation, explained as follows. If a different U-value for the roof is used, then it must
be calculated with the following formula or in accordance with the “combined method”10 given in ISO 6946. For
multiple roof types with different U-values, use an area-weighted average.
Simple method of calculating the U-value: 𝑈 − 𝑉𝑎𝑙𝑢𝑒 = 1
𝑅𝑠𝑖+𝑅𝑠𝑜+𝑅1+𝑅2+𝑅3 𝑒𝑡𝑐
Where: Rsi = Resistance of the air layer on the inner side of the roof (add constant of air)
Rso = Resistance of the air layer on the external side of the roof
R1,2 etc. = Resistance of each material layer within the roof
The resistance of a roof material is derived by the following formula: 𝑅 = 𝑑
Where: d = Thickness of the layer of material (m)
= Thermal conductivity11 in W/m K
As seen in the formula above, the insulating capacity is a direct function of the thickness of the material. Table
20 demonstrates how to achieve a U-value of 0.45W/m² K, with the thickness of certain insulation materials
indicated. The actual thickness required will depend on many other factors, including the fixing method, roof
construction and position of the insulation within the material layers.
10 Several websites give worked examples for the calculation of the U-value according to the “combined method:”
1. Conventions for U-value calculations, Brian Anderson, BRE, 2006.
http://www.bre.co.uk/filelibrary/pdf/rpts/BR_443_(2006_Edition).pdf
2. Worked examples of U-value calculations using the combined method, The Scottish Government, 2009 - http://www.scotland.gov.uk/Resource/Doc/217736/0088293.pdf
3. Determining U-values for real building elements, CIBSE - http://www.cibsejournal.com/cpd/2011-06/
11 Thermal conductivity is a standardized measure of how easily heat flows through any specific material, independent of
material thickness. It is measured in Watts per meter Kelvin (W/m K), and is often expressed as the “K Value” or “”.

ENERGY EFFICIENCY MEASURES
© International Finance Corporation 2019. All rights reserved. EDGE User Guide 71
Table 20: Thickness of insulation required to achieve a U-value of 0.45 W/m² K
Insulation Type
Thickness (mm)
Approximate values to achieve a U-
value of 0.45W/m2 K
Thermal Conductivity
(W/m K)
Vacuum Insulated Panels 10 - 20mm 0.008
Polyurethane (PU) 40 - 80mm 0.020 - 0.038
Polyisocyanurate (PIR) 40 - 60mm 0.022 - 0.028
Phenolic Foam (PF) 40 - 55mm 0.020 - 0.025
Expanded Polystyrene (EPS) 60 - 95mm 0.030 - 0.045
Extruded Polystyrene (XPS) 50 - 80mm 0.025 - 0.037
Wool and Fiberglass 60 - 130mm 0.030 - 0.061
Source: Insulation Materials Chart, Energy Savings Trust, 2004.
EDGE provides a built-in calculator for calculating the U-value of a roof with multiple layers of materials layered
on top of each other. For more complex assemblies, for example, if the materials are not in continuous layers or
metal penetrations punctuate the roof, dedicated U-value calculation software or energy modelling software can
also be used.

ENERGY EFFICIENCY MEASURES
© International Finance Corporation 2019. All rights reserved. EDGE User Guide 72
Potential Technologies/Strategies
Insulating the roof is potentially the most cost-effective way to reduce the energy used for heating a building.
Therefore, in cold or temperate climates there is a strong case for maximizing the insulation before designing
the heating ventilation and air conditioning equipment. In hot climates insulating the roof can reduce heat gain,
but the effect is relatively minor.
Different types of insulation are available, and the appropriate type will depend on the application as well as
cost and availability. Insulation types can be grouped into four main categories, as shown in Table 21.
Table 21. Insulation types and typical conductivity range
Insulation Type
Description
Typical
Conductivity Range
( - K Value)
Matting, Blanket,
or Quilt
Insulation
This type of insulation is sold in rolls of different thicknesses and is typically
made from mineral wool (fiber made from glass or rock). Some common uses
include insulating empty lofts, stud walls, and under suspended timber floors.
Other materials such as sheep’s wool are also available.
0.034 – 0.044
Loose-fill Material Loose-fill material, made of cork granules, vermiculite, mineral wool, or
cellulose fiber is usually poured between the joists to insulate lofts. It is ideal
for loft spaces with awkward corners or obstructions, or if the joists are
irregularly spaced.
0.035 – 0.055
Blown Insulation
Blown insulation is made from cellulose fibers or mineral wool. Spray foam
insulation is made from Polyurethane (PUR). Blown insulation should only be
installed by professionals, who use special equipment to blow the material into
a specific, sectioned-off area, to the required depth. The material may remain
loose if used for loft insulation, but can also bond to a surface (and itself) for
insulating stud walls and other spaces.
0.023 – 0.046
Rigid Insulation
Boards
Rigid insulation boards are mostly made from foamed plastic such as
polystyrene, polyurethane (PUR), or polyisocyanurate (PIR), which can be
used to insulate walls, floors, and ceilings. PUR and PIR board are among the
best insulation materials commonly used, and so are useful where space is
limited. Rigid board must be cut to size, so fitting is often a skilled job.
0.02 – 0.081
The range of thermal conductivity can be used by auditors and reviewers to check for reasonableness of the
project team’s claims about insulation properties. It can also be used as a substitute in the rare case when
manufacturer data is not available.
Relationship to Other Measures
Selecting this measure will show an increase in the environmental impact in the materials section due to the
addition of insulation material (reflected as a negative percent improvement).

ENERGY EFFICIENCY MEASURES
© International Finance Corporation 2019. All rights reserved. EDGE User Guide 73
However, by increasing the level of insulation the heating and/or cooling loads will be reduced. Increasing the
levels of insulation could therefore reduce the cost and environmental impact of the heating and cooling plant,
leading to energy savings that more than compensate for the negative impacts in the materials section.
Assumptions
The base case insulation assumed in the roof varies by building type and location. The base case U-value can be
seen in the Advanced Settings: Key Assumptions for the Base Case in the Design tab. The default value for the
improved case is that the actual U-value is better (lower) than the base case listed in the Key Assumptions.
Compliance Guidance
To claim savings from this measure, it is necessary to demonstrate that the U-value of the complete roof
specification is better (lower) than the base case as listed in the Key Assumptions for the Base Case in the
Design section. If the EDGE default for the improved case U-value is used, then it is only necessary to
demonstrate that insulation has been or will be installed, and that its U-value does not exceed the default
improved case value. The U-value is the reciprocal of the sum of the R-values for each component of the roof
structure.
If a U-value has been entered that exceeds the improved case, then it is necessary to confirm that the U-value
was calculated in accordance with the “combined method” given in ISO 6946 as shown in the
Approach/Methodologies above.
Design Stage Post-Construction Stage
At the design stage, the following evidence must be
used to demonstrate compliance:
A roof construction detail drawing showing the
insulation material. Ideally, the roof detail drawing
should be annotated with the U-value of the roof;
and
Calculations of U-value either using the formula
provided or U-value calculators; or
Manufacturer’s data sheet of specified insulation
material for the roof.
Since the insulation material will not be visible at the
post-construction stage, it must be demonstrated that
the insulation material specified at the design stage
was delivered to the site. The following must be used
to demonstrate compliance:
Photographs of the roof construction at a point
when the insulation material was visible; and
Delivery note confirming that the insulation
material was delivered to the site; and
Updated calculations for the U-value if the
thickness and type of insulation have changed from
the original design.

ENERGY EFFICIENCY MEASURES
© International Finance Corporation 2019. All rights reserved. EDGE User Guide 74
E06* – INSULATION OF EXTERNAL WALLS
Corresponds to HME06, HTE04, RTE06, OFE06, HSE06, EDE06
Requirement Summary
This measure refers to U-value as the indicator of performance, in which the use of insulation improves the U-
value. The measure can be claimed if the U-value of the external walls is lower than the base case U-value
listed in the Key Assumptions for the Base Case in the Design section. The user must select the measure for
‘Insulation of the External Walls’ in the Energy tab in all cases except when the measure is not marked with an
asterisk, or when the project U-value is better than the baseline and a project chooses not to take credit for it
(an auditor must verify this).
The actual U-value of the wall should be entered in the software by selecting the measure for ‘Insulation of
External Walls’ in the Energy tab. For multiple exterior wall types with different U-values, use an area-weighted
average. Note that the measure for ‘Wall Insulation’ should also be selected in the Materials tab, and the actual
insulation type and thickness entered.
Intention
Insulation is used to prevent heat transmission from the external environment to the internal space (for warm
climates) and from the internal space to the external environment (for cold climates). Insulation aids in the
reduction of heat transmission by conduction12, so more insulation implies a lower U-value and better
performance. A well-insulated building has lower cooling and/or heating energy requirements.
Please note that many modern insulating materials, such as certain foam-based insulations, as well as air
cavities that improve the sustainability and energy efficiency of buildings also spread fire more easily than
traditional materials such as concrete and wood. The project team is encouraged to take proper fire safety
precautions in the selection of these materials and the associated design details such as fire stops.
Approach/Methodologies
This measure uses U-value, which is defined as the quantity of heat that flows through unit area in unit time,
per unit difference in temperature; it is expressed in Watts per square meter Kelvin (W/m²K). U-value is an
indication of how much thermal energy (heat) is transmitted through a material (thermal transmittance). The U-
value, which is the performance indicator of this measure, is the reciprocal of the total thermal resistance13
(1/∑R) of the external walls, which is calculated from the individual thermal resistance of each component/layer
of each external wall.
12 Conduction is the process by which thermal energy moves within an object or between connected objects.
13 Thermal resistance is a measure of how much heat loss is reduced through a given thickness of a material. Thermal
resistance is expressed as the R, which is measured in square meters Kelvin per Watt (m²K/W).

ENERGY EFFICIENCY MEASURES
© International Finance Corporation 2019. All rights reserved. EDGE User Guide 75
If the default improved case is used (as shown in EDGE as the top insulation material in the dropdown), the
design team must demonstrate that the U-value of the external walls does not exceed the U-value assumed by
EDGE. This can be obtained by the manufacturer or by the “simple method” calculation, which is explained as
follows. If a different U-value for the external walls is used, then it must be calculated with the following
formula or in accordance with the “combined method”14 given in ISO 6946.
Simple method of calculating the U-value: 𝑼 − 𝑽𝒂𝒍𝒖𝒆 = 𝟏
𝑹𝒔𝒊+𝑹𝒔𝒐+𝑹𝟏+𝑹𝟐+𝑹𝟑 𝒆𝒕𝒄
Where: Rsi = Resistance of air layer on the inner side of the external wall (add constant of air)
Rso = Resistance of air layer on the external side of the external wall
R1, 2 etc. = Resistance of each layer material within the external wall
The resistance of a wall material is derived by the following formula: 𝑹 = 𝒅
Where: d = Thickness of the layer of material (m)
= Thermal conductivity15 in W/m K
As seen in the formula above, the insulating capacity is a direct function of the thickness of the material. Table
22 demonstrates how to achieve a U-value of 0.45W/m² K for a certain thickness. The actual thickness required
will depend on many other factors, including the fixing method, wall construction, and the position of the
insulation within the material layers.
14 Several websites give worked examples for the calculation of the U-value according to the “combined method:”
4. Conventions for U-value calculations, Brian Anderson, BRE, 2006.
http://www.bre.co.uk/filelibrary/pdf/rpts/BR_443_(2006_Edition).pdf
5. Worked examples of U-value calculations using the combined method, The Scottish Government, 2009 - http://www.scotland.gov.uk/Resource/Doc/217736/0088293.pdf
6. Determining U-values for real building elements, CIBSE - http://www.cibsejournal.com/cpd/2011-06/
15 Thermal conductivity is a standardized measure of how easily heat flows through any specific material, independent of
material thickness. It is measured in Watts per meter Kelvin (W/m K), and is often expressed as the “K Value” or “”.
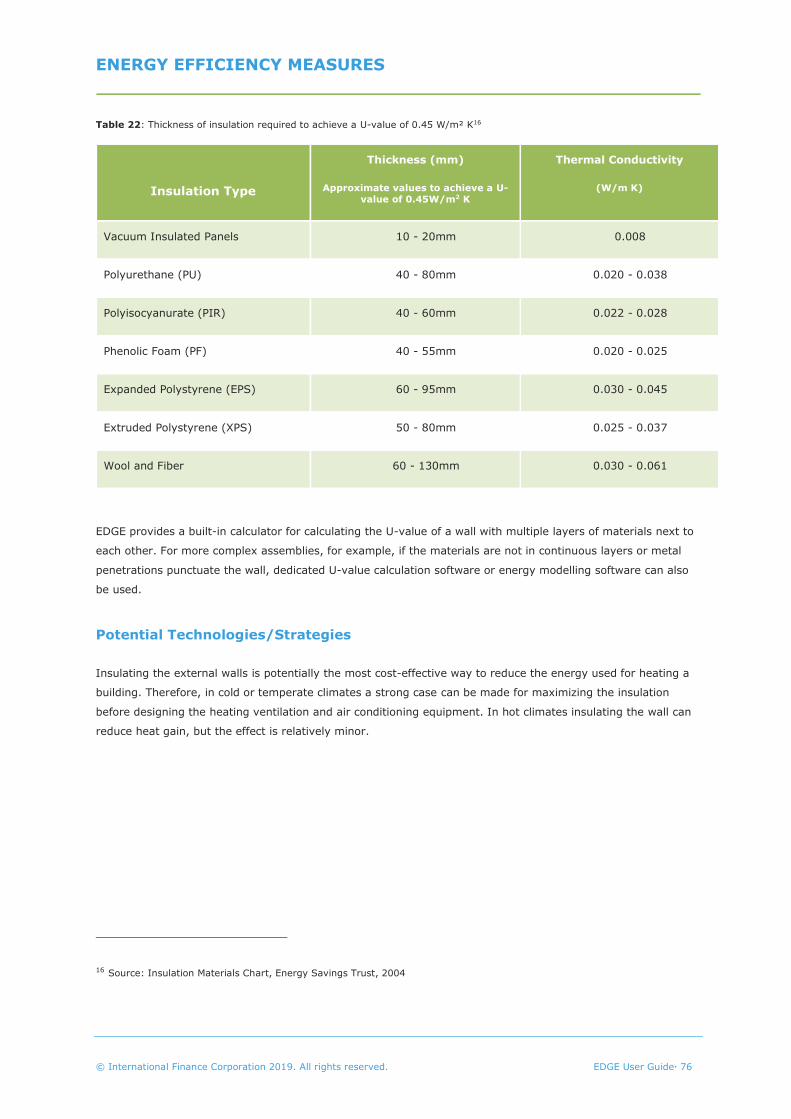
ENERGY EFFICIENCY MEASURES
© International Finance Corporation 2019. All rights reserved. EDGE User Guide 76
Table 22: Thickness of insulation required to achieve a U-value of 0.45 W/m² K16
Insulation Type
Thickness (mm)
Approximate values to achieve a U-
value of 0.45W/m2 K
Thermal Conductivity
(W/m K)
Vacuum Insulated Panels 10 - 20mm 0.008
Polyurethane (PU) 40 - 80mm 0.020 - 0.038
Polyisocyanurate (PIR) 40 - 60mm 0.022 - 0.028
Phenolic Foam (PF) 40 - 55mm 0.020 - 0.025
Expanded Polystyrene (EPS) 60 - 95mm 0.030 - 0.045
Extruded Polystyrene (XPS) 50 - 80mm 0.025 - 0.037
Wool and Fiber 60 - 130mm 0.030 - 0.061
EDGE provides a built-in calculator for calculating the U-value of a wall with multiple layers of materials next to
each other. For more complex assemblies, for example, if the materials are not in continuous layers or metal
penetrations punctuate the wall, dedicated U-value calculation software or energy modelling software can also
be used.
Potential Technologies/Strategies
Insulating the external walls is potentially the most cost-effective way to reduce the energy used for heating a
building. Therefore, in cold or temperate climates a strong case can be made for maximizing the insulation
before designing the heating ventilation and air conditioning equipment. In hot climates insulating the wall can
reduce heat gain, but the effect is relatively minor.
16 Source: Insulation Materials Chart, Energy Savings Trust, 2004

ENERGY EFFICIENCY MEASURES
© International Finance Corporation 2019. All rights reserved. EDGE User Guide 77
Different types of insulation are available, and the appropriate type will depend on the application as well as
cost and availability. Insulation types can be grouped into four main categories, as shown in Table 23:
Table 23. Insulation types and typical conductivity range
Insulation Type
Description
Typical
Conductivity Range
( - K Value)
Matting, Blanket,
or Quilt
Insulation
This type of insulation is sold in rolls of different thicknesses and is typically
made from mineral wool (fiber made from glass or rock). Some common uses
include insulating empty lofts, stud walls, and under suspended timber floors.
Other materials such as sheep’s wool are also available.
0.034 – 0.044
Loose-fill Material Loose-fill material, made of cork granules, vermiculite, mineral wool, or
cellulose fiber is usually poured between the joists to insulate lofts. It is ideal
for loft spaces with awkward corners or obstructions, or if the joists are
irregularly spaced.
0.035 – 0.055
Blown Insulation
Blown insulation is made from cellulose fibers or mineral wool. Spray foam
insulation is made from Polyurethane (PUR), and should only be installed by
professionals, who use special equipment to blow the material into a specific,
sectioned-off area, to the required depth. The material may remain loose if
used for loft insulation, but can also bond to a surface (and itself) for
insulating stud walls and other spaces.
0.023 – 0.046
Rigid Insulation
Boards
Rigid insulation boards are mostly made from foamed plastic such as
polystyrene, polyurethane (PUR), or polyisocyanurate (PIR), which can be
used to insulate walls, floors, and ceilings. PUR and PIR board are among the
best insulation materials commonly used, and so are useful where space is
limited. Rigid board has to be cut to size, so fitting is often a skilled job.
0.02 – 0.081
Auditors and reviewers can use the range of thermal conductivity to check for reasonableness of the project
team’s claims about insulation properties. The range can also be applied as a substitute in the rare case when
manufacturer data is not available.

ENERGY EFFICIENCY MEASURES
© International Finance Corporation 2019. All rights reserved. EDGE User Guide 78
Relationship to Other Measures
Selecting this measure will show an increase in the environmental impact in the materials section due to the
addition of insulation material (reflected as a negative percentage impact).
By increasing the level of insulation, the heating and/or cooling loads will be reduced. Increasing the levels of
insulation could therefore reduce the cost and environmental impact of the heating and cooling plant.
If this measure is not selected, which assigns the Wall a U-value, a U-value will be assigned to the wall via the
selection of the Exterior Wall Material. Changing the wall material will change the heat transfer through the wall
which will impact the building’s energy use.
Assumptions
The base case insulation assumed in the roof varies by building type and location. The base case U-value can be
seen in the Advanced Settings: Key Assumptions for the Base Case in the Design tab. The default value for the
improved case is that the actual U-value is better (lower) than the base case listed in the Key Assumptions.
Compliance Guidance
To claim this measure, it is necessary to demonstrate that the U-value of the complete external walls
specification is better (lower) than the base case as listed in the Key Assumptions for the Base Case in the
Design section. If the EDGE default for the improved case U-value is used, then it is only necessary to
demonstrate that insulation has been or will be installed, and that the U-value of the External Walls does not
exceed the base case.
If a user-input U-value exceeds the default improved case value, then it is necessary to confirm that the U-
value has been calculated in accordance with the “simple” or “combined” method as shown in the
Approach/Methodologies above.
Design Stage Post-Construction Stage
At the design stage, the following must be used to
demonstrate compliance:
External walls construction detail drawing showing
the insulation material. Ideally the external walls
detail drawing should be annotated with the U-
value of the external walls; and
Calculations of U-value either using the formula or
U-value calculators; or
Manufacturer’s data sheet of specified insulation
material for the external walls.
Since the insulation material will not be visible at the
post-construction stage, it must be demonstrated that
the insulation material specified at the design stage
was delivered to the site. The following must be used
to demonstrate compliance:
Photographs of the external wall construction at a
point when the insulation material was visible; and
Delivery note confirming that the insulation
material was delivered to the site; and
Updated calculations for U-value if the thickness
and type of insulations have changed from the
original design.

ENERGY EFFICIENCY MEASURES
© International Finance Corporation 2019. All rights reserved. EDGE User Guide 79
E07 – LOW-E COATED GLASS
Corresponds to HME07, HTE05, RTE07, OFE07, HSE07, EDE07
Requirement Summary
This measure can be claimed if Low Emissivity (Low-E) coated glazing is used.
Even if the U-value of the actual window in the building is worse (higher) than the base case value, the measure
must be selected, and the U-value entered when the measure is required (marked with an asterisk). For
example, this could happen in countries where double glazing is the norm for office buildings, making the base
case values quite good. The same principle is applicable to SHGC, i.e. if the SHGC is different from the base
case assumption, the measure must be selected and the actual SHGC must be entered.
Intention
The addition of a Low-E coating to glazing reduces the transference of heat from one side to the other by
reflecting thermal energy. Low-E coatings are microscopically thin metal or metallic oxide layers that are
deposited on a glass surface to help keep heat on the same side of the glass from which it originated. In warm
climates the intention is to reduce heat gain, and in cold climates the intention is to reflect interior warmth back
indoors.
Approach/Methodologies
Low-E coating reduces the Solar Heat Gain Coefficient (SHGC) and thermal conductivity (U-Value) of the
glazing. These concepts are explained as follows:
The SHGC is expressed as a number between 0 and 1 and indicates the fraction of incident solar radiation
admitted through a window, both directly transmitted and absorbed and subsequently released inward17. A solar
heat gain coefficient indicates lesser solar heat transmitted.
All Low-E glass will have a reduced U-Value compared to plain glass; however, the product’s solar heat gain
performance determines its appropriateness for a particular climate. For warm climates, Low-E glass with a low
SHGC helps reduce unwanted solar gains but in cold climates, Low-E glazing that has minimal impact on SHGC
is more desirable.
In both warm and cold climates, the lower U-Value of Low-E glazing is an advantage. Manufacturers often
provide separate U-Values for summer and winter (or the heating and cooling seasons). A simple approach is to
calculate the average of these two values. If an alternative approach is used to calculate the seasonal average,
then this must be justified. For example, an acceptable justification is if the building is in an area that lacks a
17 http://www.efficientwindows.org/shgc.php (accessed 3/28/18)
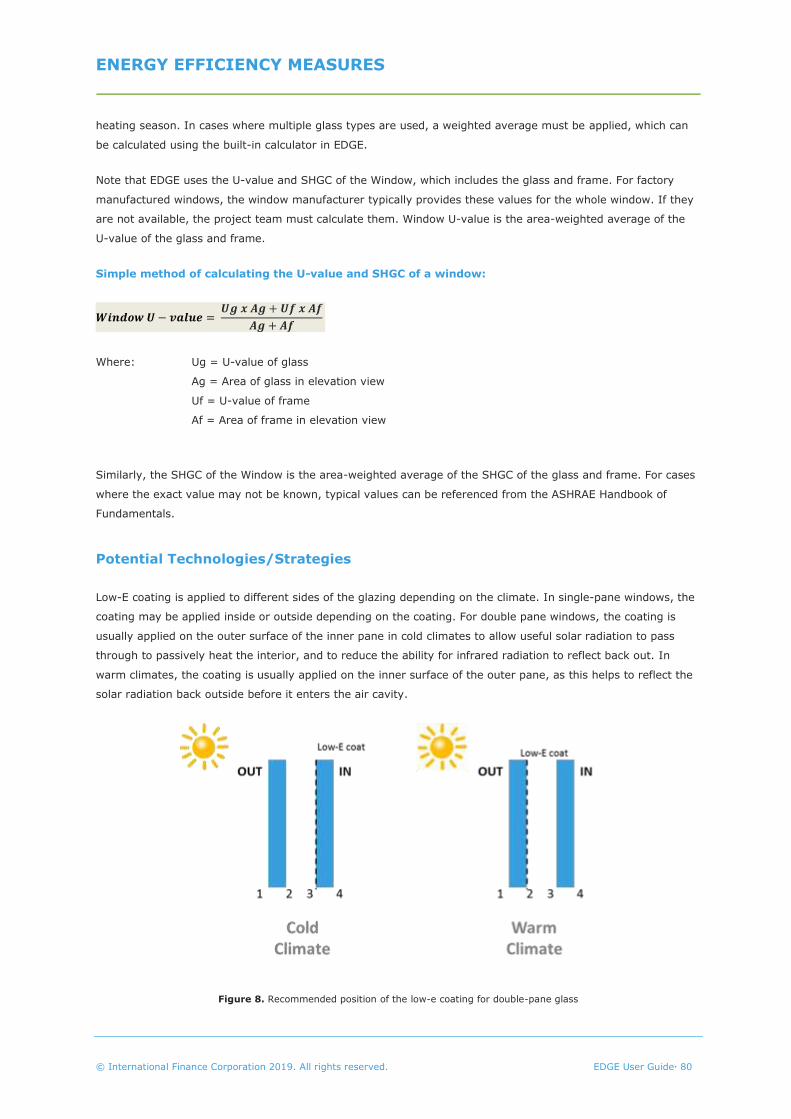
ENERGY EFFICIENCY MEASURES
© International Finance Corporation 2019. All rights reserved. EDGE User Guide 80
heating season. In cases where multiple glass types are used, a weighted average must be applied, which can
be calculated using the built-in calculator in EDGE.
Note that EDGE uses the U-value and SHGC of the Window, which includes the glass and frame. For factory
manufactured windows, the window manufacturer typically provides these values for the whole window. If they
are not available, the project team must calculate them. Window U-value is the area-weighted average of the
U-value of the glass and frame.
Simple method of calculating the U-value and SHGC of a window:
𝑾𝒊𝒏𝒅𝒐𝒘 𝑼 − 𝒗𝒂𝒍𝒖𝒆 = 𝑼𝒈 𝒙 𝑨𝒈 + 𝑼𝒇 𝒙 𝑨𝒇
𝑨𝒈 + 𝑨𝒇
Where: Ug = U-value of glass
Ag = Area of glass in elevation view
Uf = U-value of frame
Af = Area of frame in elevation view
Similarly, the SHGC of the Window is the area-weighted average of the SHGC of the glass and frame. For cases
where the exact value may not be known, typical values can be referenced from the ASHRAE Handbook of
Fundamentals.
Potential Technologies/Strategies
Low-E coating is applied to different sides of the glazing depending on the climate. In single-pane windows, the
coating may be applied inside or outside depending on the coating. For double pane windows, the coating is
usually applied on the outer surface of the inner pane in cold climates to allow useful solar radiation to pass
through to passively heat the interior, and to reduce the ability for infrared radiation to reflect back out. In
warm climates, the coating is usually applied on the inner surface of the outer pane, as this helps to reflect the
solar radiation back outside before it enters the air cavity.
Figure 8. Recommended position of the low-e coating for double-pane glass

ENERGY EFFICIENCY MEASURES
© International Finance Corporation 2019. All rights reserved. EDGE User Guide 81
Two types of Low-E coating are available: hard coat and soft coat. Only hard coat (pyrolytic coating) should be
used in single-glazed units as it is more durable than soft coat (sputter coating).
▪ Hard Coat Low-E: Hard coat Low-E, or pyrolytic coating, is a coating applied at high temperatures
and is sprayed onto the glass surface during the float glass process. The coating process, known as
Chemical Vapor Deposition (CVD), uses a variety of chemicals including silicon, silicon oxides, titanium
dioxide, aluminum, tungsten, and many others. The vapor is directed at the glass surface and forms a
covalent bond with the glass, so the result is hard wearing.
▪ Soft Coat Low-E: Soft coat Low-E, or sputter coating, is applied in multiple layers of optically
transparent silver sandwiched between layers of metal oxide in a vacuum chamber. This process
provides the highest level of performance and a nearly invisible coating. However, it is highly
susceptible to damage from handling (recommended in double glazing units).
Table 24 shows a range of U-Values and SHGC values for different types of glazing, and provides guidance for
the selection of glazing. However, this data varies from manufacturer to manufacturer; for certification purposes
actual values from the manufacturer must be provided. In addition, many manufacturers' literature indicates
the Solar Coefficient (SC) instead of the SHGC, with the conversion equation as follows:
𝑆𝐻𝐺𝐶 = 𝑆𝐶 𝑋 0.87
Table 24: Approximate SHGC and U-values for different glazing types
Glass Configuration Approximate
SHGC
Approximat
e U-value
[W/m2 K] Type of
Glass
Performance Thickness
(mm)
Color Coated
Single
glass
Medium solar control 6 mm
(Double)
Gold Hard (Pyrolytic) 0.45 2.69-2.82
Good solar control
6 mm Blue / Green Soft (sputtered)
Hard (Pyrolytic)
0.36 – 0.45
0.33 - 0.41
3.01 -3.83
2.84 – 3.68
8 mm Blue / Green Soft (sputtered)
Hard (Pyrolytic)
0.32
0.30 - 0.37
2.99 – 3.79
2.82 – 3.65
6 mm Bronze Soft (sputtered) 0.45 3.01 -3.83
6 mm Grey Soft (sputtered)
Hard (Pyrolytic)
0.41
0.36
3.01 -3.83
2.84 – 3.68
8 mm Grey Hard (Pyrolytic) 0.32 2.82 – 3.65
6 mm Clear Hard (Pyrolytic) 0.52 2.83 -3.68
8 mm Clear Hard (Pyrolytic) 0.51 2.81 -3.65
Relationship to Other Measures
Applying a Low-E coating either reduces the heat load by reducing the heat loss through the glazing, or reduces
the cooling load by reducing the solar heat gain. As with other measures which relate to the improvement of the
building fabric, addressing and optimizing performance is cheaper to do before sizing/selecting heating,
ventilation, and the air-conditioning plant.
Care must be taken in cold climates, because as the U-Value is reduced, the SHGC is reduced even further for
many coatings. Therefore, although a Low-E glass with a very low U-Value may appear to be a good choice, the
performance may actually be worse if it has low SHGC that reduces heat gain from the sun and increases
heating requirements. In those cases, a window with low U-value but with a higher solar heat gain coefficient
(SHGC) is the right selection.

ENERGY EFFICIENCY MEASURES
© International Finance Corporation 2019. All rights reserved. EDGE User Guide 82
Note that if the Higher Performance Glass measure is also claimed, then this measure will not contribute to the
calculation of savings.
Assumptions
The base case values for the U-Value and SHGC of the window are included in the Key Assumptions for the Base
Case in the Design section. These can vary based on several factors such as location and building type. The
default values for the improved case assumptions for a window with Low-E coated glass are a U-value of 3
W/m² K and an SHGC of 0.45.
Compliance Guidance
When the project has multiple types of glazing with multiple U-values and SHGC, a weighted average U-value
and SHGC must be entered in the user entry fields.
The following information must be provided to show compliance at the design and post-construction stages:
Design Stage Post-Construction Stage
At the design stage, the following must be used to
demonstrate compliance:
Manufacturer’s data sheets showing the seasonal
average U-Value for the window (including glass
and frame) and the solar heat gain coefficient
(SHGC) of the glass and frame; and
A list of different types of window included in the
design (window schedule).
At the post-construction stage, the following must be
used to demonstrate compliance:
Photographs of the glazing units installed;
Purchase receipts and delivery notes for the
glazing; and
Manufacturer’s data sheets showing the seasonal
average U-Value for the window (including glass
and frame) and the solar heat gain coefficient
(SHGC) of the glass and frame.

ENERGY EFFICIENCY MEASURES
© International Finance Corporation 2019. All rights reserved. EDGE User Guide 83
E08 – HIGH THERMAL PERFORMANCE GLASS
Corresponds to HME08, HTE06, OFE08, HSE08
Requirement Summary
This measure can be claimed if the glazing is multi-paned (double or triple) and has a superior thermal
performance.
Even if the U-value of the actual window in the building is worse (higher) than the base case value, the measure
must be selected and the U-value entered when the measure is required (marked with an asterisk). For
example, this could happen in countries where double glazing is the norm for office buildings, making the base
case values quite good. The same principle is applicable to SHGC, i.e. if the SHGC is different from the base
case assumption, the measure must be selected and the actual SHGC must be entered.
Intention
By selecting double or triple glazing, which has an improved thermal performance as well as a coating (tinted
glass or Low-E) the heat transfer is reduced further than with low-E coating alone, and an even lower SHGC can
be achieved.
Approach/Methodologies
Double or triple glazing or coating reduces the Solar Heat Gain Coefficient (SHGC) and thermal conductivity (U-
Value) of the glazing. These concepts are explained as follows:
The SHGC is expressed as a number between 0 and 1 and indicates the fraction of incident solar radiation
admitted through a window, both directly transmitted and absorbed and subsequently released inward18. A solar
heat gain coefficient indicates lesser solar heat transmitted.
All Low-E glass will have a reduced U-Value compared to plain glass; however, the product’s solar heat gain
performance determines its appropriateness for a given climate. For warm climates, Low-E glass with a low
SHGC helps reduce unwanted solar gains but in cold climates, Low-E glazing that has minimal impact on solar
gains is required.
In both warm and cold climates, the lower U-Value of Low-E glazing is an advantage. Manufacturers often
provide separate U-Values for summer and winter (or the heating and cooling seasons). A simple approach is to
calculate the average of these two values. If an alternative approach is used to calculate the seasonal average,
then this must be justified. For example, an acceptable justification is that the building is in an area without a
heating season.
18 http://www.efficientwindows.org/shgc.php (accessed 3/28/18)
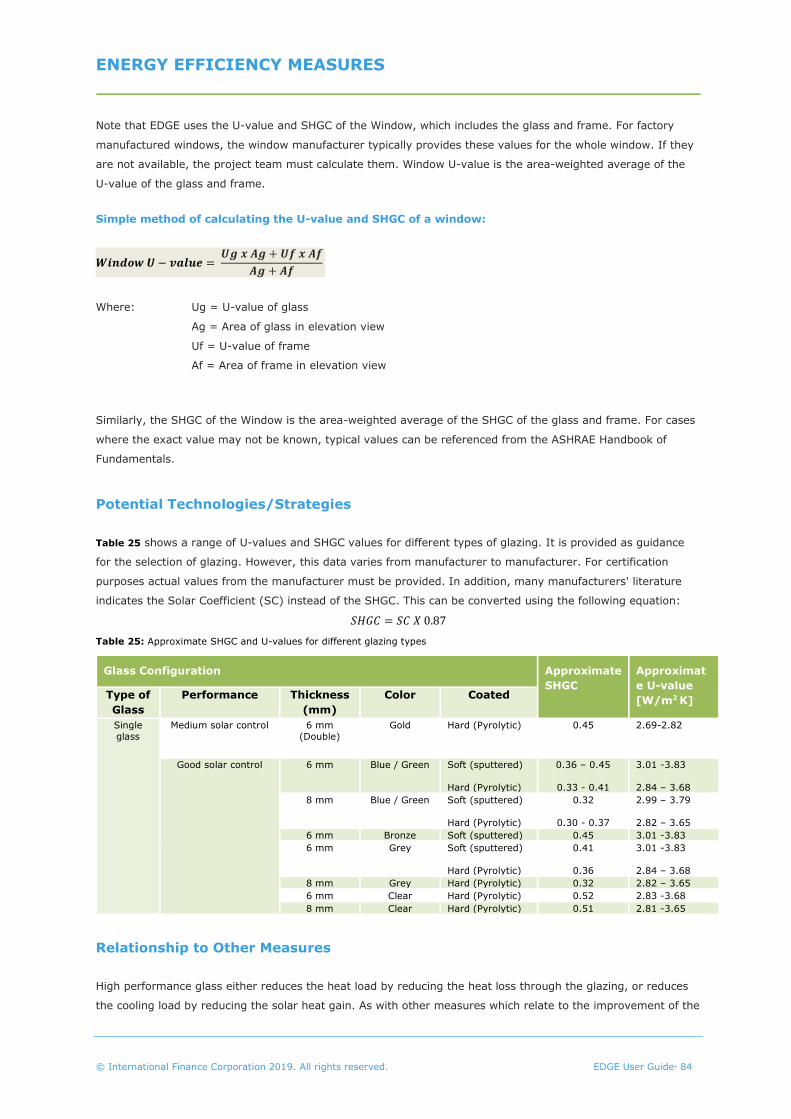
ENERGY EFFICIENCY MEASURES
© International Finance Corporation 2019. All rights reserved. EDGE User Guide 84
Note that EDGE uses the U-value and SHGC of the Window, which includes the glass and frame. For factory
manufactured windows, the window manufacturer typically provides these values for the whole window. If they
are not available, the project team must calculate them. Window U-value is the area-weighted average of the
U-value of the glass and frame.
Simple method of calculating the U-value and SHGC of a window:
𝑾𝒊𝒏𝒅𝒐𝒘 𝑼 − 𝒗𝒂𝒍𝒖𝒆 = 𝑼𝒈 𝒙 𝑨𝒈 + 𝑼𝒇 𝒙 𝑨𝒇
𝑨𝒈 + 𝑨𝒇
Where: Ug = U-value of glass
Ag = Area of glass in elevation view
Uf = U-value of frame
Af = Area of frame in elevation view
Similarly, the SHGC of the Window is the area-weighted average of the SHGC of the glass and frame. For cases
where the exact value may not be known, typical values can be referenced from the ASHRAE Handbook of
Fundamentals.
Potential Technologies/Strategies
Table 25 shows a range of U-values and SHGC values for different types of glazing. It is provided as guidance
for the selection of glazing. However, this data varies from manufacturer to manufacturer. For certification
purposes actual values from the manufacturer must be provided. In addition, many manufacturers' literature
indicates the Solar Coefficient (SC) instead of the SHGC. This can be converted using the following equation:
𝑆𝐻𝐺𝐶 = 𝑆𝐶 𝑋 0.87
Table 25: Approximate SHGC and U-values for different glazing types
Glass Configuration Approximate
SHGC
Approximat
e U-value
[W/m2 K] Type of
Glass
Performance Thickness
(mm)
Color Coated
Single
glass
Medium solar control 6 mm
(Double)
Gold Hard (Pyrolytic) 0.45 2.69-2.82
Good solar control
6 mm Blue / Green Soft (sputtered)
Hard (Pyrolytic)
0.36 – 0.45
0.33 - 0.41
3.01 -3.83
2.84 – 3.68
8 mm Blue / Green Soft (sputtered)
Hard (Pyrolytic)
0.32
0.30 - 0.37
2.99 – 3.79
2.82 – 3.65
6 mm Bronze Soft (sputtered) 0.45 3.01 -3.83
6 mm Grey Soft (sputtered)
Hard (Pyrolytic)
0.41
0.36
3.01 -3.83
2.84 – 3.68
8 mm Grey Hard (Pyrolytic) 0.32 2.82 – 3.65
6 mm Clear Hard (Pyrolytic) 0.52 2.83 -3.68
8 mm Clear Hard (Pyrolytic) 0.51 2.81 -3.65
Relationship to Other Measures
High performance glass either reduces the heat load by reducing the heat loss through the glazing, or reduces
the cooling load by reducing the solar heat gain. As with other measures which relate to the improvement of the

ENERGY EFFICIENCY MEASURES
© International Finance Corporation 2019. All rights reserved. EDGE User Guide 85
building fabric, addressing and optimizing performance is cheaper to do before sizing/selecting heating,
ventilation, and the air-conditioning plant. If the Higher Performance Glass measure is claimed, then this
measure will not contribute to the calculation of savings.
Particular care must be taken in cold climates; although a Low-E glass with a very low U-value appears to be a
good choice, it may actually have worse performance if it also has low SHGC solar heat gain that blocks the
warmth of the sun and increases heating requirements. In those cases, a double or triple layer glass with a high
solar heat gain coefficient is the right selection.
Assumptions
The Key Assumptions for the Base Case in the Design section show the base case values for the U-value and
SHGC of the window. The default values for the improved case for high thermal performance windows are a U-
value of 1.95 W/m² K and an SHGC of 0.28.
Compliance Guidance
When a project has multiple types of glazing with multiple U-values and SHGC, a weighted average U-value and
SHGC can be entered into the user entry fields.
The following information must be provided to show compliance at the design and post-construction stages:
Design Stage Post-Construction Stage
At the design stage, the following must be used to
demonstrate compliance:
Manufacturer’s data sheets showing the seasonal
average U-value for the window (including glass
and frame) and the solar heat gain coefficient
(SHGC) of the glass and frame; and
A list of different types of windows included in the
design (window schedule).
At the post-construction stage, the following must be
used to demonstrate compliance:
Photographs of the glazing units installed;
Purchase receipts and delivery notes for the
glazing; and
Manufacturer’s data sheets showing the seasonal
average U-value for the glazing (including glass
and frame) and the solar heat gain coefficient
(SHGC) of the glass and frame.

ENERGY EFFICIENCY MEASURES
© International Finance Corporation 2019. All rights reserved. EDGE User Guide 86
E09 – INSULATION FOR COLD STORAGE ENVELOPE
Corresponds to RTE34
Requirement Summary
This measure can be claimed if the project improves the U-value, which indicates the thermal performance, of
any of these elements of the building:
• Exterior walls
• Internal walls
• Floor slabs
• Roof slabs, and
• Window Glass
The actual U-values of the respective elements should be entered in the software in the Energy tab. For multiple
element types with different U-values, use an area-weighted average. Note that for exterior walls or roofs with
insulation, the measure for ‘Wall Insulation’ or ‘Roof Insulation’ should also be selected in the Materials tab, and
the actual insulation type and thickness entered.
Intention, Approach/Methodologies, Potential Technologies/Strategies,
Relationship to Other Measures, Assumptions
For details on the above, see similar measure descriptions for Insulated walls, Roofs, Low-e coated glass, and
High-performance glass previously described in this user guide.
Compliance Guidance
This measure has several components. To claim any component of this measure, it is necessary to demonstrate
that the U-value of that component is better (lower) than the base case as listed in the Key Assumptions for the
Base Case in the Design section. If the EDGE default for the improved case U-value is used, then it is only
necessary to demonstrate that that component has been or will be installed, and that the U-value of the
component does not exceed the base case.
If a user-input U-value exceeds the default improved case value, then it is necessary to confirm that the U-
value has been calculated in accordance with the “simple” or “combined” method as previously described in the
Approach/Methodologies of related glass and wall measures above.

ENERGY EFFICIENCY MEASURES
© International Finance Corporation 2019. All rights reserved. EDGE User Guide 87
Design Stage Post-Construction Stage
At the design stage, the following must be used to
demonstrate compliance:
Manufacturer’s data sheets showing the seasonal
average U-value for the window (including glass
and frame); and
A list of different types of windows included in the
design (window schedule).
Construction detail drawing showing the insulation
material for walls, roof, and floor. Ideally the detail
drawing should be annotated with the U-value; and
Calculations of U-value either using the formula or
U-value calculators; or
Manufacturer’s data sheet of specified insulation
values.
At the post-construction stage, the following must be
used to demonstrate compliance:
Photographs of the glazing units installed;
Purchase receipts and delivery notes for the
glazing; and
Manufacturer’s data sheets showing the seasonal
average U-value for the glazing (including glass
and frame)
Since insulation material will not be visible at the post-
construction stage, it must be demonstrated that the
insulation material specified at the design stage was
delivered to the site. The following must be used to
demonstrate compliance:
Photographs of the wall, roof and floor construction
at a point when the insulation material was visible;
and
Delivery note confirming that the insulation
material was delivered to the site; and
Updated calculations for U-value if the thickness
and type of insulations have changed from the
original design.

ENERGY EFFICIENCY MEASURES
© International Finance Corporation 2019. All rights reserved. EDGE User Guide 88
E10 – NATURAL VENTILATION
Corresponds to HME09, HTE07, HTE08, RTE08, OFE09, HSE09, HSE10, HSE11,
EDE08, EDE09
Requirement Summary
This measure can be claimed when two conditions are met.
1. Room geometry conditions must be met. These include the ‘room depth to ceiling height ratio’ and the
‘minimum area of opening.’
2. If the rooms are air-conditioned, the air-conditioning system in the rooms must be provided with an
auto-shut off control that switches the air-conditioning off while the room is being naturally ventilated.
The methodology for the calculation is explained in the Potential Technologies and Strategies section, which also
shows the minimum required ventilation conditions and an example of auto-shut off controls.
Table 26 shows the spaces that must be naturally ventilated for each building type to claim the natural
ventilation measure. Each row in the table represents a separate measure in the software.
Table 26: Areas to be Naturally Ventilated, by Building Type
Building Type Spaces that must have natural
ventilation
Homes Bedrooms, Living Room, Kitchen
Hospitality Corridors
Guest Rooms (with auto controls)
Retail Corridors, Atrium, and Common Areas
Offices Offices, Corridors and Lobby
Hospitals Corridors
Lobby, Waiting, and Consultation Areas
Patient Rooms
Education Corridors
Classrooms
For multiple rooms of one type, the condition must be met by 90% of the rooms of that type in the building e.g.
rooms of a hotel.

ENERGY EFFICIENCY MEASURES
© International Finance Corporation 2019. All rights reserved. EDGE User Guide 89
Intention
A well-designed natural ventilation strategy can improve occupant comfort by providing both access to fresh air
as well as reducing the temperature. This results in a reduction of the cooling load, which lowers initial capital
and maintenance costs.
Approach/Methodologies
The key factors in deciding the ventilation strategy are room size (depth, width and height), and the number
and location of openings.
Both the ‘room depth to ceiling height ratio’ and the ‘minimum area of opening’ must be calculated using the
built-in calculator in EDGE. Each relevant space type for a project must be entered on a separate row in the
calculator, to ensure adequate natural ventilation for all the required spaces in the building. All space types
required for a building type must pass in the calculator in order to claim the measure.
To evaluate whether the openings on a wall qualify for natural ventilation, take the window-to-wall ratio for that
particular wall. The window area must be at least 10% of the wall area to be counted as an opening for natural
ventilation. Openings less than 10% of the wall must not be considered for natural ventilation (although it will
still count towards the WWR calculation).
Potential Technologies/Strategies
Figure 9. Auto shut-off control for air-conditioning based on natural ventilation
EDGE uses cross-flow ventilation, where fresh air is drawn from outside into the occupied space and the exhaust
air is delivered at a different location, as explained in Table 27. This type of ventilation is used for the improved
case as it is most effective if the external air temperature is neither too hot nor too cold (temperate climates).
As EDGE takes into account the external temperature, the software can test the ventilation’s potential
effectiveness. If EDGE predicts significant savings, then a suitable strategy should be considered.
Two basic approaches are most often implemented in the design of cross ventilation: single-sided and two-
sided. Two-sided ventilation is used to ventilate single spaces (which have openings on both windward and
leeward sides) and double-banked rooms that rely on openings in corridors between rooms. Single-sided
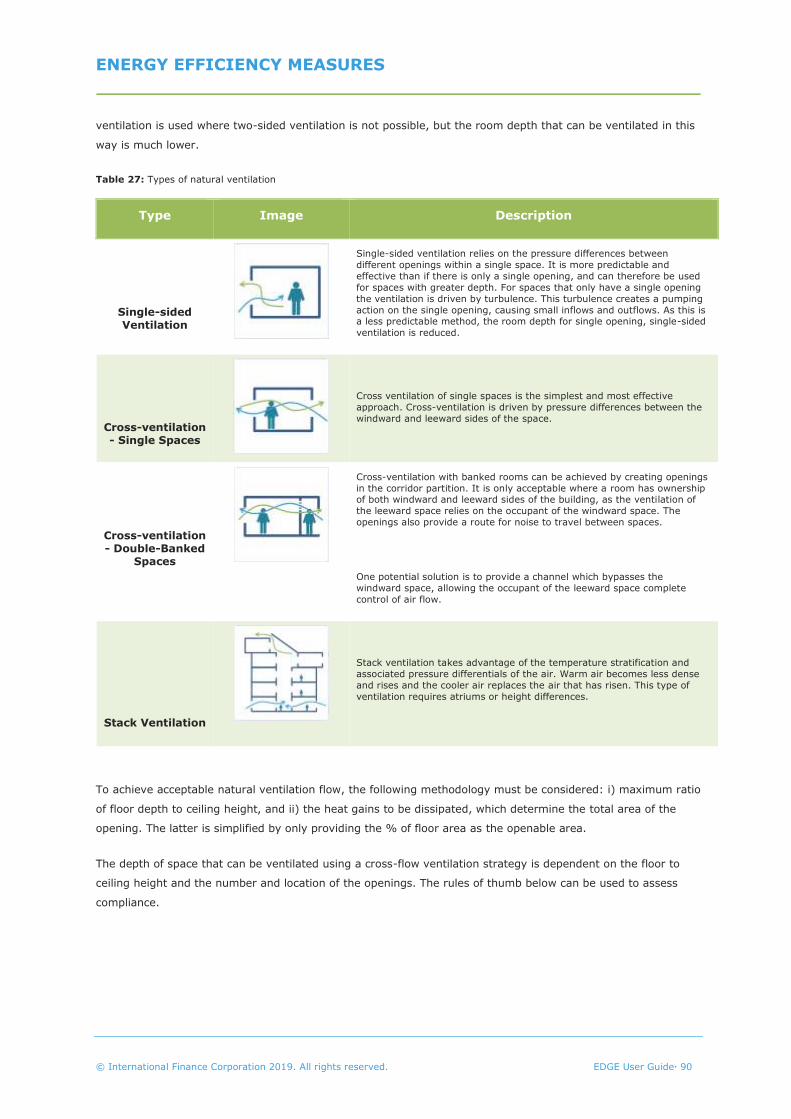
ENERGY EFFICIENCY MEASURES
© International Finance Corporation 2019. All rights reserved. EDGE User Guide 90
ventilation is used where two-sided ventilation is not possible, but the room depth that can be ventilated in this
way is much lower.
Table 27: Types of natural ventilation
Type Image Description
Single-sided Ventilation
Single-sided ventilation relies on the pressure differences between
different openings within a single space. It is more predictable and
effective than if there is only a single opening, and can therefore be used
for spaces with greater depth. For spaces that only have a single opening
the ventilation is driven by turbulence. This turbulence creates a pumping
action on the single opening, causing small inflows and outflows. As this is a less predictable method, the room depth for single opening, single-sided
ventilation is reduced.
Cross-ventilation - Single Spaces
Cross ventilation of single spaces is the simplest and most effective
approach. Cross-ventilation is driven by pressure differences between the
windward and leeward sides of the space.
Cross-ventilation - Double-Banked
Spaces
Cross-ventilation with banked rooms can be achieved by creating openings
in the corridor partition. It is only acceptable where a room has ownership of both windward and leeward sides of the building, as the ventilation of
the leeward space relies on the occupant of the windward space. The
openings also provide a route for noise to travel between spaces.
One potential solution is to provide a channel which bypasses the
windward space, allowing the occupant of the leeward space complete
control of air flow.
Stack Ventilation
Stack ventilation takes advantage of the temperature stratification and
associated pressure differentials of the air. Warm air becomes less dense
and rises and the cooler air replaces the air that has risen. This type of
ventilation requires atriums or height differences.
To achieve acceptable natural ventilation flow, the following methodology must be considered: i) maximum ratio
of floor depth to ceiling height, and ii) the heat gains to be dissipated, which determine the total area of the
opening. The latter is simplified by only providing the % of floor area as the openable area.
The depth of space that can be ventilated using a cross-flow ventilation strategy is dependent on the floor to
ceiling height and the number and location of the openings. The rules of thumb below can be used to assess
compliance.

ENERGY EFFICIENCY MEASURES
© International Finance Corporation 2019. All rights reserved. EDGE User Guide 91
Room Depth to Ceiling Height Ratio
EDGE’s methodology for natural ventilation requires that the maximum ratio of the room depth versus ceiling
height must be calculated first. See Table 28 for the maximum ratios for different room configurations.
Table 28: Depth of floor to ceiling height ratios for different room configurations
Room/Opening Configuration
Image/Example Maximum Depth of Floor to Ceiling
Height Ratio
Single-sided, single opening
1.5
Single-sided, multiple openings
2.5
Cross ventilation
5.0

ENERGY EFFICIENCY MEASURES
© International Finance Corporation 2019. All rights reserved. EDGE User Guide 92
Minimum Area of Opening
The minimum area of opening required depends on the expected heat gains in a space. Table 29 indicates the
percentage of the opening area required in each space type in order to dissipate those heat gains from the
space. The built-in calculator in the EDGE App incorporates these percentages automatically. The minimum
required area of the opening is calculated by multiplying the total area of the room by the required percentage.
Table 29: Minimum area of opening as a proportion of floor area for different heat gain ranges.
Building Type Space Type (Heat Gain) Minimum Area of Opening Required as a Percentage of Floor Area
Homes Bedrooms (15-30 W/m²) 20%
Living Room (15-30 W/m²) 20%
Kitchen (>30 W/m²) 25%
Hospitality Corridors (<15 W/m²) 10%
Guest Rooms (15-30 W/m²) 20%
Retail Corridors, Atrium & Common Areas (<15 W/m²)
10%
Offices Offices (15-30 W/m²) 20%
Corridors and Lobby (<15 W/m²) 10%
Hospitals Corridors (<15 W/m²) 10%
Lobby, Waiting and Consultation Areas (15-30 W/m²)
20%
Patient Rooms (15-30 W/m²) 20%
Education Corridors (<15 W/m²) 10%
Classrooms (15-30 W/m²) 20%
Example:
Q: A corridor with 20sqm floor area and ceiling height of 3m has 2 windows for cross ventilation. What are the
design criteria to ensure compliance with natural ventilation requirements?
A: The ratio of the depth of the floor to the ceiling height should be less than 5. The ceiling height is 3m,
therefore, the maximum depth of the corridor can be 15m. For example, the corridor plan can be 2m x 10m
where 10m is the depth.
10% of the floor area should be openable which is 2m2, making each window opening area at least 1m2.

ENERGY EFFICIENCY MEASURES
© International Finance Corporation 2019. All rights reserved. EDGE User Guide 93
Q: A classroom with 16sqm floor area and a ceiling height of 3m has a single window for ventilation. What are
the design criteria to ensure compliance with natural ventilation requirements?
A: The ratio of the depth of the floor to the ceiling height should be less than 1.5. The ceiling height is 3m,
therefore, the maximum depth of the room can be 4.5. For example, the room plan can be 4mx4m where the
depth is 4m.
20% of floor area should be openable, which is 3.2m2. This can be provided by a French door that is 2m high
and 1.6m wide.
Relationship to Other Measures
Since employing natural ventilation can significantly reduce the cooling load, the impact of more efficient cooling
systems is sometimes reduced to an insignificant level. As with all passive design solutions, natural ventilation
should therefore be considered before the detailed design of any HVAC equipment.
Assumptions
The base case assumes that ventilation is delivered using mechanical means, while the improved case assumes
that natural ventilation provides cooling during the hours when the temperature outside is suitable. If the
building has mechanical cooling, the savings are reflected in the main Energy chart in the Cooling and
associated energy uses. If the building does not have mechanical cooling, the cooling load is still calculated and
is shown as “virtual” energy on the charts.
Cooling load is reduced through natural ventilation and other passive measures including improved insulation,
reduced window-to-wall ratio, reduced SHGC, improved solar shading, and specifying ceiling fans. Reducing the
cooling load will result in improved performance even when no mechanical cooling is specified and the savings
are only reflected in “virtual energy”.

ENERGY EFFICIENCY MEASURES
© International Finance Corporation 2019. All rights reserved. EDGE User Guide 94
Compliance Guidance
If this measure is claimed, then the design team will need to demonstrate compliance with the depth of floor-to-
ceiling height ratio and minimum area of opening for all corridors as explained in the Potential
Technologies/Strategies section above.
Design Stage Post-Construction Stage
At the design stage, the following must be used to
demonstrate compliance:
Typical floor plans for every floor showing the
layouts of the naturally ventilated spaces and the
location of openings; and
Typical sections showing the floor-to-ceiling height
for every floor; and
Calculations showing the depth-to-ceiling height
ratio and the minimum area of opening for each
typical space.
At the post-construction stage, the following must be
used to demonstrate compliance:
Confirmation from the project team that no
changes have been made to the layout or the floor
to ceiling height during the design/construction
process; or
As-built drawings including floor plans and sections;
and
Photographic evidence to demonstrate that the plan
layouts and location of openings as specified at the
design stage have been constructed.

ENERGY EFFICIENCY MEASURES
© International Finance Corporation 2019. All rights reserved. EDGE User Guide 95
E11 – CEILING FANS
Corresponds to HME10, OFE10, EDE10
Requirement Summary
Ceiling fans must be installed in all the required rooms for the building type as shown below in Table 30. In
countries where ceiling fans are standard (such as India), the ceiling fans must be energy-efficient for this
measure to be claimed.
Table 30: Minimum Required Spaces to be Provided with Ceiling Fans, by Building Type
Building Type Spaces that must have ceiling fans installed
Homes All habitable rooms (bedrooms and living rooms)
Offices Office spaces (open and closed offices)
Education All Classrooms
Intention
Ceiling fans increase air movement, aiding human comfort by promoting the evaporation of perspiration
(evaporative cooling).
Approach/Methodologies
The measure can be claimed if ceiling fans have been installed in all the required rooms for a project. For
projects in India, ceiling fans must be awarded 4 or 5 stars by the Bureau of Energy Efficiency (BEE), or with an
equivalent rating.
Potential Technologies/Strategies
Ceiling fans are normally used to reduce cooling energy requirements by creating greater air movement in
rooms. The increased air movement results in occupants feeling comfortable at a relatively higher temperature
set point. In order to have this effect, the fan must be installed with the raised edge of the blade on the leading
edge. The movement of the fan pulls the air towards the ceiling. In cooling mode, the effect is on perceived
comfort, so if a room is unoccupied the fans should be switched off to avoid the waste of energy.
Ceiling fans can also be used to reduce heating requirements by reducing stratification of the warmer air that
tends to rise to the ceiling. In this mode, the raised edge of the blades should be at the trailing edge. The
movement of the fan pushes the warm air down towards the room. Fans often have a switch to change from
cooling to heating mode, which works by reversing the direction of rotation of the fan motor.

ENERGY EFFICIENCY MEASURES
© International Finance Corporation 2019. All rights reserved. EDGE User Guide 96
In order to achieve the levels of air movement assumed by EDGE, Table 31 shows the minimum fan
requirements for different room sizes. The first number in every case is the minimum required diameter in
meters. This is also known as ‘total blade span,’ which is 2 times the radius as measured from the center of the
fan to the tip of the blade. The second number is the optimum number of fans required in different sizes of
rooms. For example, a 6m x 6m room would require a minimum of 4 fans with a minimum diameter of 0.9m or
900mm each.
Table 31: Minimum fan size (in meters)/Number of ceiling fans required for different room sizes19.
Room Width
Room Length
4m 5m 6m 7m 8m 9m 10m 11m 12m 14m 16m
3m 1.2/1 1.4/1 1.5/1 1050/2 1.2/2 1.4/2 1.4/2 1.4/2 1.2/3 1.4/3 1.4/3
4m 1.2/1 1.4/1 1.2/2 1.2/2 1.2/2 1.4/2 1.4/2 1.5/2 1.2/3 1.4/3 1.5/3
5m 1.4/1 1.4/1 1.4/2 1.4/2 1.4/2 1.4/2 1.4/2 1.5/2 1.4/3 1.4/3 1.5/3
6m 1.2/2 1.4/2 0.9/4 1.05/4 1.2/4 1.4/4 1.4/4 1.5/4 1.2/6 1.4/6 1.5/6
7m 1.2/2 1.4/2 1.05/4 1.05/4 1.2/4 1.4/4 1.4/4 1.5/4 1.2/6 1.4/6 1.5/6
8m 1.2/2 1.4/2 1.2/4 1.2/4 1.2/4 1.4/4 1.4/4 1.5/4 1.2/6 1.4/6 1.5/6
9m 1.4/2 1.4/2 1.4/4 1.4/4 1.4/4 1.4/4 1.4/4 1.5/4 1.4/6 1.4/6 1.5/6
10m 1.4/2 1.4/2 1.4/4 1.4/4 1.4/4 1.4/4 1.4/4 1.5/4 1.4/6 1.4/6 1.5/6
11m 1.5/2 1.5/2 1.5/4 1.5/4 1.5/4 1.5/4 1.5/4 1.5/4 1.5/6 1.5/6 1.5/6
12m 1.2/3 1.4/3 1.2/6 1.2/6 1.2/6 1.4/6 1.4/6 1.5/6 1.4/8 1.4/9 1.4/9
13m 1.4/3 1.4/3 1.2/6 1.2/6 1.2/6 1.4/6 1.4/6 1.5/6 1.4/9 1.4/9 1.5/9
14m 1.4/3 1.4/3 1.4/6 1.4/6 1.4/6 1.4/6 1.4/6 1.5/6 1.4/9 1.4/9 1.5/9
When considering fans larger than those provided in the table, consider the following rule of thumb. A fan that
is twice the size will cover an area that is the square of the size factor. For example, a fan of 2m diameter could
replace 4 fans of 1m diameter, and a fan of 3m diameter could replace 9 fans of 1m diameter.
However, the best way to determine the number of fans required is to compare the cfm (cubic feet per minute)
of air that a fan is rated for. For example, if a standard small fan moves 60 cfm/watt, and the large fan moves
180 cfm per watt, you could replace 3 small fans with the larger fan. If the large fan moves 300 cfm per watt
instead, you could replace 5 small fans with the larger fan. Please start with EDGE guidance to determine the
number of small fans required, then include this simple calculation in your documentation to show the
replacement calculation. Ideally, the cfm of ceiling fans should be sufficient to move the entire volume of the
room in one hour. (Note that this is similar to air changes per hour for ventilation with a subtle difference; a fan
moves air, not changes it.)
Relationship to Other Measures
The installation of ceiling fans to reduce cooling requirements improves occupant comfort without actively
cooling the air. Ceiling fans are therefore only beneficial in spaces that have a demonstrable cooling load.
19 Source: India National Building Code

ENERGY EFFICIENCY MEASURES
© International Finance Corporation 2019. All rights reserved. EDGE User Guide 97
The installation of ceiling fans to reduce heating requirements does not necessarily decrease the heating load,
but can improve occupant comfort by increasing the temperature at floor level and reducing the temperature
gradient from floor to ceiling.
Assumptions
The base case assumes that no ceiling fans are specified. The improved case assumes that ceiling fans have
been installed in line with the guidance above. The assumption is that the efficiency of the ceiling fans is
60W/fan (except in India where the efficiency assumed for the improved case is 40W/fan).
Compliance Guidance
To verify compliance, the design team must demonstrate that ceiling fans will be or have been installed.
Design Stage Post-Construction Stage
At the design stage, the following must be used to
demonstrate compliance:
Mechanical and electrical layout drawings showing
the location and number of ceiling fans; and
Manufacturer’s data sheet showing the energy
consumption and diameter of ceiling fans selected.
At the post-construction stage, the following must be
used to demonstrate compliance:
As-built mechanical and electrical drawings for all
floors; and
Delivery notes showing that specified fans have
been delivered to the site including the energy
label where applicable; and
Photographs of the installed fans for a sample of
the units covered by the assessment.

ENERGY EFFICIENCY MEASURES
© International Finance Corporation 2019. All rights reserved. EDGE User Guide 98
E12* – AIR CONDITIONING SYSTEM
Corresponds to HME11
Requirement Summary
If the project includes a cooling system, the actual COP of a system must be entered into the software (even if
the COP is lower than Base Case). Savings can be achieved if the air conditioning system provides a Coefficient
of Performance (COP) greater than the Base Case.
Intention
In many cases, a cooling system will not be fitted as part of the original build, which increases the risk that
future occupants will deal with any insufficient cooling later by installing air-conditioning units that may be
inefficient and are poorly sized and installed. By carefully designing the installation of an efficient cooling system
into the project, the energy needed to deliver the required cooling can be reduced in the longer term.
Approach/Methodologies
EDGE uses the Coefficient of Performance (COP) to measure the efficiency of air conditioning systems. The COP
is the total output of cooling energy per electricity input. The COP for cooling is defined as the ratio of the rate
of heating energy removal to the rate of electrical energy input, in consistent units, for a complete air
conditioning system or some specific portion of that system under designated operating conditions. The formula
to calculate COP is explained below. For consistency the ARI conditions should be used for comparison of COP
values.
COP =𝑄 𝑜𝑢𝑡
𝑊 𝑖𝑛
Where:
Q out = heating energy removal (kW)
W in = electrical energy input (kW)
In order to claim this measure, the design team must demonstrate that the equipment achieves a COP greater
than the base case COP value. For large buildings, more than one system may be installed. If these air
conditioning systems have different COPs, the weighted average COP should be calculated.
In some cases, the cooling system could be centralized, serving a combination of buildings/dwellings within the
development. The central cooling plant may be within the EDGE project boundary and controlled by the EDGE
client, in which case the technical specifications must be submitted. However, when the plant for the cooling
system is out of EDGE project boundary or not controlled by the EDGE client, then a contract with, or letter
from the management company in charge of the plant has to be provided, stating the efficiency of the system,
as part of the documentation for the post-construction stage.

ENERGY EFFICIENCY MEASURES
© International Finance Corporation 2019. All rights reserved. EDGE User Guide 99
Potential Technologies/Strategies
Simple air-conditioners fitted in windows and through-the wall unitary air-conditioners are the most common
type of air-conditioners used in individual residential units. Apartment buildings may use packaged air-
conditioners located on roof tops with ducted air flow. However, these are the least efficient types of systems.
Various air-conditioning systems are available that achieve higher cooling efficiency, including split air-
conditioners, multi-split air conditioners, VRF systems and chillers.
Split air-conditioners are direct expansion (DX) mechanical refrigeration systems with a single condenser unit
outside serving a single fan coil unit (evaporator) inside the building, with refrigerant carried between the two in
narrow tubes through the wall. These do not require ducts, and are more efficient than ducted systems. But
they can only serve fan coil units located at a limited distance from the external condenser unit.
Multi-split air conditioners are like split systems, except that a single large condenser unit is connected to
several fan coil units with individual tubes. The added advantage is the fewer number of outside units. But these
systems can only serve spaces that are at similar temperature conditions.
Variable Refrigerant Flow (VRF) systems are a step up from multi-split systems because they can serve
zones with different thermal needs, including zones that may be in heating mode while other zones are in
cooling mode. VRF systems accomplish this through compressors that can modulate their speed and the
refrigerant flow. The refrigerant is distributed through a piping network to multiple indoor fan-coil units, each
capable of individual zone temperature control through a common communications network. The system runs
only at the rate needed to deliver the temperature change required by each internal unit. The three basic types
of VRF systems include: cooling only, VRF heat pump that provides both heating and cooling but not
simultaneously, and VRF with heat recovery that provides heating and cooling simultaneously. VRF systems
may be a particularly good option for buildings with multiple zones or wide variance in heating/cooling loads
across many different internal zones. As these systems provide individual control and are the most versatile of
the multi-split systems, they are relevant for residential apartment buildings. Due to the way the internal units
are connected to the external unit, a breakdown of one internal unit will not compromise the rest of the system.
The speed of the outdoor compressors can change to operate in a range of 6% to 100% capacity. Capacities
have typically ranged from 5.3 to 223 kW for outdoor units and from 1.5 to 35 kW for indoor units, but new
products are continually being introduced. Multiple outdoor units can be used if an even greater range of
capacity is required.
Although VRF systems are widely used in residential buildings, other cooling systems can achieve good
performance, but are not as common for these building types. A good example is chillers. Air-cooled chillers
are vapor compression mechanical refrigeration systems with heat exchangers (evaporators) in which heat
captured by the process is transferred to the refrigerant fluid. This heat transfer causes the refrigerant to
evaporate, changing from liquid (a low pressure) to vapor. As a result, the temperature of the process coolant is
decreased to the desired outgoing temperature. Water-cooled chillers are like air cooled chillers; the primary
difference is that water is used to provide the condenser cooling. In general, this technology is more efficient
than air-cooled chillers.
Some minimum efficiencies specified by ASHRAE 90.1-2016 are listed in Table 1, with the Variable Refrigerant
Flow (VRF) system highlighted. Note that these are for comparative illustration only; the ASHRAE standard
contains several COP values for each system type depending on the details of the equipment such as the
capacity and technology.

ENERGY EFFICIENCY MEASURES
© International Finance Corporation 2019. All rights reserved. EDGE User Guide 100
Table 32. Examples of current minimum COPs for different types of air conditioning systems20
Type of Cooling System
(Air Conditioning)
COP
Through the wall, air-cooled, packaged and split < 9 kW 3.51
Air-cooled, split < 19 kW 3.81
Air-cooled, single package < 19kW
DX and heat pumps
4.10
Water-cooled, split and single package < 19kW 3.54
PTAC and PTHP, standard size, all capacities
In equation, Capacity = 2.1 kW < Capacity < 4.4.kW
4.10 – (0.300 × Capacity/1000)
Variable Refrigerant Flow, air-cooled, cooling mode < 19 kW 3.81
Variable Refrigerant Flow, water source, cooling mode < 19kW 3.52
Variable Refrigerant Flow, groundwater source, cooling mode <
40kW
4.75
Variable Refrigerant Flow, ground source, cooling mode < 40kW 3.93
Air Cooled Chiller < 528 kW 2.985 at Full Load (FL)
4.048 at Part Load (IPLV)
Air Cooled Chiller > 528 kW 2.985 at Full Load (FL)
4.137 at Part Load (IPLV)
Water Cooled Chiller, positive displacement <264 kW
(Positive displacement = reciprocating, screw and scroll
compressors)
4.694 at Full Load
5.867 at Part Load (IPLV)
Water Cooled Chiller, centrifugal < 528 kW 5.771 at Full Load
6.401 at Part Load (IPLV)
20 Source: ASHRAE 90.1-2016, Chapter 6

ENERGY EFFICIENCY MEASURES
© International Finance Corporation 2019. All rights reserved. EDGE User Guide 101
Note that if a cooling system other than a chiller is installed in a residential building and achieves the desired
COP, then this information can be entered manually into the EDGE software, and evidence provided for
certification purposes.
Relationship to Other Measures
Passive measures such as improved walls and windows will reduce the energy use from air-conditioning.
Assumptions
The base case value for the efficiency of the air conditioning system will vary by building type and by location. It
is listed in the Key Assumptions for the Base Case in the Design section.
The default value for the improved case COP for the efficient cooling system also varies by system type; the
actual performance of the system must be entered in all cases.
Compliance Guidance
To demonstrate compliance, the design team must describe the specified system and provide documentation to
support the claims.
Design Stage Post-Construction Stage
At the design stage, the following must be used to
demonstrate compliance:
Mechanical and electrical layout drawings showing the
location of the external and internal units for all
floors; and
Equipment Schedule or Manufacturer’s data sheets
(with the project specific info highlighted & noted) for
the cooling system specifying COP information
For systems including more than one air-conditioning
unit, the design team must provide the weighted
average COP calculation.
At the post-construction stage, the following must be
used to demonstrate compliance:
As-built mechanical and electrical drawings with air
conditioning schematics for all floors; and
Delivery notes showing that specified chillers have
been delivered to the site;
Manufacturer’s data sheets for the cooling system
specifying COP information;
Photographs of installed external and internal air
conditioning units; and /or
Contract with the management company, if the
system is centralized or off-site.

ENERGY EFFICIENCY MEASURES
© International Finance Corporation 2019. All rights reserved. EDGE User Guide 102
E13* – AIR CONDITIONING WITH AIR COOLED CHILLER
Corresponds to HTE10, RTE11, OFE12, HSE14, EDE12
Requirement Summary
If the project includes an air-cooled chiller, the actual COP of the system must be entered in the software (even
if the COP is lower than the default). Savings can be achieved if the air conditioning system is an air-cooled
chiller and achieves a Coefficient of Performance (COP) greater than the baseline case under ARI conditions.
Intention
In many cases, a cooling system will not be fitted as part of the original build, increasing the risk that future
occupants will deal with insufficient cooling later by installing air-conditioning units that may be inefficient and
are poorly sized and installed. Chillers on the other hand deliver cooling through chilled water which has much
higher heat capacity than air, allowing heat to be transferred more efficiently. By carefully designing the
installation of a mechanical refrigeration system using chilled air as a distributing unit, the energy needed to
deliver the required cooling can be reduced. Air-cooled chillers are suitable for climates where water supply is
scarce or high humidity reduces the efficiency of the cooling towers.
Approach/Methodologies
EDGE uses the Coefficient of Performance (COP) to measure the efficiency of air conditioning systems. The COP
is the total output of cooling energy per electricity input. The COP for cooling is defined as the ratio of the rate
of heating energy removal to the rate of electrical energy input, in consistent units, for a complete air
conditioning system or some specific portion of that system under designated operating conditions. The formula
to calculate the COP is explained below. For consistency, the ARI conditions should be used for comparison of
COP values.
𝐂𝐎𝐏 =𝑄 𝑜𝑢𝑡
𝑊 𝑖𝑛
Where:
Q out = heating energy removal (kW)
W in = electrical energy input (kW)
To claim this measure, the design team must demonstrate that the chiller(s) achieve a COP greater than the
base case. For large buildings with centralized systems, more than one chiller may be installed. If these chillers
have different COPs, the weighted average COP must be calculated.
In some cases, the air conditioning system (chiller/s) for the cooling system can be centralized, serving a
combination of buildings/dwellings within the development, for example, in a district cooling system. In these
cases, the central plant will need to be included within the site boundary of the project, or managed by a
company within the control of the site owner. This is to ensure the continuous sustainable management of (and
access to) the facility by the site owner.

ENERGY EFFICIENCY MEASURES
© International Finance Corporation 2019. All rights reserved. EDGE User Guide 103
However, when the chiller for the cooling system is located off-site, then a contract with, or letter from the
management company in charge of the chiller must be provided as part of the documentation for the post-
construction stage. The document must include the efficiency of the system.
If air conditioning is not specified, any cooling load will be displayed as “virtual energy.”
Potential Technologies/Strategies
This measure is based on air-cooled chillers with mechanical compression refrigeration systems. Chillers
typically cool water, which is then circulated to provide comfort cooling throughout a building or other location.
The system has four components: i) Compressor, ii) Condenser, iii) Thermal expansion valve, and iv)
Evaporator. The compressor compresses the refrigerant and pumps it through the air conditioning system at a
designed flow rate and pressure. The compressor technology is a way to distinguish the type of air-cooled
chillers: Reciprocating chillers, rotary screw chillers, or scroll chillers. Selection must be made based on many
factors including the size of the system; for example, reciprocating compressors are typically 3–510
refrigeration tons.
Air-cooled chillers cost significantly less per ton than water-cooled systems primarily because they require fewer
components to build and operate and require less support equipment and plumbing. Installation of an air-cooled
chiller is faster and easier than that of a water-cooled chiller. However, the efficiency of water-cooled chillers is
typically higher because of the higher heat capacity of water compared to air.
Some minimum efficiencies specified by ASHRAE 90.1-2016 are listed in Table 33 with the Air-Cooled Chiller
system highlighted. Note that the EDGE App does not use the 2016 standard; these are for comparative
illustration only. The ASHRAE standard contains several COP values for each system type depending on the
details of the equipment such as the capacity and technology, and whether the system is optimized for full load
or part load operation. This table shows full load values.

ENERGY EFFICIENCY MEASURES
© International Finance Corporation 2019. All rights reserved. EDGE User Guide 104
Table 33. Examples of current minimum COPs for different types of air conditioning systems, with the air-cooled chiller
highlighted21
Type of Cooling System
(Air Conditioning)
COP
Through the wall, air-cooled, packaged and split < 9 kW 3.51
Air-cooled, split < 19 kW 3.81
Air-cooled, single package < 19kW
DX and heat pumps
4.10
Water-cooled, split and single package < 19kW 3.54
PTAC and PTHP, standard size, all capacities
In equation, Capacity = 2.1 kW < Capacity < 4.4.kW
4.10 – (0.300 ×
Capacity/1000)
Variable Refrigerant Flow, air-cooled, cooling mode < 19 kW 3.81
Variable Refrigerant Flow, water source, cooling mode < 19kW 3.52
Variable Refrigerant Flow, groundwater source, cooling mode < 40kW 4.75
Variable Refrigerant Flow, ground source, cooling mode < 40kW 3.93
Air Cooled Chiller < 528 kW 2.985 at Full Load (FL)
4.048 at Part Load (IPLV)
Air Cooled Chiller > 528 kW 2.985 at Full Load (FL)
4.137 at Part Load (IPLV)
Water Cooled Chiller, positive displacement <264 kW
(Positive displacement = reciprocating, screw and scroll compressors)
4.694 at Full Load
5.867 at Part Load (IPLV)
Water Cooled Chiller, centrifugal < 528 kW 5.771 at Full Load
6.401 at Part Load (IPLV)
21 Source: ASHRAE 90.1-2016, Chapter 6

ENERGY EFFICIENCY MEASURES
© International Finance Corporation 2019. All rights reserved. EDGE User Guide 105
Relationship to Other Measures
The local climate, heat gains and the internal temperatures based on the building design impact the cooling
load. A more efficient system will not impact other measures, but several measures will impact the total energy
use of the cooling system.
Assumptions
The base case for the air conditioning system’s efficiency is listed in the Key Assumptions for the Base Case in
the Design section.
The default value for the improved case COP for an air-cooled screw chiller system varies by factors such as
building size; if the system efficiency is different from the default then the actual performance must be entered.
Energy savings will be calculated accordingly.
Compliance Guidance
To demonstrate compliance, the design team must describe the specified system and provide documentation to
support the claims.
Design Stage Post-Construction Stage
At the design stage, the following must be used to
demonstrate compliance:
Mechanical layout drawings showing the location of
the external and internal units; and
Equipment Schedule or Manufacturer’s data sheets
(with the project specific info highlighted & noted)
for the air-cooled chiller system specifying COP
information; and
Average COP calculation for systems including
more than one chiller unit.
At the post-construction stage, the following must be
used to demonstrate compliance:
As-built mechanical drawings with air conditioning
schematics for all floors; and
Delivery notes showing that the specified chillers
have been delivered to the site; and
Manufacturer’s data sheets for the air-cooled chiller
system specifying the COP information; and
Photographs of installed external and internal air
conditioning units; and/or
Contract with the management company if the
system is centralized or off-site.

ENERGY EFFICIENCY MEASURES
© International Finance Corporation 2019. All rights reserved. EDGE User Guide 106
E14* – AIR CONDITIONING WITH WATER COOLED CHILLER
Corresponds to HTE11, RTE12, OFE13, HSE15, EDE13
Requirement Summary
If the project includes a water-cooled chiller, the actual COP of the system should be entered in the software
(even if the COP is lower than the default value). Savings can be achieved if the air conditioning system has a
Coefficient of Performance (COP) greater than the base case, as set out in the Key Assumptions for the Base
Case in the Design section. The COP must be determined under ARI conditions.
Intention
Water-cooled chillers are typically more efficient than comparable air-cooled chillers. A water-cooled system is
the best option when reducing operating costs is of paramount concern and the project can invest in a system
with a longer payback period. Water cooling does involve a higher initial investment since both a chiller and a
circulating tower system are required, which in turn require additional pumps, piping and tanks. Also, water
cooling systems consume considerable amounts of water due to evaporation, purging and bleeding.
Approach/Methodologies
EDGE uses the Coefficient of Performance (COP) to measure the efficiency of an air-conditioning system. The
COP is the total output of cooling energy per electricity input. The COP for cooling is defined as the ratio of the
rate of heating energy removal to the rate of electrical energy input, in consistent units, for a complete air
conditioning system or some specific portion of that system under designated operating conditions. The formula
to calculate the COP is explained below. For consistency, ARI conditions must be used for the comparison of
COP values.
𝐂𝐎𝐏 =𝑄 𝑜𝑢𝑡
𝑊 𝑖𝑛
Where:
Q out = heating energy removal (kW)
W in = electrical energy input (kW)
To claim this measure, the design team must demonstrate that the chiller(s) achieve a COP greater than the
base case. For large buildings with centralized systems, more than one chiller may be installed. If these chillers
have different COPs, the weighted average COP must be calculated.
In some cases, the air conditioning system (chiller/s) for the cooling system can be centralized, serving a
combination of buildings/dwellings within the development, for example, in a district cooling system. In these
cases, the central plant will need to be included within the site boundary of the project, or managed by a
company within the control of the site owner. This is to ensure the continuous sustainable management of (and
access to) the facility by the site owner.
However, when the chiller for the cooling system is located off-site, then a contract with, or letter from the
management company in charge of the chiller must be provided as part of the documentation for the post-
construction stage. The document must include the efficiency of the system.

ENERGY EFFICIENCY MEASURES
© International Finance Corporation 2019. All rights reserved. EDGE User Guide 107
If air conditioning is not specified, any cooling load will be displayed as “virtual energy.”
Potential Technologies/Strategies
This technology is similar to air-cooled chillers, the primary difference being that water is used to cool the
condenser instead of air.
The cycle begins in the evaporator where a liquid refrigerant flows over the evaporator tube bundle and
evaporates, absorbing heat from the water circulating through the bundle. The refrigerant vapor is drawn out of
the evaporator by the compressor. The compressor compresses the refrigerant raising its pressure and
temperature, and pumps the refrigerant vapor to the condenser. The refrigerant condenses in the condenser
tubes, giving up its heat to the water that is cooling the condenser. The high-pressure, liquid refrigerant from
the condenser then passes through the expansion device that reduces the refrigerant pressure and temperature
as it enters the evaporator. The cold refrigerant again flows over the water coils absorbing more heat and
completing the cycle.
Relationship to Other Measures
The local climate, heat gains and the internal temperatures based on the building design impact the cooling
load. A more efficient system will not impact other measures, but several measures will impact the total energy
use of the cooling system.
In addition, when a water-cooled chiller is selected as an energy efficiency measure, total water consumption is
increased for both the base and the improved case, as the chiller will require water to operate.
Assumptions
The base case for air conditioning system efficiency is listed in the Key Assumptions for the Base Case in the
Design section.
The default value for the improved case COP for the water-cooled chiller varies as per ASHRAE 90.1-2007 based
on the area and number of floors; if the system efficiency is different from the measure’s default value, then the
actual performance must be entered, and the energy savings will be recalculated.
ENERGY EFFICIENCY MEASURES
© International Finance Corporation 2019. All rights reserved. EDGE User Guide 108
Compliance Guidance
To demonstrate compliance, the design team must describe the specified system and provide documentation to
support the claims.
Design Stage Post-Construction Stage
At the design stage, the following must be used to
demonstrate compliance:
Mechanical layout drawings/schematic showing the
location of the external and internal units; and
Equipment schedule or Manufacturer’s data sheets
(with the project specific info highlighted & noted)
for the water-cooled chiller system specifying COP
information; and
Average COP calculation for systems including
more than one chiller unit.
At the post-construction stage, the following must be
used to demonstrate compliance:
As-built mechanical drawings with air conditioning
schematics for all floors if there are changes; and
Delivery notes showing that the specified chillers
have been delivered to the site; and
Manufacturer’s data sheets for the water-cooled
chiller system specifying the COP information; and
Photographs of installed external and internal units
including chillers and cooling towers; and/or
Contract with the management company if the
system is centralized or off-site.

ENERGY EFFICIENCY MEASURES
© International Finance Corporation 2019. All rights reserved. EDGE User Guide 109
E15* – VARIABLE REFRIGERANT FLOW (VRF) COOLING SYSTEM
Corresponds to HTE09, RTE10, OFE11, HSE13, EDE11
Requirement Summary
If the project includes a Variable Refrigerant Flow (VRF) system, the actual COP of the system should be
entered in the software (even if the COP is lower than baseline). Savings can be achieved if the air conditioning
system achieves a Coefficient of Performance (COP) greater than baseline under ARI conditions. Note that the
same measure applies to a Variable Refrigerant Volume (VRV) cooling system, which is a patented name for a
type of VRF system.
Intention
In many cases, a cooling system will not be fitted as part of the original build, which increases the risk that
future occupants will deal with insufficient cooling later by installing air-conditioning units that may be inefficient
and are poorly sized and installed. By carefully designing the installation of an efficient cooling system into the
project, the energy needed to deliver the required cooling can be reduced in the longer term.
Approach/Methodologies
EDGE uses the Coefficient of Performance (COP) to measure the efficiency of air conditioning systems. The COP
is the total output of cooling energy per electricity input. The COP for cooling is defined as the ratio of the rate
of heating energy removal to the rate of electrical energy input, in consistent units, for a complete air
conditioning system or some specific portion of that system under designated operating conditions. The formula
to calculate the COP is explained below. For consistency, ARI conditions should be used for comparison of COP
values.
𝐂𝐎𝐏 =𝑄 𝑜𝑢𝑡
𝑊 𝑖𝑛
Where:
Q out = heating energy removal (kW)
W in = electrical energy input (kW)
To claim this measure, the design team must demonstrate that the system achieves a COP greater than the
base case of 3.5. For large buildings with centralized systems, more than one system may be installed. If these
systems have different COPs, the weighted average COP must be calculated.
In some cases, the air conditioning system for the cooling system may be centralized, serving a combination of
buildings/dwellings within the development. In these cases, the central plant will need to be included within the
site boundary of the project, or managed by a company within the control of the site owner. This is to ensure
the continuous sustainable management of (and access to) the facility by the site owner.
However, when the plant for the cooling system is located off-site, then a contract with, or letter from the
management company in charge of the cooling plant must be provided as part of the documentation for the
post-construction stage. The document must include the efficiency of the system.

ENERGY EFFICIENCY MEASURES
© International Finance Corporation 2019. All rights reserved. EDGE User Guide 110
EDGE calculates the cooling load by accounting for the local climate, heat gains and the internal temperatures
based on the building design. If air conditioning is not specified, any cooling load will be displayed as “virtual
energy.”
Potential Technologies/Strategies
A Variable Refrigerant Flow (VRF) system uses refrigerant as the medium for heat transfer. These systems have
one condensing unit with multiple indoor units, each of which can be individually controlled. The system runs by
modulating the amount of refrigerant that is sent to each evaporator, running only at the rate needed to deliver
the cooling required by each internal unit. VRF systems may be the best for buildings with multiple zones or a
wide variance in cooling or heating loads across many different internal zones requiring individual control such
as offices, retail buildings, education, healthcare buildings, or hotels and resorts. The outdoor units can be fitted
to as many as 48 internal units. Due to the way in which the internal units are connected to the external unit, a
breakdown of one internal unit will not compromise the rest of the system. The outdoor units can vary the
speed of the compressors and operate in a range of 6% to 100% capacity. Multiple outdoor units can be used if
an even greater range of capacity is required.
Some minimum efficiencies specified by ASHRAE 90.1-2016 are listed in Table 34, with the Variable Refrigerant
Flow (VRF) system highlighted. Note that these are for comparative illustration only; the ASHRAE standard
contains several COP values for each system type depending on the details of the equipment such as the
capacity and technology.

ENERGY EFFICIENCY MEASURES
© International Finance Corporation 2019. All rights reserved. EDGE User Guide 111
Table 34: Examples of current minimum COPs for different types of air conditioning systems, with VRF highlighted22.
Type of Cooling System
(Air Conditioning)
COP
Through the wall, air-cooled, packaged and split < 9 kW 3.51
Air-cooled, split < 19 kW 3.81
Air-cooled, single package < 19kW
DX and heat pumps
4.10
Water-cooled, split and single package < 19kW 3.54
PTAC and PTHP, standard size, all capacities
In equation, Capacity = 2.1 kW < Capacity < 4.4.kW
4.10 – (0.300 ×
Capacity/1000)
Variable Refrigerant Flow, air-cooled, cooling mode < 19 kW 3.81
Variable Refrigerant Flow, water source, cooling mode < 19kW 3.52
Variable Refrigerant Flow, groundwater source, cooling mode < 40kW 4.75
Variable Refrigerant Flow, ground source, cooling mode < 40kW 3.93
Air Cooled Chiller < 528 kW 2.985 at Full Load (FL)
4.048 at Part Load (IPLV)
Air Cooled Chiller > 528 kW 2.985 at Full Load (FL)
4.137 at Part Load (IPLV)
Water Cooled Chiller, positive displacement <264 kW
(Positive displacement = reciprocating, screw and scroll compressors)
4.694 at Full Load
5.867 at Part Load (IPLV)
Water Cooled Chiller, centrifugal < 528 kW 5.771 at Full Load
6.401 at Part Load (IPLV)
22 Source: ASHRAE 90.1-2016, Chapter 6
ENERGY EFFICIENCY MEASURES
© International Finance Corporation 2019. All rights reserved. EDGE User Guide 112
Relationship to Other Measures
The local climate, heat gains and the internal temperatures based on the building design impact the cooling
load. A more efficient system will not impact other measures, but several measures will impact the total energy
use of the cooling system.
A VRF system will have a smaller impact on savings if the building walls and windows have been optimized. To
realize savings from a VRF system, the spaces must be zoned separately with their own individual thermostats.
Assumptions
The base case efficiency of the air conditioning system is based on ASHRAE 90.1-2007 and is listed in the Key
Assumptions for the Base Case in the Design section.
The default improved case COP for the VRF cooling system varies depending on factors such as the building
area; if the designed system efficiency is different than the default, then the actual performance must be
entered. Energy savings will be calculated accordingly.
Compliance Guidance
To demonstrate compliance, the design team must describe the specified system and provide documentation to
support the claims.
Design Stage Post-Construction Stage
At the design stage, the following must be used to
demonstrate compliance:
Mechanical layout drawings/schematic showing the
location of the external and internal units; and
Equipment schedule or Manufacturer’s data sheets
(with the project specific info highlighted & noted)
for the VRF cooling system specifying COP
information; and
Average COP calculation in the case of systems
with more than one unit.
At the post-construction stage, the following must be
used to demonstrate compliance:
As-built mechanical drawings with air conditioning
schematics for all floors; and
Delivery notes showing that the specified
equipment has been delivered to the site; and
Manufacturer’s data sheets for the VRF cooling
system specifying COP information; and
Photographs of installed external and internal air
conditioning units; and/or
Contract with the management company if the
system is centralized or off-site, including the
efficiency of the system.

ENERGY EFFICIENCY MEASURES
© International Finance Corporation 2019. All rights reserved. EDGE User Guide 113
E16 – ABSORPTION CHILLER POWERED BY WASTE HEAT
Corresponds to HTE13, RTE14, OFE15, HSE17, EDE15
Requirement Summary
This measure can be claimed if a power generator fueled by Diesel or Natural Gas provides power to the
building, and a recovery technology is installed to capture the waste heat from the generator for the cooling
cycle. Additionally, the absorption chiller system must achieve a Coefficient of Performance (COP) greater than
0.7 under ARI conditions. The COP is used to establish the efficiency of this measure.
Intention
In many cases, a cooling system will not be included in the original build, possibly increasing the risk that future
occupants will deal with insufficient cooling with an amateur installation of inefficient and poorly sized air
conditioning units. By providing a mechanical refrigeration system that uses the waste heat generated in other
processes such as electricity generation or industrial processes to run an absorption chiller, the energy needed
to deliver the required cooling and/or heating can be reduced significantly.
Approach/Methodologies
EDGE uses COP to measure the efficiency of an air conditioning system. The COP of absorption chillers is the
total output of cooling energy per waste heat input. As defined in ASHRAE, the COP is “the ratio of the rate of
heat removal to the rate of energy input, in consistent units, for a complete refrigerating system or some
specific portion of that system under designated operating conditions.” Compared to mechanical chillers,
absorption chillers have a low coefficient of performance (COP = chiller load/heat input), but they are powered
by waste heat. The formula to calculate COP is explained below. For consistency, the ARI conditions must be
used for comparison of COP values.
𝐂𝐎𝐏 =𝑄 𝑜𝑢𝑡
𝑊 𝑖𝑛
Where:
Q out = heating energy removal (kW)
W in = electrical energy input (kW)
To claim this measure, the design team must demonstrate that the absorption chiller(s) achieve an efficiency
greater than 70% (COP >0.7). For large buildings with centralized systems, more than one chiller may be
installed. If these chillers have different COPs, the weighted average COP must be calculated.
In some cases, the air conditioning system (chiller/s) for the cooling system can be centralized, serving a
combination of buildings/dwellings within the development. In these cases, the central plant will need to be
included within the site boundary of the project, or managed by a company within the control of the site owner.
This is to ensure the continuous sustainable management of (and access to) the facility by the site owner.
However, when the chiller for the cooling system is located off-site, then a contract with (or letter from) the
management company in charge of the chiller must be provided, stating the efficiency of the system, as part of
the documentation for the post-construction stage.

ENERGY EFFICIENCY MEASURES
© International Finance Corporation 2019. All rights reserved. EDGE User Guide 114
If air conditioning is not specified, any cooling load will be displayed as “virtual energy.”
If this measure is selected, the assumptions in the Key Assumptions on the Design tab must be verified. The
user must select the appropriate fuel under ‘Fuel Used for Electric Generator’, and input the appropriate value
for ‘% of Electricity Generation Using [Fuel].’
Potential Technologies/Strategies
An absorption chiller is a type of air-cooling device that absorbs waste heat instead of electrical energy to
provide cooling. An absorption chiller has a low COP. However, it can reduce operating costs because it is
powered by waste heat. An absorption chiller is a much more cost-effective alternative to a traditional cooling
system due to the use of waste heat as fuel and lower maintenance.
Waste heat is the result (byproduct) of building processes or industrial processes that is not being put to
practical use. This waste heat is captured to generate cooling as an emission-free substitute for costly
purchased fuels or electricity. It is thus a no-cost fuel source which can improve the overall energy efficiency in
a facility.
Absorption chillers are more cost-effective in large-sized buildings which are owned and operated by the same
manager.
Relationship to Other Measures
The local climate, heat gains and internal temperatures based on the building design impact the cooling load. A
more efficient system will not impact other measures, but several measures will impact the total energy use of
the cooling system.
In addition, when an absorption chiller powered by waste heat is selected as an energy efficiency measure, the
heating and/or cooling energy is reduced depending on the load of the building. The energy from pumps is
slightly increased due to the operation of the system.
Assumptions
The base case efficiency of the air conditioning system is based on ASHRAE 90.1-2007, and is listed in the Key
Assumptions for the Base Case in the Design section. The heating fuel selection can be changed by the user.
The improved case COP for the absorption chiller system is 0.7. Although the equipment efficiency is not high, it
uses waste heat to power the chiller, thus achieving a higher whole-system efficiency.

ENERGY EFFICIENCY MEASURES
© International Finance Corporation 2019. All rights reserved. EDGE User Guide 115
Compliance Guidance
To demonstrate compliance, the design team must describe the specified system and provide documentation to
support the claims.
Design Stage Post-Construction Stage
At the design stage, the following must be used to
demonstrate compliance:
Mechanical and electrical layout drawings showing
the location of the external and internal units for all
floors; and
Equipment Schedule or Manufacturer’s data sheets
for the absorption chiller system specifying COP
information and the waste heat generator; and
Average COP calculation for systems including
more than one chiller unit; and
Calculation to demonstrate that the generators
have the capacity to deliver 100% of peak energy
and that waste heat needed to run the absorption
chiller is achieved.
At the post-construction stage, the following must be
used to demonstrate compliance:
As-built mechanical and electrical drawings with air
conditioning schematics for all floors and the
location of the waste heat generation; and
Delivery notes showing that the specified
absorption chillers have been delivered to the site;
and
Manufacturer’s data sheets for the absorption
chiller system specifying COP information and the
waste heat generator; or
Photographs of installed external and internal air
conditioning units; and/or
Contract with the management company if the
system is centralized or off-site.

ENERGY EFFICIENCY MEASURES
© International Finance Corporation 2019. All rights reserved. EDGE User Guide 116
E17 – AIR ECONOMIZERS DURING FAVORABLE OUTDOOR CONDITIONS
Corresponds to RTE09, OFE23, HSE12
Requirement Summary
This measure can be claimed if the air handling units in the HVAC system use air economizers. Critical areas
with special needs for indoor air quality, such as Operation Theatres (OT) and/or the Intensive Care Units (ICU)
in hospitals, are exempt from this requirement. By default, the base case system does not have air
economizers.
Intention
Cooling energy can be reduced in buildings if outside air conditions are suitable to cool the building with little or
no need for mechanical cooling.
Approach/Methodologies
The effectiveness of air economizers is highly dependent on the outside air temperature and humidity levels,
which are measured through an outdoor sensor in the economizer system. When the conditions are suitable, the
outside air damper is opened fully and the cooling compressors are turned down or shut off.
Figure 10. Components of an air economizer system23
23 Source: Image courtesy of Energy Design Resources (www.energydesignresources.com),

ENERGY EFFICIENCY MEASURES
© International Finance Corporation 2019. All rights reserved. EDGE User Guide 117
Potential Technologies/Strategies
Decision on the inclusion of air economizers should be based on analysis of outdoor air temperature and
humidity in comparison to the desired indoor temperatures. While this measure has potential to reduce cooling
energy significantly in some locations, increased capital and operating costs are possible if the system is not
designed and maintained properly.
Air economizers should typically be avoided in following circumstances:
▪ Especially corrosive climates, such as near an ocean
▪ Hot and humid weather
▪ Scarcity of sufficiently trained maintenance staff
Relationship to Other Measures
When weather conditions are appropriate, an air economizer will reduce the need for mechanical cooling.
Therefore, the savings from cooling efficiency improvement measures will be reduced.
Assumptions
EDGE software uses monthly average outdoor air temperatures based on the project location to estimate the
suitability of an air economizer for the project. If more accurate monthly average outdoor temperatures are
available, they can be entered in the “Key Assumptions for the Base Case” section of the design tab.
Compliance Guidance
To demonstrate compliance, the design team must describe the specified system and provide documentation to
support the claims.
Design Stage Post-Construction Stage
At the design stage, the following must be used to
demonstrate compliance:
Manufacturer’s data sheet for the air economizer
specified; and
System schematics showing the location, brand
and model of the air economizer.
At the post-construction stage, the following must be
used to demonstrate compliance:
Updated system schematics;
Photographs of the installed economizer;
Purchase receipts and delivery notes for the
economizers; and
Manufacturer’s data sheet for the economizers
purchased.

ENERGY EFFICIENCY MEASURES
© International Finance Corporation 2019. All rights reserved. EDGE User Guide 118
E18 – CO2 SENSOR/DEMAND-CONTROLLED VENTILATION FOR FRESH
AIR INTAKE
Corresponds to RTE20
Requirement Summary
Mechanical ventilation in principal areas of the building can be controlled by CO2 sensors. At least 50% of the
building ventilation system should be controlled by CO2 sensors to claim this measure.
Intention
Mechanical ventilation introduces fresh air into the space. By installing CO2 sensors in the principal areas and
covering at least 50% of the building, mechanical ventilation can be switched off when it is not required, thus
consuming lesser energy. While the primary benefit of the CO2 sensors is the reduction of energy bills, the
following are the other associated benefits:
▪ Improved and consistent indoor air quality
▪ Occupant comfort
▪ Reduced greenhouse gas emissions; and
▪ Extended equipment life due to less demand on the HVAC system
It is recommended that the control system take frequent measurements of CO2 levels to adjust the ventilation
supply to maintain proper indoor air quality.
Approach/Methodologies
No calculations are involved in the assessment of this measure. To claim that it has been achieved, the principal
areas of the building must have CO2 sensors to control ventilation, covering at least 50% of the building floor
area.
Potential Technologies/Strategies
The amount of mechanical ventilation can be controlled to only provide fresh air to spaces at the time that it is
required. This reduces the energy consumed by the HVAC system. Traditional ventilation systems are designed
to provide a constant volume of fresh air based on maximum occupancy24. However, at partial occupancy levels,
energy is wasted to condition outside air provided through the mechanical ventilation system even when it is
24 Commercial HVAC, Manitoba Hydro. 2014. https://www.hydro.mb.ca/your_business/hvac/ventilation_co2_sensor.shtml

ENERGY EFFICIENCY MEASURES
© International Finance Corporation 2019. All rights reserved. EDGE User Guide 119
not needed. The level of Carbon Dioxide (CO2) in the air exhaled by people serves as a useful indicator of the
room's occupancy levels, and therefore its ventilation needs.
CO2 sensors are therefore a type of controls based on demand for the mechanical ventilation system, which
reduce energy consumption while ensuring good air quality. The savings vary depending on the configuration of
the HVAC system. For constant volume air-handling units (AHUs), the savings occur at the primary systems
(boilers, chillers, air-conditioners, etc.), while for variable-air-volume (VAV) AHUs, the savings occur not only at
the primary systems but also at the terminal boxes that include reheat25. The following image explains the way
CO2 sensors operate in both cases:
Figure 11. Energy savings due to CO2 sensors. Source23
ASHRAE Standard 90.1-2004 recommends that the building incorporate any type of Demand Controlled
Ventilation (DCV), which includes CO2 sensors, when the building has a density greater than 100 people and
when the AHU has an outdoor air capacity greater than 3,000 ft³/min. The following specifications are
recommended in ASHRAE 90.1-2004 for the selection of the CO2 sensor:
▪ Range: 0-2,000 ppm
▪ Accuracy (including repeatability, non-linearity and calibration uncertainty): +/- 50 ppm
▪ Stability (allowed error due to aging): <5% Full Scale for 5 years
▪ Linearity (maximum deviation between a reading and the sensor’s calibration curve): +/- 2% Full Scale
▪ Manufacturer recommended minimum calibration frequency: 5 years
Relationship to Other Measures
CO2 sensors are controls for the mechanical ventilation system that can reduce the amount of cooling or heating
energy, as well as fan energy, used by the HVAC system as less outside air is moved into the building. In
addition, if the building uses a water-cooled chiller for the AC, then a reduction in the water consumption is also
achieved.
25 Design brief: Demand-controlled ventilation, Energy Design Resources. 2007. http://energydesignresources.com/media/1705/EDR_DesignBriefs_demandcontrolledventilation.pdf?tracked=true

ENERGY EFFICIENCY MEASURES
© International Finance Corporation 2019. All rights reserved. EDGE User Guide 120
Assumptions
The base case assumption is that the mechanical ventilation is provided at a fixed rate. The improved case
assumes that CO2 sensors are installed on all fresh air systems to control the fresh air based on the demand.
Compliance Guidance
Design Stage Post-Construction Stage
At the design stage, the following must be used to
demonstrate compliance:
HVAC layout drawings showing the location of the CO2
sensors including the mounting height; and
Specification of the sensors from the manufacturer.
At the post-construction stage, the following must
be used to demonstrate compliance:
Photographs of the CO2 sensor controls in the
principal areas of the building. It is not
necessary to take photos of every sensor, but
the auditor must be convinced that a reasonable
proportion has been checked and verified; and
As-built electrical layout drawings showing the
location of the CO2 sensors if changed from
design; and/or
Purchase receipts and delivery notes for sensors,
showing that covers or guards have been
provided.

ENERGY EFFICIENCY MEASURES
© International Finance Corporation 2019. All rights reserved. EDGE User Guide 121
E19 – EARTH AIR TUNNEL SYSTEM TO PRE-CONDITION SUPPLY AIR
INTAKE
Corresponds to HSE23
Requirement Summary
This measure can be claimed if the building has an Earth Air Tunnel (EAT) system to help ventilate or pre-cool
or pre-heat the intake air for the air conditioning system.
Intention
Earth Air tunnel systems help buildings reduce fossil fuel consumption and lower operating costs by pre-heating
or pre-cooling the outside air entering the building. This reduces the load for space heating or for space cooling.
Buildings that use energy for heating or cooling with fresh air supply have the potential to benefit from an Earth
Air Tunnel system.
Approach/Methodologies
In a building with significant space heating or space cooling load, installing an EAT system will reduce energy
consumption. In an EAT, fresh outside air is passed through a tunnel or pipe several meters under the ground.
This pre-heats / pre-cools the air through conductive heat exchange with the relatively stable temperatures a
few meters under the surface of the ground. This tempered air is supplied to the building for heating, cooling or
ventilation.
In order to qualify, the design team must demonstrate that an EAT system is installed on the building site.
EDGE calculates the savings of the system based on the local climate conditions as well as the ground
temperature at which the system will be located. If the ground temperature is known, it can be input in the
EDGE software.
Potential Technologies/Strategies
The Earth Air Tunnel system, also called an Earth-Air heat exchanger, Air-to-soil heat exchanger, or Earth
Canal, is a system that relies on the relatively constant annual temperature a few meters below the ground. The
system uses the thermal inertia of the soil, and depends on its thermal conductivity (temperature difference
between the soil and the air). The thermal conductivity of the soil can be affected by different factors which are
detailed in the table below.

ENERGY EFFICIENCY MEASURES
© International Finance Corporation 2019. All rights reserved. EDGE User Guide 122
Table 35: Factors affecting thermal conductivity of the soil
Recovery technology Description
Moisture content Most notable impact is on thermal conductivity as it increases with moisture up to a certain
point (critical moisture content)
Dry density of soil Thermal conductivity increases when soil is dry and dense
Mineral Composition If the mineral content is high then the conductivity is high, while if the organic content is high
then conductivity is low.
Soil Texture Coarse textured, angular grained soil has higher thermal conductivity
Vegetation Vegetation acts as an insulating agent moderating the effect of temperature
The system has a wind catcher for the input air, which is driven down into an underground tunnel that runs
under the building, where the air is cooled or heated based on the weather conditions (see Figure 12). The
system is more commonly used in hot and dry climates for cooling, where air pre-cooled in the EAT system is
input to the mechanical ventilation system or circulated directly into the building.
Figure 12. Interaction of soil with Earth Air tunnel system
If the tunnel is used for cooling, the ground can be shaded using vegetation, and can be wetted by sprinkling
water to reduce the underground temperature further. The following are some of the design parameters to
consider when designing an Earth Air tunnel system, as they impact its performance.

ENERGY EFFICIENCY MEASURES
© International Finance Corporation 2019. All rights reserved. EDGE User Guide 123
Table 36: Design parameters to be considered for Earth Air tunnel system26
Parameter Description
Tube Depth
The deeper the better to get the lowest fluctuation in temperature. Generally, a balance between the
depth and the temperature can be obtained at four meters below the ground. However, that can vary
upon the external climate, the water content, the soil composition and its thermal properties.
Surface area (Tube
Length and diameter)
Higher surface area of the pipe (diameter and length), higher heat transfer, therefore higher efficiency.
However, the length should be optimized as after certain length no significant no significant heat
transfer occurs and more fan energy is required.
Also, increased diameter results in reduction of air speed and heat transfer.
The surface area of the pipe will be determined by the balance of the best performances vs. costs.
Air Flow rate Increase of air flow increases the heat transfer and the outlet temperature.
Tube arrangement:
Open-loop system: Outdoor air is driven to AHU or to the building. Apart from providing ventilation,
it also provides heating or cooling.
Closed-loop system: Air from the interior of the building is circulated through the Earth-Air tunnel to
reduce condensation problems as well as it increases efficiency.
One-tube system: This arrangement is not efficient for cooling due to the length of the tube, but it is
cost-efficient for ventilation purposes
Parallel tubes system: This arrangement increases thermal performance as it reduces the air
pressure.
Open-loop system Closed-loop system Parallel tubes system
Tube Material
The selection of material is based on the cost, the strength, resistance to corrosion and durability, but
not based on the performance, as it has little influence on it.
Efficiency It is measured using the Coefficient of Performance (COP), which is based on the amount of
heating/cooling generated by the system and the amount of energy needed to move the air though the
system.
26 Adapted from: Singh, Angad Deep, Earth Air Tunnels, (n.d.), Retrieved April 11, 2018 from ASHRAE India website
http://ashraeindia.org/pdf/Angad_Deep_Singh.pdf

ENERGY EFFICIENCY MEASURES
© International Finance Corporation 2019. All rights reserved. EDGE User Guide 124
Relationship to Other Measures
The air intake is pre-cooled in hot weather; this decreases the cooling load and consumption due to ‘Cooling
Energy.’ The same principle applies to the heating load if the building uses predominately space heating, in
which case the reduction is in ‘Heating Energy.’ In addition, both 'Fan Energy' and 'Pump Energy' are reduced
because the load for the cooling / heating system is lower, and the HVAC system does not need to work at full
capacity.
Assumptions
The HVAC systems included in the base case do not include an Earth Air tunnel system. The improved case is
assumed to have an Earth Air tunnel system that uses the local ground temperature (based on the weather file)
at 4 meters below the ground.
Compliance Guidance
Design Stage Post-Construction Stage
At the design stage, the following must be used to
demonstrate compliance:
Mechanical and electrical layout drawings showing
the location and design of the Earth Air Tunnel
system; and
Evidence of the ground temperature at the location
of the system.
At the post-construction stage, the following must be
used to demonstrate compliance:
As-built mechanical and electrical drawings with
the location and design of the Earth Air Tunnel
system, if changed from design; and
Photographs of the installation of Earth Air Tunnel
system.

ENERGY EFFICIENCY MEASURES
© International Finance Corporation 2019. All rights reserved. EDGE User Guide 125
E20 – VARIABLE SPEED DRIVES ON THE FANS ON COOLING TOWERS
Corresponds to HTE15, RTE16, OFE18, HSE19, EDE17
Requirement Summary
This measure can be claimed if water-cooled chillers are installed for the cooling system, and the fans in the
cooling towers of the chillers use only Variable Speed Drive (VSD) motors. These are typically variable-
frequency drive (VFD) or adjustable-frequency drive motors, although other VSD technologies are available.
Intention
VSD fans offer improved system reliability and process control. By specifying VSD fans for cooling towers,
energy consumption is reduced resulting in reduced utility costs. The lifetime of system components is increased
because of lesser use at full capacity leading to lesser wear and tear with less maintenance needed.
Approach/Methodologies
Cooling towers need to operate at the maximum (peak) load only at certain times. For most of the hours in a
day, they only need to operate at part loads. VSDs on fans control and regulate the fan speeds depending on
the load on the cooling towers, as opposed to constant speed fans, thus reducing energy consumption.
To claim this measure, the design team must demonstrate that the project includes Air Conditioning with Water
Cooled Chillers, and that the fans on the cooling towers of the HVAC system are VSD fans.
Potential Technologies/Strategies
Water chiller systems include cooling towers which are specialized heat exchangers in which air and water are
brought into direct contact with each other to reduce the water's temperature through evaporation. Water
carrying heat from the building is pumped through pipes to the cooling tower. There it is sprayed through
nozzles onto banks of material that break up the water, exposing a large amount of the water surface to air.
The air that is driven across the water to cool it approaches 100% relative humidity and elevated temperatures
and is rejected to the atmosphere. A small amount of water evaporates in the process and the rest cools down
and is pumped back into the chiller where it again absorbs heat in a continuous cycle.
The air used to cool the water is pulled through the cooling tower by electric motor-driven fans. These fans can
be electronically controlled with Variable Speed Drive (VSD) motors. A VSD motor regulates the speed and the
rotational force of the fan by varying the motor input frequency and voltage.

ENERGY EFFICIENCY MEASURES
© International Finance Corporation 2019. All rights reserved. EDGE User Guide 126
Figure 13. Schematic of cooling tower and VSDs system27
Relationship to Other Measures
When VSDs for the fans of the cooling towers is selected as an energy efficiency measure, the cooling system
selected must be Air Conditioning with Water Cooled Chiller to show the savings. Reduced fan energy will also
reduce the heat loss from fan motors and, therefore, the load on the cooling energy.
Assumptions
The base case for the air conditioning system varies based on ASHRAE 90.1-2007, and is typically a standard
Packaged Terminal Air Conditioner (PTAC), as listed in the Key Assumptions for the Base Case in the Design
section*. Cooling towers and therefore, VSDs on cooling towers, are not typically part of the baseline. In the
Improved Case, this measure will show savings only if ‘Air Conditioning with a Water-Cooled Chiller’ is also
selected as a measure because cooling towers are a part of the chiller system. The assumption for the Improved
Case is that all fans in the cooling towers will be provided with VSDs.
27 Source: Image courtesy of Joliet Technologies, L.L.C. 2014 and Schneider Electric SE. 2014

ENERGY EFFICIENCY MEASURES
© International Finance Corporation 2019. All rights reserved. EDGE User Guide 127
Compliance Guidance
To demonstrate compliance, the design team must describe the specified system and provide documentation to
support the claims.
Design Stage Post-Construction Stage
At the design stage, the following must be used to
demonstrate compliance:
Manufacturer’s data sheets for the air conditioning
with water cooled chiller and cooling towers,
showing the specification of VSDs in the fans of the
cooling towers; and
For systems including more than one cooling
tower, the design team must ensure that all fans
are provided with VSDs; and
Mechanical and electrical layout drawings
highlighting the use of VSDs in the fans of the
cooling towers.
At the post-construction stage, the following must be
used to demonstrate compliance:
Delivery notes showing that specified VSDs have
been delivered to the site along with the cooling
towers and the water-cooled chillers; and
Manufacturer’s data sheets for the air conditioning
with water cooled chiller, showing the specification
of VSDs in the fans of the cooling towers; or
Photographs of installed VSDs in the cooling
towers.

ENERGY EFFICIENCY MEASURES
© International Finance Corporation 2019. All rights reserved. EDGE User Guide 128
E21 – VARIABLE SPEED OR FREQUENCY DRIVES (VSD OR VFD) IN
AHUs
Corresponds to RTE17, OFE19, HSE20, EDE18
Requirement Summary
This measure can be claimed if the fans in the Air Handling Units (AHUs) of the HVAC system are installed with
Variable Speed Drive (VSD) motors. These are typically variable-frequency drive (VFD) or adjustable-frequency
drive motors although other VSD technologies are also available.
Intention
The aim is to encourage the project team to specify VSDs, which modulate the motor speed of AHU fans based
on actual demand.
Approach/Methodologies
Air Handling Units (AHUs) are part of the typical HVAC system which contain heating/cooling coils, filters and
fans. The fans use a significant amount of energy if they continuously run at a constant speed. Variable Speed
Drive (VSD) motors use an electronic device to modulate the speed of the fan motors based on actual
heating/cooling demand. The power demand of motors is directly proportional to the cube of the motor speed.
So, even a 20% reduction in motor speed cuts down power consumption by about half28.
To claim this measure, the design team must demonstrate that all the installed AHU fans have VSD motors.
Potential Technologies/Strategies
VSDs offer a high degree of control and are extremely versatile. They are available both as integrated and
standalone devices that can be connected to the fan motor.
Assumptions
The base case for the air conditioning system is dependent on the building size and type. This measure will
show savings only if the air conditioning system has AHUs. The assumption is that all fans in the HVAC system
will be provided with VSDs.
28 http://www.ecmweb.com/power-quality/basics-variable-frequency-drives

ENERGY EFFICIENCY MEASURES
© International Finance Corporation 2019. All rights reserved. EDGE User Guide 129
Compliance Guidance
To demonstrate compliance, the design team must describe the specified system and provide documentation to
support the claims.
Design Stage Post-Construction Stage
At the design stage, the following must be used to
demonstrate compliance:
Mechanical and electrical layout drawings showing
the entire HVAC system and highlighting the use of
VSDs in AHU fans; and
Manufacturer’s data sheets for VSDs for fans.
At the post-construction stage, the following must be
used to demonstrate compliance:
Delivery notes showing that specified VSDs have
been delivered to the site; and
Manufacturer’s data sheets for VSDs for fan
motors; or
Photographs of installed VSDs for fan motors.

ENERGY EFFICIENCY MEASURES
© International Finance Corporation 2019. All rights reserved. EDGE User Guide 130
E22 – VARIABLE SPEED DRIVE PUMPS
Corresponds to HTE16, RTE18, OFE20, HSE21, EDE19
Requirement Summary
This measure can be claimed if the HVAC system has installed Variable Speed Drive (VSD) pumps, that is
pumps with VSD motors.
Intention
The aim is to encourage the project team to specify VSD pumps, as energy consumption will be reduced, and
therefore the utility costs. The lifetime of the system components is increased and less maintenance is needed.
Approach/Methodologies
In most cases, the HVAC system needs to operate at the maximum (peak) load only at certain times because its
load is not continuous. VSDs control and regulate the speed of the flow depending on the load of the HVAC
system. Therefore, installing VSD pumps on the cooling/heating system will reduce energy consumption.
The following are the pros and cons of VSD motors for pumps:
Table 37: Benefits and limitations of VSD motors for pumps
Benefits and Limitations of VSDs for Pumps
BENEFITS Improved Process Control: Provide regulation functions that improve the entire
system and protect the other components of the system.
Improved System Reliability: Lower chance of failure
Simplified pipe systems: Elimination of control valves and by-pass lines
Improved system lifetime: Avoidance of soft start and stop, and resulting mechanical
overload and peak pressures implied by on-off systems
Reduced energy costs and maintenance: Ability to modulate speed and torque at part-loads
reduces energy use, and wear and tear
LIMITATIONS Minimum speed may be required (typically
30%)
Manufacturers may require a minimum speed to avoid
problems with overheating and lubrication

ENERGY EFFICIENCY MEASURES
© International Finance Corporation 2019. All rights reserved. EDGE User Guide 131
To claim this measure, the design team must demonstrate that only VSDs pumps are installed. The HVAC
system must require pumps, such as air or water-cooled chillers, heat pumps or absorption chillers, which must
be previously selected.
Potential Technologies/Strategies
Various methods can be used to regulate the speed of the flow in the pumps to modulate its use in tandem with
the load on the system, therefore reducing the energy consumption.
Variable Speed Drive (VSD) pumps use electronics to control the power used by the motor of the pump to
adjust the speed of the flow into an HVAC system in response to the demand.
VSDs offer a high degree of control and are extremely versatile. They are available as standalone devices that
are connected to the motor of the pump except for motors below 15kW, which are embedded or integrated into
the motor.
Relationship to Other Measures
When VSDs for the pumps is selected as an energy efficiency measure, it is required that the HVAC system
selected are either air or water-cooled chillers, heat pumps or absorption chillers for savings to show. Reduced
pump energy use will also reduce the heat loss from pump motors and, therefore, the load on the cooling
energy.
Assumptions
The base case for the air conditioning system varies based on ASHRAE 90.1-2007, and is typically a standard
Packaged Terminal Air Conditioner (PTAC), as listed in the Key Assumptions for the Base Case in the Design
section*. This measure will show savings only if the improved case includes air- or water-cooled chillers, heat
pumps, or absorption chillers, that is, systems in which pumps are a part of the system. The assumption is that
all pumps in the HVAC system will be provided with VSDs.
Compliance Guidance
To demonstrate compliance, the design team must describe the specified system and provide documentation to
support the claims.
Design Stage Post-Construction Stage
At the design stage, the following must be used to
demonstrate compliance:
Mechanical and electrical layout drawings showing
the entire HVAC system and highlighting the use of
VSD pumps; and
Manufacturer’s data sheets for VSD pumps.
At the post-construction stage, the following must be
used to demonstrate compliance:
Delivery notes showing that specified VSDs have
been delivered to the site; and
Manufacturer’s data sheets for VSD pumps; or
Photographs of installed VSD pumps.
ENERGY EFFICIENCY MEASURES
© International Finance Corporation 2019. All rights reserved. EDGE User Guide 132
E23* – GROUND SOURCE HEAT PUMP
Corresponds to HTE12, RTE13, OFE14, HSE16, EDE14
Requirement Summary
If the project includes ground source heat pumps, the actual COP (coefficient of performance) of the system
must be entered in the software (even if the COP is lower than the base case). The COP is used to establish the
efficiency. Savings can be achieved if the Ground Source Heat Pump system achieves a COP greater than the
base case, as set out in the Key Assumptions for the Base Case in the Design section.
Intention
Ground source heat pumps (GSHPs), sometimes referred to as geothermal heat pumps (GHPs), are used to
heat and cool buildings by absorbing naturally existing heat from the earth. A GSHP/GHP takes advantage of
the more constant below-ground temperature within the earth (soil or water) compared to the more variable
outside air temperature. Below-ground temperature is warmer than the air during the winter and cooler than
the air in the summer. A GHP takes advantage of this by exchanging heat with the earth through a ground heat
exchanger. A GHP can reach a high COP of 3 to 5.2 on the coldest winter nights, compared to air-source heat
pumps that only reach up to a 1.5 to 2.5 COP on cool days. Ground source heat pumps are a clean alternative
utilizing renewable and reliable sources of energy29.
Approach/Methodologies
EDGE uses the Coefficient of Performance (COP) to measure the efficiency of the ground source heat pump. As
defined in ASHRAE, the COP is the “ratio of the rate of heat delivered to the rate of energy input, in consistent
units, for a complete heat pump system, including the compressor and, if applicable, auxiliary heat, under
designated operating conditions.” For consistency, the ARI conditions should be used for comparison of COP
values.
To achieve savings from this measure, the Ground Source Heat Pump must have a COP greater than the base
case. The COP for an efficient ground source heat pump ranges between 3.6 and 5.2.
If air conditioning is not specified, any cooling load will be displayed as “virtual energy.”
Potential Technologies/Strategies
Four major types of ground source heat pump systems (GHPs) are available. Of these four types, three systems
– the horizontal, vertical, and pond systems – are closed loop systems. The fourth major type of GHP is the
open loop system. A closed loop system recirculates antifreeze or water through a loop of piping that is either
buried in the ground or submerged under water. A heat exchanger transfers heat between the refrigerant in the
heat pump and the antifreeze/water solution. An open loop GHP system pumps water from a ground or water
29 Source: http://energy.gov/energysaver/articles/geothermal-heat-pumps and www.informedbuilding.com

ENERGY EFFICIENCY MEASURES
© International Finance Corporation 2019. All rights reserved. EDGE User Guide 133
source, circulates the water and then discharges it once the heat has been transferred into or out of the water.
It draws fresh water instead of recirculating the same water again.

ENERGY EFFICIENCY MEASURES
© International Finance Corporation 2019. All rights reserved. EDGE User Guide 134
Table 38: Types of Ground Source Heat Pumps30.
System Geothermal Heat Pump Type Process
Closed Loop System
Horizontal 31
A horizontal closed loop is usually the most cost effective for buildings with adequate land space available, in which trenches are easy to dig. This type of installation is composed of pipes that run horizontally in the ground. A slinky method is sometimes used to loop or coil the pipes along the bottom of a wide trench if space is inadequate space for a true straight horizontal system. Essentially, coiled loops are more economically and space-efficient.
Closed Loop System
Vertical
A vertical closed loop installation is usually most cost-effective for building sites with limited amount of land space or where existing landscape is to be preserved. This type of installation is composed of pipes that run vertically beneath the ground. Holes are drilled into the ground, in which each hole contains a single loop of pipe that ranges from 30 to 100 meters deep. Vertical pipes are then inserted and connected to a heat pump within the building. This type is more expensive to
install due to the drilling, but less material (piping) and land are required.
Closed Loop System
Pond/Lake
A pond or lake closed loop system is used only if a body of water at least 2.5-meter-deep body is in close proximity to the building property. A supply line pipe runs underground from the building and connects to large, coiled pipes that are located deep beneath the water. Due to advantages of water-to-water heat transfer, a pond system is both a highly economical and efficient option for a heat pump.
Open Loop System
Open Geothermal Loop System
An open geothermal loop system uses a well or pond to pump fresh water into and back out of the geothermal system. The water is used as the heat exchange fluid that circulates within the GHP. An abundant source of fresh clean water and a water runoff area is essential for a successful open loop system.
30 Source: ASHRAE 90.1-2010
31 Source of all images in this table: courtesy of U.S. Department of Energy

ENERGY EFFICIENCY MEASURES
© International Finance Corporation 2019. All rights reserved. EDGE User Guide 135
Relationship to Other Measures
The local climate, heat gains and the internal temperatures based on the building design impact the cooling
load. A more efficient system will not impact other measures, but several measures will impact the total energy
use of the cooling system.
When a ground source heat pump is selected as an energy efficiency measure, the heating and/or cooling
energy is reduced depending on the load on the building systems. The energy use by pumps is slightly
increased due to the operation of the system.
Assumptions
The base case includes an air conditioning system based on ASHRAE 90.1-2007, which is typically a Packaged
Terminal Air Conditioner (PTAC) (a ground source heat pump is not a default base case system). The efficiency
(COP) value of the base case in EDGE varies depending on factors such as building area and location. The
improved case COP for the ground source heat pump system varies between 3.6 and 5.2 depending on the
location; if the system efficiency is different than the default value provided in EDGE, then the actual COP must
be entered.
Compliance Guidance
To demonstrate compliance, the design team must describe the specified system and provide documentation to
support the claims.
Design Stage Post-Construction Stage
At the design stage, the following must be used to
demonstrate compliance:
Manufacturer’s data sheets for the ground source
heat pump system specifying COP information; and
Mechanical and electrical layout drawings showing
the location of the external loops and internal
equipment and distribution for all floors.
At the post-construction stage, the following must be
used to demonstrate compliance:
As-built mechanical and electrical drawings with
system schematics and distribution for all floors;
and
Manufacturer’s data sheets for the ground source
heat pump system specifying COP information; and
Photographs of the installation process of the
external loops and internal equipment installed;
and/or
Purchase receipts and delivery notes showing that
the specified system has been delivered to the site.

ENERGY EFFICIENCY MEASURES
© International Finance Corporation 2019. All rights reserved. EDGE User Guide 136
E24 – RADIANT HEATING AND COOLING SYSTEM
Corresponds to OFE16
Requirement Summary
This measure can be claimed if at least 50% of the building area is served by a radiant cooling or heating
system.
Intention
Reducing fan energy associated with traditional forced air cooling/ heating systems can reduce operational
costs. Occupant comfort can also be improved due to reduction in wide temperature diversities, strong
ventilation drafts and fan noise.
Approach/Methodologies
In EDGE, the maximum heat removal capacity of a Radiant System is taken as 50W/m2 of ceiling area. If the
cooling or heating load of the building is more than 50W/m2, the excess load is considered as a secondary
system load.
When a user selects the radiant cooling measure, the COP of the cooling system is assumed to increase by
15%. But if a DX or VRV system has been selected in the project, selecting the radiant cooling system will not
show any savings. If an Absorption Chiller is selected, it is given first priority and then the radiant system.
No air flow is assumed with a radiant system, therefore, the AHU power for the radiant system is zero.
Potential Technologies/Strategies
Radiation is an effective way of heating or cooling occupants, as it involves heat transfer via infra-red waves
absorbed and emitted from various surfaces. The amount of heat transfer is directly proportional to the
temperature difference between the surfaces. Human thermal comfort can be achieved by designing some of
the surfaces surrounding the occupants to be a bit colder (or warmer, in a heating situation) than the desired
temperature. This is done typically by piping cold or hot water to “radiant panels” in the walls, ceiling or floor or
in chilled beams. Radiant systems can also be standalone units. For heating, electrically operated or gas-fired
panels can also be used.
Radiant systems are especially effective in spaces with large ceiling height and in non-partitioned spaces, where
a traditional system will require significant forced air to condition. They are also useful in semi-open spaces,
such as outdoor entrances, stadiums, etc. The radiant panels should be installed in such a way that they have a
view over the occupants.
Since the radiant systems typically operate at relatively milder temperatures (less than 82ºC for heating and
higher than 7ºC for cooling), the cooling/ heating plants can be much smaller. These systems do not depend on
air movement for heat transfer, and the ventilation rates can be typically cut down by up to 75% just to meet

ENERGY EFFICIENCY MEASURES
© International Finance Corporation 2019. All rights reserved. EDGE User Guide 137
the fresh air requirements. A Dedicated Outdoor Air System (DOAS), sometimes with energy recovery, can be
used to provide this air.
One of the challenges to a radiant cooling system, especially in humid climates, is moisture control. If the
surface temperature of the radiant panel drops below the ambient air dew point temperature, water may start
condensing on the surface. This could lead to mold growth and other indoor air quality issues. The panel
temperature and relative humidity of the indoor space must be properly balanced to avoid this situation.
Radiant systems also require smaller mechanical system spaces and duct sizes. Acoustic quality of the spaces is
also improved due to reduction in fan noise.
Relationship to Other Measures
Effectiveness of the Radiant systems can be reduced if the building envelope (including glass) is not sufficiently
insulated. In buildings with a large exterior glass area, much of the heat transfer from the radiant panels may
be with exterior surfaces, instead of with the desired interior surfaces and occupants.
Assumptions
The base case for the cooling and heating system comprises of traditional forced air systems, whose efficiency
can be found under the Key Assumptions on the Design tab. The efficiency is based on ASHRAE 90.1-2007.
The COP of the improved case with a radiant cooling and heating system varies according to the peak cooling
load of the project building.
Compliance Guidance
To demonstrate compliance, the design team must provide documentation to support the claims.
Design Stage Post-Construction Stage
At the design stage, the following must be used to
demonstrate compliance:
Manufacturer’s data sheets for the radiant cooling/
heating technology used; and
Mechanical and electrical layout drawings showing
the location of the panels, and the output efficiency
for system.
At the post-construction stage, the following must be
used to demonstrate compliance:
As-built mechanical and electrical drawings with
the location of the radiant panels, and the output
efficiency of the cooling/ heating system; and
Photographs of installed equipment related to the
system; or
Delivery notes showing that specified radiant
technology have been delivered to the site.

ENERGY EFFICIENCY MEASURES
© International Finance Corporation 2019. All rights reserved. EDGE User Guide 138
E25 – SENSIBLE HEAT RECOVERY FROM EXHAUST AIR
Corresponds to HTE17, RTE19, OFE21, HSE22, EDE20
Requirement Summary
This measure can be claimed if a Sensible Heat Recovery device with at least 60% efficiency is installed in the
ventilation system to reuse the heat from the exhaust air.
Intention
Recovering sensible heat from the exhaust air helps buildings to reduce fossil fuel consumption, and lower
operating costs by providing useful heat for space heating and in some cases for space cooling. Buildings that
use energy for heating or cooling with fresh air supply have the potential to benefit from the application of heat
recovery systems for ventilation.
Approach/Methodologies
When buildings include an HVAC system and the main load of the building is due to space heating, installing
sensible heat recovery on the ventilation system reduces energy consumption by preheating the incoming fresh
air with the outgoing exhaust air. Alternatively, in cooling mode, the incoming fresh air is cooled with the
exhaust air from the air-conditioned space.
To qualify, the design team must demonstrate that the HVAC system has a sensible heat recovery device on the
fresh air supply system. No heat recovery system is included in the base case. EDGE uses Temperature Transfer
Efficiency (TTE) as the measure of efficiency, which is either quoted by the manufacturer or can be calculated
with the following formula:

ENERGY EFFICIENCY MEASURES
© International Finance Corporation 2019. All rights reserved. EDGE User Guide 139
Temperature Transfer Efficiency (TTE):
𝝁𝒕 = 𝑻𝟐−𝑻𝟏
𝑻𝟑−𝑻𝟏
Where: μt = Temperature Transfer Efficiency (%)
T1 = Outside air temperature before heat exchanger (ºC)
T2 = Air temperature after heat exchanger (ºC)
T3 = Exhaust air temperature before heat exchanger (ºC)
Potential Technologies/Strategies
Heat recovery aims to collect and reuse the heat arising from a process that would otherwise be lost. In the
case of sensible heat recovery in buildings, it involves transfer of energy between an exhaust airstream that
preheats (winter mode) or precools (summer mode) the supply airstream. As air contains moisture, the heat
contained within the air can be sensible heat (affects the temperature) or latent heat (includes water vapor).
Some energy recovery devices transfer both sensible and latent heat (also called “total heat recovery”), and
some only transfer sensible heat, which is the technology covered by this measure.
Sensible Heat Recovery occurs when the temperature of the cooler air stream exchanges heat with the
temperature of the warmer air stream. Moisture level is not impacted unless condensation occurs.
In some areas of the building where condensation is expected, such as restaurants, spas and pools, this
technology is ideal as the materials are anti-corrosive. It is also convenient for light ventilation systems as it
offers low pressure drops.
Relationship to Other Measures
Sensible heat is recovered from the exhaust air, reducing the heating load in heating mode and therefore
decreasing consumption in “Heating Energy.” The same principle applies to the cooling load if the building is
predominantly in cooling mode; then the reduction is in “Cooling Energy.” The energy due to “Fans” also
decreases slightly as less air is moved. However, in climates where both heating and cooling are used, savings
appear in the “heating energy,” but the “cooling energy” increases due to some heat trapped during midseason.

ENERGY EFFICIENCY MEASURES
© International Finance Corporation 2019. All rights reserved. EDGE User Guide 140
Assumptions
The HVAC systems included in the base case do not include heat recovery systems. The improved case is
assumed to have a sensible heat recovery device with a Temperature Transfer Efficiency (TTE) of at least 60%.
If the actual TTE value is higher or lower than 60%, the value must be entered in EDGE. It is assumed that at
least 75% of all exhaust air in the building is being passed through the heat recovery system.
Compliance Guidance
To demonstrate compliance, the design team must provide documentation to support the claims.
Design Stage Post-Construction Stage
At the design stage, the following must be used to
demonstrate compliance:
Manufacturer’s data sheets for the sensible heat
recovery device specifying Temperature Transfer
Efficiency; or
A calculation to demonstrate efficiency in case the
manufacturer’s data does not specify the TTE; and
Mechanical and electrical layout drawings showing
the location of the heat recovery technology and
indicating % of total air passing through the heat
recovery system.
At the post-construction stage, the following must be
used to demonstrate compliance:
As-built mechanical and electrical drawings with
the location of recovery technology, if changed
from design; and
Delivery notes showing that the specified recovery
technology has been delivered to the site; and
Manufacturer’s data sheets for the sensible heat
recovery technology using the specified efficiency
(TTE) if changed from design; or
Photographs of the installed heat recovery system.
ENERGY EFFICIENCY MEASURES
© International Finance Corporation 2019. All rights reserved. EDGE User Guide 141
E26 – HIGH EFFICIENCY CONDENSING BOILER FOR SPACE HEATING
Corresponds to HME12, HTE18, RTE21, OFE22, HSE24, EDE21
Requirement Summary
This measure can be claimed if the boiler used for delivering space heating is a condensing boiler with an annual
fuel utilization efficiency greater than the base case, as set out in the Key Assumptions for the Base Case in the
Design section. By default, the base case system efficiency is 80% if gas is selected as the heating fuel.
Intention
The specification of a condensing boiler for space heating can reduce the energy required to satisfy the heating
load for a building, if the fuel selected for heating is gas. Condensing boilers can be up to 97% efficient.
Approach/Methodologies
To qualify, the condensing boiler must be able to demonstrate an efficiency level greater than the base case of
80%. Different methodologies can be used for demonstrating the efficiency of a condensing boiler, for example,
manufacturers might quote the gross efficiency, net efficiency, seasonal efficiency, or the annual fuel utilization
efficiency (AFUE), each of which uses a different methodology to calculate the percentage.
EDGE uses AFUE as the measure of efficiency as it provides the most consistent methodology. AFUE is
calculated by comparing the seasonal thermal energy output to the calorific value of the fuel used. AFUE data is
available from the Energy Star website at http://www.energystar.gov/productfinder/product/certified-
boilers/results. If the AFUE is not available, Thermal Efficiency may be used as a proxy.
Modular systems usually use multiple boilers of the same size and type. However, where boilers with different
efficiency ratings are specified, the weighted average efficiency must be calculated accounting for boiler size
and the expected run time.
Potential Technologies/Strategies
An efficient boiler is one that turns as much of its fuel into useful energy as possible. Condensing boilers are
most likely to achieve the highest level of efficiency. They utilize the latent heat in the waste gases’ water vapor
which is generated by the combustion process. Condensing boilers have a larger heat exchanger that recovers
more heat and sends cooler gases up the flue. Additional heat is extracted from the water vapor from
combustion; the heat extraction converts the vapor into liquid or “condensate”. This condensate is removed
through the drain or the flue. The types of condensing boilers available in the market are as follows:

ENERGY EFFICIENCY MEASURES
© International Finance Corporation 2019. All rights reserved. EDGE User Guide 142
Table 39: Types of Condensing Boiler
Type / method Description
Heat-only boilers Conventional boilers
Provide both space heating and hot water
Hot water storage cylinder and cold-water top-up tanks are
required, plus a loft tank for feed and expansion
System boilers The pump and expansion vessel are built-in, does not need a
loft tank.
Designed to generate space heating and service hot water,
the latter stored in a separate hot water storage tank.
Combination boilers or 'Combi' Combines a high-efficiency water heater and a central
heating boiler in a compact unit
Heats water instantaneously on demand
Does not need a loft tank or storage cylinder Good water pressure, as water is directly from the mains
Economical to run
Modulated control boilers New generation
More efficient because of the modulated controls
To achieve the best results, care must be taken not to oversize the boiler, since maximum levels of efficiency
are achieved at a full load. In larger buildings with a centralized plant, like an education building, a modular
system made up of an array of smaller boilers may be appropriate. Smaller boilers can be used so that when
the system is under partial load, individual boilers within the array can still operate at full load.
To minimize the cost of a boiler installation, the heat loads must be minimized before sizing the system.
Relationship to Other Measures
The heat demand that the boiler is sized to supply is affected by the balance between heat gains and heat
losses. Heat losses must be minimized during initial construction as the cost of improvements to the building
fabric implemented during the initial construction is typically lower than the cost of installing a larger plant.
If this measure is selected, natural gas must be selected as the main fuel for space heating in the Key
Assumptions for Base Case on the Design page. Only “Heating energy” is reduced with this measure.
Assumptions
The base case for the efficiency of the space-heating boiler assumes 80% efficiency. The default efficiency for
the improved case is 90%, which can be overwritten. Actual efficiency must be input for the selected equipment
if this measure is selected. The base case is assumed to use Electricity as the fuel for heating; if this measure is
selected, the main fuel must be changed to “Natural Gas.”

ENERGY EFFICIENCY MEASURES
© International Finance Corporation 2019. All rights reserved. EDGE User Guide 143
Compliance Guidance
To demonstrate compliance, the design team must provide the following documentation to support their claims.
Design Stage Post-Construction Stage
At the design stage, the following must be used to
demonstrate compliance:
Manufacturer’s data sheet for the condensing
boiler(s) specified
System schematics showing the brand and model
of boiler(s), and
The calculation of the average weighted efficiency
if multiple condensing boilers with different
efficiencies are specified
At the post-construction stage, the following must be
used to demonstrate compliance:
Updated system schematics
Photographs of the installed condensing boilers
Manufacturer’s data sheet indicating AFUE for the
condensing boiler(s) purchased, and
Purchase receipts and delivery notes for the
condensing boilers

ENERGY EFFICIENCY MEASURES
© International Finance Corporation 2019. All rights reserved. EDGE User Guide 144
E27 – RECOVERY OF WASTE HEAT FROM THE GENERATOR FOR SPACE
HEATING
Corresponds to HTE14, RTE15, OFE17, HSE18, EDE16
Requirement Summary
This measure can be claimed if an on-site power generator fueled by Diesel or Natural Gas provides power to
the building, and a recovery technology is installed to capture the waste heat for space heating.
Intention
Recovering waste heat from power generators helps buildings to significantly reduce fossil fuel consumption,
lower operating costs, and limit pollutant emissions by providing useful heat for space heating. Buildings that
use fossil fuel energy for heating and that have a power generator as the main electricity source have the
potential to benefit from the application of heat recovery systems.
Approach/Methodologies
If this measure is selected, the assumptions in the Key Assumptions on the Design tab must be verified. The
user must select the appropriate fuel under ‘Fuel Used for Electric Generator,’ and input the appropriate value
for ‘% of Electricity Generation Using [Fuel].’
Potential Technologies/Strategies
In the context of buildings, heat recovery collects and reuses the heat arising from a process that would
otherwise be lost. Sometimes, the loss of this heat is intentional, such as in air conditioning, where the purpose
is to remove heat from a space. But in the case of an electric generator, it typically has low efficiency and a
large portion of the energy input is lost via the exhaust gases and in cooling the equipment jacket. The
following image shows the different sources of waste heat and the uses of the recovered waste heat:

ENERGY EFFICIENCY MEASURES
© International Finance Corporation 2019. All rights reserved. EDGE User Guide 145
Figure 14. Typical Sources of Waste Heat and Recovery Options32
This waste heat can be turned into useful space heat with a recovery technology such as one of those indicated
in the table below:
Table 40: Recovery technology options
Recovery Technology Description
Thermal Energy Storage (TES) Buffer tank where waste heat from different sources is stored and realized later to
reduce the heating load during night time.
Seasonal Thermal Energy Storage
(STES)
This technology is similar to TES but the heat is kept for longer periods of time,
even months. Usually, the heat is stored in a bigger area where a cluster of heat-
exchanger equipped boreholes is surrounded by bedrock.
Pre-heating Simply put, waste heat can help to preheat incoming water, air and objects before
they are heated to the desired temperature. This can happen in a heat exchanger,
where the waste heat is mixed with the incoming air/water to increase its
temperature before it enters into a boiler or heater.
Cogeneration or Combined Heat and
Power (CHP) system
This is a system that reduces the waste heat used in the generation of power;
however, some limitations arise from the engineering cost/efficiency of using small
temperature differences on the power generation.
Recuperator This is a type of heat exchanger with simultaneous flow of hot and cold fluids
along physically separated flow paths, transferring heat between the streams.
Heat Pipe exchanger33
This type pf heat exchanger has vacuum-sealed tubes filled with a working fluid
(heat pipes) that are used to absorb heat from a warmer surface and transfer it to
a cooler surface. The working fluid inside a heat pipe evaporates at the warmer
surface and then travels to the colder surface where it transfers that latent heat
and turns back into a liquid phase.
32 Source: Heat is Power Association. Trade association of Waste Heat to Power (Not-for-Profit organization)
33 Source: Heat is Power Association. Trade association of Waste Heat to Power (Not-for -Profit organization)

ENERGY EFFICIENCY MEASURES
© International Finance Corporation 2019. All rights reserved. EDGE User Guide 146
Relationship to Other Measures
EDGE calculates the heating load by taking into account the local climate, heat losses and internal temperatures
based on the building design. If a heating system is not specified, any heating load will be displayed as “virtual
energy.”
When waste heat is recovered from the generator, heating energy consumption of utility fuel is decreased.
However, the energy from pumps may increase slightly due to the operation of the waste heat recovery system.
Assumptions
The default base case for the fuel of the electric generator is Diesel, as listed in the Key Assumptions for the
Base Case in the Design section. The fuel can be changed to Natural Gas if that is the main fuel powering the
generator. In the same section, the default assumption for the percentage of annual electricity provided by the
generator is 5%. The user must input the appropriate value for ‘% of Electricity Generation Using [Fuel]’ to
update this default. Justification and documentation must be provided for these key assumptions.
Compliance Guidance
To demonstrate compliance, the design team must provide the following documentation to support their claims.
Design Stage Post-Construction Stage
At the design stage, the following must be used to
demonstrate compliance:
Manufacturer’s data sheets for the electric
generator specifying hours of operation and
coverage of the demand; and
Manufacturer’s data sheets for the recovery
technology used; and
Mechanical and electrical layout drawings showing
the location of the generator, the recovery
technology and the output for the space heating
system; and
Calculation to demonstrate that waste heat covers
the percent of the demand for space heating as
calculated in the EDGE software.
At the post-construction stage, the following must be
used to demonstrate compliance:
As-built mechanical and electrical drawings with
the location of the generator, the recovery
technology and the output for the space heating
system; and
Delivery notes showing that the specified electric
generator and the recovery technology have been
delivered to the site; and
Manufacturer’s data sheets for electric generator;
or
Photographs of installed external and internal
equipment related to the system.

ENERGY EFFICIENCY MEASURES
© International Finance Corporation 2019. All rights reserved. EDGE User Guide 147
E28 – HIGH EFFICIENCY BOILER FOR WATER HEATING
Corresponds to HME13, HTE19, RTE22, HSE25, EDE22
Requirement Summary
This measure can be claimed if the boiler used for delivering hot water heating has annual fuel utilization
efficiency greater than the base case, as set out in the Key Assumptions for the Base Case in the Design
section. Actual efficiency must be input for the selected equipment if this measure is selected. This measure
does not apply to electric water heating. The base case default selection for the ‘Fuel used for hot water
generation’ is ‘Electricity;’ if this measure is selected, the fuel selection must be changed to ‘Natural Gas’ for gas
boilers, or LPG or Diesel as appropriate.
Intention
The specification of a highly efficient boiler for water heating reduces the energy required to satisfy the hot
water demand for the building.
Approach/Methodologies
In order to qualify, the high efficiency boiler must be able to demonstrate efficiency greater than the base case
of 80%. There are several different methodologies for calculating the efficiency of a boiler. Manufacturers might
quote the gross efficiency, net efficiency, seasonal efficiency, or the annual fuel utilization efficiency (AFUE),
each of which uses a different methodology to calculate the percentage.
EDGE uses AFUE as the measure of efficiency as it provides the most consistent methodology. AFUE is
calculated by comparing the thermal energy output to the calorific value of the fuel used. AFUE data is available
from the Energy Star website at http://www.energystar.gov/productfinder/product/certified-boilers/results.
Modular systems usually use multiple boilers of the same size and type. However, where boilers with different
efficiency ratings are specified the weighted average efficiency should be calculated. The weighted efficiency
takes into account the size of the boilers and the expected run time.
For tankless water heaters, if the AFUE rating is not available, Thermal Efficiency (TE) can be used instead.
AFUE accounts for factors such as stand-by losses and performance at part-loads in addition to thermal
efficiency but tankless water heaters do not have appreciable standby losses, so their Thermal efficiency is
much closer to AFUE compared to Boilers.
Potential Technologies/Strategies
Even the most efficient boilers have a maximum efficiency around 98%, because some energy (heat) is lost via
the flue gases and through the main body of the boiler itself; also, lack of maintenance can reduce a boiler’s
efficiency.
The following table shows a set of solutions related to hot water boilers.

ENERGY EFFICIENCY MEASURES
© International Finance Corporation 2019. All rights reserved. EDGE User Guide 148
Table 41: Types of High Efficiency Hot Water Boilers34
Type Description
Condensing boilers The only boilers likely to achieve efficiency level of at least 90%. They extract latent heat from
the waste gases’ water vapor that is generated by the combustion process. To minimize the
cost of a boiler installation, hot water demand should be minimized before sizing the system.
Combi Boiler This is a type of condensing boiler that provides both heating and hot water without needing a
separate tank.
Low temperature hot water
(LTHW) boilers
Produce hot water at around 90ºC, which is then distributed via pipework to a hot water
storage tank. These boilers commonly run on Natural Gas, but may also be LPG.
High-efficiency boilers These generally have lower water content, larger heat exchanger surface areas and greater
insulation of the boiler shell. They are suitable to applications where a higher water
temperature is required, such as kitchens, laundry and showers.
“Staged” multiple-boiler
system
Reduces the amount of time in which a boiler is running at less than peak load, since only few
boilers run depending on the demand. So, in the peak times more boilers are in use while
during the off-peak times only the boilers to cover a small demand will be active.
Modular boiler systems Series of boilers linked together to meet different demands; they are suitable for buildings or
processes with a significant variable hot water/heating demand. Modular systems are
generally composed of several identical boiler units although a mix of condensing and
conventional boilers could be used.
Relationship to Other Measures
The hot water demand that the boiler is sized to supply is affected by the rate of hot water use. Hot water use
should be minimized first by selecting low-flow taps in washbasins and low-flow showerheads.
If this measure is selected the main fuel for hot water must be selected as ‘Natural Gas’ in the key assumptions
for base case on the Design page. This measure reduces both ‘Water Heating’ and ‘Other’ due to the reduction
of pumping requirements for water.
Assumptions
The base case efficiency of the hot water boiler is assumed to be 80%. The default value for the efficiency of
the improved case is 90%, which can be overwritten.
34 The Carbon Trust. Low temperature hot water boilers. UK: March 2012. https://www.carbontrust.com/media/7411/ctv051_low_temperature_hot_water_boilers.pdf

ENERGY EFFICIENCY MEASURES
© International Finance Corporation 2019. All rights reserved. EDGE User Guide 149
Compliance Guidance
To demonstrate compliance, the design team must provide the following documentation to support their claims.
Design Stage Post-Construction Stage
At the design stage, the following must be used to
demonstrate compliance:
Manufacturer’s data sheet for the boiler/s
specified; and
System schematics showing the brand and model
of boiler/s; and
The calculation of average weighted efficiency if
multiple boilers with different efficiencies are
specified.
At the post-construction stage, the following must be
used to demonstrate compliance:
Updated system schematics; and
Photographs of the installed boilers; and
Manufacturer’s data sheet for the boiler/s
purchased; or
Purchase receipts and delivery notes for the
boilers.

ENERGY EFFICIENCY MEASURES
© International Finance Corporation 2019. All rights reserved. EDGE User Guide 150
E29 – ELECTRIC HEAT PUMP FOR HOT WATER
Corresponds to HME14, HTE24
Requirement Summary
This measure can be claimed if electric heat pumps are used for delivering hot water and have an efficiency
greater than the base case, as set out in the Key Assumptions for the Base Case in the Design section. Note
that the baseline assumes a standard instantaneous water heater which has a near 100% efficiency. So, an
instantaneous electric water heater will not generate savings.
Intention
Providing hot water with high efficiency will reduce fuel consumption and related carbon emissions from water
heating.
Approach/Methodologies
Heat pump water heaters (HPWH) use electricity to take the heat from surrounding air and transfer it to the
water in an enclosed tank. This process is similar to the heat transfer process in a refrigerator but in reverse.
Heat pump water heaters can be used with dual functionality in hotels for example to cool the kitchen, laundry,
or ironing area and to generate hot water. Because they move heat rather than generate heat, heat pumps can
provide efficiencies greater than 100%.
The efficiency of a heat pump is indicated by the Coefficient of Performance (COP). It is determined by dividing
the energy output of the heat pump by the electrical energy needed to run the heat pump, at a specific
temperature. The higher the COP, the more efficient the heat pump. Typical heat pump water heaters are two
to three times more efficient than standard electric water heaters.

ENERGY EFFICIENCY MEASURES
© International Finance Corporation 2019. All rights reserved. EDGE User Guide 151
Potential Technologies/Strategies
Type Process
Heat Pump Water Heaters
A low-pressure liquid refrigerant is vaporized in the heat pump's evaporator
and passed into the compressor. As the pressure of the refrigerant increases,
so does its temperature. The heated refrigerant runs through a condenser coil
within the storage tank, transferring heat to the water stored there. As the
refrigerant delivers its heat to the water, it cools and condenses, and then
passes through an expansion valve where the pressure is reduced and the
cycle starts over.
Air-source Heat Pumps
These systems are called "integrated" units because they integrate the heating
of domestic water with a house space-conditioning system. They recover heat
from the air by cooling and transferring heat to domestic hot water. Water
heating can be provided with high efficiency with this method. Water heating
energy can be reduced by 25% to 50%.
Ground-Source Heat Pumps
In some Ground-Source Heat Pumps, a heat exchanger, sometimes called a
"desuperheater," removes heat from the hot refrigerant after it leaves the
compressor. Water from the home’s water heater is pumped through a coil
ahead of the condenser coil, in order that some of the heat that would have
been dissipated at the condenser can be used to heat water. Excess heat is
always available in the summer cooling mode, and is also available in the
heating mode during mild weather when the heat pump is above the balance
point and not working to full capacity. Other ground-source heat pumps
provide domestic hot water (DHW) on demand: the whole machine switches to
providing DHW when it is required.
Water heating is easier with ground-source heat pumps because the
compressor is located indoors. They generally have many more hours of
surplus heating capacity than required for space heating, because they have
constant heating capacity.
Similar to air-source heat pumps, ground-source heat pumps can reduce
water heating consumption by 25% to 50%, as some have a desuperheater
that uses a portion of the heat collected to preheat hot water, and also can
automatically switch over to heat hot water on demand.

ENERGY EFFICIENCY MEASURES
© International Finance Corporation 2019. All rights reserved. EDGE User Guide 152
Relationship to Other Measures
This measure directly reduces the energy consumption for hot water. Depending on the amount of hot water
usage in the building, the impact of this measure on energy use may vary.
Assumptions
The base case COP assumed for the heat pumps is 1.0 and the default improved case is 1.5 for Homes and 3.0
for Hospitality.
Compliance Guidance
To demonstrate compliance, the design team must provide the following documentation to support their claims.
Design Stage Post-Construction Stage
At the design stage, the following must be used to
demonstrate compliance:
Manufacturer’s data sheets for the heat pumps
system specified, including the water heater’s COP
information; and
For systems including more than one heat pump
water heater unit, the design team must provide the
average COP calculation; and
Mechanical and electrical layout drawings showing the
heat pump system and the location of the water
heaters.
At the post-construction stage, the following must be
used to demonstrate compliance:
As-built mechanical and electrical drawings with heat
pump system schematics; and
Manufacturer’s data sheets for the heat pumps
system installed, including the water heater’s COP
information; and
Photographs of the installed water heaters; or
Purchase receipts and delivery notes showing the heat
pump’s water heaters have been delivered to the site.
ENERGY EFFICIENCY MEASURES
© International Finance Corporation 2019. All rights reserved. EDGE User Guide 153
E30 – PREHEAT WATER USING WASTE HEAT FROM THE GENERATOR
Corresponds to HTE21, HSE26
Requirement Summary
This measure can be claimed if waste heat is recovered from a power generator running on diesel or gas fuel, to
preheat water flowing into the main hot water system of the hospital. If this measure is selected, the
assumptions in the Key Assumptions on the Design tab must be verified. The user must select the appropriate
fuel under ‘Fuel Used for Electric Generator,’ either Diesel of Natural Gas, and input the appropriate value for ‘%
of Electricity Generation Using [Fuel].’
Intention
Recovering waste heat from power generators to preheat the water supplied to the hot water system helps
buildings to significantly reduce fossil fuel consumption, lower operating costs and pollutant emissions. Hospitals
that use energy for hot water and that use a power generator as a significant source of electricity can reap
benefits from the use of heat recovery systems such as lower maintenance, quieter operation and higher
availability of hot water, as well as reducing the energy costs and the carbon emissions from lower fuel
consumption.
Approach/Methodologies
Waste heat is recovered from the power generator. The percentage of electricity provided by the generator
should be marked in the Design section under Advanced Settings.
Potential Technologies/Strategies
In the context of buildings, heat recovery aims to collect and reuse the process heat waste that would otherwise
be lost. Sometimes, the loss of this heat is intentional, such as in air conditioning, where the purpose is to
remove heat from a space. But heat is also lost in the exhaust fumes emitted by an electric generator. Using a
recovery technology, this waste heat can be turned into a useful source for hot water generation by preheating
the water feeding the boiler.
Relationship to Other Measures
The use of waste heat from the generator to preheat the hot water supply reduces the load on the hot water
system and shows a decrease in energy use for ‘Water Heating.’
Assumptions
The default fuel for the Electric generator is Diesel, as listed in the Key Assumptions for the Base Case in the
Design section. The fuel can be changed to Natural Gas if that is the fuel powering the generator. If this key
assumption is changed from the default value, justification and documentation of fuel availability must be

ENERGY EFFICIENCY MEASURES
© International Finance Corporation 2019. All rights reserved. EDGE User Guide 154
provided. Regardless of the fuel source, if the improved case uses this energy measure, it is assumed that a
portion of the hot water demand is covered by the recovery of the waste heat from the generator.
Compliance Guidance
To demonstrate compliance, the design team must provide the following documentation to support their claims.
Design Stage Post-Construction Stage
At the design stage, the following must be used to
demonstrate compliance:
Manufacturer’s data sheets for generator specifying
hours of operation and coverage of the demand; and
Manufacturer’s data sheets for the recovery
technology used; and
Mechanical and electrical layout drawings showing
the location of the generator, the recovery
technology and the output for the water heating
system; and
Calculation to demonstrate that waste heat
covers % of the demand for hot water as calculated
by EDGE software.
At the post-construction stage, the following must be
used to demonstrate compliance:
As-built mechanical and electrical drawings with
the location of the generator, the recovery
technology and the output for hot water; and
Delivery notes and purchase receipts showing
that specified generator and the recovery
technology have been delivered to the site; and
Manufacturer’s data sheets for generator
specifying hours of operation and coverage of the
demand; or
Photographs of installed external and internal
equipment related to the system.
ENERGY EFFICIENCY MEASURES
© International Finance Corporation 2019. All rights reserved. EDGE User Guide 155
E31 – HEAT RECOVERY FROM GREY WATER
Corresponds to HTE22, HSE27
Requirement Summary
This measure can be claimed if a heat recovery device is installed to capture and reuse the heat from the hot
water drain pipes with at least 30% efficiency. This does not include heat recovery from laundry waste water,
which is a separate measure.
Intention
Recovering heat from the grey water (drain water from showers, kitchens, spa area, etc.) helps to reduce fossil
fuel consumption of buildings, lower operating costs, and pollutant emissions by preheating the water for
bathrooms, laundry and kitchens as part of the hot water system. Buildings that use energy for hot water have
the potential to benefit from the application of heat recovery systems.
Approach/Methodologies
Buildings can benefit from technology to recover heat from grey water, as it can save energy and help decrease
the design capacity of water heaters. In order to qualify, the design team must demonstrate that the Hot water
system has a ‘heat recovery’ device. EDGE uses an efficiency of 30% for the improved case. The efficiency must
be verified using manufacturer specifications.
Potential Technologies/Strategies
In the context of buildings, heat recovery aims to collect and reuse the heat arising from processes that would
otherwise be lost. In this measure, heat energy is transferred from the hot waste water from showers, bath
tubs, sinks, and dishwashers, etc. to the incoming cold-water pipes directly to water fixtures or to preheat the
water being supplied to the hot water heater. Various commercial solutions are available for grey water heat
recovery, ranging from non-storage systems (shower-only recovery) to centralized heat recovery, which
connects more equipment and augments the possibilities for use of the recovered energy. The following table
shows some of the solutions:

ENERGY EFFICIENCY MEASURES
© International Finance Corporation 2019. All rights reserved. EDGE User Guide 156
Table 42: Grey Water Heat Recovery Solutions
Types Description
Spiral design (non-storage)
Hot water runs through a series of narrow spirals in
which it is forced to spin alongside the walls of the
heat recovery pipe. The cold water then comes as a
counter flow in a spiral pipe swirled around the
outside. This design requires small gaps (2cm) to
avoid plugging.
It is commonly used in residential and small hotels or
hospitals.
Instead of a spiral system, tubular or rectangular heat
exchanger systems can also be used.
Accumulation tank (centralized)
Grey water from different sources is accumulated in a
tank, which has an electrical coil (close loop) that
transfers the heat to the cold water passing through
the grey-water heat recovery unit outside the tank.
Parallel heat exchanger (centralized)
This is ideal for larger buildings such as hospitals, as
it collects the grey water in one pipe that passes
through the heat exchanger. It is similar to spiral
design but used centrally rather than in each unit.
Relationship to Other Measures
The hot water demand that the boiler is sized to supply is affected by the rate of hot water use. Hot water use
should be minimized first by selecting low-flow taps in washbasins and low-flow showerheads.
This measure reduces both ‘Water Heating’ and ‘Other’ due to pumping water in the system.
Assumptions
The base case assumes no heat recovery from grey water, while the improved case assumes that all the hot
water discharge except laundry passes through a heat recovery system with 30% efficiency.

ENERGY EFFICIENCY MEASURES
© International Finance Corporation 2019. All rights reserved. EDGE User Guide 157
Compliance Guidance
To demonstrate compliance, the design team must provide documentation to support the claims.
Design Stage Post-Construction Stage
At the design stage, the following must be used to
demonstrate compliance:
Manufacturer’s data sheets for grey water heat
recovery device specifying recovery technology
used and its efficiency (%); and
Hydraulic layout drawings showing the location
of the recovery technology.
At the post-construction stage, the following must be
used to demonstrate compliance:
As-built hydraulic drawings with the location of
recovery technology if changed from design; and
Delivery notes and purchase receipts showing that
specified recovery technology have been delivered
to the site; and
Manufacturer’s data sheets for grey water heat
recovery device specifying recovery technology
used and its efficiency (%); or
Photographs of installed equipment related to the
system.

ENERGY EFFICIENCY MEASURES
© International Finance Corporation 2019. All rights reserved. EDGE User Guide 158
E32 – HEAT RECOVERY FROM LAUNDRY WASTE WATER
Corresponds to HTE23, HSE28
Requirement Summary
This measure can be claimed if a heat recovery device with at least 30% efficiency is installed in the hot water
system to reuse the heat from the grey water of the laundry.
Intention
Recovering heat from the grey water of the laundry helps to reduce fossil fuel consumption of buildings, lower
operating costs, and pollutant emissions by preheating the water that will be used in bathrooms, laundry and
kitchens as part of the hot water system. Buildings that use energy for hot water have the potential to benefit
from the application of heat recovery systems.
Approach/Methodologies
Buildings can benefit by recovering heat from the grey water of the laundry, as it can save energy and increase
the capacity of water heaters.
In order to qualify, the design team must demonstrate that the hot water system has a ‘heat recovery’ device
installed on the grey water coming from the laundry, whose efficiency must be greater than the base case (no
heat recovery is included in the base case). EDGE uses Efficiency (%), which must be verified with
manufacturer specifications.
Potential Technologies/Strategies
In the context of buildings, heat recovery aims to collect and reuse the heat arising from process that would
otherwise be lost. In this measure, it involves transfer of energy between hot grey water coming from the
laundry area (washing machines) and the incoming cold potable water. Heat from the water already used in the
laundry is used to preheat the cold water entering the boiler, reducing the energy used to heat the water.
Various commercial solutions are available for grey water heat recovery that ranges from non-storage systems
to centralized heat recovery, which connects more equipment and augments the possibilities for use of the
recovered energy. The following table shows some of the solutions:

ENERGY EFFICIENCY MEASURES
© International Finance Corporation 2019. All rights reserved. EDGE User Guide 159
Table 43: Grey Water Heat Recovery Solutions
Types Description
Spiral design (non-storage)
Hot water runs through a series of narrow spirals in
which it is forced to spin alongside the walls of the
heat recovery pipe. The cold water then comes as a
counter flow in a spiral pipe swirled around the
outside. This design requires small gaps (2cm) to
avoid plugging.
It is commonly used in residential and small hotels or
hospitals.
Instead of a spiral system, tubular or rectangular heat
exchanger systems can also be used.
Accumulation tank (centralized)
Grey water from the laundry is accumulated in a tank,
which has an electrical coil (closed loop) that transfers
the heat to the cold water passing through the grey-
water heat recovery unit outside the tank.
Parallel heat exchanger (centralized)
This is ideal for larger buildings, as it collects the grey
water in one pipe that passes through the heat
exchanger. It is similar to spiral design but used
centrally rather than in each unit.
Relationship to Other Measures
This measure can be used to reduce the size of the boiler. The size of the boiler is also affected by the rate of
hot water use. Hot water use should be minimized first by selecting low-flow taps in washbasins and low-flow
showerheads to reduce the boiler size.
Recovering heat from hot water waste reduces both ‘Water Heating’ and ‘Other’ due to pumping water in the
system.
Assumptions
The base case assumes no heat recovery from grey water, while the improved case assumes that the hot water
discharged from the laundry area passes through a heat recovery system with 30% efficiency.

ENERGY EFFICIENCY MEASURES
© International Finance Corporation 2019. All rights reserved. EDGE User Guide 160
Compliance Guidance
To demonstrate compliance, the design team must provide documentation to support the claims.
Design Stage Post-Construction Stage
At the design stage, the following must be used to
demonstrate compliance:
Manufacturer’s data sheets for grey water heat
recovery device specifying recovery technology
used and its efficiency (%); and
Hydraulic layout drawings showing the location
of the recovery technology installed in the
laundry area.
At the post-construction stage, the following must be
used to demonstrate compliance:
As-built hydraulic drawings with the location of
recovery technology installed in the laundry area if
changed from design stage; and
Delivery notes showing that specified recovery
technology have been delivered to the site; and
Manufacturer’s data sheets for grey water heat
recovery device specifying recovery technology
used and its efficiency (%); or
Photographs of installed internal equipment related
to the system.

ENERGY EFFICIENCY MEASURES
© International Finance Corporation 2019. All rights reserved. EDGE User Guide 161
E33 – ENERGY SAVING LIGHT BULBS
Corresponds to HME16, HME17, HTE25, HTE26, HTE 27, RTE23, RTE24, RTE25,
OFE24, OFE25, HSE29, HSE30, HSE31, EDE23, EDE24
Requirement Summary
This measure can be claimed if the light bulbs used in the project are either compact fluorescent (CFL), LED, or
T5, or other types of light fixtures that achieve 90 lm/W or greater. At least 90% of the lamps must be of the
efficient type.
The required spaces with efficient bulbs vary by building type. Table 44 shows the indoor spaces that are
required to have at least 90% of the lamps to be of the efficient type, by building typology. Where there is more
than one row for a building type, each row represents a separate measure that can be claimed individually. This
measure cannot be claimed for spaces that are not fitted with efficient lighting fixtures. For example, if an office
building for lease is not fitted with lighting fixtures for tenants and there is no provision for efficient lighting in a
binding lease agreement or similar provision, then this measure cannot be claimed for those spaces.
Table 44: Indoor spaces required to have efficient lighting, by Building Type
Building Type Internal spaces that must have efficient lighting
Homes All habitable spaces (including living rooms, dining rooms, kitchens, bathrooms, and
corridors)
Shared corridors, Common areas, Staircases
Hospitality All guest spaces (including guest rooms, bathrooms, conference/banquet rooms,
corridors, etc.)
Back-of-the-house (including kitchens, laundry, health spa, storage area, etc.)
Retail Sales area
Corridors and common areas
Offices All internal spaces (including offices, circulation area, lobby, storage, restrooms, etc.)
Hospitals All, except Operation theaters
Basement, car parking, and kitchen
Education All internal spaces

ENERGY EFFICIENCY MEASURES
© International Finance Corporation 2019. All rights reserved. EDGE User Guide 162
Table 45 shows the outdoor spaces that are required to have at least 90% of the lamps to be of the efficient
type.
Table 45: Outdoor spaces required to have efficient lighting, by Building Type
Building Type External spaces that must have efficient lighting
Homes Outdoor areas
Hospitality Common outdoor spaces, such as outdoor garden
Retail Common outdoor spaces, such as outdoor garden
Offices Common outdoor spaces, such as outdoor garden,
Hospitals Common outdoor spaces, such as outdoor garden
Education Outdoor spaces of the project, such as a sports field
Intention
Efficient lamps, that produce more light with less power compared to standard incandescent bulbs, reduce the
building’s energy use for lighting. Due to the reduction in waste heat from efficient lamps, heat gains to the
space are lowered, which in turn reduces cooling requirements. Maintenance costs are also reduced as the
service life of these types of bulbs is longer than that of incandescent bulbs.
Approach/Methodologies
EDGE requires no specific efficacy for CFL, LED or T5 lamps, so the design team only needs to demonstrate that
CFL, LED, or T5 lamps have been specified. Both fluorescent (e.g. CFL and T5) and LED bulbs are available with
various performance specifications. Other efficient technologies are also available. If another technology is used,
documentation must be provided to demonstrate that the light fixtures achieve at least 90 lm/W.
Here, lumens per watt (lm/W) is the measure of lighting efficacy used in the industry, which is the ratio of
visible light output measured in lumens to the total power draw from the main electrical supply. e.g. a 40W light
bulb has a total power input of 40W and a typical one may produce about 450 lumens35. Therefore, the efficacy
of this 40 W lamp would be 450/40 or 11.25 lm/W.
Besides efficacy (lumens/watt), the key indicators are the color rendering index (CRI), color temperature (in
Kelvin), and service life. CRI is a good indication of the quality of the light produced. The higher the CRI, the
35 http://clark.com/technology/lightbulbs-watt-to-lumen-conversion-chart/

ENERGY EFFICIENCY MEASURES
© International Finance Corporation 2019. All rights reserved. EDGE User Guide 163
better the colors will be rendered. As color temperature is more subjective, the appropriate level will depend on
the application.
EDGE does not account for lighting quality, illumination (lux or lumen) levels, or lighting layout. These should be
handled by the lighting designer using local or international lighting design code requirements. Light bulbs
covered by the EDGE lighting measure exclude safety and security lighting.
Potential Technologies/Strategies
The following table explains the different technologies for the recommended energy saving light bulbs:
Table 46: Description of technologies (lamp types)
Lamp Type Description
Compact fluorescent
lamps (CFLs)
CFLs are available for most light fittings as a direct replacement for incandescent bulbs. CFLs use a
fluorescent tube that has been folded into the shape of the incandescent bulb they have been
designed to replace. In comparison to incandescent bulbs, CFLs can last as much as 15 times longer.
It should be noted that the service life can be reduced by frequent switching, so CFLs are not always
appropriate where lights will be turned on and off frequently. CFLs use only a fraction of the energy of
their incandescent alternatives and therefore produce less heat.
As with normal fluorescent lamps, CFLs require ballasts in order to operate. Older lamps use magnetic
ballasts, but these have largely been replaced with electronic ballasts that operate at a high
frequency. Although the efficacy is not affected, electronic ballasts have reduced warm-up times and
flickering, which were issues with the earlier CFLs.
Light emitting diode
(LED)
LED technology has evolved quickly and there are LED lamps available for most light fittings, and in
different color temperatures ranging from warm white to daylight. The efficacy levels of LEDs are
much higher than CFLs. The service life of LED lamps can be as much as two to three times the
longest life of any available compact fluorescent lamp, and is not affected by frequent on/off cycles.
Over the last few years, the performance of LED lamps has improved greatly while prices have
dropped sharply, and they are now highly cost-effective.
T5 Lamps The name of these fluorescent tubes refers to their shape (tubular) and diameter (5 units measured
in 1/8s of an inch). T5s have a miniature G5 bi-pin base with 5mm spacing, while T8s and T12s have a G13 bi-pin base with 13mm spacing. Although T8/T12 to T5 conversion kits are available, dedicated
T5 luminaires should be specified in new construction projects, as using ballasts designed for T8s and
T12s could reduce the service life of T5s.

ENERGY EFFICIENCY MEASURES
© International Finance Corporation 2019. All rights reserved. EDGE User Guide 164
Although the efficacy of bulbs from different manufacturers will differ, Table 47 gives an approximate range of
efficacies that can be expected for different bulb technologies.
Table 47: Typical range of efficacies for different lamp types36
Lamp Type Typical Range of Efficacy (Lumens/Watt)
Rated lifetime (hours)
Incandescent – Tungsten Filament
10-19 750-2,500
Halogen lamp 14-20 2,000-3,500
Tubular Fluorescent 25-92 6,000-20,000
Compact Fluorescent 40-70 10,000
High Pressure Sodium 50-124 29,000
Metal Halide 50-115 3,000-20,000
Light Emitting Diode (LED) 50-100 15,000-50,000
Relationship to Other Measures
Using more efficient bulbs reduces the heat gain from lighting, thereby reducing cooling loads. Heating loads
may increase in a heating dominated climate. A related measure is daylighting; better daylight design can
reduce the need for artificial lighting during the daylit hours.
Assumptions
The default assumption for the base case is that the lighting is a mixture of standard incandescent lamps and
efficient lamps. The improved lighting density assumes that at least 90% lamps in the improved case are not
incandescent, but of a more efficient type. The assumed lighting load (in Watts/m²) for each area in both cases
(baseline and improved) is available in Appendix 2.
36 Source: https://www.eia.gov/consumption/commercial/reports/2012/lighting/ Data from the 2011 Buildings Energy Data
Book, Table 5.6.9, Office of Energy Efficiency and Renewable Energy, U.S. Department of Energy
ENERGY EFFICIENCY MEASURES
© International Finance Corporation 2019. All rights reserved. EDGE User Guide 165
Compliance Guidance
To demonstrate compliance, the design team must provide the following documentation to support their claims.
Design Stage Post-Construction Stage
At the design stage, the following must be
used to demonstrate compliance:
Lighting schedule listing type and
number of bulbs specified;
Electrical layout drawings showing the
location and type of all installed bulbs;
Manufacturer’s data sheets or
calculations showing that fixtures that
are not CFL, LED or T5 meet the 90
lm/W threshold.
At the post-construction stage, the following must be used to
demonstrate compliance:
As-built electrical drawings with the lighting layout if
changed from design;
Manufacturer’s data sheets and calculations showing that
fixtures that are not CFL, LED or T5 meet the 90 lm/W
threshold.
Photographs of the lighting installation. It is not necessary
to take photos of every single installed lamp, but the
auditor must be convinced that a reasonable proportion has
been checked and verified; or
Purchase receipts and delivery notes for lamps

ENERGY EFFICIENCY MEASURES
© International Finance Corporation 2019. All rights reserved. EDGE User Guide 166
E34 – LIGHTING CONTROLS
Corresponds to HME18, HTE28, HTE29, RTE26, OFE26, OFE27, OFE28, OFE29,
HSE32, HSE33, HSE34, EDE25, EDE26, EDE27, EDE28
Requirement Summary
This measure can be claimed if lighting in all the required rooms are controlled using technologies such as
occupancy sensors, timer controls, or light sensors. Table 48 shows the spaces and the controls required to
claim this measure, depending on the building type. Each row represents a measure that can be claimed
separately in the EDGE App.
Table 48: Lighting Control Requirements by Building Type
Building Type Spaces required to have lighting controls
Control type required
Homes Shared corridors, Common areas, Staircases, and Outdoor areas
Photoelectric switching or dimming, occupancy sensors, or timer controls
Hospitality Corridors, common areas, staircases, and outdoor areas
Photoelectric switching or dimming, occupancy sensors, or timer controls
Bathrooms Occupancy sensors
Retail Bathrooms Occupancy sensors
Offices Corridors, Staircases Daylighting controls
Bathrooms, Conference Rooms, and Closed Cabins
Occupancy Sensors
Open Offices Occupancy Sensors
All internal spaces with access to natural light
Daylight Photoelectric Sensors
Hospitals Corridors Daylighting controls
Bathrooms Occupancy Sensors
All internal spaces with access to natural light
Daylight Photoelectric Sensors
Education Bathrooms Occupancy Sensors
Classrooms Occupancy Sensors

ENERGY EFFICIENCY MEASURES
© International Finance Corporation 2019. All rights reserved. EDGE User Guide 167
Corridors Occupancy Sensors
All internal spaces with access to natural light
Daylight Photoelectric Sensors
Intention
By installing lighting controls in rooms, lighting usage is reduced use. Lighting use may be reduced by using
occupancy sensors to reduce the possibility for lights to be left on when the room is unoccupied, or by using
photoelectric sensors when sufficient natural light is available. Reduced lighting use leads to a reduction in
energy consumption.
Approach/Methodologies
No calculations are involved in the assessment of this measure. To claim that it has been achieved, the lighting
in all the required rooms must be connected to lighting controls. In the case of lighting controls for daylighting,
all ambient lighting in “daylight zones” which have access to exterior windows, or skylights, must be connected
to an automatic daylight control system using photosensors. Daylight zones next to windows are defined as the
perimeter space near a window with a depth = 1.5 x head height of the window from the floor.
Figure 15. Daylight zone configuration
Potential Technologies/Strategies
Controlling artificial lighting in occupied areas reduces energy consumption. Occupancy sensor controls are
effective in saving lighting energy in spaces that have varying occupancy over the working hours. If many of the
spaces in a building are expected to be unoccupied during some hours of the day, such as a conference room or
a classroom, this measure may be considered.
Selection of the type of sensor and its location is critical for this measure. The sensor should be situated such
that it can “see” all the occupants in the room. If the room is small enough, this could be done by placing the
sensor in one corner of the room near the ceiling. For larger rooms, multiple sensors may be used.

ENERGY EFFICIENCY MEASURES
© International Finance Corporation 2019. All rights reserved. EDGE User Guide 168
Table 49 lists various types of controls with their pros and cons. Typically, occupancy sensors are used to
control ambient lighting only. However, task lights, such as table lamps and under-cabinet lights may also be
controlled by automatic sensors. Individual power strips equipped with in-built occupancy sensors may be used
for this purpose.
Table 49: Types of controls for lighting and other equipment
Type Description
Timer Controls The two types of timer controls are: time delay switches and actual timer controls.
Time delay switches are manually switched on and then automatically switch off after a set time, which can
be adjusted. Time delay or time lag switches can either be mechanical (pneumatic time delay) where the
lighting requirement is less than 30 minutes, or they can be electronic, which can be programmed to provide
a longer delay. A time delay switch is most appropriate in spaces where lighting is only used for short
periods of time, such as bathrooms in common areas or rarely-used corridors.
Timer controls use a built-in clock function to switch on and off at preset times. They can either be used to
switch lights off when the lighting is unlikely to be required (such as security lighting during daylight hours),
or to switch lights on at a set time (such as decorative lighting). Timer controls should always be fitted with
a manual override so that out-of-hours use is still possible if required.
Occupancy or
Presence
Detectors
Occupancy or presence detectors can be used to switch lights on when movement or presence is detected
and switch them off again when no movement or presence is detected. These may be used in areas of
infrequent use by staff and public. Some technologies are as follows:
• High frequency ultrasonic sensors, detect occupancy by emitting a high-frequency signal, which
they receive back as a reflected signal using the Doppler effect, and interpret change in frequency as motion
in the space37. They can work around obstructions. These are first generation occupancy sensors and not
very reliable as they get triggered by any movement including undesirable triggers.
• Passive Infrared Sensors (PIR), detect human body temperature by sending out infrared beams to
detect temperature differences. These are an advancement on ultrasonic sensors. However, PIRs do not
always work well in very hot climates, as the background temperature is similar to human body
temperature. They also require a direct line of sight38.
• Microphonics sensors, utilize a microphone inside of the sensor to hear sounds that indicate
occupancy. They can learn to ignore background noise such as air conditioners and do not rely on line of
sight. So they are especially useful in rooms with obstructions such as bathrooms with stalls.
• Dual technology sensors, use a combination of technologies described above to reduce the
chances of false-on and false-off. As each type of presence-detecting technology has different limitations,
many controls use a combination of the three technologies.
Daylight
Sensors
Daylight sensors can be used to switch lights on or off, alone or in conjunction with dimmers. Daylight
sensors sense the availability of daylight and can switch lights off or trigger lighting dimmers to produce
reduced lighting levels to maintain a comfortable level of light.
37 Source: http://www.ecmweb.com/lighting-amp-control/occupancy-sensors-101
38 Source: Occupancy Sensor Technologies by Acuity Brands (2016)

ENERGY EFFICIENCY MEASURES
© International Finance Corporation 2019. All rights reserved. EDGE User Guide 169
Natural light is amply available during daytime hours in most climates. Typically, just 1%-5% of the diffused
exterior lighting available outside the building is sufficient to light up the interiors to the desired light levels. An
intelligent daylight design has the following features:
▪ Optimum glass area: Windows need to be appropriately sized to allow sufficient diffused light into
the space, without causing too much heat transfer. Especially in warm climates, a large amount of
window area (above 40% window to wall ratio) may result in excessive cooling load, which may
outweigh any benefits gained through daylighting control. Location and orientation of glass is also
critical. South and North facing glass are more appropriate as they can be shaded easily and do
not cause as much glare. Also, windows that are higher on the wall are more efficient in allowing
diffused light deeper into the space.
▪ Suitable sun shading: Diffused sunlight is more desirable for daylighting. Direct sunlight should be
avoided into regularly occupied spaces, as it causes glare and overheating. Windows on the south
and north façades should be shaded with horizontal overhangs, whose depth is dictated by the
latitude of the building location. In tropical countries, the required depth of horizontal shading is
quite small. East and west windows should be avoided as much as possible. If provided, they
should be equipped with vertical shading or full glass shading.
▪ Appropriate glass product: In climates where solar heat is undesirable, glass with low Solar Heat
Gain Coefficient (SHGC) should be used. SHGC is the proportion of solar heat that the glass allows
to pass through to the interior space. At the same time, care should be taken that the Visible Light
Transmittance (VLT) of the product is not too low, as it will reduce the amount of usable light
entering the space.
▪ Automated daylight control system: Energy is saved through daylighting only if the electric lights
are switched off. It is desirable that the switching be done through automated controls to avoid
missed opportunities. The two commonly used daylighting control types are Stepped and
Continuous Dimming. A Stepped system turns off some lamps in the space when enough natural
light is available by the photo sensor. A Continuous Dimming system dims down all lights to
maintain the desirable light levels. Stepped controls are less expensive, while the Continuous
Dimming system offers more savings. For both systems, the photo sensor should be appropriately
located and calibrated to be effective.
Relationship to Other Measures
Lighting controls can reduce the amount of energy used by lighting in rooms, therefore the more efficient the
light bulbs are, the less impact the automated controls will have. However, when using controls with energy
efficient lighting, one should make sure to choose the correct light bulbs, which are not impacted by the
increased switching or dimming.
As lighting controls help to reduce unnecessary use of lighting which produces heat, cooling loads are reduced.
Both “Lighting” and “Cooling Energy” are reduced in the energy graph, while “Heating Energy” is increased.
The amount of savings achieved with a daylighting measure will be affected by the Window to Wall Ratio
entered in the WWR measure.

ENERGY EFFICIENCY MEASURES
© International Finance Corporation 2019. All rights reserved. EDGE User Guide 170
Assumptions
The base case assumption is that manual controls will be used for the control of all lighting. The improved case
assumes that these spaces will have technology to reduce lighting usage by a certain amount. The assumed
percentage reduction in lighting for each area for various building types is available in Appendix 2.
In the case of daylighting, the improved case assumes that all occupied perimeter spaces with windows will
have automated daylight controls that will switch off electric lights during some part of the day. The amount of
savings will depend on the geographical location and building geometry defined in the “Building Orientation”
section of the Design tab.
Compliance Guidance
Design Stage Post-Construction Stage
At the design stage, the following must
be used to demonstrate compliance:
Electrical layout drawings showing the
sensors, highlighting the location of
the sensors; and
Specifications of the sensors from the
manufacturer.
At the post-construction stage, the following must be used to
demonstrate compliance:
Photographs of sensors and controls. It is not necessary to take
photos of every sensor, but the auditor must be convinced that a
reasonable proportion has been checked and verified; and
As-built electrical layout drawings showing the location of the
sensors if changed from design; or
Purchase receipts and delivery notes for sensors.

ENERGY EFFICIENCY MEASURES
© International Finance Corporation 2019. All rights reserved. EDGE User Guide 171
E35 – SKYLIGHT(S) TO PROVIDE DAYLIGHT TO 50% OF TOP FLOOR
AREA
Corresponds to RTE30
Requirement Summary
This measure can be claimed if the top floor of a building utilizes natural daylight from skylight(s) to light up the
top floor of the interior, reducing the use of artificial lighting during daytime hours.
Intention
The intent of this measure is to reduce the use of electricity for artificial lighting by using natural daylight. The
use of daylight for lighting interior spaces requires only a part of the roof to be transparent, and can save
significant amounts of electricity usage for lighting, especially in spaces that are used mostly in the daytime.
Approach/Methodologies
The skylight(s) must be well distributed to provide maximum daylight penetration in the building. The
skylight(s) may be horizontal or vertical (also called roof monitor).
To claim this measure, the design team must demonstrate that transparent elements in the roof allow sufficient
daylight to achieve the required lighting level in the interior of the space of the top floor area, and that the
lights in this area are equipped with dimming or shut-off controls such as daylight-responsive controls.
The “Daylight Zone” claimed under each type of skylight must comply with the guidelines accompanied by the
figures below.
1. The Daylight Zone of a skylight shall extend in both horizontal directions along the floor beyond the
edge of the skylight to the lesser of (i) 0.7 x the ceiling height, or (ii) the nearest obstruction that is
0.7 times the ceiling height or more, as indicated in Figure 16.
a. An obstruction less than 0.7 x the ceiling height (CH) may be ignored
b. An obstruction up to 0.7 x CH in height that is closer than 0.7 x (CH minus the obstruction
height (OH)) may be ignored39
2. In the case of multiple skylights, the floor areas under the skylights which are being counted as
Daylight Zone areas must not overlap.
3. The lighting in each Daylight Zone area must be controlled with either manual or daylight-responsive
controls. Controls or calibration mechanisms must be readily accessible, and may serve all light
fixtures, alternate fixtures or individual fixtures in a zone. Dimmable controls must be capable of
dimming to 15% of light output or lower and be capable of complete shut-off.
Exceptions:
39 Adapted from: (1) ASHRAE Standard 90.1-2015 and (2) International Energy Conservation Code 2015, Section C405.2
Lighting Controls

ENERGY EFFICIENCY MEASURES
© International Finance Corporation 2019. All rights reserved. EDGE User Guide 172
a. Areas with less than 6.5 Watts/m2 of general lighting may not be controlled
b. Areas designated as security or emergency areas that are required to be continuously lighted
c. Interior exit stairways, interior exit ramps and exit passageways
d. Emergency egress lighting that is normally off
e. Display/accent lighting must have dedicated controls independent of the general lighting
controls
Design Guidance
Sunlight access must not be blocked for > 1500 hours in a year between 8 a.m. and 4 p.m.
One method to verify the adequacy of the daylighting system is to calculate the product of the visible
transmittance (VT) of the skylight and the area of the skylight (rough opening), divided by the area of the
Daylight Zone. The result must be no less than 0.008.
𝑉𝑇 ×𝐴𝑟𝑒𝑎 𝑜𝑓 𝑆𝑘𝑦𝑙𝑖𝑔ℎ𝑡
𝐴𝑟𝑒𝑎 𝑜𝑓 𝐷𝑎𝑦𝑙𝑖𝑔ℎ𝑡 𝑍𝑜𝑛𝑒≥ 0.008
Figure 16. Daylight zone under roof skylights

ENERGY EFFICIENCY MEASURES
© International Finance Corporation 2019. All rights reserved. EDGE User Guide 173
Figure 17. Daylight zone under a vertical skylight (roof monitor) with a flat top
Figure 18. Daylight zone under a vertical skylight (roof monitor) with a sloping top
Potential Technologies/Strategies
Natural daylight can be introduced into the top floor using windows in the roof, that is, skylights. Glass skylights
are typically used, but daylight can also be introduced through other transparent or translucent materials such
as translucent insulation panels.
Relationship to Other Measures
The use of skylights will impact the heat gain through a roof which will impact the energy use for space
conditioning. The area of skylights and their thermal properties (the Solar Heat Gain Coefficient or SHGC and
the U-value) must be optimized to avoid excessive heat gain. Reduction in electricity usage for artificial lighting
by using skylights must be balanced with the potential increase in cooling energy use.

ENERGY EFFICIENCY MEASURES
© International Finance Corporation 2019. All rights reserved. EDGE User Guide 174
Assumptions
The base case assumes no skylights in the building. When this measure is selected, the improved case with
skylights assumes that a default area of 50% of the top floor is a Daylight Zone served by skylights, with a
default Solar Heat Gain Coefficient (SHGC) of 0.35 and a U-value of 1.7 W/m2.K. Selecting the measure also
reveals the editable fields for (1) the area of the Daylight Zone (represented as a percentage of the top floor
area) labelled as “% Day Lit Area,” (2) SHGC of the fenestration, and (3) U-value of the fenestration.
Compliance Guidance
Design Stage Post-Construction Stage
At the design stage, the following must be used to
demonstrate compliance:
Building plans and sections showing the
skylight(s) and obstructions in the daylight zones;
and
Lighting plans showing the lighting controls in the
Daylight Zones.
At the post-construction stage, the following must be
used to demonstrate compliance:
Photographs of the installed skylight(s); and
Photographs of the daylit area; and/or
As-built documentation of the lighting control
system

ENERGY EFFICIENCY MEASURES
© International Finance Corporation 2019. All rights reserved. EDGE User Guide 175
E36 – VARIABLE SPEED HOODS WITH AUTOMATED FAN CONTROLS
Corresponds to HTE20
Requirement Summary
This measure can be claimed if the exhaust fans in the kitchen hoods have Variable Speed Drives (VSD)
installed.
Intention
By specifying VSD on the fans of exhaust hoods in kitchens, energy consumption and related utility cost are
reduced. Also, the lifetime of the system components is increased and less maintenance is needed.
Approach/Methodologies
Standard exhaust hoods in commercial kitchens typically operate at a fixed speed designed for maximum (peak)
load. However, that peak ventilation is not always required. Smart controlled hoods have VSDs installed on the
fans, which are controlled by a temperature sensor, therefore reducing energy consumption between 20% and
50% (see Figure 19 below), because the VSDs control and regulate the fan speeds depending on the
temperature of the cooking surface. Lowering fan speed reduces noise levels as well as maintenance costs,
while the life of kitchen equipment could be extended.
To claim this measure, the design team must demonstrate that VSDs with temperature control are installed
within the exhaust hoods of the kitchen.
Figure 19. Savings with use of VSD on kitchen hoods40
40 Schneider Electric, Leading the Way to Energy Savings, August 2009, p. 33, Retrieved on April 11, 2018 from
http://www2.schneider-electric.com/documents/designers/SOLTED109025EN.pdf

ENERGY EFFICIENCY MEASURES
© International Finance Corporation 2019. All rights reserved. EDGE User Guide 176
Potential Technologies/Strategies
According to the US Environmental Protection Agency (EPA), kitchens in commercial premises consume 2.5
times more energy than any other commercial space, of which only 40% is used in food preparation and
storage; much of the wasted energy is dispersed into the kitchen41. Kitchens in hotels mostly have grills, ovens
and fryers, which require high levels of ventilation and therefore consume large amounts of electricity. In many
cases, this high consumption is due to the fans in the kitchen hoods running constantly at maximum speed
regardless of the requirements. Lowering the speed of fans and controlling the time of use with sensors (air
temperature) will result in energy reduction.
The fans can be electronically controlled with the Variable Speed Drivers (VSD), a piece of equipment that
regulates the speed of the fan according to air temperature, which is detected by a sensor installed inside the
exhaust hood. It can determine if the cooking surface temperature rises, therefore the fan speed increases to
compensate, but if the air is cooler, then, the fan runs more slowly. VSD offer an improved system reliability
and process control, as well as result in energy savings.
Relationship to Other Measures
Energy reduction due to kitchen equipment is expected by automated control hoods which will be reflected in
the 'Catering Energy' portion of the energy chart, and its contribution is purely related to energy.
Assumptions
The base case assumes conventional exhaust hoods in kitchens, while the improved case assumes that all the
exhaust hoods are provided with VSDs that control the fan speed according to the temperature at the cooking
surface.
41 US EPA data quoted by Carbon Trust UK, Energy Efficiency in the Kitchen, March 27, 2010, Retrieved on April 11, 2018 from
the Green Hotelier webpage http://www.greenhotelier.org/our-themes/energy-efficiency-in-the-kitchen/

ENERGY EFFICIENCY MEASURES
© International Finance Corporation 2019. All rights reserved. EDGE User Guide 177
Compliance Guidance
To demonstrate compliance, the design team must provide documentation to support the claims.
Design Stage Post-Construction Stage
At the design stage, the following must be used to
demonstrate compliance:
Electric drawings/specifications of automated control
hood including make and model of the VSD control;
and
Manufacturer’s specification of the automated control
hood; and/or
For systems including more than one exhaust hood,
the design team must ensure that all fans are
provided with VSDs.
At the post-construction stage, the following must be
used to demonstrate compliance:
As-built electrical drawings detailing the automated
control hood installed; and
Purchase receipt for the automated control hood; or
Photographs of installed VSDs in the exhaust hoods of
the kitchen.

ENERGY EFFICIENCY MEASURES
© International Finance Corporation 2019. All rights reserved. EDGE User Guide 178
E37 – ENERGY EFFICIENT REFRIGERATORS AND CLOTHES WASHING
MACHINES
Corresponds to HME15
Requirement Summary
This measure can be claimed if the refrigerators and clothes washing machines installed are energy efficient.
This can be demonstrated by purchasing refrigerators and clothes washing machines that achieve recognized
appliance ratings as described in the Approach/Methodologies section below. This measure cannot be claimed if
homes are not fitted with efficient refrigerators and clothes washing machines at the time of certification, and
there is no binding agreement in place to ensure that they will be installed at a later date.
Intention
Minimize the energy consumed by refrigerators and clothes washing machines installed in a home.
Approach/Methodologies
EDGE uses the following recognized appliance rating systems, but is not necessarily limited to:
▪ Energy Star rated; or
▪ Minimum ‘A’ rating under the EU Energy Efficiency Labelling Scheme; or
▪ Equivalent level in a comparable rating scheme42 to the ones above
Potential Technologies/Strategies
Appliance Overview Key Features for Efficiency
Refrigerators
After heating and
cooling, refrigeration
appliances are the
biggest energy
consumption in a
household, as they
An efficient refrigerator should:
Be small. Consider refrigerators with a capacity of 14 to 20 cubic feet (>4 people).
Have a high efficiency compressor (350kWh/year or
less). A model with the freezer on top (not a bottom-
mounted freezer or side-by-side model). Not have an automatic ice-maker and/or through-
the-door ice dispenser. Have automatic moisture control rather than an
“anti-sweat" heater.
42 If other rating schemes are used, evidence describing how the refrigerator or clothes washing machine meets or exceeds the
equivalent requirements under the Energy Star or EU labelling scheme must be submitted.

ENERGY EFFICIENCY MEASURES
© International Finance Corporation 2019. All rights reserved. EDGE User Guide 179
are working
continuously.
Clothes Washing Machines
About 60% of the
energy used by a
washing machine
goes towards water
heating; therefore,
models that use less
water also use less
energy.
An efficient clothes washing machine should:
Be the right size for the house. Have several wash cycles. Have improved water filtration. Have a dryer with a moisture sensor. Have a model with a high Modified Energy Factor
(MEF) and a low Water Factor (WF).
The way the occupants use the appliances also influences energy performance. It is important to provide users
with guidelines outlining the benefits of these appliances, and the best way to achieve maximum efficiency.
Relationship to Other Measures
Energy reduction due to appliances is expected by both energy efficient refrigerators and clothes washing
machines. Clothes washing machines also show reductions in energy due to hot water as well as lower water
consumption.
Assumptions
The base case assumes standard refrigerators and clothes washing machines, while the improved case is 5% to
10% more efficient.
Compliance Guidance
Design Stage Post-Construction Stage
At the design stage, the following must be used to
demonstrate compliance:
Summary list of the refrigerators and clothes washing
machines to be installed in the building, including
quantity, energy use, and proof of certification by
Energy Star, EU Energy Efficiency Labeling Scheme,
or equivalent; or
Specifications from the manufactured detailing energy
use.
At the post-construction stage, the following must be
used to demonstrate compliance:
Updated summary list of refrigerators and clothes
washers installed in the building including quantity,
manufacturer, and model; and
Proof of certification by Energy Star, EU Energy
Efficiency Labeling Scheme, or equivalent; or
Specifications from the manufactured detailing energy
use.

ENERGY EFFICIENCY MEASURES
© International Finance Corporation 2019. All rights reserved. EDGE User Guide 180
E38 – HIGHER EFFICIENCY REFRIGERATED CASES
Corresponds to RTE27
Requirement Summary
This measure can be claimed if the refrigerated cases, and any other fridge or refrigerator installed are energy
efficient. This can be demonstrated by purchasing refrigerated cases, fridges and refrigerators that achieve
recognized appliance ratings as described in the Approach/Methodologies section (below).
Intention
Minimize the energy consumed by refrigeration equipment installed in the buildings, such as supermarkets and
small food retail, to reduce the operational costs and increase the reputation of the retailer.
Approach/Methodologies
EDGE uses the following recognized appliance rating systems, but is not limited to:
▪ Energy Star rated - Commercial Food Service (CFS) equipment, which are up to 40% more efficient
than standard ones; or
▪ Minimum ‘A’ rating under the EU Energy Efficiency Labelling Scheme 43; which will be mandatory in
2016 for commercial refrigeration cabinets (draft versions are currently available); or
▪ Listed in the Energy Technology Product List (ETL)44; or
▪ Equivalent level in a comparable rating scheme 45 to the ones above.
The energy chart shows reduction in ‘Refrigeration'.
Potential Technologies/Strategies
Refrigerated cases are mostly used in supermarkets and small food retail, where up to half of the energy
consumption is dedicated to the refrigeration systems (display cases and storage coolers). Four main categories
of refrigerated cases are shown in the table below:
43 The scheme will be launched in July 2016. Draft versions can be used
44 Energy Technology List (ETL) is the UK government-managed list of energy-efficient plant and machinery. ETL website:
https://etl.decc.gov.uk/etl/site/etl.html
45 If other rating schemes are used, evidence describing how the refrigerated cases, fridges and refrigerators meets or exceeds
the equivalent requirements under the Energy Star or EU labelling scheme or ETL list must be submitted.

ENERGY EFFICIENCY MEASURES
© International Finance Corporation 2019. All rights reserved. EDGE User Guide 181
Table 50: Types of refrigerated cases
Type of refrigerated cases Use Key Features for Efficiency
Tub or Island
Storage and display of frozen foods and meats.
Operate at a very uniform temperature and less amount of refrigeration per unit area.
It has low storage volume per unit area used.
Glass door reach-in
Supermarkets, primarily for frozen foods
Ability to contain the cold refrigerated air, which reduces the “cold aisle” problem.
Less refrigeration loads. EEMs for this type are anti-sweat heaters
in the doors to prevent fogging and decreased visibility of the product.
Open-front multi-deck
Possesses the largest storage volume per
unit area, because of the use of an upright cabinet and shelves.
high Refrigeration requirements for multi-deck cases, including latent load from ambient air.
Recommended EEMs for this type are air curtains.
Single-deck or service
Display of fresh meat products.
Equipped with sliding doors in the back for the staff and a glass front to show the products to customers.
Commonly seen in the deli and meat departments of supermarkets.
The energy use of the cases described above is related to the refrigeration load, the sources of which are:
▪ Infiltration: Moist and warm air from the ambient pass through the open front of the cases. Energy
efficiency measures (EEMs) include air curtains or glass doors, which are detailed in Table 51;
▪ Conduction: Case panels and walls allow heat to be conducted to the interior of the case;
▪ Thermal radiation from the ambient surfaces to the product and display case interior; and
▪ Internal heat gains: generated by the lights, evaporator fans, periodic defrosts, and anti-sweat
heaters.
To reduce this load various energy efficiency measures (EEMs) could be applied to the refrigerated cases, which
result in the reduction of the refrigeration load and therefore energy savings of the retail units. These EEMs are
explained in the table below:

ENERGY EFFICIENCY MEASURES
© International Finance Corporation 2019. All rights reserved. EDGE User Guide 182
Table 51: Efficiency measures for Refrigerated cases
Technologies / controls
Potential saving
(refrigeration
) energy 46
Application Benefits /Key Features for Efficiency47
Glass doors Up to 50% Chilled and
frozen multi-decks
Better performance to medium temperature cases.
Special Polymer doors reduce the need for thermal
glass.
Strip Curtains and Air curtains
30% Chilled multi-
decks Well freezers
Reduced infiltration of ambient air and humidity into
the display case.
Night blinds or night covers
20% Chilled multi-
decks
Well freezers
Out-of-hours usage to reduce heat gain from ambient
temperature
Multideck Air Curtain Optimisation Technology
17% Chilled multi-
decks
Cost savings from reduced energy consumption
Low cost and fast payback within two years
Easy to install and minimal maintenance
Warmer shopping aisles for improved consumer
experience
Defrost optimization
20% Freezers Need of defrost controls that triggers defrost only
when needed
Interior Lighting 5 - 12% All types Energy-efficient lights: LED lighting or T8 lamps
Electronic Ballasts
Efficient Modular / Multi Evaporator coil
10% All cabinets Mainly
freezers
Defrost system to be installed with multi-evaporator
Enhance heat transfer
Evaporator coil to operate at a close temperature
difference (TD).
Efficient coil: evaporation occurs over the greatest
length of coil tubing, which maintains a reasonable evaporator size.
Use of electronic expansion valves.
High efficiency compressors and fans (evaporator or motors)
9% All cabinets
with forced air convection
Reduce both refrigeration load and direct energy
consumption, as coil defrost is less needed.
Use of electronically commutated motor (ECM)
Use of variable-speed drive (VSD), which enables the
coil to be held constant throughout the time between
defrosts, and to reduce defrost time/cycle.
Electronic Commutated Motors (ECM)
2 -8 % Evaporator: All
cabinets with
forced air convection
Condenser: All
integrals and
remote system
2% for reach-in freezers 7% for reach-in refrigerators
8% for (grocery) display cases
Thicker Insulation 4 - 6% All - primarily
frozen
Insulation such as Vacuum Insulated Panels (VIPs)
helps cut conduction heating of the cases.
Non-electric Anti-sweat heater controls
3 - 6% Freezers
cabinets
Reduce energy consumption as load is decreased.
High efficiency Liquid Suction Heat Exchanger (LSHX)
3% All cabinets Provides sub-cooling of liquid refrigerant through
useful superheat.
Allows the evaporator coil to operate with low superheat at the evaporator outlet.
46 Potential supermarket energy efficiency options
47 Investigation of Energy-Efficient Supermarket Display Cases. December, 2004. Prepared by: Foster Miller, Inc. David H.
Walker Principal Investigator Southern California Edison RTTC. Ramin T. Faramarzi Principal Investigator Oak Ridge National Lab
Van D. Baxter

ENERGY EFFICIENCY MEASURES
© International Finance Corporation 2019. All rights reserved. EDGE User Guide 183
Technologies / controls
Potential saving
(refrigeration
) energy 46
Application Benefits /Key Features for Efficiency47
Tangential fan
2% All cabinets
with fans
Improve the coil airflow distribution.
For increased savings to be used ECM motor and VSD
controller
Low-E / reflective glazing (K glass)
1 - 2% Glazed and
delicatessen cabinets
Reduction on radiant heat
The way the occupants / building manager use the appliances also influences energy performance. It is
important to provide users with guidelines outlining the benefits of these appliances, and the best way to
achieve maximum efficiency.
Relationship to Other Measures
Claiming this measure reduces energy use for refrigeration only.
Assumptions
The base case assumes standard refrigerated cases. The improved case is 10% more efficient. The reduction
varies depending on the type of building.
Compliance Guidance
Design Stage Post-Construction Stage
At the design stage one of the following must be used
to demonstrate compliance:
Summary list of the refrigerated cases to be
installed in the building, including quantity, energy
use, and proof of certification by Energy Star, EU
Energy Efficiency Labeling Scheme, Energy
Technology Product List (ETL), or equivalent; and
Specifications from the manufactured detailing
energy use.
At the post-construction stage one of the following
must be used to demonstrate compliance:
Updated summary list of the refrigerated cases
installed in the building, including quantity,
manufacturer, and model; and
Proof of certification by Energy Star, EU Energy
Efficiency Labeling Scheme, Energy Technology
Product List (ETL), or equivalent; and
Specifications from the manufactured detailing
energy use.

ENERGY EFFICIENCY MEASURES
© International Finance Corporation 2019. All rights reserved. EDGE User Guide 184
E39 – IMPROVED COOLING SYSTEM FOR COLD STORAGE
Corresponds to RTE35
Requirement Summary
This measure can be claimed if the project includes an improved efficiency system for cold storage, such as an
air-cooled screw chiller with a higher COP. The actual COP of the system must be entered in the software.
Savings can be achieved if the cooling system is an air-cooled chiller and achieves a Coefficient of Performance
(COP) greater than the baseline case under ARI conditions.
Intention, Approach/Methodologies, Potential Technologies/Strategies,
Relationship to Other Measures, Assumptions
For details on the measure under these headings, see the similar measure description for air conditioning with
air cooled chiller previously described in this user guide (measure E13).
Compliance Guidance
To demonstrate compliance, the design team must describe the specified system and provide documentation to
support the claims.
Design Stage Post-Construction Stage
At the design stage, the following must be used to
demonstrate compliance:
Mechanical layout drawings showing the location of
the external and internal units; and
Equipment Schedule or Manufacturer’s data sheets
(with the project specific info highlighted & noted)
for the air-cooled system specifying COP
information; and
Average COP calculation for systems including
more than one type of unit.
At the post-construction stage, the following must be
used to demonstrate compliance:
As-built mechanical drawings with air conditioning
schematics; and
Delivery notes showing that the specified cooling
system has been delivered to the site; and
Manufacturer’s data sheets for the air-cooled
system specifying the COP information; and
Photographs of installed external and internal air
conditioning units; and/or
Contract with the management company if the
system is centralized or off-site.

ENERGY EFFICIENCY MEASURES
© International Finance Corporation 2019. All rights reserved. EDGE User Guide 185
E40 – SMART METERS
Corresponds to HME21
Requirement Summary
This measure can be claimed when smart metering is provided in each unit of the building. The owners may
subscribe to an online monitoring system or install a Home Electricity Management System (HEMS), which
requires little additional equipment installation. Note that this measure cannot be claimed when 'prepaid meters'
are installed as they are not considered smart meters under EDGE.
The smart meter must be able to show readings of the last hour, last day, last 7 days and last 12 months of
usage data, and the devices should be accessible within the home. Other objectives of the smart meters and /
or HEMS are:
▪ Measure home electricity use and real power;
▪ Analyze measurements;
▪ Relatively low price per home;
▪ The smart meters solution must be workable in offline households with no web dependency.
Intention
The intent is to reduce energy demand through increased awareness of energy consumption. With smart
meters, end-users can appreciate, understand, and contribute to responsible use of energy in the building.
Smart meters can display measurements and recommendations.
Approach/Methodologies
When smart meters are installed in each unit of the building, end-users receive immediate feedback that can
result in 10 to 20% energy savings, as they are able to identify consumption in more detail than with
conventional meters.
Potential Technologies/Strategies
Smart metering is designed to provide occupants with information on a real-time basis about their domestic
energy consumption. This may include data on how much gas and electricity they are consuming, the costs, and
the impact of their consumption on greenhouse gas emissions.
A detection unit (the transmitter) is affixed to an existing utility meter and tracks energy use. The display unit
receives a wireless signal from the transmitter and displays the consumption information in real time and cost

ENERGY EFFICIENCY MEASURES
© International Finance Corporation 2019. All rights reserved. EDGE User Guide 186
for the end user. Many companies also offer online monitoring systems48 which require little to no additional
equipment installation.
The benefits of smart metering include controlling demand; improving equipment performance by signaling the
need for preventive maintenance or repairs; optimizing operational efficiency with controlled costs; and
maximizing property values.
For best results it is recommended that separate smart meters be used for different uses, i.e. lighting, cooling,
heating, hot water, and plug loads. This will offer better visibility of energy usage and therefore better
management. Some design considerations for an optimal HEMS are as follows:
▪ Include a utility-grade power meter, with network interface to home broadband router, or access to
cloud based data analysis, as an option;
▪ Consider an inductive power meter (clamp-on sensor) with wireless Home Area Network (HAN)
connection to in-home display (IHD) or web browser; and
▪ Use an interface to utility electricity meter for data acquisition, data storage in logger device, HAN
connection to IHD or web browser.
Figure 20. Home screen to of smart meter with display options to inform home users
48 For example, http://www.theenergydetective.com/ or
http://efergy.com/media/download/datasheets/ecotouch_uk_datasheet_web2011.pdf

ENERGY EFFICIENCY MEASURES
© International Finance Corporation 2019. All rights reserved. EDGE User Guide 187
Relationship to Other Measures
The contribution made by the measure is reflected in the common amenities portion of the energy chart.
Although EDGE does not show savings in other areas of energy consumption, this measure increases end user
awareness, which in the long term can help to significantly reduce energy consumption from appliances,
heating, cooling, and hot water.
Assumptions
The base case assumes conventional meters, while the improved case assumes smart meters to be installed in
each unit.
Compliance Guidance
Design Stage Post-Construction Stage
At the design stage, the following must be used to
demonstrate compliance:
Electric drawings/specifications including make and
model of smart meters and the connection with the
electric system or equivalent system online; and / or
Manufacturer’s specification of the smart meters.
At the post-construction stage, the following must be
used to demonstrate compliance:
Photographs of the installed smart meters; and/or
Purchase receipt for the smart meters or subscription
to the equivalent online system.

ENERGY EFFICIENCY MEASURES
© International Finance Corporation 2019. All rights reserved. EDGE User Guide 188
E41 – SOLAR HOT WATER COLLECTORS
Corresponds to HME19, HTE30, RTE28, HSE35, EDE29
Requirement Summary
This measure can be claimed if solar water heating is specified.
Intention
The installation of solar water heating will reduce the grid electricity (fossil fuels) used by the building for water
heating.
Approach/Methodologies
To recognize energy reductions from installing solar collectors, a user must enter the proportion of hot water
demand in the improved case that the solar collectors will deliver. EDGE uses this percentage to offset the
amount of energy needed, displaying an approximate minimum area of collectors required to deliver the
proportion of hot water demand. This will help auditors to check the size of the solar system against the EDGE
estimate.
The amount of hot water delivered by the solar collectors is dependent on the amount of solar energy available,
the roof pitch and profile, space available, shading factors, the orientation and angle of the solar collectors, and
the type of solar collectors. The size of the storage tank also impacts the amount of hot water delivered, as a
tank that is too small will reduce the quantity that can be stored. These factors should be considered by the
design team.
Solar collector sizing calculators are available from manufacturers of solar collectors. Alternatively, online
calculators or software can be used.
In some cases, solar collectors are centralized for a combination of buildings within the building project. In
these cases, the central solar plant should be located within the site boundary of the project, or managed by a
company within the control of the site owner. This is to ensure continued and sustainable management and
access to the plant for future maintenance.
When solar hot water collectors are located off-site, then a contract with the management company in charge of
the PV system must be provided as part of the documentation at post-construction stage.
Potential Technologies/Strategies
The two types of solar thermal collectors are flat plate and evacuated tube. Both types of solar collectors should
ideally be installed at a tilt angle that takes advantage of the most useful altitude angles of the sun to maximize
the solar heat available. This angle is approximately equal to the building location’s latitude. The collectors
should be angled towards the equator (towards the south in the northern hemisphere, and towards the north in
the southern hemisphere). If this is not possible then facing the panels towards the southeast, southwest or
even west is also acceptable, but panels should not be installed to face north in the northern hemisphere, and
towards the south or east in the southern hemisphere. Solar collectors can also be installed horizontal to the

ENERGY EFFICIENCY MEASURES
© International Finance Corporation 2019. All rights reserved. EDGE User Guide 189
ground. This is optimal in locations where the sun’s azimuth (angle of the sun from the horizon) is vertically
overhead at the desired peak production times. Where the sun is at other angles, the efficiency is adversely
affected.
Table 52: Types of solar water collectors
Type Description
Flat Plate Collectors As their name suggests, they are flat and typically black. They are the most commonly used collectors
and are the cheapest option. Flat plate collectors consist of an absorber plate, which is usually black
chrome; a transparent cover which protects the absorber plate and reduces heat loss; tubes
containing a fluid to take heat from the absorber plate; and an insulated backing.
Evacuated Tube
Collectors
Evacuated tubes consist of a row of glass tubes. These glass tubes each contain an absorber plate
fused to a heat pipe containing heat transfer fluid.
Relationship to Other Measures
This measure is inextricably linked to hot water consumption, which EDGE estimates based on the number of
occupants, the efficiency of the hot water boiler, and the flow rates of the kitchen, showers, laundry and hand
basin faucets. The required area of solar thermal collectors can therefore be reduced significantly by specifying
low-water-use showers and faucets, as well as any water heating recovery technology.
Assumptions
The base case assumes that no solar thermal collectors are installed. The default improved case assumes 50%
of total hot water demand in the improved case being met by the solar thermal installation. The default value of
50% must be overwritten by the user with the actual percentage applicable to the project. The area of the
collector required to deliver the stated proportion of hot water demand assumes that flat plate collectors are
used, and assumes that the collectors are installed at an optimum angle.

ENERGY EFFICIENCY MEASURES
© International Finance Corporation 2019. All rights reserved. EDGE User Guide 190
Compliance Guidance
To demonstrate compliance, the design team must briefly describe the system including the type of solar
collector; the capacity of the storage tank and its location; and the size, orientation and installed angle of the
panels.
EDGE will display the approximate area of panels required to deliver the proportion of hot water claimed by the
design team. The required area is calculated using local climate data and assumes an optimum angle for the
solar panel installation. The calculations assume use of flat plate collectors, therefore if the design team is using
evacuated tube collectors the area can be reduced.
Design Stage Post-Construction Stage
At the design stage, the following must be used to
demonstrate compliance:
Roof plan and drawings showing location,
orientation, and angle of the panels, which must be
at least as much as the area estimated by EDGE;
and
Manufacturer’s data sheet for the panels specified;
or
Building’s hot water system schematic including
solar panels.
At the post-construction stage, the following must be
used to demonstrate compliance:
As-built plumbing schematics; and
As-built roof plan showing the location, orientation
and angle of the panels; and
Photographs of the installed panels; or
Purchase receipts and delivery notes for the solar
panels.

ENERGY EFFICIENCY MEASURES
© International Finance Corporation 2019. All rights reserved. EDGE User Guide 191
E42 – SOLAR PHOTOVOLTAICS
Corresponds to HME20, HTE31, RTE29, OFE30, HSE36, EDE30
Requirement Summary
This measure can be claimed if solar photovoltaic (PV) panels are installed on the building or the site and if the
energy generated from the PV panels is used for operation of the building. Since a specific proportion of
electricity is replaced by renewable energy, the PV panels are considered an energy efficiency measure.
Intention
Installing solar photovoltaic panels reduces the amount of electricity required from the grid.
Approach/Methodologies
To claim this measure, the design team needs to indicate the proportion of electricity demand that they would
like to offset with the PV installation. This is the percentage of the annual electricity use (expressed in
kWh/year) of the improved case that is met by the PV system. This percentage can be calculated using the
electricity consumption from the EDGE improved case for the project, and the projected annual production from
the PV system. For example, if the projected energy use for the improved case is 100 kWh/m2/year, and the PV
system will generate 10 kWh/m2/year, 10% must be input into the model. EDGE will also indicate the peak
power output (kWp) required to deliver that percentage. The design team must be able to demonstrate that the
installation can deliver that kWp. The expected output of the solar panels is measured in kilowatt peak (kWp)
and is based on the theoretical peak output of the panels under test conditions. The kWp can be obtained
directly from the manufacturer.
For any project being split into multiple EDGE models, a total value must be calculated for the entire project and
this value must be input into every model.
In some cases, the PV panels are centralized for a combination of buildings within the building project. In these
cases, the central PV location/plant must be located within the site boundary of the project, or managed by a
company within the control of the site owner. This is to ensure continued and sustainable management and
access to the plant for future maintenance.
When PV panels are located off-site, a contract with the management company in charge of the PV system must
be provided as part of the documentation at the post-construction stage.
Potential Technologies/Strategies
Many types of solar photovoltaic systems are available and different technologies convert solar energy into
electricity with varying levels of efficiency. Efficiency levels of up to 22.5% can be achieved by some
commercially available systems, but others are only capable of delivering as little as 5% efficiency. The majority

ENERGY EFFICIENCY MEASURES
© International Finance Corporation 2019. All rights reserved. EDGE User Guide 192
of panels range from 14% to 16% efficiency rating49. Design teams should therefore ensure that the specified
system achieves the maximum efficiency possible for the available capital.
Relationship to Other Measures
To maximize the percentage contribution from the solar photovoltaic installation, the electricity demand must
first be minimized by reducing energy consumption (e.g., by using natural instead of mechanical ventilation, or
by using automatic lighting controls).
Assumptions
The base case assumes that photovoltaic panels are not specified. The improved case assumes 25% of total
energy demand being met by the solar panels, but the percentage can be adjusted by the user.
Compliance Guidance
To demonstrate compliance, the design team must briefly describe the system, including information on the
type of solar photovoltaic system and the location, size, orientation and installed angle of the panels. EDGE will
display the approximate kWp that is required to deliver the proportion of electricity demand claimed by the
design team.
Design Stage Post-Construction Stage
At the design stage, the following must be used to
demonstrate compliance:
Supporting calculation showing the proposed solar
photovoltaics will deliver sufficient electricity to achieve
the claimed proportion of total demand, and at least as
much as the area estimated by EDGE. If not, clear
justification should be provided; and
Manufacturer’s data sheet for the panels specified with
information on Wp per square meter; and
The roof plan and/or other drawings showing the
location, orientation and angle of the panels.
At the post-construction stage, the following
must be used to demonstrate compliance:
As-built roof plan showing the location,
orientation and angle of the panels if changed
from the design; and
Purchase receipts and delivery notes for the
solar panels; or
Photographs of the installed panels; and/or
Contract with the energy management
company if the PV system is centralized or
off-site.
49 Source: https://news.energysage.com/what-are-the-most-efficient-solar-panels-on-the-market/ accessed Nov. 30, 2017
ENERGY EFFICIENCY MEASURES
© International Finance Corporation 2019. All rights reserved. EDGE User Guide 193
E43 – OTHER RENEWABLE ENERGY FOR ELECTRICITY GENERATION
Corresponds to HME22, HTE32, RTE31, OFE31, HSE37, EDE31
Requirement Summary
This measure can be claimed if the project utilizes electricity generated from renewable resources other than
solar photovoltaics, such as Biomass, Wind, Geothermal and Hydropower. The renewable energy source must
be located on the project site to claim savings. Because the renewable source replaces a proportion of the
electricity generated from fossil fuels, renewable sources of electricity are considered an energy efficiency
measure.
Intention
The intent of this measure is to reduce the use of electricity generated from fossil fuels such as coal.
Approach/Methodologies
To claim this measure, the design team needs to indicate the proportion of electricity demand offset with
renewable energy generated on-site. The total annual electricity consumption of the improved case is calculated
by EDGE. The design team must be able to demonstrate that the renewable electricity source can deliver the
percentage of electricity consumption claimed by the project.
The renewable electricity source may be centralized for a combination of buildings/dwellings within the
development. In these cases, the total must be calculated for the master project and the same average
percentage must be used uniformly in all the models for the project.
Potential Technologies/Strategies
Several systems for generating electricity from renewable sources are available at varying levels of efficiency.
Efficiency levels of 20% or more can be achieved by some commercially available systems, but others are only
capable of delivering as little as 5% efficiency. Design teams must therefore ensure that the specified system
achieves the maximum efficiency possible for the available capital.
Relationship to Other Measures
To maximize the percentage contribution from the renewable source of electricity, the electricity demand must
first be minimized by reducing energy consumption (such as by using natural instead of mechanical ventilation
or by using automatic lighting controls).

ENERGY EFFICIENCY MEASURES
© International Finance Corporation 2019. All rights reserved. EDGE User Guide 194
Assumptions
The base case assumes that no renewable source of electricity generation is being utilized. When the measure is
selected, the default percentage of electricity generated from these sources is zero (0). The improved case
shows improvement only after the editable fields for the measure have been filled. A user must select the
appropriate source of renewable energy and assign to it the percentage of annual electricity consumption met
by the source.
Compliance Guidance
To demonstrate compliance, the design team must briefly describe the system. EDGE will display the annual
electricity demand of the improved case in kWh. The percentage of this demand met by the renewable energy
system can be claimed by the design team.
Design Stage Post-Construction Stage
At the design stage, the following must be used to
demonstrate compliance:
Supporting calculation showing the proposed
system will deliver sufficient electricity to achieve
the claimed proportion of total demand; and
Manufacturer’s data sheets for the proposed
system; or
Engineering drawings showing the system size and
location
At the post-construction stage, the following must be
used to demonstrate compliance:
As-built documentation showing the location and
size of the system; and
Photographs of the system; and/or
Purchase receipts and delivery notes of the system

ENERGY EFFICIENCY MEASURES
© International Finance Corporation 2019. All rights reserved. EDGE User Guide 195
E44 – OFFSITE RENEWABLE ENERGY PROCUREMENT
Corresponds to HME23, HTE33, RTE32, OFE32, HSE38, EDE32
Requirement Summary
The measure can be claimed if a contract has been signed for the procurement of new off-site renewable energy
that is specifically allocated to the building project. Renewable energy includes any carbon-free energy that is
generated without the use of fossil fuels, such as that sourced from solar, wind, tidal, or biomass resources.
This measure does not impact operational CO2 savings, but it reduces the total carbon footprint of the project.
This measure can be claimed for a Zero Net Carbon50 certification only once the project has achieved 40% or
greater savings in Energy.
Intention
Investment in off-site renewable energy supports the creation of new clean energy resources on the electrical
grid. This allows projects to access renewable energy even if they are located in a dense urban environment and
do not have sufficient open space or solar access to generate energy on site. Supporting off-site renewable
energy can accelerate the reduction of greenhouse gas emissions associated with the energy sector.
Additionally, by increasing renewable energy capacity on the grid, these resources may become more accessible
or affordable for a greater number of electricity consumers.
Approach/Methodologies
In order to claim this measure, the design team must specify the quantity of off-site renewable energy that was
contractually procured for the building project. If an entity associated with the project has already made general
procurements of off-site renewable energy at an organization level, it must be demonstrated that a specific
allocation was made for the exclusive use of the building. Off-site renewable energy procurements are typically
transacted in blocks of energy units over the course of a year, such as kilowatt hours or equivalent BTU of
electricity. When off-site renewable energy procurements are entered into the EDGE app, the quantity is
compared to the annual electricity use to give a percentage offset.
Potential Technologies/Strategies
Off-site renewable energy may be procured from a variety of sources that are typically regionally dependent. In
some countries, utility providers have established formal programs to support renewable energy development
through a premium rate that is charged directly to the consumer’s electricity bill, known as “green power”
purchasing. Alternatively, third-party providers may have established individual projects or other community-
based cooperatives to allow collective procurement of renewable energy at the local level. Where regional
50 “A Zero Net Carbon building is a highly energy efficient building that produces on-site, or procures, enough carbon-free renewable energy to meet building operations energy consumption annually.” Source: Architecture 2030.

ENERGY EFFICIENCY MEASURES
© International Finance Corporation 2019. All rights reserved. EDGE User Guide 196
renewable energy resources do not exist, projects may also consider procurement of renewable energy
certificates (RECs) or other transferrable credits that can be sourced from a broader range of locations. These
credits essentially transfer the value of renewable energy generated from the system owner to a consumer on
the open market.
Project teams should refer to their local jurisdiction or regulatory authority for a definition of acceptable forms
of renewable energy. In general, the EDGE tool will not accept forms of renewable energy that involve the
combustion of fossil fuels or other non-renewable carbon-based resources.
Relationship to Other Measures
Off-site renewable energy procurements may be made in combination with other measures that reduce the use
of fossil fuel or carbon-based energy resources for building construction and operations. These may include
energy efficiency measures that improve the passive performance of a building, such as increased insulation or
higher efficiency glass; the reduction of fossil fuel energy use in active systems, such as through high efficiency
equipment; or the replacement of fossil-fuel based electricity from the grid with on-site generated renewable
energy. The ultimate goal of combining these energy use reduction and replacement measures would be to
utilize renewable energy for all energy demands on site.
Assumptions
The base case assumes that no off-site renewable energy procurements have been made for the project.
Compliance Guidance
The design team must be able to provide documentation of the origin and type of off-site renewable energy
procurements, including the name of the provider. This documentation should include a copy of a signed
contract or other formal agreement to confirm allocation of the of the off-site renewable energy. Note: off-site
renewable energy procurements must be associated with new projects that are retired from the market after
the energy is procured.
Design Stage Post-Construction Stage
No documentation is required at the design stage.
At the post-construction stage, the following must be
used to demonstrate compliance:
Copy of contract or other formal document
stating the quantity and term of renewable
energy provided to the project; and
Description of the form of renewable energy that
is procured and its origin or project name; and
Documentation that it meets the definition of an
applicable local authority

ENERGY EFFICIENCY MEASURES
© International Finance Corporation 2019. All rights reserved. EDGE User Guide 197
E45 – CARBON OFFSET
Corresponds to HME24, HTE34, RTE33, OFE33, HSE39, EDE33
Requirement Summary
The measure can be claimed if a contract has been signed for investment in a carbon offset project. Carbon
offsets represent funding for third-party action to reduce or recapture carbon emissions that would otherwise be
emitted to the atmosphere. This measure does not impact operational CO2 savings, but it reduces the total
carbon footprint of the project. This measure can be claimed for a Zero Net Carbon51 certification only once the
project has achieved 40% or greater savings in Energy.
Intention
Investing in carbon offsets reduces the net impact of building construction and operations to the atmosphere.
By putting a value on carbon emissions reduction, the market is incentivized to implement additional measures
to mitigate carbon emissions impact.
Approach/Methodologies
In order to claim this measure, the design team must specify the amount of carbon offsets that have been
procured with a signed contract. Typically, each carbon offset unit represents the mitigation of one metric tonne
of carbon dioxide or equivalent greenhouse gas. When carbon offsets are claimed in the EDGE app, the offset
value is compared to the total estimated carbon emissions of the improved case in order to calculate the total
offset percentage
Potential Technologies/Strategies
Many different carbon offset products are available from providers that represent projects across a range of
sectors and regions. While the most common carbon offset projects are related to funding new renewable
energy installations, such as solar or wind energy, a number of other projects are available related to energy
efficiency upgrades, methane or carbon capture and sequestration and forestry restoration. The EDGE tool does
not make restrictions on the type or origin of carbon offsets, though project teams may choose to procure
specific offset products based on their desired impact (e.g. support clean energy development) or a preference
for locally-based projects. While the EDGE tool recognizes carbon offsets equally based on the equivalent metric
tonnes of CO2, the cost of individual carbon offsets may vary depending on regional availability and project
type.
51 “A Zero Net Carbon building is a highly energy efficient building that produces on-site, or procures, enough carbon-free renewable energy to meet building operations energy consumption annually.” Source: Architecture 2030.

ENERGY EFFICIENCY MEASURES
© International Finance Corporation 2019. All rights reserved. EDGE User Guide 198
Relationship to Other Measures
Carbon offsets may be applied in combination with other measures that reduce the emissions associated with
building construction and operations. These may include energy efficiency measures that improve the passive
performance of a building, such as increased insulation or higher efficiency glass; the reduction of fossil fuel
energy use in active systems, such as through high efficiency equipment; or the replacement of fossil-fuel
based electricity from the grid with on-site generated or off-site procured renewable energy. Together, carbon
reduction measures can be combined with carbon offsets to achieve a zero-net carbon balance for the building.
Assumptions
The base case assumes that no carbon offsets have been procured for the project.
Compliance Guidance
The design team must be able to provide documentation of the origin and type of carbon offset procured, the
organization issuing the offset, and evidence of third-party verification by the appropriate regulatory authority.
Finally, a copy of a signed contract must be provided in order to confirm execution of the carbon offsets. Note:
carbon offsets must be new projects that are retired after the offset is issued. Also, EDGE does not recognize
carbon offsets that are based on materials combustion.
Design Stage Post-Construction Stage
No documentation is required at the design stage.
At the post-construction stage, the following must be
used to demonstrate compliance:
Documentation of the carbon offset provider,
stating formal certification or other third-party
verification by an appropriate authority; and
Description of carbon offset project, including the
methods by which carbon reductions are made;
and
Copy of contract or other formal document
stating the amount of offsets procured in
equivalent metric tonnes of CO2

WATER EFFICIENCY MEASURES
© International Finance Corporation 2019. All rights reserved. EDGE User Guide 199
WATER EFFICIENCY MEASURES
Water efficiency is one of the three main resource categories that comprise the EDGE standard. To comply for
certification purposes, the design and construction team must review the requirements for selected measures as
indicated and provide the information.
Required measures in EDGE do not mean that the improved case must meet or exceed the baseline case.
Rather, it means that the actual performance of water fixtures is required to be entered in EDGE. If the final
installed fixtures have variation in performance for any reason, a weighted average of the performance metric
must be used.
Note: Flow rates used in this User Guide are global baseline assumptions and may differ from rates used in
EDGE for countries in which it has been calibrated.
The following pages explain each water efficiency measure by relaying the intention, approach, assumptions and
compliance guidance requirements.
Figure 21. Screenshot of water saving measures in EDGE for Homes

WATER EFFICIENCY MEASURES
© International Finance Corporation 2019. All rights reserved. EDGE User Guide 200
W01* – LOW FLOW SHOWERHEADS
Corresponds to HMW01, HTW01, HSW01, EDW01
Requirement Summary
The actual flow rate of showerheads should be entered into the software in all cases, irrespective of whether the
value is low or high. Savings can be achieved if the average flow rate of the showerheads is less than the base
case flow rate.
Building Type Spaces that must have low flow showerheads
Homes All bathrooms
Hospitality Guest rooms
Hospitals All bathrooms
Education All bathrooms
Intention
By specifying low-flow showerheads, water use is reduced without adversely affecting the functionality.
Approach/Methodologies
The flow rate of a shower can be as low as 6 liters per minute or greater than 20 liters per minute. As the flow
rate of a showerhead is dependent on the water pressure, manufacturers often provide a chart which plots the
flow rate at different pressures. For consistency, the flow rate used for the EDGE assessment in the design/pre-
construction phase must be that quoted for the operating pressure of 3 bar (43.5 psi). At the post-construction
stage, actual flow rates must be used. If the pressure and flow rates of the showerheads vary across a project
after construction, a weighted average at full flow must be used. Multiple measurements must be made across a
variety of locations and floors to come up with a weighted average.
This measure can be claimed if the actual flow rate is entered and is lower than the Base Case. A flow rate that
is lower than the default value for the design case contributes to even greater water savings.

WATER EFFICIENCY MEASURES
© International Finance Corporation 2019. All rights reserved. EDGE User Guide 201
Potential Technologies/Strategies
Many different showerheads are available that meet the flow rate required. In order to maintain user
satisfaction at the lower flow rates, some manufacturers mix water with air to cause turbulence in the flow; this
in turn gives an increased sense of pressure without increasing the flow rate.
Relationship to Other Measures
Higher flow rate showers use a significant quantity of hot water. Reducing the flow rate of the shower reduces
the energy required to produce hot water. Therefore, both water consumption from showers, and energy
consumption due to hot water, are reduced.
Assumptions
Assumptions for the base case and improved case vary by building type and location. The relevant improved
case automatically gets displayed in the software. The base case flow rate can be deduced by changing the
improved case values to get the same water consumption as the base case. Typically, it is either 8 or 9 liters
per minute at 3 bar (43.5 psi).
Compliance Guidance
Design Stage Post-Construction Stage
At the design stage, the following must be used to
demonstrate compliance:
Plumbing drawings/specifications including make,
model, and flow rate of the showerhead(s); and
Manufacturer’s data sheet for the showerhead(s)
confirming the flow rate at 3 bar.
At the post-construction stage, the following must be
used to demonstrate compliance:
On site test results by the auditor of the flow rate
at the highest flow per minute, using a timer and
a measurement container; and
Photographs of the installed showerhead(s); or,
Purchase receipts and delivery note for the
showerhead(s).

WATER EFFICIENCY MEASURES
© International Finance Corporation 2019. All rights reserved. EDGE User Guide 202
W02* – LOW FLOW FAUCETS FOR WASHBASINS
Corresponds to HMW03, HTW02, HTW07, RTW03, OFW01, HSW02, EDW02
Requirement Summary
Savings can be achieved if the flow rate of the faucets specified for the washbasins in the building are less than
the base case in liters per minute. This low flow rate must be obtained through the use of aerators and auto
shut off controls.
Building Type Spaces that must have low flow faucets
Homes Bathrooms
Hospitality Guest room bathrooms
All other bathrooms
Retail All bathrooms
Offices All bathrooms
Hospitals All bathrooms
Education All bathrooms
Intention
By specifying aerators and auto shut-off faucets for washbasins and sinks, water use is reduced without
adversely affecting functionality.
Approach/Methodologies
As the flow rate of a faucet is dependent on the water pressure, manufacturers often provide a chart that plots
the flow rate at different pressures. To improve consistency, the flow rate used for the EDGE assessment in the
design/pre-construction phase must be that quoted for the operating pressure of 3 bar (43.5 psi). At the post-
construction stage, actual flow rates must be used. If this flow rate is not available, physical measurements can
be made on site using a bucket of a known size and a timer to record the flow rate. Multiple measurements
must be made across a variety of locations and floors to come up with a weighted average.
WATER EFFICIENCY MEASURES
© International Finance Corporation 2019. All rights reserved. EDGE User Guide 203
If the measure is claimed, then the assumed improved flow rate is 2 liters per minute. If the flow rate is greater
than 2 liters per minute but lower than the baseline in liters per minute, the measure can still be claimed if the
actual flow rate is entered. The lower the flow rate the greater the water savings.
Potential Technologies/Strategies
This measure includes two technologies fitted to the faucet – aerators and auto shut-off valves – which must be
purchased as one product.
Aerators are small water-saving devices attached to the faucet that maintain user satisfaction at the lower flow
rates. They mix water with air to cause turbulence in the flow; this in turn gives an increased sense of pressure
without increasing the flow rate. They are also called flow regulators.
Auto shut-off faucets are activated by a push action or electronic sensors that allow the water flow to last for
a programmed length of time, usually 15 seconds. After this period the faucet shuts off automatically, which is
ideal for public and unsupervised washing areas.
Flow restrictors or aerators can be added on to the specified faucets to reduce the flow rate, which may be a
cheaper alternative to purchasing a low-flow faucet.
Relationship to Other Measures
Reducing the flow rate of all the washbasin faucets in the building reduces the water demand and the energy
required to produce hot water for the faucets.
Assumptions
The base case assumptions vary by location. Globally, the typical baseline flow rate is 6 liters per minute for all
the faucets in all the washbasins; it is assumed that these faucets do not have auto shut-off technology. The
improved case has aerated, auto shut-off faucets with a default flow rate of 2 liters per minute in all the
washbasins included in the measure.
Compliance Guidance
Design Stage Post-Construction Stage
At the design stage, the following must be used to
demonstrate compliance:
Plumbing drawings/specifications including make,
model auto shut-off mechanism and flow rate of
the washbasin faucet(s); or
Manufacturer’s data sheet for faucet(s)/flow
aerator(s) confirming the flow rate at 3 bar.
At the post-construction stage, the following must be
used to demonstrate compliance:
On-site test results by the auditor of the flow rate
at the highest flow per minute, using a timer and a
measurement container; and
Photographs of the installed faucet(s); or
Purchase receipts and delivery note for faucet(s)
which includes make, model and auto shut-off
mechanism.

WATER EFFICIENCY MEASURES
© International Finance Corporation 2019. All rights reserved. EDGE User Guide 204
W03* – WATER-EFFICIENT WATER CLOSETS
Corresponds to HMW04, HMW05, HTW03, HTW06, RTW01, OFW02, HSW03,
EDW03
Requirement Summary
This measure can be claimed when the water closets in all bathrooms of the building have a dual flush
mechanism, or if they have an efficient single flush or flush valve. It is required that the actual flush rate of
water closets be entered in EDGE in all cases, irrespective of the value.
Intention
Installing dual flush water closets helps to reduce the water used for flushing by providing a reduced flush
option when a full flush is not required. Installing a more water efficient single flush water closet or flush valve
similarly helps to reduce the water used to flush.
Approach/Methodologies
This measure will result in savings if the main flush is less than the base case in liters/flush and/or if the second
flush is less than the base case in liters/flush. The default flush volumes for the improved case must be replaced
with the actual values provided by the manufacturer.
In the case of a more efficient single flush system, select the Single flush/flush valve choice in EDGE. The actual
flush value must be entered in the field for the volume of the flush. If the volumes of the flush vary across a
project, a weighted average must be used. Multiple measurements must be made across a variety of locations
and floors to come up with a weighted average.
Potential Technologies/Strategies
Dual-flush water closets have two flush levers where the smaller volume flush is recommended for liquid waste,
and the higher volume flush for solid waste. The design team should be careful to select dual-flush water closets
with clear intuitive controls, and a good flush performance rating. In some cases, dual-flush water closets can
adversely increase the volume of water used if the method of use is not clear, or if they do not flush the waste
adequately, requiring repeat flushes. The Environmental Protection Agency in the U.S. has a label,
“WaterSense,”52 with tests for water efficiency and performance, for high-performance water closets. The EPA
website is a useful reference to identify dual flush water closets which have low water use but equivalent
flushing performance to water closets with higher flush volumes.
52 Water Sense, US Environmental Protection Energy. 2014. http://www.epa.gov/WaterSense/index.html

WATER EFFICIENCY MEASURES
© International Finance Corporation 2019. All rights reserved. EDGE User Guide 205
Relationship to Other Measures
This measure is not affected by any other measure. However, this measure impacts building energy
consumption due to a change in the energy use of water pumps as the total volume of water pumped changes
(this portion of the energy consumption is included within the Energy Use category “Other”).
Assumptions
The base case assumptions vary by location based on studies. Globally, the typical baseline is a flush volume of
8 liters. The improved case assumes a flush volume of 6 liters for the main flush and 3 liters for the reduced
flush.
Compliance Guidance
Design Stage Post-Construction Stage
At the design stage, the following must be used to
demonstrate compliance:
Plumbing drawings/specifications including make,
model and flush volumes of water closet(s); and
Manufacturer’s data sheet for water closet(s) with
information on the flush volume of the main and
reduced flushes.
At the post-construction stage, the following must be
used to demonstrate compliance:
Photographs of installed water closet(s); or
Purchase receipts and delivery note for water
closet(s).

WATER EFFICIENCY MEASURES
© International Finance Corporation 2019. All rights reserved. EDGE User Guide 206
W04* – WATER-EFFICIENT URINALS
Corresponds to HTW05, RTW02, OFW03, HSW04, EDW04
Requirement Summary
This measure can be claimed when urinals in all bathrooms of the building have a flush volume which is lower
than the base case. The actual flush rate of urinals must be entered in the software in all cases, irrespective of
the value.
Intention
Fitting low-flush urinals reduces the water used for flushing, ensuring efficient water use and a high level of user
satisfaction with flushing performance.
Approach/Methodologies
The flush volume is measured in liters/flush. The default flush volumes for the improved case must be replaced
with the actual values provided by the manufacturer. The maximum flush volume of the urinal fixture as per the
manufacturer must be specified.
If the flow rates of the urinals vary across a project, a weighted average must be used. Multiple measurements
must be made across a variety of locations and floors to come up with a weighted average.
There are urinals available that do not use any water, referred to as waterless urinals. For waterless urinals, a
value of 0.001 Lt/flush must be entered in the field provided.
Potential Technologies/Strategies
Urinals are only provided in bathrooms for males and only accept liquid waste. Their water saving potential
depends on the number of male users in the building.
Urinals that are designed to be non-adjustable above their flush volume and that are provided with drain trap
functionality tend to save more water. Pressurized flushing devices and a valve provide controls and therefore
water savings.
In some cases, water efficient urinals can result in an increased risk of blockages caused by the reduced volume
of water. The Environmental Protection Agency in the U.S. has a label, “WaterSense,” with tests for water
efficiency and performance53. The WaterSense label helps purchasers easily identify high–performing, water–
efficient urinals, which can be found on the EPA website.
53 Water Sense, US Environmental Protection Energy. 2014. http://www.epa.gov/WaterSense/index.html or
http://www.epa.gov/WaterSense/products/urinals.html

WATER EFFICIENCY MEASURES
© International Finance Corporation 2019. All rights reserved. EDGE User Guide 207
Type of Urinal Description
High efficiency Urinals that flush 2 liters or less, which are currently available from several manufacturers.
Waterless or non-water
These urinals eliminate flush valves and water use. They need special maintenance to control odors and blockages with “urine stone” deposits in the drains. This adds operation costs as well as reduced life expectancy, which should be taken into account.
Wall-mounted urinals with flush valves
These urinals are flushed after each use, either manually or automatically. The automatic controls can be a timer or a valve, which are useful in bathrooms of high use, such as conference areas.
Relationship to Other Measures
This measure is not affected by any other measure. However, this measure impacts building energy
consumption due to a change in the energy use of water pumps as the total volume of water pumped changes
(this portion of the energy consumption is included within the Energy Use category “Other”).
Assumptions
The base case assumptions vary by location. Globally, the typical baseline is a flush volume of 4 liters; the
improved case assumes a flush volume of 2 liters. EDGE assumes on average that urinals are used two out of
three instances of bathroom use in the male restrooms.
Compliance Guidance
Design Stage Post-Construction Stage
At the design stage, the following must be used to
demonstrate compliance:
Plumbing drawings/specifications including make,
model and flush volume of the urinal(s); or
Manufacturer’s data sheet for urinal(s) with
information on the flush volume.
At the post-construction stage, the following must be
used to demonstrate compliance:
Photographs of installed urinal(s); or
Purchase receipts and delivery note for urinal(s).

WATER EFFICIENCY MEASURES
© International Finance Corporation 2019. All rights reserved. EDGE User Guide 208
W05* – WATER-EFFICIENT KITCHEN FAUCETS
Corresponds to HMW02, HTW10, RTW04, OFW04, HSW07, EDW05
Requirement Summary
The actual flow rate of kitchen sink faucets must be entered in the software in all cases, irrespective of the
value. Savings can be achieved if the flow rate of the faucets specified for the kitchen sinks is less than the base
case specified in liters per minute.
In some cases, these savings are not applicable. For instance, in a building without a kitchen, there will be no
kitchen water faucets and therefore no savings from this measure.
Intention
By specifying low-flow faucets for kitchen sinks, water use is reduced without adversely affecting the
functionality. Hot water use is also reduced, reducing energy consumption for heating the water.
Approach/Methodologies
As the flow rate of a faucet is dependent on the water pressure, manufacturers often provide a chart that plots
the flow rate at different pressures. To improve consistency, the flow rate used for the EDGE assessment must
be that quoted for the operating pressure of 3 bar (43.5 psi). If this flow rate is not available, physical
measurements can be made on site using a bucket of a known size and a timer to record the flow rate. If the
flow rates of the faucets vary across a project, a weighted average must be used. Multiple measurements must
be made across a variety of locations and floors to come up with a weighted average.
If the measure is claimed, the assumed improved flow rate defaults to 4 liters per minute. As long as the actual
flow rate is lower than the base case in liters per minute, the measure can be claimed by specifying the actual
flow rate. A lower flow rate contributes to greater water savings.
Potential Technologies/Strategies
Many different faucets are available that meet the flow rate required. To maintain user satisfaction at the lower
flow rates, some manufacturers mix water with air to cause turbulence in the flow; this in turn gives an
increased sense of pressure without increasing the flow rate.
Flow restrictors or aerators can be added on to the specified faucets to reduce the flow rate, which may be a
cheaper alternative to purchasing a low-flow faucet.
Relationship to Other Measures
Higher flow rate kitchen faucets use a significant quantity of hot water. Reducing the flow rate of the kitchen
faucets reduces the energy required to produce hot water.

WATER EFFICIENCY MEASURES
© International Finance Corporation 2019. All rights reserved. EDGE User Guide 209
Assumptions
The base case assumption varies by location. Globally, the typical baseline assumption is a flow rate of 8 liters
per minute and the improved case is a flow rate of 4 liters per minute at 3 bar.
Compliance Guidance
Design Stage Post-Construction Stage
At the design stage, the following must be
used to demonstrate compliance:
Plumbing drawings/specifications
including make, model and flow rate of
kitchen faucet(s) or flow restrictor(s); or
Manufacturer’s data sheet for
faucet(s)/flow restrictor(s) confirming the
flow rate at 3 bar.
At the post-construction stage, the following must be used to
demonstrate compliance:
On site test results by the auditor of the flow rate at the
highest flow per minute, using a timer and a measurement
container; and
Photographs of the installed faucet(s) or flow restrictor(s);
or
Purchase receipts and delivery note for faucet(s) or flow
restrictor(s).

WATER EFFICIENCY MEASURES
© International Finance Corporation 2019. All rights reserved. EDGE User Guide 210
W06 – LOW FLOW PRE-RINSE SPRAY VALVES FOR DISHWASHING
Corresponds to HTW09, RTW06, HSW06
Requirement Summary
This measure can be claimed if the kitchens are fitted with low flow pre-rinse spray valves for rinsing the dishes
prior to be placed in the washing machine. The pre-rinse valve specified should be 6 liters per minute or less.
Intention
By specifying low-flow pre-rinse valve, water use is reduced compared to a manual rinse of the dishes.
Approach/Methodologies
As the flow rate of the pre-rinse valve is dependent on the water pressure, manufacturers often provide a chart
that plots the flow rate at different pressures. In order to improve consistency, the flow rate used for the EDGE
assessment in the design/pre-construction phase must be that quoted for the operating pressure of 3 bar (43.5
psi). At the post-construction stage, actual flow rates on site must be used for the EDGE inputs. If the flow rates
of the spray valves vary across a project, a weighted average must be used.
Some of the benefits of having an efficient pre-rinse valve in the kitchen of the hospital include having an
efficient cleaning but using less water and energy, which then reduce the operational costs.
Potential Technologies/Strategies
Many different pre-rinse valves are available in the market; however as the flow rate required is low, efficient
spray valves need to meet 6 liters per minute flow rate. In order to maintain user satisfaction at the lower flow
rates, manufacturers mix water with air to cause turbulence in the flow; this in turn gives an increased sense of
pressure without increasing the flow rate. Pre-rinse spray valves require a lot of pressure, which is given by the
air within the valve, to remove the food waste prior to dishwashing. The savings are even more noticeable
because pre-rinse valves use hot water, so when water is reduced the use of energy is also dropped.
Relationship to Other Measures
Water reduction in the 'Kitchen' section of the water chart is expected by low flow pre-rinse valves. Moreover, it
shows reductions in energy due to 'water heating' and water pumps which is part of 'Others'.
Assumptions
The base case assumption is a flow rate of 19 liters per minute and the improved case default is a flow rate of 6
liters per minute.

WATER EFFICIENCY MEASURES
© International Finance Corporation 2019. All rights reserved. EDGE User Guide 211
Compliance Guidance
Design Stage Post-Construction Stage
At the design stage, the following must be
used to demonstrate compliance:
Plumbing drawings/specifications
including make, model, and flow rate of
the pre-rinse valve(s); or
Manufacturer’s data sheet for pre-rinse
valve(s) confirming the flow rate at 3 bar.
At the post-construction stage, the following must be used to
demonstrate compliance:
On site test results by the auditor of the flow rate at the
highest flow per minute, using a timer and a measurement
container; and
Photographs of the installed pre-rinse valve(s); or
Purchase receipts and delivery note for pre-rinse valve(s).

WATER EFFICIENCY MEASURES
© International Finance Corporation 2019. All rights reserved. EDGE User Guide 212
W07 – WATER-EFFICIENT DISHWASHERS
Corresponds to HTW08, RTW05, HSW05
Requirement Summary
This measure can be claimed if all the dishwashers installed in the building are water efficient (low
consumption). This can be demonstrated when the purchased dishwasher(s) use less water than the base case.
The base case dishwasher uses 5 liters per rack.
Intention
Minimize the water consumed by the dishwashers installed in the building.
Approach/Methodologies
The dishwasher consumption can be as low as 4 liters per load or greater than 21 liters per load. In a load two
racks can be filled up. EDGE measures the water consumption per rack, which is calculated with the maximum
total water consumption in liters divided by the number of racks in the dishwasher. The maximum total water
consumption is taken from the manufactures datasheet on the cycle of the dishwasher that uses the most
water. This measure can be claimed as long as the dishwasher uses 2 liters per rack or less.
Potential Technologies/Strategies
Dish washers overview Key features for Efficiency
About 60% of the energy used
by a dishwasher goes towards
water heating; therefore,
models that use less water also
use less energy.
An efficient dishwasher should:
Be the right size for the building Have several wash cycles Enable pre-rinse to be skipped Have soil sensors, which test how dirty dishes are and adjust the cycle to
reduce water and energy use Have more efficient jets, which use less energy to spray detergent and
water Have ‘no-heat’ drying feature, which circulates room air through the
dishwasher by fans, rather than using electric heating Have improved water filtration
In terms of dishwashers, the way that occupant use them also influence the water performance. It is important
to provide users with guidelines outlining the benefits of these appliances, and the best way to achieve
maximum efficiency.
Relationship to Other Measures
Water reduction in the 'Kitchen' section of the water chart is expected by water efficient dishwashers. Moreover,
it shows reductions in energy due to equipment and pumps which is part of 'Others.'

WATER EFFICIENCY MEASURES
© International Finance Corporation 2019. All rights reserved. EDGE User Guide 213
Assumptions
The base case assumes standard dishwashers with a water consumption of 5 liters per rack, while the improved
case assumes 2 liters per rack, which is 60% more efficient.
Compliance Guidance
Design Stage Post-Construction Stage
At the design stage, the one of the following must
be used to demonstrate compliance:
Summary of the dishwasher(s) to be installed in
the building, including quantity and proof of
maximum water use; or
Specifications from manufacture detailing water
use.
At the post-construction stage, one of the following must
be used to demonstrate compliance:
Updated summary of dishwasher(s) installed in the
building including quantity, manufacturer and model;
or
Proof of maximum water consumption from
manufacture; or
Purchase receipts and delivery note for dishwashers

WATER EFFICIENCY MEASURES
© International Finance Corporation 2019. All rights reserved. EDGE User Guide 214
W08 – WATER-EFFICIENT FRONT-LOADING WASHING MACHINES
Corresponds to HTW04
Requirement Summary
This measure can be claimed when all the washing machines used in the laundry of a hotel or serviced
apartment are front loading washing machines with high water efficiency.
Intention
Using high efficient front-loading washing machines reduces the water used for laundry. Other benefits, of high
efficient washing machines, include energy saving due to the reduction of hot water use, better performance in
cleaning the clothes, reduce fabric wear, and usually less detergent use.
Approach/Methodologies
The measure can be claimed if all the washing machines in the laundry use 6 liters of water per kilogram of
clothes washed or less.
Potential Technologies/Strategies
There are two types of washing machines available in the market, top loading and front loading. While top
loading need more water in order to cover the clothes inside, the front loading require about a third. The high
efficiency washers are high-tech machines that use less water (both hot and cold water) and energy, while are
more effective in cleaning the clothes compared to the standard ones. This is because in the front loading the
washer moves the clothes through the water using gravity to create more agitation.
Relationship to Other Measures
Using a water-efficient washing machine not only reduces cold water demand but also hot water demand.
Therefore, when this measure is selected the energy consumption is decreased due to water heating, as well as
miscellaneous equipment, which is included within "Others".
Assumptions
The base case assumption is a standard washing machine that uses 10 liters per kilogram of clothes per cycle,
while the improved case assumes a water usage of 6 liters per kilogram of clothes per cycle. This is equivalent
to Water Consumption Factor (WCF)* of 5.94l/kg/cycle or 4.5gal/cu.ft/cycle.

WATER EFFICIENCY MEASURES
© International Finance Corporation 2019. All rights reserved. EDGE User Guide 215
Compliance Guidance
Design Stage Post-Construction Stage
At the design stage, the following must be used to
demonstrate compliance:
Manufacturer’s data sheet for washing machine(s)
selected with information on the water consumption
and maximum load capacity in kilograms.
At the post-construction stage, the following must be
used to demonstrate compliance:
Photographs of installed front loading washing
machine(s); or
Purchase receipts and delivery note for washing
machine(s).
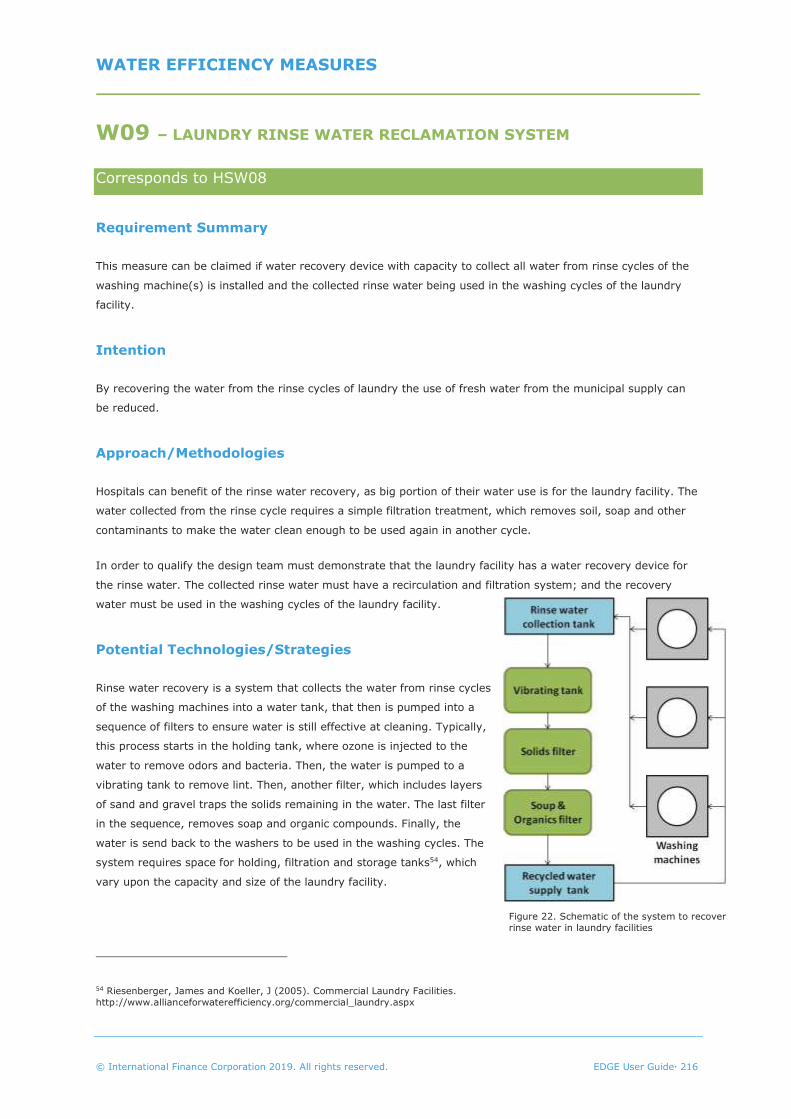
WATER EFFICIENCY MEASURES
© International Finance Corporation 2019. All rights reserved. EDGE User Guide 216
W09 – LAUNDRY RINSE WATER RECLAMATION SYSTEM
Corresponds to HSW08
Requirement Summary
This measure can be claimed if water recovery device with capacity to collect all water from rinse cycles of the
washing machine(s) is installed and the collected rinse water being used in the washing cycles of the laundry
facility.
Intention
By recovering the water from the rinse cycles of laundry the use of fresh water from the municipal supply can
be reduced.
Approach/Methodologies
Hospitals can benefit of the rinse water recovery, as big portion of their water use is for the laundry facility. The
water collected from the rinse cycle requires a simple filtration treatment, which removes soil, soap and other
contaminants to make the water clean enough to be used again in another cycle.
In order to qualify the design team must demonstrate that the laundry facility has a water recovery device for
the rinse water. The collected rinse water must have a recirculation and filtration system; and the recovery
water must be used in the washing cycles of the laundry facility.
Potential Technologies/Strategies
Rinse water recovery is a system that collects the water from rinse cycles
of the washing machines into a water tank, that then is pumped into a
sequence of filters to ensure water is still effective at cleaning. Typically,
this process starts in the holding tank, where ozone is injected to the
water to remove odors and bacteria. Then, the water is pumped to a
vibrating tank to remove lint. Then, another filter, which includes layers
of sand and gravel traps the solids remaining in the water. The last filter
in the sequence, removes soap and organic compounds. Finally, the
water is send back to the washers to be used in the washing cycles. The
system requires space for holding, filtration and storage tanks54, which
vary upon the capacity and size of the laundry facility.
54 Riesenberger, James and Koeller, J (2005). Commercial Laundry Facilities.
http://www.allianceforwaterefficiency.org/commercial_laundry.aspx
Figure 22. Schematic of the system to recover
rinse water in laundry facilities

WATER EFFICIENCY MEASURES
© International Finance Corporation 2019. All rights reserved. EDGE User Guide 217
Relationship to Other Measures
Claiming this measure only reduces the water demand for laundry. The contribution that the measure makes to
the overall performance is not affected by any other measure.
Assumptions
The base case assumes no rinse water recovery from laundry, while the improved case assumes that all the
water generated from the rinse cycles is recovered for the washing cycles within the laundry facility.
Compliance Guidance
In order to demonstrate compliance, the design team must provide documentation to support the claims.
Design Stage Post-Construction Stage
At the design stage, the following must be used to
demonstrate compliance:
Hydraulic layout drawings of the laundry facility
showing the location of the rinse water collection,
filtration and reuse tanks.
At the post-construction stage, the following must be
used to demonstrate compliance:
As-built hydraulic drawings of the laundry facility
showing the location of the rinse water collection,
filtration and reuse tanks; and
Photographs of installed equipment related to the
system.
WATER EFFICIENCY MEASURES
© International Finance Corporation 2019. All rights reserved. EDGE User Guide 218
W10 – CONDENSATE WATER RECOVERY SYSTEM
Corresponds to HTW13, RTW08, OFW05, HSW10, EDW06
Requirement Summary
This measure can be claimed if a condensate water recovery device with the capacity to collect all condensate
water from the cooling system is installed and the condensate water is used in landscaping, toilet flushing or for
outdoor uses.
Intention
By recovering the condensate water from HVAC equipment, the use of fresh water from the municipal supply
can be reduced.
Approach/Methodologies
Buildings benefit from condensate water recovery, which does not require much treatment and saves water for
other purposes within the building and landscaping.
To qualify, the design team must demonstrate that the HVAC system has a collection device for the condensate
water recovered. The collected condensate must have a piping system and collection tank or can be directed to
the rain water collection tank if present. The collected water must be used in the building, such as for toilet
flushing or on-site irrigation.
Potential Technologies/Strategies
In the context of buildings, condensate water recovery aims to re-use the water arising from the
dehumidification of the air in HVAC or refrigeration systems. When the air passes through the cold coil of the
system, the temperature of the air is decreased and the vapor (humidity) changes from gas to liquid, which can
then be removed as condensate. It is essentially distilled water with low mineral content, but it can potentially
contain harmful bacteria such as Legionella55. This water can potentially be used anywhere in the building
except for drinking, if proper treatment to address biological contaminants is considered. Potential use of
condensate water includes:
Irrigation: generally safe to use without treatment, if used as surface irrigation;
Cooling towers: treatment is needed;
Water for decorative ponds or fountains: treatment is needed;
Toilet and urinal flushing: treatment is needed;
Rainwater recycle system: condensate can be a source to feed the system; and
55 Boulware, B. Environmental leader magazine. Air Conditioning Condensate Recovery, January 15, 2013.

WATER EFFICIENCY MEASURES
© International Finance Corporation 2019. All rights reserved. EDGE User Guide 219
Laundry and washing: biocide treatment required.
Condensate can be a constant source of water if the HVAC system is in use. It can generate between 11 to 40
liters/day per 100m² of conditioned space56, depending on the HVAC system type and operation.
Collected water must be in accordance with local or international health and sanitary code requirements
(whichever are more stringent).
Relationship to Other Measures
Claiming this measure reduces the water demand for the kitchen (dishwasher, rinse valve and faucets),
bathroom faucets, the HVAC system and “Other” Water use, which is mainly cleaning.
Assumptions
The base case assumes there is no condensate water recovery from HVAC, while the improved case assumes
that all condensate water generated from the HVAC system is recovered.
Compliance Guidance
To demonstrate compliance, the design team must provide documentation to support the claims.
Design Stage Post-Construction Stage
At the design stage, the following must be used to
demonstrate compliance:
Calculations for condensate water recovery
specifying cooling load and water collected in
liters per day; and
Hydraulic layout drawings showing the location of
the recovery, collection and reuse technology.
At the post-construction stage, the following must be
used to demonstrate compliance:
As-built hydraulic drawings with the location of the
recovery, collection and reuse technology; and
Photographs of installed equipment related to the
system.
56 Alliance for Water Efficiency website. http://www.allianceforwaterefficiency.org/condensate_water_introduction.aspx

WATER EFFICIENCY MEASURES
© International Finance Corporation 2019. All rights reserved. EDGE User Guide 220
W11 – WATER-EFFICIENT LANDSCAPING
Corresponds to HTW11, RTW07, HSW09, EDW08
Requirement Summary
This measure can be claimed if water-efficient landscaping is incorporated within the building. The water-
efficient landscaping measure can be claimed if less than 4 liters of water (excluding rainwater) will be used on
average per square meter of landscaping per day.
Intention
Water-efficient outdoor landscaped areas can reduce the use of fresh water from the municipal supply, as well
as fertilizers and maintenance cost, while preserving the habitat of plants and wildlife.
Approach/Methodologies
This measure can only be claimed if the outdoor landscaping areas, including lawns, gardens and ponds, will use
less than 4 liters of water (excluding rainwater) per square meter a day throughout the year. This can be
achieved by replacing the areas planted with water-intensive plants with native and adaptive plants. Detailed
guidance for selecting water-efficient plants according to the local climate would normally be carried out by the
landscape designer or the supplier of the plants. However, the following can be used as a rough guide:
Outdoor landscaping water consumption, including for lawns, gardens and ponds, is calculated as:
𝐿𝑎𝑛𝑑𝑠𝑐𝑎𝑝𝑒 𝑊𝑎𝑡𝑒𝑟 𝑐𝑜𝑛𝑠𝑢𝑚𝑝𝑡𝑖𝑜𝑛 =𝐿𝑎𝑛𝑑𝑠𝑐𝑎𝑝𝑒 𝑊𝑎𝑡𝑒𝑟 𝑅𝑒𝑞𝑢𝑖𝑟𝑒𝑚𝑒𝑛𝑡𝑠 − 𝑅𝑎𝑖𝑛𝑓𝑎𝑙𝑙 𝑉𝑜𝑙𝑢𝑚𝑒
𝑇𝑜𝑡𝑎𝑙 𝑂𝑢𝑡𝑑𝑜𝑜𝑟 𝐿𝑎𝑛𝑑𝑠𝑐𝑎𝑝𝑖𝑛𝑔 𝐴𝑟𝑒𝑎
Where: Landscape Water Requirements = Average amount of water needed per day for all the plants within the outdoor
landscaping area (in liters)
Rainfall Volume = Daily average annual rainfall (in liters)
Total Outdoor Landscaping Area = Area of outdoor lawns, gardens and ponds (m²)
Potential Technologies/Strategies
According to studies, “up to 50 percent of the water applied to lawns and gardens is not absorbed by the plants.
It is lost through evaporation, runoff or being pushed beyond the root zone because it is applied too quickly or
in excess of the plants’ needs.”57 To offset this, following are the main considerations when designing a water-
efficient landscaping area:
57 US Environmental Protection Agency. http://www.epa.gov/WaterSense/docs/water-efficient_landscaping_508.pdf

WATER EFFICIENCY MEASURES
© International Finance Corporation 2019. All rights reserved. EDGE User Guide 221
Use native and low water-using plants, as they require very little water beyond the local rainfall.
Create zones of vegetation according to their water requirements. In this way, less water is wasted in
irrigation as each zone is watered differently.
Use an appropriate irrigation system. For example, a drip irrigation or under surface system can help
reduce the water consumption compared to a sprinkler system.
Relationship to Other Measures
Claiming this measure reduces the water demand use for landscaping only.
Assumptions
The base case assumption is that 6 liters of fresh water per square meter a day is used on landscaping areas.
The improved case assumes that 4 liters per square meter a day is used in the landscaping area.
Compliance Guidance
Design Stage Post-Construction Stage
At the design stage, the following must be used to demonstrate
compliance:
A landscape plan showing the zoning for plants and the type of
plants used highlighting native species and the irrigation
system selected; and
Description of the water requirements use in landscaped areas;
or
Calculation of the landscape water consumption in
liters/m²/day.
At the post-construction stage, the
following must be used to demonstrate
compliance:
Photographs of the planted species,
landscaping area and irrigation system;
or
Purchase receipt and delivery note for
the plants and vegetation.

WATER EFFICIENCY MEASURES
© International Finance Corporation 2019. All rights reserved. EDGE User Guide 222
W12 – SWIMMING POOL COVER
Corresponds to HTW12, EDW09
Requirement Summary
This measure can be claimed if the building has pool(s) and these are fitted with a cover to prevent water and
heat losses through evaporation.
Intention
Water and heat are lost through evaporation from the surface of the pool. The use of a cover for the entire
pool(s) can reduce the use of fresh water from the municipal supply as well as energy for heating the pool.
A pool cover can also protect the pool from debris contamination, which reduces the use of chemicals and
maintenance. A pool cover can provide shade in hot climates. For a heated pool in cold climates, a pool cover
prevents heat loss during the night or when the pool is not in use; a transparent cover outdoors can also
provide heat gain while reducing heat loss.
Approach/Methodologies
This measure can only be claimed if all the pools including outdoor and indoor pools have a suitable cover fitted
to the entire pool surface. A suitable cover will include the following characteristics:
- Resistance to pool treatment chemicals and UV light;
- Thick and durable material;
- Insulation properties;
- Fully fitted to the pool;
- Easy to store and utilize; and
- Safe for both pool users and staff.
Potential Technologies/Strategies
Most pools lose water due to evaporation from the surface. Heat loss from pools occurs at the surface mostly
due to evaporation, but also from radiation to the sky. These issues can easily be addressed with an affordable
solution such as a pool cover. Pool covers have the following benefits:
Benefits Description
Reduced water consumption
Surface water from a pool evaporates to the atmosphere. A pool cover for times when the pool is not in use can reduce the evaporation rate up to 98%, thus reducing the use of water to re-fill the pool.
Reduced energy consumption
In heated pools, a pool cover can be used both at daytime and nighttime to save energy, as it can gain heat as well as prevent heat losses. Standard pool temperature can rise by up to 4ºC (especially in dry and cold environments), if short-wave radiation from the sun passes through a transparent cover and heats the surface of the pool.

WATER EFFICIENCY MEASURES
© International Finance Corporation 2019. All rights reserved. EDGE User Guide 223
Then at night, when there is no heat gain, the cover retains the heat by reducing long-wave radiant heat losses and the evaporation rate.
Reduced chemicals consumption
When the pool is covered, it is protected from debris (leaves, twigs and litter) contamination and therefore requires less chemical (chlorine) to clean up the pool. In addition, chemicals are not dispersed to the atmosphere due to the reduction of the evaporation rate.
Reduced need of mechanical ventilation (halls)
If evaporation is prevented when the pool cover is in place, then less mechanical ventilation is required in enclosed pool halls. In addition, dehumidifiers can be shut-off during off hours. These two factors reduce the energy consumption from the mechanical ventilation system.
Reduced maintenance
Both building and pool maintenance are reduced. This is because the reduction of humidity and condensation when the pool cover is in place lessens the maintenance to prevent mold on the building structure (especially in pool halls). In addition, pool maintenance is also lessened as chemicals are saved and debris contamination is avoided.
Relationship to Other Measures
This measure does not impact other measures.
Assumptions
The base case assumption is that the pool does not have a fitted cover. The improved case assumes that a pool
cover is adequately fitted and that the cover reduces the evaporation rate, therefore 30% of water is saved
each time that the pool is refilled.
Compliance Guidance
Design Stage Post-Construction Stage
At the design stage, the following must be used to
demonstrate compliance:
Sizing calculations and manufacturer’s data sheet
for a pool cover that fits the whole pool.
At the post-construction stage, the following must be
used to demonstrate compliance:
Photographs of the installed pool cover; or
Purchase receipt and delivery note for the pool
cover.

WATER EFFICIENCY MEASURES
© International Finance Corporation 2019. All rights reserved. EDGE User Guide 224
W13 – RAINWATER HARVESTING SYSTEM
Corresponds to HMW06, HTW14, RTW09, OFW06, HSW11, EDW07
Requirement Summary
This measure can be claimed if a rainwater collection system is installed to supply water for use within the
project. This water must be re-used on the project site to replace water consumption from the municipal water
supply. End uses may include flushing toilets, the HVAC system, cleaning the building, or irrigation of
landscaping.
Intention
A rainwater harvesting system can reduce the use of fresh water from the municipal supply.
Approach/Methodologies
To qualify, the collected rainwater must be re-used on the project site, and demonstrate that it replaces
municipal water supply. The project team must document both the need for municipal water supply for the end-
use being served, and the fact that the collected rainwater is being directed to replace it. For example, the team
could submit pictures that show the planned piping system connected to an irrigation system. This would ensure
that the system is reducing municipal water use.
EDGE automatically calculates the approximate maximum quantity of water that can be collected by a rainwater
harvesting system using rainfall data from the project location and the size of the roof area. Although the
default assumption is that the roof will serve as the rainwater collection system, a rainwater collection system
located on the grounds of the project is just as acceptable provided it is properly sized.
Detailed guidance for sizing a rainwater collection system is available on the worldwide web and would normally
be carried out by the supplier of the system. However, the following can be used as a rough guide:
𝑅𝑎𝑖𝑛𝑤𝑎𝑡𝑒𝑟 𝐻𝑎𝑟𝑣𝑒𝑠𝑡𝑖𝑛𝑔 (𝑚3) = (𝐶𝑎𝑡𝑐ℎ𝑚𝑒𝑛𝑡 𝐴𝑟𝑒𝑎 ∗ 𝑅𝑎𝑖𝑛𝑓𝑎𝑙𝑙 𝑉𝑜𝑙𝑢𝑚𝑒 ∗ 𝑅𝑢𝑛 𝑜𝑓𝑓 𝐶𝑜𝑒𝑓𝑓𝑖𝑐𝑖𝑒𝑛𝑡/1000)
Where: Catchment Area = area of rooftop or hardscape (m²).
Rainfall volume = average annual rainfall (mm), also called “amount potential”
Run-off coefficient = varies depending on the surface type. some examples are as follows:
Metal roof - 0.95, Concrete/asphalt roof - 0.90, Gravel roof - 0.80
If hardscape is included, it can also be expressed as a percentage of the roof area. For example, if a building
has a 1000 m2 roof and another 500 m2 serving as rainwater catchment area, the EDGE input for % of Roof
Area used can be 150%.
WATER EFFICIENCY MEASURES
© International Finance Corporation 2019. All rights reserved. EDGE User Guide 225
Potential Technologies/Strategies
The main consideration when designing a rainwater harvesting system is adequate sizing of the storage tank.
The supplier/designer of the system must be able to advise on appropriate sizing, but the two key factors to
consider when sizing the tank are the rate of supply (local rainfall data and collection area) and the demand
(water use per day).
When harvesting the rain water, a dual piping system must be used to separate the rain water from the mains
and to distribute the collected water for use at the project site (such as flushing toilets, the washing machine or
showers).
Collected water must be in accordance with local or international health and sanitary code requirements
(whichever are more stringent).
Relationship to Other Measures
Claiming this measure reduces the water demand for all uses considered by EDGE.
Assumptions
The base case assumption is that no rainwater is harvested. The improved case assumes that the rainwater
harvesting system is adequately sized and that the rainwater collected is used internally for such purposes as
flushing toilets and showers. When this measure is claimed, dual piping is required to avoid cross-contamination
of water.
Compliance Guidance
Design Stage Post-Construction Stage
At the design stage, the following must be used to
demonstrate compliance:
A system schematic showing the collection area,
feed pipes and storage tank; and
Sizing calculations for the rainwater harvesting
system.
At the post-construction stage, the following must be
used to demonstrate compliance:
Photographs of the installed rainwater harvesting
system and dual piping; or
Purchase receipt and delivery note for the rainwater
harvesting/storage system.
EDGE assumes that the rainwater is being used within the building. If the rainwater is being used only to
irrigate the landscape, the project team must demonstrate that (1) there is need for irrigation with municipal
water (in addition to just natural rainwater) and (2) that the recycled water will be directed to this use. This can
be done with drawings of the plumbing layout at the design stage, and with pictures that show the planned
piping system connected to the irrigation system at the post-construction stage.

WATER EFFICIENCY MEASURES
© International Finance Corporation 2019. All rights reserved. EDGE User Guide 226
W14 – GREY WATER TREATMENT AND RECYCLING SYSTEM
Corresponds to HMW07, HTW15, RTW10, OFW07, HSW12, EDW10
Requirement Summary
This measure can be claimed if there is a grey water recycling system that treats the waste water from the
building, except the waste water from toilet flushing and kitchen sinks. This recycled water must be re-used on
the project site to replace water consumption from the municipal water supply. End uses may include flushing
toilets, the HVAC system, cleaning the building, or irrigation of landscaping.
Intention
By recycling the grey water, the use of fresh water from the municipal supply can be reduced. The load on the
local water and sewage infrastructure is also reduced.
Approach/Methodologies
EDGE assumes that the recycled greywater will be used for flushing toilets. When this measure is claimed, EDGE
automatically calculates the potential supply and reduces the municipal water demand for flushing toilets by
that amount. EDGE assumes that wastewater from the building is collected and stored in sufficient quantities to
meet the demand for flushing toilets. If the quantity of treated grey water is insufficient, then only a portion of
the demand is shown to be met by the treated water.
A water balance model can be produced by the design team to demonstrate the potential for water recycling.
The recycled water must be reused for flushing toilets, with the remainder directed towards other uses. Where
this water is not used for toilet flushing, the project must provide additional documentation that the system is
indeed replacing municipal water supply. For example, if the recycled water is being used for irrigation only,
then the project must demonstrate that (a) the landscaped area requires municipal water (in addition to just
natural rainwater), and (b) the system is designed to serve the landscape, thus replacing water from the
municipal supply. This can be done with drawings of the plumbing layout at the design stage, and with pictures
that show the planned piping system connected to the irrigation system at the post-construction stage.
Potential Technologies/Strategies
When recycling the water, a dual piping system must be used to separate the recycled water from the mains.
Treated water must be in accordance with local or international health and sanitary code requirements
(whichever is more stringent).
In some cases, the grey water treatment plant can be centralized for a combination of buildings within the
development. In these cases, the central plant must fall within the site boundary of the project, or managed by
a company within the control of the site owner. This is to ensure continuity of sustainable management and
future access to the system for maintenance.

WATER EFFICIENCY MEASURES
© International Finance Corporation 2019. All rights reserved. EDGE User Guide 227
However, when the grey water treatment plant is located off-site, then a contract with the management
company in charge of water treatment must be provided as part of the documentation at the post-construction
stage.
Some jurisdictions may not permit the use of grey water in buildings for flushing; in such cases this measure
cannot be claimed.
Relationship to Other Measures
The quantity of wastewater available depends on the efficiency of water fittings; more water-efficient buildings
may have insufficient water available to completely offset the demand for flushing. This measure has an impact
on “Other” Energy uses in the energy chart as water pumps required for operation of the system are included in
in that category.
Assumptions
The base case assumes that there is no grey water recycling. The improved case assumes that grey water from
the washbasins is reused in the building for flushing water closets.
Compliance Guidance
Design Stage Post-Construction Stage
At the design stage, the following must be used to
demonstrate compliance:
A system schematic showing the plumbing layout
including the dual plumbing lines; and
Manufacturer’s data sheet of the specified grey water
treatment plant; and
Calculations including the following:
o Designed capacity of the grey water treatment system
in m3/day.
o Quantity of grey water available daily to recycle in
liters/day.
o Efficiency of the grey water system to produce treated
water in liters/day.
o Water balance chart.
At the post-construction stage, the following
must be used to demonstrate compliance:
Date stamped photographs of the installed
system; and
Purchase receipt and delivery note for the
water treatment and storage system; or
Updated calculations or specifications if
necessary; and/or
Contract with the management company if
the system is centralized or off-site.

WATER EFFICIENCY MEASURES
© International Finance Corporation 2019. All rights reserved. EDGE User Guide 228
W15 – BLACK WATER TREATMENT AND RECYCLING SYSTEM
Corresponds to HMW08, HTW16, RTW11, OFW08, HSW13, EDW11
Requirement Summary
This measure can be claimed if there is a black water recycling system that treats all the wastewater produced
from all internal uses including from the toilets and kitchen. This recycled water must be reused on the project
site. End uses may include flushing toilets, the HVAC system, cleaning the building, or irrigation of landscaping.
Intention
To reduce the use of water from the municipal supply and reduction of load on the local water and sewage
infrastructure, a black water recycling system can be used.
Approach/Methodologies
When this measure is claimed, EDGE automatically calculates the potential supply of black water from the
building and applies a reduction in municipal water demand across the end uses that can benefit from it. These
include flushing toilets, cleaning of the building, the HVAC system, and irrigation of landscaping. The EDGE
software assumes that most of the black wastewater from the building is collected, treated and stored properly
to meet ongoing demand. If the quantity of treated black water is insufficient, then only a portion of the
demand is shown to be met by the treated water.
A water balance model must be produced by the design team to demonstrate the potential for water recycling.
The recycled water must be reused for flushing toilets, with the remainder directed towards other uses. Where
this water is not used for toilet flushing, the project must provide additional documentation that the system is
indeed replacing municipal water supply. For example, if the recycled water is being used for irrigation only,
then the project must demonstrate that (a) the landscaped area requires municipal water (in addition to just
natural rainwater), and (b) the system is designed to serve the landscape, thus replacing water from the
municipal supply. This can be done with drawings of the plumbing layout at the design stage, and with pictures
that show the planned piping system connected to the irrigation system at the post-construction stage.
Grey water is included in black water, so there are no additional savings from a grey water system when a black
water system is selected.
Potential Technologies/Strategies
Treated water must be in accordance with local or international health and sanitary code requirements
(whichever is more stringent).
When recycling the water, a dual piping system must be used to separate the recycled water from the main.
In some cases, the black water treatment plant could be centralized for a combination of buildings within the
development. In these cases, the central plant must fall within the site boundary of the project, or be managed

WATER EFFICIENCY MEASURES
© International Finance Corporation 2019. All rights reserved. EDGE User Guide 229
by a company within the control of the site owner. This is to ensure continuity of sustainable management and
future access to the system for maintenance.
If the black water treatment plant is located off-site, then a contract with the management company in charge
of the water treatment must be provided as part of the documentation at the post-construction stage.
Some jurisdictions may not permit the use of recycled black water; in such cases this measure cannot be
claimed.
Relationship to Other Measures
This measure affects the building energy use because the energy use of the water pumps required for the
operation of the system is included in “Other” Energy use.
Assumptions
The base case assumes that there is no black water harvesting. The improved case assumes that all black water
is re-used in the building for flushing water closets and urinals, landscaping, the HVAC system and cleaning
(“Other”).
Compliance Guidance
Design Stage Post-Construction Stage
At the design stage, the following must be used to
demonstrate compliance:
A system schematic showing the plumbing layout including
the dual plumbing lines; and
Manufacturer’s data sheet of the specified black water
treatment plant; or
Calculations including the following:
o Designed capacity of the black water treatment system
in m3/day.
o Quantity of black water available daily to recycle in
liters/day.
o Efficiency of the black water system to produce treated
water in liters/day.
o Water balance chart.
At the post-construction stage, the following
must be used to demonstrate compliance:
Photographs of the installed system; and
Updated calculations or specifications if
necessary; or
Purchase receipt and delivery note for the
water treatment and storage system;
and/or
Contract with the management company if
the system is centralized or off-site.

MATERIALS EFFICIENCY MEASURES
© International Finance Corporation 2019. All rights reserved. EDGE User Guide 230
MATERIALS EFFICIENCY MEASURES
Materials efficiency is one of the three main resource categories that comprise the EDGE standard. To comply
for certification purposes, the design and construction team must review the requirements for selected
measures as indicated and provide the information.
The following pages explain each materials efficiency measure by relaying the intention, approach, assumptions
and compliance guidance requirements. For a more detailed view of the embodied energy and images for the
material options included in the Potential Technologies, see the companion reference guide called the EDGE
Materials Reference Guide.
The Materials section includes Efficiency Measures for the following building elements: floor slabs, roof
construction, external walls, internal walls, flooring, window frames, roof insulation and wall insulation.
Structural elements are not included within this section because the structure should be designed as per safety
and other engineering considerations and will not be altered. Structural engineers might consider lower
embodied energy structures; however, EDGE excludes the structure from all embodied energy calculations. The
main reason is to avoid any potential impact on the integrity of structural design considerations.
In addition to the selection of materials, the thickness can be specified for some elements in this section.
However, changing these thickness values does not influence the building size or internal floor areas. For
example, if the floor slab thickness is changed from 200mm to 500mm, the default volume and height of the
room will be maintained in the calculations for other aspects, such as energy.
All materials measures marked with an asterisk (*) on the measure name such as HMM01* must be specified as
per actual building conditions. For building elements where more than one material may be selected, a second
predominant material that covers more than 25% of the area can optionally be indicated and marked with its
percentage (%) area in the total project. Any additional materials beyond the first two must be represented by
one of the two selected materials that is nearest to it in embodied energy. For projects being modeled with
multiple EDGE models, the preferred method is to calculate the average distribution of materials over the entire
project and use the same selections and percentage (%) figures across all models.
Figure 23. Screenshot of Materials saving measures in EDGE for Hospitality

MATERIALS EFFICIENCY MEASURES
© International Finance Corporation 2019. All rights reserved. EDGE User Guide 231
EDGE provides default embodied energy values for the materials based on the EDGE Emerging Economies
Construction Dataset (the EDGE Materials Embodied Energy methodology report is available on the EDGE
website). Embodied energy values can vary widely based on the assumptions made; using a standardized
dataset ensures that each material is evaluated following the same methodology for a fair comparison in EDGE.
To ensure consistency, EDGE does not allow the addition of a custom material.

MATERIALS EFFICIENCY MEASURES
© International Finance Corporation 2019. All rights reserved. EDGE User Guide 232
M01* – FLOOR SLABS
Corresponds to HMM01, HTM01, RTM01, OFM01, HSM01, EDM01
Intention
The intent is to reduce the embodied energy in the building by specifying a floor slab with lower embodied
energy than a typical floor slab. The floor slab specification matching the actual building design must be entered
in the software.
Approach/Methodologies
The design team must select the specification that most closely resembles the floor slab specified, and enter the
thickness and steel rebar content, which are requirements of EDGE. Where there are multiple specifications, the
predominant specification must be selected. A second predominant material that covers more than 25% of the
area can optionally be indicated and marked with its percentage (%) area in the total project.
The specification for the floor slab must be that of the intermediary floor and not the ground floor, as the
ground floor slab is often dictated by the ground conditions. The thickness must only include the structural slab.
Do not include the thickness of the concrete used to level the floor slab for the finished flooring; this layer of
screed is included in the embodied energy of the Flooring (EDM05).
Potential Technologies/Strategies
Following is a list of the floor slab options included in EDGE. The user must always try to select the specification
that most closely resembles that of the building design.
In-Situ Reinforced
Concrete Slab
One of the most popular and conventional floor slab construction types, this floor
slab uses Portland cement, sand, aggregate, water and reinforcing steel.
In-Situ Concrete with
>25% GGBS
Same as above, but with >25% Portland cement replaced on a one-to-one basis
by weight with ground granulated blast furnace slag (GGBS), a by-product of iron
and steel manufacturing processes. Replacement levels of GGBS vary from 30% to
up to 85% as applicable. Typically, 40% to 50% of GGBS is used.
In-Situ Concrete with
>30% PFA
Same as above, but with >30% Portland cement replaced by pulverized fuel ash
(PFA), also known as fly ash, a waste product of coal fired at power stations. Using
PFA as a cement replacement significantly reduces the overall carbon footprint of
the concrete construction and helps to reduce risk of air and water pollution. In
the promotion of environmental sustainability, PFA usage is one of the most highly
recommended construction practices.

MATERIALS EFFICIENCY MEASURES
© International Finance Corporation 2019. All rights reserved. EDGE User Guide 233
Concrete Filler Slab Filler slab construction is technology based on the principal of using filler materials
such as brick, clay tiles and cellular concrete blocks instead of concrete. The filler
materials are used in the lower tensile region of the slab, which needs only enough
concrete to hold the steel reinforcement together.
Filler slab uses less concrete as well as steel due to the lightweight quality of the
slab. It is also more cost-effective compared to conventional in-situ reinforced
concrete slab.
Precast RC Planks and
Joist System
This system uses precast concrete elements to construct intermediate floors and
consists of (1) the plank, which represents smaller sections of the slab and is
therefore of reduced thickness and reinforcement, and (2) the joist, which is a
beam spanning across the room to provide a bearing for the planks. The planks
are supported over partially precast RC joists which are set side by side and then
joined together by pouring in-situ concrete over the entire roofing area. The
monolithic action of the slab elements is enhanced by leaving reinforcement hooks
projecting out of the joists and providing nominal reinforcement over the planks,
before the in-situ concrete is poured. This method of construction saves time. Both
elements of the floor – planks and joists – can also be manually produced at the
site using wooden moulds.
Concrete Filler Slab with
Polystyrene Blocks
This system is similar to concrete filler slab technology in that one of the aims is to
reduce the volume of concrete required, which is more cost-effective compared to
conventional in-situ reinforced concrete slab. It is comprised of precast concrete
beams, a polystyrene form which then stays in place in the lower tensile region of
the slab, and in-situ concrete. This system can be installed with or without
insulation. Adding insulation to the floor slabs when they are exposed to outdoor
or unconditioned area helps to improve thermal performance for heat gain and
loss. If Concrete Beam Vault with Insulation is selected, then the embodied energy
due to the insulation is added to the floor slab in the Materials chart and not to the
chart’s insulation section.
In-Situ Trough Concrete
Slab
This system is similar to concrete filler slab technology in that one of the aims is to
reduce the volume of concrete required, which makes it more cost-effective
compared to conventional in-situ reinforced concrete slab. It is comprised of in-
situ concrete troughs formed using removable void formers cast into the lower
tensile region of the slab. The void formers are removed on completion.
In-situ Waffle Concrete
Slab
Same as above, except it is comprised of in-situ concrete waffles, instead of
troughs, formed using removable void formers.
Hollow Core Precast
Slab
Hollow-core floor planks are precast concrete elements with continuous
longitudinal voids providing an efficient lightweight section. When grouted, the
effective shear key between adjacent hollow-core planks ensures that the system
behaves similarly to a monolithic slab. Hollow-core planks may be used to produce
a diaphragm to resist horizontal forces, either with or without a structural topping.

MATERIALS EFFICIENCY MEASURES
© International Finance Corporation 2019. All rights reserved. EDGE User Guide 234
Hollow-core planks, supported on masonry or steel can be used in domestic,
commercial and industrial applications.
Composite Slim Floor
Slabs with Steel I-
beams
A slim floor is a system of precast, hollow core concrete units or deep composite
steel decking supported on modified steel beams in the form of an asymmetric
section with a wider bottom flange or a flat steel plate welded to the bottom flange
of a standard UKC section. The beam becomes partially encased within the floor
depth, resulting in a structural system with no down-stand beams, which leads to
reduced floor-to-floor heights. The floor slab supports in-situ concrete that is
placed level with (or above) the top flange of the beam.
Composite In-situ
Concrete and Steel Deck
(Permanent Shuttering)
Composite slabs comprised of reinforced concrete cast on top of profiled steel
decking acts as formwork during construction and external reinforcement at the
final stage. Additional reinforcing bars may be placed in the decking troughs,
particularly for deep decking. They are sometimes required in shallow decking
when heavy loads are combined with high periods of fire resistance.
Precast Concrete
Double Tee Floor Units
Double tee units reduce the number of pieces to erect and minimize the number of
connections between beams and columns. Double tees provide a safe,
unobstructed work platform, immediately after erection, that is usable for light
construction loads. Reinforced, cast-in-place concrete topping over the double tees
provides a leveling course, proper drainage slopes and a structural floor
diaphragm.
Thin Precast Concrete
Deck and Composite In-
situ Slab
The most common type of composite beam is one where a composite slab sits on
top of a downstand beam, connected by a through deck welded shear studs. This
form of construction offers advantages: the decking acts as external reinforcement
at the composite stage, and during the construction stage as formwork and a
working platform. It may also provide lateral restraint to the beams during
construction. The decking is lifted into place in bundles, which are then distributed
across the floor area by hand. This dramatically reduces the crane lifts when
compared with a precast based alternative.
Timber Floor
Construction
Timber floor construction is generally supported on timber joists. These joists are
rectangular sections of solid timber spaced at regular intervals, built into the
external wall. The covering to the floor is generally timber floorboards or sheet
chipboard. The finish to the underside is generally sheet plasterboard. Joist
hangers have become very common as the method of supporting the joist,
avoiding building joists into walls. These are formed from galvanized steel and
effectively form a shoe or seat for the joist to fit into, which is then built into the
wall. They are also very useful for junctions between joists where previously a
complicated carpentry joint would have been required.

MATERIALS EFFICIENCY MEASURES
© International Finance Corporation 2019. All rights reserved. EDGE User Guide 235
Light Gauge Steel Floor
Cassette
Pre-assembled sheet steel floor cassettes are manufactured off-site to stringent
factory tolerances and can be bolted into the structure as a complete unit,
providing a secure platform that can take a load straight away. This significantly
speeds up the building process and ensures precise accuracy.
Re-use of Existing Floor
Slab
Re-using an existing material avoids the use, and therefore embodied energy, of
new materials. The re-use of the existing materials option in EDGE is highly
desirable and is assigned an embodied energy value of zero. The material must be
verifiably more than five years old to be classified as re-used. The material does
not have to have been sourced from the project site.
Relationship to Other Measures
The contribution that the measure makes to the overall performance is not affected by any other measure.
Assumptions
The base case assumption is that the floor is constructed of a 200mm in-situ reinforced concrete slab.
Compliance Guidance
Design Stage Post-Construction Stage
At the design stage, the following must be used to
demonstrate compliance:
Floor sections showing build-up of the floor; or
Manufacturer’s data sheet for specified building
material if applicable; or
Bill of quantities with the floor slab specification
clearly highlighted.
At the post-construction stage, the following must be
used to demonstrate compliance:
Date stamped photographs of floor slabs taken during
or after construction; and
Purchase receipt for the specified floor slab material;
or
Delivery notes.

MATERIALS EFFICIENCY MEASURES
© International Finance Corporation 2019. All rights reserved. EDGE User Guide 236
M02* – ROOF CONSTRUCTION
Corresponds to HMM02, HTM02, RTM02, OFM02, HSM02, EDM02
Intention
To select a roof specification with a lower embodied energy than the typical specification. The roof slab
specification matching the actual building design must be entered in the software.
Approach/Methodologies
The design team must select the specification that most closely resembles the roof specified, and enter the
thickness and steel rebar content, which are requirements of EDGE. Where there are multiple specifications the
predominant specification must be selected.
In the Energy tab, a weighted average must be used for specifications such as solar reflectivity and U-value.
This applies for green roofs as well. To specify a green roof, adjust these values in the Energy tab: (1)
reflectivity of the roof (use the default of 70% if actual value is not available) and (2) insulation of the roof (U-
value) to define the green roof condition. In the Materials tab, under roof insulation, select the insulation type
used in the roof assembly.
Potential Technologies/Strategies
The following is a list of specifications included in EDGE. The user should always try to select the specification
that most closely resembles that of the building design.
In-Situ Reinforced
Concrete Slab
One of the most popular and conventional of all roof construction types, in-situ
reinforced concrete slab uses Portland cement, sand, aggregate, water and
reinforcing steel.
In-Situ Concrete with
>25% GGBS
Ground granulated blast furnace slag (GGBS) is obtained by quenching molten iron
slag (a by-product of iron and steel making) from the blast furnace in water or
steam, producing a glassy, granular product which is then dried and ground into a
fine powder. The roof construction technology for GGBS is the same as for the in-
situ reinforced concrete slab but the Portland cement is directly replaced by
industrial waste (GGBS) on a one-to-one basis by weight. Replacement levels of
GGBS vary from 30% to up to 85% as applicable. In most instances, typically
40% to 50% of GGBS is used. Since the manufacture of Portland cement is energy
intensive, replacing it with GGBS helps to reduce high-embodied energy content.
Using GGBS also helps to reduce air and water pollution, leading to a more
sustainable slab construction practice.
In-Situ Concrete with
>30% PFA
Pulverized fuel ash (PFA), also known as fly ash, is a waste product of coal fired
power stations. Using PFA as a cement replacement significantly reduces the
overall carbon footprint of the concrete construction and helps to reduce risk of air

MATERIALS EFFICIENCY MEASURES
© International Finance Corporation 2019. All rights reserved. EDGE User Guide 237
and water pollution. In the promotion of environmental sustainability, PFA usage is
one of the most highly recommended construction practices.
Concrete Filler Slab
Filler slab construction is technology based on the principal of using filler materials
such as brick, clay tiles and cellular concrete blocks instead of concrete. The filler
materials are used in the lower tensile region of the slab, which needs only enough
concrete to hold the steel reinforcement together.
Precast RC Planks and
Joist System
This system uses precast concrete elements to construct a roof and consists of two
elements:
The plank, which represents smaller sections of the slab and is therefore of
reduced thickness and reinforcement, and
The joist, which is a beam spanning across the room to provide a bearing for the
planks. The joist is partially precast, with the remaining portion being cast in-situ
after the planks are installed.
The monolithic action of the slab elements is enhanced by leaving reinforcement
hooks projecting out of the joists and providing nominal reinforcement over the
planks, before the in-situ concrete is poured. The planks are supported over
partially precast RC joists which are set side by side and then joined together by
pouring in-situ concrete over the entire roofing area. Both elements of the roof –
planks and joists – can be manually produced at the site using wooden moulds.
This method of construction saves time.
Concrete Filler Slab with
Polystyrene Blocks
This system is similar to concrete filler slab technology in that one of the aims is to
reduce the volume of concrete required, which is more cost-effective compared to
conventional in-situ reinforced concrete slab. It is comprised of precast concrete
beams, a polystyrene form which then stays in place, in the lower tensile region of
the slab and in-situ concrete. This system can be installed with or without
insulation. Adding insulation to the roof slabs helps to improve thermal
performance for heat gain and loss. If Concrete Beam Vault with Insulation is
selected in the Materials section, the embodied energy due to the insulation is
added to the roof slab and not to the insulation.
In-Situ Trough Concrete
Slab
This system is similar to concrete filler slab technology in that one of the aims is to
reduce the volume of concrete required, which is more cost-effective compared to
conventional in-situ reinforced concrete slab. It is comprised of in-situ concrete
troughs formed using removable void formers cast into the lower tensile region of
the slab. The void formers are removed on completion.
In-Situ Waffle Concrete
Slab
Same as above, except it is comprised of in-situ concrete waffles, instead of
troughs, formed using removable void formers.
Hollow Core Precast
Slab
Hollow core planks are precast concrete elements with continuous longitudinal
voids providing an efficient lightweight section. When grouted, the effective shear
key between adjacent hollow core planks ensures that the individual planks
behave similarly to a monolithic slab. Hollow core planks may be used to produce

MATERIALS EFFICIENCY MEASURES
© International Finance Corporation 2019. All rights reserved. EDGE User Guide 238
a diaphragm to resist horizontal forces, either with or without a structural topping.
Hollow core planks, supported on masonry or steel, can be used in domestic,
commercial and industrial applications.
Composite Slim Slabs
with Steel I-beams
A slim roof beam is a modified steel section in the form of a rolled asymmetric
section (ASB beam) or a flat steel plate welded to the bottom flange of a standard
UKC section. The bottom plate supports the slab so that the beam is partially
encased within the slab depth, resulting in a structural system with no down-stand
beams, which leads to reduced floor-to-floor heights. The slab may be in the form
of precast, hollow core concrete units or deep composite steel decking, in both
cases supporting in-situ concrete that is placed level with (or above) the top
flange of the beam.
Composite In-situ
Concrete and Steel Deck
(Permanent Shuttering)
Composite slabs comprise reinforced concrete cast on top of profiled steel decking,
which acts as formwork during construction and external reinforcement at the final
stage. Additional reinforcing bars may be placed in the decking troughs,
particularly for deep decking. They are sometimes required in shallow decking
when heavy loads are combined with high periods of fire resistance.
Precast Concrete
Double Tee Roof Units
Combined beam/column frame units reduce the number of pieces to erect and
minimize the number of connections between beams and columns. Double tees
provide a safe, unobstructed work platform, immediately after erection, that is
usable for light construction loads. Reinforced, cast-in-place concrete topping over
the double tees provides a leveling course, proper drainage slopes and a structural
roof diaphragm.
Thin Precast Concrete
Deck and Composite In-
situ Slab
This construction technique utilizes a composite beam that is a structural beam
composed of different materials that are interconnected so that the beam
responds to loads as a unit. The most common type of composite beam is one
where a steel-concrete composite slab sits on top of a downstand beam,
connected by the use of through-deck welded shear studs. This form of
construction offers a number of advantages: the decking acts as external
reinforcement at the composite stage, and during the construction stage as
formwork and a working platform. It may also provide lateral restraint to the
beams during construction. The decking is lifted into place in bundles, which are
then distributed across the roof area by hand. This dramatically reduces the crane
lifts when compared with a precast alternative.
Brick Panel Roofing
System
A brick roofing panel is made of first-class bricks reinforced with two mild steel
bars of 6mm diameter. The joints between panels are filled with either 1:3 cement
sand mortar or M15 concrete. The panels can be made in any size, but are
typically 530mm x 900mm or 530mm x 1,200mm, depending on the
requirements. The recommended maximum length is 1,200 mm.
MATERIALS EFFICIENCY MEASURES
© International Finance Corporation 2019. All rights reserved. EDGE User Guide 239
Ferro Cement Roofing
Channels
Ferro cement is a thin layer of reinforced cement, made of layers of continuous
mesh covered on both sides with mortar. Ferro cement elements are durable,
versatile, light and waterproof. They are not good thermal insulators. A ferro
cement channel (FC) is a longitudinal element of a curved section (often semi-
cylindrical). It is precast using moulds. It uses less cement and steel but has the
same strength as RCC (reinforced cement concrete). This system is cheaper than
RCC. Although it is easy to learn and to manufacture, constant quality control is
needed during the manufacturing process.
Clay Roofing Tiles on
Steel Rafters
With this type of roof construction, clay tiles are laid on steel rafters. Steel rafters
ensure durability and strength but the embodied energy content of steel is higher
than that of timber rafters, which need maintenance but have less embodied
energy. EDGE estimates the embodied energy based on a thickness of 10mm for
the clay roofing tiles and 8mm for the steel or timber rafters.
Clay Roofing Tiles on
Timber Rafters
Same as above, except with timber rafters instead of steel rafters. Timber rafters
need maintenance but have less embodied energy than steel. Timber sourced from
a responsible forest management agency or from re-growth forests ensures the
protection and conservation of natural forest communities.
Micro Concrete Tiles on
Steel Rafters
Micro Concrete Roofing (MCR) Tiles are a cost-effective, aesthetic and durable
alternative sloping roof technology. They have less embodied energy content than
clay roof tiles and, as MCR tiles are lighter than other roofing tiles, they can be
laid on a lighter weight structure.
Micro Concrete Tiles on
Timber Rafters
Same as above, except on timber rafters.
Steel (Zinc or
Galvanized Iron) Sheets
on Steel Rafters
Zinc is a very dense and corrosion-resistant architectural material. It is non-
ferrous, thus not subject to rusting. Its manufacturing includes crushing the zinc
ore into particles, which are then concentrated by floatation. Then they are cast on
a continuously rotating cylinder and rolled through pressure rolls to a specified
thickness. They are often used as vertical cladding or on pitched roofs.
Corrugated zinc sheets are widely used for roofs as they are easy to install due to
being prefabricated; also, they are cheap and very light. The corrugations increase
the bending strength of the sheet in the direction perpendicular to the
corrugations, but not parallel to them.
Steel (Zinc or
Galvanized iron) Sheets
on Timber Rafters
Same as above, but on timber rafters.
Aluminium Sheets on
Steel Rafters
Besides steel, aluminum is the most commonly used metal in construction. It is
one of the lightest and easiest metals to manipulate, bend, shape, cast, fasten and
weld, and is also very ductile, often extruded into shapes for architectural
MATERIALS EFFICIENCY MEASURES
© International Finance Corporation 2019. All rights reserved. EDGE User Guide 240
purposes. It can easily be drilled, tapped, sawed, planed and filed with hand tools,
making it a yielding material for tradesmen to use. Aluminum has higher
resistance to corrosion than steel. However, disadvantages include higher cost and
embodied energy, greater thermal expansion, and lower fire resistance than steel.
Aluminium Sheets on
Timber Rafters
Same as above, but on timber rafters.
Copper Sheets on Steel
Rafters
When properly designed and installed, a copper roof provides an economical, long-
term roofing solution. Its low life cycle costs are attributable to the low
maintenance, long life and salvage value of copper. Unlike many other metal
roofing materials, copper requires no painting or finishing.
Copper Sheets on
Timber Rafters
Same as above, but on timber rafters.
Asphalt Shingles on
Steel Rafters
Asphalt shingles are an effective roof covering material for sloped roofs. They can
be successfully used on steeper pitches as well as moderately “low sloped” roofs
(less than 1:3 i.e.100mm of vertical rise for every 300mm of horizontal run, or
18.5°), providing a few special application procedures are followed for low slopes.
They should not be applied to roof slopes lower than 1:6.
Asphalt Shingles on
Timber Rafters
Same as above, but on timber rafters.
Aluminum-clad
Sandwich Panel
Sandwich panels provide a combination of high structural rigidity and low weight
and are used in a variety of applications. An aluminum-clad sandwich panel is
made of three layers: a low-density core with a thin skin-layer of aluminum
bonded to each side. The core may be empty or honeycombed and may contain
insulation.
Steel-clad Sandwich
Panel
Sandwich panels provide a combination of high structural rigidity and low weight
and are used in a variety of applications. A steel-clad sandwich panel is made of
three layers: a low-density core with a thin skin-layer of steel bonded to each
side. The core may be empty or honeycombed and may contain insulation. Steel is
stronger than aluminum, so there is less likelihood of the core being honeycombed
for strength.
Re-use of Existing Roof Re-using an existing material avoids the use, and therefore embodied energy, of
new materials. The re-use of existing materials option in EDGE is highly desirable
and assigned an embodied energy value of zero. The material must be verifiably
more than five years old to be classified as re-used. The material does not have to
have been sourced from the project site.

MATERIALS EFFICIENCY MEASURES
© International Finance Corporation 2019. All rights reserved. EDGE User Guide 241
Relationship to Other Measures
The selected roof specification will impact the thermal insulation of the roof surface, so the energy efficiency
could be adversely affected or improved by selecting different roof specifications.
Assumptions
The base case assumption is that the roof is constructed of a 200mm in-situ reinforced concrete slab.
Compliance Guidance
Design Stage Post-Construction Stage
At the design stage, the following must be used to
demonstrate compliance:
A section drawing of roof showing the materials and
thicknesses; or
Manufacturer’s data sheet for specified building
material; or
Bill of quantities with the materials used for roof
construction clearly highlighted.
At the post-construction stage, the following must be
used to demonstrate compliance:
Date stamped photograph of the roof taken during or
after construction; and
Purchase receipt for the building materials used for
roof construction; or
Delivery note for materials used for roof construction.

MATERIALS EFFICIENCY MEASURES
© International Finance Corporation 2019. All rights reserved. EDGE User Guide 242
M03* – EXTERNAL WALLS
Corresponds to HMM03, HTM03, RTM03, OFM03, HSM03, EDM03
Intention
To select an external wall specification with a lower embodied energy than the typical specification. The external
walls specification matching the actual building design must be entered in the software.
Approach/Methodologies
The design team must select the specification that most closely resembles the external walls specified, and
enter the thickness, which is a requirement of EDGE. Where there are multiple specifications the predominant
specification must be selected.
The external walls of the building are those directly exposed to the outdoor environment.
Potential Technologies/Strategies
The following is a list of the specifications included in EDGE. Only the broad wall types are described here; EDGE
does not include options on plaster or finishing. The user should always try to select the specification that most
resembles that of the building design.
Common Brick
Wall with Internal
& External Plaster
Common bricks, also known as fired clay bricks, are popular with builders as they are easily
available and inexpensive. However, because common bricks are fired at high temperatures,
normally achieved by the combustion of fossil fuels, they have high embodied energy.
Cored (with
Holes) Bricks with
Internal &
External Plaster
Cored clay blocks are made of fired clay and have a holed cross-section. The holed structure
means that there is less material per square meter of finished wall.
Honeycomb Clay
Blocks with
Internal &
External Plaster
Honeycomb clay blocks are made of fired clay and have a honeycombed cross-section. The
large size of the blocks enables rapid construction, and the honeycomb structure means
that there is less material per square meter of finished wall. The honeycomb structure leads
to improved thermal performance. Blocks can be customized. No mortar is needed in the
vertical joints due to a tongue and grooved edge, reducing mortar use by up to 40%. The
blocks are strong and have a high impact resistance. Honeycomb clay blocks have post-
consumer value if dismantled carefully.
Medium Weight
Hollow Concrete
Blocks
Hollow concrete blocks are lightweight and easier to handle than solid concrete blocks. The
lightness of the blocks helps in reducing the dead load of the masonry on the structure. The
voids also marginally improve the thermal insulation and sound insulation of the block. The

MATERIALS EFFICIENCY MEASURES
© International Finance Corporation 2019. All rights reserved. EDGE User Guide 243
larger size of the blocks (compared to conventional burnt clay bricks) also reduces the
number of mortar joints and the amount of cement mortar.
Solid Dense
Concrete Blocks
Solid dense concrete blocks can be used in virtually any part of a building. They provide
excellent sound insulation and their high strength makes them applicable for use in
structural walls. However, the use of virgin aggregates and sand can lead to land or marine
degradation and resource depletion, and the lack of supplementary materials in the cement
results in increased embodied energy.
Autoclaved
Aerated Concrete
Blocks
Aerated concrete is a versatile, lightweight building material. Compared to solid dense
concrete blocks, aerated concrete blocks have a lower density and excellent insulation
properties. They are durable and have good resistance to sulfate attack and damage by fire
and frost. Aerated concrete blocks are excellent thermal insulators.
Based on volume, the manufacture of aerated blocks typically uses 25% less energy than
other concrete blocks. They are lighter in weight which makes them easier to work with and
saves energy in transportation.
Fly-Ash Stabilized
Soil Blocks
Soil blocks have some inherent weaknesses that can be corrected using stabilization
materials like fly ash or ground granulated blast furnace slag (GGBFS).
Fly ash usually refers to industrial waste produced during coal combustion.
Compressed
Stabilized Earth
Blocks
Stabilized Compressed Earth Block (SCEB) technology offers a cost-effective and
environmentally-friendly alternative to conventional building materials. The blocks are fire-
resistant, provide better thermal insulation, and do not need to be fired, so they have a
lower embodied energy.
Ground
Granulated Blast
(GGBS) Stabilized
Soil Blocks
GGBFS is a by-product of the iron industry. The molten slag is cooled rapidly with water and
is then ground into a fine cementations powder. GGBFS can then be used as a cement
replacement in the blocks.
Rammed Earth
Blocks/Walls
Rammed earth walls are more commonly used in arid areas. They are constructed by the
compacting (ramming) of moistened subsoil into place between temporary formwork panels.
When dried, the result is a dense, hard monolithic wall. As an alternative, rammed earth
bricks are also available. The high moisture mass of rammed earth helps regulate humidity.
Precast Concrete
Panels
Precast concrete is a construction product made by casting concrete in a reusable molding
or “form” which is then cured in a controlled environment, transported to the construction
site, and lifted into place.
Precast cladding or curtain walls are the most common use of precast concrete for building
envelopes. These types of precast concrete panels do not transfer vertical loads but simply
enclose the space. They are only designed to resist wind, seismic forces generated by their
own weight, and forces requiring transferring the weight of the panel to the support.
Common cladding units include wall panels, window wall units, spandrels, mullions and
column covers. These units can usually be removed individually if necessary.
MATERIALS EFFICIENCY MEASURES
© International Finance Corporation 2019. All rights reserved. EDGE User Guide 244
In some cases, precast panels are used as formwork for cast-in-place concrete. The precast
panels act as a form, providing the visible aesthetics of the system, while the cast-in-place
portion provides the structural component.
Straw Bale Blocks
Straw bale blocks are a rapidly renewable building material made from the dry stalk left in
the earth after harvest, which is traditionally considered a waste product that is burned or
baled and sold for animal use. It is a natural, non-toxic building material with low
environmental impact and excellent insulation properties. Since it is very easy to work with
it is a good choice for amateur or unskilled self-builders.
Straw bale houses are finished and coated with cement stucco or earth-based plaster,
sealing the straw from the elements and giving long-lasting protection with little
maintenance. In contrast to the timber used for wood framing, straw can be grown in less
than a year in a completely sustainable production system. The conversion of straw into a
sustainable renewable resource to be used as a dominant building material could be
especially beneficial in areas where the climate is severe and timber is scarce, but straw is
plentiful.
Facing Brick and
Timber Stud
Timber stud walls are a light weight construction technique which reduces the dead load of
building and increases the pace of construction. Timber has relatively high embodied
energy. Timber for stud walls should be made from local forest-department-certified wood
or a forest-stewardship-council-certified wood, which helps to avoid the use of virgin wood
for building construction activities.
Phosphogypsum
Panel
Phosphogypsum is a waste product of the fertilizer industry. The use of phosphogypsum
board in buildings is a substitute for natural gypsum.
Ferrocement Wall
Panel
Ferrocement is a very simple construction of 2 to 5 layers of chicken wire over a frame
made from reinforcing bar, with cement forced into the gaps and in a layer over the chicken
wire reinforcing. The use of chicken wire makes ferrocement a very flexible building material
that is strongest when curved.
In-Situ Reinforced
Wall
More commonly used for floor slabs and roofs, in-situ reinforced concrete is also used to
construct external walls. It has a high embodied energy due to the inclusion of Portland
cement and uses sand, aggregate, water and reinforcing steel.
Cellular Light
Weight Concrete
Blocks
These blocks, which are environmentally friendly, are also called CLC blocks. The energy
consumed in the production is only a fraction compared to the production of clay bricks.
They are made from a slurry of cement, fly ash* and water, which is further mixed with the
addition of pre-formed stable foam in an ordinary concrete mixer under ambient conditions.
The addition of foam to the concrete mixture creates millions of tiny voids or cells in the
material, hence the name Cellular Concrete.
*Fly ash is a waste material from thermal power plants.

MATERIALS EFFICIENCY MEASURES
© International Finance Corporation 2019. All rights reserved. EDGE User Guide 245
Stone Blocks Limestone makes up about 10% of the total volume of all sedimentary rocks. Although
limestone is found widely, developers and designers should opt for local extracted stone to
reduce transport implications.
Limestone is readily available and relatively easy to cut into blocks in a quarry. It is also
long-lasting and stands up well to exposure, as it is hard, durable and commonly occurs in
easily accessible surface exposures. Because of its mass, it has a high thermal inertia.
However, limestone is a very heavy material, making it impractical for tall buildings, and
relatively expensive as a building material.
Stone Blocks –
Hand Cut
Same as above, except hand-cut and not polished. The embodied energy is in the extraction
process and heavy transportation loads.
Stone Blocks –
Machine Cut
Unpolished
Quarried stone, machine-cut and not polished. The quarried stone is typically of medium
hardness between limestone and granite. The embodied energy is in the extraction process
and cutting with a mechanized saw.
FaLG Block The Fly Ash-Lime-Gypsum blocks technology primarily uses industrial wastes such as fly ash
(from thermal power plants), lime gypsum (from fertilizer industries), and sand (optional) to
produce alternative walling materials. It reduces the environmental impacts associated with
disposal of these industrial wastes, as well as avoids the environmental impacts associated
with clay brick production, such as denudation of fertile topsoil. As the process for FAL-G
blocks does not require sintering, the amount of energy (fossil fuels) for production is
reduced.
The manufacturing process consists of three main stages:
- Mixing the materials: Fly ash is mixed with lime and gypsum. Chemical accelerator
may or may not be added to it.
- Pressing the mix in a machine: the mix is molded under pressure, also air/ sun
drying may be undertaken; and
- Curing the blocks for a stipulated period: the green block is water cured.
In the presence of moisture, fly ash reacts with lime at ordinary temperature and forms a
compound possessing cementations properties. After reactions between lime and fly ash,
calcium silicate hydrates are produced which are responsible for the high strength of the
compound.
Generally, FAL-G blocks are grey in color, solid and have plain rectangular faces with
parallel sides and sharp, straight and right-angled edges. They are used for the
development of infrastructure, construction of pavements, dams, tanks and under water
works.
Steel Profile
Cladding
Steel, one of the strongest and most affordable materials, is a ferrous metal, meaning it
contains iron. It has a favorable strength-to-weight ratio as well as provides elasticity. Other
benefits include stiffness and fire and corrosion resistance.
Steel wall cladding profiles create totally new economical solutions in both new building and
renovation and in operating and maintenance. The profiles are versatile cladding that comes

MATERIALS EFFICIENCY MEASURES
© International Finance Corporation 2019. All rights reserved. EDGE User Guide 246
in a very broad range of shapes, finishing and colors that enable innovative designs. In
addition, they can be installed with insulation for better thermal performance.
Aluminium Profile
Cladding
Beside steel, aluminum is the most commonly used metal in construction. It is one of the
lightest and easiest metals to manipulate, bend, shape, cast, fasten and weld, and is also
very ductile, often extruded into shapes for architectural purposes. It can easily be drilled,
tapped, sawed, planed and filed with hand tools, making it a yielding material for tradesmen
to use.
Aluminum is commonly used as wall cladding or curtain-walls, as its resistance to corrosion
is higher than steel, and lighter than other metals. However, the disadvantages are the
higher cost and embodied energy, greater thermal expansion, and lower fire resistance as
compared to steel.
Most exterior applications using aluminum alloys are anodized surfaces, which increases the
metal durability, traps dyes and adheres to other finishes. Plastic coatings, which are
applied electrostatically as a powder and then heat cured, are also used for cladding wall
panels. This coating gives a durable protection layer, with a more uniform appearance.
The finished appearance can range from clear to a wide variety of colors and textures,
depending on the coating applied. In addition, the panels can be installed with insulation for
better thermal performance.
Exposed Brick
Wall with Internal
Plaster
Same as brick wall, except with no external plaster. Common bricks are fired at high
temperatures, normally achieved by the combustion of fossil fuels, and therefore have high
embodied energy.
Exposed Cored
(with Holes)
Bricks with
Internal Plaster
Same as cored brick wall, except with no external plaster.
Facing Brick and
Hollow Concrete
Blocks
Facing bricks are bricks made of fired clay and used as the exterior face of a wall. Hollow
concrete blocks are used as the inner layer of the wall. They are lightweight and easier to
handle than solid concrete blocks. The lightness of the blocks helps in reducing the dead
load of the masonry on the structure. The voids also marginally improve the thermal
insulation and sound insulation of the block. The larger size of the blocks (compared to
conventional burnt clay bricks) also reduces the number of mortar joints and the amount of
cement mortar.
Facing Brick and
Solid Concrete
Blocks
Same as above, except with solid concrete blocks instead of hollow concrete blocks. Their
high strength makes them applicable for use in structural walls. However, the use of virgin
aggregates and sand can lead to land or marine degradation and resource depletion, and
the lack of supplementary materials in the cement results in increased embodied energy.
Polymeric Render
on Concrete Block
The exterior layer is made of polymeric render. Polymer render is a dry premixed polymer
and fiber-reinforced powder applied to precast concrete blocks. Requiring only a single coat,
polymer render is weather tight when cured, but will freely allow transmission of water

MATERIALS EFFICIENCY MEASURES
© International Finance Corporation 2019. All rights reserved. EDGE User Guide 247
vapor. The render is both breathable and flexible. Life expectancy is often in excess of 30
years. The inside layer is made of concrete blocks.
Polymeric Render
on Brick
Same as above, except the inner layer is brick. Because common bricks are fired at high
temperatures, normally achieved by the combustion of fossil fuels, they have high embodied
energy.
Precast Concrete
Sandwich Panel
Precast concrete sandwich panels comprise an outer leaf of precast concrete, an insulating
layer “sandwiched” in between, and an inner leaf of plain grey concrete with a power floated
finish. The panels may be attached to a steel frame as a cladding panel, or they can form
part of a precast structural frame where the inner leaf is load bearing and the external leaf
is connected to and supported off the internal leaf using ties. The ties used in the precast
structural frames are made of metal, plastic or epoxy and have low thermal conductivity to
eliminate cold bridging. The thickness of the insulation depends on the required U-value.
The shape, thickness and size of the concrete can be varied to meet the requirements of the
project.
Brick Faced
Precast Concrete
Sandwich Panel
Same as above, except an exterior brick face is attached to the precast concrete sandwich
panels.
Stone Faced
Precast Concrete
Sandwich Panel
Same as above, except an exterior stone face is attached to the precast concrete sandwich
panels.
Glass Fiber
Reinforced
Concrete Cladding
Glass fiber reinforced concrete (GFRC) is an alternative to pre-cast concrete for building
façades. Because of its strength, this type of cladding can be produced in thinner sections to
meet complex architectural specifications, and is three to five times lighter than standard
concrete. GFRC has excellent weather-proofing and fire-retardant qualities, and is more
water and pollution-proof than standard concrete. Glass reinforced concrete offers greater
versatility due to its superior compressive strength and flexibility. It is also easy to handle
and fast to erect and mount on support systems due to its light weight.
Stone Profile
Cladding
Stone profile cladding is a natural stone panel system consisting of Z-shaped interlocking
panels, stone corner pieces (quoins) and integrated fixing clips. All edges on both straight
and corner panels are made of hand-dressed stone. The stone cladding panel system uses
large (approx.) 600 x 200 mm panels which allows the use of larger pieces of stone to build
a panel, giving a natural appearance. It saves both time and money compared to traditional
stone masonry.
Cement Fibre
Boards on Metal
Studs
Cement fibre board used to clad buildings may also be referred to as “siding” or “ship lap
cladding.” It has the advantage of being more stable than wood through an extreme range
of weather conditions and it won’t rot, twist or warp. It is used to replace timber cladding in
new build and refurbishment projects. Boarding is often self-colored so it doesn’t need
painting. The board can be fixed to timber or steel studs, and is easily cut by scoring and
snapping external corners and edges.

MATERIALS EFFICIENCY MEASURES
© International Finance Corporation 2019. All rights reserved. EDGE User Guide 248
Cement Fibre
Boards on Timber
Studs
Same as above, except on timber studs instead of metal studs.
Timber
Weatherboard on
Timber Studs
Timber cladding can be used in many forms to achieve a wide variety of pattern, texture
and colors ranging from the use of shingles or shakes through to prefinished panels.
However, the most common form of timber cladding consists of boards laid vertically,
diagonally or horizontally with either overlapping or flush faces. Timber for stud walls should
be made from local forest-department-certified wood or a forest-stewardship-council-
certified wood.
UPVC
Weatherboard on
Timber Studs
Same as above, except with UPVC weatherboard instead of timber weatherboard. UPVC
(unplasticised polyvinyl chloride) is a tough, durable plastic. UPVC cladding looks similar to
timber cladding but usually has a thinner section as UPVC can be easily moulded. It can be
easier to work with UPVC than timber because it is manufactured with more accurate
dimensions, does not twist, warp or split and there are no knots in it.
Clay Tiles
Cladding (or
“Terracotta
Rainscreen
Cladding”) on
Metal Studs
Terracotta rainscreen tiles are fixed onto a steel or aluminum substructure. The
substructure is generally formed of vertical “T” support rails and adjustable brackets, or
brackets fixed along the horizontal axis of the support wall. Terracotta tiles are then
mounted on the substructure using self-tapping stainless steel screws or aluminum hollow
rivets, and held in place at four points with proprietary clips. Terracotta tiles are made of
clay fired at high temperatures, normally achieved by the combustion of fossil fuels, and
therefore have high embodied energy.
Plasterboards on
Timber Studs
Plasterboard is a form of wallboard manufactured using a core of gypsum plaster bonded to
layers of paper or fiberboard. It can be mounted on timber studs.
Plasterboards on
Metal Studs
Same as above, except mounted on metal studs instead of timber studs.
Curtain Walling
(Opaque Element)
A curtain wall is a vertical building enclosure which supports no load other than its own
weight and the environmental forces which act upon it. Curtain walls are not intended to
assist in maintaining the structural integrity of a building. Dead loads and live loads are thus
not intended to be transferred via the curtain wall to the foundations.
3-D Wire Panel
with “Shot-crete”
Both Sides
3D wire panel is a spatial structure consisting of the following elements:
• Welded reinforcing mesh of high wire diameter 3mm and a mesh size 50 × 50mm
• Diagonal wire (stainless or galvanized) wire of diameter 4mm
• Core of expanded polystyrene of thickness 50 - 120mm
• Concrete sprayed on the wire structure
Aluminum-clad
Sandwich Panel
Sandwich panels provide a combination of high structural rigidity and low weight and are
used in a variety of applications. An aluminum-clad sandwich panel is made of three layers:

MATERIALS EFFICIENCY MEASURES
© International Finance Corporation 2019. All rights reserved. EDGE User Guide 249
a low-density core with a thin skin-layer of aluminum bonded to each side. The core may be
empty or honeycombed and may contain insulation.
Steel-clad
Sandwich Panel
Sandwich panels provide a combination of high structural rigidity and low weight and are
used in a variety of applications. A steel-clad sandwich panel is made of three layers: a low-
density core with a thin skin-layer of steel bonded to each side. The core may be empty or
honeycombed and may contain insulation. Steel is stronger than aluminum, so there is less
likelihood of the core being honeycombed for strength.
Re-use of Existing
Wall
Re-using an existing material avoids the use, and therefore embodied energy, of new
materials. The re-use of existing materials option in EDGE is highly desirable and assigned
an embodied energy value of zero. The material must be verifiably more than five years old
to be classified as re-used. The material does not have to have been sourced from the
project site.
Relationship to Other Measures
The selected external wall specification will impact the thermal insulation of the external wall element, so the
energy efficiency could be adversely affected or improved by selecting different specifications.
Assumptions
The base case assumption is that the external wall is constructed of 200mm common bricks.
Compliance Guidance
Design Stage Post-Construction Stage
At the design stage, the following must be used to
demonstrate compliance:
Façade drawings clearly marking the external wall
specification selected; and
Drawings of the external wall sections; or
Manufacturer’s data sheet for specified building
material; or
Bill of quantities with the materials used for the
external wall clearly highlighted.
At the post-construction stage, the following must be
used to demonstrate compliance:
Date stamped photograph of the wall taken during or
after construction; and
Purchase receipt for the building materials used for
wall construction; or
Delivery note for materials used for wall construction.

MATERIALS EFFICIENCY MEASURES
© International Finance Corporation 2019. All rights reserved. EDGE User Guide 250
M04* – INTERNAL WALLS
Corresponds to HMM04, HTM04, RTM04, OFM04, HSM04, EDM04
Intention
To select an internal wall specification with a lower embodied energy than the typical specification. The internal
wall specifications matching the actual building design must be entered in the software in all cases.
Approach/Methodologies
The design team must select the specification from the drop-down list that most closely resembles the internal
walls specified, and enter the thickness, which is a requirement of EDGE. Where there are multiple
specifications the predominant specification must be selected.
Potential Technologies/Strategies
The following is a list of the specifications included in EDGE. Only the broad wall types are described here; EDGE
does not include options on plaster or finishing. The user must always try to select the specification that most
closely resembles that of the building design.
Common Brick Wall with
Plaster Both Sides
Common bricks, also known as fired clay bricks, are popular with builders as they
are easily available and inexpensive. However, because common bricks are fired at
high temperatures, normally achieved by the combustion of fossil fuels, they have
high embodied energy.
Cored (with Holes) Bricks
with Plaster Both Sides
Cored clay blocks are made of fired clay and have a holed cross-section. The holed
structure means that there is less material per square meter of finished wall.
Honeycomb Clay Blocks
with Plaster on Both Sides
Honeycomb clay blocks are made of fired clay and have a honeycombed cross-
section. The large size of the blocks enables rapid construction, and the
honeycomb structure means that there is less material per square meter of
finished wall. The features listed below make honeycomb clay blocks an eco-
friendlier building product:
o The honeycomb structure leads to improved thermal performance.
o Blocks can be customized.
o No mortar is needed in the vertical joints due to a tongue and grooved
edge, reducing mortar use by up to 40%.
o The blocks are strong and have a high impact resistance.
o Honeycomb clay blocks have post-consumer value if dismantled carefully.

MATERIALS EFFICIENCY MEASURES
© International Finance Corporation 2019. All rights reserved. EDGE User Guide 251
Medium Weight Hollow
Concrete Blocks
Hollow concrete blocks are lightweight and easier to handle than solid concrete
blocks. The lightness of the blocks helps in reducing the dead load of the masonry
on the structure. The voids also marginally improve the thermal insulation and
sound insulation of the block. The larger size of the blocks (compared to
conventional burnt clay bricks) also reduces the number of mortar joints and
hence the amount of cement mortar.
Solid Dense Concrete
Blocks
Solid dense concrete blocks can be used in virtually any part of a building. They
provide excellent sound insulation and their high strength makes them applicable
for use in structural walls. However, the use of virgin aggregates and sand can
lead to land or marine degradation and resource depletion, and the lack of
supplementary materials in the cement results in increased embodied energy.
Autoclaved Aerated
Concrete Blocks
Aerated concrete is a versatile, lightweight building material. Compared to solid
dense concrete blocks, aerated concrete blocks have a lower density and excellent
insulation properties. They are durable and have good resistance to sulphate
attack and damage by fire and frost. Aerated concrete blocks are excellent thermal
insulators.
Based on volume, the manufacture of aerated blocks typically uses 25% less
energy than other concrete blocks. They are lighter weight which makes them
easier to work with and saves energy in transportation.
Fly-Ash Stabilized Soil
Blocks
Soil blocks have some inherent weaknesses that can be corrected using
stabilization materials like fly ash or ground granulated blast furnace slag
(GGBFS).
Fly ash usually refers to industrial waste produced during coal combustion.
Compressed Stabilized
Earth Blocks
Stabilized Compressed Earth Block (SCEB) technology uses local soil mixed with
sand if required and a small percentage (about 5-10%) of ordinary Portland
cement (OPC) as the stabilizing agent. It offers a cost-effective and
environmentally-friendly alternative to conventional building materials. The blocks
are fire-resistant, provide better thermal insulation and do not need to be fired, so
they have lower embodied energy.
Ground Granulated Blast
Furnace Slag (GGBS)
Stabilized Soil Blocks
GGBS is a by-product of the iron industry. The molten slag is cooled rapidly with
water and is then ground into a fine cementations powder. GGBFS can then be
used as a cement replacement in the blocks.
Rammed Earth
Blocks/Walls
Rammed earth walls are more commonly used in arid areas. They are constructed
by the compacting (ramming) of moistened subsoil into place between temporary
formwork panels. When dried, the result is a dense, hard monolithic wall. As an
alternative, rammed earth bricks are also available. The high moisture mass of
rammed earth helps regulate humidity.

MATERIALS EFFICIENCY MEASURES
© International Finance Corporation 2019. All rights reserved. EDGE User Guide 252
Precast Concrete Panels
Precast concrete is a construction product made by casting concrete in a reusable
molding or “form” which is then cured in a controlled environment, transported to
the construction site, and lifted into place.
Precast cladding or curtain walls are the most common use of precast concrete for
building envelopes. These types of precast concrete panels do not transfer vertical
loads but simply enclose the space. They are only designed to resist wind, seismic
forces generated by their own weight, and forces requiring transferring the weight
of the panel to the support. Common cladding units include wall panels, window
wall units, spandrels, mullions and column covers. These units can usually be
removed individually if necessary.
In some cases, precast panels are used as formwork for cast-in-place concrete.
The precast panels act as a form, providing the visible aesthetics of the system,
while the cast-in-place portion provides the structural component.
Straw Bale Blocks
Straw bale blocks are a rapidly renewable building material made from the dry
stalk left in the earth after harvest, which is traditionally considered a waste
product that is burned or baled and sold for animal use. It is a natural, non-toxic
building material with low environmental impact and excellent insulation
properties. Since it is very easy to work it is a good choice for amateur or
unskilled self-builders.
Straw bale houses are finished and coated with cement stucco or earth-based
plaster, sealing the straw from the elements and giving long-lasting protection
with little maintenance. In contrast to the timber used for wood framing, straw
can be grown in less than a year in a completely sustainable production system.
The conversion of straw into a sustainable renewable resource to be used as a
dominant building material could be especially beneficial in areas where the
climate is severe and timber is scarce, but straw is plentiful.
Ferrocement Wall Panels
Ferrocement is a very simple construction of 2 to 5 layers of chicken wire over a
frame made from reinforcing bar, with cement forced into the gaps and in a layer
over the chicken wire reinforcing. The use of chicken wire makes ferrocement a
very flexible building material that is strongest when curved.
In-Situ Reinforced Wall
More commonly used for floor slabs and roofs, in-situ reinforced concrete is also
used to construct walls. It has a high embodied energy due to the inclusion of
Portland cement and uses sand, aggregate, water and reinforcing steel.

MATERIALS EFFICIENCY MEASURES
© International Finance Corporation 2019. All rights reserved. EDGE User Guide 253
Cellular Light Weight
Concrete Blocks
These blocks, which are environmentally friendly, are also called CLC blocks. The
energy consumed in production is only a fraction compared to the production of
clay bricks. They are made from slurry of cement, fly Ash*, and water, which is
further mixed with the addition of pre-formed stable foam in an ordinary concrete
mixer under ambient conditions.
The addition of foam to the concrete mixture creates millions of tiny voids or cells
in the material, hence the name Cellular Concrete.
*Fly ash is a waste material from thermal power plants.
Stone Blocks Limestone makes up about 10% of the total volume of all sedimentary rocks.
Although limestone is found widely, developers and designers should opt for local
extracted stone to reduce transport implications.
Limestone is readily available and relatively easy to cut into blocks in a quarry. It
is also long-lasting and stands up well to exposure, as it is hard, durable and
commonly occurs in easily accessible surface exposures. Because of its mass, it
has a high thermal inertia.
However, limestone is a very heavy material, making it impractical for tall
buildings, and relatively expensive as a building material.
Stone Blocks – Hand Cut Same as above, except hand-cut and not polished. The embodied energy is in the
extraction process and heavy transportation loads.
Stone Blocks – Machine
Cut Unpolished
Quarried stone, machine-cut and not polished. The quarried stone is typically of
medium hardness between limestone and granite. The embodied energy is in the
extraction process and cutting with a mechanized saw.

MATERIALS EFFICIENCY MEASURES
© International Finance Corporation 2019. All rights reserved. EDGE User Guide 254
FaLG Block The Fly Ash-Lime-Gypsum blocks technology primarily uses industrial wastes such
as fly ash (from thermal power plants), lime gypsum (from fertilizer industries)
and sand (optional) to produce alternative walling materials. It reduces the
environmental impacts associated with disposal of these industrial wastes, and
avoids the environmental impacts associated with clay brick production, such as
denudation of fertile topsoil. As the process for FAL-G blocks does not require
sintering, the amount of energy (fossil fuels) for production is reduced.
The manufacturing process consists of three main stages:
- Mixing the materials: Fly ash is mixed with lime and gypsum. Chemical
accelerator may or may not be added to it.
- Pressing the mix in a machine: the mix is molded under pressure, also
air/sun drying may be undertaken; and
- Curing the blocks for a stipulated period: the green block is water cured.
In the presence of moisture, fly ash reacts with lime at ordinary temperature and
forms a compound possessing cementations properties. After reactions between
lime and fly ash, calcium silicate hydrates are produced which are responsible for
the high strength of the compound.
Generally, FAL-G blocks are grey in color, solid and have plain rectangular faces
with parallel sides and sharp, straight and right-angled edges. It is also used for
development of infrastructure, construction of pavements, dams, tanks and under
water works.
Common Brick Wall No
Finish
Same as common brick wall, except without any plaster finish.
Cored (with Holes) Bricks
No Finish
Same as cored brick wall, except without any plaster finish.
Precast Concrete Sandwich
Panel
Precast concrete sandwich panels comprise an outer leaf of precast concrete, an
insulating layer “sandwiched” in between, and an inner leaf of plain grey concrete
with a power floated finish. The panels may be attached to a steel frame as a
cladding panel, or they can form part of a precast structural frame where the inner
leaf is load bearing and the external leaf is connected to and supported off the
internal leaf using ties. The ties used in the precast structural frames are made of
metal, plastic or epoxy and have low thermal conductivity to eliminate cold
bridging. The thickness of the insulation depends on the required U-value. The
shape, thickness and size of the concrete can also be varied to meet the
requirements of the project.

MATERIALS EFFICIENCY MEASURES
© International Finance Corporation 2019. All rights reserved. EDGE User Guide 255
Cement Fiber Boards on
Metal Studs
Cement fiber board used to clad buildings may also be referred to as “siding” or
“ship lap cladding.” It has the advantage of being more stable than wood through
an extreme range of weather conditions and it won’t rot, twist or warp. It is used
to replace timber cladding in new build and refurbishment projects. Boarding is
often self-colored so it doesn’t need painting. The board can be fixed to timber or
steel studs, and is easily cut by scoring and snapping external corners and edges.
Cement Fiber Boards on
Timber Studs
Same as above, except on timber studs instead of metal studs.
Plasterboards on Timber
Studs
Plasterboard is a form of wallboard manufactured using a core of gypsum plaster
bonded to layers of paper or fiberboard. It can be mounted on timber studs.
Plasterboards on Timber
Studs with Insulation
Same as above, except with insulation between the timber studs.
Plasterboards on Metal
Studs
Same as above, except mounted on metal studs instead of timber studs.
Plasterboards on Metal
Studs with Insulation
Same as above, except with insulation between the metal studs.
3-D Wire panel with “Shot-
crete” Both Sides
3D wire panel is a spatial structure consisting of the following elements:
• Welded reinforcing mesh of high wire diameter 3mm and a mesh size 50
× 50mm
• Diagonal wire (stainless or galvanized) wire of diameter 4mm
• Core of expanded polystyrene of thickness 50 - 120mm (embodied
energy of insulation is not included in this material)
• Concrete sprayed on the wire structure
3-D Wire Panel with “Shot-
crete” Both Sides with
Insulation
Same as above, except that the embodied energy of insulation is included in this
material.
Re-use of Existing Wall Re-using an existing material avoids the use, and therefore embodied energy, of
new materials. The re-use of the existing materials option in EDGE is highly
desirable and assigned an embodied energy value of zero. The material must be
verifiably more than five years old to be classified as re-used. The material does
not have to have been sourced from the project site.

MATERIALS EFFICIENCY MEASURES
© International Finance Corporation 2019. All rights reserved. EDGE User Guide 256
Relationship to Other Measures
The specification of internal walls does not affect other EDGE measures but can impact acoustic performance.
Assumptions
The base case assumption is that internal walls are constructed from 200mm common brick plastered on both
sides.
Compliance Guidance
Design Stage Post-Construction Stage
At the design stage, the following must be used to
demonstrate compliance:
Drawings of the internal wall sections; or
Manufacturer’s data sheet for building materials used for
internal wall specifications if available; or
Bill of quantities with the materials used for the internal
wall clearly highlighted.
At the post-construction stage, the following must be
used to demonstrate compliance:
Date stamped photograph of the wall taken during
or after construction; and
Purchase receipt for the building materials used for
wall construction; or
Delivery note for materials used for wall
construction.

MATERIALS EFFICIENCY MEASURES
© International Finance Corporation 2019. All rights reserved. EDGE User Guide 257
M05* – FLOORING
Corresponds to HMM05, HTM05, RTM05, OFM05, HSM05, EDM05
Intention
To select a flooring specification with a lower embodied energy than the typical specification. The floor type
specification matching the actual building design must be entered in the software.
Approach/Methodologies
The design team must select the specification that most closely resembles the floor finish specified. Where there
are multiple specifications the predominant specification must be selected.
Potential Technologies/Strategies
The following is a list of the specifications included in EDGE. The user must always try to select the specification
that most closely resembles that of the building design.
Ceramic Tile
The advantage of tiles is that they are hard wearing, which minimizes the maintenance
required. However, tiles are not maintenance free, as the grout requires maintenance.
The manufacture of tiles uses large amounts of energy due to the firing required and
therefore tiles have a high embodied energy.
Vinyl Flooring
Vinyl flooring is water resistant, low maintenance and inexpensive. It is easy to install
and is durable. However, vinyl flooring has a high embodied energy and can release
harmful volatile organic compounds after installation. Although durable, vinyl flooring
must be laid on a flat, smooth surface. An uneven surface might cause wearing and holes
which are difficult to repair, as vinyl is usually laid in a single piece.
Stone
Tiles/Slabs
Stone tiles can often be sourced locally and have low embodied energy compared to
some man-made materials. However, machine cut and polished stone tiles can be higher
in embodied energy relative to other natural materials and can be expensive.
Finished
Concrete Floor
More commonly referred to as “screed,” cement plaster is often used as a preparation
layer for soft or flexible floor finishes or tiles. Cement plaster can be used as a finish
layer, but it can be chipped more easily than other hard flooring options.
Linoleum
Sheet
Linoleum, often referred to as lino, is a floor covering made from solidified linseed oil
(linoxyn), pine rosin, ground cork dust, wood flour and mineral fillers such as calcium
carbonate. These materials are added to a canvas backing; pigments are often added to
the materials. Lino can be used as an alternative to vinyl and has a much lower embodied
energy.

MATERIALS EFFICIENCY MEASURES
© International Finance Corporation 2019. All rights reserved. EDGE User Guide 258
Terrazzo Tiles
Terrazzo tiles are a hard-wearing option for flooring which require very little
maintenance. Terrazzo floors can be laid in situ by pouring concrete or resin with granite
chips and then polishing the surface. Alternatively, terrazzo tiles are manufactured in a
factory before being laid onsite.
Nylon Carpets
Most nylon carpets have a very high embodied energy because of the large amount of
energy used in their manufacture but also because nylon is made from oil. Nylon carpets
have good acoustic properties and help to reduce reverberation times as well as the
transfer of impact sound.
Laminated
Wooden
Flooring
Laminated wooden flooring is more dimensionally stable than solid wood flooring so it can
be used in rooms prone to changes in moisture levels or where underfloor heating is
used. Due to the thickness of the finish layer the number of times that it can be
refinished is reduced, but the initial capital cost is lower than for solid wood flooring.
Terracotta
Tiles
Terracotta is fine-grained, orange or reddish-brown fired clay that is used for several
construction and decorative purposes, primarily roof and floor tiles. The name comes
from Italian, which means “baked earth,” as it is cooked or fired earth or soil.
The color varies slightly depending on the clay used. It is waterproof and a very sturdy
material. Its durability and resistance to both fire and water make it an ideal building
material. It is also lighter than stone, and it can be glazed for extra durability or to
provide a wide variety of colors, including finishes that resemble stone or metal patina.
Terracotta is a relatively inexpensive material.
Parquet/Wood
Block Finishes
Parquet is wood block flooring in a geometric pattern. It is available in either solid or
engineered construction, both of which can be manufactured to have an aged, rustic
appearance. Solid parquet wood flooring is more traditional. Engineered wood flooring is
composed of layers with a wood species forming the top flooring surface, and two or
more under layers of wood running at 90° to each other. The crisscrossed layers increase
stability which enables the product to be installed over all types of sub floors and to be
used with underfloor heating.
Plant Fiber
(Seagrass,
Sisal, Coir or
Jute) Carpet
Natural flooring has low embodied energy, but it has some disadvantages. It can be
sensitive to changes in environment or atmosphere; the product may expand or shrink if
fitted in an area such as a bathroom or kitchen where there is a constant change in
temperature. Natural fiber flooring may also stain easily. Also, grass contains its own
natural oils which makes it slippery on stairs. It’s also not as hardwearing as other
natural-fiber floorings such as sisal or coir.
Cork Tiles Cork has low embodied energy and is environmentally friendly. It can be harvested from
the same tree for about two hundred years. Harvesting is done with minimal impact on
the environment and no trees are cut down to manufacture cork products. Advanced
coating technology provides highly resistant and long-lasting protection even in high
traffic environments.

MATERIALS EFFICIENCY MEASURES
© International Finance Corporation 2019. All rights reserved. EDGE User Guide 259
Re-use of
Existing
Flooring
Re-using an existing material avoids the use, and therefore embodied energy, of new
materials. The re-use of existing materials option in EDGE is highly desirable and
assigned an embodied energy value of zero. The material must be verifiably more than
five years old to be classified as re-used. The material does not have to have been
sourced from the project site.
Relationship to Other Measures
Although flooring does not affect other measures in EDGE it can impact acoustic performance.
Assumptions
The base case assumption is that ceramic tile flooring is specified.
Compliance Guidance
Design Stage Post-Construction Stage
At the design stage, the following must be used to
demonstrate compliance:
Drawings clearly marking the flooring specification
selected; or
Manufacturer’s data sheet for building materials used
for floor specifications; or
Bill of quantities with the materials used for the
flooring clearly highlighted.
At the post-construction stage, the following must be
used to demonstrate compliance:
Date stamped photograph of the flooring once fitted;
and
Purchase receipt for the specified building materials
used as a floor finish; or
Delivery note for materials used for flooring.

MATERIALS EFFICIENCY MEASURES
© International Finance Corporation 2019. All rights reserved. EDGE User Guide 260
M06* – WINDOW FRAMES
Corresponds to HMM06, HTM06, RTM06, OFM06, HSM06, EDM06
Intention
To select a window frame specification with a lower embodied energy than the typical specification. The window
frame specification matching the actual building design must be entered in the software.
Approach/Methodologies
The design team must select the specification that most closely resembles the windows specified. Where there
are multiple specifications the predominant specification must be selected.
Potential Technologies/Strategies
The following is a list of the specifications included in EDGE. The user must always try to select the specification
that most closely resembles that of the building design.
Aluminium The two metals typically used for window frames are aluminum or steel. Aluminum is lighter
weight and does not rust like a ferrous metal such as steel, but the embodied energy is much
higher. The advantage of using metal window frames is that they are strong, light and
require less maintenance than other materials used for window frames. However as metal
conducts heat very well, the thermal performance of metal windows is not as good as other
materials. To reduce heat flow and U-Value, metal frames can include a thermal break
between the inside and outside of the frame.
Steel
Similar to aluminum windows above, except steel windows are heavier than aluminum and
require some maintenance to protect from rust (unless stainless steel is used). Steel has
somewhat better thermal performance than aluminum.
Timber
Timber window frames insulate relatively well, but they also expand and contract in response
to weather conditions. Timber frames can be made from either softwood or hardwood.
Softwood frames are much cheaper, but are likely to require more regular maintenance. The
maintenance required can be reduced by using aluminum or vinyl cladding.
UPVC
uPVC window frames are made of extruded polyvinyl chloride (PVC) with ultraviolet light (UV)
stabilizers to keep sunlight from breaking down the material. uPVC window frames are low
maintenance as they do not require painting. If the cavities of uPVC frames are filled with
insulation, they have very good thermal performance.
MATERIALS EFFICIENCY MEASURES
© International Finance Corporation 2019. All rights reserved. EDGE User Guide 261
Aluminium Clad
Timber
Aluminum cladding is fixed to wooden framing members with a space for ventilation
purposes. Timber and aluminum have high embodied energy. The extruded aluminum
sections are designed for strength and rigidity, to prevent deformation at the fastening
points. Often used in commercial applications, these windows are also suitable for residential
applications where low maintenance is important, such as social housing and high-rise
developments.
Re-use of Existing
Window Frames
Re-using an existing material avoids the use, and therefore embodied energy, of new
materials. The re-use of existing materials option in EDGE is highly desirable and assigned an
embodied energy value of zero. The material must be verifiably more than five years old to
be classified as re-used. The material does not have to have been sourced from the project
site.
Relationship to Other Measures
The choice of window frame material will have an impact on thermal performance. EDGE does not directly take
account of this as it is already reflected in the manufacturer’s calculation of the window U-value.
Assumptions
The default assumption is that window frames are aluminum.
Compliance Guidance
Design Stage Post-Construction Stage
At the design stage, the following must be used to
demonstrate compliance:
Façade drawings marking the window frame(s)
specification; or
Manufacturer’s data sheet for glazing specified; or
Bill of quantities with the windows/window frames
highlighted.
At the post-construction stage, the following must be
used to demonstrate compliance:
Date stamped photograph of the installed windows;
and
Purchase receipt for the specified windows; or
Delivery notes for windows.

MATERIALS EFFICIENCY MEASURES
© International Finance Corporation 2019. All rights reserved. EDGE User Guide 262
M07 & M08 – INSULATION
Corresponds to HMM07, HMM08, HTM07, HTM08, RTM07, RTM08, OFM07,
OFM08, HSM07, HSM08, EDM07, EDM08
Intention
To select insulation with a low embodied energy. If the building has insulation on the walls and the roof, then
the insulation type matching the actual building specifications must be entered in the software.
Approach/Methodologies
The design team must select the specification that most closely resembles the insulation specified. Where there
are multiple specifications the predominant specification must be selected.
As the base case assumes that no insulation is specified, the embodied energy calculation will not take account
of the insulation selected unless the Insulation of Roof Surface and/or Insulation of External Walls measures are
selected in the energy efficiencies section.
Potential Technologies/Strategies
The following is a list of the specifications included in EDGE. The user must always try to select the specification
that most closely resembles that of the building design.
Polystyrene
Polystyrene has the highest embodied energy per square meter of any other insulation type. There are two types of polystyrene insulation:
Expanded Polystyrene (EPS) insulation is made from small beads of polystyrene that when heated cause them to expand; they are then mixed with a blowing agent (pentane). Expanded polystyrene is available in board form or as beads. Boards are produced by placing the beads in moulds and heating them to fuse the beads together. Typical applications of EPS boards are for insulation of walls, roofs and floors. Polystyrene beads are frequently used as cavity fill in masonry walls.
Extruded Polystyrene (XPS) is made by mixing polystyrene with a blowing agent under pressure and forcing it through a die. As it emerges from the die it expands into foam; it can then be shaped and trimmed. XPS is slightly stronger than EPS, and although it is used in many of the same applications as EPS, it is particularly suitable for use below ground or where extra loading and/or impacts might be anticipated.
Mineral Wool Rock-based mineral wool is made by melting rock and recycled steel slag and spinning it into fibers. The insulation is available in different densities depending on the required functionality. Higher densities provide better sound insulation but poorer thermal insulation. Applications include masonry cavity walls, timber frame walls and insulation for roof rafters, lofts and suspended floors. Mineral wool has low resistance for moisture.
Glass Wool
Glass wool insulation is manufactured in a similar way to rock wool, though the raw materials are different as well as the melting process. Glass wool is made from silica sand, recycled glass, limestone and soda ash. Higher densities provide better sound insulation but poorer thermal insulation. Applications include masonry cavity walls, timber frame walls, and insulation for roof rafters, lofts and suspended floors.
MATERIALS EFFICIENCY MEASURES
© International Finance Corporation 2019. All rights reserved. EDGE User Guide 263
Polyurethane
Polyurethane (PUR), a closed-cell plastic, is formed by reacting two monomers in the presence of a blowing agent catalyst (polymerization). Polyisocyanurate foam (PIR) is an improvement on polyurethane (there is a slight difference in the constituents and the reaction is conducted at higher temperatures). PIR is more fire-resistant and has a slightly higher R Value.
Applications include wall, floor and roof insulation. Polyurethane is also popular in laminate form in SIPS and as an insulation backing to rigid boarding such as plasterboard.
Cellulose Four major types of loose-fill cellulose products have been developed for differing uses in a building under a variety of brand names. These are characterized as: 1. Dry cellulose 2. Spray applied cellulose 3. Stabilized cellulose 4. Low dust cellulose.
Cork Cork has low embodied energy and is environmentally friendly. It can be harvested from the same tree for about two hundred years. Harvesting is done with minimal impact on the environment and no trees are cut down to manufacture cork products.
Woodwool Woodwool boards have been used in buildings for decades and are a popular substrate for lime plaster. Strands of wood, bound together with a small proportion of Portland cement, provide a good background for lime plasters, eliminate thermal bridges in pillars, beams, inter-story facings and radiator niches and provide insulation of flat and sloping roofs; provide acoustic insulation of walls and insulation from floor noise; as well as fire resistant coverings.
Air Gap <100mm Wide
In principle, the use of cavities is similar to the use of an insulating material. Air is a poor conductor of heat, therefore still air trapped in an air space between two layers of a wall or roof acts as a barrier to heat transfer.
Air Gap >100mm Wide
Gaps larger than 100mm encourage convection and are not effective insulators.
No Insulation This option must be selected if no insulation is specified for the roof or walls.
Relationship to Other Measures
The base case assumes that no insulation is used. If the measures for roof surface and/or external walls
insulation are selected, then the improved case will assume that polystyrene insulation is specified. If either
mineral wool or glass wool is selected on the insulation dropdown, it will result in a small percentage
improvement over the base case, due to the greater embodied energy in polystyrene insulation.
Assumptions
The base case assumption is that no insulation is specified. The improved case assumes that polystyrene
insulation is specified.
MATERIALS EFFICIENCY MEASURES
© International Finance Corporation 2019. All rights reserved. EDGE User Guide 264
Compliance Guidance
Design Stage Post-Construction Stage
At the design stage, the following must be used to
demonstrate compliance:
Drawings marking the insulation specification
selected; or
Manufacturer’s data sheet for insulation specified; or
Bill of quantities with the insulation materials
highlighted.
At the post-construction stage, the following must be
used to demonstrate compliance:
Date stamped photograph of the insulation installed
during construction; and
An invoice for the specified insulation; or
Delivery note for materials used for insulation.
REFERENCES
© International Finance Corporation 2019. All rights reserved. EDGE User Guide 265
REFERENCES
Energy
American Society of Heating, Refrigerating and Air-Conditioning Engineers. ASHRAE Standard for Buildings
Except Low-Rise Residential Buildings, I-P Edition. Atlanta, US: ASHRAE, 2007
American Society of Heating, Refrigerating and Air-Conditioning Engineers. ASHRAE 90.1 Standard for Buildings,
I-P Edition. Atlanta, US: ASHRAE, 2010
Anderson, B. Conventions for U-value calculations. Watford, UK: British Research Establishment (BRE), 2006.
http://www.bre.co.uk/filelibrary/pdf/rpts/BR_443_(2006_Edition).pdf
BC Hydro. Commercial kitchens can save money with smart exhaust hoods. Jan 13, 2014. Retrieved 2014, from
http://www.bchydro.com/news/conservation/2014/commercial-kitchen-exhaust-hoods.html
Berdahl, P. Berkeley Laboratory - Environmental Energy Technologies Division. Cool Roofing Materials
Database. US: 2000.
Bureau of Indian Standards: National Building Code India. New Delhi, 2007
Callison Global. Matrix by Callison website: http://matrix.callison.com/
Carbon Trust. Heat recovery. Retrieved 2014, from
https://www.carbontrust.com/media/31715/ctg057_heat_recovery.pdf
Carbon Trust. Refrigeration systems: Guide to key energy saving opportunities. Retrieved 2015, from
https://www.carbontrust.com/media/13055/ctg046_refrigeration_systems.pdf
Carter Retail Equipment website. Refrigerated Display Cabinets & Coldroom Solutions. Retrieved 2014, from
http://www.cre-ltd.co.uk/
Chartered Institution of Building Services Engineers. CIBSE Guide A: Environmental Design. London: 7th
Edition, 2007
Chartered Institution of Building Services Engineers. CIBSE - Concise Handbook. London, June 2008
Clayton innovative Steam solutions. Heat Recovery Steam Generator. Retrieved 2014, from
http://www.claytonindustries.com/clayton_p5_heat_recovery.html
CIBSE Journal. Determining U-values for real building elements. UK: CIBSE, 2011.
http://www.cibsejournal.com/cpd/2011-06/
City of Wilson, North Carolina. Turn Waste Heat into Energy with Absorption Chillers. Retrieved 2014, from
http://members.questline.com/Article.aspx?articleID=7942&accountID=1874&nl=11427
Cooling technology Inc. Water cooled chillers & Air cooled chillers. Retrieved 2014, from
http://www.coolingtechnology.com/about_process_cooling/water-cooled-chiller/default.html.

REFERENCES
© International Finance Corporation 2019. All rights reserved. EDGE User Guide 266
Dubai Municipality. Green Building Regulations and Specifications: Practice Guide.
Energy Saving Trust. Replacing my boiler. Retrieved 2014, from http://www.energysavingtrust.org.uk/Heating-
and-hot-water/Replacing-your-boiler
Energy Saving Trust - Energy Efficiency Best Practice in Housing. Domestic Condensing Boilers – ‘The Benefits
and the Myths’. UK, November 2003.
Energy Savings Trust. Insulation Materials Chart: Thermal properties and environmental ratings. London:
August 2010. http://www.energysavingtrust.org.uk/Publications2/Housing-professionals/Insulation-and-
ventilation/Insulation-materials-chart-thermal-properties-and-environmental-ratings
Ethical Consumer. Gas boilers. Retrieved 2014, from
http://www.ethicalconsumer.org/buyersguides/energy/gasboilers.aspx
Energy Star website. Commercial Refrigerators & Freezers. Retrieved 2014, from
http://www.energystar.gov/products/certified-products/detail/commercial-refrigerators-freezers
Erwin Schawtz. DDI heat exchangers. Energy management magazine: How to tap the energy savings in
greywater. Retrieved 2014, from http://ddi-heatexchangers.com/wp-content/uploads/2012/09/ENERGY-RECOVERY-from-
wasted-GreyWater-Feb-2013.pdf
Glow.worn - Vaillant Group. How does your boiler work. Retrieved 2014, from http://www.glow-worm.co.uk/boilers-
3/your-boiler-guide/how-does-your-boiler-work/
International Organization for Standardization (ISO). ISO 13790:2008 Energy performance of buildings -
Calculation of energy use for space heating and cooling. 2008
Hanselaer, P. Lootens, C. Ryckaert, W.R. Deconinck, G. Rombauts, P. Power density targets for efficient lighting
of interior task areas. Laboratorium voor Lichttechnologie, April 2007.
Heat is Power Association. Recovery of Waste Heat from the Generator for Space Heating. Retrieved 2014, from
http://www.heatispower.org
Joliet Technologies. Variable Speed Drive Systems and Controls. Retrieved 2014, from www.joliettech.com
Norwegian University of Science and Technology. Hustad Kleven, M. Analysis of Grey-water Heat Recovery
System in Residential Buildings. Retrieved 2014, from http://www.diva-
portal.org/smash/get/diva2:566950/FULLTEXT01.pdf
Oak Ridge National Laboratory. Walker, D. (Foster Miller, Inc), Faramarzi, R T. (Southern California Edison
RTTC) and Baxter, V D. (Oak Ridge National Lab). Investigation of Energy-Efficient Supermarket Display Cases.
Oak Ridge, Tennessee December 2004. Retrieved 2014, from
http://web.ornl.gov/~webworks/cppr/y2001/rpt/122084.pdf
Phipps, Clarance A. Variable Speed Drive Fundamentals. The Fairmont Press Inc. 1997. ISBN0-88173-258-3
Pilkington Group Limited, European Technical Centre. Global Glass Handbook 2012: Architectural Products.
Ormskirk, Lancashire, UK: (NSG Group), 2012.

REFERENCES
© International Finance Corporation 2019. All rights reserved. EDGE User Guide 267
Potterton. Types of boilers. Retrieved 2014, from http://www.potterton.co.uk/types-of-boilers/
Recair. Sensible & latent heat. Retrieved 2014, from http://www.recair.com/us/recair_enthalpy-how-it-works.php
Schneider Electric. HVAC control - Regulate kitchen exhaust hood speed according to temperature. Retrieved
2014, from http://www2.schneider-electric.com/sites/corporate/en/customers/contractors/energy-efficiency-solution-for-
buildings/hvac_control_regulate_kitchen_exhaust.page
Spirax Sarco. Heat Pipe Heat Exchanger: An energy recovery solution. Cheltenham, UK, 2014. Retrieved 2014,
from http://www.spiraxsarco.com/pdfs/SB/p211_02.pdf
TAS Energy. Pollution? Think Again. Retrieved 2014, from http://www.tas.com/renewable-energy/waste-
heat/overview.html
Trane engineers newsletter (volume 36–1). Water-side heat recovery - Everything old is new again!. US, 2007.
Retrieved 2014, from http://www.trane.com/content/dam/Trane/Commercial/global/products-systems/education-
training/engineers-newsletters/waterside-design/admapn023en_0207.pdf
The Carbon Trust. Variable speed drives: technology guide. UK, November 2011,
The Carbon Trust. Low temperature hot water boilers. UK, March 2012. Retrieved 2014, from
https://www.carbontrust.com/media/7411/ctv051_low_temperature_hot_water_boilers.pdf
The Scottish Government. Worked examples of U-value calculations using the combined method. UK,2009.
http://www.scotland.gov.uk/Resource/Doc/217736/0088293.pdf
US Energy Department. Drain Water Heat Recovery. Retrieved 2014, from
http://energy.gov/energysaver/articles/drain-water-heat-recovery
US Energy Department. Glossary of Energy-Related Terms. Retrieved 2014, from
http://www.energy.gov/eere/energybasics/articles/glossary-energy-related-terms#A
US Energy Department, Industrial technology program. Waste Heat Recovery: Technology and Opportunities in
U.S. Industry. Retrieved 2014, from http://www.heatispower.org/wp-content/uploads/2011/11/waste_heat_recovery-
1.pdf
US Energy Department. Use Low-Grade Waste Steam to Power Absorption Chillers. Retrieved 2014, from
https://www1.eere.energy.gov/manufacturing/tech_assistance/pdfs/steam14_chillers.pdf
US Energy Department - Hydraulic Institute, Europump, Industrial Technologies Program Variable Speed
Pumping — A Guide To Successful Applications. May 2004. Retrieved 2014, from
http://www.energy.gov/sites/prod/files/2014/05/f16/variable_speed_pumping.pdf
U.S. Environmental Protection Agency. Energy Star – Air-Side Economizer. Retrieved 2015, from
https://www.energystar.gov/index.cfm?c=power_mgt.datacenter_efficiency_economizer_airside
U.S. Environmental Protection Agency. Energy Star - Boilers. Retrieved 2014, from
http://www.energystar.gov/productfinder/product/certified-boilers/results
U.S. Environmental Protection Agency. Energy Star – Electric Storage Heaters. Retrieved 2014, from
http://www.energystar.gov/certified-

REFERENCES
© International Finance Corporation 2019. All rights reserved. EDGE User Guide 268
products/detail/high_efficiency_electric_storage_water_heaters?fuseaction=find_a_product.showProductGroup&pgw_code=WH
H
US Energy Department. Energy Saver - Heat Pump Water Heaters. Retrieved 2014, from
http://energy.gov/energysaver/articles/heat-pump-water-heaters
US Office of Energy and Efficiency. EnerGuide: Heating and Cooling With a Heat Pump. Gatineau, Canada,
Revised December 2004.
UK Department of Energy and Climate Change. Standard Assessment Procedure for Energy Rating of Dwellings
(SAP). London: 2009 (March 2010)
York International Corporation. Energy Recovery Wheels. Retrieved 2014, from
http://www.johnsoncontrols.com/content/dam/WWW/jci/be/integrated_hvac_systems/hvac_equipment/airside/air-
handling/102.20-AG6.pdf
Carrier United Technologies. Economizers. Retrieved 2015, from
http://www.commercial.carrier.com/commercial/hvac/general/0,3055,CLI1_DIV12_ETI12218_MID6123,00.html

REFERENCES
© International Finance Corporation 2019. All rights reserved. EDGE User Guide 269
Water
General:
BRE Global Ltd. BREEAM International New Construction (NC). 2013
Sustainable Baby Steps. Water Conservation: 110+ Ways To Save Water. Retrieved 2014, from
http://www.sustainablebabysteps.com/water-conservation.html
U.S. Environmental Protection Agency. Water Sense website. http://www.epa.gov/WaterSense/index.html
Urinals:
Alliance for Water Efficiency. Urinal Fixtures Introduction. Retrieved 2014, from
http://www.allianceforwaterefficiency.org/Urinal_Fixtures_Introduction.aspx
U.S. Environmental Protection Agency. Water Sense. Urinals. Retrieved 2014, from
http://www.epa.gov/WaterSense/products/urinals.html
Auto Shut off taps:
UK Department for Environment Food & Rural Affairs. ECA Water. Efficient taps, Automatic shut off taps.
Retrieved 2014, from http://wtl.defra.gov.uk/technology.asp?sub-
technology=000300030001&technology=00030003&tech=000300030001
Dishwashers
Which?. Water saving products: Water efficient dishwashers. Retrieved 2014, from
http://www.which.co.uk/energy/creating-an-energy-saving-home/reviews-ns/water-saving-products/water-efficient-
dishwashers/
Pre-rinse valves:
U.S. Environmental Protection Agency. Water Sense. Pre-rinse spray valves. Retrieved 2014, from
http://www.epa.gov/WaterSense/docs/prsv_fact_sheet_090913_final_508.pdf
Water efficient landscaping
Arizona Municipal Water Users Association. Building Water Efficiency. Landscape. Retrieved 2014, from
http://www.building-water-efficiency.org/landscape.php
U.S. Environmental Protection Agency. Water Sense. Water-Smart Landscapes. Retrieved 2014, from
http://www.epa.gov/WaterSense/docs/water-efficient_landscaping_508.pdf
Condensate water
Alliance for Water Efficiency. Condensate Water Introduction. Retrieved 2014, from
http://www.allianceforwaterefficiency.org/condensate_water_introduction.aspx
American Society of Heating, Refrigerating and Air-Conditioning Engineers. ASHRAE Journal: AHU Condensate
Collection Economics: A Study of 47 U.S. Cities. Retrieved 2014, from https://www.ashrae.org/resources--
publications/periodicals/ashrae-journal/features/ahu-condensate-collection-economics--a-study-of-47-u-s--cities

REFERENCES
© International Finance Corporation 2019. All rights reserved. EDGE User Guide 270
Business Sector Media, LLC. Environmental Leader magazine. Air Conditioning Condensate Recovery. January
15, 2013. Retrieved 2014, from http://www.environmentalleader.com/2013/01/15/air-conditioning-condensate-recovery/
TLV. Returning Condensate and When to Use Condensate Pumps. Retrieved 2014, from
http://www.tlv.com/global/TI/steam-theory/types-of-condensate-recovery.html
Materials
Advanced WPC technologies. http://wpc-composite-decking.blogspot.com/p/what-is-wood-plastic-composite-wpc.html
Aldo A. Ballerini, X. Bustos, M. Núñez, A. Proceedings of the 51st International Convention of Society of Wood
Science and Technology: Innovation in window and door profile designs using a wood-plastic composite.
Concepción, Chile: November 2008. http://www.swst.org/meetings/AM08/proceedings/WS-05.pdf
Ballard Bell, V. and Rand, P. Materials for Architectural Design. London: King Publishing Ltd, 2006.
Krishna Bhavani Siram, K. Cellular Light-Weight Concrete Blocks as a Replacement of Burnt Clay Bricks. New
Delhi, India: International Journal of Engineering and Advanced Technology (IJEAT), December 2012.
Primary Information Services. FaL-G Bricks. Chennai, India. http://www.primaryinfo.com/projects/fal-g-bricks.htm
Reynolds, T. Selmes, B. Wood Plastic Composites. London: BRE, Feb 2003
United Nations Centre for Human Settlements and Auroville Building Centre. Ferrocement Channels. Nairobi,
Kenya and Tamil Nadu, India. http://ww2.unhabitat.org/programmes/housingpolicy/documents/Ferrocement.pdf
World Bank Group. India - Fal-G (Fly Ash-Lime-Gypsum) Bricks Project. Washington, DC: 2006.
http://documents.worldbank.org/curated/en/2006/05/6843612/india-fal-g-fly-ash-lime-gypsum-bricks-project

APPENDIX
© International Finance Corporation 2019. All rights reserved. EDGE User Guide 271
APPENDIX 1. COUNTRY SPECIFIC CONSIDERATIONS
South Africa
SANS Building Regulations
SANS Building Regulations standards are referenced in the EDGE software to ensure that if a project meets
EDGE requirements it also meets SANS requirements. If there are issues with SANS compliance text alerts will
appear below the energy section and will also appear in the downloadable pdf (if the user chooses to generate
it). Note that EDGE should not be used as a compliance tool for SANS as there are additional requirements
mandated by SANS that are not included in EDGE.
Figure 24. SANS alerts for SA are given at the end of the EE measures when project meets EDGE standard of 20% energy
saving but does not meet SANS requirements. This alert is specific to South Africa.
HME01 – Reduced Window to Wall Ratio
South African design teams generally refer to Window to Floor Ratio (WFR). EDGE has therefore introduced WFR
into the building Design page and the Window to Wall Ratio section. To change the WFR, the user must modify
the WWR. WFR cannot be modified directly in EDGE software.
By changing the WWR, the area of windows changes in the software calculations. This automatically modifies
the WFR as follows:
𝑊𝐹𝑅 =Total Window Area
Total Floor Area
So, since the floor area remains constant (from the input in the Design page), the window area may be
amended by changing the WWR.

APPENDIX
© International Finance Corporation 2019. All rights reserved. EDGE User Guide 272
WWR and WFR are not directly proportional, although when WWR increases the WFR also increases. However, a
conversion factor is not possible since the dependent variables are not the same for WWR and WFR.
HME 05-06- Insulation of Roof and External Walls
Since the South African (SANS) baseline U-Value is low, addition of insulation above and beyond the SANS
requirements will not provide a financially viable energy savings option.
HME14 – Heat Pump for Hot Water Generation
When Heat Pumps for hot water are selected as an Energy Efficient measure for South Africa, the system must
deliver at least 50% of SANS energy requirements. Therefore, only savings for the remainder of the system will
be counted toward EDGE energy efficiency achievements.

APPENDIX
© International Finance Corporation 2019. All rights reserved. EDGE User Guide 273
China
Green Building Evaluation Label (GBL), also known as the “3-Star” System
EDGE Version 2.1 includes the ability to demonstrate compliance with certain categories of China’s Green
Building Evaluation Label (GBL), also known as the “3-Star” System. China GBL is a green building certification
program administered by the Ministry of Housing and Urban-Rural Development of the People’s Republic of
China (MOHURD). GBL evaluates projects based on eight categories: land, energy, water, resource/material
efficiency, indoor environmental quality, construction management, operational management and a bonus
category for innovation.
The EDGE software can be used to demonstrate compliance in four of the eight GBL categories for the GBL
points listed in the table in this section. Note that not all GBL categories are included in EDGE. The EDGE
software includes nearly 30 cities in China. The EDGE baseline for projects located in China follows the GBL
system instead of the ASHRAE baseline. EDGE also provides GBL-specific calculators for China projects within
the EDGE user interface.
Users can create a project in EDGE with a location in China, select the measures included in their project, and
use the GBL calculators to generate inputs for the EDGE App. Users can then generate a GBL report in the EDGE
App by going to File > Download GBL Report.
Some features unique to the EDGE user interface for China are:
1. The “Building Data” section on the Design tab includes a field for the “Building Shape Coefficient.”
𝐵𝑢𝑖𝑙𝑑𝑖𝑛𝑔 𝑆ℎ𝑎𝑝𝑒 𝐶𝑜𝑒𝑓𝑓𝑖𝑐𝑖𝑒𝑛𝑡(𝐶) = 𝐵𝑢𝑖𝑙𝑑𝑖𝑛𝑔 𝐸𝑥𝑡𝑒𝑟𝑖𝑜𝑟 𝐴𝑟𝑒𝑎
𝐵𝑢𝑖𝑙𝑡 𝑉𝑜𝑙𝑢𝑚𝑒
The smaller the Building Shape Coefficient, the less the heat loss via the building envelope and the less
the energy consumption.
2. The “Building Systems” section on the Design tab includes dropdown menus to select system types for
AC and heating.
• The AC system defaults to a DX Split System
• The space heating system has four choices
i. Fuel Gas Boiler
ii. Layered Combustion Boiler
iii. Spreader Chain Grate Boiler
iv. Fluidized Bed Combustion Boiler
3. There are GBL calculators built into the measures. For example, if “HME16: Energy-saving Light Bulbs”
measure is selected in the Homes tool, a GBL- Lighting Power Density calculator becomes available.
There are also additional GBL calculators available at the bottom of the Energy tab. These are:
• GBL – Lighting Control, and
• GBL – Openable Window/Façade Ratio
GBL Category Measure Total Points Available through EDGE
ENERGY 68

APPENDIX
© International Finance Corporation 2019. All rights reserved. EDGE User Guide 274
5.1.4 & 5.2.10 Lighting Power Density 8
5.2.1 Window to Wall Ratio 6
5.2.2 Openable Window/Façade Ratio 6
5.2.3 Design Thermal Performance Improvements 10
5.2.4 Equipment Efficiency Improvements 6
5.2.6 HVAC System Energy Saving 10
5.2.9 Lighting Control 5
5.2.13 Energy Recovery from Exhaust Air 3
5.2.15 Waste Heat Recovery 4
5.2.16 Renewable Energy 10
INDOOR ENVIRONMENTAL QUALITY 13
8.2.10 Natural Ventilation 13
WATER 43
6.2.6 Water Fixtures 10
6.2.8 Condenser Water System 10
6.2.10 Non-Traditional Water Utilization (Landscaping,
Lavatory, Car Washing & Road Washing)
15
6.2.11 Non-Traditional Water Utilization (Condenser Water Use)
8
EXEMPLARY PERFORMANCE AND INNOVATION 5
11.2.1 Design Thermal Performance Improvements 2
11.2.2 Equipment Efficiency Improvements 1
11.2.4 Water Fixtures 1
11.2.11 Carbon Emission Calculation 1

APPENDIX
© International Finance Corporation 2019. All rights reserved. EDGE User Guide 275
APPENDIX 2. LIGHTING ASSUMPTIONS IN EDGE
The tables in this Appendix list the assumptions made for Lighting Power Density in the EDGE building models.
Table 53: Indoor lighting power density [LPD] assumptions for the base case and improved case for Homes
Building Type Indoor Space Type Base Case [LPD: W/m²]
Improved Case [LPD: W/m²]
HOMES Bedroom 9.5 6.5
Kitchen 14.3 9.7
Living and Dining 4.8 3.2
Toilet 66.7 11.1
Utility, Balcony, service shaft 33.3 5.6
Corridors & Common areas 5.4 4.0
Table 54: Outdoor lighting power density [LPD] assumptions for the base case and improved case for Homes
Building Type External Space Type Base Case [LPD: W/m²]
Improved Case [LPD: W/m²]
HOMES Site Grounds 3.2 2.0
Table 55: Indoor lighting power density [LPD] assumptions for the base case and improved case for Hospitality
Building Type Indoor Space Type Base Case [LPD: W/m²]
Improved Case [LPD: W/m²]
HOSPITALITY Administrative Office 11.8 7.5
Back of House 10 6.5
Bars 15.1 5.9
Basement Car Parking 1.8 1.8
Breakfast only area 14.0 8.7
Conference /Banquet 14.0 14.0
Corridors 10.8 10.8
Guest rooms 11.8 2.9
Guest Room Toilets 9.7 2.9
Health spa 9.7 6.0
Kitchen 12.9 8.0
APPENDIX
© International Finance Corporation 2019. All rights reserved. EDGE User Guide 276
Laundry 6.5 4.0
Linen and storage 6.5 4.0
Lobby 11.8 5.9
Lockers 6.5 5.9
Reception 12.9 5.9
Restaurant and Cafeteria 14.0 5.9
Cafe 12.9 5.0
Table 56: Outdoor lighting power density [LPD] assumptions for the base case and improved case for Hospitality
Building Type External Space Type Base Case [LPD: W/m²]
Improved Case [LPD: W/m²]
HOSPITALITY Site Grounds 1.5 0.8
Table 57: Indoor lighting power density [LPD] assumptions for the base case and improved case for Retail – Department Store
Building Type Indoor Space Type Base Case [LPD: W/m²]
Improved Case [LPD: W/m²]
RETAIL – DEPARTMENT STORE
Bathrooms 9.7 6.6
Car Parking 1.8 1.1
Cold Storage Area 18.3 16.5
Corridors and Lobby 5.4 2.2
Dry Storage 8.6 4.4
Electronics Area 18.3 16.5
Food Court 18.6 16.5
Food Sales 18.6 16.5
Frozen Storage 18.3 16.5
General Sales Area 18.3 16.5
Mechanical & Electrical Room 16.1 11.0
Offices 10.8 6.6
Supermarket 18.3 16.5
Table 58: Indoor lighting power density [LPD] assumptions for the base case and improved case for Retail – Shopping Mall
Building Type Indoor Space Type Base Case [LPD: W/m²]
Improved Case [LPD: W/m²]

APPENDIX
© International Finance Corporation 2019. All rights reserved. EDGE User Guide 277
RETAIL - SHOPPING MALL
Anchor Store Area (Supermarket) 18.3 6.6
Anchor Store Area (Other) 18.3 6.6
Atrium 5.4 4.4
Bathrooms 9.7 2.2
Car Parking 1.8 1.1
Dry Storage 8.6 4.4
Food Court 14.0 4.4
In-line Store Area 18.3 6.6
Leisure & Entertainment 11.8 6.6
Mall Area (Communal Corridors) 5.4 4.4
Mechanical & Electrical Room 16.1 11.0
Offices 10.8 6.6
Table 59: Indoor lighting power density [LPD] assumptions for the base case and improved case for Retail – Supermarket
Building Type Indoor Space Type Base Case [LPD: W/m²]
Improved Case [LPD: W/m²]
RETAIL - SUPERMARKET
Bakery 18.3 16.5
Bathrooms 9.7 6.6
Car Parking 1.8 1.1
Cold Storage Area 18.3 16.5
Dry Storage 8.6 5.5
Food Court 14.0 8.8
Frozen Section 18.3 16.5
Frozen Storage 18.3 16.5
General Sales Area 18.3 16.5
Mechanical & Electrical Room 16.1 11.0
Offices 10.8 6.6
Refrigerated Area 18.3 16.5
Table 60: Indoor lighting power density [LPD] assumptions for the base case and improved case for Retail – Small Food Retail
Building Type Indoor Space Type Base Case [LPD: W/m²]
Improved Case [LPD: W/m²]

APPENDIX
© International Finance Corporation 2019. All rights reserved. EDGE User Guide 278
RETAIL – SMALL FOOD RETAIL
Bathrooms 23.7 2.2
Car Parking 1.8 1.1
Cold Storage Area 18.3 16.5
Dry Storage 8.6 4.4
Food Court 14.0 8.8
Frozen Section 18.3 16.5
General Sales Area 7.5 6.6
Mechanical & Electrical Room 16.1 11.0
Refrigerated Area 18.3 16.5
Supermarket 18.3 6.6
Table 61: Indoor lighting power density [LPD] assumptions for the base case and improved case for Retail – Non-Food Big Box
Retail
Building Type Indoor Space Type Base Case [LPD: W/m²]
Improved Case [LPD: W/m²]
RETAIL – NON-FOOD BIG
BOX RETAIL
Car Parking 1.8 1.1
Corridors and Lobby 5.4 4.4
Dry Storage 8.6 6.6
Food Court 14.0 11.0
General Sales Area 18.3 16.5
Mechanical & Electrical Room 16.1 11.0
Offices 10.8 6.6
Supermarket 18.3 6.6
Table 62: Indoor lighting power density [LPD] assumptions for the base case and improved case for Retail – Light Industry
Building Type Indoor Space Type Base Case [LPD: W/m²]
Improved Case [LPD: W/m²]
RETAIL – LIGHT INDUSTRY
Car parking 5.4 3.8
Cold Storage Area 8.6 7.5
Food Court 11.8 7.5
Inventory Area 8.6 7.5
Mechanical & Electrical Room 8.3 5.0

APPENDIX
© International Finance Corporation 2019. All rights reserved. EDGE User Guide 279
Office Space 10.8 7.5
Production Area 15.0 12.5
Receiving Area 10.8 7.5
Shipping Area 10.8 7.5
Table 63: Indoor lighting power density [LPD] assumptions for the base case and improved case for Retail – Warehouses
Building Type Indoor Space Type Base Case [LPD: W/m²]
Improved Case [LPD: W/m²]
RETAIL – WAREHOUSES Bulk Storage 9.7 6.6
Car parking 1.8 1.1
Controlled Storage 15.1 11.0
Dispatcher 18.3 16.5
Food Court 14.0 11.0
Inventory Control 11.8 8.8
Mechanical & Electrical Room 18.3 16.5
Office Spaces 10.8 6.6
Package Assembly 18.3 16.5
Package Disassembly 18.3 16.5
Rack Storage 15.1 11.0
Receiving and Shipping 18.3 16.5
Table 64: Outdoor lighting power density [LPD] assumptions for the base case and improved case for Retail buildings
Building Type External Space Type Base Case [LPD: W/m²]
Improved Case [LPD: W/m²]
RETAIL Site Grounds 1.5 1.0
Table 65: Indoor lighting power density [LPD] assumptions for the base case and improved case for Offices
Building Type Indoor Space Type Base Case [LPD: W/m²]
Improved Case [LPD: W/m²]
OFFICES Conference Rooms 14.0 5.4
Corridors 5.4 1.8
Food Court 9.7 2.3
Indoor Car Parking 2.2 1.8

APPENDIX
© International Finance Corporation 2019. All rights reserved. EDGE User Guide 280
Lobby 14.0 3.5
M&E Rooms and Storage 16.1 4.7
Open Plan/ Cellular Office 11.8 5.4
Toilets 9.7 4.7
Table 66: Outdoor lighting power density [LPD] assumptions for the base case and improved case for Offices
Building Type External Space Type Base Case [LPD: W/m²]
Improved Case [LPD: W/m²]
OFFICES Site Grounds 1.2 0.8
Table 67: Indoor lighting power density [LPD] assumptions for the base case and improved case for Hospitals – Nursing Home
Building Type Indoor Space Type Base Case [LPD: W/m²]
Improved Case [LPD: W/m²]
HOSPITALS – NURSING HOME
Consultation Rooms 16.1 6.7
Corridors 10.8 2.2
Dining 14.0 11.8
Kitchen and Food Preparation 12.9 11.8
Laundry 1.8 1.6
Mechanical & Electrical Rooms 16.1 6.7
Offices 11.8 6.7
Patient Areas - General 7.5 3.4
Patient Areas – Specialty Wards 7.5 3.4
Waiting Areas 11.8 6.7
Table 68: Indoor lighting power density [LPD] assumptions for the base case and improved case for Hospitals – Private Hospital
Building Type Indoor Space Type Base Case [LPD: W/m²]
Improved Case [LPD: W/m²]
HOSPITALS – PRIVATE HOSPITAL
Bathrooms and Storage 9.7 2.2
Central Sterile Supply Department 15.1 2.2
Consultation Rooms 16.1 6.7
Corridors 10.8 2.2
Diagnostic Services 15.1 6.7
Indoor Car Parking 1.8 1.6

APPENDIX
© International Finance Corporation 2019. All rights reserved. EDGE User Guide 281
Intensive Care Units (ICUs) 16.1 6.7
Kitchen and Food Preparation 12.9 11.8
Laundry 6.5 2.2
Mechanical & Electrical Rooms 16.1 6.7
Offices 11.8 6.7
Operating Rooms 23.7 11.8
Patient Areas - General 7.5 3.4
Patient Areas – Specialty Wards 7.5 3.4
Pre- & Post-Operating Rooms 16.1 6.7
Therapy Rooms 16.1 6.7
Waiting Areas 16.1 6.7
Table 69: Indoor lighting power density [LPD] assumptions for the base case and improved case for Hospitals – Public Hospital
Building Type Indoor Space Type Base Case [LPD: W/m²]
Improved Case [LPD: W/m²]
HOSPITALS – PUBLIC HOSPITAL
Bathrooms and Storage 9.7 2.2
Central Sterile Supply Department 15.1 2.2
Consultation Rooms 16.1 6.7
Corridors 10.8 2.2
Diagnostic Services 15.1 6.7
Indoor Car Parking 1.8 1.6
Intensive Care Units (ICUs) 16.1 6.7
Kitchen and Food Preparation 12.9 11.8
Laundry 6.5 2.2
Mechanical & Electrical Rooms 16.1 6.7
Offices 11.8 6.7
Operating Rooms 23.7 11.8
Patient Areas - General 7.5 3.4
Patient Areas – Specialty Wards 7.5 3.4
Pre- & Post-Operating Rooms 16.1 6.7
Therapy Rooms 16.1 6.7

APPENDIX
© International Finance Corporation 2019. All rights reserved. EDGE User Guide 282
Waiting Areas 16.1 6.7
Table 70: Indoor lighting power density [LPD] assumptions for the base case and improved case for Hospitals – Multi-Specialty
Hospital
Building Type Indoor Space Type Base Case [LPD: W/m²]
Improved Case [LPD: W/m²]
HOSPITALS – MULTI-SPECIALTY HOSPITAL
Bathrooms and Storage 9.7 2.2
Central Sterile Supply Department 15.1 2.2
Consultation Rooms 16.1 6.7
Corridors 10.8 2.2
Diagnostic Services 15.1 6.7
Indoor Car Parking 1.8 1.6
Intensive Care Units (ICUs) 16.1 6.7
Kitchen and Food Preparation 12.9 11.8
Laundry 6.5 2.2
Mechanical & Electrical Rooms 16.1 6.7
Offices 11.8 6.7
Operating Rooms 23.7 11.8
Patient Areas - General 7.5 3.4
Pre- & Post-Operating Rooms 16.1 6.7
Therapy Rooms 16.1 6.7
Waiting Areas 16.1 6.7
Table 71: Indoor lighting power density [LPD] assumptions for the base case and improved case for Hospitals – Clinics
(Outpatient)
Building Type Indoor Space Type Base Case [LPD: W/m²]
Improved Case [LPD: W/m²]
HOSPITALS – CLINICS (OUTPATIENT)
Bathrooms and Storage 9.7 2.2
Consultation Rooms 16.1 11.8
Diagnostic Services 15.1 6.7
Kitchen and Food Preparation 12.9 11.8
Laundry 1.8 1.6
Mechanical & Electrical Rooms 16.1 6.7

APPENDIX
© International Finance Corporation 2019. All rights reserved. EDGE User Guide 283
Offices 11.8 6.7
Waiting Areas 11.8 6.7
Table 72: Indoor lighting power density [LPD] assumptions for the base case and improved case for Hospitals – Diagnostic
Center
Building Type Indoor Space Type Base Case [LPD: W/m²]
Improved Case [LPD: W/m²]
HOSPITALS – DIAGNOSTIC CENTER
Bathrooms and Storage 9.7 2.2
Corridors 10.8 2.2
Diagnostic Services 15.1 6.7
Indoor Car Parking 1.8 1.6
Kitchen and Food Preparation 12.9 11.8
Laundry 6.5 2.2
Mechanical & Electrical Rooms 16.1 6.7
Offices 11.8 6.7
Waiting Areas 8.6 6.7
Table 73: Indoor lighting power density [LPD] assumptions for the base case and improved case for Hospitals – Teaching
Hospital
Building Type Indoor Space Type Base Case [LPD: W/m²]
Improved Case [LPD: W/m²]
HOSPITALS – TEACHING HOSPITAL
Bathrooms and Storage 9.7 2.2
Central Sterile Supply Department 15.1 2.2
Consultation Rooms 16.1 6.7
Corridors 10.8 2.2
Diagnostic Services 15.1 6.7
Education, Auditorium 14.0 6.7
Indoor Car Parking 1.8 1.6
Intensive Care Units (ICUs) 16.1 6.7
Kitchen and Food Preparation 12.9 11.8
Laundry 6.5 2.2
Mechanical & Electrical Rooms 16.1 6.7
Offices 11.8 6.7

APPENDIX
© International Finance Corporation 2019. All rights reserved. EDGE User Guide 284
Operating Rooms 23.7 11.8
Patient Areas - General 7.5 3.4
Patient Areas – Specialty Wards 7.5 3.4
Pre- & Post-Operating Rooms 16.1 6.7
Waiting Areas 16.1 6.7
Table 74: Indoor lighting power density [LPD] assumptions for the base case and improved case for Hospitals – Eye Hospital
Building Type Indoor Space Type Base Case [LPD: W/m²]
Improved Case [LPD: W/m²]
HOSPITALS – EYE HOSPITAL
Bathrooms and Storage 9.7 2.2
Consultation Rooms 16.1 6.7
Corridors 10.8 2.2
Diagnostic Services 15.1 6.7
Indoor Car Parking 1.8 1.6
Kitchen and Food Preparation 12.9 11.8
Laundry 6.5 1.6
Mechanical & Electrical Rooms 15.1 6.7
Operating Rooms 23.7 6.7
Opticals 16.1 6.7
Patient Areas - General 7.5 3.4
Refraction 16.1 6.7
Waiting Areas 16.1 6.7
Table 75: Indoor lighting power density [LPD] assumptions for the base case and improved case for Hospitals – Dental Hospital
Building Type Indoor Space Type Base Case [LPD: W/m²]
Improved Case [LPD: W/m²]
HOSPITALS – DENTAL HOSPITAL
Bathrooms and Storage 9.7 2.2
Consultation Rooms 16.1 6.7
Corridors 10.8 2.2
Diagnostic Services 15.1 6.7
Indoor Car Parking 1.8 1.6
Kitchen and Food Preparation 12.9 11.8

APPENDIX
© International Finance Corporation 2019. All rights reserved. EDGE User Guide 285
Laundry 6.5 1.6
Mechanical & Electrical Rooms 15.1 6.7
Operating Rooms 23.7 6.7
Waiting Areas 16.1 6.7
Table 76: Outdoor lighting power density [LPD] assumptions for the base case and improved case for Hospitals
Building Type External Space Type Base Case [LPD: W/m²]
Improved Case [LPD: W/m²]
HOSPITALS Site Grounds 1.5 0.8
Table 77: Indoor lighting power density [LPD] assumptions for the base case and improved case for Education
Building Type Indoor Space Type Base Case [LPD: W/m²]
Improved Case [LPD: W/m²]
EDUCATION Auditoriums 6.8 6.0
Cafeteria - Pre-school 11.4 9.7
Cafeteria – all other types 11.4 9.7
Changing Rooms 9.1 7.7
Classrooms 10.3 8.8
Computer Rooms 12.9 11.0
Corridors 6.0 4.0
Indoor Car Parking 1.8 1.4
Labs 12.9 11.0
Library 8.8 7.5
Meeting Rooms 8.7 7.4
Offices/Administration Rooms – Pre-school
8.7 7.4
Offices/Administration Rooms – all other types
10.3 8.8
Other Space Types 9.1 7.7
Playrooms 10.3 8.8
Restrooms 9.1 7.7
Sports Room 4.7 4.0
Staff Rooms 6.0 5.0

APPENDIX
© International Finance Corporation 2019. All rights reserved. EDGE User Guide 286
Workshops 12.9 11.0
Worship Places 10.3 9.0
Table 78: Outdoor lighting power density [LPD] assumptions for the base case and improved case for Education
Building Type External Space Type Base Case [LPD: W/m²]
Improved Case [LPD: W/m²]
EDUCATION Site Grounds 1.5 1.0

APPENDIX
© International Finance Corporation 2019. All rights reserved. EDGE User Guide 287
APPENDIX 3. RECORD OF POLICY UPDATES IN THE USER GUIDE
Date Location Old Text Update
11/09/2017 Special Ruling Request (SRR)
Added information on Special Ruling Request (SRR) in the User Guide
03/08/2018 Measure E01 – Reduced Window to Wall Ratio
The following examples should be excluded from the calculations of WWR:
a) Walls with windows into unconditioned enclosed spaces
The following examples should be excluded from the calculations of WWR:
a) Walls with windows into unconditioned enclosed spaces
03/08/2018 Measure W07 – Rainwater Harvesting System
This measure can only be claimed if the rainwater collected is used within the building. A rainwater collection system used for landscaping will not satisfy the requirements of the measure.
This measure can only be claimed if the rainwater collected is used within the building. A rainwater collection system used for landscaping will not satisfy the requirements of the measure.
Water may be used for landscaping
03/08/2018 Measure W14 –Greywater System
This measure can be claimed if there is a grey water recycling system that reuses waste water from kitchens, laundry and bathrooms for the purpose of flushing toilets within the building.
This measure can be claimed if there is a grey water recycling system that reuses waste water from kitchens, laundry and bathrooms for the purpose of flushing toilets within the building.
Water may be used for landscaping
03/08/2018 Measure W15 –Blackwater System
Some jurisdictions may not permit the use of recycled black water in buildings for future flushing; in such cases this measure cannot be claimed.
Some jurisdictions may not permit the use of recycled black water in buildings for future flushing; in such cases this measure cannot be claimed.
Water may be used for landscaping
06/01/2018 Grouping of residential units under Subprojects
Added information on the 10% rule for grouping residential units for the purpose of EDGE certification
07/24/2018 E03 and E04 - Reflective Paint/Tiles for Walls and Roof
(from Supplement) Replace with Solar Reflectance Index (SRI) wherever it appears in the text for this measure.
Replace with Solar Reflectance Index (SRI) wherever it appears in the text for this measure.
The measures continue to use Solar Reflectance (albedo) as in older
versions of EDGE.
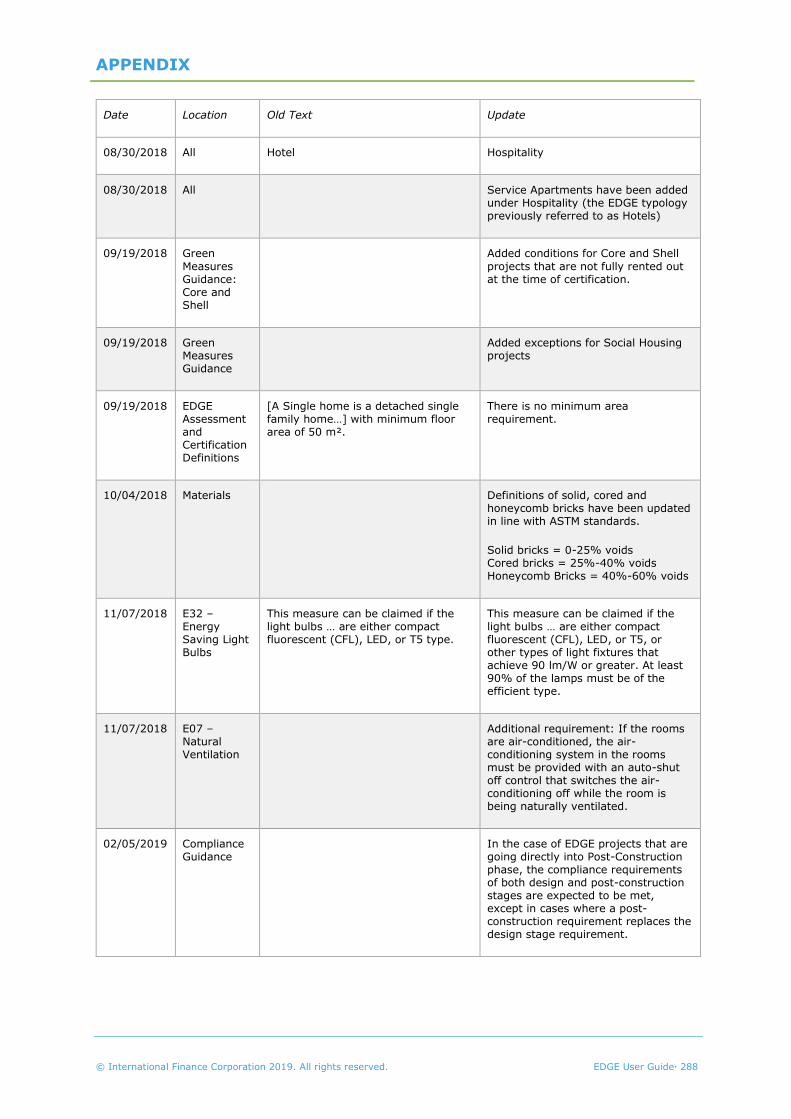
APPENDIX
© International Finance Corporation 2019. All rights reserved. EDGE User Guide 288
Date Location Old Text Update
08/30/2018 All Hotel Hospitality
08/30/2018 All Service Apartments have been added under Hospitality (the EDGE typology previously referred to as Hotels)
09/19/2018 Green
Measures Guidance: Core and Shell
Added conditions for Core and Shell
projects that are not fully rented out at the time of certification.
09/19/2018 Green Measures Guidance
Added exceptions for Social Housing projects
09/19/2018 EDGE Assessment and Certification Definitions
[A Single home is a detached single family home…] with minimum floor area of 50 m².
There is no minimum area requirement.
10/04/2018 Materials Definitions of solid, cored and honeycomb bricks have been updated in line with ASTM standards.
Solid bricks = 0-25% voids Cored bricks = 25%-40% voids Honeycomb Bricks = 40%-60% voids
11/07/2018 E32 – Energy Saving Light Bulbs
This measure can be claimed if the light bulbs … are either compact fluorescent (CFL), LED, or T5 type.
This measure can be claimed if the light bulbs … are either compact fluorescent (CFL), LED, or T5, or other types of light fixtures that achieve 90 lm/W or greater. At least 90% of the lamps must be of the efficient type.
11/07/2018 E07 – Natural Ventilation
Additional requirement: If the rooms are air-conditioned, the air-conditioning system in the rooms must be provided with an auto-shut off control that switches the air-conditioning off while the room is being naturally ventilated.
02/05/2019 Compliance Guidance
In the case of EDGE projects that are going directly into Post-Construction phase, the compliance requirements of both design and post-construction stages are expected to be met, except in cases where a post-construction requirement replaces the design stage requirement.

Page intentionally left blank

Page intentionally left blank
