edinburgh research explorer - connecting repositories · modelling urban scale retrofit, ......
TRANSCRIPT
Edinburgh Research Explorer
Modelling Urban scale Retrofit, Pathways to 2050 Low CarbonResidential Building Stock
Citation for published version:Lannon, S, Georgakaki, A & Macdonald, S 2013, 'Modelling Urban scale Retrofit, Pathways to 2050 LowCarbon Residential Building Stock'. in Proceedings of BS2013. International Building PerformanceSimulation Association, pp. 3441-3448, 13th Conference of International Building Performance SimulationAssociation, Chambery, France, 26-28 August.
Link:Link to publication record in Edinburgh Research Explorer
Document Version:Publisher final version (usually the publisher pdf)
Published In:Proceedings of BS2013
General rightsCopyright for the publications made accessible via the Edinburgh Research Explorer is retained by the author(s)and / or other copyright owners and it is a condition of accessing these publications that users recognise andabide by the legal requirements associated with these rights.
Take down policyThe University of Edinburgh has made every reasonable effort to ensure that Edinburgh Research Explorercontent complies with UK legislation. If you believe that the public display of this file breaches copyright pleasecontact [email protected] providing details, and we will remove access to the work immediately andinvestigate your claim.
Download date: 20. Feb. 2015
MODELLING URBAN SCALE RETROFIT, PATHWAYS TO 2050 LOW CARBON RESIDENTIAL BUILDING STOCK.
Simon Lannon 1, Aliki Georgakaki 1, Stuart Macdonald 2,
1 Welsh School of Architecture, Cardiff University, Bute Building, King Edward VII Ave, Cardiff, CF10 3NB, United Kingdom
2 EDINA, University of Edinburgh, Causewayside House, 160 Causewayside, Edinburgh, EH9 1PR United Kingdom
ABSTRACT A bottom up engineering modelling approach has been used to investigate the pathways to 2050 low carbon residential building stock. The impact of housing retrofit, renewable technologies, occupant behaviour, and grid decarbonisation is measured at a local authority scale. The results of this exercise were visualised using a client web application, or ‘demonstrator,’ which was developed to allow stakeholders to engage with the modelling process.
INTRODUCTION The UK government has set an ambitious target of 80% reduction of carbon emissions by the year 2050. As part of this target, it is predicted that the emissions related to buildings in 2050 will need to be close to zero. While the design of new zero carbon buildings has been researched, the potential for zero emission retrofit is less well known. As the vast majority of buildings that will exist in 2050 have already been built, and the interactions of the carbon emission reduction methods, such as fabric improvements, occupant behaviour and renewable technologies in the urban retrofit design process need to be researched further. The Welsh Government have committed to achieving annual emissions reductions of 3% carbon equivalents in areas within their competence (WAG, 2010a). The target includes all direct GHG emissions in Wales except those covered by the EU ETS. In addition, power generation emissions (covered by EU ETS) are also included in the 3% target, by assigning them to the end-user in each of the non-EU ETS sectors. This is in recognition of the importance of reducing electricity consumption as part of achieving sustainability goals. Taking the above into account, the residential sector becomes a key target area for reductions as it represent 30% of the emissions within Welsh Government competence (WAG, 2008) and the aspiration has been expressed to make all new buildings “zero carbon” in future. Other goals include reducing the use of carbon-based energy by 80-90%, and at least matching electricity consumption in Wales with power generated from renewable sources by 2025 (WAG, 2009) which would translate to more than 30TWh of renewable electricity and 3TWh of renewable heat per year.
More ambitious views have also been expressed, which involve generating twice as much renewable electricity in 2025 as presently consumed in Wales, and covering all local energy needs by low carbon electricity by 2050 (WAG, 2010b). In this context, local authorities in Wales share the responsibility of improving and maintaining building stock condition to certain levels of sustainability (NAW, 2001), and promoting the deployment of renewable energy schemes in their area (WAG, 2010c). The Welsh residential sector has a larger share of hard to treat properties compared to the rest of the UK. This could mean higher potential for energy efficiency improvements but also higher associated marginal costs (Baker and Preston, 2006). There is currently no representative residential stock model for Wales, and studies quoted in literature model the region based on data from other parts of the UK (Hinnels et al, 2007). In view of the policy targets and stakeholder responsibilities at the local authority level, it is necessary to obtain a more accurate portrayal of the sector in order to address stock-specific constraints and opportunities in Wales. Recent research has used a top-down model to derive insights on the impact of retrofit measures at local authority level (Gandhi et al. 2012). Focusing within the local authority at a lower level, this bottom-up approach goes one step further to demonstrate the possibility of providing policy makers and stakeholders at the local level with valuable information on the potential for retrofit based or area specific data.
Background Modelling the energy use of buildings at an urban level has been undertaken for many years, and different models have been created of which the majority fall into one of two approaches, top down or bottom up (Swan and Ugursal, 2009). Top down is commonly used as a statistical model of the built environment based on demographic data from sources such as the census and other national datasets. This information is applied at lower levels of geography to give area-based resolution of the modelling. Examples of top down include the UK Department of Energy & Climate Change (DECC) 2050 calculator (DECC 2011), The Economics of
3URFHHGLQJV�RI�%6��������WK�&RQIHUHQFH�RI�,QWHUQDWLRQDO�%XLOGLQJ�3HUIRUPDQFH�6LPXODWLRQ�$VVRFLDWLRQ��&KDPEpU\��)UDQFH��$XJXVW������
��������
Low Carbon Cities (Gouldson et al, 2012), DeCarb (Natarajan, 2007). Bottom up models, sometimes known as engineering models use data on individual buildings that are aggregated up to the larger scale. The individual buildings can be grouped together or classified into archetypes to aid the data collection and modelling process (Jones, et al, 2007) A model that attempts to bridge the gap between academic endeavour and the public is the DECC 2050 calculator, an emission model for all sectors of the UK economy, which considers a number of options for each sector based upon economic and energy models .
SCENARIOS AND PATHWAYS Many pathways and scenarios have been created to show how emission reduction targets can be achieved, for example, Carbon Trust “Building the future today” (Carbon Trust, 2009), but they are generally based on a top down approach. Therefore, they tend to give broad guidance on the impact of the work on the ground. In this work, a framework has been developed to take these top down approaches and merge them with a bottom up model of a large urban area based on the Energy and Environmental Prediction (EEP) model (Jones, et al, 2000). The grid decarbonisation pathways chosen for the modelling process have taken data and waypoints from the UK Energy Research Centre (UKERC) 2050 Carbon Pathway (DECC 2011). Concepts regarding affordability of energy efficiency measures have been taken from the Carbon trust “Building the future, today” research (Carbon Trust, 2009). The outcome of the scenario analysis was three example possible future scenarios:
Scenario 1 – Faint Hearted Generally business as usual, some minor attempts to decarbonise the grid and continued slow energy efficiency update.
Scenario 2 – Low Carbon Reference The government invests in partial decarbonisation of the grid through reduced dependence on fossil fuels. Large investment in energy efficiency and small scale renewable, some change in occupant behaviour.
Scenario 3 – Super Ambitious The government invests in full decarbonisation of the grid through renewable, nuclear, and huge investment in energy efficiency and small scale renewable. There is also large scale change in occupant behaviour. Each of these scenarios can be broken down into four components that have an impact on the emissions of buildings; the electric national grid, small-scale renewable technologies, energy efficiency and occupant behaviours. Choices for these components are introduced in the model through sliders, covering
the range of change corresponding to the scenarios described above.
The Grid The supply of energy in the UK is usually through the national grid, which uses a mix of fuel sources to generate electricity. This mix, which includes fossil fuels, has an overall emission rate for each unit of energy delivered to houses. The government plans to reduce this emission rate by decarbonising the grid. This slider represents the government policy range from business as usual Faint-heart with 0.422 kg CO2 per kWh to super ambitious decarbonisation with 0.08 kg CO2 per kWh.
Renewables Small scale or building renewable energy systems can help to reduce the carbon emissions of buildings. This slider selects the number of photovoltaic panels installed on buildings, from around 10% to over 80% of houses having some or their entire roof covered in panels.
Energy Efficiency There are simple measures currently available to reduce energy use in the home. These include loft insulation, new boilers, double glazing and low energy lighting. However, if houses are to reach the targets set by the government, options that are more expensive need to be considered, for example external wall insulation. This slider varies from a business as usual scenario to 100% uptake of simple measures and to a nearly 100% uptake of expensive options.
Occupant Behaviour The way people use their houses has an impact on energy use. This slider changes the indoor temperature of the house set by the occupant; it varies from 21 degrees C to 17 degrees C representing a business as usual scenario to large scale change in user behaviour, i.e. lower expectation for indoor temperatures and more clothes worn.
CASE STUDY AREA The area chosen for the case study is Neath Port Talbot County Borough Council (NPTCBC). Based on DECC estimates (DECC, 2007) NPTCBC contains 4.7% of the households in Wales, which compares well with UK National Atmospheric Emissions Inventory (NAEI) data (NAEI, 2008) attributing 4.4% of domestic emissions to the area.
Domestic EEP Database The data used in the case study area is based on the surveyed properties entered into the EEP database. The list of domestic properties for the county borough was generated from the Postal Address File and the Ordnance Survey Addresspoint file supplied by NPTCBC. This contains 58,041 domestic properties of which 55,148 have been entered into the
3URFHHGLQJV�RI�%6��������WK�&RQIHUHQFH�RI�,QWHUQDWLRQDO�%XLOGLQJ�3HUIRUPDQFH�6LPXODWLRQ�$VVRFLDWLRQ��&KDPEpU\��)UDQFH��$XJXVW������
��������
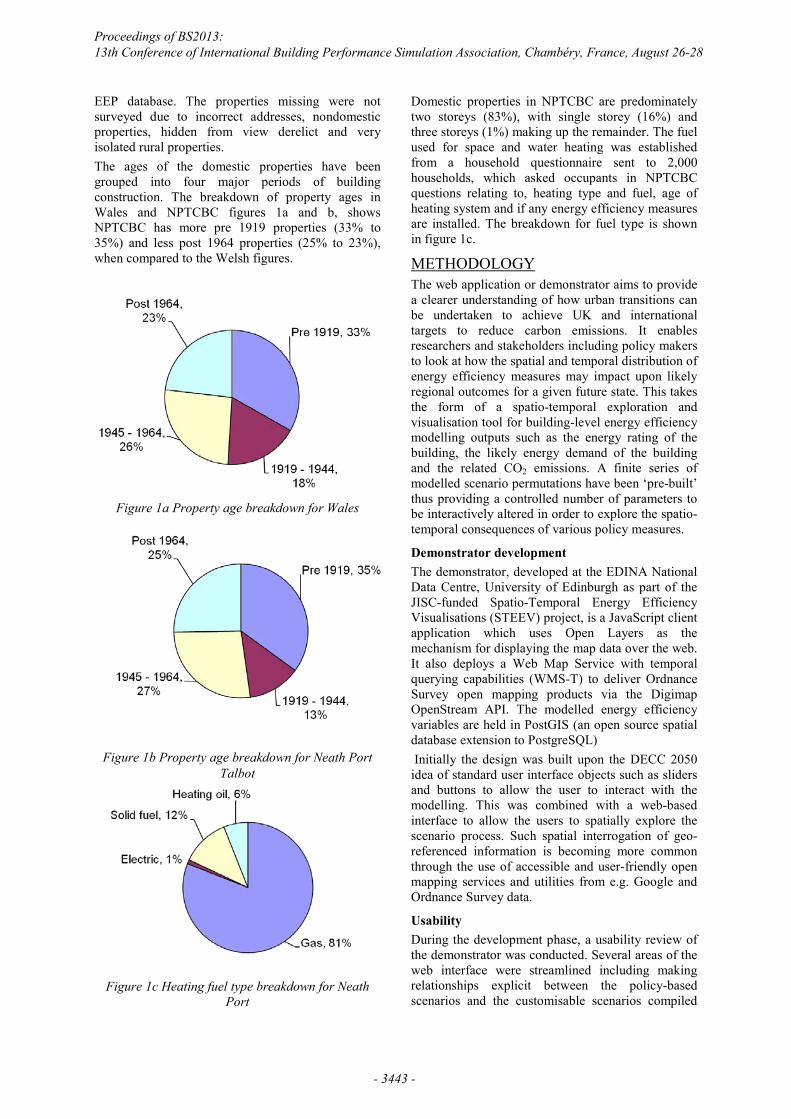
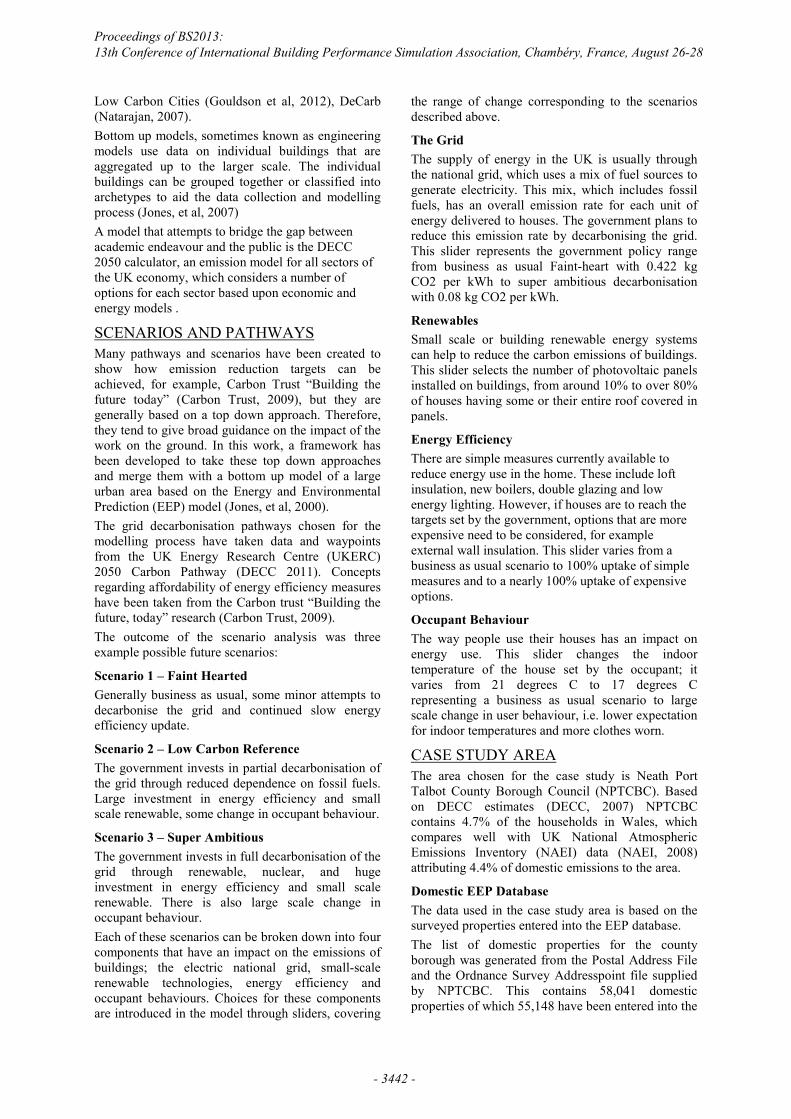
EEP database. The properties missing were not surveyed due to incorrect addresses, nondomestic properties, hidden from view derelict and very isolated rural properties. The ages of the domestic properties have been grouped into four major periods of building construction. The breakdown of property ages in Wales and NPTCBC figures 1a and b, shows NPTCBC has more pre 1919 properties (33% to 35%) and less post 1964 properties (25% to 23%), when compared to the Welsh figures.
Figure 1a Property age breakdown for Wales
Figure 1b Property age breakdown for Neath Port Talbot
Figure 1c Heating fuel type breakdown for Neath
Port
Domestic properties in NPTCBC are predominately two storeys (83%), with single storey (16%) and three storeys (1%) making up the remainder. The fuel used for space and water heating was established from a household questionnaire sent to 2,000 households, which asked occupants in NPTCBC questions relating to, heating type and fuel, age of heating system and if any energy efficiency measures are installed. The breakdown for fuel type is shown in figure 1c.
METHODOLOGY The web application or demonstrator aims to provide a clearer understanding of how urban transitions can be undertaken to achieve UK and international targets to reduce carbon emissions. It enables researchers and stakeholders including policy makers to look at how the spatial and temporal distribution of energy efficiency measures may impact upon likely regional outcomes for a given future state. This takes the form of a spatio-temporal exploration and visualisation tool for building-level energy efficiency modelling outputs such as the energy rating of the building, the likely energy demand of the building and the related CO2 emissions. A finite series of modelled scenario permutations have been ‘pre-built’ thus providing a controlled number of parameters to be interactively altered in order to explore the spatio-temporal consequences of various policy measures.
Demonstrator development The demonstrator, developed at the EDINA National Data Centre, University of Edinburgh as part of the JISC-funded Spatio-Temporal Energy Efficiency Visualisations (STEEV) project, is a JavaScript client application which uses Open Layers as the mechanism for displaying the map data over the web. It also deploys a Web Map Service with temporal querying capabilities (WMS-T) to deliver Ordnance Survey open mapping products via the Digimap OpenStream API. The modelled energy efficiency variables are held in PostGIS (an open source spatial database extension to PostgreSQL) Initially the design was built upon the DECC 2050 idea of standard user interface objects such as sliders and buttons to allow the user to interact with the modelling. This was combined with a web-based interface to allow the users to spatially explore the scenario process. Such spatial interrogation of geo-referenced information is becoming more common through the use of accessible and user-friendly open mapping services and utilities from e.g. Google and Ordnance Survey data.
Usability During the development phase, a usability review of the demonstrator was conducted. Several areas of the web interface were streamlined including making relationships explicit between the policy-based scenarios and the customisable scenarios compiled
3URFHHGLQJV�RI�%6��������WK�&RQIHUHQFH�RI�,QWHUQDWLRQDO�%XLOGLQJ�3HUIRUPDQFH�6LPXODWLRQ�$VVRFLDWLRQ��&KDPEpU\��)UDQFH��$XJXVW������
��������
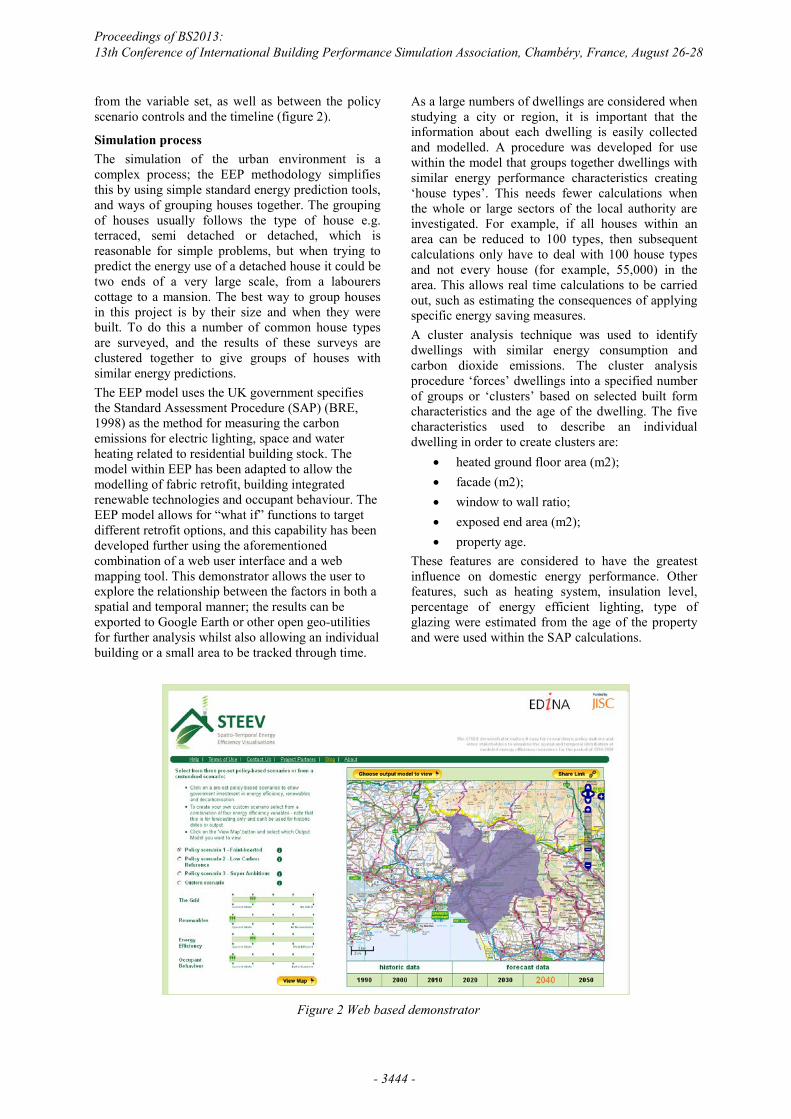
from the variable set, as well as between the policy scenario controls and the timeline (figure 2).
Simulation process The simulation of the urban environment is a complex process; the EEP methodology simplifies this by using simple standard energy prediction tools, and ways of grouping houses together. The grouping of houses usually follows the type of house e.g. terraced, semi detached or detached, which is reasonable for simple problems, but when trying to predict the energy use of a detached house it could be two ends of a very large scale, from a labourers cottage to a mansion. The best way to group houses in this project is by their size and when they were built. To do this a number of common house types are surveyed, and the results of these surveys are clustered together to give groups of houses with similar energy predictions. The EEP model uses the UK government specifies the Standard Assessment Procedure (SAP) (BRE, 1998) as the method for measuring the carbon emissions for electric lighting, space and water heating related to residential building stock. The model within EEP has been adapted to allow the modelling of fabric retrofit, building integrated renewable technologies and occupant behaviour. The EEP model allows for “what if” functions to target different retrofit options, and this capability has been developed further using the aforementioned combination of a web user interface and a web mapping tool. This demonstrator allows the user to explore the relationship between the factors in both a spatial and temporal manner; the results can be exported to Google Earth or other open geo-utilities for further analysis whilst also allowing an individual building or a small area to be tracked through time.
As a large numbers of dwellings are considered when studying a city or region, it is important that the information about each dwelling is easily collected and modelled. A procedure was developed for use within the model that groups together dwellings with similar energy performance characteristics creating ‘house types’. This needs fewer calculations when the whole or large sectors of the local authority are investigated. For example, if all houses within an area can be reduced to 100 types, then subsequent calculations only have to deal with 100 house types and not every house (for example, 55,000) in the area. This allows real time calculations to be carried out, such as estimating the consequences of applying specific energy saving measures. A cluster analysis technique was used to identify dwellings with similar energy consumption and carbon dioxide emissions. The cluster analysis procedure ‘forces’ dwellings into a specified number of groups or ‘clusters’ based on selected built form characteristics and the age of the dwelling. The five characteristics used to describe an individual dwelling in order to create clusters are:
heated ground floor area (m2); facade (m2); window to wall ratio; exposed end area (m2); property age.
These features are considered to have the greatest influence on domestic energy performance. Other features, such as heating system, insulation level, percentage of energy efficient lighting, type of glazing were estimated from the age of the property and were used within the SAP calculations.
Figure 2 Web based demonstrator
3URFHHGLQJV�RI�%6��������WK�&RQIHUHQFH�RI�,QWHUQDWLRQDO�%XLOGLQJ�3HUIRUPDQFH�6LPXODWLRQ�$VVRFLDWLRQ��&KDPEpU\��)UDQFH��$XJXVW������
��������
Clustering results In this case study 100 clusters were by date of construction, 34 for pre 1919, 13 for 1919 to 1944, 27 for 1945 to 1964 and 23 for post 1964. These numbers reflect the age breakdown for the local authority area. When the clusters are applied to the case study area, it was found that fourteen clusters represent over 67% of the dwellings, and cluster 55 represents 13.6% of the dwellings (Table 1).
Table 1 Clustering breakdown for case study area
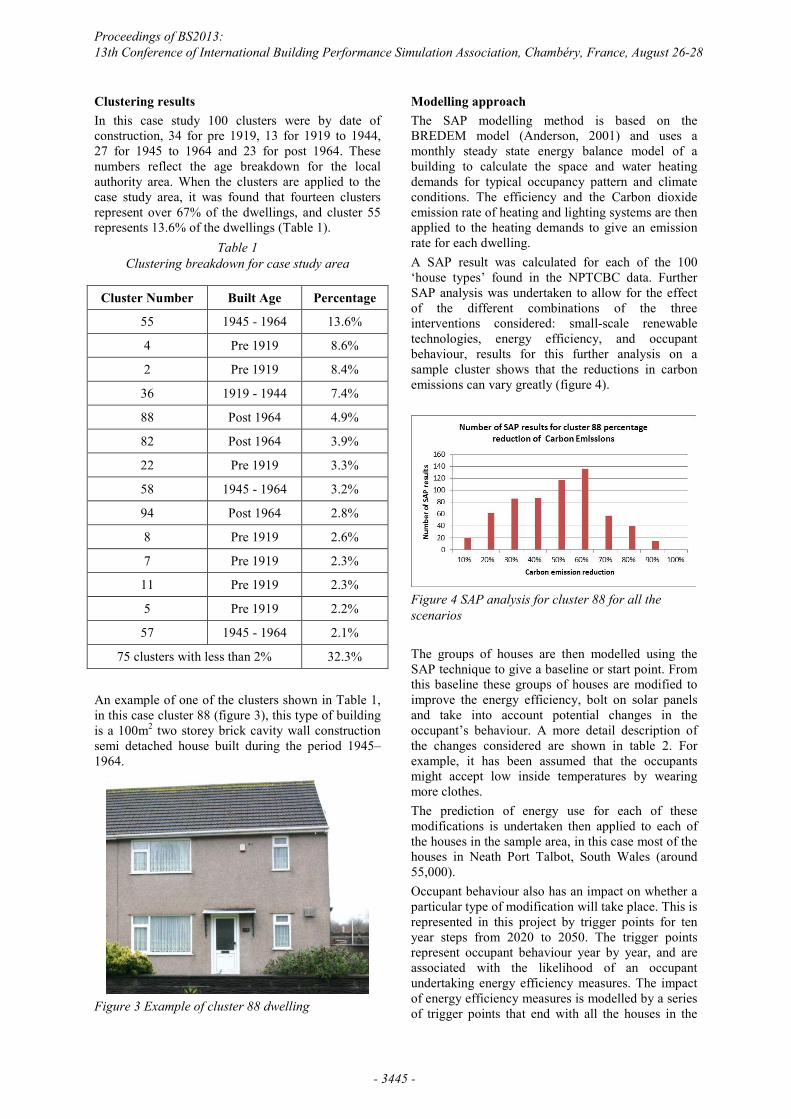
An example of one of the clusters shown in Table 1, in this case cluster 88 (figure 3), this type of building is a 100m2 two storey brick cavity wall construction semi detached house built during the period 1945– 1964.
Figure 3 Example of cluster 88 dwelling
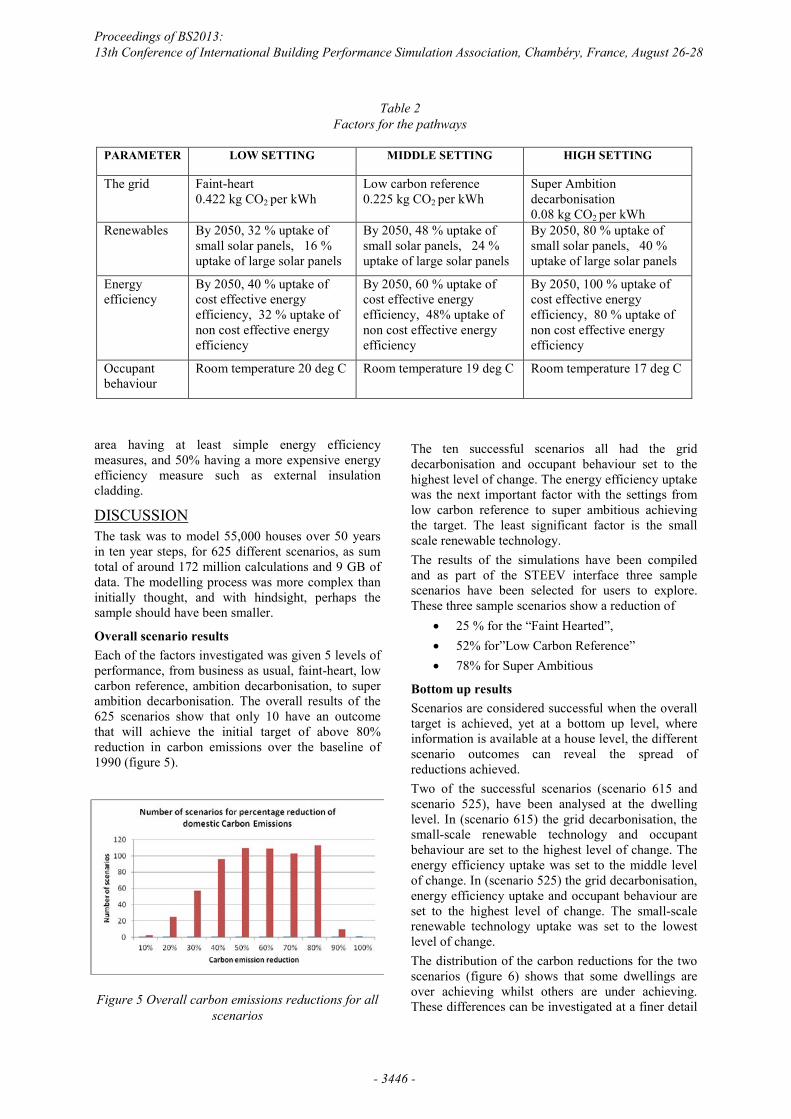
Modelling approach The SAP modelling method is based on the BREDEM model (Anderson, 2001) and uses a monthly steady state energy balance model of a building to calculate the space and water heating demands for typical occupancy pattern and climate conditions. The efficiency and the Carbon dioxide emission rate of heating and lighting systems are then applied to the heating demands to give an emission rate for each dwelling. A SAP result was calculated for each of the 100 ‘house types’ found in the NPTCBC data. Further SAP analysis was undertaken to allow for the effect of the different combinations of the three interventions considered: small-scale renewable technologies, energy efficiency, and occupant behaviour, results for this further analysis on a sample cluster shows that the reductions in carbon emissions can vary greatly (figure 4).
Figure 4 SAP analysis for cluster 88 for all the scenarios The groups of houses are then modelled using the SAP technique to give a baseline or start point. From this baseline these groups of houses are modified to improve the energy efficiency, bolt on solar panels and take into account potential changes in the occupant’s behaviour. A more detail description of the changes considered are shown in table 2. For example, it has been assumed that the occupants might accept low inside temperatures by wearing more clothes. The prediction of energy use for each of these modifications is undertaken then applied to each of the houses in the sample area, in this case most of the houses in Neath Port Talbot, South Wales (around 55,000). Occupant behaviour also has an impact on whether a particular type of modification will take place. This is represented in this project by trigger points for ten year steps from 2020 to 2050. The trigger points represent occupant behaviour year by year, and are associated with the likelihood of an occupant undertaking energy efficiency measures. The impact of energy efficiency measures is modelled by a series of trigger points that end with all the houses in the
Cluster Number Built Age Percentage
55 1945 - 1964 13.6%
4 Pre 1919 8.6%
2 Pre 1919 8.4%
36 1919 - 1944 7.4%
88 Post 1964 4.9%
82 Post 1964 3.9%
22 Pre 1919 3.3%
58 1945 - 1964 3.2%
94 Post 1964 2.8%
8 Pre 1919 2.6%
7 Pre 1919 2.3%
11 Pre 1919 2.3%
5 Pre 1919 2.2%
57 1945 - 1964 2.1%
75 clusters with less than 2% 32.3%
3URFHHGLQJV�RI�%6��������WK�&RQIHUHQFH�RI�,QWHUQDWLRQDO�%XLOGLQJ�3HUIRUPDQFH�6LPXODWLRQ�$VVRFLDWLRQ��&KDPEpU\��)UDQFH��$XJXVW������
��������
area having at least simple energy efficiency measures, and 50% having a more expensive energy efficiency measure such as external insulation cladding.
DISCUSSION The task was to model 55,000 houses over 50 years in ten year steps, for 625 different scenarios, as sum total of around 172 million calculations and 9 GB of data. The modelling process was more complex than initially thought, and with hindsight, perhaps the sample should have been smaller.
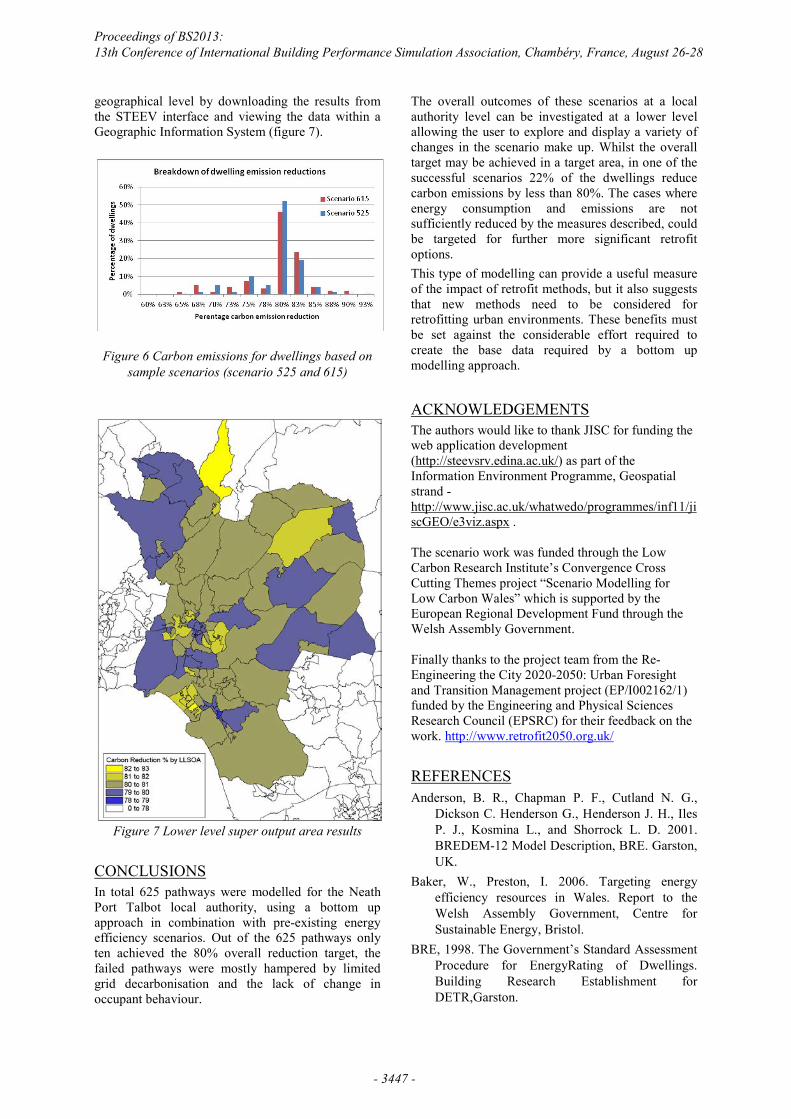
Overall scenario results Each of the factors investigated was given 5 levels of performance, from business as usual, faint-heart, low carbon reference, ambition decarbonisation, to super ambition decarbonisation. The overall results of the 625 scenarios show that only 10 have an outcome that will achieve the initial target of above 80% reduction in carbon emissions over the baseline of 1990 (figure 5).
Figure 5 Overall carbon emissions reductions for all
scenarios
The ten successful scenarios all had the grid decarbonisation and occupant behaviour set to the highest level of change. The energy efficiency uptake was the next important factor with the settings from low carbon reference to super ambitious achieving the target. The least significant factor is the small scale renewable technology. The results of the simulations have been compiled and as part of the STEEV interface three sample scenarios have been selected for users to explore. These three sample scenarios show a reduction of
25 % for the “Faint Hearted”, 52% for”Low Carbon Reference” 78% for Super Ambitious
Bottom up results Scenarios are considered successful when the overall target is achieved, yet at a bottom up level, where information is available at a house level, the different scenario outcomes can reveal the spread of reductions achieved. Two of the successful scenarios (scenario 615 and scenario 525), have been analysed at the dwelling level. In (scenario 615) the grid decarbonisation, the small-scale renewable technology and occupant behaviour are set to the highest level of change. The energy efficiency uptake was set to the middle level of change. In (scenario 525) the grid decarbonisation, energy efficiency uptake and occupant behaviour are set to the highest level of change. The small-scale renewable technology uptake was set to the lowest level of change. The distribution of the carbon reductions for the two scenarios (figure 6) shows that some dwellings are over achieving whilst others are under achieving. These differences can be investigated at a finer detail
Table 2 Factors for the pathways
PARAMETER LOW SETTING MIDDLE SETTING HIGH SETTING
The grid Faint-heart 0.422 kg CO2 per kWh
Low carbon reference 0.225 kg CO2 per kWh
Super Ambition decarbonisation 0.08 kg CO2 per kWh
Renewables By 2050, 32 % uptake of small solar panels, 16 % uptake of large solar panels
By 2050, 48 % uptake of small solar panels, 24 % uptake of large solar panels
By 2050, 80 % uptake of small solar panels, 40 % uptake of large solar panels
Energy efficiency
By 2050, 40 % uptake of cost effective energy efficiency, 32 % uptake of non cost effective energy efficiency
By 2050, 60 % uptake of cost effective energy efficiency, 48% uptake of non cost effective energy efficiency
By 2050, 100 % uptake of cost effective energy efficiency, 80 % uptake of non cost effective energy efficiency
Occupant behaviour
Room temperature 20 deg C Room temperature 19 deg C Room temperature 17 deg C
3URFHHGLQJV�RI�%6��������WK�&RQIHUHQFH�RI�,QWHUQDWLRQDO�%XLOGLQJ�3HUIRUPDQFH�6LPXODWLRQ�$VVRFLDWLRQ��&KDPEpU\��)UDQFH��$XJXVW������
��������
geographical level by downloading the results from the STEEV interface and viewing the data within a Geographic Information System (figure 7).
Figure 6 Carbon emissions for dwellings based on sample scenarios (scenario 525 and 615)
Figure 7 Lower level super output area results
CONCLUSIONS In total 625 pathways were modelled for the Neath Port Talbot local authority, using a bottom up approach in combination with pre-existing energy efficiency scenarios. Out of the 625 pathways only ten achieved the 80% overall reduction target, the failed pathways were mostly hampered by limited grid decarbonisation and the lack of change in occupant behaviour.
The overall outcomes of these scenarios at a local authority level can be investigated at a lower level allowing the user to explore and display a variety of changes in the scenario make up. Whilst the overall target may be achieved in a target area, in one of the successful scenarios 22% of the dwellings reduce carbon emissions by less than 80%. The cases where energy consumption and emissions are not sufficiently reduced by the measures described, could be targeted for further more significant retrofit options. This type of modelling can provide a useful measure of the impact of retrofit methods, but it also suggests that new methods need to be considered for retrofitting urban environments. These benefits must be set against the considerable effort required to create the base data required by a bottom up modelling approach.
ACKNOWLEDGEMENTS The authors would like to thank JISC for funding the web application development (http://steevsrv.edina.ac.uk/) as part of the Information Environment Programme, Geospatial strand - http://www.jisc.ac.uk/whatwedo/programmes/inf11/jiscGEO/e3viz.aspx . The scenario work was funded through the Low Carbon Research Institute’s Convergence Cross Cutting Themes project “Scenario Modelling for Low Carbon Wales” which is supported by the European Regional Development Fund through the Welsh Assembly Government. Finally thanks to the project team from the Re-Engineering the City 2020-2050: Urban Foresight and Transition Management project (EP/I002162/1) funded by the Engineering and Physical Sciences Research Council (EPSRC) for their feedback on the work. http://www.retrofit2050.org.uk/
REFERENCES Anderson, B. R., Chapman P. F., Cutland N. G.,
Dickson C. Henderson G., Henderson J. H., Iles P. J., Kosmina L., and Shorrock L. D. 2001. BREDEM-12 Model Description, BRE. Garston, UK.
Baker, W., Preston, I. 2006. Targeting energy efficiency resources in Wales. Report to the Welsh Assembly Government, Centre for Sustainable Energy, Bristol.
BRE, 1998. The Government’s Standard Assessment Procedure for EnergyRating of Dwellings. Building Research Establishment for DETR,Garston.
3URFHHGLQJV�RI�%6��������WK�&RQIHUHQFH�RI�,QWHUQDWLRQDO�%XLOGLQJ�3HUIRUPDQFH�6LPXODWLRQ�$VVRFLDWLRQ��&KDPEpU\��)UDQFH��$XJXVW������
��������
Carbon Trust, 2009, Building the future, today, CTC765, Carbon Trust, London
DECC. 2007. Quality indicators for regional and local authority level electricity and gas consumption. URN 09D/431/REV22007.
DECC 2011, DECC 2050 Pathways calculator, http://2050-calculator-tool.decc.gov.uk
Gandhi, K., Georgakaki, A., Kerr, N., Gouldson, A., Eames., M. 2012. Regional scale modelling on the potential of energy, cost and carbon emission savings from retrofit of low carbon measures in the Welsh domestic sector. 1st International Conference for Urban Sustainability and Resilience, 5-6 November 2012, UCL, London.
Gouldson, A., Kerr, N., Topi, C., Dawkins, E., Kuylenstierna, J., Pearce, R. 2012, The Economics of Low Carbon Cities. A Mini-Stern Review for the Leeds City Region. Centre for Low Carbon Futures, School of Earth and Environment, University of Leeds.
Hinnells M. Boardman, B., Layberry, R., Darby, S., Killip, G. 2007. The UK Housing Stock 2005- to 2050: Assumptions used in Scenarios and Sensitivity Analysis in UKDCM2. Environmental Change Institute, University of Oxford
Jones, P., Williams, J.L., and Lannon, S., 2000, Planning for a Sustainable City: an Energy and Environmental Prediction Model, Journal of Environmental Planning and Management, vol. 43, no. 6, pp. 855-872(18)
Jones, P.J., Patterson, J.L., Lannon, S 2007. Modelling the built environment at an urban scale—Energy and health impacts in relation to housing, Landscape and Urban Planning 83, 39–49
NAEI. 2008. Data Warehouse, Mapped Emissions Data, 2008 Emission Maps, CO2 Emissions by energy users/suppliers - 2008, CO2 emissions by 1x1km: Crown copyright 2008.
Natarajan, S. and Levermore, G. J., 2007. Predicting future UK housing stock and carbon emissions. Energy Policy, 35 (11), pp. 5719-5727.
NAW. 2001.Better Homes for People in Wales. A National Housing Strategy for Wales. Cardiff: National Assembly for Wales, Housing Strategy Branch; 2001.
Swan, L.G., Ugursal, V.I. 2009. Modeling of end-use energy consumption in the residential sector: A review of modeling techniques, Renewable and Sustainable Energy Reviews, 13(8): 1819-1835.
WAG. 2008. Setting a baseline for reductions in greenhouse gas emissions in areas of devolved Welsh Assembly Government competence and monitoring progress towards achieving targets.
Welsh Assembly Government Climate Change Commission - Research, Methodologies and Economics Working Group; 2008.
WAG. 2009. One Wales: One Planet - The Sustainable Development Scheme of the Welsh Assembly Government, Welsh Assembly Government, May 2009.
WAG. 2010a. Climate Change Strategy for Wales, Welsh Assembly Government; October 2010.
WAG. 2010b. A Low Carbon Revolution – The Welsh Assembly Government Energy Policy Statement. Welsh Assembly Government, 2010.
WAG. 2010c. Planning Policy Wales, Edition 3, Welsh Assembly Government; 2010.
3URFHHGLQJV�RI�%6��������WK�&RQIHUHQFH�RI�,QWHUQDWLRQDO�%XLOGLQJ�3HUIRUPDQFH�6LPXODWLRQ�$VVRFLDWLRQ��&KDPEpU\��)UDQFH��$XJXVW������
��������