editorial office of oeconomica
TRANSCRIPT


EDITORIAL OFFICE OF OECONOMICA : Teodor Mihali str. no. 58-60, s. 231, 418655 Cluj-Napoca, Phone: 0040-264-41.86.52, [email protected], www.econ.ubbcluj.ro/oeconomica.html
EDITORIAL BOARD
EDITOR:
Dumitru Mati ş Babeş-Bolyai University, Cluj-Napoca, ROMANIA EXECUTIVE EDITOR:
Cristian Drago ş Babeş-Bolyai University, Cluj-Napoca, ROMANIA
CO-EDITORS:
Dumitru Miron ASE Bucharest, ROMANIA
Ioan Talpo ş West University, Timişoara, ROMANIA
ADVISORY BOARD
Dana Bako Babeş-Bolyai University, Cluj-Napoca, ROMANIA
Ivan Bélyacz Pécs University, Pécs, HUNGARY
Gabriela Bodea Babeş-Bolyai University, Cluj-Napoca, ROMANIA
Anca Borza Babeş-Bolyai University, Cluj-Napoca, ROMANIA
Chikan Attila Corvinus University, Budapest, HUNGARY
Gheorghe Ciobanu Babeş-Bolyai University, Cluj-Napoca, ROMANIA
Ernesto Volpe Di Prignano La Sapienza University, Rome, ITALY
Mihaela Dr ăgan Babeş-Bolyai University, Cluj-Napoca, ROMANIA
Diana Filip Babeş-Bolyai University, Cluj-Napoca, ROMANIA
Gyula Horváth Pécs University, Pécs, HUNGARY
Dorina Laz ăr Babeş-Bolyai University, Cluj-Napoca, ROMANIA
Ştefan Ni Ńchi Babeş-Bolyai University, Cluj-Napoca, ROMANIA Maria Parli ńska University of Warsaw, POLAND
Adrian Pop University of Nantes, FRANCE
Marius Pop Babeş-Bolyai University, Cluj-Napoca, ROMANIA
Roxana Stegerean Babeş-Bolyai University, Cluj-Napoca, ROMANIA
Vincent Šoltés University of Košice, SLOVAKIA
Daniel Stavarek Silesian University, Karvina, CZECH REPUBLIC
Adriana Tiron-Tudor Babeş-Bolyai University, Cluj-Napoca, ROMANIA
Alexandru Todea Babeş-Bolyai University, Cluj-Napoca, ROMANIA
Patrick Villieu University of Orleans, FRANCE
Maria Vincze Babeş-Bolyai University, Cluj-Napoca, ROMANIA
EDITORIAL ASISTANTS
Corina Gavrea, Babeş-Bolyai University, Cluj-Napoca, ROMANIA
Gabriela Mihalca, Babeş-Bolyai University, Cluj-Napoca, ROMANIA

ANUL LI 2006
STUDIA UNIVERSITATIS BABE Ş-BOLYAI
OECONOMICA 2
EDITORIAL OFFICE OF OECONOMICA : Teodor Mihali str. no. 58-60, s. 231, 400591 Cluj-Napoca,
Phone: 0040-264-41.86.52, [email protected], www.econ.ubbcluj.ro/oeconomica.html
SUMAR – SOMMAIRE – CONTENTS – INHALT
G. KOCZISZKY Chances of Convergence of the Region of Northern Hungary ….....................
3
C. DRAGOŞ Le comportement d’un marché automobile emergent. Estimation par un modèle Nested Logit ……………………………………………..…………………
23
F. KUPFERSCHMIDT, A. GOZMAN What do Entrepreneurs Expect from Romania’s Accession? Results from an Expert Interview Survey ……………………………………………………………
43
M.F. BǍCILĂ, O.A. GICǍ An Overview of the Causes, Factors and Advantages of Strategic Alliances between Companies and Universities. The Case of Romania ……………….
53
B.Z. NAGY Corporate Restructuring and Controlling Interest The Issue of Return Reversals and Momentum on The Bucharest Stock Exchange .......................
69

D. KESIČ, A. BERTONCEL Strategic Challenges of Romanian Pharmaceutical Industry …………………
83
A. TIRON TUDOR Implementing the Accrual Accounting in Public Sector – East European Countries Experience ………………………….………….……………………….
95

3
STUDIA UNIVERSITATIS BABEŞ-BOLYAI, OECONOMICA, LI, 2, 2006
CHANCES OF CONVERGENCE OF THE REGION OF NORTHERN HUNGARY
György KOCZISZKY * University of Miskolc, Hungary
Abstract . The period 2007-2013 may be of decisive importance regarding the so-cial and economic processes in the region of Northern Hungary for at least two reasons. The first long-term development program (7 years) was prepared after the changes in economic policy of 1989 in order to improve the competitiveness of the region. On the other hand, the amount of the funds that can be called (as proved by the analyses) will facilitate to induce a demonstrable economic growth in the re-gion. The plans take a change in paradigm into account: the convergence of the region is planned to be based on creating and strengthening the foundations of a competitive economy. JEL Classification: R11 Keywords: convergence, regional development, cost-benefit analysis
Introduction
In the past fifteen years the socio-economic-ecological maps of the post-socialist countries, among them that of Hungary, have undergone considerable changes. In the last decade of the 20th century economic polarisation between the regions has intensified, and as proven by the statistical data, the regional devel-opment policy (which has treated the convergence of the backward regions as a declared top priority since 1995) has not achieved any spectacular results. The tendency has namely not changed in effect: the better-off regions in Hungary have got into a more advantageous position1/, and the disadvantage of the backward re-gions (although only by a few per cents, but still) continued to increase (Figure 1)2/,
*Corresponding author. Faculty of Economics. Adress: 3515 Miskolc Egyetemváros, Hungary. Phone: 0036 46 565200. E-mail: [email protected] 1/ The Central Statistics Office (KSH) has been calculating data of regional and county GDP suitable for measuring and comparing the economic performance since 1994. 2/ The ranking of the regions has not basically changed in the nine years till 2003. According to the per capita GDP value, the first three ranks were taken by Central Hungary, Western Dunántúl and Central Dunántúl, respectively, each year. The other four regions have also shown only moderate and temporary steps forward or backward during the years. Although the regions have maintained their rankings according to the status in 1994, the differences between regions representing the extreme values have become more pronounced: the first

4
while only the smaller part of the regional development subsidies found its way to the backward regions, e.g. to the region of Northern Hungary (Figure 2).
Figure 1. Per capita GDP as percentage of the national average
69,273,6
82,983,6
86,4
100,5
146,6
92,4
161,0
107,6
64,065 ,368,0
71,6
50
70
90
110
130
150
170
Central H ungary W etern D unántúl C entral Dunántúl SouthernD unántúl
Southern A lfö ld N orthern A lfö ld NorthernM agyarország
1994 2005
Source: Central Statistics Office (KSH) By contrast, as can be seen from the allocation of funds, the most developed re-gion of Central Hungary receives nearly half of all the funds (Figure 2).
Figure 2: Decentralised regional development subsidy, 2004 (HUF)
46.43%
7.50%
8.51%
10.50%9.32%
10.45%
7.29%
1. Southern Alföld (15488850356)
1. Southern Dunántúl (12558172137)
2. Central Dunántúl (11073198681)
3. Central Hungary (685249751)
4. Western Dunántúl (10761146984)
5. Northern Alföld (15419802056)
6. Northern Hungary (13751482114)
1.
2.
3.
4.
5.
6.
7.
Source: National Development Office
three regions could claim an even higher percentage of the per capita national average GDP, while the other regions could claim an even lower percentage than nine years before. The region of Central Hungary has shown particular strengthening, while the economic per-formance of Southern Alföld was the poorest.

5
It poses a question what quota of the new seven-year EU budget the backward regions will be able to call, and whether the funds collected will promote convergence. (According to preliminary calculations in 2007-2013 Hungary will be able to call annually two and a half times as many funds - 3.5-4 % of the Hungarian GDP - as it did in the first three years after accession.)
It is justified to raise the questions: to what extent will the next 7 years con-tribute to the convergence of the region of Northern Hungary; will the negative ten-dency prevailing for more than 15 years be reversed, and if it is, what extent of convergence can be counted with? Competitiveness versus convergence
Uneven regional development (independent of the level of development) can be detected and shown in all the countries of the world3/. The specialist literature of regional economics dealing with the issues presents a basically uniform standpoint regarding the causes underlying regional disparities and the issue of the state (budgetary) intervention required for their moderation; but is less uniform in judging the issue of the nature of the role.
Beyond the differing economic policy approaches, the fact that for a long time less attention has been devoted to the socio-economic usefulness of devel-opment interventions as well as to showing their impact on regional convergences also plays a role. Perhaps it can also be attributed to that that the rate of regional convergence has fallen behind the desirable level in most countries in spite of the increasing subsidies.
In the regional policy of the EU, the Lisbon strategy4/ launched a change in paradigm. In addition to the previous, almost exclusive objective of convergence, a growing emphasis is laid on increasing competitiveness. This means that it is be-coming more and more obvious: when there are no measures strengthening com-petitiveness, convergence will proceed much more slowly. On the other hand, the deterioration of the competitive position of the Community will generate budget dis-putes again and again, as a result of which fewer and fewer funds can be obtained for funding the programs designed to achieve convergence.
These signs have already appeared; in spite of the emergence of the new member states (an increase in the number of “mouths to be fed” and a growth in regional disparities), the amounts of the funds available for regional equalisation have not increased in specific terms. Therefore more definite changes in the meth-odology are needed, many more characteristic efficiency analyses and impact
3/ An example is the post-accession European Union, where taking the average of the 25 member states as the basis, in the 10 regions with the highest performance in 2004 the per capita GDP was 189 % of the average, while in the 10 most backward regions it was 36 %. As a result, the per capita GDP of 64 regions (more than one fourth of the population of the Union) does not reach an average of 75 %. In the new member states this affects 90 % of the population (with the exception of the regions of Prague, Bratislava and Budapest as well as the population of Cyprus and Slovenia, practically all the population). In the EU-15 it af-fects only 13 % of the population. (htp://uropa.eu.int/comm/regional_policy/sources/docoffic/official/reports/interim3:en.htm). 4/ In March 2000 the leaders of the member states set the objective that by 2010 the EU “shall become the most dynamic and competitive knowledge-based economy in the world”, “which is capable of sustainable economic growth, with more and better jobs and greater social cohesion and respect to the environment.”

6
studies have to be performed than at present at the national level in the allocation of the funds. The practice in Hungary also has to be changed, for today we only now and again find ex-ante analyses. Although the legislation background is well-ordered in Hungary (Act XXI of 1996 on regional development and country plan-ning obliges the government to report biannually to the Parliament on the devel-opment of regional processes and the experiences of regional development pol-icy5/), however, as it is proven by the first two reports, no essential steps have been taken towards the allocation of funds with efficiency as its priority.
We are of the opinion therefore that, in the planning phase preparing the allocation of funds in the next period, it is justified to raise the question of what impact re-gional development interventions have.
This is a particularly exciting exercise if we think of the fact that the Com-munity funds available annually in the period 2007-2013 are by orders larger that those in 2004-2006. On the other hand, the domestic own resources required for making use of the funds will practically deplete the domestic budgetary allowance for development (that is, beyond what is formulated in the National Reference Framework being prepared now, there will be hardly any government funds for funding further programs). Therefore it does matter what for and with what effi-ciency the potential financial estimates are used!
The efficiency of using the available funds (beyond the standards of the programs and projects) depends to quite a considerable extent on how the practice in planning in Hungary changes; that is:
• Does the decision maker intend to demonstrate the expected and actual impacts? Does the amount of the impact shown by the experts play a role in the allocation of funds; are the decision makers influenced in drawing up the financial plans by the social usefulness of the programs, by the extent of their regional impacts, or will they ignore them?
• Are the experts involved in regional planning familiar with the methods of impact studies?
• Are the data supplied by the Hungarian statistics system sufficient to show regional impacts?
• Can the threshold of subsidies quantified, i.e. subsidies whose conse-quences cannot be measured any longer (in such cases, instead of a con-centration of funds, politics uses the principle of ‘all those involved should be given a little’)?
• What accountability can be expected; will there be any consequences if the usefulness of the subsidy falls short of that predicted in the ex-ante analy-sis?
Current practice
The developers of Hungarian regional development policy (following the change in paradigm after 1989) have not really brought anybody to account. The decision makers did not want (or did not dare) to face the low efficiency of the ap-plication of funds or its unsuccessfulness, the creation of virtual jobs financed from public moneys, etc. (It cannot be a coincidence that e.g. in the county of Borsod-
5/ The formal framework of the report is included in the National Regional Development Con-cept adopted by an order of the Parliament in 1998, (resolution of the Parliament No. 35/1998/III.20.)

7
Abaúj-Zemplén there was not a single ex-post impact study on the regional devel-opment subsidies used in 1995-2004, while at the same time a number of studies deal with praising the supports granted to the region.) It seems that politics has chosen a more convenient and safer method; it has de-veloped ‘soft’ aspects of assessment, which are suitable for wrapping the subjec-tive (not infrequently selfish) intentions underlying the decisions in an appearance of objectivity.
In the past 15 years demonstrating the expected impacts of regional devel-opment was only incidentally dealt with in the period of program making. If, how-ever, there are some examples, mostly verbal impact studies were written, which do without numerical analyses (e.g.: in terms of the number of employed, creating new jobs, and retaining the existing ones, etc.). It is even harder to find examples for showing the expected and actual regional impacts of the development pro-grams, while there are several dozen methods known for demonstrating the con-sequences of regional development programs (projects) ranging from the simple ones to more complex empirical methods (Table 3). Figure 3. Methods for demonstrating regional development impacts
Impact study
Program/project level analysis
Regional level analysis
Efficiency analysis of investments
Yield analysis
Cost-benefit analysis
Scale theory (potential) methods
Empirical methods
Source: constructed by the author
The use of empirical modells obviously requires more time and better pro-fessional skills, which may contribute to the fact that we can mostly find verbal analyses in the Hungarian practice. Potentials and limits of development in the Norther n Hungary region
The accepted development objectives of the next seven years (2007-2013) will be fundamentally influenced by the following:
• The region of Northern Hungary is one of the least developed regions of the European Union in economic terms.
• The education level of the Roma population concentrated regionally (living mainly in less developed small regions and in certain parts of the towns of

8
Miskolc and Salgótarján) is low, which results in serious welfare and social problems.
• In the region of Northern Hungary there are few large companies having a strong market position and considerable capital, so the large towns of the region are unable to counterbalance the economic attraction and central role of Budapest.
• The small and medium-sized enterprises of the region lack capital, are struggling with regular liquidity problems, their market positions and com-petitiveness are weak, and show little willingness to cooperate.
• In the centres of the deprived small regions there is a shortage of industrial zones, incubator houses and related consultancy services promoting the settlement and operation of enterprises or helping new ones. The transfer organisations encouraging the innovation activities of enterprises are miss-ing or are of low standards; the relations between R&D organisations and enterprises are insufficient.
• The income-producing capacity of tourism in the region lags behind the po-tentialities, primarily due to the non-harmonised and low-standard product structure and supply of accommodations.
• Unemployment in the region of Northern Hungary is higher than the na-tional average, the rate of those permanently unemployed is high, multi-general unemployment is emerging; the level of employment is low, the number of people drawing disability pensions and social welfare exceeds the national average, particularly in areas with small villages.
• The health of the population is poor, there are many inactive people and disability pensioners, and the mortality rate is higher than the national and European average. The population of the region and that of the more backward small regions is continuously aging..
• Lower income levels in the region, the population getting poorer and poorer.
• The education level of the population is lower than the national average, and the number of jobs employing people with higher qualifications is few (particularly in the medium-sized and small towns).
• The towns in the north of the region (Salgótarján, Ózd, and Sátoraljaújhely) are difficult to reach by road; and their public transport infrastructure is ob-solete (coach stations, passenger information systems, etc.).
• There are large contaminated industrial areas left after the factories of heavy industry (e.g.: in Ózd, Salgótarján, Kazincbarcika, and Miskolc), and landscape wounds (pit-heaps).
Development objectives
The development program of the region of Northern Hungary for 2007-2013 aims to strengthen the competitiveness of the region, and to reduce the re-gional, social and economic differences within the region at the same time. The program formulates five priorities:
• Creating the knowledge-based competitive economy of the region.

9
• Strengthening the tourism potential, improving the quality of products and services based on natural and cultural values, creating new jobs, a sus-tainable application of the resources.
• Rehabilitation of urban areas, renewal of urban areas being segregated and contaminated in social terms, strengthening social cohesion.
• Improving regional infrastructure, including the accessibility of the centres of small regions, a renewal of humane public services, improving IT-based public services.
• Technical assistance to support the implementation of the program and to achieve the objectives of the program.
In line with the above objectives, four programs (1. Creating a competitive econ-omy; 2. Strengthening the tourism potential; 3. Rehabilitation of urban areas; and 4. Improving regional infrastructure) have been formulated for the period 2007-2013 together with the related objectives (Table 1).
Table 1: Strategy and priority level expected impacts, quantification of indicators
Objectives Indicators Targets (2014)
Number of jobs created (pcs) 75.000
Number of enterprises settled in the supported logistics parks (pcs)
25-30
Number of logistics centres supported (pcs) 4-5
Number of new, supported cooperation with enterprise and/or R&D institutions (pcs)
25-30
Number of supported investments in creating jobs (pcs) 200-300
Number of supported technological innovations in the en-terprises (pcs)
350-400
Number of supported innovation services in the SMEs (pcs) 350-400
Number of supported innovation-technological centres (pcs)
4-6
Number of persons participating in training (pcs) 1,300-1,500
Priority 1:
Creating a competitive
economy
Number of organisations transferring supported innovation (pcs)
25-30

10
Table 1 continued
Number of jobs created in tourism (persons) 4,500-5,000
Number of commercial accommodations (pcs) 41,000-43,000
Average time spent (nights) 2.7-3
Number of nights per 1000 permanent residents (nights) 2,100-2,300
Supported priority tourism products, attractions (pcs) 40-50
Number of supported refurbished accommodations (pcs) 12,000-15,000
Number of supported tourism accommodations (pcs) 200-300
Number of supported tourism management organisations (pcs)
12-16
Priority 2:
Strengthen-ing the tour-
ism potential
Number of those participating in training (persons) 800-1,000
Number of jobs created due to support (persons) 4,000-5,000
Number of organisations, enterprises settled or offering ser-vices in rehabilitated areas (pcs)
150-200
Number of those successfully completing training (persons) 700-800
Number of employees returning to the labour market (per-sons)
700-1,000
Number of segregated parts of towns supported (pcs) 10-15
Number of centres of towns supported (pcs) 30-35
Number of brown-field areas rehabilitated (pcs) 7-10
Area of brown-field areas rehabilitated (ha) 130-170 ha
Area of towns rehabilitated (ha) 150 ha
Number of inactive persons supported in employment pro-grams (persons)
3,000
Number of supported employment initiatives (persons) 30
Priority 3:
Rehabilita-tion of urban
areas
Number of persons participating in training (persons) 1,000
Number of students in supported educational institutions (persons)
50,000-60,000
Number of local governments interested in IT development (pcs)
300-400
Number of supported small region programs (pcs) 82-86
Number of constructed or reconstructed roads with 4- or 5-digit markings (km)
1,400-1,600
Number of supported public transport service projects (pcs) 20-25
Number of educational institutions improved or refurbished (pcs)
150-200
Number of health institutions improved or refurbished (pcs) 70-80
Priority 4: Improving regional
infrastruc-ture
Number of projects supported in order to modernise public administration (pcs)
80-100
Source: NORDA [2006]

11
The program counts with EU funds of approximately 399.0 billion HUF ar-riving in the region of Northern Hungary in the period 2007-2013 (Table 2). Table 2. Development programs of the region of Northern Hungary (2007-2013)
No. Program Sub-program
Funding require-
ment
Grand to-tal
(bn HUF)
1.1 Developing integrated supplier networks in the region.
15.0
1.2 Attracting environmental pro-tection industry
20.0
1.3 Biomass energetics industry 15.0
1.4 Establishing a regional knowl-edge centre
8.0
1.5 Developing a regional logistics network
10.0
1. Creating a com-petitive economy (techno-region)
1.6 Developing business services supporting enterprises
5.0
73.0
2.1 Developing a coherent and inte-grated communication strategy, de-veloping region-marketing tools
0.5
2.2 Establishing a joint regional cluster centre with the region of Northern Alföld
3.0
2.3 Supporting the establishment of regional tourism clusters
82.0
2.4 Development of program-related services
10.5
2. Developing a re-gional tourism network together with the region of Northern Alföld
2.5 Development of program-related human resources
5.0
101.0
3. Creating the con-ditions for high-standard life, re-habilitation of urban areas
111.0
4. Improving re-gional infrastruc-ture
110.0
Total: 395.0
12
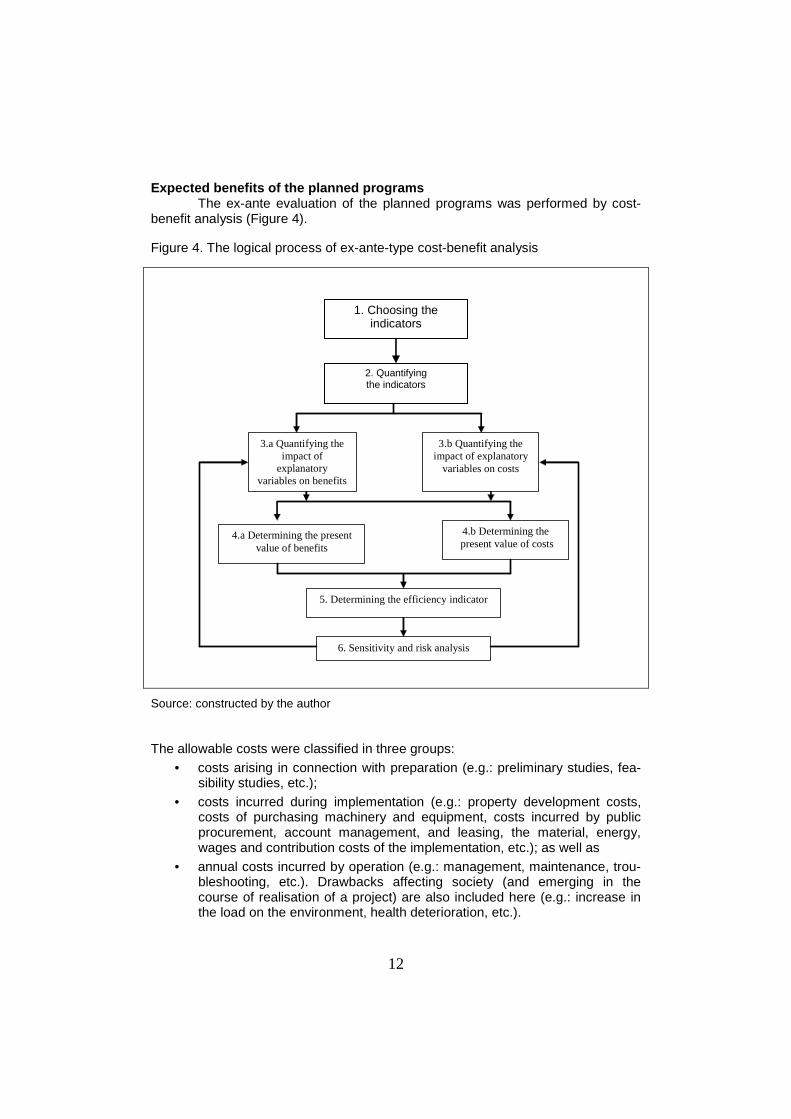
Expected benefits of the planned programs The ex-ante evaluation of the planned programs was performed by cost-
benefit analysis (Figure 4). Figure 4. The logical process of ex-ante-type cost-benefit analysis
Source: constructed by the author The allowable costs were classified in three groups:
• costs arising in connection with preparation (e.g.: preliminary studies, fea-sibility studies, etc.);
• costs incurred during implementation (e.g.: property development costs, costs of purchasing machinery and equipment, costs incurred by public procurement, account management, and leasing, the material, energy, wages and contribution costs of the implementation, etc.); as well as
• annual costs incurred by operation (e.g.: management, maintenance, trou-bleshooting, etc.). Drawbacks affecting society (and emerging in the course of realisation of a project) are also included here (e.g.: increase in the load on the environment, health deterioration, etc.).
4.a Determining the present value of benefits
4.b Determining the present value of costs
5. Determining the efficiency indicator
2. Quantifying the indicators
1. Choosing the indicators
Forecasts Implementation plans, feasibility
studies
3.a Quantifying the impact of
explanatory variables on benefits
3.b Quantifying the impact of explanatory
variables on costs
6. Sensitivity and risk analysis
2. Quantifying the indicators
1. Choosing the indicators

13
Costs were determined by a calculative method (e.g. technical, time, etc. norms) on the basis of the feasibility studies or based on the costs of similar programs. The system handles three benefit tables: direct benefits (H1); indirect benefits (H2) and spill-over benefits (H3). Accordingly, the benefit of a program (H) is given by the sum of the three factors depending on a given utilisation (Q): H(Q) = H1(Q) + H2(Q) + H3(Q).
• Direct benefits appear in the implementation of the project (e.g.: surplus sales revenues, savings in fuel costs, savings in maintenance costs, etc.).
• Indirect benefits take into account income arising for the budget (e.g.: personal income tax, contributions by employers, social security contribu-tions, value added tax, company tax, duties, etc.), savings for the budget due to the retention of jobs, as well as savings expressed by shadow price (e.g.: savings arising from a reduction in the number of road accidents, benefits due to a reduction in the time to get to work, benefits due to a re-duction in the load on the environment, etc.).
In determining indirect benefits the multiplication factor , which expresses the spill-over effect of the intervention (appearing in a different sector), plays an out-standing role. In line with the specialist literature, the software interprets four multiplication factors in theory.
• The income multiplication factor, which expresses the spill-over effect of the expenditure effected in a given sector and appearing in a different sec-tor.
• The output multiplication factor, which expresses the impact of unit output in the transportation sector (under examination) appearing in a different sector.
• The employment multiplication factor, which expresses the impact of unit expenditure in the transportation sector (under examination) on employ-ment in other sectors.
• The budget multiplication factor, which expresses the impact of unit expen-diture in the transportation industry (under examination) on the central budget. It was quite a job to determine the current output multiplication factor, i.e. to take into account the spill-over effect of the programs within the region. The specialist literature offers three models for solving the task: the bal-ance of sectorial connections, the Computable General Equilibrium (CGE), and the Social Accounting Matrix (SAM). In view of the fact that the Central Statistics Office does not quantify the balance of either the country connections or the balance of regional secto-rial connections, the multiplication factor was determined on the basis of the data of the turnover between the sectors (Table 3).
• c) Spill-over benefits , which express the increase in solvent demand ap-pearing in the region (Table 4). The program quantifies five indicators of the cost-benefit data determined
above (Table 5). Two of them are conservative.

Table 3. The total multiplication factor of the region of Northern Hungary
Sectors 1 2 3 4 5 6 7 8 9 10 11 12 13 14 15 16 17 18 Total 1. Agriculture 1.40 0.02 0.03 0.01 0.02 0.02 0.01 0.02 0.00 0.01 0.02 0.04 0.31 0.01 0.01 0.01 0.01 0.01 1.96
2. M ining 0.01 1.08 0.03 0.00 0.02 0.01 0.00 0.01 0.00 0.00 0.02 0.02 0.02 0.00 0.00 0.00 0.00 0.00 1.22
3. Food industry 0.04 0.06 1.20 0.01 0.02 0.03 0.01 0.02 0.01 0.02 0.05 0.04 0.02 0.02 0.03 0.02 0.02 0.04 1.66
4. Clothes industry 0.02 0.01 0.01 1.02 0.04 0.02 0.01 0.01 0.02 0.01 0.02 002 0.01 0.04 0.07 0.03 0.01 0.02 1.39
5. O ther light industry
0.07 0.04 0.05 0.03 1.19 0.03 0.02 0.05 0.01 0.02 0.04 0.02 0.03 0.02 0.02 0.01 0.01 0.01 1.67
6. Chemical industry
0.04 0.02 0.06 0.02 0.03 1.19 0.02 0.08 0.04 0.04 0.18 0.03 0.03 0.02 0.02 0.03 0.01 0.01 1.87
7. O ther processing industry
0.01 0.00 0.00 0.10 0.01 0.01 1.01 0.00 0.06 0.01 0.01 0.01 0.01 0.01 0.01 0.01 0.01 0.01 1.29
8. M achine industry 0.03 0.02 0.03 0.02 0.05 0.02 0.02 1.27 0.04 0.02 0.02 0.03 0.02 0.05 0.06 0.05 0.05 0.02 1.82
9. Energetics 0.05 0.03 0.04 0.06 0.07 0.08 0.02 0.02 1.16 0.15 0.03 0.03 0.05 0.04 0.02 0.03 0.02 0.02 1.92
10. Construction ind. 0.00 0.00 0.00 0.00 0.00 0.01 0.01 0.01 0.01 1.02 0.00 0.00 0.01 0.01 0.01 0.01 0.00 0.00 1.1
11. Accommodation, catering
0.02 0.01 0.02 0.01 0.01 0.02 0.01 0.01 0.04 0.06 0.11 0.02 0.03 0.02 0.02 0.07 0.02 0.02 0.52
12. Railway transport.
0.14 0.07 0.11 0.03 0.05 0.08 0.03 0.04 0.03 0.05 0.12 1.08 0.10 0.08 0.06 0.06 0.04 0.05 2.22
13. Financial activities
0.02 0.01 0.01 0.00 0.01 0.01 0.01 0.00 0.01 0.01 0.01 0.01 1.05 0.00 0.05 0.01 0.00 0.00 1.22
14. Property 0.03 0.02 0.03 0.02 0.02 0.03 0.03 0.02 0.03 0.01 0.03 0.05 0.02 1.03 0.04 0.03 0.01 0.01 1.46
15. Public admin. 0.01 0.00 0.01 0.01 0.01 0.01 0.00 0.01 0.00 0.01 0.01 0.01 0.01 0.01 1.01 0.01 0.01 0.01 1.15
16. Education 0.01 0.00 0.01 0.03 0.01 0.01 0.03 0.00 0.01 0.00 0.01 0.01 0.01 0.04 0.13 1.04 0.00 0.00 1.35
17. Health care 0.02 0.01 0.03 0.01 0.01 0.01 0.01 0.01 0.01 0.02 0.02 0.03 0.02 0.02 0.03 0.03 1.05 0.05 1.39
18. O ther services 0.03 0.02 0.03 0.03 0.03 0.03 0.02 0.03 0.03 0.04 0.02 0.04 0.04 0.03 0.05 0.04 0.04 2.23 2.78
Total 1.95 1.42 1.7 1.41 1.6 1.62 1.27 1.61 1.51 1.5 1.66 1.49 1.79 1.45 1.64 1.49 1.31 2.51 28.93
Interpretation: Impact of unit demand for the products of the sector in the column on the output of the sectors in the rows with consid-eration of the induced impacts of spending the wages. Source: Joint calculations by the county headquarters of the Central Statistics Office in Borsod-Abaúj-Zemplén and the Department of Regional Economics of the University of Miskolc.

15
Table 4. Equations of benefit elements (REINPLAN)
Type Method of definition Notation
Direct benefit
Sales revenue: ∆SI (HUF) =∆IND * FA.
Revenue from contribution by employers: ∆ET (HUF) = ∆ALKSZ * BATL * MJAR.
Revenue from personal income tax: ∆PI (HUF) = ∆ALKSZ * BATL * SZJA. Replacement of unemployment benefit: ∆NUE (HUF) = ∆ALKSZ * MNELK * MJAR * 0.75 * 0.85.
Surplus company tax: ∆CT (HUF) = ∆NÁ * ADOK
Local industrial tax: ∆LT (HUF) = ∆NA * ÁTLA
VAT ∆VTI: (HUF) = ∆B * ÁFAI
Surplus VAT (services): ∆VTS (HUF) = ∆Á * ÁFASZ
Surplus local duty revenue: ∆LTP (HUF) = ∆B * I
Indirect benefit
Surplus revenue from other sectors: ∆SII (HUF) = ∆ÁB * M 1
Surplus revenue from contribution by employers in other sectors: ∆ETI (HUF) = ∆ALKSZ * M 1 * BATL *I
Personal income tax from other sectors ∆PII (HUF) = ∆ALKSZ * M 1 *BATL*SZJA
Replacement of unemployment benefit arising in other sectors: ∆NUEI (HUF) =
= ∆ALKSZ * M * BATL * SZJA Company tax revenue from other sectors: ∆CTI (HUF) = ∆LKSZ * MUNKN * M * MNÉLKJ * ÁTLA
Revenue from local industrial tax from other sectors: ∆LTI (HUF) = ∆ÁB * Mi * I
VAT (services) from other sectors: ∆VTSI (HUF) = ∆ÁB * M *ÁFASZ Spill-over
benefit Benefit of increase in income: CB (HUF) = ∆ALKSZ * NATL * FI
IND – indicator FA – specific price (HUF/indicator) ALKSZ – number of employees in the sector (person/year) BATL – gross average wages (HUF/person/year) MJAR – contribution by employers (%) SZJA – average personal income tax rate(%) ∆ALKSZ – increment in the number of employees (person) MNELK – number of unemployed employed due to the program (person/year) MJAR – unemployment benefit (HUF/person) Á – gross sales revenue (HUF) NÁ – net sales revenue (HUF) B – investment costs (HUF) ÁFASZ – VAT rate for services (%) ÁFAI – VAT rate for capital goods (%) ∆ÁB – net (VAT-free) increment of the revenues of the sector (HUF) ADOK – average company tax rate (%) ÁTLA – average tax rate (%) Mi – �olio sector multiplication factor I – average contribution (%) NATL – net average income (HUF) FI – consumption rate (%)

16


16
Table 5. Profit and loss indicators of cost-benefit analysis Indicator Type
Definition Interpretation Notation
Return rate (M) ∑
∑
=
=
+
+=n
1ttt
n
1ttt
t
)r1(
1K
)r1(
1H
M
The program is so-cially beneficial if M > 1
Benefit present value indicator (HJ)
∑∑== +
−+
=n
1tttt
n
1ttt )r1(
1K
)r1(
1HHJ The program is so-
cially beneficial if HJ > 0
H – benefit (for example value added) K – cost
Budgetary return (KV) KVJ
TJKV
To what percentage the subsidy granted for the implementa-tion of the program is returned from the budgetary revenues during time T.
KVJ – present value of budget reve-nue TJ – present value of sub-sidy
Import ratio indicator (IH) 100
IJ
KJIH ⋅=
What percentage are imports of the costs arising during time T of the program.
IJ – present value of im-ports KJ – present value of costs
Benefit intensity (HI)
∑
∑
=
=
+
+=n
1ttt
n
1ttt
t
)r1(
1T
)r1(
1H
HI
What percentage of the subsidy is re-turned from the benefit.
T – subsidy
Findings of the impact studies
Costs were determined on the basis of feasibility studies built on estimates by experts. In the calculations a 3 % increase in wages and a constant contribution percentage were used. According to preliminary calculations by the experts, the programs will induce a considerable demand for employment (Table 6). Table 6. Aggregate job creating impact of the programs
Program Persons Creating a competitive economy 25,000
Regional tourism network 29,000
Improving the conditions for high standards of life 21,000
Total: 75,000
Regarding the current output multiplication factor the assumption was used that it was static in the period under examination, i.e. in 2007-2013 the values of the ele-ments of the matrix were constant. The social usefulness of all the three programs is clear, however, as regards their impacts, the three programs do not show the same strengths (Tables 7 and 8).

17
Table 7. The cost-benefit curves of the programs
100 000
50 000
0
50 000
100 000
150 000
200 000
250 000
300 000
350 000
2007 2008 2009 2010 2011 2012 2013 2014 2015 2016 2017 2018 2019 2020
millió Ft
20 000
0
20 000
40 000
60 000
80 000
100 000
2007 2008 2009 2010 2011 2012 2013 2014 2015 2016 2017 2018 2019 2020
millió Ft
100 000
50 000
0
50 000
100 000
150 000
200 000
250 000
300 000
350 000
400 000
2007 2008 2009 2010 2011 2012 2013 2014 2015 2016 2017 2018 2019 2020
millió Ftmillion HUFmillion HUF million HUF
Improving the standards of lifeDeveloping a regional tourism network Creating a competitive economy Improving the standards of lifeDeveloping a regional tourism network Creating a competitive economy

18
Table 8. The cost-benefit indicators of the three programs
Indicator Program of
competitiveness
Program of tourism develop-
ment
Program of im-proving the stan-
dards of life Return rate (M) 7.29 4.58 3.09 Benefit present value (HJ)
572.983 bn HUF 395.627 bn HUF 371.114 bn HUF
Benefit intensity (HI) 16.28 6.10 1.96
The program of competitiveness generates the highest added value, there-fore this program has obviously the highest return rate and benefit intensity as well; while the program of improving the standards of live shows the lowest specific val-ues. This latter one aims at creating social cohesion primarily. Investigating the regional impact
The investigation of regional impact has a considerable econometric litera-ture6/. The models adopt mostly the Cobb-Douglas production function (Table 9). Table 9. Production functions (constructed by the author)
Author Model Notation
Eckey/ Kosfeld/ Türek [2000]
)K,H,L,(fY Tα=
KlnHlnLlnlnYln KHLT ⋅α+⋅α+⋅α+α=
2
KK
2
HH
2
LL )K(ln2
1)H(ln
2
1)L(ln
2
1 ⋅β+⋅β⋅+⋅β⋅+
.KlnHlnKlnLlnHlnLln HKLKLH ⋅⋅β+⋅⋅β+⋅⋅β+
Tα - level of
knowledge L - labour H - human capital K - physical capital
Sala-Martin [1993] )L,K,t(fY =
α−α= 1LK)t(AY
A - technical level t - time L - labour K - capital
We attempted to demonstrate regional impact on the basis of two indica-
tors (added value and changes in regional GDP) (Table 5). The added value (HÉi) of a particular sector (i) of the region was determined using the following relation-ship:
HÉi = α + βBi + γALKi + δMKi + εCPI,
6/ The models have developed two groups (with some simplification). The first includes the models that aim at quantifying the impact of economic growth on changes in regional GDP, the second group aims at modelling regional convergence.

19
where: – i = number of sector,7/ – α = constant, – β, γ, δ, ε = parameters, – Bi = investment effected in the sector in a given year, – ALK = number of employed in the sector in a given year, – MKI = average wages in the sector, – CPI = average inflation.
Regional GDP is equal to the cumulated added value in the sectors:
∑=
=n
1i
HEGDP .
The output indicators under examination were determined in the economet-
ric model were determined on the basis of two hypotheses: • Supposing a ‘natural’ growth; that is the changes will develop in line with
the current economic policy practice; • Supposing a ‘generated” growth; that is what change can be quantified as
a result of the subsidy.
The difference obtained between the data as a result of the quantification of the two functions gives the extent of the expected change.
7/ The model REINPLAN developed by the Department of Regional Economics of the Uni-versity of Miskolc in 2005 can handle 18 sectors simultaneously (agriculture, mining, food industry, clothes industry and other light industry, other processing industry, machine indus-try, energy and water supply, construction industry, trade, accommodation, catering, trans-portation, storage, communication, financial activities, property deals, public administration, education, health care and other services).

20
HÉi= αααα + βΒΒΒΒi+γγγγALK i + δδδδMK i + εεεεCPI
GDP = ΣΣΣΣHÉi
Modified function HÉip= αααα+β (ΒΒΒΒi + ∆∆∆∆B ip) +
+ γγγγ (ALK i + ∆∆∆∆ALK ip)+ δδδδMK i + εεεεCPI GDP = ΣΣΣΣHÉip
Preparing a forecast for each interpreting variable
Determining variables corrected by the impact
of programs
Determining variables without the impact of
programs
Quantifying the change
Database
Figure 5. Model of demonstrating regional impacts (REINPLAN)
In determining a national tendency, we counted with the following: • The rate of technological development remains unchanged; • The growth rate of GDP in Hungary will exceed the EU average by 2-2.5
per cent in the next 10-15 years. Regarding regional tendencies we applied the following assumptions:
• The sectorial weight of mining is low in the region and is expected to re-main so;
• The agriculture in the region will have a similar fate in the years to come. Chances of convergence
The mezo-econometric model was used to find the answer to the question whether it will be possible to achieve a growth rate higher by 2-2.5 per cent, which would enable the region to converge upon the average of the domestic GDP in the long run.
Analyses of the regional impact prove that the impact of the planned pro-grams in increasing the added value may ensure a growth above the national av-erage by 2.0 – 2.2 per cent in the period 2007-2009, and by 2.4 – 2.6 per cent in the period 2009-2013 for the region (Table 10).

21
Table 10. Regional impact of the development programs
Creating a competitive economy Developing a regional tourism
network
0
500
1000
1500
2000
2500
3000
1994
1995
1996
1997
1998
1999
2000
2001
2002
2003
2004
2005
2006
2007
2008
2009
2010
2011
2012
2013
(thousand HUF/head)
0
500
1000
1500
2000
2500
3000
1994
1995
1996
1997
1998
1999
2000
2001
2002
2003
2004
2005
2006
2007
2008
2009
2010
2011
2012
2013
(thousand HUF/head)
Notes:
Growth in added value due to the development program
Growth in added value without the development intervention
Concusions
The period 2007-2013 may be of decisive importance regarding the social and economic processes in the region of Northern Hungary for at least two rea-sons. The first long-term development program (7 years) was prepared after the changes in economic policy of 1989 in order to improve the competitiveness of the region. On the other hand, the amount of the funds that can be called (as proved by the analyses) will facilitate to induce a demonstrable economic growth in the re-gion.
The plans take a change in paradigm into account: the convergence of the region is planned to be based on creating and strengthening the foundations of a competitive economy.
If the political intention will back these efforts, it will be possible to stop the process of the region of Northern Hungary drifting towards the periphery that has been going on for two decades now, and there will be hope to establish a new ex-pansion path. REFERENCES Anselin L. (1988) Spatial Econometrics: Methods and Models, Dordrecht. Bode E. (1988) Lokale Wissensdiffusion und regionale Divergenz in Deutschland, Tübingen. Dinwiddy C., Teal F. (1996) Principles of cost-benefits analysis for developing countries, Cambridge
University Press.

22
Eckey H.F., Kosfeld R., Türck M. (2000) Regionale Produktionsfunktionen mit Spillover-Effekten für Deutschland - empirischer Befund und wirtschaftspolitische Implikationen, Uni Kassel. Fachbereich Wirtschaftswissenschaften. Nr. 64/04.
Grossman G. M., Helpman E. (1989) “Production Development and International Trade”, Journal of Po-
litical Economy, 97. pp. 1261-1283. Haas A., Möllner J. (2001) “Qualifizierungstrends und regionale Disparitäten“, Mitteilungen aus der
Arbeitsmarkt- und Berufsforschung (MittAB). 34 (2). pp. 139-151. Kirkpatrick C., Weiss J. (1996) Cost Benefit Analysis and Project Appraisal in Developing Countries, El-
gar, Cheltennan. Kocziszky Gy. (2005) “Modelling the Regional Impact of Regional Subsidies”, Novy Smokovec, 28 Sep-
tember NORDA (2006) Észak-magyarországi régió regionális operatív programja (2007-2013), Észak-
Magyarországi Regionális Fejlesztési Ügynökség, Miskolc. Sala Martin X. (1994) ”La riqueza de las regiones. evidencia y teorias sobre crecimiento regional y
convergencia”, Moneda y Crédito 198. pp. 13-80.

23
STUDIA UNIVERSITATIS BABEŞ-BOLYAI, OECONOMICA, LI, 2, 2006
LE COMPORTEMENT D’UN MARCHE AUTOMOBILE EMERGENT. ESTIMATION PAR UN MODELE NESTED LOGIT
Cristian DRAGO Ş* Babeş-Bolyai University of Cluj Napoca, Romania
Abstract. The discrete choice models have been used in the last decade in order to study the American and French car markets. Because of there structure, which allows the probability to take an explicit form, the Logit models were preferred to the Probit ones which present major estimation problems. We propose a study of the Romanian car market, by showing that its behavior is different from that of the maturity markets, which will be put in evidence by an original specification of the tree structure of the Nested Logit model, using a hierarchical classification. JEL Classification: C25, D43, L13 Keywords: Nested Logit, car market, oligopoly
1. Introduction Quelques études économétriques (Berry et al., 1995, Goldberg, 1995, Cecchini, 2000), modélisant la demande et le comportement du choix à partir des modèles de type Logit ont abouti à de bons résultats sur les marchés automobile en phase de maturité : américain et français. Berry et al (1995) utilisent un Mixed Logit pour estimer le marché américain. Sur la base du travail de Berry (1994), ils considèrent que des caractéristiques non observée des produits influencent l’utilité des consommateurs. Ils introduisent une structure de corrélation entre les attributs des véhicules et les goûts non observables de l’individu. Goldberg (1995) préfère pour le même marché un Nested Logit. Pour éviter les inconvénients de l’approche Logit Multinomial, elle combine des données au niveau du consommateur et un processus séquentiel de décision de l’individu. La structure arborescente du modèle Nested Logit utilisé est construite successivement par les décisions des individus : achat – non achat, voiture neuve – voiture d’occasion, voiture étrangère – voiture nationale, type (la classe) de voiture. Wojcik (2000) compare les modèles de Berry et Goldberg surtout en termes des performance de leurs prévisions, en exprimant sa préférence pour le dernier. Cecchini (2000) effectue une étude semblable à celle de Goldberg, mais sur le marché français. Les données qu’il
* Faculty of Economics and Business Administration. Adress: : 58-60 Teodor Mihali Street, room 231, 400591 Cluj-Napoca, Romania. E-mail: [email protected]

24
utilise sont issues d’une enquête faite sur des personnes qui ont acheté effectivement une voiture. La structure arborescente du modèle Nested Logit de Cecchini est construite à partir de la classe des automobiles et de la nationalité du producteur.
Dans cet article nous avons choisi d’estimer un Nested Logit, afin d’éviter le biais induit par l’hypothèse d’indépendance des alternatives non pertinentes des modèles Logit multinomiaux qui génèrent des substitutions peu crédibles entre certains produits. L’application qu’on propose porte sur le marché émergent de l’automobile roumain dont le comportement est différent de celui des marchés à fort pouvoir d’achat et à forte industrie automobile. Des voitures habituelles pour tous les pays et des voitures spécifiques (généralement indigènes) y coexistent. Affin d’expliquer cette différence de comportement et d’estimer la demande (pour les automobiles existantes ou potentielles) nous construisons un modèle adapté, utilisant la classification hiérarchique et nous montrons que les spécifications adoptées pour d’autres marchés sont moins performantes. On utilise des données qui saisissent des attributs des véhicules et des caractéristiques propres aux individus. L’estimation de la demande est fondée sur les jugements des acheteurs sur les caractéristiques du véhicule choisi et celles des véhicules concurrents. 2. Le modèle Nested Logit
On s’intéresse essentiellement á un modèle capable à la fois de bien expliquer le mécanisme du choix, mais aussi de bien estimer la demande selon les valeurs des attributs des véhicules et des individus. Comme la réponse est discrète, les modèles les plus adaptés sont ceux à choix discret et particulièrement les modèles Logit. On suppose que les acheteurs sont rationnels et font des choix qui maximisent leur utilité. Quelle que soit la source d’alea (caractéristiques inobservables, variations inobservables des utilités des individus, erreurs de mesure, etc), on peut diviser la fonction d’utilité en deux parties. L’utilité d’un bien j pour un individu qui choisit parmi n biens peut prendre l’expression :
jjj VV ε+= (1)
où jV est la partie déterministe de l’utilité et jε est le terme d’erreur.
Pour généraliser un modèle Logit binaire au cas multinomial, on considère des paramètres différents en fonction des alternatives, de telle sorte que les variables explicatives restent constantes sur les alternatives. Une autre possibilité est de considérer un vecteur de paramètres constants et de permettre aux variables explicatives de dépendre des alternatives (McFadden, 1974, 1980). Le modèle, appelé souvent Logit conditionnel, s’écrit comme siute:
∑=
==n
kjk
jij
x
xiYP
1
)exp(
)exp()(
β
β (2)
Un tel modèle est susceptible de fournir des termes de substitution peu vraisemblables parmi les alternatives de choix, à cause de la propriété

25
d’Indépendance des Alternatives non Pertinentes (Independance from Irrelevant Alternatives ou IIA dans la littérature anglo-saxonne). Parmi les tests capables de vérifier cette hypothèse, le plus répandu est celui basé sur la statistique de Hausman et McFadden (1984) :
)ˆˆ()ˆˆ()'ˆˆ( 1 ββββ −−−= −rrr VVT (3)
où β̂ et rβ̂ sont les paramètres estimés par le maximum de vraisemblance pour
l’ensemble de choix et l’ensemble restreint, et V̂ et rV̂ les matrices de covariance
estimées. La statistique T suit une loi 2χ à m degrés de liberté (m est le nombre des paramètres à estimer).
Afin de s’affranchir de l’hypothèse IIA, on peut grouper les alternatives en sous-ensembles et considérer un choix en plusieurs étapes. Ensuite, on applique à chaque étape un Logit multinomial. On note par L le nombre des groupes résultant de la partition de l’espace des choix. Dans chaque groupe l, il y a lJ choix
possibles, indicés par )(lj . Le nombre total d’alternatives est donc
lJJJJ +++= ...21 . Le processus de décision se déroule à deux niveaux : à
l’intérieur de chaque groupe et parmi les groupes. Les variables décrivant les qualités communes aux choix d’un même groupe, lx , prennent des valeurs qui
peuvent varier d’un groupe à l’autre, mais ne doivent pas le faire d’un choix à l’autre d’un même groupe. Les variables caractéristiques de chaque choix, )(ljx ,
prennent des valeurs variables d’un choix à l’autre. On note x l’ensemble des variables explicatives. On suppose que la fonction d’utilité du choix j se décompose en deux parties : l’une qui caractérise le groupe, et l’autre pouvant varier d’un choix à l’autre du même groupe :
jljljjj VVVV εε ++=+= )( (4)
McFadden (1974) a montré qu’on peut écrire un modèle de choix discrets découlant de la maximisation de l’utilité sous l’hypothèse que les termes d’erreur
suivent une distribution Weibull. Supposons que lV et )(ljV sont des
combinaisons linéaires des variables explicatives, l’utilité jV s’écrit :
lljllj xxV βλβ )(+= (5)
avec 10 ≤< lλ . Hausman & McFadden (1984) ont montré que si et seulement si
ces valeurs sont comprises entre 0 et 1, le modèle reste en concordance avec le principe de rationalité individuelle (à savoir la maximisation de l’utilité stochastique). Si l’estimation du modèle donne un paramètre 1>lλ , la

26
spécification est erronée et il faut changer de modèle. On peut écrire la probabilité )/( xjP comme le produit de deux probabilités :
)/)(()/()/( )(ljxljPxlPxjP ⋅= (6)
où )/( xlP est la probabilité de choisir un des L groupes :
∑=
+
+=
L
llll
lll
Ix
IxxlP
1
)exp(
)exp()/(
λβ
λβ (7)
où ∑=
=lJ
jlljl xI
1)( )exp(ln β s’appelle variable d’inclusion, et )/)(( )(ljxljP est la
probabilité de choisir une option, étant donné que cette option fait partie du groupe l :
∑=
=lJ
jllj
lljlj
x
xxljP
1)(
)()(
)exp(
)exp()/)((
β
β (8)
Après l’estimation des paramètres, on peut calculer les effets des variables explicatives sur les probabilités de choix :
)(
)(
)()(
)/)((ln)/(ln)/(ln
k
lj
kk x
xljP
x
xlP
x
xjP
∂∂
+∂
∂=∂
∂ (9)
On obtient une estimation de la demande pour chaque modalité (ou produit) j en multipliant la probabilité )/( xjP qu’un individu quelconque choisisse j, par le nombre total d’acheteurs potentiels :
NxjPN j ×= )/(~~
)( (10)
Les modèles Nested Logit posent quelques problèmes pratiques de spécification. Même si l’on suppose qu’on dispose des variables lx caractéristiques des
groupes, on peut hésiter quant à la manière de définir les différents groupes. L’une des grosses difficultés, vient du fait que les partitionnements faits
dans les applications concernant les marchés américain et français de l’automobile ne sont pas pertinents pour un marché émergent comme celui de la Roumanie et nous trouverons une méthode adéquate basée sur des éléments de l’analyse des données (classification hiérarchique).

27
3. Le marché automobile roumain Le marché roumain de l’automobile semble être un cadre bien adapté à
l’analyse des produits différenciés. Les principales raisons en sont : (1) un petit nombre de modèles de véhicules pour pouvoir s’appuyer sur les théories liées à l’oligopole, (2) les déterminants du choix sont identifiables et observables en grande partie, (3) les données sont disponibles et (4) le marché est en général bien connu par les acheteurs, qui peuvent être considères comme rationnels. L’analyse que nous faisons ici se résume aux voitures neuves destinées à l’usage des particuliers.
En général, on utilise pour le marché automobile la segmentation suivante : (1) la classe des voitures mini (équivalent – Twingo), (2) la classe des voitures petites (équivalent – Clio), (3) la classe des voitures compactes (équivalent – Mégane), (4) la classe des voitures moyennes (équivalent – Laguna), (5) la classe des voitures de luxe (équivalent – VelSatis), (6) la classe des voitures tout-terrain, (7) la classe des voitures sport, (8) la classe des monospaces. Les segments déterminent le choix de la structure arborescente des modèles Nested Logit utilisés pour étudier le marché américain (Goldberg, 1995) et français (Cecchini, 2000).
En Roumanie en particulier, on peut parler d’une structure oligopolistique, les premiers huit modèles de voitures couvrent 81,9% du marché dans la région Nord-Ouest du pays comme suit : Dacia Solenza – 24,9%, Daewoo Matiz – 17,4%, Dacia 1410 – 11,9%, Renault Clio Symbol – 6,7%, Skoda Octavia – 5,8%, Renault Mégane Classic – 5,5%, Daewoo Cielo – 5,1%, Skoda Fabia - 4,6%. Les pourcentages au niveau national ne sont pas très differents. On va essayer de démontrer que le comportement de ce marché (émergent en général) est différent du comportement des marchés à forte industrie automobile et à fort pouvoir d’achat et trouver des spécifications adéquates pour la structure arborescente du modèle Nested Logit utilisé pour estimer le choix du véhicule.
4. Les données
Les données sur les huit modèles des véhicules concernés proviennent d’une enquête réalisée en février-juin 2003 par l’Institut National de Statistique de Roumanie – Centre Départemental de Cluj et la Faculté de Sciences Economiques de l’Université de Cluj-Napoca (Roumanie). L’échantillon est formé de 221 individus qui ont acheté l’un des huit modèles et ont répondu au questionnaire. Sont envisagés seulement les versions les mieux vendues (par exemple pour la Skoda Octavia une version diesel).
La variable endogène (0 ou 1) indique l’automobile acheté. Les variables explicatives contiennent des caractéristiques propres aux individus ou aux ménages et des attributs des véhicules choisis, elles sont soit objectives (prix de vente), soit subjectives (caractéristiques qualitatives évaluées individuellement par les acheteurs). On suppose que ce n’est pas nécessairement la valeur objective d’une variable qui compte dans la décision d’achat, mais surtout l’image que l’individu retient d’un produit, relative à cette variable. Les attributs des automobiles retenus comme variables explicatives sont les suivants :
- dimensions des voitures : extérieure, intérieure, coffre ; - moteur : puissance, vitalité, bruit, robustesse ; - carrosserie : robustesse, résistance à la corrosion ; - économie : consommation de combustible ;
28
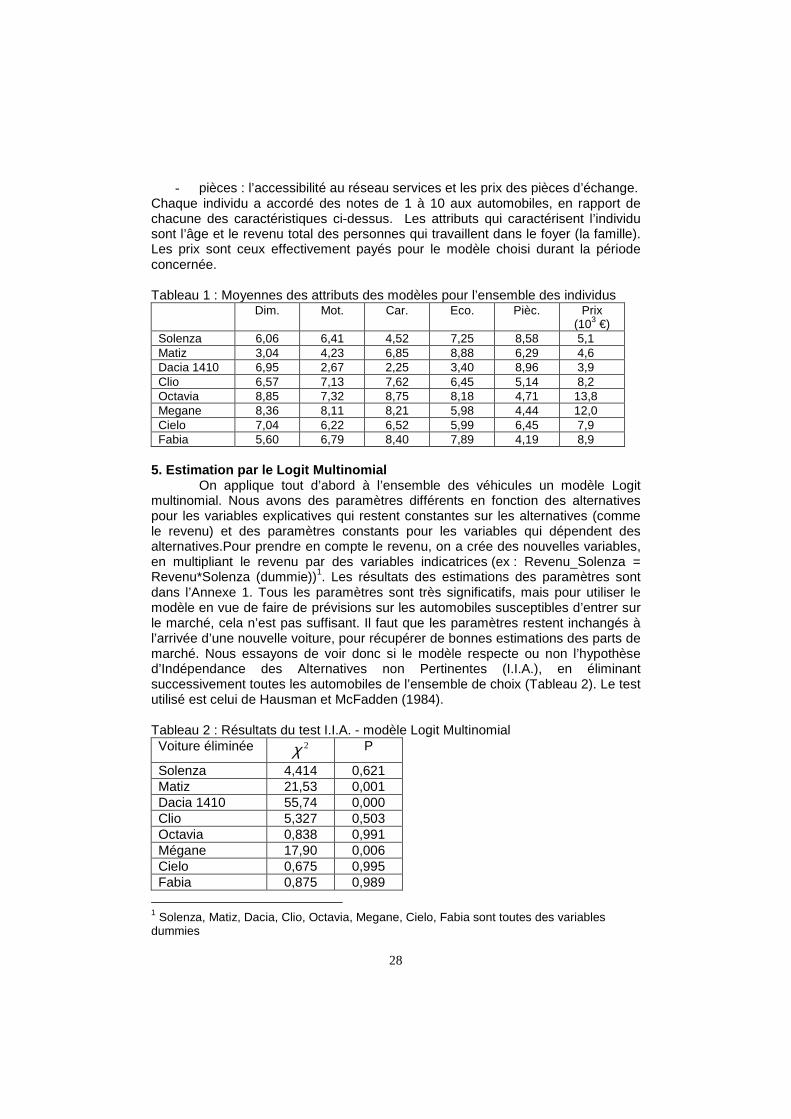
- pièces : l’accessibilité au réseau services et les prix des pièces d’échange. Chaque individu a accordé des notes de 1 à 10 aux automobiles, en rapport de chacune des caractéristiques ci-dessus. Les attributs qui caractérisent l’individu sont l’âge et le revenu total des personnes qui travaillent dans le foyer (la famille). Les prix sont ceux effectivement payés pour le modèle choisi durant la période concernée. Tableau 1 : Moyennes des attributs des modèles pour l’ensemble des individus
Dim. Mot. Car. Eco. Pièc. Prix (103 €)
Solenza 6,06 6,41 4,52 7,25 8,58 5,1 Matiz 3,04 4,23 6,85 8,88 6,29 4,6 Dacia 1410 6,95 2,67 2,25 3,40 8,96 3,9 Clio 6,57 7,13 7,62 6,45 5,14 8,2 Octavia 8,85 7,32 8,75 8,18 4,71 13,8 Megane 8,36 8,11 8,21 5,98 4,44 12,0 Cielo 7,04 6,22 6,52 5,99 6,45 7,9 Fabia 5,60 6,79 8,40 7,89 4,19 8,9
5. Estimation par le Logit Multinomial
On applique tout d’abord à l’ensemble des véhicules un modèle Logit multinomial. Nous avons des paramètres différents en fonction des alternatives pour les variables explicatives qui restent constantes sur les alternatives (comme le revenu) et des paramètres constants pour les variables qui dépendent des alternatives.Pour prendre en compte le revenu, on a crée des nouvelles variables, en multipliant le revenu par des variables indicatrices (ex : Revenu_Solenza = Revenu*Solenza (dummie))1. Les résultats des estimations des paramètres sont dans l’Annexe 1. Tous les paramètres sont très significatifs, mais pour utiliser le modèle en vue de faire de prévisions sur les automobiles susceptibles d’entrer sur le marché, cela n’est pas suffisant. Il faut que les paramètres restent inchangés à l’arrivée d’une nouvelle voiture, pour récupérer de bonnes estimations des parts de marché. Nous essayons de voir donc si le modèle respecte ou non l’hypothèse d’Indépendance des Alternatives non Pertinentes (I.I.A.), en éliminant successivement toutes les automobiles de l’ensemble de choix (Tableau 2). Le test utilisé est celui de Hausman et McFadden (1984). Tableau 2 : Résultats du test I.I.A. - modèle Logit Multinomial Voiture éliminée 2χ P
Solenza 4,414 0,621 Matiz 21,53 0,001 Dacia 1410 55,74 0,000 Clio 5,327 0,503 Octavia 0,838 0,991 Mégane 17,90 0,006 Cielo 0,675 0,995 Fabia 0,875 0,989
1 Solenza, Matiz, Dacia, Clio, Octavia, Megane, Cielo, Fabia sont toutes des variables dummies

29
L’hypothèse est clairement rejetée pour certains véhicules. Pour relâcher cette propriété, nous pouvons utiliser un Nested Logit en regroupant les alternatives en sous-ensembles et considérer un choix en plusieurs étapes, en appliquant à chaque étape un logit multinomial. Ainsi l’hypothèse I.I.A. doit être respectée dans chaque groupe, mais une certaine corrélation est permise entre les groupes. Une telle formulation (Logit emboîté ou Nested Logit) représente un instrument intéressant pour estimer le choix, parce qu’il permet aussi à la probabilité de conserver une forme explicite. Le modélisateur décide lui-même comment regrouper les modalités qu’il trouve semblables, affin d’eviter le risque de voir leur probabilité de choix influencée par les autres modalités du même groupe. Trouver la spécification optimale d’un Nested Logit s’avère particulièrement difficile, à cause d’un grand nombre de possibilités de groupage. Dans notre application, avec 8 modalités, on peut former 2, 3, 4, 5, 6 ou 7 groupes. Par exemple, si nous formons 4 groupes, de 4, 2, 1, 1 produits, le nombre de
possibilités de former les groupes sera égal à : 42067024
48 =×=×CC . Le
nombre total des possibilités de regroupement des 8 véhicules est de 4292. Il sera donc très coûteux d’estimer tous les modèles et choisir le meilleur. Il est préférable de trouver un algorithme rationnel pour partager l’ensemble de choix. 6. Estimation par Nested Logit – partage selon les dimensions
C’est le plus répandu partage dans les applications (Goldberg, 1995, Cecchini, 2000), selon la segmentation habituelle de l’industrie automobile. Dans notre étude, par ce type de partage nous obtenons les groupes suivants : - groupe 1 : Matiz - groupe 2 : Solenza, Clio, Fabia - groupe 3 : Dacia1410, Octavia, Mégane, Cielo Nous appelons ce modèle – Nested Logit 1. Les classes sont définies selon les dimensions (intérieure, extérieure, coffre), on garde donc la variable dimensions
comme décrivant les qualités communes aux choix d’un même groupe )( lx . Les
autres variables vont caractériser le choix à l’intérieur des groupes. Figure 1 : La structure arborescente du choix selon les dimensionnes des voitures
Achat
Groupe 1
Matiz
Groupe 2
Solenza Clio Fabia
Groupe 3
Dacia 1410
Octavia Mégane Cielo

30
Comme la variable dimensions peut varier que d’un groupe à l’autre, mais pas à l’intérieur des groupes, on construit des nouvelles variables décrivant les dimensionnes des voitures d’un groupe en multipliant les valeurs moyennes de l’attribut dimensions pour chaque groupe (issues du Tableau 1) par des variables indicatrices : dim gr.1 = 3,04×matiz dim gr.2 = 6,07× (solenza+clio+fabia) dim gr.3 = 7,08× (dacia1410+octavia+mégane+cielo)
Les résultats des estimations des paramètres se trouvent dans l’Annexe 1 (Nested Logit 1). Ils sont encore plus modestes que ceux du Logit Multinomial. Nous remarquons aussi des paramètres inclusifs >1, ce qui indique une mauvaise spécification du modèle. Comme les estimations nous le montrent, il semble que le résultat est dû à la faible homogénéité des groupes. Nous essayons donc de trouver une autre spécification pour la structure arborescente. 7. Estimation par Nested Logit – partage selon la n ationalité ou le prix
La manière de partager l’ensemble des véhicules selon la nationalité du producteur est justifiée par le comportement de certains marchés automobile. En effet, en 2002 les 10 premiers modèles de voitures vendus en France étaient français. En Allemagne, en 2002 les 10 premiers modèles de voitures vendus étaient allemands. Cecchini (2000) suppose que c’est la perception des acheteurs sur la robustesse mécanique qui accompagne la nationalité et partage l’ensemble du choix. Dans notre étude, les variables envisagées pour expliquer le choix entre les groupes, semblables à la robustesse mécanique sont moteur et carrosserie. Nous faisons donc deux spécifications de la structure, tout en gardant successivement les variables moteur (modèle Nested Logit 2) et carrosserie (modèle Nested Logit 3) pour expliquer le choix entre les groupes. Pour maintenir les deux variables à l’extérieur des groupes, on génère une autre variable qui contient les deux : 2/)( ecarrosserimoteurrobustesse += (modèle Nested Logit 3bis)2. Nous obtenons trois groupes, selon la nationalité : - groupe 1 : Solenza, Matiz, Dacia1410, Cielo (voitures roumaines) - groupe 2 : Clio, Mégane (voitures françaises) - groupe 3 : Octavia, Fabia (voitures tchèques) Tout comme dans le modèle Nested Logit 1, nous bloquons les variables qui restent à l’extérieur (moteur et carrosserie) aux niveaux moyens de chaque groupe: Modèle Nested Logit 2 :
mot_ gROM = 4,82× ( solenza+matiz+dacia1410+cielo) mot_ gFRA = 7,62× (clio+ mégane) mot_ gTCH = 7,22× (octavia+fabia)
2 Les résultats de ce modèle sont très faibles et ne sont pas présentés dans cet article

31
Modèle Nested Logit 3 : car_ gROM = 5,03× ( solenza+matiz+dacia1410+cielo) car_ gFRA = 7,91× (clio+ mégane) car_ gTCH = 8,57× (octavia+fabia) Nous pouvons aussi de constituer les groupes selon les prix des véhicules. On peut garder la variable prix à l’extérieur ou à l’intérieur des groupes (Nested Logit 4 et Nested Logit 5). Nous obtenons dans les deux cas les groupes suivants : - groupe 1 : Solenza, Matiz, Dacia1410 (prix ≤ 6000€) - groupe 2 : Clio, Cielo, Fabia (prix∈(6000€ ;10000€]) - groupe 3 : Mégane, Octavia (prix > 10000€) Nous définissons les nouvelles variables pour le modèle Nested Logit 3 : prix_ g1 = 4,58× ( solenza+matiz+dacia1410) prix_ g2 = 8,33× (clio+cielo+ fabia) prix_ g3 = 12,9× (octavia+mégane) Les résultats des estimations des paramètres de ces derniers modèles (Nested Logit 2,3,4,5) se trouvent également dans l’Annexe 1. Comme pour les modèles précédents, ces spécifications ne donnent pas de très bons résultats pour le marché roumain d’automobiles. Pour toutes les spécifications utilisées pour le modèle Nested Logit il y a des paramètres inclusifs à l’extérieur de l’intervalle [0;1], ce qui contredit le principe de maximisation de l’utilité stochastique (Hausmman & McFadden, 1984). Quelle que soit donc la variable utilisée pour expliquer le choix entre les groupes, on n’arrive pas à obtenir des groupes assez homogènes, ce qui nous oblige à chercher un partage qui corresponde à ce but. 8. Estimation par Nested Logit - partage par la cla ssification hiérarchique
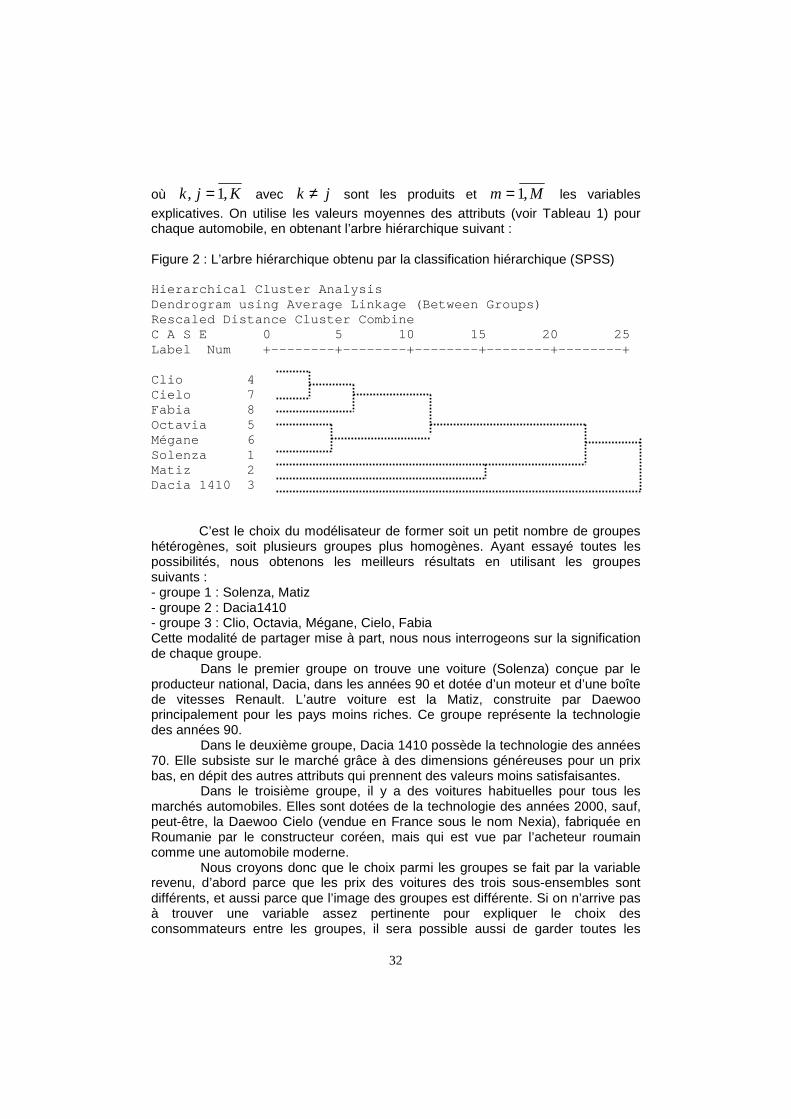
Nous avons vu dans les modèles précédents que le partage en sous-ensembles utilisant une seule variable n’est pas satisfaisant. C’est à cause du fait que sur un marché émergent les différentes variables explicatives sont moins corrélées. Sur les marchés automobiles en phase de maturité, l’augmentation des dimensions implique une augmentation du confort, de la robustesse mécanique (carrosserie, moteur), du prix, etc. Ce n’est pas le cas en Roumanie, où subsistent des voitures conçues dans des périodes différentes. Un modèle qui a des dimensions généreuses ne possède pas nécessairement une bonne carrosserie ou un moteur performant. Nous allons partager l’ensemble des automobiles en sous-ensembles en tenant compte de toutes les variables à la fois, utilisant la classification hiérarchique. Considérons la distance euclidienne entre les produits :
∑=
−=M
mjmkmjk xxd
1
2, )( (11)
32
où Kjk ,1, = avec jk ≠ sont les produits et Mm ,1= les variables
explicatives. On utilise les valeurs moyennes des attributs (voir Tableau 1) pour chaque automobile, en obtenant l’arbre hiérarchique suivant : Figure 2 : L’arbre hiérarchique obtenu par la classification hiérarchique (SPSS) Hierarchical Cluster Analysis Dendrogram using Average Linkage (Between Groups) Rescaled Distance Cluster Combine C A S E 0 5 10 15 20 25 Label Num +--------+--------+--------+--------+ --------+ Clio 4 Cielo 7 Fabia 8 Octavia 5 Mégane 6 Solenza 1 Matiz 2 Dacia 1410 3
C’est le choix du modélisateur de former soit un petit nombre de groupes
hétérogènes, soit plusieurs groupes plus homogènes. Ayant essayé toutes les possibilités, nous obtenons les meilleurs résultats en utilisant les groupes suivants : - groupe 1 : Solenza, Matiz - groupe 2 : Dacia1410 - groupe 3 : Clio, Octavia, Mégane, Cielo, Fabia Cette modalité de partager mise à part, nous nous interrogeons sur la signification de chaque groupe.
Dans le premier groupe on trouve une voiture (Solenza) conçue par le producteur national, Dacia, dans les années 90 et dotée d’un moteur et d’une boîte de vitesses Renault. L’autre voiture est la Matiz, construite par Daewoo principalement pour les pays moins riches. Ce groupe représente la technologie des années 90.
Dans le deuxième groupe, Dacia 1410 possède la technologie des années 70. Elle subsiste sur le marché grâce à des dimensions généreuses pour un prix bas, en dépit des autres attributs qui prennent des valeurs moins satisfaisantes.
Dans le troisième groupe, il y a des voitures habituelles pour tous les marchés automobiles. Elles sont dotées de la technologie des années 2000, sauf, peut-être, la Daewoo Cielo (vendue en France sous le nom Nexia), fabriquée en Roumanie par le constructeur coréen, mais qui est vue par l’acheteur roumain comme une automobile moderne.
Nous croyons donc que le choix parmi les groupes se fait par la variable revenu, d’abord parce que les prix des voitures des trois sous-ensembles sont différents, et aussi parce que l’image des groupes est différente. Si on n’arrive pas à trouver une variable assez pertinente pour expliquer le choix des consommateurs entre les groupes, il sera possible aussi de garder toutes les

33
variables à l’intérieur des groupes et laisser des variables indicatrices à l’extérieur. Nous appelons ce modèle Nested Logit 6, dont les résultats se trouvent également dans l’Annexe 1. Remarquons tout d’abord que pour cette application Nested Logit 6 c’est la seule spécification d’un modèle Nested Logit à avoir tous les paramètres inclusifs entre 0 et 1. Nous observons une bonne significativité des paramètres, pour ceux qui expliquent le choix dans les groupes, comme pour ceux qui restent à l’extérieur. Le pourcentage de bonnes prédictions, 58,4% est supérieur aux
pourcentages obtenus pour les modèles antérieurs, emboîtés ou non. Le 2R de McFadden prend aussi une valeur satisfaisante3. La propriété I.I.A. n’est toujours pas respectée pour la majorité des alternatives du choix (Tableau 3). Il y a pourtant
un certain progrès, les valeurs 2χ sont généralement plus petites par rapport aux valeurs obtenues pour le modèle Logit Multinomial (Tableau 2). Tableau 3 : Résultats du test I.I.A. - Nested Logit 6 Voiture éliminée 2χ p
Solenza 9,713 0,137 Matiz 13,04 0,042 Dacia 1410 7,964 0,241 Clio 4,065 0,668 Octavia 7,143 0,308 Mégane 31,65 0,000 Cielo 6,212 0,399 Fabia 1,554 0,956
Une manière d’utiliser le meilleur modèle obtenu pour les automobiles existantes déjà sur le marché est de simuler les changements occasionnées par les modifications des valeurs des certaines variables. A partir de l’expression de la probabilité de choisir une voiture quelconque, nous calculons les effets marginaux obtenus en augmentant d’une unité la valeur de la variable pour la voiture en question. Le calcul est fait dans le point des valeurs moyennes des variables explicatives. En modifiant en sens positif la variable dimensions (Annexe 2), nous observons une augmentation de la probabilité de choisir la voiture de référence et une diminution de la probabilité pour toutes les autres. Pour la variable prix (Annexe 3) nous obtenons de façon logique exactement le contraire : une diminution de la probabilité de choisir la voitures de référence et une augmentation de la probabilité pour toutes les autres Les effets marginaux ont tous les signes attendus et leurs valeurs sont logiques, plus grandes à l’intérieur d’un groupe et plus petites pour les voitures appartenant à d’autres groupes. Les producteurs utilisent, au moins intuitivement ce type de résultats. Les automobiles Renault Clio et Renault Laguna sont fabriquées pour l’Europe de l’Est en variantes limousines à quatre portes, équipées d’un coffre plus grand. Ce
3 Le R2 de McFadden prend d’habitude des valeurs assez basses. D’autres R2 basés sur celui de McFadden, qui se rapprochent plus facilement de 1 ont été proposés par d’autres auteurs (Estrella, Veal and Zimmerman)

34
comportement est dû à une élasticité élevée de la probabilité d’achat par rapport à la variable dimensions. 9. Critères basés sur les prévisions
Dans le paragraphe antérieur nous avons évalué les différents modèles possibles selon des critères économétriques : significativité des paramètres, R2 de McFadden (analyse de la variance), relâchement de l’hypothèse I.I.A., restrictions sur les paramètres inclusifs. Mais les modèles de choix discrets sont utilisés principalement, soit pour expliquer les déterminants du choix, soit pour effectuer des prévisions sur une ou plusieurs modalités. Il est intéressant dans la pratique de connaître le pouvoir prédictif des modèles candidats. On propose deux critères basés sur les prévisions : 1. Pourcentage de bonnes prédictions 2. Prévision des parts de marché Pourcentage de bonnes prédictions
Dans l’échantillon, le pourcentage de bonnes prédictions représente le nombre des individus pour lesquels le modèle a prédit correctement la modalité effectivement choisie divisé par le nombre total des individus. Pour les individus
indicés Ni ,1= et les modalités Mj ,1= le pourcentage peut être écrit :
N
yyN
iij
M
jij
2
)ˆ(
1 1
2
1∑∑
= =
−− (12)
avec : Ni ,1 =∀
≠=∀=>=
=. 0
, ,1, )1Prob()1Prob( 1 ˆ
sinon
jkMjkyysiy ikij
ij
Pour notre application, les résultats des pourcentages de bonnes prédictions se trouvent dans l’Annexe 5. On remarque le meilleur résultat (58,4%) pour le modèle Nested Logit 6, qui utilise la classification hiérarchique pour partager les modalités. Une analyse plus fine peut être envisagée pour chaque voiture, à partir d’un tableau croisé des modalités actuelles versus modalités prédites (Annexe 4). Prévision des parts de marché
Le pourcentage élevé de bonnes prédictions montre que le modèle est capable d’identifier en grande partie les alternatives choisies par les individus de l’échantillon. Mais pour estimer la part de marché d’un produit qu’on envisage de lancer sur le marché cela n’est pas suffisant. Comme les données proviennent d’une enquête on ne connaît pas les individus qui achèteraient ou pas une nouvelle voiture (peut-être même hypothétique). On connaît éventuellement, plus ou moins précisément, les valeurs moyennes des attributs, en les estimant par rapport aux véhicules déjà existants. De telles estimations sont vraiment réalisées lors des salons d’automobiles, où les constructeurs exposent des voitures-

35
prototypes pour examiner la réaction du public. En plus, approximativement un an avant de lancer une certaine automobile, sa version physique existe déjà et peut-être évaluée par rapport à la concurrence. Pour pouvoir donc utiliser le modèle économétrique afin d’estimer la part de marché du nouveau produit, nous déterminons d’abord s’il est capable de les estimer pour les produits déjà existants, en remplaçant les valeur de chaque variable explicative par les valeurs moyennes de l’échantillon.
Pour notre application, les valeurs moyennes des attributs spécifiques aux véhicules (dimensions, moteur, carrosserie, économie, pièces, prix) sont récupérées du Tableau 1. Quant à la variable spécifique aux individus (revenu) on prend l’ensemble des valeurs possibles, ce qui permet en plus d’observer les variations des parts de marché par rapport à cette variable. On utilise la distribution de la variable revenu (Figure 3) pour récupérer les parts de marché sur l’ensemble des individus (Annexe 5). Figure 3 : Distribution empirique de la variable revenu
0 0,2 0,4 0,6 0,8 1 1,2 1,4 1,6 1,8 2
revenu (*1000 euros)
Dans la mesure où les producteurs sont intéressés à mieux cibler les acheteurs potentiels, il est possible d’estimer aussi les parts de marché de chaque voiture pour tout intervalle éventuel des valeurs du revenu. Affin de comparer le pouvoir prédictif des modèles, dans l’Annexe 5, entre parenthèses, nous donnons un écart de prévision (%) calculé comme la différence relative entre le nombre de véhicules estimés et le nombre de véhicules effectivement vendus. Dans la dernière ligne du tableau (Annexe 5) se trouve, pour chaque modèle, la moyenne des valeurs absolues des écarts de prévision calculés sur les 8 voitures. On remarque le plus faible écart moyen de prévision (et par conséquent les parts de marché prédites les plus exactes) pour le modèle Nested Logit 6, qui utilise la classification hiérarchique pour partager les groupes.
10. Conclusions
Nous avons réussi à expliquer par des modèles de type Logit les différentes facettes d’un marché oligopolistique – le marché roumain d’automobile. La demande pour chacun des véhicules est bien prédite et aussi les attributs des produits qui déterminent le choix des individus. Il sera facile de déduire quelles sont les caractéristiques des biens qu’il faut favoriser pour augmenter les parts de marché. Les effets marginaux obtenus pour chaque variable explicative ont tous

36
les signes attendus et leurs valeurs absolues sont plus grandes pour les automobiles d’un même groupe par rapport aux automobiles appartenant aux autres groupes.
Ces résultats indiquent quelles seront les démarches qu’il faut envisager à propos des politiques de marketing, de publicité et de recherche et développement. D’ailleurs, les producteurs jouent à court et moyen terme avec quelques attributs des véhicules (séries spéciales) et avec les prix (réductions des prix, promotions). A long terme, on peut préfigurer même les caractéristiques fondamentales d’une voiture qui sera construite. Les préférences divergentes des acheteurs sur les différents marchés obligent les fabricants à développer des modèles inédits pour cibler certains marchés émergents (voir Dacia-Renault Logan).
L’utilisation d’une méthode d’analyse des données (la classification hiérarchique) pour trouver une bonne structure du modèle Nested Logit (bonne significativité des paramètres, relâchement de l’hypothèse I.I.A., tous les paramètres inclusifs positifs et sous unitaires, pourcentage de bonnes prédictions élevé) constitue une démarche originale. D’autres types de modèles (le Mixed Logit ou le Probit Multinomial) peuvent être aussi utilisés, mais dans cet article, on n’a visé que la meilleure spécification d’un Nested Logit pour un marché particulier - le marché automobile roumain. BIBLIOGRAPHIE Adda J., Cooper R. (2000). “Balladurette and Juppette: A Discrete Analysis of Scrapping Subsidies”,
Journal of Political Economy, vol.108, nr.4, Aug. Afsa Essafi E. (2000). “Les modèles logit polytomiques non ordonnées : théorie et applications”, INSEE
– Documents de Travail, Nr.0301, 2002 Auteur. (2005). “Spécification de la structure arborescente du modèle Nested Logit, par une méthode
d’analyse des données – application au marché automobile roumain”, Document de recherche
Ben-Akiva M., Lerman S. (1985). Discrete Choice Analysis: Theory and Application to Predict travel
Demand, Cambridge (Mass.), MIT Press Berry S. (1994). “Estimating Discrete Choice Models of Product Differentiation”, RAND Journal of
Economics, nr.25, p.242-262 Berry S., Levinsonn J., Pakes A. (1995). “Automobile Prices in Market Equilibrium”, Econometrica,
nr.63, p.841-890 Billot A., Thisse J.F. (1995). “Modèles de choix individuels discrets. Théorie et application à la
microéconomie”, Revue Economique, vol.46, nr.3, May, p.921-931 Bresson G., Mathieu C. (1992). “Différenciation horizontale et verticale des produits : une application à
l’industrie automobile”, Annales d’Economie et de Statistique, vol.0, nr.27, July-Sept, p.116-147
Brooks R., Fry T., Harris M. (1998). “Combining Choice Set Partition Tests for IIA : Some Results in the
Four Alternative Settings ”, Journal of Quantitative Economics, vol.14, nr.2, July

37
Cecchini L. (2000). “Différenciation du produit et concurrence oligopolistique : une étude du marché automobile français”, Revue Economique, vol.51, nr.1, Jan, p.103-117
Denicolo V. (2000). “Independence of Irrelevant Alternatives and Consistency of Choice”, Economic
Theory, vol.15, nr.1, Jan Dixit A., Stiglitz J. (1977). “Monopolistic Competition and Optimum Product diversity”, American
Economic Review, nr.67, p.297-308 Goldberg P.K. (1995). “Product differentiation and oligopoly in international markets: the case of the
U.S. automobile industry”, Econometrica, vol.63, nr.4, p.891-951 Goldberg P.K. (1998). “The evolution of price dispersion in the European car market”, Working Paper
6818, NBER Working Paper Series Hausman J.A., McFadden D. (1984). “Specification Tests for the Multinomial Logit model”,
Econometrica, nr.52, p.1219-1240 Manski C.F., McFadden D. (1981). “Structural Analysis of Discrete Data with Econometric Application” ,
MIT Press , Cambridge (Mass.) McFadden D. (1974). “Conditional Logit Analysis of Qualitative Choice Behaviour”, Frontiers in
Econometrics, Academic Press, New York, p.105-142 McFadden D. (1980). “Econometric Models of Probabilistic Choice among Products”, Journal of
Bussines, nr.53, p.513-529 McFadden D. (1981). “Econometric Models of Probabilistic Choice”, Structural Analysis of discrete Data
with Econometric Application, MIT Press, Cambridge (Mass.) McFadden D. (1984). “Econometric Analysis of Qualitative Response Models”, Handbook of
Econometrics, vol II, Ed. North Holland, Amsterdam, p.1395-1457 McFadden D. (1986). “The Choice Theory to Market Research”, Marketing Science, nr.5, p.275-297 McFadden D. (1987). “Regression Based Specification Tests for the Multinomial Logit Model”, Journal
of Econometrics, vol.34, nr.1/2, Jan-Feb, p.63-82 Pointet J.M. (1997). “Pour une conceptualisation du mimétisme de produit : mimétisme volontaires et
mimétisme contraint”, Economie Appliquée, vol.50, nr.1 Ray P. (1973). “Independence of Irrelevant Alternatives”, Econometrica, vol.41, nr.5, Sept, p.141-156 Samuelson L. (1985). “On the Independence from Irrelevant Alternatives in Probabilistic Choice
Models”, Journal of Economic Theory, vol.35, nr.2, Avril, p.376-389 Wojcik C. (2000). “Alternative Models of Demand for Automobiles”, Economics Letters, vol.68, nr.2,
Aug., p.113-118

38
Annexe 1 : Estimations des paramètres (logiciel LIMDEP) – écart type entre parenthèses
Logit NLogit 1 NLogit 2 NLogit 3 NLogit 4 NLogit 5 NLogit 6
Dimensionnes 0,742*** (0,104)
- 0,866*** (0,144)
0,796*** (0,141)
0,729*** (0,127)
0,661*** (0,124)
0,697*** (0,124)
Moteur 0,289*** (0,081)
0,280*** (0,077)
- 0,248*** (0,094)
0,280*** (0,082)
0,400*** (0,088)
0,477*** (0,106)
Carroserie 0,311*** (0,087)
0,211** (0,083)
0,327*** (0,102)
- 0,290*** (0,089)
0,426*** (0,093)
0,457*** (0,108)
Economie 0,527*** (0,086)
0,382*** (0,084)
0,658*** (0,105)
0,622*** (0,104)
0,375*** (0,087)
0,541*** (0,092)
0,623*** (0,104)
Pieces 0,679*** (0,099)
0,525*** (0,123)
0,747*** (0,150)
0,711*** (0,141)
0,620*** (0,126)
0,570*** (0,113)
0,624*** (0,113)
Prix -1,692*** (0,191)
-1,581*** (0,239)
-2,116*** (0,307)
-2,073*** (0,314)
- -1,219*** (0,406)
-1,087* (0,876)
Solenza -
- -
- - 18,254 (12,11)
12,482 (10,35)
Matiz -
- -
- - 19,369 (12,10)
13,849 (10,50)
Dacia1410 -
- -
- - 19,392 (12,18)
19,854** (8,706)
Clio -
- -
- - -0,339 (0,562)
-0,300 (0,743)
Octavia -
- -
- - 2,872 (3,492)
2,453 (4,269)
Megane -
- -
- - 2,110 (3,019)
2,245 (2,741)
Cielo -
- -
- - -1,293** (0,736)
-1,109 (1,022)
Fabia - - - - - 0,000 (param. fixe)
0,000 (param. fixe)
Rvn_Solenza -0,783*** (0,084)
-0,653*** (0,085)
-0,879*** (0,176)
-0,902*** (0,161)
-2,357** (1,029)
- -
Rvn_Matiz -0,592*** (0,080)
-1,439*** (0,439)
-0,761*** (0,156)
-0,640*** (0,134)
-2,015** (0,099)
- -
Rvn_Dacia1410 -0,866*** (0,120)
-1,303*** (0,383)
-1,150*** (0,194)
-1,157*** (0,187)
-2,219** (1,038)
- -
Rvn_Clio -0,157*** (0,036)
-0,111*** (0,337)
-1,056** (0,564)
-0,997** (0,476)
-0,036 (0,040)
- -
Rvn_Octavia 0,399*** (0,086)
0,135 (0,154)
0,488*** (0,153)
0,493*** (0,159)
-0,189** (0,099)
- -
Rvn_Megane 0,315*** (0,068)
-0,052 (0,180)
-0,412 (0,506)
-0,351 (0,421)
-0,070 (0,092)
- -
Rvn_Cielo -0,246*** (0,057)
-0,631** (0,274)
-0,223 (0,191)
-0,166 (0,163)
-0,082* (0,049)
- -
Rvn_Fabia 0,000 (param. fixe)
0,000 (param. fixe)
0,000 (param. fixe)
0,000 (param. fixe)
0,000 (param. fixe)
- -
* p<0,1 ** p<0,05 *** p<0,01

39
Annexe 1 : Estimations des paramètres (logiciel LIMDEP) – écart type entre parenthèses (continuation)
Logit NLogit 1 NLogit 2 NLogit 3 NLogit 4 NLogit 5 NLogit 6
Dim_g1 - 0,000 (param. fixe)
- - - - -
Dim_g2 -
-0,419 (0,353)
-
- - - -
Dim_g3 -
0,247 (0,233)
-
- - - -
Mot_gROM -
- 0,322 (0,747)
- - - -
Mot_gFRA -
- 0,558** (0,327)
- - - -
Mot_gTCH - - 0,000 (param. fixe)
- - - -
Car_gROM -
- -
0,530 (0,812)
- - -
Car_gFRA -
- -
0,646** (0,337)
- - -
Car_gTCH - - - 0,000 (param. fixe)
- - -
Prix_g1 - - - - 0,000 (param. fixe)
- -
Prix_g2 -
- -
- -2,474** (1,221)
- -
Prix_g3 -
- -
- -2,413*** (0,686)
- -
Rvn_g1 -
- -
- - -2,076*** (0,355)
0,000 (param. fixe)
Rvn_g2 -
- -
- - 0,000 (param. fixe)
-1,408*** (0,216)
Rvn_g3 -
- -
- - -0,144 (0,102)
1,798*** (0,273)
G1 -
1,000 (param. fixe)
1,237 (0,352)
1,403*** (0,369)
0,947 (0,403)
0,958** (0,381)
0,895*** (0,247)
G2 -
2,055*** (0,689)
0,329 (0,171)
0,380** (0,176)
1,025 (0,588)
1,319** (0,560)
1,000 (param. fixe)
G3 -
1,375*** (0,277)
-0,120 (0,246)
-0,089 (0,260)
1,625 (0,528)
1,674*** (0,456)
0,745 (0,623)
R2 McFadden 0,385 0,347 0,457 0,453 0,491 0,508 0,500
* p<0,1 ** p<0,05 *** p<0,01

40
Annexe 2 : Effets marginaux de la variable dimensions
Solenza Matiz D. 1410 Clio Octavia Mégane Cielo Fabia
Solenza 0,080 -0,043 -0,021 -0,005 -0,003 -0,003 -0,002 -0,002 Matiz -0,043 0,070 -0,018 -0,002 -0,003 -0,002 -0,001 -0,001 Dacia1410 -0,019 -0,016 0,040 0,000 0,000 0,000 0,000 0,000 Clio -0,006 -0,003 0,000 0,038 -0,007 -0,008 -0,008 -0,008 Octavia -0,004 -0,003 0,000 -0,007 0,033 -0,007 -0,007 -0,005 Mégane -0,004 -0,003 0,000 -0,008 -0,007 0,033 -0,007 0,006 Cielo -0,003 -0,001 0,000 -0,008 -0,007 -0,007 0,030 -0,005 Fabia -0,002 -0,001 0,000 -0,008 -0,005 -0,006 -0,005 0,027
Annexe 3 : Effets marginaux de la variable prix
Solenza Matiz D. 1410 Clio Octavia Mégane Cielo Fabia
Solenza -0,125 0,068 0,033 0,007 0,005 0,005 0,003 0,003 Matiz 0,068 -0,110 0,027 0,004 0,004 0,003 0,002 0,002 Dacia1410 0,029 0,025 -0,062 0,000 0,000 0,000 0,000 0,000 Clio 0,009 0,005 0,001 -0,059 0,011 0,013 0,012 0,012 Octavia 0,006 0,005 0,000 0,011 -0,051 0,011 0,012 0,008 Mégane 0,006 0,004 0,000 0,013 0,011 -0,051 0,010 0,009 Cielo 0,004 0,002 0,000 0,012 0,012 0,010 -0,047 0,008 Fabia 0,003 0,002 0,000 0,012 0,008 0,009 0,008 -0,042
Annexe 4 : Modalités actuelles versus modalités prédites – Nested Logit 6
modalité prédite
Solenza Matiz D1410 Clio Octavia Mégane Cielo Fabia total
Solenza 51 12 2 0 0 2 0 0 67 Matiz 16 24 6 0 1 0 0 0 47 D.1410 5 6 21 0 0 0 0 0 32 Clio 5 1 1 7 1 1 2 0 18 Octavia 1 1 0 2 7 3 2 0 16 Mégane 0 0 0 1 5 6 1 2 15 Cielo 0 0 0 3 3 0 6 2 14 Fabia 0 0 0 2 0 1 2 7 12
Total 78 44 30 15 17 13 13 11 221
mod
alité
act
uelle

41
Annexe 5 : Parts de marchés prédites (écarts de prévision entre parenthèses) et pourcentage de bonnes prédictions
Part de marché
Voiture Réele Logit NLogit 1
NLogit 2
NLogit 3
NLogit 4
NLogit 5
Nlogit 6
Solenza 24,9 30,6 (+22,9)
25,6 (+2,81)
28,5 (+14,5)
29,7 (+19,3)
31,9 (+28,1)
29,7 (+19,3)
28,6 (+14,8)
Matiz 17,4 15,4 (-11,5)
18,9 (+8,62)
15,0 (-13,8)
13,9 (-20,1)
15,9 (-8,62)
16,7 (-4,02)
16,0 (-8,04)
D.1410 11,9 7,5 (-37,0)
8,4 (-29,4)
7,2 (-39,5)
7,2 (-39,5)
7,7 (-35,3)
9,5 (-20,2)
9,8 (-17,6)
Clio 6,7 6,2 (-7,46)
5,1 (-23,9)
8,7 (+29,9)
8,2 (+22,4)
6,5 (-2,99)
8,5 (+26,9)
7,8 (+16,4)
Octavia 5,8 4,1 (-29,3)
4,7 (-19,0)
4,1 (-29,3)
4,2 (-27,6)
4,4 (-24,1)
4,7 (-19,0)
5,6 (-3,45)
Megane 5,5 5,4 (-1,82)
5,4 (-1,82)
5,3 (-3,64)
5,6 (+1,82)
4,5 (-18,2)
4,0 (-27,3)
5,6 (+1,82)
Cielo 5,1 6,8 (+33,3)
7,8 (+52,9)
4,6 (-9,80)
4,8 (-5,88)
5,6 (+9,80)
4,6 (+9,80)
4,4 (-13,7)
Fabia 4,6 5,7 (+23,9)
6,0 (+30,4)
8,5 (+84,8)
8,3 (+80,4)
5,4 (+17,4)
4,2 (+8,70)
4,1 (-10,8)
Total 81,9 81,9 (20,9)
81,9 (21,1)
81,9 (28,1)
81,9 (27,1)
81,9 (18,1)
81,9 (16,9)
81,9 (10,8)
% bonnes prédictions
52,0
49,3
52,0
51,5
57,9
57,9
58,4

42

43
STUDIA UNIVERSITATIS BABEŞ-BOLYAI, OECONOMICA, LI, 2, 2006
WHAT DO ENTREPRENEURS EXPECT FROM ROMANIA'S EU ACCESSION? RESULTS FROM AN EXPERT INTERVIEW SURVEY
Frank KUPFERSCHMIDT * Friedrich-Alexander-Universität Erlangen-Nürnberg, Germany Andreea GOZMAN Babeş-Bolyai University of Cluj Napoca, Romania
ABSTRACT. The present paper discusses the results of an expert interview survey. Romanian entrepreneurs in small and medium-sized enterprises (SME) were interviewed about their expectations of the effects of EU accession on Romania's economy as well as on their enterprises. Following general characteristics and their expectations entrepreneurs can be regrouped into four clusters. Firstly, we compare the results of our interviews with an existing opinion research study (IRSOP 2004). Then, we resume the expectations of the entrepreneurs on Romania's readiness for accession, on implications on the general economy as well as on SME. In general, SME entrepreneurs perceive EU accession very positively but expect negative effects on their business such as the increase of wage costs and other input prices. Smaller business units fear the EU accession more than bigger enterprises. Furthermore, all expectations are highly influenced by uncertainty about the true effects.
JEL Classification: F15, M21 Keywords: Economic Integration, EU Accession, Business Economics, SME
Introduction
Romania joined the EU on 1 January 2007. The European Commission delegation in Romania still monitors general political, economic, social and legislative developments. Jonathan Scheele, head of the delegation of the European Commission in Romania, pointed out in his statement on the latest monitoring report in Mai 2006: "There will be no honeymoon after the EU-Romania wedding night. Romania will be expected to operate as a full Member State from day one.”1 Though Romania joined the EU, nor Romania nor the EU can be sure about its implications in the aftermath of accession. The public discussion on
* Corresponding author. Address: Universität Erlangen-Nürnberg, Lehrstuhl für Volkswirtschaftslehre insbes. Finanzwissenschaft, Lange Gasse 20, D-90403 Nürnberg, Germany. Phone: +49 911 5302 203. E-mail: [email protected] 1 See EU (2006) for the complete statement.
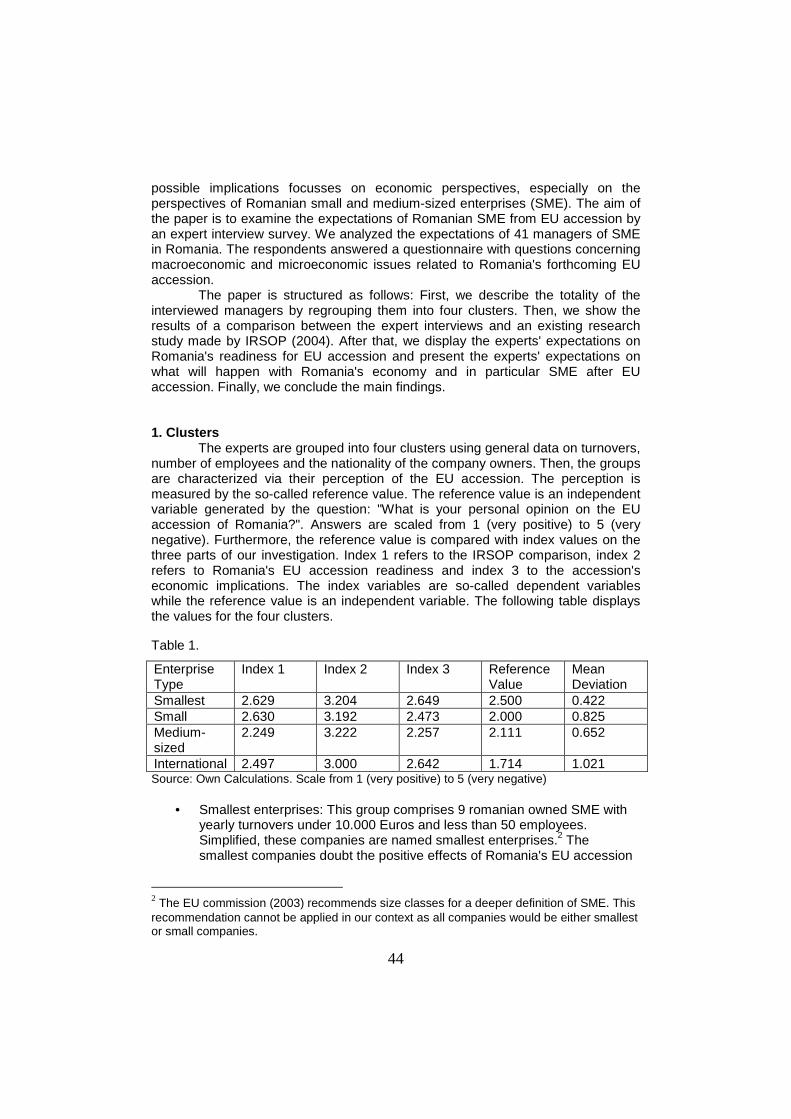
44
possible implications focusses on economic perspectives, especially on the perspectives of Romanian small and medium-sized enterprises (SME). The aim of the paper is to examine the expectations of Romanian SME from EU accession by an expert interview survey. We analyzed the expectations of 41 managers of SME in Romania. The respondents answered a questionnaire with questions concerning macroeconomic and microeconomic issues related to Romania's forthcoming EU accession.
The paper is structured as follows: First, we describe the totality of the interviewed managers by regrouping them into four clusters. Then, we show the results of a comparison between the expert interviews and an existing research study made by IRSOP (2004). After that, we display the experts' expectations on Romania's readiness for EU accession and present the experts' expectations on what will happen with Romania's economy and in particular SME after EU accession. Finally, we conclude the main findings.
1. Clusters
The experts are grouped into four clusters using general data on turnovers, number of employees and the nationality of the company owners. Then, the groups are characterized via their perception of the EU accession. The perception is measured by the so-called reference value. The reference value is an independent variable generated by the question: "What is your personal opinion on the EU accession of Romania?". Answers are scaled from 1 (very positive) to 5 (very negative). Furthermore, the reference value is compared with index values on the three parts of our investigation. Index 1 refers to the IRSOP comparison, index 2 refers to Romania's EU accession readiness and index 3 to the accession's economic implications. The index variables are so-called dependent variables while the reference value is an independent variable. The following table displays the values for the four clusters.
Table 1.
Enterprise Type
Index 1 Index 2 Index 3 Reference Value
Mean Deviation
Smallest 2.629 3.204 2.649 2.500 0.422 Small 2.630 3.192 2.473 2.000 0.825 Medium-sized
2.249 3.222 2.257 2.111 0.652
International 2.497 3.000 2.642 1.714 1.021 Source: Own Calculations. Scale from 1 (very positive) to 5 (very negative)
• Smallest enterprises: This group comprises 9 romanian owned SME with yearly turnovers under 10.000 Euros and less than 50 employees. Simplified, these companies are named smallest enterprises.2 The smallest companies doubt the positive effects of Romania's EU accession
2 The EU commission (2003) recommends size classes for a deeper definition of SME. This recommendation cannot be applied in our context as all companies would be either smallest or small companies.

45
as they dispose the lowest reference value. Furthermore, the smallest enterprises display relatively homogenous expectations as the index values do not show large variance measured by the mean deviation.
• Small enterprises: This group comprises 13 romanian owned SME with yearly turnovers of more than 10.000 Euros and less than 50 employees. Though the small enterprises have the second highest positive reference value the standard deviation shows a relatively high variance of expectations in comparison to the reference value. The individual answers in the three parts of the questionnaire widely show more negative expectations on specific issues of the accession than the general perceptions measured by the reference value. In general, small enterprises perceive EU accession positively but are rather pessimistic about concrete issues.
• Medium-sized enterprises: This group comprises 9 romanian owned SME with turnovers of more than 10.000 Euros and a number of employees of more than 51. Furthermore, we simplify by renaming this type of SME into medium-sized companies. Though the medium-sized enterprises display the third highest reference value the expectations have a low variance. The index values differ the lowest from the reference value so that the experts' expectations are relatively homogenous compared to small enterprises and international companies. The medium-sized enterprises seem to have a rather optimistic and at the same time realistic view on Romania's EU accession.
• International enterprises: This group comprises 10 enterprises partially or totally owned by foreign business units. The international companies show the most optimistic reference value but index values scatter the most around the reference value. Though the experts have very positive expectations they fear negative effects on the general economy and on their individual business.
2. Experts versus IRSOP
In the first part of our questionnaire, we partially reproduced a study realized by the market research company IRSOP in August 2004. IRSOP (2004) analyzed the perception of fraud associated with EU subsidies. Hereby, we could compare the experts' expectations for selected issues with existing data. For the comparison we focus only on 80 interviewed SME's among the whole IRSOP survey totality. Note, that the two studies are not totally comparable as they addressed two different totalities. We examined the experts' trust in the correct distribution of EU subsidies in Romania and compared them with the IRSOP results. The following table shows selected results.

46
Table 2.
Do you agree with the following statement? Experts IRSOP Funds are correctly distributed by EU 74 66 Funds are transparently distributed by EU 44 36 Funds are correctly distributed by Romanian institutions
23 25
Funds are correctly used by Romanians 40 26 No fraud with funds 0 3 Some fraud with funds 35 23 Much fraud with funds 63 73 Source: Own Calculations and IRSOP (2004). Ratio in % of respondents who agree with the statement..
Hereby, we observe that both experts in our survey as well as SME's in the
IRSOP study trust more in EU institutions than in Romanian institutions concerning the correct distribution of EU subsidies. Furthermore, the experts generally suspect less intensive fraud with EU subsidies but do not neglect the existence of fraud. 3. Romania's Accession Readiness
Part 2 of the questionnaire comprises questions on Romania's EU accession readiness and on the entrepreneurs' opinions on the demand for institutional reforms. The main finding is somehow surprising. The experts think that though Romania meets most of the accession criteria Romania is not yet ready to join the EU. We asked the experts if they agree on the statement "Do you agree that Romania is not ready to join the EU in 2007?". 72% of all experts think that Romania is not yet prepared for accession in 2007. Furthermore, 78% of the respondents believe that Romania disposes a comparative disadvantage compared with Central and Eastern European nations which joined EU in 2004. Additionally, the experts widely agree (92%) that there is huge demand for institutional reforms in Romania though there is a relatively high rate of indifferent opinions. We should note that the ratio of respondents who answered the readiness question by "Do not know" is relatively low (between 0 and 10%). In contrast, the same ratio for the disadvantage question amounts to 11 to 31% and for the reform question from 8 to 20%.
Then, we examined the readiness related to specific accession criteria. In contrast to the rather pessimistic view on general readiness, the experts are far more optimistic about specific accession criteria defined in the chapters of the EU accession monitoring reports.3 The summary index of responses to questions on accession criteria displays a general value of 2.31 while the agreement value of the summary statement mentioned above only amounts to 3.06. The difference between these two numbers underlines the initial statement that Romania is not ready for accession though it widely fulfills the accession criteria. Furthermore, this adds to the relatively pessimistic index value for readiness (index 2) compared to the rather optimistic reference values in the first table.
Again, the experts' responses regarding 10 selected chapters can be compared to the IRSOP study which we partially reproduced for our expert
3 See European Commisson (2005) for the monitoring report 2005 with 28 chapters in detail.

47
interview survey. The results are shown in the following table. Hereby, we find out that in general both IRSOP-respondents and experts have widely the same opinion on the fulfillment of the specific criteria. Though, a difference should be pointed out: experts agree to a far higher extent in the fulfillment of the three essential criteria rule of law, free competition and functional market economy than the SME in the IRSOP study. This might be due to the efforts made by Romanian authorities in the past year to better meet the criteria. The EU commission points out in the May 2006 report that "progress has continued since the October 2005 report. More appropriate fiscal, monetary and wage policies have been adopted." (European Commission (2006), p. 6.) In contrast, the experts are at least as pessimistic if not more pessimistic about criteria which the IRSOP respondents already did not rate as fulfilled in 2004 (implementation of EU legislation, independence of judiciary).
Table 3.
Do you agree that Romania meets the following criteria Experts IRSOP Press freedom 91 83 Human rights 81 76 Rule of law 79 54 Free competition 73 60 Functional market economy 67 50 Approximation of EU legislation 63 60 Implementation of EU legislation 37 45 Environment protection 35 31 Independence of judiciary 35 43 Competitive agriculture 16 16 Source: Own Calculations and IRSOP (2004). Ratio in % of respondents who agree with the statement. 4. Macroeconomic Expectations
In part 3 of the questionnaire, we investigated the entrepreneurs' expectations on how the EU accession will influence Romania's macroeconomic parameters. The following table shows the results.
Table 4. Smallest Small Mid-sized International Total Economic Growth 67 100 89 100 90 FDI 67 85 78 100 83 Consumer Protection 78 100 78 90 88 Selling Market 78 100 78 80 85 Capital Market 67 92 78 90 83 Corruption 67 85 44 80 71 Bureaucracy 56 77 67 90 73 Migration 56 77 67 90 71 Competition 44 38 67 80 56 Living Standards 33 46 67 80 56 Source: Own Data. Ratio in % of respondents who agree with the statement: Do you agree that EU accession will positively affect...

48
• Positive Effects: More than 80% of respondents expect positive
evolutions of the parameters economic growth, foreign direct investments (FDI), onsumer protection, selling markets and capital markets. Hereby, espondents primarily expect more economic growth and improvements in consumer protection. Though at least two third of the respondents expect positive effects on these macroeconomic parameters the four groups show different degrees of optimism. Most notably, the smallest enterprises have the lowest positive expectations. Small and international enterprises seem to be very optimistic about the future evolution of Romania's macroeconomic key data.
• Inconclusive effects: The entrepreneurs show more inconclusiveness
(less optimism) with regard to the parameters corruption, bureaucracy, migration, competition and living standard. While roughly 70% of the respondents expect improvements concerning corruption, bureaucracy and migration of labor force in Romania, only 56% think that EU accession will have positive effects on competition and living standards. The respondents show remarkable differences between the four groups. Again, the smallest enterprises have the biggest fears towards EU accession. For instance, only one third of them expects better living standards after EU accession. On the other hand, entrepreneurs in international companies display the most positive expectations. In such a way, 80% of entrepreneurs in international companies expect a positive evolution of living standards.
5. Implications on SME
We investigated the expectations on business related parameters such as the evolution of profits, wage costs, wage supplement costs, administrative costs, employee turnover and qualification of employees. Then, we examined the expected turnovers after EU accession.
The results on SME business parameters are coined more by inconclusiveness or pessimism than by optimism. The following table shows the results. The respondents answered that the EU accession will influence business related parameters but they are uncertain about direction and extent of the effect.
Table 5.
Positive Inconclusive Negative Profits 14 44 39 Wage costs 28 37 35 Wage supplement costs 21 37 35 Administrative costs 23 47 31 Employee turnover 40 44 17 Labor qualification 35 33 33 Source: Own Data. Ratios in %. Question: In which way EU accession will affect the following parameters of your business?

49
Furthermore, the table shows that more respondents expect a negative effect on business profits than a positive evolution of profit. The questions on wage costs, wage supplement costs and administrative costs show the same pattern so that entrepreneurs expect increasing input costs due to EU accession. Surprisingly, entrepreneurs expect the employee turnover to decrease. Concerning group specific expectations medium-sized enterprises display the most optimistic expectation on business related parameters. The index value made off all parameters amounts to 2.39 while the smallest enterprises display an index value of 2.59, international companies of 2.66 and small enterprises of 2.72. The relatively positive value for smallest enterprises seems to be at the first glance surprising. Note that this is the index only for business related parameters. In general, the positive value is compensated by other, more pessimistic values.
This ranking is somehow surprising when compared to the initially mentioned reference values in the first table. Small and international companies display the highest reference values, so have the most optimistic view on Romania's EU accession among all respondents. In contrast, they expect the most negative implications on their business compared to the other experts. Thus, small and international enterprises only apparently are EU accession optimists but fear concrete negative implications.
Additionally, entrepreneurs were interviewed about their expected turnover evolution after EU accession. Entrepreneurs were asked if they expect an increase of turnover or not. If yes, they were asked to estimate their expectation in concrete numbers. Finally, the respondents should indicate if and to which extent they expect to increase their turnover on the Romanian market or on foreign markets. The following figure shows the results.
The main result is that one half of respondents expect increasing turnovers
while the other half does not believe that their turnovers will be affected by EU accession. Those respondents who expect a positive evolution scaled the extent of the expected turnover increase. The majority of them await an increase in the national market, in most cases of more than 10%. The smaller part of

50
entrepreneurs expects to increase the turnover in international markets. The group specific differences in turnover expectation shall not be discussed as the response rate is relatively low especially in case of smallest, small and international enterprises.
A final note is to be made on those entrepreneurs who do not expect a turnover increase. While only 11% of medium sized companies do not await growing business volume, 46% of small and 56% of the smallest enterprises are pessimistic about their turnover forecast. Surprisingly, 80% of international enterprises do not expect growing turnovers after EU accession. So, smallest and international companies predominantly fear negative effects on their business volume when Romania joins the EU. In contrast, medium sized companies predominantly expect growing business.
6. Conclusions
This paper showed the results of an expert interview survey with 41 SME managers in Romania that were interviewed in spring 2006. The evaluation of the questionnaire generated multiple results which are summarized into the following main findings.
• Our results on the perception of fraud and on Romania's EU readiness correspond to a high extent with the IRSOP results. The experts think that Romania fulfills most of the accession criteria but is not yet ready for the accession. Experts believe that there is some fraud committed in the distribution of EU funds but trust more in EU authorities than in Romanian institutions.
• Most experts await positive effects of the accession on economic growth, FDI flows and the Romanian capital and selling market but fear negative effects on living standards, free competition, corruption and bureaucracy.
• The implications on SME are stronger coined by pessimism and uncertainty than by optimism. Experts expect increasing wage and other input costs. Only 50% of the respondents expect growing turnovers. The experts believe that their turnovers will more likely increase on the national market than on foreign markets.
• While medium-sized enterprises display the most optimistic expectations the smallest enterprises seem to be the most pessimistic about EU accession. Small and international enterprises show inconclusive expectations. Though they are widely optimistic about general issues they are rather pessimistic about concrete issues such as the accession's implications on SME.
• In general, the expectations are coined by uncertainty what will happen after EU accession. Obviously, also experts do not perfectly foresee the extent and direction of future economic implications of Romania's EU accession.
There are many ways to improve the method of that research work. We
are aware of the weaknesses of the applied approach. Taking into account the caveats of empirical work the results should be discussed more in a qualitative

51
dimension than in a quantitative dimension. Though, the qualitative findings can add to the discussion on the economic implications of Romania's EU accession. REFERENCES
European Commission (2006): “Communication from the Commission Monitoring report on the state of preparedness for EU membership of Bulgaria and Romania”, (notified under document SEC(2006)), http://www.infoeuropa.ro/ieweb/imgupload/Report2006_Summary_final_RO_EN.pdf, 09/20/2006.
European Commission (2005): “Romania 2005 Comprehensive Monitoring Report”, (notified under
document number SEC (2005) 13), http://delegatie.infoeuropa.ro/ROMR2005.pdf, 09/19/2006.
European Commission (2003): “Commission Recommendation of 6 May 2003 concerning the definition
of micro, small and medium-sized enterprises”, (notified under document number C(2003) 1422), http://europa.eu/eur-lex/pri/en/oj/dat/2003/l_124/l_12420030520en00360041.pdf,, 09/19/2006.
European Union (2006): “Declaratia domnului Jonathan Scheele, Seful Delegatiei Comisiei Europene în
România cu ocazia publicarii Raportului de Monitorizare”, Declaratie de Presa, http://www.infoeuropa.ro/jsp/page.jsp?cid=10970&lid=2, 09/19/2006.
IRSOP Market Research (2004): “Field Research on Public Perceptions of Fraud Associated with EU
Funds Deployment and the Delegation’s Image in Connection to such Deployment”, http://www.infoeuropa.ro/jsp/page.jsp?cid=2895&lid=2#31, 09/19/2006.

52

53
STUDIA UNIVERSITATIS BABEŞ-BOLYAI, OECONOMICA, LI, 2, 2006
AN OVERVIEW OF THE CAUSES, FACTORS AND ADVANTAGES O F STRATEGIC ALLIANCES BETWEEN COMPANIES AND UNIVERSIT IES.
THE CASE OF ROMANIA
Mihai Florin B ǍCILǍ* Babeş-Bolyai University of Cluj Napoca, Romania Oana Adriana GIC Ǎ Babeş-Bolyai University of Cluj Napoca, Romania
Abstract. This article reviews the importance of company-university long-term rela-tionships. It focuses on the identification of the causes which make universities and companies develop strategic alliances, the analysis of the key factors for a long-term successful collaboration between companies and universities and the descrip-tion of the benefits and barriers of these collaborations. The article also reveals the effectiveness of in-house research and development activities carried out by the Romanian companies, the external sources to create new products and services, the novelty of products and services as well as the external partners of the compa-nies to carry out together research activities.
JEL classification: I29 Key words: strategic alliances, knowledge transfer, technology transfer
1. Introduction The idea of a company-university relationship is not new. Such examples
of collaboration can be found in the relationship between universities and German pharmaceutical industry or the actions of United States to mobilize universities to help in World War I. (Bower,1993).
The changes in company and university environment, the trends affecting the way in which the companies carry out their research activities force these ac-tors to work together so that they gain a better position in their increased competi-tive environment.
Nowadays, there are well-founded reasons for universities and companies to collaborate. Companies are willing to engage in company-university alliances to
* Corresponding author. Faculty of Economics and Business Administration. Adress: : 58-60 Teodor Mihali Street, 400591 Cluj-Napoca, Romania. Phone: 40 + 0264 41.86.52 / 3 / 4 E-mail: [email protected]

54
share costs, gain access to universities research, labs and facilities in order to in-crease research and development productivity, supplement internal research, ob-tain access to highly trained students and professors, enhance companies’ image and acquire new technology (Santoro, 2000, Santoro, Chakrabarti, 1999),
The main reasons why university collaborates with companies are as fol-lows: attracting funds from industry for research, developing a strong infrastructure, the possibility to secure work placements for students and various research find-ings can be exploited (patents, licenses, brevets) (Barden , 1993, web.cornell.edu).
Figure 1. Strategic Alliances between Companies and Universities
On the other hand, however, these alliances between companies and uni-versities are not always a bed of roses. Such alliances can be plagued with quality control, compatibility, and coordination problems, lack of common understanding of needs just to name a few (Brennan, 2003).
The article represents an exhaustive analysis of literature regarding strate-gic alliances between companies and universities. This article intends to present not only the individual aspects of this type of relations but an overall vision of the strategic alliances analysing the causes, the key factors and their advantages. The article ends with a case study on the way the Transylvanian companies carry out the research activity as well as their collaboration with the universities.
Changes in Universities Environment and Mission
Changes in Companies’ Environment
Changing the Way in which Research and Development are performed
Strategic Alliances between Companies
and Universities
- Research Support - Cooperative Research - Knowledge Transfer -Technology Transfer
Advantages: - For companies - For universities - For economy and society
Barriers: - Quality control - Compatibility and coordination problems - Lack of common understanding of needs
Results - Patents, licenses - Better trained stu-dents - Research articles published and/or pre-sented at conferences -

55
2. Causes for the Development of Strategic Alliance s between Companies and Universities
Building a competitive knowledge-based European economy, building the European Research Area and the European Higher Education Area requires a growing number and the increased intensity of strategic alliances between compa-nies and universities.
Recently, the environment where companies and institutions of higher edu-cation are conducting their activities is increasingly unstable and competitive. Also the research and development activity has been increasingly affected by new trends that change the way the companies perform research. These changes have increased the pressure on companies and universities and have determined de-velopment of collaborative networks involving academic and business enterprise research because these relationships will bring significant economic benefits to both sides and to economy.
2.1 Changing the Way in which the Research and Deve lopment Are Realized
Global knowledge-based competition is changing fundamentally the envi-ronment in which European research and industry operate. Two trends affect the way in which companies conduct research. First, companies are seeking to col-laborate with other organizations; they no longer carry out most of their research and development alone. Secondly, research and development are going to be global and companies collaborate with organizations from other countries ( Lam-bert R. et al, 2003).
Nowadays, it is more difficult for a company to carry out the entire research activity inside the organization due to its limited expertise and resources. Under these circumstances, companies must choose to cooperate with companies, re-search institutes or universities. Thus, these trends have an important influence on the way in which universities operate: they become very attractive business part-ners because they have skilled researchers and adequate facilities (Lambert R. et al, 2003). Universities have researchers who are abreast to last national and inter-national discoveries in that field. Universities employ 34 percent of the total number of researchers in Europe, although national figures vary in the ratio of one to three between member states (26 percent in Germany, 55 percent in Spain, and over 70 percent in Greece). They are also responsible for 80 percent of fundamental re-search pursued in Europe (Communication from Commission, 2004).
Meanwhile, universities do not compete with companies as far as consum-ers are concerned. Thus, it is more attractive for a company to share the results of their research with a university rather than with a competitor company.
Europe and the rest of the industrialized world can no longer take their technological leadership for granted. Whilst Europe still maintains leadership in certain industrial areas, supported by a well-educated workforce, concern about the future arises from the rapid expansion of European industry research and technological development and demonstration outside Europe and the inability to attract the best talent into Europe from around the world. The increasing availability of high-quality, industrially relevant knowledge, efficient innovation environments, and easier access to markets outside Europe are contributing to a gradual loss of European competitiveness. So companies and universities from Europe should try to improve this situation.

56
2.2 Changes in Companies’ Environment The environment in which companies operate becomes more and more
competitive. The increase of competitive pressure is due to changes that occurred in the economic environment. The things are not merely changing, the change is very fast. Jim Knight said that “Change is now a constant condition within which all organizations must learn to operate or risk significant if not total fail.”(Knight,1997,p. 8). The companies’ environment is shaped by two powerful forces: technology and globalization.
Also, the consumers’ desires and needs are more complex and sophisti-cated. To satisfy these needs companies should offer a wide range of products and services. Thus, companies are forced to conduct research in several different fields in order to offer an appropriate portfolio of products and services. Neverthe-less, for a company it is far too complex to handle research alone because it is not enough to be leader in one or two fields.
The current competitive environment is characterized by rapid technologi-cal change, shorter product-life cycles, and intense global competition. These changes have forced the companies to focus on their core strengths and to out-source a growing proportion of their activities especially the research activity. (Lazzeroni, Piccaluga, 2003, Santoro, Chakrabarti, 1999).
As a result of the increasing competition, companies must enlarge their knowledge base and develop strategic alliances. Though companies currently dis-pose of various possibilities, collaborating with universities may be an efficient so-lution (Santoro, Chakrabarti, 1999).
In a knowledge-based economy competitiveness is becoming more de-pendent upon the ability to apply new knowledge and technology in products and production processes. However, with growing competition and globalization and the rapid advancement of knowledge, new technologies and innovative concepts have a wider variety of sources, most of them outside the direct control of firms that have become more specialized and focused on their core competencies. For complementary knowledge and know-how, they increasingly rely on collaborative arrangements, in addition to market-mediated relations (e.g. purchase of equip-ment, licensing of technology). Inter-firm collaboration within networks is now by far the most important channel of knowledge sharing and exchange. Interactions are also intensifying between firms and a number of other institutions involved in the innovation process: universities and other institutions of higher education, private and public research labs, providers of consultancy and technical services, regula-tory bodies, etc. (OECD 1998).
2.3 Changing University Mission and Environment
Traditionally, universities have accomplished three primarily functions: teaching, research and services to community (Brătianu, 2002). Nowadays, uni-versities must integrate entrepreneurial attitude in their current activities. Students must be considered as consumers or customers with certain needs and universi-ties must compete to satisfy them. Universities conduct not only basic or funda-mental research. A part of their research is funded and developed on contract ba-sis with companies. Government and companies are consumers who need cost effective research projects accomplished in a given period of term. Universities are looking for gaining prestige and recognition. They also intend to increase their in-

57
fluence on the community and obtain continuous support from government and funding agencies for further expansion and development.
University mission and the way of realizing activities are changing. Cur-rently, universities are confronting with the need to adapt and adjust to a series of profound changes.
The increased demand for higher education substantially transforms higher-education systems and teaching activities. The growth of lifelong learning and access to higher education demand force countries to move toward mass higher education systems. As results, universities are confronting with a new chal-lenge: to maintain and improve the research and teaching quality simultaneously with a wider access to education.
Development of communications and information technologies has brought about the internalization of research and education. As result of this change, the competition between universities to attract students has increased and the climate for research and the conduct of R&D was affected. Information technology also contributes to greater participation in research and distance learning, makes pos-sible new teaching methods, and may lead to the emergence of the virtual univer-sity. It also improves scientists’ access to electronic databases and virtual libraries.
Proliferations of the places where knowledge is produced and increasing of systemic linkages encourage universities to develop relationships and strategic al-liances with companies, government facilities, and others research institutions to effectiveness of research and innovation. As a result, companies started to con-tract research from most famous universities. Thus, the universities develop rela-tionship not only with local universities and companies but with companies and uni-versities abroad.
The reorganization of knowledge is influenced by two opposite trends. On the one hand, society is confronted with increasing diversification and specializa-tion of knowledge. On the other hand, the academic world must adapt to the inter-disciplinary character of the fields opened up by society’s major problems such as sustainable development, the new medical scourges, and risk management. The reorganization of knowledge can also be seen in a coalescence of fundamental re-search and applied research.
Emergence of new expectation. Alongside its fundamental mission of initial training, universities must cater for new needs in education and training stemming from the knowledge-based economy and society. These include an increasing need for scientific and technical education, horizontal skills, and opportunities for lifelong learning, which require greater permeability between components and lev-els of the education and training systems. Universities are concerned with scientific research, widening the access to lifelong learning, the increase collaboration with companies, improving students’ services and diversification of the range of training in terms of groups, content and methods.
Ageing of scientific research employees combined with decreasing interest in some field of sciences on a part of youth lead to growing research personnel concerns. This trend may cause lack of adequate numbers of well-trained re-searchers in some field in future and may cause problems for universities who train students in those fields.
Declining of governmental finance for R&D forces universities to seek new sources for funding. Also, the nature of governmental finance is changing; the gov-ernmental funds for academic research are increasingly contract-based and de-

58
pendent on output and performance criteria. These changes may bring about uni-versities’ collaboration to a greater extent with companies to obtain funds for R&D. This support, in the form of joint projects and contract-based research, leads uni-versities to perform more market or product oriented research than fundamental research (Lambert et al, 2003, Communication from Commission, 2004).
Presently, universities are confronting with an increase in the competitive pressure as a result of reduced external funds. Under these circumstances, uni-versities can no longer remain isolated in their ivory tower as they are not disposed to collaborate with companies to generate practical application for marketplace. Thus, universities must modify their strategic focus and they will have to share the output of their academic research not only with the academicians but also with the companies in the form licenses, patens and other practical applications (Santoro, Chakrabarti,1999).
European universities and research institutes have traditionally been able to develop and maintain the European knowledge base. In many fields this is still the case. The latest evidence based on scientific publications indicates however that, although in terms of overall volume of publications Europe has surpassed all other regions, if quality is taken into account only a few European universities have been able to reach global leadership (Communication from Commission, 2004).
Although little data is currently available in member states on the extent to which universities are commercializing their research, so that it is difficult to say how well universities across the European Union are exploiting research results with the enterprise sector, some data are available through the Community Innova-tion Survey.
The Community Innovation Survey asks enterprises, inter alia, about the most important sources of information for innovation. The results show that educa-tion-related and public research sources are ranked very low. Less than 5 percent of innovative companies considered information from government or private non-profit research institutes, and from universities or other higher education estab-lishments, as being a very important source of information. Only 3% of manufactur-ing innovators and 1% of those in the service sector considered government or private nonprofit research institutes, and universities or other higher education es-tablishments as being a very important source of patents (EUROSTAT, 2000-2001)
There’s compatibility between companies’ needs and university mission and several key factors are essential to build an efficient relation of collaboration.
3. Key Factors for a University-Company Successful Relationship
A strategic alliance between companies and universities is a comprehen-sive, formally managed company-university agreement centred on a major, multi-year, financial commitment involving research, programmatic interactions, intellec-tual property licensing, and other services. The essence of these strategic alli-ances must be trust, reciprocity and results (web.cornell.edu).
All organizations have limited human, physical and organizational re-sources. All these types of resources are necessary to acquire knowledge and de-velop new technologies. If an organization has not enough resources they must re-sort to external sources.
Universities are very attractive partners for companies when trying to de-velop strategic alliances as universities have skilled researchers, the necessary

59
knowledge and facilities. Small and large companies are advised to develop long-term collaborative relations with universities to obtain new technologies and strengthen the core competencies which should maintain and improve their com-petitive capacities.
For long term relationship there must be a match between organizational cultures of the two parties as there will be a flow of information, knowledge and technology transfer between universities and companies. To facilitate these ex-changes the university may set up business liaison offices and technology transfer offices which could set forth an organization culture close to that of companies. To collaborate efficiently the two parties must have a shared vision and common goals (Santoro, Chakrabarti, 1999).
Champions play an important role in initiating and developing long-term collaborative relations between universities and companies. For a company to de-velop strategic alliances with universities, companies should consider this alliance to be worthy. These champions play an important role in promoting the research which is carried out or can be carried out by universities. They represent a con-necting bridge between universities and companies as they are sensitive to com-panies and universities’ mission, vision and objectives.
Champions are innovative persons, opened to everything that is new and have very sound technological knowledge (Chakrabarti, 1974). Due to the numer-ous functions they have (they contribute to intensifying the relation between uni-versities and companies, to developing and maintaining good relations, to monitor-ing the relation and identification and removal of causes threatening these long-term relations (Ancona, Caldwell, 1990). Therefore, champions are an essential factor in the development of efficient strategic alliances.
It is a must that each party trusts the other party so that universities and companies share all the information and knowledge necessary to achieve the goals of strategic alliances. This should favour knowledge transfer between com-pany and university.
It is also necessary that the way in which the two parties shall benefit from the results of alliance, IP, brevets and patents must be clearly established. It should be regulated in such a way as to lead to income increase, acquiring a com-petitive advantage and increase the prestige both of universities and companies. For a successful collaboration IP, patents and brevets related policy must be flexi-ble and adjusted to the need of these two parties (Bower, 1993).
Realizing effective company-university research long-term relationships imply a clear definition of the four related components: research support, coopera-tive research, knowledge transfer, and technology transfer (Santoro, 2000).
Research support represents contribution of long-term secure funding, in-formation and data, staff, and equipment made to universities by companies. As companies become increasingly aware that in-house R &D facilities, expertise and resources are no longer capable of being the sole source of the research required for the products, they are willing to support the universities in exchange of access to skilled researchers, universities’ facilities and universities’ scientific and techno-logical outputs (HEFCE, 2003). Lately, companies’ support for university research has been more targeted and tied to specific research projects for developing spe-cific technologies and products.

60
Cooperative research projects between universities and companies can take various forms: institutional agreements, groups’ arrangements, the use of in-stitutional facilities and informal interactions (Santoro, 2000).
Companies have recently started to change their view on their relations with universities. Thus, large companies prefer long-term cooperative research rather then short term cooperative research projects. Small and medium-sized business should start orienting themselves towards long-term cooperative relations with universities, in the field of researches as they do not have the necessary re-sources and expertise to conduct in-house researches. Companies and universi-ties may also involve the public sector in their cooperative research projects and thus be able to get funds from governmental institution and even from the Euro-pean Union (Lambert et al, 2003).
As a result of developing long-term cooperation relations as part of some strategic alliances, companies and universities foster mutual trust and share infor-mation and knowledge. The chances for extraordinary results are thus substantially increased.
University role and influence in the area where it carries out its activity has recently increased. University managers have built relationships with CEOs of local companies, with chamber of commerce and regional development agencies. To favour the development of cooperative relations between universities and compa-nies, universities may set up business liaisons offices. These offices are responsi-ble for: marketing university cutting-edge field of research, developing relations with companies, providing assistance for research contracts and consulting activi-ties as well as facilitating knowledge transfer and technology transfer (Lambert et al, 2003).
Knowledge transfer has been defined as “the process by which knowledge concerning the making or doing of useful things contained within one organized setting is brought into use within another organization context” (Cutler,1989, p.68). For the cooperative research project between universities and companies be suc-cessful, knowledge transfer must be achieved on a permanent basis and not as an exception. This is why, collaborative research programs between universities and companies must start from knowledge transfer and these should be structured in such a way that they must favour a frequent and open communication between the two groups starting from the very first stages of collaboration.
The networks, sponsored students, contract research, collaborative re-search and consultancy play an important role in promoting knowledge transfer. The annual amount invested for students’ training and research carried out in uni-versities are very large. Knowledge and skill transfer between universities and companies amplify the economic and social results of these investments (Lambert et al, 2003).
Knowledge transfer consists of processes which focus on human interac-tions, cooperative education and personnel changes. Most of the times, knowledge transfer activities, are necessary to stimulate the research programs between uni-versities and companies in the form of consortia or strategic alliances.
Cooperation between universities and companies is essential so that the universities develop and provide a proper curriculum to train the students using the best methods. Thus, universities provide the companies with the students who meet the companies’ current and long-term requirements (Deutch, 1991). Consul-tancy given by faculty members as part of university is another form of knowledge

61
transfer frequently use. It is also possible to use knowledge transfer by means of institutional programs and cooperative education. These are formal programs de-veloped to encourage information exchange between university and companies. Universities may provide students and graduates with probation times in compa-nies.
Lambert said that that the most efficient forms of knowledge transfer bring about the interaction between individuals. A large number of collaboration be-tween companies and universities are the outcome of encounters between busi-nessmen and academicians. This is why universities shall benefit substantially if they are to develop strong relations with alumni who may pave the road for univer-sity graduates in the companies, may act as university ambassadors, may provide financial support and insure first contact between CEOs and vice-chancellors.
Companies can sponsor students or MA students. They will have the chance to work part-time in companies and study in the same time as well. There’s also the possibility that companies and universities collaborate to develop master courses and training programs for companies’ employees.
The driving force of social change in the contemporary world is economic globalization, which has demanded a more highly educated work force. Our future is dependent on the skills, knowledge and abilities of the workplace. This calls for even closer alignment with universities and other higher education institutions and a more focused approach to acquiring and retaining a skilled workforce. Today’s industrial environment is characterized by continuous change so, every employee, regardless of age, besides continuous informal learning taking place incidentally at work, needs formal retraining to keep abreast of changing technology. Renewing employees’ competencies is something no company can afford to neglect. Adapt-ing the ‘lifelong learning mindset’ is advantageous both for the individual and or-ganizations (Slotte, Tynjälä,2003).
Collaboration between companies and universities may take various forms: contract-based research, coordination research and consultancy. As for contract base research, university is hired by company to conduct a research in company’s interest. In this case company will not actively get involve in the research but it shall pay the cost of this research, at least. In the event of collaborative research the parties work together in the common problem and company researchers and engineers shall work together with university researchers. The cost of research shall be paid by both company and university while public sector may be involved as well.
Consultancy take the form of expert advice or analysis services and repre-sent the simplest form of collaboration between university and companies. For small and medium-sized business, consultancy gives the advantage of small cost while for large companies’ advantage means getting acquainted with the research-ers before establishing long-term relations.
For a successful collaboration between universities and companies, these shall develop a code of conduct to avoid the conflicts of interests that might occur.
Technology transfer programs capitalize on joint industry-university re-search and aim to integrate university-driven research into applied initiatives for the development and commercialization of new technologies.
In many industry sectors, businesses will not invest in research and devel-opment to develop early stage technologies without a patent to guarantee them exclusive rights to commercialize their work. Universities may realize technology

62
transfer in different ways: collaborating with companies on research projects and agreeing at the outset exploitation on any intellectual property created, providing technical expertise to companies seeking to develop new products or processes, assisting entrepreneurs in starts-ups, and providing technology patent or licensing services already developed in university research (Santoro, 2000).
Intellectual Property (IP) is any product of human intellect that is unique and un-obvious with some value in the marketplace. Intellectual property laws cover ideas, inventions, works, of authorship, designs, business goodwill and repu-tation, confidential information, literary creations, unique names, business models, industrial processes, computer program code, and others.
To facilitate technology transfer, universities must develop technology transfer offices. Also, laws must encourage this type of transfer.
However, universities may encounter several obstacles in IP commerciali-zation:
− Difficulties in establish of ownership of IP in cooperative research. Uni-versities say that they need ownership to ensure that their future research is not held back. Industry often argues that it needs ownership to protect the investment which will be required to develop the IP into a commercial product. This lack of clarity increases the time and cost involved in negotiating research collaborations and prevents some deals being completed.
− Lack of marketing skills, market research, license negotiation expertise, legal knowledge and spinout experience of technology transfer offices.
Some concerns have been expressed over the industry–university partner-ship: Bryans and her colleagues think that there is the risk to the universities of be-coming too closely associated with powerful constituencies of professional inter-ests that can distort their wider mission in society (Bryans et al., 1998).
Another tension for the industry–university relationship derives from the limited opportunities that exist for it. For many university departments and many academics, this kind of cooperation is hardly a high priority either. When individu-als or departments within institutions enter into collaboration with companies, they usually have constraints placed upon them concerning the type, amount and desti-nation of the information they can disseminate. Seen from another perspective, po-tentially valuable intellectual property may be damaged by the premature disclo-sure of scientific discoveries (Slotte, Tynjälä, 2003).
An additional major group of tensions arise from the possibility that staff may be distracted from their academic functions by too much industry-directed work. In the increasingly busy life of the academic in the 2000s, competing de-mands upon time are a major constraint on the ability to develop and maintain ex-ternal linkages (Howells et Al., 1998).
A closer interaction between university and industry would enable compa-nies (and society as a whole) to benefit from the innovative capacity of universities. In that context, transparent and clear rules on ownership of intellectual property and equitable sharing of income generated by commercialization of IP rights has often been perceived as a key mechanism for creating the appropriate incentives to enhance such interaction.
For an alliance to be effective there needs to be a sharing of visions and values, good management and accountability procedures, appropriately skilled personnel, adequate resources and time, a commitment to addressing ethical is-

63
sues, and a readiness to continually learn more about the other organization’s mis-sion and culture. 4. Advantages of Strategic Alliances between Compan ies and Universities
There are many ways in which companies can gain competitive advantage from collaborating with universities. They obtain access to new ideas of all kinds as the academic researchers are in touch with knowledge breakthroughs in their area of speciality wherever they may be happening in the world. Another benefit is the ability to achieve excellence across a wider range of disciplines and through a much larger intellectual gene pool than an individual business could hope to create on its own.
The industry-university partnership have access to public funding and this means that companies can do much more than they can afford on their own, so the ability to leverage the research dollar would be another benefit.
Companies can obtain high-quality people at low cost and recruiting and retaining the best talent as they have knowledge about the best students who are passing through the (education) system. When associated with a prominent institu-tion companies can enhance competitiveness and reputation. Collaborating with universities, companies gain access to labs and facilities. Another reason why in-dustry may benefit from collaborating with universities is to do with employee re-tention policies. By supporting employees’ formal education, companies can keep their core employees in-house ( Lambert, et al. 2003, Slotte, Tynjälä, 2003).
From collaborating with universities businesses have access to specialized consultancy. Consultancy is one way to bring more companies into contact with universities. It may increase the volume of research collaboration with many con-tracts originating from consulting relationships. It may also improve the effective-ness of the technology transfer. Companies also benefit from the IP transfer from universities. Some of the benefits of licensing include fast access to new technolo-gies often on an exclusive basis, leading to new products and services, increased revenue and possible employment growth.
The reasons why a university finds the collaboration with companies to be beneficial are: attracting funding from industry for research; development of a strong infrastructure; gaining access to companies research; once a centre of re-search has been created students will be attracted to university; the possibility for securing work placements for students; consultancy services; experienced manag-ers from business can become members of the governing board of the university and their knowledge facilitates the development of the university; exposure to prac-tical problems; joint research projects will lead to mutual development especially from the point of view of greater professional expertise; businesses may be in-clined to provide with donations (sponsorship of students and various endow-ments); various research findings can be exploited (patents). (Barden,1993, web.cornell.edu).

64
Table 1. The possible benefits of industry—university cooperation
Industry University Individual learners Broad and thorough theoretical knowledge
Contacts with working life Personal development
Continuity and stability Work practices Job security Experience of delivery Business awareness Lifelong learning Commitment Resources Opportunities for career
progression Inquiry Work-based cases for
teaching purposes Opportunities for salary improvements
Advantages of a better-skilled workforce
Source: Slotte, V., Tynjälä, P.: Industry-University Collaboration for Continuing Professional Development. Journal of Education & Work, Vol. 16, Issue 4, (2003) p.446
Table 1 summarizes the possible benefits that may results from successful com-pany-university collaboration.
5. Case study
The objective of this study is to identify the effectiveness of in-house re-search and development activities carried out by companies, external sources for new products and services, the novelty of products and services and external com-panies’ partners for research activities.
The study was conducted on a sample made up of 338 companies which are from the most industrialized area in Romania, the North- West Region, called Transylvania. Only 17.81% of the companies have connections with universities. Only 65.68 % of the companies in the sample have launched new products or ser-vices on the market in last 2 years, and these companies resorted to the following: 9% resorted to purchasing patents, 7.2% to purchasing licenses, 8.55% to pur-chasing know-how, 27.93% resort to imitating competitor’s products.
8.39% consider that the research activity is carried out very well, 41.61% find that this activity is carried out properly, 29.09% consider that this is improperly organized while 25.91% of the companies do not conduct research activities.
14.29 % consider that the development activity is carried out very well, 52.01% consider that this activity is carried out properly, 19.05 % consider that this is organized improperly while 25.91% of the companies do not conduct develop-ment activities. 16.57% of the companies consider their new products or services a global novelty and 37.28% consider they have new products or services which are a novelty in the country.

65
Table 2. The way companies do research
The compa-nies which have launched new prod-ucts in the last 2 years resorted to contract based research to a Research Institute in the country
%
11.26
The companies which have launched new products in the last 2 years resorted to coop-erative research with a
Research Insti-tute in the country
%
23.87
The compa-nies which have launched new prod-ucts in the last 2 years resorted to contract based research to a Research Institute from abroad
%
11.71
The companies which have launched new products in the last 2 years resorted to coop-erative research to a Re-search Institute from abroad
%
11.26
The compa-nies which have launched new prod-ucts in the last 2 years resorted to contract based research to a University in the coun-try
%
1.35
The companies which have launched new products in the last 2 years resorted to coop-erative research to a University in the country
%
8.56
The compa-nies which have launched new prod-ucts in the last 2 years resorted to contract based research to a
University from abroad
%
1.80
The companies which have launched new products in the last 2 years resorted to coop-erative research to a University from abroad
%
4.05
As the table shows, companies prefer to cooperate with research institutes
to carry out the research activities rather than with universities. This may occur perhaps because the research institutes’ researchers are no so preoccupied with the dissemination of the research as the researchers from the universities, compa-nies being interested in keeping the results secret as long as possible.
It is possible also that research institutes actively use more champions to obtain the research contracts. More often, the universities’ researchers are in-volved not only in research activities but also in the educational ones.
We can observe that companies prefer collaborative research to contract based research and they resort to research institutes in the country or from abroad,

66
so the research institutes and universities competition is not limited to the local level.
The quality control, an imperative premise of a successful collaboration is difficult to be accepted by the researchers from universities. This is another reason that explains the small percentage of the companies that choose to collaborate with the universities.
Because 55% of the companies do not carry out any research activity or this activity is carried out in an improper manner and because 44.96% do not carry out any development activity or it is carried out improperly the result is that these companies must outsource research to accomplish these activity.
Though the collaboration between universities and companies has a lot of advantages, the number of long-term collaborations between the two parties is relatively small as far as Romania is concerned because universities would col-laborate with research institutes rather than universities. It can be also noticed that universities prefer to carry out cooperative research both with research institutes and universities rather than resort to contract based research. It is also true that Romanian companies collaborate both with the universities and research institutes from the country and abroad.
6. Conclusions
Though universities are attractive partners to companies for setting up long-term alliances, the number of these alliances is relatively small. At the level of European Industrial Research Management Association created a guide to facili-tate the accomplishments of these alliances.
University leaders must understand that presently, the accomplishment of the research function means also the accomplishment of some applied researches and this type of research may represent an import income source
Nonetheless, university researchers are probably considered too academic and used to perform just fundamental research in the field they are interested in and this is why companies chose to collaborate with other organizations.
Universities are recognized as essential to the knowledge based economy, and no country will willingly permit a serious, permanent decline in the research, training or knowledge-transfer capabilities of their national systems. In the early part of the 21st century, however, university research and its relation to society are likely to be very different from what they are today. All the countries need to ensure that universities can continue to perform their functions to the benefit of society at local, national, and global levels.
To increase the number of strategic alliances between companies and uni-versities, the latter must get actively involved in finding research partners and per-suade these partners that they may constitute a worthy partner and adapt to the way the companies are operating. Universities must also set up business liaison offices and technology transfer offices which are meant to facilitate the negotiation of collaboration contracts and technology transfer.
As futures research we recommend conducting a survey among universi-ties to find their point of view concerning this kind of alliances. As well an efficiency analysis of the strategic alliances between companies and universities should be performed (number of spin-offs, number and value of contracts, licences, brevets, number of hired graduates etc.). The study should be also carried out at national and European level.

67
REFERENCES
Ancona D., Caldwell, D., (1990), “Improving the Performance of New Product Teams”, Research-
Technology Management, Vol. 33, No. 2, p. 25-29 Barden L., (1993), “University-Business Partnership”, Industry and Higher Education, Vol. 7, No. 4, p.
220-228 Bloedon R.V., Strokes D.R. (1994), “Making University/Industry Collaborative Research Succeed”, Re-
search Technology Management, Vol. 37, No. 2, p. 44-49 Bower, D.J. (1993), “Successful Joint Ventures in Science Parks”, Long Range Planning, Vol. 26, No. 6,
p. 114-120 Brătianu C., (2002), Paradigmele Managementului Universitar, Editura Economica, Bucureşti Brennan L.L. (2003), “The View from Ivory Tower: What Do University Alliances Offer Technology
Firms?”, Academy of Management Executive, Vol. 17, No 1, p. 125-126 Bryans P., Gormely N., Stalker B., Williamson B., (1998, “ From Collusion to Dialogue: Universities and
Continuing Professional Development”, Continuing Professional Development, Vol.1, No. 4, p. 137-145
Chakrabarti A., (1974),” The Role of Champion in Product Inovation”, California Management Review, Vol. 17, No. 2, p. 58-62
Cole G.A. (1994), Strategic Management - Theory and Practice, Dp Publication Ltd., London Cutler R.C.(1989),” A Survey of High-Technology Transfer Practices in Japan and in the United States”,
Interfaces, Vol. 19, No. 6, p. 67-78 Deutch J.M., (1991), “Getting University-Industry Relations Right”, Technology Review, Vol. 94, Issue 4,
p. 65-66 Ernst D., Bamford, J., (2005),”Your Alliances Are to Stable”, Harvard Business Review, Vol. 83, No.6, p.
133-142 Finely D.S., Galloway J.R., Rogers G., (2001), “ Beyond the Mission Statement: Alternative Futures for
Today’s Universities”, Journal of Marketing for Higher Education, Vol. 10, No. 4, p. 63-82 Howells J., Nevada M., Georghiou L.(1998), “Industry–Academic Links in the UK”, Higher Education
Funding Council for England, PREST, p.1–103 Kerr C. (1974), “The University and the Corporation: Partially Shared Goals and Separate Identities”,
California Management Review, Vol. XVI, No. 3, p. 20-24 Knight J.,(1997), Strategic Planning for School Managers, Kogan Page Limited, London Lambert R. et al, (2003), “ Lambert Review of Business-University Collaboration Final Report”, London
HM Treasury, London , p. 1-133 Lazzeroni M., Piccaluga A., (2003), “Towards the Entrepreneurial University”, Local Economy, , Vol. 18,
No. 1, p. 38-49 Meneghel S., Mello D., Gomes E., Brisolla S., (2003), “The University-Industry in Brazil, Trends and Im-
plications for University Management”, International Journal of Technology Management & Sustainable Development, Vol. 2, No. 3, p. 173-191

68
Santoro M.D., (2000), “Success Breeds Success: The Linkage between Relationship Intensity and Tan-
gible Outcomes in Industry-University Collaborative Ventures”, Journal of High Technology Management Research, Vol. 11, No 2, p. 255-273
Santoro M.D., Chakrabarti A.K., (1999), “ Building Industry-University Research Centers: Some Strate-
gic Considerations”, International Journal of Management Reviews, Vol. 1, No. 3, p. 225-244. Slotte V., Tynjälä P., (2003), “Industry-University Collaboration for Continuing Professional Develop-
ment”, Journal of Education & Work, Vol. 16, No. 4, p. 445-465 *** 2nd OECD Conference of Ministers Responsible for Small and Medium-Sized Enterprises; Networks,
Partnerships, Clusters and Intellectual Property Rights: Opportunities and Challenges for Inno-vative SMEs in a Global Economy, Istanbul, (2004) 1-78, Available on OECD site: http://www.oecd.org/dataoecd/6/10/31919244.pdf
*** Berlin Conference of European Higher Education Ministers, Realizing the European Higher Educa-
tion Area. European Education, Vol. 36, Issue 3, (2004) 28-35 *** Communication from Commission, The Role of the Universities in the Europe of Knowledge. Euro-
pean Education, Vol. 36, Issue 2, (2004) 5-34 *** Five Years Assessments of the European Union Research Framework Programmes 1999-2003
(2004), Available on European Industrial Research Management Association Site http://www.eirma.org/f3/local_vbindex.php
*** Higher Education Business Interaction Survey 2000-01, HEFCE, (2003) 1-56, Available on HEFCE
site: http://www.hefce.ac.uk/pubs/hefce/2003/03_11/03_11.pdf *** Responsible Partnership – Joining Forces in a World of Open Innovation – A guide to Better Prac-
tices for Collaborative Research and Knowledge Transfer between Science and Industry (2005) , Available on European Industrial Research Management Association Site http://www.eirma.asso.fr/f3/local_links.php?action=jump&id=796
*** Science Technology Industry. University Research in Transition, OECD (1998) p.1-108, Available
on site: http://cdnet.stic.gov.tw/ebooks/OECD/46.pdf *** Statistics on Innovation in Europe, EUROSTAT, data 2000-2001, Available on site
http://www.cordis.lu/innovation-policy/studies/2001/policy01.htm *** web.cornell.edu *** www.legal-database.com

69
STUDIA UNIVERSITATIS BABEŞ-BOLYAI, OECONOMICA, LI, 2, 2006
THE ISSUE OF RETURN REVERSALS AND MOMENTUM ON THE BUCHAREST STOCK EXCHANGE
Balint Zsolt NAGY * University of Pecs, Hungary
Abstract. One of the most influential financial paradigms of the last century is the Efficient Market Hypotheses (EMH) formulated by Eugene Fama (1965) and described by the random walk and martingale models. However, during the last decades many so-called “market anomalies” have been uncovered one of which is the so-called reversal and momentum effect.The present article tests the reversal and momentum hypothesis on the Bucharest Stock Exchange. Our main conclusion is that on this market the reversal phenomenon cannot be demonstrated on these intervals and rather the momentum effect can be documented and exploited through momentum strategies.
JEL Classification : C12, C14, G14
Keywords : reversal, momentum, contrarian strategy, parametric and nonparametric testing
1. Introduction The debate on whether or not capital markets are efficient is a debate which is
still ungoing and unsolved since the very early formulations of the theory. This open question is not only of theoretical importance but it also has deep practical conclusions: the inefficiencies of the capital markets can be exploited to generate abnormal profits and could form the basis of investment sdtrategies followed by market participants. Althoguh the biggest amount of research has been carried out over the developed markets of the United States and Western Europe there is an ongoing effort to discover the factors that determine the efficiency of the emerging markets as well. So far several efficiency studies have been carried out on the Romanian market. Among these I would like to refer to Todea (2005), where several references are made
*Corresponding author. Faculty of Economics. Phone: 0040-264-432604, e-mail: [email protected]

70
to Romanian studies concerning the impact of dividend announcements and the random walk character of stock prices.
The strucure of the article is as follows: The literature review chapter presents the studied phenomenon on the developed markets and examines some explanations for this phenomenon. The second chapter explains aspects of data and methodology that was used and the last two chapters formulate the numerical results and the conclusions that can be drawn from them. 2. The phenomenon of reversals and momentum in the financial literature – findings and explanations
The return reversals are market anomalies that may have seasonal and value-based components. Therefore the studies regarding this phenomenon can also be divided into two subgroups: those that examine historical returns and those that try to regress test-period returns on certain financial indicators (which act as proxies for fundamental value). Detailed references are given in the next paragraphs.
The studies based on historical returns construct portfolios of “winner” and “loser” stocks based on the stock’s return performance in the so-called “formation period” and examine their performance in the so-called “test-period”. The anthological paper that opened this direction of research was written by DeBondt and Thaler (1985). They observe that stocks on the NYSE1 that have significantly higher (lower) returns than the market during a 3-5 year period, tend to have lower (higher) returns than the market in the following 3-5 years. In the former case the expression “underperformance” and in the latter “overperformance” is used. The authors consider that this is an effect of the irrationality of investors who overreact to certain factors that determine stock prices. Therefore they named their hypothesis the “overreaction hypothesis”. This effect is also known as the „winner-loser” or “contrarian” effect because in this case an investor can obtain consistent profits by buying (going long on) past losers and shorting past winners. This would constitute a so-called “contrarian strategy”, which contradicts the weak efficiency of the markets. Conversely, if the winner portfolio exhibits higher returns than the loser one over the test-period then the so-called momentum strategy is possible: go long on winners, and short on losers!
DeBondt and Thaler’s overreaction hypothesis states that the price of the stock departs from fundamental value due to waves of optimism and pessimism among investors. Their study examines monthly returns between 1926 and 1982. For each period of three years they form two portfolios containing the 35 best and the 35 worst performing stocks. In the next step they examine the return performance of the winner and loser portfolio over the next 3 years, these two steps being reiterated for 16 intervals of three years without overlapping. The authors show that on average loser portfolios overperform the market by 19% and the winners underperform it by 5%. They also point out that the biggest abnormal returns occur in the 2nd and 3rd years of the test- period and that the biggest part of the reversal effect takes place in January.
1 New York Stock Exchange

71
Synthetically their theory can be stated as follows: investor overreaction causes the phenomenon of reversal, which in turn can be exploited with the aid of contrarian strategies.
During the 1990’s we saw a growing body of literature examining these effects (as part of the return predictability literature) on the developed and highly capitalised financial markets of Western Europe and the United States. Examining the returns, Fama and French (1988) find that return autocorrelations become negative on a period of 2 years, then tend to reach minimum level for 3-5 years, then rise again toward zero and positive values for longer time horizons (U shaped autocorrelation functions). Poterba and Summers (1988) reinforce these results observing that there exists a „mean-reverting” component of returns which tends to manifest itself on longer horizons.
In the UK one of the most referenced researches were carried out by Poterba and Summers (1988), and Clare and Thomas (1995). Clare and Thomas (1995) examine monthly returns in the United Kingdom between 1955 – 1990. They find a small reversal, overreaction effect but they argue that this is just another manifestation of the small firm or size effect. In the case of continental Europe, we refer to the papers of Brouwer, Van DerPut and Veld (1997) who test value based overreaction strategies on the British, French and German markets providing conclusions in favour of the overreaction hypothesis.
However, there are lots of studies that are at least sceptical about overreaction and try to offer alternative explanations, consistent with the EMH. Chan (1988) rejects the overreaction hypothesis affirming that stocks with low excess returns suffer an increase of their beta coefficient, which, according to the Capital Asset Pricing Model (CAPM) would lead to the higher observed returns in the test-period. The empirical results of Ball and Kothari (1989) confirm this and conclude that the reversal in returns is caused by reversals in systematic risk.
Zarowin (1990) questions the hypothesis arguing that in fact the loser papers are papers of low capitalization firms, and therefore this effect can be attributed to the size effect. After the author corrects for the size effect, the return differentials disappear except for the case of January.
Other criticisms of the hypothesis arise from methodological grounds, for example the impact of the bid-ask spread („bid-ask spread bias”) (Conrad and Kaul, 1993). Large bid-ask spreads may induce “spurious autocorrelation” and market microstructure studies have shown that the small, seldom traded papers tend to have larger bid - ask spreads.
The supporters of the overreaction explanation have answered these critics the following way: DeBondt and Thaler (1987) argue that the differences between the betas of loser and winner stocks are too small to provide explanation for the return reversal. Chopra, Lakonishok and Ritter (1992) present further evidence and underline that the effect is different from the size premium. They find economically significant contrarian profits even after having controlled for the capitalization of companies. The conclusions of Conrad and Kaul are debated by Loughran and Ritter (1996), by showing that the methodological aspects of the chosen return measures do not affect the results of overreaction studies significantly.

72
One of the pioneers of EMH, Eugene Fama, also took a stance on this debate through a 1998 article in which he defies the overreaction literature in its entirety. Fama (1998) says that many of these studies suffer from methodological problems and that underreaction may just as well be documented as overreaction for most time intervals. Most of all Fama stresses out that most anomalies do not indicate irrational investor behaviour. Fama and French (1996) find that the reversals of DeBondt and Thaler and the contrarian profits of Lakonishok et al (1994) can be explained through a “Multifactor Asset Pricing Model”.
In the meantime the adepts of the overreaction hypothesis began to look for evidence outside the return predictability literature. Cognitive psychology suggests that individuals do not make proper Bayesian decisions, which means that they do not account for the difference between a priori and a posteriori probabilities and they do not update their expectations and beliefs with the required frequency (Kahneman and Tversky, 1973).
Lo and MacKinlay (1990) argue that contrarian profits are possible even in the absence of return reversals. More precisely, they identify situations in which returns of some stocks react faster to news than the returns of others, creating a so-called “lead-lag” structure of returns, which in the opinion of Lo and MacKinlay leads to consistent contrarian profits. The results of Jegadeesh and Titman (1995) (JT) suggest that the stock prices react on average with a certain delay to changes in common risk factors but the biggest part of contrarian profits is due to overreaction towards changes in firm specific indicators.
More recently numerous studies have appeared that investigate the reversal and overreaction phenomena on emerging markets. Most of these concentrate on the developing markets of China (Wang et al, 2004), South Korea, Malaysia, Thailand, Taiwan, and the Philippines (Brooks and Persand, 2001) and also latin-american markets like Brazil (Da Costa, 1994). Van der Hart et al, 2005 offers a comprehensive examination of several value and momentum based strategies for Central and Eastern European markets as well (Czech Republic, Hungary, Poland, Russia, Slovakia). Most of the evidence from these studies suggests that the overreaction effect is significant and contrarian profits emerge even after having adjusted the returns for market risk using several different market models. Possible explanations of the reversal-momentum effect
The points of view of researchers differ when it comes to identifying the causes of the phenomenon of reversals. Some authors provide the explanation of over- or underreaction, others merge the effect with other anomalies such as the size premium or the January effect. Still others look for the implications of market microstructure (e.g. effects of the bid-ask spread) or the possible time-varying risk premium. We will now shortly present some of these explanations. 2.1. Explanations regarding undiversified, suppleme ntary risk (French, 1992, Ball and Kothari (1989).
The multifactor models of Fama and French and the works of Ball and Kothari explain the return differentials between loser and winner portfolios by the differences

73
between systematic risk. Another explanation is the changing nature of market risk premium.
2.2. Explanations from behavioural finance
The LSV model (Lakonishok, Shleifer, Vishny, 1994) states that contrarian strategies do pay off because they are superior to the “naive” strategies of most market participants. These investors extrapolate the past growth rates of certain companies for a too long period in the future. LSV points out that usually the growth rates incorporated in prices are too high. The great performances of value stocks (e.g. stocks that have a low PER) appear from the moment when the market realizes these expectational errors, and proceeds to correct them, thereby increasing the return of value stocks and decreasing the return of the growth (or glamour) stocks. The authors of the LSV model don’t find evidence of value stocks being riskier than glamour stocks.
The model of Barberis, Shleifer and Vishny (BSV, 1998) has two mains hypotheses:
- Individuals are myopic, they tend to overestimate the importance of recent events
- conservativism – people tend to update their expectations quite slowly to new information.
The model considers that the process of stock prices follows a random walk but investors perceive it otherwise. They perceive a regime called “A” in which they think that prices follow a mean reverting process. When investors perceive this regime, they will underreact because they think that every change that occurs can only be transitory. In regime “B”, investors try to identify trends and momentum in prices therefore the innovations in the price tend to be persistent, the market overreacts. Of course according to the model, the prices really follow a random walk and as soon as the market realises that it perceived the wrong regime, the returns suffer important corrections.
The model of Daniel, Hirshleifer and Subramanyam (DHS, 1997) postulates that prices are determined by the so-called informed investors who possess two characteristics:
- too much „self confidence” in the precision of own forecasts - „self-attribution” which means that when public information contradicts the
informed investors private information they tend to disregard the public information in favour of their own beliefs.
The overreactions towards private information and underreactions to public information cause a momentum in prices on the short term, but on the long run, as the public signals overwhelm the private ones, the returns suffer large corrections.

74
3. Data and methodology
We used the daily closing prices from the websites of The Bucharest Stock Exchange (www.bvb.ro) and the financial information portal www.vanguard.ro. In order to avoid the issues of seldom trading and asynchronicity of data, we have considered 15 stocks (grouped in 5 portfolios of three stocks each), over the time period 8th jan. 2001 – 24th dec. 2004. Most of the selected stocks are from the 1st category of the exchange. The formation (ranking) period of the winner and loser portfolios is January 2001- December 2002 and the test-period January 2003 - December 2004. The choice for these intervals is justified by the fact that prior to 2001 the exchange was characterized by low trading volumes (Todea 2005) and the data series for 2005 and 2006 was not included for maintaining the symmetry of the formation and test periods. The analysed stocks are the following:
The data have been processed through MS EXCEL spreadsheet calculator
enhanced with the add-ins „Analysis Toolpak” and „Analyse-it”. These add-ins provide the descriptive and inferential statistics tools needed for our purposes.
For the computation of stock returns and the returns on the representative BET-C index we used daily logarithmical returns:
=
−1,
,, ln
~
tj
tjtj P
PR (1)
tjR ,
~ = the return of stock j at moment t calculated from the sample (estimation)
Pj,t = the price of stock j at moment t Pj,t-1 = the price of stock j at moment t-1
Company Symbol Sector Compa Sibiu CMP Auto parts Rulmentul Braşov RBR Industrial equipment Azo Mureş AZO Chemicals Impact Bucureşti IMP Constructions SIF Muntenia SIF4 Financial services SIF Moldova SIF2 Financial services SIF Oltenia SIF5 Financial services SIF Banat Crişana SIF1 Financial services SIF Transilvania SIF3 Financial services Antibiotice Iaşi ATB Pharmaceuticals Banca Transilvania TLV Banking Oltchim OLT Chemicals Banca Română pentru Dezvoltare BRD Banking Alro Slatina ALR Nonferrous metals Astra Ploieşti ASP Oil and gas

75
The excess returns (returns relative to the market portfolio), R~
E~
, are the following:
R~
-R~
R~
E~
tm,tj,= (2)
Where tj,R~
and tm,R~
stand for the return of stock j and return for the index (m). Some
studies (e.g. Brown and Warner (1980)) argue that the results of overreaction and momentum studies are not influenced by the choice between a simple return differential relative to the market portfolio and CAPM based, systematic-risk adjusted models. Besides, many studies have pointed out the failure of the CAPM to describe the Romanian market (Todea, 2005).
The cumulative excess returns ( REC~~~
) are computed for the two-year period between January 2001 and December 2002, which will be called further the formation period (FP)
∑=
=T
ttjj REREC
1,
~~~~~ (3)
where “t” represents the number of days when the stock was traded. In the next step
the stocks are sorted descending by REC~~~
. For the remaining steps we need the extreme portfolios, PORTOFOLIO 1 being the "winner", respectively portfolio 5 the "loser".
For the examination of the reversal effect first we use the parametric Student-t test to see whether the stocks in the winner portfolio suffer significant decreases in their cumulative return and conversely whether the stocks in the loser portfolio have increasing returns in the test period? To this end we apply the Student test for paired samples with the following test statistic:
1/~
ns
dt
d
=
where
1
)(
1
2
21
−−
=
−=
∑n
dds
xxd
d
The cumulative returns exhibit departure from the gaussian distribution which is why the results of the Student-t tests have to be enforced by conducting a nonparametric test as well. We applied the Wilcoxon signed rank test as a nonparametric counterpart of the paired samples Student-test. The Wilcoxon test is suitable for testing the significance in changes induced in parameters of the same

76
population or sample. In our case we have the same stock examined in the formation and testing periods. In order to properly test for reversal we have to formulate the following alternative hypotheses: increasing cumulative excess returns for the loser, decreasing for the winner portfolios. The Wilcoxon test statistic is the following:
N
PP
PNzs
)1(~
−−=
where “N” is the number of negative return differentials between the formation and testing periods and “P” the number of positive return differentials.
Finally we proceed to test for the possibility of contrarian or momentum strategies between the winner and loser portfolios. Similarly to the previous case we begin with conducting a parametric Student-t test, namely the test for means in independent samples assuming unequal variances. The test statistic is as follows:
2
22
1
21
21~
n
s
n
s
xxt
+
−=
The nonparametric counterpart for this test is the Mann Whitney “U” test with the following test statistic:
111
21 2
)1(~R
nnnnU −++=
where n1 and n2 are the sizes of the two independent samples and R1 is an intermediate variable.
4. Empirical Results The results of the Shapiro-Wilk normality test, the coefficients of skewness and
kurtosis reveal that the cumulative excess returns do not follow gaussian distribution. However, the departure from the normal distribution is less obvious given the effect that the central limit theorem has on the cumulative returns.
In the case of individual stocks both for parametric and nonparametric tests the null- and alternative hypothesis are the following:
TPFP
TPFP
CERCERH
CERCERH
≠
=
:
:
1
0

77
which means that if significant reversal or momentum exists then the mean cumulative excess returns differ significantly between the formation and testing periods.
More specifically in order to test the reversal we need to examine the one tailed p-values for testing the alternative hypotheses
TPFP CERCERH >:1 for the titles in the winner and
FPTP CERCERH >:1 for the titles in the loser portfolios. In the case of portfolios when we test the possibility of momentum strategies, we use the following hypotheses:
H0: CERTP1(WINNER)=CERTP5(LOSER) H1: CERTP1(WINNER)>CERTP5(LOSER) TABLE 1: PORTOFOLIOS OF THE STUDIED STOCKS PORTOFOLIOS PORTOFOLIO 1 CMP ER FORM 0,881354 ER TEST 0,706346 SIF4 ER FORM 0,866846 ER TEST -0,19355 SIF2 ER FORM 0,848828 ER TEST 0,047617 AVERAGE 0,865676 AVERAGE 0,186806 PORTOFOLIO 2 RBR ER FORM 0,835701 ER TEST -0,10569 SIF5 ER FORM 0,750388 ER TEST 0,229938 SIF1 ER FORM 0,711783 ER TEST 0,023199 AVERAGE 0,765957 AVERAGE 0,049148 PORTOFOLIO 3 SIF3 ER FORM 0,659624 ER TEST 0,28862 AZO ER FORM 0,387287 ER TEST -0,47744 IMP ER FORM 0,142974 ER TEST -0,57697 AVERAGE 0,396628 AVERAGE -0,25526 PORTOFOLIO 4 ATB ER FORM -0,35132 ER TEST -0,1111 TLV ER FORM -0,62002 ER TEST 0,137691 OLT ER FORM -0,78915 ER TEST 0,1342 AVERAGE -0,58683 AVERAGE 0,053596

78
PORTOFOLIO 5 BRD ER FORM -0,81263 ER TEST -0,60601 ALR ER FORM -0,91384 ER TEST 0,158732 ASP ER FORM -1,37771 ER TEST -0,88461 AVERAGE -1,03472 AVERAGE -0,44396
The results of the Student-t test (table 2) show significant values of the statistic
compared to the critical one-tailed values, therefore the null hypothesis of equal means can be rejected in favour of the corresponding alternative hypotheses. This is confirmed by the facts shown in the first table: the mean cumulated excess return decreases in the case of winners and increases in the case of losers (with only one stock, the “BRD” as exception). The same conclusion can be drawn from the Wilcoxon test: for each stock the null hypothesis of the equality of means can be rejected.
Table 2: Student-T And Wilcoxon Tests For Equality Of Average Returns (Significance Level 5%)
T Stat one-tailed p Wilcoxon's W statistic one-tailed p
CMP 40,07683 <0.0001 120512 <0.0001
SIF4 31,18975 <0.0001 110952 <0.0001
SIF2 24,06305 <0.0001 108672 <0.0001
BRD 6,471125 <0.0001 69442 0,9995
ALR -8,98706 <0.0001 40438 <0.0001
ASP -18,3792 <0.0001 16337 <0.0001
5. Conclusions At first glance these results seem to indicate the presence of reversal but we
have to be careful: although we can see that at the portfolio level higher returns are followed by lower ones and vice versa, this alone does not constitute a proof of reversal, at least not over the examined periods. It is obvious that one cannot construct a contrarian strategy of the type „long loser – short winner” because during the test period the cumulative returns on the winner portfolio remain positive while those on the loser remain negative. Therefore a momentum strategy may be profitable by going long on the winner and short on the loser portfolio. The Mann-Whitney test reveals that the returns in the winner portfolio remain significantly higher than those for the loser portfolio (table 3). Nevertheless, if we look at all the portfolios it seems as if the returns followed a mean-reverting process in general, which over these shorter periods manifests itself in momentum but most probably as reversal over longer periods.
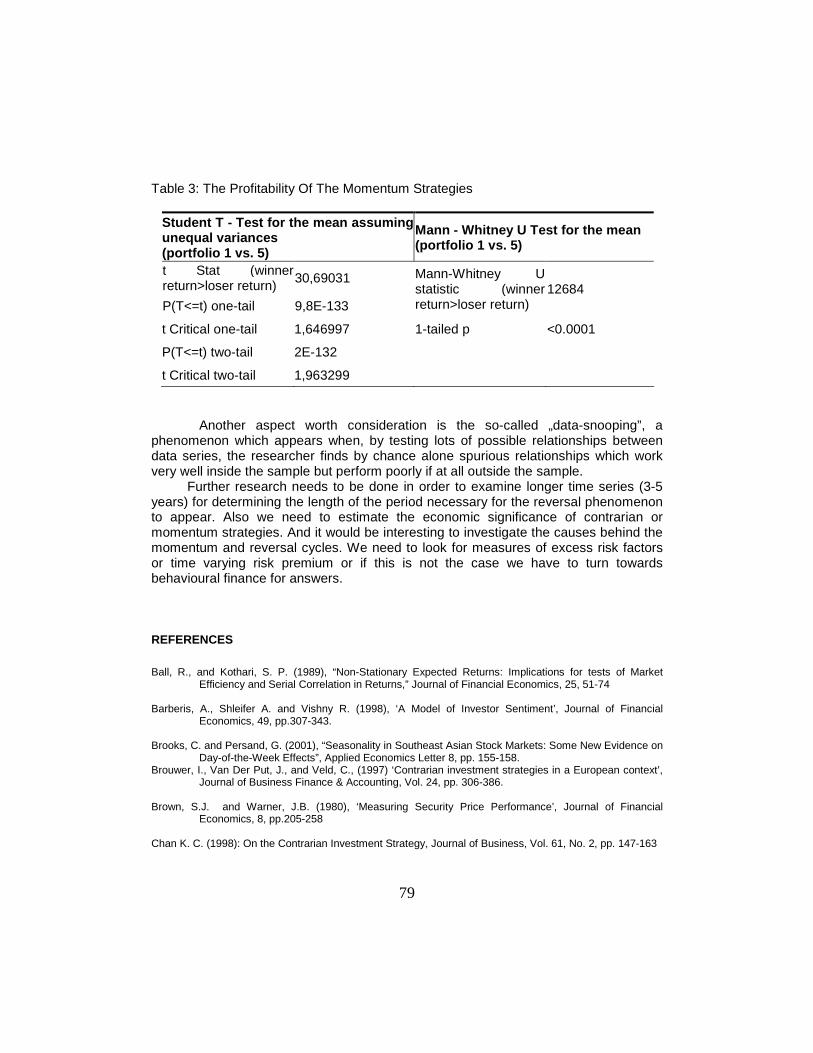
79
Table 3: The Profitability Of The Momentum Strategies
Another aspect worth consideration is the so-called „data-snooping”, a
phenomenon which appears when, by testing lots of possible relationships between data series, the researcher finds by chance alone spurious relationships which work very well inside the sample but perform poorly if at all outside the sample.
Further research needs to be done in order to examine longer time series (3-5 years) for determining the length of the period necessary for the reversal phenomenon to appear. Also we need to estimate the economic significance of contrarian or momentum strategies. And it would be interesting to investigate the causes behind the momentum and reversal cycles. We need to look for measures of excess risk factors or time varying risk premium or if this is not the case we have to turn towards behavioural finance for answers.
REFERENCES
Ball, R., and Kothari, S. P. (1989), “Non-Stationary Expected Returns: Implications for tests of Market
Efficiency and Serial Correlation in Returns,” Journal of Financial Economics, 25, 51-74 Barberis, A., Shleifer A. and Vishny R. (1998), ‘A Model of Investor Sentiment’, Journal of Financial
Economics, 49, pp.307-343. Brooks, C. and Persand, G. (2001), “Seasonality in Southeast Asian Stock Markets: Some New Evidence on
Day-of-the-Week Effects”, Applied Economics Letter 8, pp. 155-158. Brouwer, I., Van Der Put, J., and Veld, C., (1997) ‘Contrarian investment strategies in a European context’,
Journal of Business Finance & Accounting, Vol. 24, pp. 306-386. Brown, S.J. and Warner, J.B. (1980), ‘Measuring Security Price Performance’, Journal of Financial
Economics, 8, pp.205-258 Chan K. C. (1998): On the Contrarian Investment Strategy, Journal of Business, Vol. 61, No. 2, pp. 147-163
Student T - Test for the mean assuming unequal variances (portfolio 1 vs. 5)
Mann - Whitney U Test for the mean (portfolio 1 vs. 5)
t Stat (winner return>loser return)
30,69031
P(T<=t) one-tail 9,8E-133
Mann-Whitney U statistic (winner return>loser return)
12684
t Critical one-tail 1,646997 1-tailed p <0.0001
P(T<=t) two-tail 2E-132
t Critical two-tail 1,963299

80
Chopra, N., Lakonishok, J. and Ritter J.R. (1992), ‘Measuring Abnormal Performance’. Journal of Financial Economics, 31, pp. 235-268.
Clare, A. and Thomas S. (1995), ‘The Overreaction Hypothesis and the UK Stock Market’. Journal of
Business Finance and Accounting, 22 (7), pp. 961-973. Conrad, J. and Kaul G. (1993), ‘Long-Term Overreaction or Biases in Computed Returns?’, Journal of
Finance, 48, pp. 39-63. Da Costa, N., (1994) “Overreaction in the Brazilian Stock Market,” Journal of Banking and Finance 18, , 633-
642. Daniel, K; Hirshleifer; D Subrahmanyam, A (February, 1997); „A Theory of Overconfidence, Self-Attribution,
and Security Market Under- and Over-reactions” working paper DeBondt, W.F.M. and Thaler R.H (1987), ‘Further Evidence of Investor Overreaction and Stock Market
Seasonality’, Journal of Finance, 42, pp.557-581. DeBondt, W.F.M. and Thaler R.H. (1985), ‘Does the Stock Market Overreact?’ Journal of Finance, 40, pp.
793-808. Fama E., (1965), „ The Behaviour of stock market prices”, Journal of Business, January Fama, E. F. (1997); „Market Efficiency, Long-Term Returns, and Behavioural Finance, working paper,
Chicago, June Fama, E. F., and French, K. R (1996), “Multifactor Explanations of Asset Pricing anomalies,” Journal of
Finance, 51, 55-84 Jegadeesh N., and Titman S., (1993), “Returns to Buying Winners and Selling Losers: implications for Stock
Market Efficiency, Journal of Finance, 48, 65-91 Kahneman, D. and Tversky A. (1973), ‘On the psychology of Prediction’, Psychological Review, 80, pp. 237-
251 Kothari, S., and Warner, J., (1997), “Measuring Long-Horizon Performance: Abnormal Returns,” Journal of
Financial Economics, 43, 301-339 Lakonishok, J., A. Shleifer and R. Vishny (1994), ‘Contrarian Investment, Extrapolation, and Risk’, Journal of
Finance, 49, pp.1541-1578. Lo, A.W. and MacKinlay, A.C., (1990) ‘When are Contrarian Profits due to Market Overreaction?’, Review of
Financial Studies, Vol. 3, , pp. 175-205. Loughran, T. and Ritter J.R. (1996), ‘Long-Term Market Overreaction: The Effect of Low-Priced Stocks’,
Journal of Finance, 51, pp. 1959-1970. Poterba, J. M., and Summers L. H., (1988), “Mean Reversal in Stock Prices,” Journal of Financial
Economics, 27-59 Todea, A. (2005): EficienŃa informaŃională a pieŃelor de capital – studii empirice pe piaŃa românească, Casa
CărŃii de StiinŃă, Cluj Napoca van der Hart, J.M., G. de Zwart and D. van Dijk (2005), The success of stock selection strategies in
emerging markets: Is it risk or behavioral bias?, Emerging Markets Review 6, 238-262.

81
Wang, J., et al., (2004). Analysis of the overreaction effect in the Chinese stock market. Applied Economics Letters.
Zarowin, P. (1990), ‘Size, Seasonality, and Stock Market Overreaction’. Journal of Financial and Quantitative
Analysis, 25 (1), pp.113-125. Web sites: WWW.BVB.RO WWW.KMARKET.RO WWW.VANGUARD.RO

82

83
STUDIA UNIVERSITATIS BABEŞ-BOLYAI, OECONOMICA, LI, 2, 2006
STRATEGIC CHALLENGES OF ROMANIAN PHARMACEUTICAL INDUSTRY
Dragan KESIČ Carynthia Group Ltd., Slovenia Andrej BERTONCEL * Carynthia Group Ltd., Slovenia
ABSTRACT. Romanian pharmaceutical market is one of the most attractive markets in the region of Central and Eastern Europe due to its size, growth potential and increasing per capita medicine consumption. Romanian pharmaceutical industry has been to large extent consolidated in the last decade and thus followed the process of concentration and globalization of world pharmaceutical industry. Forthcoming entry of Romania into the full European Union membership will undoubtedly further influence and strengthen regulatory, competitive and other industry relevant issues related to the local pharmaceutical market. We foresee further consolidation of local pharmaceutical industry and hence increased competition among local pharmaceutical companies. JEL Classification: L 11, M 39, G34 Keywords: pharmaceutical industry, pharmaceutical market, generic medicines, consolidation, globalization, Romania.
1. Introduction
On the basis of sound scientific estimation of several authors (Aaker, 1998; Corstjens, 1991; Kesič, 2000) we define the characteristics of world pharmaceutical industry as the following:
a) enhanced globalisation, b) increased competition and competitiveness, c) lack of new products despite enlarged investments into basic R&D
activities, d) increased value of regulative (product registration, intellectual property
protection and law-suits), e) fast gaining importance of marketing and marketing way of thinking
* Corresponding author. Carynthia Group Ltd., Lobodova 17, 1236 Trzin, Slovenia. E-mail: [email protected]

84
and performing, f) development of brand new therapeutic areas and technologies
(biotechnology, pharmacogenomics, new delivery systems), g) ageing of population and emerging of new therapeutic fields, h) quick growth of world generic markets.
World pharmaceutical market has undergone fast and complex changes in the last several years. Pharmaceutical industry of today is still one of the most innovative and lucrative so called »high-tech« industries. Development of a brand new medicine (NAS – New Active Substance) is estimated to cost over 1,2 billion dollars and it takes over 12 years to bring it as a finished, legally registered and approved product to a marketplace (Pharma Strategy Group, 2005). This is at the same time very complex and highly risky business project with no final guarantee of payback. Empirical studies suggest that big pharmaceutical companies invest on average around 16% of their sales into R&D and even more, around 25%, into marketing and sales activities (Kesič, 2003). However, these ratios, especially the one of R&D investment, are even higher with specialists like biotechnology and pharmacogenomic pharmaceutical companies, but much lower with generic pharmaceutical companies (Kesič, 2003).
In 2005, world pharmaceutical market posted total sales of 602 billion dollars and growth rate of 10% (see Figure 1). The fastest growing markets and regions are China, Central and Eastern Europe (Hungary, Czech and Slovak Republic, Russia, Poland, Romania) and certain markets of Latin America (Brazil, Mexico, Chile). It is estimated that world pharmaceutical market will grow by an average of 7% CAGR till the year 2010 (World Review, 2005). However, it is as well estimated that due to several factors – the expiration of patent protection of some of the blockbuster products in the most developed markets, the worldwide healthcare cost reduction, ageing of population and price pressures – the world generic markets will grow even faster by an average of 12% CAGR till the year 2010 (World Review 2005; Pharma Strategy Group, 2005). The most developed and biggest pharmaceutical market in the world is the U.S. market which grew 7,5% in the same year (World Review, 2005).
Figure 1: World pharmaceutical market 2000 – 2005
Year Value in billion US$ Growth in %
2000 358
2001 387 8,1
2002 422 9,0
2003 490 16,1
2004 547 11,6
2005 602 10,0
Source: World Review 2005
We forecast, taking into account the aforementioned factors, further
consolidation and concentration of world pharmaceutical industry. We expect the

85
formation of even bigger pharmaceutical concerns in all sectors of pharmaceutical industry. We argue that further concentration of Romanian pharmaceutical industry will be a part of the ongoing global conglomeratisation process. 2. Romanian pharmaceutical market Historically, pharmaceutical industry in the CEE region has never really been a key strategic priority for the most of regional countries. However, in some countries like Hungary, Slovenia, Croatia, Poland and partly in the Czech Republic, some relatively solid pharmaceutical companies have emerged (see Figure 2) and developed significant international presence. In the other countries of the region, including Romania and Russia, pharmaceutical industry is still scattered, relatively unimportant, and to some extend unable to meet required international pharmaceutical standards (USP, BP, GP, GSP, GLP etc.). Needless to mention there are only a few pharmaceutical companies in the CEE region that have become important players in the international marketplace, meaning predominantly in the market for generic medicines.
Figure 2: Leading pharmaceutical companies in the CEE region
Position Company Sales in million US $
1. Pliva*, Croatia 999
2. Richter Gedeon, Hungary 843
3. Lek**, Slovenia 656
4. Krka, Slovenia 656
5. Zentiva***, Czech Republic 481
6. Polpharma, Poland 290
Source: own estimation, according to pharmaceutical companies official reports * recently acquired by Barr Pharmaceuticals of the USA ** part of Sandoz Group, a Swiss Novartis company *** 24,9% owned by a French multinational sanofi-aventis
We emphasize the influence of general economic situation in the CEE region for the development of local pharmaceutical industry. Having developed only in the recent years more towards open market economies, the countries of CEE region were under strong influence of central planning, resulting in poor market understanding and performance. Sudden shift to free market economies in the nineties and opening up of home markets had relatively strong impact on the business performance of local pharmaceutical companies. However, there are still relatively big differences in the development stage of pharmaceutical markets within the CEE region, especially if we measure and compare them by a real consumption and absorption capability.
The Romanian pharmaceutical market reached 1,13 billion Euro in the last twelve months ending in March 2006, according to the market research company Cegedim. This figure is 4% higher than the previous twelve months average ending in December 2005, but mainly due to cyclical slowdown in sales in the first quarter of 2006 after very strong sales in the last quarter of the previous year

86
(Cegedim, 2005). In the first quarter of 2006, the market amounted to 302 million Euro; a figure which is lower than the one corresponding to the previous quarter (310 million Euro), but 16% higher than the first quarter of 2005, during which sales stood at 259 million Euro (Cegedim, 2005 and 2006).
The pharmacies accounted for approximately 85% of the overall pharmaceutical sales whilst the hospitals accounted for the difference. The average medicines sales in the first quarter of 2006, in both market segments, exhibited contrasting variations as the increase in the retail segment by 16,4% was partly offset by the 2,2% decrease in the hospital segment. On the retail side, the sales of over-the-counter (OTC) drugs represented 16% of the overall sales whereas the sales of prescription-only (Rx) drugs accounted for the remaining 84%.
The highest growing therapeutic classes were cardiovascular (27,6%), central nervous system (21,1%) and muscular-skeletal (16%). The OTC drugs, however, displayed a higher growth rate (4,5%) than the Rx drugs (3,9%). Regarding the market's generics penetration, the increase in both the government's and the population's purchasing power led to a reduction in the share of generics prescription drugs in terms of both units and value (77% in 2006 vs. 90% in 1999 and 37% in 2006 vs. 50% in 1999). The high growth rates experienced in the last couple of years (16,7% 1999-2005 CAGR) and the increase in the share of original Rx and OTC drugs have enhanced the Romanian pharmaceutical market's attractiveness, which has led major multinational players to enter the market and establish a significant presence, both in the manufacturing and distribution segments.
Despite encouraging evolution of Romanian pharmaceutical market over the last five years there are persistent problems which are still unresolved. Despite the fact that 96% of Romanian citizens are registered with local doctors, outpatient care is poor, and although the doctor/patient ratio has increased over the last years it still shows only 22,2 physicians per 10.000 inhabitants; there is also a chronic deficit of pharmacists, with a pharmacist/patient ratio of only 4 per 10.000 (National Institute of Statistics, 2005). Further, according to a study carried out by the Economist Intelligence Unit (EIU, 2005) the estimated expenditure per capita on healthcare in Romania approximates 160 Euro, relative to the EU's average of 1.000 Euro. Furthermore, the drug consumption per capita, at estimated 52 Euro in 2005, is among the lowest in Europe (less than half that of Hungary, the Czech Republic and Poland, and 14% of that in the EU), but it is expected to reach 85 Euro by 2007, as stated in the EIU report. Concerning the evolution of the Romanian pharmaceutical market, the report estimates that the market will reach 1,46 billion Euro in 2007.
The EIU report stresses that the market share of imported drugs has grown rapidly from 45% in 1996 to 75% in 2004. Most of the imports are from the EU countries with France and Germany as leading suppliers accounting for approximately 30% of all imports. However, imports account for only about 20% of the market by volume, as the domestic producers largely concentrate on the production of low-value generic medicines and imports are concentrated on more sophisticated, patent-protected medicines. The state's role in the health and pharmaceutical sectors is highly significant as the former, through the national health programmes and drugs-reimbursements schemes, covers approximately half of the total drugs expenditure in Romania. The health system is financed

87
entirely by employees' and employers' contributions, which amount to 7% and 6,5% of the employee's gross wage, respectively. For high social impact diseases such as AIDS, cancer, diabetes, tuberculosis or cardiovascular diseases, there are national health programmes under which the patients do not have to support the cost of treatment and all medicines are purchased by the Ministry of Health through national tenders, due to be held annually. Furthermore, there are reimbursement schemes under which, depending on the gravity of the diseases and of the importance of each prescription medicine, the state, through the National Health Insurance House covers 50% or 90% of the drug's price. Each year, based on the recommendations made by the College of Physicians and the College of Pharmacists, the Health Ministry and the National Health Insurance House compose the list of reimbursed drugs.
The authorisation of medicines production, import, registration and distribution are controlled by the National Drug Agency, one of the first government institutions to adopt the EU's regulatory acquis. As a consequence, all previously registered medicines have had to undergo a re-registration process and for each medicine the manufacturer has had to provide bio-equivalence studies and to compile the drug information in a common technical document (CTD) format dossier. 3. Leading Romanian pharmaceutical companies
Figure 3: Leading pharmaceutical companies in Romania
Position Company Estimated sales for 2006 in million Euro
1. Zentiva (Sicomed S.A.) 100
2. Terapia 81
3. Antibiotice 64
4. Ozone Laboratories 50
5. Sindan 80
Source: own estimation, according to pharmaceutical companies official reports Zentiva (formerly Sicomed SA)
For 2005 Sicomed reported sales of 52,6 million and for the 2006 Zentiva expects sales to reach 100 million Euro, which according to company officials implies a market share of 6%, relative to the 5% market share in 2005. In 2005, the sales of over-the counter (OTC) medicines accounted for almost 50% of the company's sales and one of its OTC products, Algocalmin, was the seventh best sold drug in Romania, with sales of approximately 7,5 million Euro (Cegedim Report, 2005). Zentiva's portfolio comprises 100 drugs in 200 formulations and the company plans to add 20 new molecules by 2009, mainly in the cardiovascular, central nervous system and digestive-tract therapeutic classes.
88
Terapia Terapia is the second largest pharmaceutical manufacturer in Romania.
The company was established in Cluj-Napoca in 1921 and its extensive tradition has transformed it into a household name in the Romanian pharmaceutical field. Currently, Terapia develops, produces and sells a large portfolio of around 150 products, including Rx and OTC drugs, with a strong position on the cardiovascular therapeutic class. For the local market the company has announced plans to introduce 40 new products by the end of 2007, with a strong emphasis on cardiovascular, muscular-skeletal, central nervous system, anti-infective and diabetes drugs. For 2006 Terapia forecasts turnover of 81 million Euro, 25% more than in 2005. In 2005, exports accounted for approximately 15% of the company's turnover and this figure is likely to be maintained as the new owners might open up new markets for Terapia's successful products. Antibiotice
Antibiotice is the largest still independent generic pharmaceuticals manufacturer with expected sales of 63,4 million Euro and earnings before tax (EBT) of 8,5 million Euro in 2006. The company had a total market share of 3,2% in 2005 (Cegedim Report 2005). Over the years, Antibiotice has diversified its portfolio and it currently covers 10 therapeutic classes. Currently, the company has 60 molecules registered in Romania, for which it possesses approximately 250 marketing authorisations. Antibiotice has developed a strong portfolio of OTC drugs, ranging from nutritional supplements, to cough-and-cold products and dermatology products. Antibiotice also exports its products, mainly the active pharmaceutical ingredients (API) to some 50 countries. According to company officials, exports represented approximately 14% of the company's turnover in 2005. Antibiotice was listed on the Bucharest Stock Exchange and its current market capitalisation amounts to approximately 175 million Euro. The state, through the government-controlled National Authority for State Assets Recovery (AVAS) still controls 53% of the subscribed share capital, which it plans to sell in a privatisation process scheduled to commence by the end of 2006.
Ozone Laboratories
Ozone Laboratories has developed a highly successful and unique business model - contract manufacturing. For 2006 the company plans to further expand the portfolio to reach an estimate of 170 products by year-end. For 2005 the company posted a turnover of 22,2 million Euro and for 2006 it plans to continue its accelerated growth rate to reach 50 million Euro. Given its successful evolution on the Romanian market, Ozone plans to extend its operations into Russia, Ukraine, Hungary, Poland, Bulgaria, Czech Republic, Greece and Turkey and to transform the Romanian company into a regional hub.
Labormed-Pharma Labormed Pharma, established in 1991 by a group of local entrepreneurs as a green-field investment, is the sixth largest pharmaceutical manufacturers in Romania. Over the years the company has experienced rapid growth rates which have enabled it to post 19,5 million Euro turnover in 2005 and to plan 30 million Euro turnover in 2006. The company's portfolio comprises approximately 80

89
products and whilst its strength lies in cardiovascular therapy, Labormed also has a strong position in central nervous system and muscular-skeletal and digestive tract. The company has invested in excess of 8 million Euro in the construction of a new, GMP-compliant production facility with an estimated capacity of 1,5 billion capsules per year.
Sindan Sindan is the only niche pharmaceutical manufacturer in Romania, with an exclusive focus on oncology. The company focuses on three business lines: manufacturing of own products, secondary packaging for multinational companies and distribution of own and third party drugs as part of the tender for the Oncology National Health Programme. Sindan, which in 2005 controlled approximately 2% of the Romanian pharmaceutical market in terms of value, has reported a 68 million Euro turnover for the aforementioned year and is planning to reach 80 million turnover in 2006.
4. Consolidation of Romanian pharmaceutical industry In 2005, Czech-based Zentiva paid 120 million Euro for 75% of the
subscribed share capital of Sicomed, the largest Romanian pharmaceutical manufacturer. The second largest player, Terapia, was acquired by Indian-based Ranbaxy in 2006 for 260 million Euro which was a record-breaking transaction. Ranbaxy representatives have publicly pledged to maintain Terapia brand and to use it as a regional hub for the expansion into the EU and CIS member states. In 2006, Sindan, the only oncology-specialised Romanian pharmaceutical manufacturer was acquired by Iceland-based Actavis for 150 million Euro and has since vowed to use Sindan's unique expertise to internationally expand into oncology (see Figure 4). The implied multiples of these transactions were: for Sicomed 3,4 x Sales and 13,5 x EBITDA, for Terapia 4,2 x Sales and 11,6 x EBITDA and for Sindan 2,2 x Sales and 10 x EBITDA. Following this wave of foreign acquisitions, the Romanian government has decided to commence the privatisation process which should allow it to sell its majority stake in the third largest Romanian pharmaceutical manufacturer, Antibiotice.
In the manufacturing segment, following acquisitions of Sicomed, Sindan and Terapia there are only a handful of relatively significant local players which remain independent and it is realistic expectation that, within the next couple of years, Antibiotice, Labormed, Biofarm or Ozone will be acquired by international players who will be attracted by Romania's high growth rate and its rather low cost-base relative to the EU countries. The product development restrictions and additional intellectual property rights protection which Romania is to implement upon admission into the EU will further complicate the evolution of domestic independent producers lacking the development capabilities of vertically integrated international pharmaceutical manufacturers.
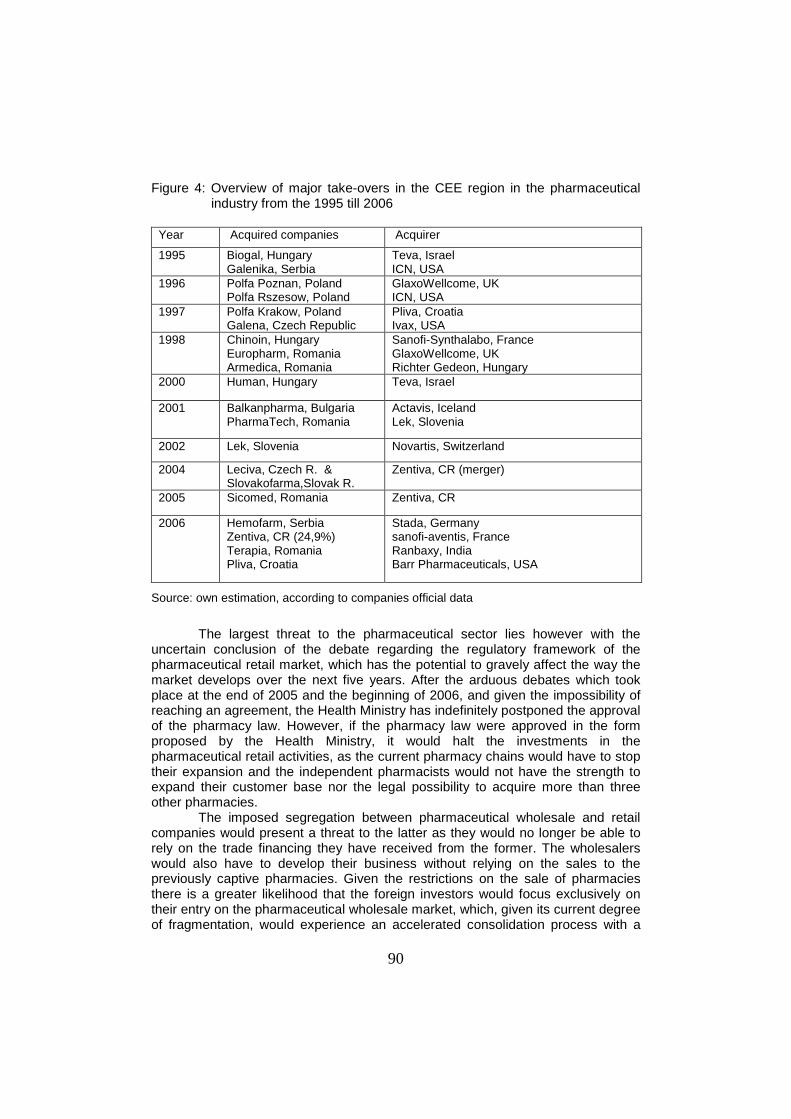
90
Figure 4: Overview of major take-overs in the CEE region in the pharmaceutical industry from the 1995 till 2006
Year Acquired companies Acquirer
1995 Biogal, Hungary Galenika, Serbia
Teva, Israel ICN, USA
1996 Polfa Poznan, Poland Polfa Rszesow, Poland
GlaxoWellcome, UK ICN, USA
1997 Polfa Krakow, Poland Galena, Czech Republic
Pliva, Croatia Ivax, USA
1998 Chinoin, Hungary Europharm, Romania Armedica, Romania
Sanofi-Synthalabo, France GlaxoWellcome, UK Richter Gedeon, Hungary
2000 Human, Hungary Teva, Israel
2001
Balkanpharma, Bulgaria PharmaTech, Romania
Actavis, Iceland Lek, Slovenia
2002 Lek, Slovenia Novartis, Switzerland
2004 Leciva, Czech R. & Slovakofarma,Slovak R.
Zentiva, CR (merger)
2005 Sicomed, Romania Zentiva, CR
2006 Hemofarm, Serbia Zentiva, CR (24,9%) Terapia, Romania Pliva, Croatia
Stada, Germany sanofi-aventis, France Ranbaxy, India Barr Pharmaceuticals, USA
Source: own estimation, according to companies official data
The largest threat to the pharmaceutical sector lies however with the
uncertain conclusion of the debate regarding the regulatory framework of the pharmaceutical retail market, which has the potential to gravely affect the way the market develops over the next five years. After the arduous debates which took place at the end of 2005 and the beginning of 2006, and given the impossibility of reaching an agreement, the Health Ministry has indefinitely postponed the approval of the pharmacy law. However, if the pharmacy law were approved in the form proposed by the Health Ministry, it would halt the investments in the pharmaceutical retail activities, as the current pharmacy chains would have to stop their expansion and the independent pharmacists would not have the strength to expand their customer base nor the legal possibility to acquire more than three other pharmacies.
The imposed segregation between pharmaceutical wholesale and retail companies would present a threat to the latter as they would no longer be able to rely on the trade financing they have received from the former. The wholesalers would also have to develop their business without relying on the sales to the previously captive pharmacies. Given the restrictions on the sale of pharmacies there is a greater likelihood that the foreign investors would focus exclusively on their entry on the pharmaceutical wholesale market, which, given its current degree of fragmentation, would experience an accelerated consolidation process with a

91
series of existing wholesalers either forced out of business or acquired by the larger players.
The medium term evolution of the Romanian pharmaceutical market will most likely benefit from the increased purchasing power of the population, the enhanced healthcare awareness and the state's improved ability to finance the needs of an ageing population. The reference price established for medicines that are reimbursed equals the minimum price of the respective active substance. Thus, the current reimbursement system would favour the local producers whose products have significant price advantages. The main problem for local producers lie in outdated portfolio of products and low profitability which hurts their competitiveness (limited funding for R&D, license acquisitions, promotions, etc.). There is also low profitability for the distributor of domestic products due to the small mark-up on wholesale sales imposed by the Ministry of Health. Doctors, pharmacists and patients are keen to use pharmaceutical products from “brand name” manufacturers; the main difficulty is the relative high price of these products. Most subjects consider that medicines produced by foreign companies are of better quality and efficiency as compared to Romanian ones. However, the higher price over that of Romanian medicines limits their administration to the patients that have sufficient financial means to buy them. The Romanian market is extremely price sensitive because the average monthly income is relatively low and most cannot afford to buy expensive drugs. The highest demand is for pharmaceuticals produced by the domestic industry as they are of the lowest cost, unfortunately they are often the least effective. Nevertheless, the products of domestic producers are often preferred in the state-owned hospitals because of the Government’s desire to control costs in healthcare system. There is only one remaining strategic pharmaceutical producer which is still state owned, Antibiotice Iasi. Historically, the Romanian manufacturers had very little modern equipment, a large labor force, and relatively low productivity. With increased foreign investments, local manufacturers are improving their productive capacities and efficiency. Romanian pharmaceutical market will grow further in the following years. Factors influencing the growth rate include:
a) increase in economic growth and per capita income as economic reforms take hold, b) increase in funds allocated through the state budget for the health sector, c) increase in the sales of international products due to the lack of
domestic alternative, d) increase in the prices of local products as Romanian producers must
invest in modern technology to meet international standards (GMP). 5. Conclusions
Romanian pharmaceutical market has been growing steadily in the last couple of years despite major imbalances in the healthcare and drug chain system. The market is still traditionally »brand« oriented, as brand and brand generic drugs tend to prevail. Strategic marketing is very important in the endeavour to conquer

92
targeted market shares. Romanian pharmaceutical market has a considerable growth potential as per capita medicine consumption is still relatively low in comparison to nearby countries in the CEE region. Forthcoming entry of Romania in the common market of the EU will have an additional impact on the local pharmaceutical industry. We foresee further intensification of competition and increased number of new players as Romanian pharmaceutical market is set to look strategically even more attractive. Romanian pharmaceutical industry has already taken part in the intensive processes of globalisation in the past as major local manufacturers were acquired by big international players. The biggest independent pharmaceutical company Antibiotice is going to be privatised in the near future year and will undoubtedly attract the attention of foreign strategic investors. Competition for tomorrow will be predominantly among allied companies that means among coalition of companies and big individual companies ; small companies will lack needed resources to successfully exploit the potential of new products, the needed knowledge and skills to successfully turn its visions into reality (Hammel&Prahalad,1994). Nowadays, pharmaceutical companies tend to cooperate and compete. That is where we see Antibiotice in the future. REFERENCES Aaker D.A. (1998). Strategic market management, John Wiley&Sons, Inc., New York Antibiotice (2005). Annual Report 2005 Barlett C.A., Ghosal S.(1989). Managing across Borders: The Transnational Solution, Harvard Business
School Press, Boston Barr Laboratories (2005). Annual Report 2005 Bertoncel A. (2006). Akvizicije, Zagreb, Narodne novine Business Eastern Europe, Current Issues, 1995.,1996., 1997.,1998., 1999., 2000., 2001., 2002., 2003.
The Economist Intelligence Unit Ltd., London Cegedim, Romanian Pharmaceutical Market 2005., 2006. Corstjens M. (1991). Marketing Strategy in the Pharmaceutical Industry, Chapman and Hall, University
Press, Cambridge Datamonitor (1996). Mergermania: Who is Next?, Datamonitor, London Datamonitor (2000). Merger and Acquisition 2000, London Datamonitor (2002). Global Pharmaceutical Forecasts to 2010, Datamonitor, London Drucker P.(1999). Managing for the Future, Butterworth-Heineman Ltd., London Economist Intelligence Unit, 2004., 2005., 2006 The Economist Intelligence Unit Ltd., London Evers P.( 2001). The Generics Outlook 2001, Datamonitor, London Hamel G., Prahalad C.K. (1994). Competing for the Future, Harvard Business School Press, Boston

93
Kesič D. (2000). Strateške povezave kot realnost poslovanja v farmacevtiki, Zbornik EPF, Inštitut za
razvoj managementa in Izobraževalno društvo MBA klub, Maribor Kesič D.(2003). Strateško povezovanje Leka in Novartisa, Zbornik EPF, Inštitut za razvoj managementa
in Izobraževalno društvo MBA klub, Maribor Knickerbocker F.T.(1973). Oligopolistic Reaction and the Multinational Enterprise, Harvard University
Press, Cambridge Kotler P.(1994). Marketing Management, Prentice Hall, Intl., Englewood Cliffs Lorange P., Roos J.(2000). Strategic Alliances: Formation, Implementation and evolution, Blackwell
Publishers, Cambridge Markusen J.R. (2002). Multinational Firms and the Theory of International Trade, MIT Press Cambridge Moore J.(1998). The Generic Pharmaceuticals Outlook 1998-2008, Datamonitor, London Rugman A.M. (1982). New theories of the multinational enterprise, Croom Helm, London Pharma Strategy Group London, Current Issues, 2003., 2004., 2005., 2006., Pharma Strategy Group
Ltd., London Pharma Company Profiles, Pharma Vitae, 2005, Barr Laboratories, Datamonitor, London Pliva (2005). Annual Report 2005 Romanian National Institute of Statistics, 2005 Scrip Reports (2003). Where is the Pharma Industry Going?, PJB Publications Ltd., London Sicomed (2005). Annual Report 2005 Strategic Pharma Prognosis Forecast, 2000.,2001., IMS Health, London Svetličič M.(1996). Svetovno
podjetje, Znanstveno in publicistično središče, Ljubljana Svetličič M., Singer H. (1996). World Economy: Challenges of Globalisation and Regionalization. IN:
Svetličič M., Singer, H. (eds.): World Economy: Challenges of Globalization and Regionalization. Mac Millan Press Ltd., St. Martin's Press Inc., London
Svetličič M.(1996). “Challenges of Globalisation and Regionalization in the World Economy” Global
Society, Vol. 10, No 2. Terapia (2005). Annual Report 2005 World Review - The Pharmaceutical Market, 2006., IMS Health, London http://www.pfizer.com (12.10.2006) http://www.novartis.com (14.10.2006) http://www.tevapharm.com (25.10.2006) http://www.watson.com (10.10.2006) http://www.mylan.com (10.10.2006) http://www.pliva.hr (25.10.2006) http://www.krka.si (12.10.2006)

94
http://www.ranbaxy.com (15.10.2006) http://www.zentiva.com (12.10.2006) http://www.sicomed.ro (11.10.2006) http://www.terapia.ro (22.10.2006) http://www.antibiotice.ro (23.10.2006) http://www.merck.de (16.10.2006) http://www.pharmalicensing.com (22.10.2006) http://www.gsk.com (18.10.2006) http://www.barrlabs.com (26.10.2006) http://www.lek.si (19.10.2006) http://www.leciva.cz (19.10.2006) http://www.ft.com (15.8. 2006, 22.9.2006, 15.10.2006, 27.10.2006)

95
STUDIA UNIVERSITATIS BABEŞ-BOLYAI, OECONOMICA, LI, 2, 2006
IMPLEMENTING THE ACCRUAL ACCOUNTING IN PUBLIC SECTOR- EAST EUROPEAN COUNTRIES EXPERIENCE
Adriana TIRON TUDOR* Babeş-Bolyai University of Cluj Napoca, Romania
ABSTRACT In public sector the cash basis of accounting has been traditionally used, but in the last period there have been discussions over the benefits of a change to the accrual basis. The move to the accrual basis for public sector financial reporting has not gained universal acceptance. In Europe, there are a lot of countries who refuse to make the exchange, or who have increased doubts.In this confuse international context Romania, like other East European countries in last ten years, starting with 01 January 2006 implement the accrual accounting for public sector. We intend to realize a comparative study for a group of East European countries regarding the reform of accounting, the implementation of accrual accounting in public sector, knowing the fact that since countries differ at the level of individual reforms, there is no single model of reform. Nonetheless, reform strategies have many points in common emphasizing the international character of public management reform. By cross-national comparisons we intend to analyze the impact of movement from cash to accrual accounting in East European Countries, and in Romania, focused on the utility of financial information for the management and other users.
JEL Classification: M41, M40, P20, H80, O52 Keywords: accounting, public sector, comparation, east european countries.
Introduction
In recent years, many government bodies have moved away from traditional public administration approaches toward a management model more akin to the private sector, with its results-oriented contracts and performance-based remuneration schemes.
This reform of public sector financial management has at its heart a shift from cash-based accounting to accrual accounting, where more meaningful information is obtained from expenditures laid against performance achievements rather than previously agreed-upon budgets.
* Corresponding author. Faculty of Economics and Business Administration. Adress: : 58-60 Teodor Mihali Street, 400591 Cluj-Napoca, Romania. Phone: 0040 744779494. E-mail: [email protected]

96
This transition has enabled governments to improve the transparency of budget and financial performance; make better decisions; and spend public funds more effectively.
In practice there are three accounting method used in public sector: • Cash Basis of Accounting under which revenues are recorded when cash is
received and expenses are recorded when cash is paid. • Accrual Basis of Accounting that records revenues in the period in which they
become earned (whether received or not) and the expenses in the period that resources are used.). Therefore, the transactions and events are recorded in the accounting records and recognized in the financial statements of the periods to which they relate. The elements recognized under accrual accounting are assets, liabilities, net assets/equity, revenue and expenses.
• Modified Accrual Basis: The modified actual basis, also called the modified cash basis and the modified cash-accrual basis is a compromise between these two ends of the accounting spectrum. It has served governments well since, by using it, they have avoided the difficult and potentially expensive job of valuing assets that do not lend themselves to easy valuation. Such public holdings as parkland, public monuments, national or local library or art holdings have some monetary value, but, in the absence of market forces, determining what it is difficult. The modified approach presents expenditures other than accrued interest on government long-term debt, inventory and disbursements, which may be recorded a the time of purchase or when used, and prepared expenses, which are normally recorded or recognized on the accrual basis at the time the liability is incurred. Revenues are recorded when received, and those that are measurable and available for expenditure are accrued to properly reflect the taxes levied and revenues earned.
Like advantages of cash accounting are mentioned: direct link to the compilation of the budget, well-established software applications, good knowledge of the actual system. And like disadvantages: the economic actions are not recognized in timely and factually relationship, there is not the overview about assets and liabilities, expenses and revenues, necessity of compliance formation of main government treasury account.
For accruals accounting advantages consist in: fair view of the events, standardized process (way of preparation of annual accounts, possibility of the following of cash flows, and disadvantages regard at: costly implementation, assets valuation cost, fear from the unknown by the users.
The transition from cash to accrual accounting implies follow risks: issue of budgetary impact of transition to accruals accounting, unclear basis terms for public sector, political unwillingness and fear from unpopular actions.
1. Types of transition from cash to accrual
Within jurisdictions1, the style and speed of the transition may vary greatly. A wide range of approaches is possible and various combinations of these approaches are also possible.
1 www.ifac.org- Study 14, December 2003, Transition to the Accrual Basis of Accounting: Guidance for Governments and Government Entities (Second Edition)

97
Like possible types of transition from cash to accrual we follow the IFAC structure presented in Study 14. There structure is followed also in the paper where we tried to establish the type of reform in each countries analyzed.
Taking into consideration like criteria the type of entities, which are implied in reform process, the reforms may be applied to all public sector entities within a government, or they may be restricted to certain types of entities. So the transition to accrual accounting may be: mandatory for certain types of entities, voluntary for some or all of them or different transition paths for different types or sizes of entities.
However, voluntary transitions2 can cause difficulties in that the use of different bases of accounting by various entities within a government precludes the preparation of consolidated financial statements for the whole-of-government entity. Voluntary choice (also referred to as self-selection) is sometimes used when a small number of pilot entities are sought to trial the reforms. The use of pilot entities allows a government to gain experience in how to deal with the reforms and the problems likely to be encountered, and assists in developing a core of trained personnel.
At the Government level, the Whole-of-Government Reporting under accrual basis can be required at the same time as the first accrual reports from individual entities, or, the production of such reports may be delayed for a period to allow more time to focus on the transition by individual entities, the boundaries of the reporting entity and other consolidation issues and the last type can be to produce consolidated accrual reports for various sub-sectors of the whole-of-government reporting entity as an interim step, and then complete whole-of-government reports.
Another criteria are implementation steps for assets and liabilities. The accrual accounting central idea is to recognize all assets and liabilities, which meet the definition of assets and liabilities and satisfy the criteria for recognition of assets and liabilities. But, there is a way to make this movement in steps, first for example with the recognition of short-term assets and liabilities such as debtors and creditors followed by the recognition of tangible assets. Also the tangible assets can be made in steps: first those assets that are readily identified and measured being recognized followed by other, which will be identified and measured.
Similarly, the recognition of liabilities can occur in a step-by-step manner. Firs are recognized public debt, because an entity usually has reasonably accurate records of existing borrowings followed by pension and other long-term obligations, which may be recognized in stages.
The follow criteria are the link between accrual budgeting and accrual accounting. There two elements can be part of reform process, the change in budgeting and authorization processes may occur at the same time as the initial change to accrual accounting and reporting. In many countries it has occurred at least one to two periods after the introduction of accrual reports. This delay is sometimes required to provide assurance to those responsible for authorization of budgets that the new financial systems can provide reliable information on which to base budget authorizations.
The reform period is direct link with the resources available or the extent of political commitment and can be:
2 idem 1

98
• short (one to three years) where there is strong political support and a limited number of entities
• medium (four to six years) provide more time for the preparation of detailed implementation plans, the development of accounting policies and implementation and testing of new systems. They also provide a reasonably long time for the education of groups such as government employees and politicians regarding the changes
• long (over six years). The benefits of a longer implementation period need to be balanced against the risks of “reform fatigue3”.
In selecting a time frame for the transition, a government may also establish target dates or stages (milestones) for the achievement of various aspects of the reforms. Entities may be required to meet certain criteria by certain dates in order to progress to the next stage of implementation.
Professor Lueder presents another classification4: • substitution of accrual accounting and budgeting for traditional cash based
accounting and budgeting • substitution of accrual accounting for traditional cash based accounting.
Maintaining cash based budgeting and deriving actual cash data from the accrual system
• adding an accruals based accounting system to the traditional cash based accounting and budgeting systems that remain unchanged that remain unchanged
2. Methodology
We realize a comparative study for a group of East European countries regarding the status of accrual accounting reform before and after EU accession, knowing the fact that since countries differ at the level of individual reforms, there is no single model of reform. Nonetheless, reform strategies have many points in common emphasizing the international character of public management reform. By cross-national comparisons we intend to analyze the type of accrual accounting reform in certain Eastern European Countries, and in Romania.
We select for our research 7 countries from Eastern Europe: EU members Slovenia, Hungary and Czech Republic, acceding countries Bulgaria and Romania, one candidate country Croatia and a potential candidate country Albania. Our country profile is based on the data collected from progress reporting and status of performance audit monitories by Commission and international organizations, Finance Ministry websites and other electronically sources.
3 www.ifac.org- Study 14, December 2003, Transition to the Accrual Basis of Accounting: Guidance for Governments and Government Entities (Second Edition)- Reform fatigue occurs when those at the forefront of the changes in government entities lose the sense of urgency and enthusiasm needed to implement the reforms, particularly if no benefits emerge early in the process. 4Luder - Where are we now, Conference: Accruals Accounting in the Public Sector - Progress and Achievements - 27/09/2004, http://ec.europa.eu/budget/documents/reference_documents_accounting_en.htm

99
3. EU Accounts In March 2000, following the resignation of the previous Commission in
March 1999 the European Commission initiated a substantial reform program to improve financial management and accountability. One of the key elements of this process, which is still to be completed, is reform of the Commission's accounting system; to allow it to produce accruals based accounts.
The European Commission has indicated in a press release in December 2002 that it is going to move its own accounting system from a cash basis to a new accounting framework that will be based on International Public Sector Accounting Standards (IPSAS), including accrual accounting. IPSAS are developed by the Public Sector Committee of the International Federation of Accountants (IFAC) and are based on International Financial Reporting Standards (IFRS). The OECD (Organization for Economic Co-operation and Development) and NATO (North Atlantic Treaty Organization) have also adopted IPSAS for their financial reports.
The new Financial Regulation adopted the European Council in June 2002, sets the new legal framework for sound financial management of the EU Budget. This new law requires the European Commission to complete its shift to accrual accounting for its general accounts by 2005. The Commission began this phase of the modernization of its accounting system in 2000 with thorough independent analysis of the existing accounts system’s strengths and weaknesses. In 2002 the Commission detailed the further measures, which needed to be implemented to change the accounting framework and to modernize the information systems underpinning it. Given the complexities of such a move, implementing all measures up to 2005 was an ambitious target.
The general accounts of the EC are designed to monitor the budget execution. The commission has modernized the accounts to provide an accrual accounting system to complete the budget accounts with the request of the court of auditors and the recommendations of various international bodies such as the IFAC (International Federation of Accountants).
In the Financial Regulation applicable to the general budget of the European Communities Council Regulation5 art 124, in mentioned that the financial statements shall be drawn up in accordance with the generally accepted accounting principles, namely: going-concern basis, prudence, consistent accounting methods, comparability of information, materiality, no netting, reality over appearance and accrual-based accounting.
Accrual-based accounting principle is presented in article 125 of the Financial Regulation. The accrual-based accounting principle means that transactions and events shall be entered in the accounts when they occur and not when amounts are actually paid or recovered. They shall be booked to the financial years to which they relate. The accounting methods shall specify the obligating event for the entry of each transaction in the accounts.
In 2004 the state of reform in members of UE is presented in the follow table:
5 No 1605/2002 of 25 June 2002

100
State of reform in the nine members of UE 2004 Luder6: Government Level
1970/80s 1990s After 2000 Not started in 2004
Local CH, NL, S E, F, FIN, UK D, I National E, FIN, S, UK CH, F, EC D*, I, NL*
In March 2006 on IFAC website there were an article “ IPSAS adoption by
governments” with a list of countries that either have adopted or are in process of adopting IPSAS. Regarding EU member countries are presented the follow information: • France: Government changing to accrual basis. Applicable standards, in the
process of development, are based on International Financial Reporting Standards (IFRSs), IPSASs, and French accounting rules.
• Netherlands: Government is piloting adoption of IPSASs (accruals, with amendments where deemed necessary).
• UK already applies full accrual accounting standards and applies accounting standards that are broadly consistent with IPSAS requirements.
• Albania: Government plans to adopt IPSASs (accruals) with Italian government, United Nations Development Program, and World Bank support. (Target date: 2006)
• Hungary: European Union (EU) twinning project for accounting and other reform includes IPSASs.
• Slovakia: Planning to adopt IPSASs. • Latvia: EU twinning project for accounting and other reform includes IPSASs. • Lithuania: EU twinning project for accounting and other reform includes IPSASs. • Germany: In general7 the financial statements of the public sector in Germany
are still prepared under a cash basis of accounting, called "Kameralistik". At local level a number of States initiated programs establishing full accrual accounting for the local communities.
4. Accounting reform in EU Members countries: Hungary, Slovenia, and Czech Republic
4.1 Hungary
Hungary’s choice was to start the accounting system’s reform with two main components: moving to accrual accounting and adopting the GFSM 2001 framework. In 2004 a formal8 “migration path” from the GFSM 1986 framework to the GFSM 2001 framework has not yet been adopted. But, significant progress has been made to this effect in connection with the country’s accession to the European Union (EU):
6 Luder - Where are we now, Conference: Accruals Accounting in the Public Sector - Progress and Achievements - 27/09/2004, http://ec.europa.eu/budget/documents/reference_documents_accounting_en.htm 7 Vogelpoth N- Statement on how Germany has applied Standards for Accrual Accounting, www.pwcglobal.com 8 www.imf.org- 2004 International Monetary Fund July 2004 IMF Country Report No. 04/192, Hungary: Report on the Observance of Standards and Codes—Data Module—Substantive Update on Government Finance Statistics, Response by the Authorities, and Detailed Assessment Using the Data Quality Assessment Framework

101
• the coverage of legal government has been expanded to comply with the European System of Accounts 1995 definition of general government (and thereby with the GFSM 2001),
• accrual (cash adjusted) data is being compiled annually, • a balance sheet of non-financial assets is being prepared, • and balance sheets of financial assets and liabilities have been compiled
(including other economic flows). The Hungarian government is currently in the process of revising their
statistics to be consistent with European System of Accounts 1995 (ESA95) and the revised Government Finance Statistics (GFS).
The process9 of shifting Hungary’s balance of payments statistics to accrual accounting, consistent with the principles of the IMF’s Balance of Payments Manual-Fifth Edition (BPM5) began in 2004. Beginning with the 2004 quarterly data, income on financial assets is recorded on an accrual basis.
In the Hungarian Law on Public Finance Section 7 (2002) the budget is defined as “a financial plan and the related funds containing the allowed expenditure [...] in the budget period” So respecting the law, Hungarian budgets have to be prepared on the cash basis.
The current accounting system is somewhere between a modified cash-flow and modified accrual based system, although budget preparation and reporting is done on a strict cash-flow basis in line with GFS86. The annual budget and final accounts contain no statement of accounting basis, although the cash flow accounting basis is clearly specified in the Act on Public Finances (APF), the primary law governing the public sector.
The government produces two sets of budget accounts. One account is cash based using IMF GFS86 methodology (this account is used for the annual budget submission and budget management). In the past the OECD used an adjusted version of these accounts in its Economic Outlook database. More recently, the Hungarian authorities have implemented an accrual-based account using the European Commission’s ESA95 and developed a comprehensive and back-dated ESA95 account covering the period 1997 onwards.
In terms of classification, institutional sectors are generally defined in accordance with the System of National Accounts 1993 (and thereby with the GFSM 2001).
The budget execution data for central government and its sub sectors provide only summary data using a national classification. Only the annual budget execution contains tables for the economic classification of revenues and expenditures, and for the functional classification of expenditures, following GFSM 1986 classification guidelines 4.2. Slovenia
The modernization10 process of accounting system in Slovenia started in 1999 with the adoption of a new Accounting Act. In article 15 of the new Accounting Act were prescribed the use of cash accounting method for the
9 Report on the observance of standards and codes Hungary—data module: an update, April 2004, www.imf.org 10 Slovenia: Ministry of Finance: www.sigov.si

102
Slovenian public sector. In this sense has been introduced a uniform Chart of Accounts, for all direct budget users.
In the moving towards accrual accounting process, Slovenia followed a pragmatic11 approach with following and participating in debates on accrual accounting in the public sector. Officials stated that a switch to accrual accounting is less of a technical problem but rather an issue of “mentality” with users of accounting information.
A 1995 government resolution12 required the introduction of uniform accounting software for all direct budget users as a basis for a unified accounting system. This software was introduced in 1998 and has been rolled out to about 4000 users. The software is designed to disallow entries by direct budget users if they would result in expenditures in excess of authorized amounts.
The government organized a lot of training courses for accountants of public sector in order to enhance them skills. Also, the government founded the Center of Excellence in Finance, which offers a two-year certified public accountant program with support from international donors and accreditation by a London-based institution. A special training activity was organized for public sector employees with lower entry qualifications.
Slovenia preferred a gradually approach for the passage over to accrual accounting.Now, accrual accounting is implemented for all budget users, except for four state treasuries of public finance (state budget, local budgets, pension and disability fund, health fund) who apply cash accounting. A disadvantage of the use of different accounting systems represents delays in the preparation of financial statements and their quality also suffers.
The basic conditions for introduction an unified accounting system for budget and all budget users are13: connecting accounting and budget preparation, understanding of accounting rules, political obligation and stability, more stress on controlling results over inputs, more education and training for all accounting workers, adapting IT. For connecting accounting and budget preparation is needed a wider analysis of all public revenues, more stress on controlling results over inputs suppose the moving from traditional towards ‘results orientated budget’, more education and training for all accounting workers implies acquiring certificate of certified accountants for public sector and adapting IT means adapting of current software and expansion of current software to local level. 4.3. Czech Republic
In Czech Republic all public entities use the double entry accounting system. In follow table there is a synthesis of transition from cash accounting to accrual accounting in Czech Republic14 public sector as it was planned in 2000 year.
11 www.oecd.org- When and how into accrual accounting in public finance , OECD-CESEE meeting of Senior Budget Officials of Central, Eastern and South Eastern European countries, Lublijana, Slovenia 2006 12 Kraan D J, Wehner J- Budgeting in Slovenia, OECD Journal on Budgeting Volume 4 – No. 4,2005 13 Safranek Z- Accruals Accounting in the public sector, www.oecd.org, OECD-CESEE meeting of Senior Budget Officials of Central, Eastern and South Eastern European countries, Lublijana, Slovenia 2006 14 Accounting Treatment Public Private Partnership Guidance Note 14, 14 April 2000 Department of the Environment and Local Government www.mfcr.cz

103
Accounting System Pre 1999 Pre 2002 Post 2002 National accounts Cash/Accruals Accruals Accruals Governmental Accounts Cash Cash Cash Local Authority Accounts Cash Cash/Accruals Accruals
National Accounts are prepared using the accrual basis in concordance with European System of National and Regional Accounts ("ESA95") that came into effect in 1999.
The reports submitted to the European Commission are compiled on a National Accounts basis. The accruals basis applies to all flows, monetary and non-monetary, intra-unit as well as between units with a single exception in relation to certain taxation transactions.
The Government Accounts are prepared under the cash basis and report the overall surplus or deficit generated during the year. The Government Accounts also report the movement in the National Debt for the year.
For Local Authority Accounts, the cash basis is generally used to account. Local authorities do not currently use the accruals system of accounting so no estimates of amounts outstanding at the end of each financial year are prepared. Local authorities do not prepare a balance sheet and therefore assets and liabilities are not recorded separately. Instead only actual capital expenditure during the accounting period is recorded in the accounts of local authorities.
In compliance with ESA9515 reporting requirements, the Czech Statistical Office (CSO) has been providing annual non-financial data and the financial accounts for the general government to Eurostat since 1993. Beginning in 2004, the CSO has started providing quarterly data to Eurostat. As regards the fiscal data provided to the IMF, progress continues to be made in migrating from the 1986 cash-based Manual on Government Finance Statistics 1986 (GFSM 1986)— which is consistent with the national definition—to the 2001 accrual-based Government Finance Statistics Manual (GFSM 2001)—which is compatible with ESA95 standards.
Beginning with the 2004 annual data, the presentation are shifted to that of GFSM 2001 and the data were reported initially on a mixed cash-accrual basis, gradually moving to accrual reporting according to bridge tables already in place.
The differences in the coverage of “general” government under the national GFSM 1986 methodology and the ESA95 and GFSM 2001 methodologies, the use of cash (the national definition and GFSM 1986) versus accrual accounting (ESA95 and GFSM 2001), and the uneven frequency and timeliness of data have contributed to difficulties in interpreting and assessing fiscal developments and targets. About the application of accruals principle in the Czech accounting system, Mr.Safranek16 said that in 2004 Czech Republic does not apply the accruals accounting principle to the full extent but discloses cash flows, therefore receipts and expenditures are classified by means of budgetary items. However, the
15 www.mfcr.cz, www.2004mfcr.cz Czech Republic: Ministry of Finance 16 Safranek Z- The application of accruals principle in the Czech accounting system within the scope of public finance reform, Introducing accrual accounting: Czech Republic situation, http://ec.europa.eu/budget/documents/reference_documents_accounting_en.htm

104
organizational branches of the state funds and municipalities follow the movement of cash flows; they do not apply the accruals accounting principle.
The receipts and expenditures from the state budget, budget of the state funds and budget of municipalities are classified according to budget pattern.
On of the reasons of deleing the movement to accrual accounting it seem to be the lot of advantages that are attached to actual cash accounting system. Safranek17 mention them: the cash flows are directly linked to the state budget compilation, budgets of the state funds and budgets of the municipalities, well-established summarization of both approved budgets, modified budges and the real drawings of cash flows, the actual system and knowledge of it gives users a very good overview about the information that was put into the system. Like disadvantages he mentioned: the economical actions are not recognized in time and do not reflect factual relationship, there is no actual overview of assets and liabilities, expenses and revenues, difficulties with the compilation of the main government treasury account.
An impact analysis18 of the implementation of the accruals accounting principle into the Czech accounting system at all levels identified some problems regarding: • explicit determination of expenses and revenues with the link to receipts and
expenditures of organizational branches of the state, state funds and municipalities, particularly in the area, where the state plays a unique role, for example state guaranties and tax collection etc.
• valuation of property at cost, of national listed buildings, of receivables and liabilities especially regarding non-monetary restitution cause or lawsuit and determination of the moment of the expense and revenue recognition.
• risks: budgetary impact that is not easy to determine, unclarified basic terms for the public sector and as has been already mentioned and political unwillingness including the fear of unpopular actions.
• financial impact on the state budget including minimizing financial expenses resulting from this transition.
Czech Republic has choused to realize the full implementation of accruals accounting, but the transition to accruals accounting will be realized into several steps, in time.
The first step consists in creating the legal framework, the preparation of certain laws regarding economical framework of the organizational branches of the state, state funds and municipalities. A second step consists in the preparation of the legal base for the implementation of accruals accounting for these accounting entities.
It was identified that more than 30 laws19 and decrees will need to be amended for introducing accrual accounting system in Czech public sector. Step by step implementation of the changes will require a long period of time and steps that would minimize total impact on the economy of the state.
17 idem 13 18 idem 17 19 idem 17

105
5. Acceding countries Bulgaria and Romania
5.1. Bulgaria In recent years20, following the recommendations of international
organizations and within the framework of reporting requirements for EU accession, the authorities have made great progress on the implementation of accrual accounting for government, budgetary and statistical systems.
Consolidated data on central government operations were reported on a cash basis for the years 2003, 2004. These data do not conform to GFS standards and not published in a bulletin format, they are posted on the Ministry of Finance’s website.
The authorities have made progress in presenting data on a disaggregated basis, including expenditure by functional classification. In addition, a full economic classification of expenditure is now available, and the authorities have provided such data on an annual basis back to 1998.
A new Accounting Law for the budget sector has been established, with implementation from 2001, with a new unified chart of accounts for the budget sector. It allows consolidated reporting on an accrual basis, production of reliable reports and enhanced control on budget execution. The principles and rules for classification of assets, liabilities, revenues and expenditures comply with the IMF Government Financial Statistics (GFS), the UN System of National Accounts (SNA 93) and the European System of National and Regional Accounts (ESA 95). A Manual on the new budgetary chart of accounts has been worked out in 2001.
The new Accounting Law point out that the financial statements will be drawn up in accordance with the generally accepted accounting principles, namely: going-concern basis, prudence, consistent accounting methods, comparability of information, materiality, no netting, reality over appearance and accrual-based accounting. Also it is required that the operations must have a good documentary background.
The structure of the chart of accounts was discussed and agreed with advisors form the European Commission, SIGMA and the IMF technical support missions.
Budgetary entities are obliged21 to use the approved chart of accounts and accounting standards. Ministry of Finance instructed budgetary entities to transform not later than 15.11.2001 the accounting data as of 30.09.2001, and to start to apply the new chart of accounts. A Manual and a bridge table for transforming the accounts were prepared to help the transition to the new chart of accounts22. The Manual contents the basic concepts, principles and approach in the new chart of accounts for budgetary entities, as well as to underline the new issues and changes in the new budget accounting practice. Provision of financial information for the purpose of macroeconomic and fiscal analysis is accentuated, this being a requirement of the main users of financial information on the public sector.
The above accounting framework was chosen to facilitate the harmonization and coordination of public sector reporting data with those from the other three macro-statistics sources: the SNA, the monetary statistics of the
20 Ministry of Finance of the Republic of Bulgaria www.minfin.government.bg 21 Paragraph 44 of the Transitional and Final Regulations of the State Budget Law for 2001 and instruction of the Ministry of Finance № 07/09.02.2001 22 they were published in “The Budget” magazine, No.3 and 5 of 2001 - an official MoF publication

106
banking system and the balance of payment. Another reason for the choice made was the need to comply with certain requirements during the pre-accession period, such as public sector economic indices - budget deficit, level of indebtedness etc., estimated under ESA 95 methodology. Those are the indices the public sector accounting and statistics has to be focused on.
The unified budget classification has been preserved in the meanwhile for cash based accounting of the public sector, in view of legally regulated practice to prepare and report execution of the State budget, the local and autonomous budgets and the extra-budget funds and accounts on a cash basis, as well as to provide public finances information for international organizations on a cash basis.
The new legal framework stipulates the common application of the accounting rules in public sector, so that the necessary accounting information on an accrual and cash basis is consolidated in the Ministry of Finance for the needs of the macroeconomic management and analysis. What was achieved up to date was only the first step in the process of modernization of the reporting and accounting systems in the public sector in Bulgaria.
Further on standards and instructions are to be developed and applied in practice, and this is connected with hard work in the future. This, together with the rest of the elements of the large-scale reform of the management and control of the public finances, will contribute to better transparency and effectiveness of the budget management. 5.2. Romania
Till 2006 financial accounting was officially done solely on a cash basis. On of the main problem of the cash based accounting system was non-providence of the extent of unpaid bills (arrears). Local governments were constrained by the requirements of having balanced budgets, and as a consequence, they tend to roll over hidden debts in their books from one year to the next.
The Law of Accounting23 gives the Ministry of Public Finances wide regulatory authority to issue guidelines on drawing up accounts. Monthly, quarterly and annual budget execution reports are currently issued.
An important problem of Romanian public accounting system was the widespread of manual bookkeeping at local government level, especially at rural communities, which made the accounting process totally not efficient. At villages, the accountants were not prepared for an automated accounting process and they were without specialized assistance. In these conditions, MFP preferred not to be direct implied in software acquisition of the accounting process. Instead of acquisition of a unique national system for all users, each village bought separate accounting soft wares with or not modules for assets administration, salaries and budget execution.
In 2002, government decided to move accounting to a parallel cash and accrual basis. The addition of a full accrual basis started with pilot programs in 2003. There were 13 line agencies that are engaged in pilot testing and the development of accruals and are benefiting from a twinning project with France and Italy.
One of the main parts of the plan to introduce accruals was focused on training organized by MFP. But the training program was not an efficient one since the training was based on the vary project versions, not the final, approved one.
23 Ministry of Public Finances www.mfinante.ro

107
Head accountants have been trained first and training was planed to cascade down the ranks of government employees.
As a whole, the accounting of the public sector in Romania is based on the same fundamental and conventional accounting principles and rules /accrual basis, substance over form principle, valuation and recognition rules etc./ that underlie the national accounting legislation as well as the International Accounting Standards. So the common accounting legislation of Romania is applied with the budgetary entities as much as possible. That is why the structure of the accounts is as close to that in the National Chart of Accounts as possible.
Romania choused to move to accrual based system in a single step for all public entities.
The team reviewing24 Romania views the move to accrual-based accounting as positive but with a great deal of caution. The benefits of moving to a system of financial reports generated on an accrual basis are well documented. Implementing full accrual accounting will improve transparency and accountability by providing a more comprehensive picture of the government’s assets and liabilities and showing an annual fiscal result that better reflects the impact of economic events and government decisions during the fiscal year. It should help with many areas that are currently lacking or need improvement. Reporting and monitoring on an accrual basis for capital assets, tax revenues, contingent liabilities and long-term liabilities – all areas that need upgrading in the Romanian context – should be improved.
Yet, there are many challenges that Romania will face in implementing accruals and experience in OECD countries is informative. First, the move to accruals25 is projected to be complete within three years. This is an extremely ambitious goal, as the few OECD countries that have completed this process have taken longer to move to full accruals. In fact, a recent OECD survey shows that only seven out of 30 OECD member countries have thus far adopted full accrual accounting, and 21 uses only or mostly cash accounting for whole-of government financial statements.
The assembling of a complete asset record – like that which Romania is currently undertaking – is one area that countries found took much longer than expected and slowed down the process.
Analyzing the movement to accrual accounting system in Romania we can conclude that: • it requires an entirely new set of skills in many cases for the people who are
working on accounting issues for government. • is a costly and difficult process, more if it is in the same time with other reforms
regarding budget processes and organizational structures. • it is hard to manage at entities level, where there were many changes and
public servants must learn new rules about accounting, new rules about budgeting new rules about organizations.
Interviewing public sector accountants we found that it is a fear about the new accounting system, a misunderstanding about why the changes needed to
24 Ruffner M, Wehner J, Witt M- Budgeting in Romania, OECD Journal on budgeting – Volume 4 – No. 4,2005 25 idem 25

108
occur now. They are sure that the move to accrual accounting was a requirement for EU accession.
Knowing that accrual accounting is an area where there are still large international debates on the appropriate method, with many interpretations and decisions on accounting concepts we are questioning if it was the better decision to make the movement through accrual accounting in such a short period.
Given26 the state of the system and the costs of the changeover, it may be appropriate to slow down the move to accruals. There are ways to continue the drive to accruals such as implementation in those areas, which have the most benefit in terms of effective management and increased transparency compared to the costs involved. 6. Croatia -candidate country
Croatia27 used cash based accounting until 2001, but in 2002 moved to a modified accrual basis (the budget remains on a cash basis). For the modified accrual accounts expenses are registered at the time a commitment is made and revenue records are based on financial income in the reporting period. The end-of-year financial statements28 are required to be presented on a modified accrual basis. The long-term objective of the Government is to move to full accrual accounting. Ministry of Finance officials note that the move to modified accruals has brought benefits, in particular an improvement in the control of arrears accumulated by budget users. But the transition has not been without difficulties, partly due to a lack of prerequisite accounting skills amongst some budget users. Moreover, the accounting system is fragmented. Budget users frequently operate different systems for different types of expenditures, which make the preparation of financial statements cumbersome and vulnerable to errors. The Supreme Audit Office notes that the number of errors in the submitted accounts has decreased over the past three years, although it still picks up and reports individual cases where expenses are recorded on a cash basis. End-of-year budget reporting to Parliament remains mainly on a cash basis. The Budget Act does not clearly distinguish between the different end-of-year reports. The act outlines the process for the compilation of a report on budget execution, which is referred to as the ‘annual statement of budget accounts’ (articles 124-128). The deficits of the consolidated central and general governments will be defined on a modified accrual basis, with cash data corrected for changes in outstanding stock of central and local government arrears and commitment based spending reported for HAC and HC. The national accounts have undergone substantial improvements in the last few years. The Central Bureau of Statistics (CBS) publishes constant and current price data compiled in accordance with the 1995 ESA. Other shortcomings include: inadequate conversion of government finance statistics from cash to accrual basis; and the late publication of annual data, which generally show large differences with quarterly data. The summary methodology on national accounts on the IMF’s DSBB was last updated in July 2003.
26 idem 25. 27 Republic of Croatia Ministry of Finance www.mfin.ht 28 2003 Budget Act art. 121 and the Decree on Budget Accounting

109
7. Albania - possible candidate country An organic budget law 837929 regulates currently the Albanian budgetary
process. In 2001, a detailed economic classification scheme was incorporated within the existing functional classification scheme. Expenditures and revenues are classified in terms of functional and economic classification. The standard adopted for the functional classification is the IMF and GFS standard. A New Organic Budget Law (NOBL) is in preparation since 2003, with the assistance of a British DFID30. This new law should be finalized in June 2006, in order to be implemented in 2007, but it could also be postponed to next year. So one of the main issues of the reform of public accounting law is to articulate its dispositions with the NOBL, which is supposed to cover the majority of public accounting and budgeting, but not the all the legal accounting aspects.
The budgetary institutions use the accrual modified accounting system and provide, at the end of the year, a balance sheet in which all budgetary and non budgetary operation are included, a performance accounts, a Cash-Flow Statement and notes. The Treasury Department adopted the cash basis system as an instrument to manage and control the cash flow, so reconciliation has to be made annually between Accounting Department data and Treasury department cash flows. After June 2006, the five Financial Statements (Balance Sheet, Performance Statement, Cash- Flow Statement, Reserve Statement and Notes) will be produced following GFS- IMF Statistical model.
Currently accounting is realized by the different governmental entities, and transmitted every year to the Department of Accounting. A double-entry system is used, but generally speaking, accounting is made manually, except in some 9 local tax offices. The unified accounting software does not exist. Generally accounting is currently made on a cash basis, except that it takes accruals into consideration at consolidated level, and it has began to migrate towards accrual-modified system. For instance, construction, material and equipment are registered as capital expenditures for Budget purpose, and then transferred to Fixed Assets and depreciated.
The World Bank31 has started to finance the implementation of a new integrated financial system (Oracle-Financials) for public budgeting and accounting in Albania. At the moment, the World Bank is carrying out a project aimed at providing all the 36 local structures of the Treasury Department with software and hardware instruments suitable to collect manage and share their accounting data. As soon as the IT system developed under Oracle through a World Bank funded project, every governmental entity will be in position to make it’s accounting online, and to transmit it to the Accounting Department, which has been placed under the responsibility of the Treasury Department. This new IT system will cover most of the budgeting and accounting aspects: Budgeting, Treasury, Fixed Assets, Financial Statements, Procurement, Revenue and Cash management, Accounting, financial reporting. Inventory management is not included in the Oracle system. This project was planned to be concluded by December 2006.
29 enacted on 29th July 1998 30 Project SPEM: Strengthening Public Expenditure Management, by REPIM at PPFI – February 2003. 31 www.unpd.org E-accounting project for Albania

110
Conclusions Before 1999, all European governments have kept their accounts on a
cash basis, with cash revenues and expenditures. From 1999 on, EU countries are required to report their deficits on an accrual basis for Maastricht purposes. In the same period a number of OECD countries have shifted to accrual accounting. Moreover, the Public Sector Committee of the International Federation of Accountants (IFAC) has developed standards for public sector accounting and reporting based on accrual system, which will further enhance their comparability.
Only few countries -New Zealand, Iceland, and Australia- have actually made the shift to accrual accounting. The majority of countries adopt the practice of adjusting their cash (“administrative”) accounts for the main discrepancies between the two systems by using some compilation tables. Typically these include the addition of payments due and noncash outlays, changes in accounts receivable, and timing adjustments, but not depreciation. Most European countries continue to have cash accounting but are nonetheless required to report the deficit as if it were measured on an accrual basis.
The Commission introduced accrual accounts in 2005 and by January 2010 the entire United Nations system would adopt IPSAS based on accrual accounting, so the future of public sector accounting is established, will be accrual accounting ? Can we discuss about a common accrual accounting standards for public sector? No32 supra-national body can impose accounting standards. The Commission has no power to do so in the EU. Fortunately, the IFAC Public Sector Committee has provided an indispensable basis for all moves to accrual accounting through its IPSAS. These are essential to the development and strengthening of financial reporting by governments. However, as they have been developed from standards applying to the private sector, further standards are needed to resolve issues peculiar to the public sector, such as provisions for claims under grant schemes, pension liabilities, and tax revenues. The Commission will support this work. We must recognize that the movement to accrual accounting gives the reader of the accounts more transparency and more disclosure of the state's assets and liabilities, and implicit more credibility to government accounts.
In analyzed countries, we can conclude that each country had made and continue to make steps through accrual accounting system in public sector. There are differences but also similarities between countries regarding the approach of reform. Like example, some of them preferred to move from cash to accrual in a single step, in a short period (Romania), other preferred a step-by-step approach in a medium period of time (Czech Republic). Like similarities we can mention the Public Chart of Accounts (Romania, Bulgaria, Albania). For the economic classification, a single Chart of Accounts is utilized for the whole public sector, which is inspired from the French Public Chart of accounts, with 9 classes of accounts, from 1 to 7 (1-Reserve-2-Fixed Assets – 3- Inventories – 4- Debtors and Creditors – 5- Treasury – 6 –Charges – 7-Incomes– 8 –Result -9- Analytical). There is also a budgetary institutional classification in which the subjects involved in the management of expenditures and revenues are distinguished. The Treasury manages expenditures and revenues according to this classification. This Chart of accounts has to be reviewed in order to be in line with IPSAS, but also to correspond to the budgetary needs.
32 www.imf.org- Cash versus accrual: The basis for government accounting, 2000

111
We consider that all analyzed countries performed or will perform some needed steps for moving to accrual accounting, to IPSAS: • the translation of IPSAS into national language, • the adaptation of national accounting standards on the IPSAS’ basis, with important
impact on the accounting policies and on the asset and liabilities management. • a comprehensive chart of account must be modified in order to be compliant with
the new principles and the relevant new approaches to financial information. • training and dissemination • production of training and learning material.
Indifferent in what stage of movement to accrual is a country, it is important to analysis the impact, to evaluate the risks, financial cost minimization, preparation of the legislation. The impact analyze on current accounting policies and procedures should be focused on: • further analysis of the current national accounting regulations and standards; • full evaluation study and preparation of the implementation of the public
accounts in compliance with IPSAS, including new chart of account and public accounting manual;
• analysis of macro processes (long-term planning, financial planning, management, and control);
• drafting of an accounting manual for the implementation of the National Accounting Standards in compliance with IPSAS.
For candidate countries, it is important to check if them public accounting law has the following characters33: • be as short as possible and do not overlap IPSAS, public sector standards
General Accounting Law or other Laws, regulation and standards, but complete their perimeter if necessary
• make explicit reference to the progressive migration to public standards based upon IPSAS from IFAC
• be coherent and complementary with Budget Law and complete it • be conform with International standards, such as GFS, IMF, IFRS and IPSAS
and prepare the progressive migration towards them, • correspond to the needs of the Treasury and the Accounting Departments, • be in conformity with the policy of EU on accounting and the “acquis
communautaire”, • facilitate the implementation, the notification and the parametrising of the
integrated budgeting software, • define clearly the tasks, the responsibility and the organization of public
officers and accountants, • permit a proper reporting to the Treasury Department, the government and the
Parliament. The movement to accrual accounting present a lot of advantages
mentioned before, but implies also some disadvantages in implementation of the accruals accounting principle that were anticipate, particularly: costly implementation, increase of assets valuation cost, fear from the change of the current system and fear for the unknown by users.
33 www.unpd.org E-accounting project for Albania

112
From our analyzed countries, Romania was too determined: one step for all in a too short period. As international experts34 said: Romania is starting an ambitious move to accrual accounting. This move should be reassessed and slowed down to a more realistic timeline and more attention should be given to basic processes and automation of the current system.
That implementation of accruals principle have impact on the fair view of economic and financial operations, on preparation of annual accounts including disclosure and control of cash flows. Only the future will validate or not these decisions about movement from cash accounting to accrual accounting in public sector in Romania, In Europe and all over the world. REFERENCES
Carlin T. M. and Guthrie J. (2000) - A Review of Australian and New Zealand Experiences with Accrual Output Based Budgeting, Third Bi-annual Conference of the International Public Management Network, Sydney, Australia, pp 103 -142;
Chan J. L. (2003) - Government Accounting: An Assessment of Theory, Purposes and Standards,
Public Money & Management Review 27 (2), pp 34 - 45 ; Guthrie J. (1998) - Accrual Accounting in the Australian Public Sector Financial Accountability and
Management, Hepworth, N. (2003) Preconditions for Successful Implementation of Accrual Accounting in Central Government, Public Money & Management Review 23(1), pp 37 - 43;
King N., Beattie A., Cristescu A.M., Weetman P. (2001) - Developing accounting and audit in a
transition economy: the Romanian Experience, Accounting, Auditing and Accountability Journal, 23 (2) pp. 28-51;
Likierman A. (1992) - Financial Reporting in the Public Sector in Public Sector Accounting and Financial
Control, Edited by Sir Douglas Henley, Clive Holtman, Chapman & Hall; IFAC- Study 14, December 2003, Transition to the Accrual Basis of Accounting: Guidance for
Governments and Government Entities (Second Edition) www.ifac.org Kraan D J, Wehner J (2005)- Budgeting in Slovenia, OECD Journal on Budgeting Volume 4 – No. 4. McKendrick J. (2003) - Modernisation of the Public Accounting Systems in Central and Eastern Europe
Countries – the case of Romania 9th CIGAR Conference, Bodo, Norway, pp 52 -76 ; OECD/SIGMA (2001) - Managing Public Expenditure - a reference book for transition countries Edited
by Richard Allen and Daniel Tommasi OECD/SIGMA; Richard J. (1995) - The evolution of the Romanian and Russian accounting charts after the collapse of
the communist system, The European Accounting Review, no. 4,pp 17-31; Richard J. (1998) - Accounting for Eastern Europe: from communism to capitalism, International
Accounting, Edited by Walton P., Haller A., Raffournier B., International Thomson Business Press;
Ruffner M, Wehner J, Witt M (2005)- Budgeting in Romania, OECD Journal on budgeting – Volume 4,
No. 4
34 Ruffner M, Wehner J, Witt M- Budgeting in Romania, OECD Journal on budgeting – volume 4 – no. 4, 2005

113
Guide for authors
The articles can be written in English, French or German. Before being accepted for publication, the articles must be sent in two copies printed on paper and on a CD (Word only) on the address:
Studia Oeconomica 58-60 Teodor Mihali street, room 231
400591 Cluj-Napoca, Romania
In the first stage, before being accepted for publication, the articles will be presented in the following way: (1) The text: between 10 and 20 printed pages, numbered, recto only, A4 format,
all margins 2 cm, characters Arial 11, and spacing 1.5. (2) The first page (which will be eliminated in order to make the evaluation, by one
of the Advisory Board members, anonymous) must contain the title of the article, the author’s name, his/her complete coordinates (professional address, phone, e-mail) and potential thanks for the technical and/or the financial help. The title must be precise, clear and in agreement with the main theme of the text. The authors must make sure that they cannot be identified when reading the manuscript.
(3) The second page will contain the title of the article and an abstract (in English)
of 5-10 lines, that should present the main results of the article. The summary must inform the reader about the content of the article. The summary must be followed by the JEL Classification and by 3-6 keywords in English which define best the article.
(4) The text will start properly on page 3. (5) In the introduction, the author must present the relevance of the article for the
respective field and must quote the main results obtained by other authors concerning the subject. The conclusions must summarize clearly the results and the consequences.
(6) The presentation of the bibliographical references: - In the text the references quotes will appear between brackets, with the name
and the publication date, e.g.: (Denicolo, 2000). - For two co-authors they will use for example (Dixit & Stiglitz, 1977). - In the case of three or more than three authors, only the first will be mentioned,
under the form (Brooks & al, 1998). - If two references have the same author and the same publication year, they
will be differentiated through letters (McFadden, 1984a). These letters will also appear in the bibliography.

114
At the end of the article the references will be presented as follows: Periodicals: The list of the authors including the first name initial with bold characters, the year of publication, the title of the article between inverted comas, the name of the periodical without abbreviations in italics, the number of the volume, the month of publication and the number of pages. Ex: Wojcik C., (2000), “Alternative Models of Demand for Automobiles”, Economics
Letters, vol.68, no.2, Aug., p.113-118 Books: The list of authors including the first name initial and the year of publication with bold characters , the title of the book without abbreviations, the publishing house, the place of publication. Ex: Biswas T., (1997), Decision-making under Uncertainty, Macmillan Press, London Quotes of personal works: If the author wants to make reference to one or several personal works, it is essential that the used formulation preserve his anonymity. In the first sent version, before being accepted for publication, if the quotation of a personal work is absolutely necessary, the author may use the formulation (author, 2001) both in the text and in the bibliography. The bibliographical references will be completed after the article is accepted for publication. (7) After the article is accepted for publication, the final and complete version of
the article must be sent on a CD or by e-mail. The article will be written in Microsoft Word.
(8) Studia Oeconomica requires the exclusivity of the article. The same article
mustn’t be proposed simultaneously to other journals.