education, worker productivity, and income distribution...
TRANSCRIPT

Education, Worker Productivity, and Income Distribution in China
Team
Belton M. Fleisher
Department of Economics, Ohio State University
James J. Heckman
Department of Economics, University of Chicago
Yifan Hu
School of Economics and Business, University of Hong Kong
Haizheng Li
School of Economics, Georgia Institute of Technology
Shi Li
y of Social SciencesChinese Academ
Xiaojun Wang
ics, University of Hawaii at Manoa Department of Econom
Heng-fu Zou
The World Bank

1
1. Introduction
e propose that a basic cause of high and rising regional income inequality in
China is attributable to underinvestment a
education th
bias, regional favoritism
those with the most to gain to attain higher educational attainment. If not, then the
W
nd to misallocation of investment in higher
at is both an effect and a cause of low incomes in the relatively
disadvantaged areas and provinces of China. In the early years of its economic reform in
the late 1970s through the end of the 1980s, regional inequality as measured by the
coefficient of variation of provincial per-capita income fell from nearly unity to
approximately 0.6. Since then, the trend has reversed so that by the year 2001, this
measure of regional inequality stood at 0.76 (Chen and Fleisher, 1996, Chang, 2002).
This rising inequality in part reflects the relaxation of income equalizing policies that
characterized regulated wage grids under central planning (Fleisher, Sabirianova, and
Wang, 2004), but that is clearly not the entire story. According to Yang (1999), China in
the late 1990a surpassed almost all countries in the world for which data are available in
rising income inequality, and by the year 2000 China found itself with one of the highest
degrees of income inequality in the world (Yang, 2002).
Rising income inequality has been assigned a number of causes including urban
, and corruption in the reform process. Fleisher and Chen (1997)
found that China’s high and rising regional income inequality reflected a wide, and
perhaps growing, dispersion of labor and total-factor productivity which, in turn, they
attribute to regional inequality of investment in higher education. Evidence of
underinvestment in human capital, particularly at the higher-education end has been
corroborated in research by Fleisher and Wang (2001, 2003 and 2004). Heckman (2004)
shows that expenditure on higher education in China remains characterized by extreme
regional inequality and that there is a serious imbalance between investment in physical
and human capital. In the past decade, total expenditure on higher education in China has
grown rapidly and the contribution of private expenditures has outpaced the growth of
government expenditures (Zhang, Zhao, Park, and Song, 2005). A critical question,
though is whether this change in mix of support for higher education has encouraged

2
educational resources may be allocated inefficiently, and income inequality may be
estimate the effect of education on m
irect
education on productivity. In perfectly f
China’s labor markets and the degree of competition among firms. The deliverable
exacerbated if the poorest segment of the population who may benefit significantly from
more schooling is excluded.
Given the extent of educational achievement, another important question is
whether pay gains match productivity gains attributable to more schooling.. We will
arginal productivity of labor and investigate the
extent to which incomplete labor markets have so far failed to fully reward higher levels
of schooling, which discourages private investment in education. Moreover, to the
extent that higher education is subsidized with public funds, these expenditures are biased
in favor of high-income regions, so that in the presence of imperfect and incomplete
credit markets for investment in human capital, regional income and productivity gaps
are exacerbated. We will measure the social return to education in production, both d
and through spillover effects on other firms or enterprises. These estimates will yield
very useful results in at least three areas. First, by comparing private and social returns to
education, we gain important insight on the development of China’s labor market.
Secondly, the estimated returns will provide a base from which to study the private
demand for education and how it is affected by perceived returns to schooling and by
uncertainty and borrowing constraints. The results will provide a sound basis for policy
recommendations for government policies on education, including the regional
distribution of funds. The information will help to evaluate educational policies that can
be used to reduce regional income disparity in China through investment in human
capital.
A distinguishing feature of our proposal is that we study the effects of education
from two aspects: (1) the effect of education on individual earnings; (2) the effect of
unctioning market economics, these two effects
are closely related, although not necessarily equal. However, in China’s transition
economy they are likely to diverge significantly (Fleisher and Chen, 1997, Fleisher and
Wang, 2001, Fleisher and Wang, 2003) in large part due to barriers and restrictions in

3
output will highlight how the returns to schooling in terms of income reflects the
vide
estimate of the impact of higher education on income and
both aggregate and disaggregate data, across
ross various ownership types consistently
e effects of a growing premium for educated workers, families at
lower end of the income distribution face the double constraint of inadequate credit and
efficiency of the current educational funding system and the degree to which it
approaches the return in production. We will estimate the treatment effect of adding
more college-trained workers to the labor force across regions with an emphasis on
identification of any misallocation of educational and labor resources. We will pro
these estimates for urban areas according to geographical, economic, and political
characteristics. The impact of current policy on productivity and income distribution will
be addressed. Policy recommendations for improving the allocation of educational
expenditures, the efficiency of labor markets, and their impact on income inequality will
be provided.
2. Background
We do not have a single ‘best’
production in China, but evidence from
regions, across rural and urban sectors, and ac
supports the hypothesis that its impact on production is significant and substantial. What
are the likely sources of this relationship? They are to be found in the myriad ways that
highly-skilled and talented individuals increase productivity both directly and indirectly
through the allocation of resources and adopting and adapting new technology as cited
widely in the growth literature. Although China under Communist planning largely
eliminated illiteracy and achieved a high level of primary-school graduation, public
support of investment in higher education lagged seriously during and after the Cultural
Revolution, and China trailed other countries at comparable stages of development (Table
1 and Table 2).
There is recent evidence that the relative scarcity of college graduates has begun
to pay off in terms of earnings; these higher relative earnings may now be providing
greater incentives for people to obtain higher education. However offsetting the
increasing incentiv

4
rising schooling fees, which exacerbates China’s widening income gap. In the past
ns
cause and ad
n in
ost advanced methods available.
decade, China has vastly expanded expenditures on education overall but still lags its
counterparts in terms of proportion of GDP spent (Table 3 and Table 4).
Moreover, a critical aspect of China’s policies toward higher education has been
inappropriate. Educational expenditures have been disproportionately directed toward
areas where the rate of return is relatively low, and this has important policy implicatio
for efforts to promote economic growth and to reduce regional income inequality through
encouragement of investment in physical capital (Table 5). These expenditures partially
ditionally reinforce a gross inequality of the regional allocation of educated
persons (Tables 6-8). Moreover, they reinforce regional differences in labor productivity
that are exacerbated by restrictions on labor migration and the difficulties that migrants
face in obtaining public support for education. Although national and local laws require
that the municipality of residence (whether or not one’s hukou grants permanent
residence rights) is responsible for providing nine years of primary schooling for each
child., in practice this right is often denied. The result is that migrant families must pay
fees ranging from 3,000 to 30,000 yuan per year per child to have their children admitted
to the regular school system or cooperate with other migrant families in providing their
own schools and teachers. Even so, newspapers often contain reports of migrant schools
being torn down by public authorities on grounds that they provide inferior schooling or
are safety hazards (which are probably true claims; see e.g., Xie, 1999). Obviously, their
access to schooling at the secondary level and beyond is subject to even greater
restrictions.
3. Research Plan
3.1 Methodology
We will conduct a comprehensive investigation of the effects of educatio
China on production and on personal income, using both firm level survey data and
household survey data, using the m

5
First, we will estimate private (individual) returns to education based on
e will identify the average treatment effect of education by
allowing for heterogeneous returns among indi
their personal characteristics
constraints following Heckm an
individual earnings. W
viduals selecting into schooling based on
and perceived returns. This will be done using a semi-
parametric framework that accounts for heterogeneity, selection, and for funding
an and Li (2004) and Carneiro, Hansen, and Heckm
(2003). These estimates will be compared with conventional approaches (ordinary least
squares estimation or instrumental variable estimation) which do not account for
heterogeneity in returns on which individuals select into schooling. We will utilize
information regarding regional and over-time variation in public expenditure on
education to identify the effects of funding constraints on schooling choices. We will
show the extent to which changes in educational funding and increased reliance on
private financing of higher education have increased or reduced the efficiency of the
allocation of educational resources in China.
3.1.1 Individual Returns to Schooling. Our method takes into account both
heterogeneous returns to schooling and self-selection based on anticipated returns. We
first estimate the marginal treatment effect (MTE) in the sample, which is the building
block of other parameters of interest. The marginal treatment effect and its derivatives
estimated using the method developed in Heckm
are
an, Ichimura, Todd, and Smith (1998).i, ii
nschooled state (0). Y is income, X is observed heterogeneity, and U is unobserved
heterogeneity in wage determination. In general, the functional forms can have a
onlinear component, and .
We set up the following model of wage determination by schooling choice:
( )( )
1 1 1
0 0 0
ln ,
ln ,
Y X U
Y X U
m
m
=
=
where a subscript indicates whether the individual is in the schooled state (1) or the
u
1 0U U¹n

6
The schooling choice comes from the following latent dependent model:
( )*
*1 0
s sS Z U
S if S
m= -
= ³
where S* is a latent variable valu whose e is determined by an observable component
( )s Zm and a unobservable component Us. A respondent will only attend college (i.e. S=1)
this latent variable turns out to be nonnegative.
In our empirical work, Z is a vector of variables that help predict the probability
f attending college. It includes parental education, parental income, number of children
vector that holds explanatory power on wage
work experience, work experience squared, gender, ethnic group, ownership, industry,
iables, but Z must also possess unique
ariabl
if
o
(siblings), gender, ethnic group, and birth year dummies. On the other hand, X is a
s. In the benchmark setting, this includes
and location. Z and X can share some common var
v es for the model to be identified.
In the first step, a probit model is used to estimate the ( )s Zm function. The
predicted value is called propensity score, iP , where the subscript i denotes each
individual. The second step adopts a semi-parametric procedure in which local linear
regressions are used. Fan (1992, 1993)iii develops the distribution theory for the local
linear estimator of E(Y|P=P0), where Y and P are random variables. They show that
(Y|P= the fo m: E P0) and its derivatives can be consistently estimated by llowing algorith
( )1 2
2 01 2 0
,min i
i ii N N
P PY P P G
ag gg g
£
æ ö- ÷çé ù ÷- - - ç ÷ë û ç ÷çå
where 1 is a consistent estimator of E(Y|P=P0), and 2 is a consistent estimator of
( )0| /E Y P P P¶ = ¶ . G(.) is a kernel function and Na is the bandwidth. We use a
è ø
Gaussian kernel and a bandwidth of 0.2 in the estimation.iv Obviously, this algorithm is

7
equivalent to applying weighted least square at each observation point, only using
samples in its nearest “neighborhood”.
We first estim
double residual reg (X
). The
ts of the linear components of the model, .
s the
followi weig
ate E(lnY|P) and E(X|P) with the above procedure. Then we run the
ression of lnY-E(lnY|P) on X-E |P). This is a simple OLS
regression, except we trimmed off the smallest 2% of the estimated propensity scores
with a biweight kernel as suggested by Heckman, Ichimura, Todd, and Smith (1998
result is consistently estimated coefficien
Define the nonlinear component residual as U=lnY- X. Use local linear
regression again to estimate E(U|P) and its first derivative. This first derivative i
marginal treatment effect (MTE). The average treatment effect (ATE) is a simple
integration of the MTE with equal weight assigned to each P(Z)=Us. However, treatment
on the treated (TT) and treatment on the untreated (TUT) are calculated with the
ng hting functions:
( )( )
( )
( )( )
( )
1
su
TT s
0
1
su
TUT s
f p dph u
E p
f p dph u
E p
é ùê úê úë û=
é ùê úê úë û=
-
ò
where f(p) is the conditional density of propensity scores. The conditioning on X is
plicit in the above functions. All integrations are conducted numerically using simple
trapezoidal rules.
3.1.2 Returns to Schooling in Production. W
ò
im
e will measure the return to
des
productivity and efficiency. The social return will be compared to the
education (social return) by its contribution to production. Such a contribution inclu
a direct contribution to marginal productivity of workers and an indirect contribution to a
firm’s total factor

8
private return as reflected in workers’ wages. We will specify a general production
function as follows:
ititpitsitit uXLLfY ),,( (1)
where Y is output, Lp is the number of production workers, Ls is the number of
skilled/technical workers, X represents other inputs, and u is a disturbance term, for firms
i= 1, 2, …, n from year t=1, 2, …, T. Potential choices of production function
t elasticity of
ct a su orm.
an capital
the labor luence employment decisions and
and Ashenfelter (1986) and Svejnar (1986) in specifying an empirical model
specification include Cobb-Douglas (CD), translog (TL), and constan
substitution (CES). Empirical tests will be conducted to sele itable functional f
In this study, we will investigate both direct and indirect effects of hum
in China, the direct affect being through the marginal productivity of an individual
worker and the indirect effect being through total factor productivity. Mankiw et al.
(1992) advocate the direct approach, while Islam (1995) and Benhabib and Spiegel
(1994) find that human capital does not contribute significantly to explaining output
directly; they suggest that human capital mainly affects total factor productivity.
We will proceed in the following steps.
A. Test Firm’s Objective
The ownership structure of Chinese firms may lead to multiple objectives,
especially for state- and collectively-owned enterprises. A reasonable set of goals
includes profit maximization, generating employment, and increasing wages (in the spirit
of rm’s objective will inf-managed firm). A fi
the observed relationship between value of marginal product and wage. Following
Svejnar (1986), the firm’s objective is specified as a geometric average of the above three
goals:
)1()( wlwl WaWLU (2)
where L is total labor, W is wage, Wa is alternative wage, and Π is profit. We will follow
Brown

9
obtained by maximizing equation (2) subject to a CES production function. Estimates
odel will provide an indicat ill be
pply instrumental variable (IV) estimation in
combin
in the labor market, which should be uncorrelated
bles influencing a firm’s production decisions. In
measures
C. W
Th er
ma d from the estimated output elasticity for each
type of worker from
stochas
based on this m ion of firm objectives. The estimation w
performed for each ownership sector.
A. Estimation of the Production Function
The production function (1) will be first estimated assuming technical efficiency
via ordinary least squares (OLS) and fixed effects (FE) techniques.. Additionally, given
the possibility of input endogeneity, we a
ation with the FE approach.
Possible instruments include:
a. basic wages, treated as administratively set by the government. Elements
of the wage “grid” will be estimated from household survey data.
b. supply-side variables
with demand-side varia
the current firm level data, we have two such variables that can be used as
instruments:
o i) the number of applicants for each category of jobs (worker
category) as reported by the firms in the survey.
o ii) the time taken to fill the last job in each category of worker.
c. local inflation
d. local unemployment rate or number of laid off workers.
orker Marginal Products and the Direct Effect of Education
e direct effect of education on production is measured by its impact on work
rginal product, which is easily derive
either conventional estimation of the production function or from the
tic production frontier.
For example, in the case of Cobb-Douglas technology, the marginal product of
production workers and skilled workers for firm i at year t can be expressed as

10
pit
itpj
pit
itpit
L
Y
L
YMP
and sit
itsj
sit
itsit
L
Y
L
YMP
(6)
If the average education level for production workers is Ep and for
l workers is Es then, th n for each firm
(ignoring direct schooling costs) ρit can be calculated as
skilled/technica e annual rate of return to educatio
1)(
1
pit
sitEE
it
MPMP ps
. (7)
Clearly, the rate of return is a function both of output level , the quantities of
workers, and their re an use sample
averages to calculate the average annual rates of return based on equation (7), and we can
allow f
ill
l, and
sw to be the number of additional years of
schooling required (the difference in average years of schooling between highly educated
technical/skilled spective output elasticities. We c
or the possibility of intercity or inter ownership-sectoral differences in output
elasticities. By comparing the value of marginal product of each type of worker with
their respective average wages we can draw inferences regarding a firm’s objectives and
the influence of labor market institutional constraints (e.g. monopsony power). We w
combine the results from firm data and individual data to discuss the difference in
estimated effects of education on production and on earnings and their implications for
China’s education, labor-market, and income-distribution policies, and the implications
for human capital investment in China and for policies addressing sectoral, regiona
individual income inequality.
In order to identify the effect of education on production, we assume that less
educated workers can be converted to highly educated workers by sending them to school
for a sufficient number of years. Define

11
and less educated workers) to convert one worker with low education into a worker with
high education. Under the simplifying assumptions (also basic to the standard Mincer
equation) that the only opportunity cost of investing in a highly educated worker is the
foregone marginal product of the less-educated worker and that the production gain is a
constant, infinite stream, then
(1 ) iswi i iMPs r MPp= + , (1)
or
(1 ) iswii
i
MPsr
MPp= + (2)
icitly defines a rate of return to schooling in production. It can be
applied to various groups of firms, such as firms located in different cities, or firms in
ifferent ownership classes. In the above approach w
that observable or unobservable firm-specific factors affect the marginal-product ratio
Equation (4) impl
d e need to account for the possibility
and may lead to over- or under- estimation of the effect of education on production.
In order to investigate this possibility, we use regression analysis. More
specifically, We express equation (4) as
(1 ) iswii
MPhedr e= + ⋅
iMPled(3)
ling in production and ei is an error term that
captures other factors that may affect the MP ratio. Taking logs, we obtain the following
pproximation of a Mincer-type empirical model
Where r is the expected return to schoo
a
log log(1 ) *ii i
i
MPheda r sw
MPled
æ ö÷ç ÷= + + +ç ÷ç ÷çè øe , (4)

12
Equation (6) can easily be expanded to include experience as
2log ii
i
MPheda b sw c
MPled
æ ö÷ç ÷= + ⋅ +ç ÷ç ÷çè ø *i i iex d ex e⋅ + ⋅ + (5)
here b is an estimate of rc and d allow us to calculate the effec f experience, and e
the difference in average experience between highly educated and less educated workers.
Because the ratio of marginal product only depends on the ratio of the two types of
-specific effects (observed
and unobserved, fixed or time-varying) related to output are canceled out. Therefore, it
reatly reduces endogeneity problem in the estimation.1
w t o x is
workers, not output, the advantage of this approach is that firm
g
1 While a seemingly simpler approach is simply to regress marginal product on education, as can be seen in equation (2), this procedure would be subject to bias, because of correlation between omitted variables affecting output and marginal product that are also correlated with education. If they are not controlled for, the regression will be inconsistent.
13
easures of hum ay also
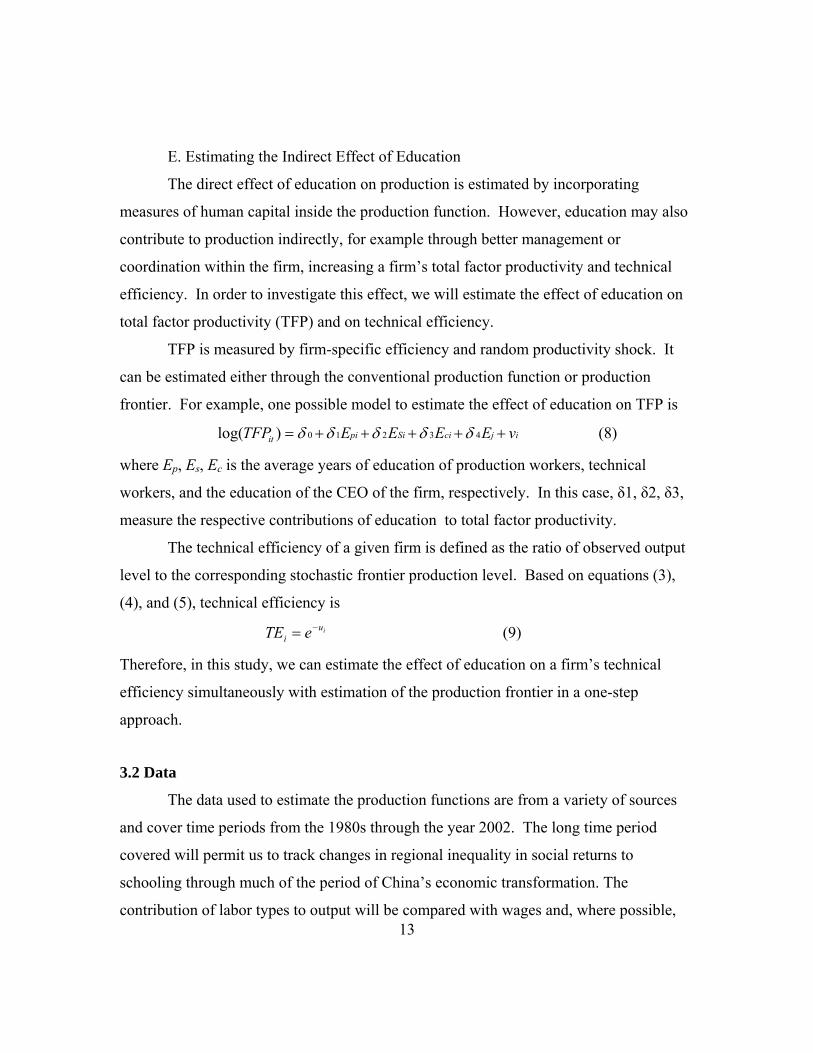
E. Estimating the Indirect Effect of Education
The direct effect of education on production is estimated by incorporating
m an capital inside the production function. However, education m
contribute to production indirectly, for example through better management or
coordination within the firm, increasing a firm’s total factor productivity and technical
efficiency. In order to investigate this effect, we will estimate the effect of education on
total factor productivity (TFP) and on technical efficiency.
TFP is measured by firm-specific efficiency and random productivity shock. It
can be estimated either through the conventional production function or production
frontier. For example, one possible model to estimate the effect of education on TFP is
ijciSipiit vEEEETFP 43210)log( (8)
where , , is the average years of education of production workers, technical
(9)
Therefore, in this study, we can estimate the effect of education on a firm’s technical
contribution of labor types to output will be compared with wages and, where possible,
Ep Es Ec
workers, and the education of the CEO of the firm, respectively. In this case, δ1, δ2, δ3,
measure the respective contributions of education to total factor productivity.
The technical efficiency of a given firm is defined as the ratio of observed output
level to the corresponding stochastic frontier production level. Based on equations (3),
(4), and (5), technical efficiency is
u ii eTE
efficiency simultaneously with estimation of the production frontier in a one-step
approach.
3.2 Data
The data used to estimate the production functions are from a variety of sources
and cover time periods from the 1980s through the year 2002. The long time period
covered will permit us to track changes in regional inequality in social returns to
schooling through much of the period of China’s economic transformation. The

14
nonwage income, to assess how well labor markets are working to allocate labor and
rly 1990 that covers
nd some private enterprises in 24 cities of
all include data on intermediate inputs, so both gross-
estimated. Survey ( i) contains data
es from
(LCUC). These data are currently in the posse of
these surveys have im
for 1995 and 2002. For example, CHIP-95 data covered 6,928 urban households and
skills and how labor-market efficiency has evolved since reform.
The data we have for estimation of the production functions include:
i) A survey 30 enterprises in the paper industry conducted in the ea
the years 1985, 1987, and 1990.
ii) A survey of 442 urban SOEs, collectives, a
12 provinces for the year 1991.
iii) A World Bank survey of production and innovation conducted by China’s National
Bureau of Statistics in 2001, which covers 1500 firms across ten service and
manufacturing sectors and five cities over the period of 1998-2000. Five cities are Beijing,
Shanghai, Tianjin, Chengdu and Guangzhou, representing different urban areas of diverse
development level.
Surveys (i), (ii), and (iii)
value and value-added production functions can be
on worker schooling as well as occupation; Surveys (ii) contains data on worker
occupational level only, thus we need assume average level of schooling for each
occupation level to estimate private returns to schooling; and Survey (iii) contains data on
worker occupation level and the average education level for different occupation levels.
All three surveys report earnings data, particularly Survey (iii) has aggregate labor
earnings data including wages, bonus and subsidies for three years, but only has one year
(2000) disaggregated data for each occupational level.
Data for estimating the relationship between schooling and earnings com
two sources:
i.) The Chinese Household Income Project (CHIP)
ii.) The Survey of the State and Life Chances in Urban China, 1949—1994
ssion of this research team. All three
portant information about family background and respondent
schooling experience during the CR. The CHIP data provide income and earnings data
15
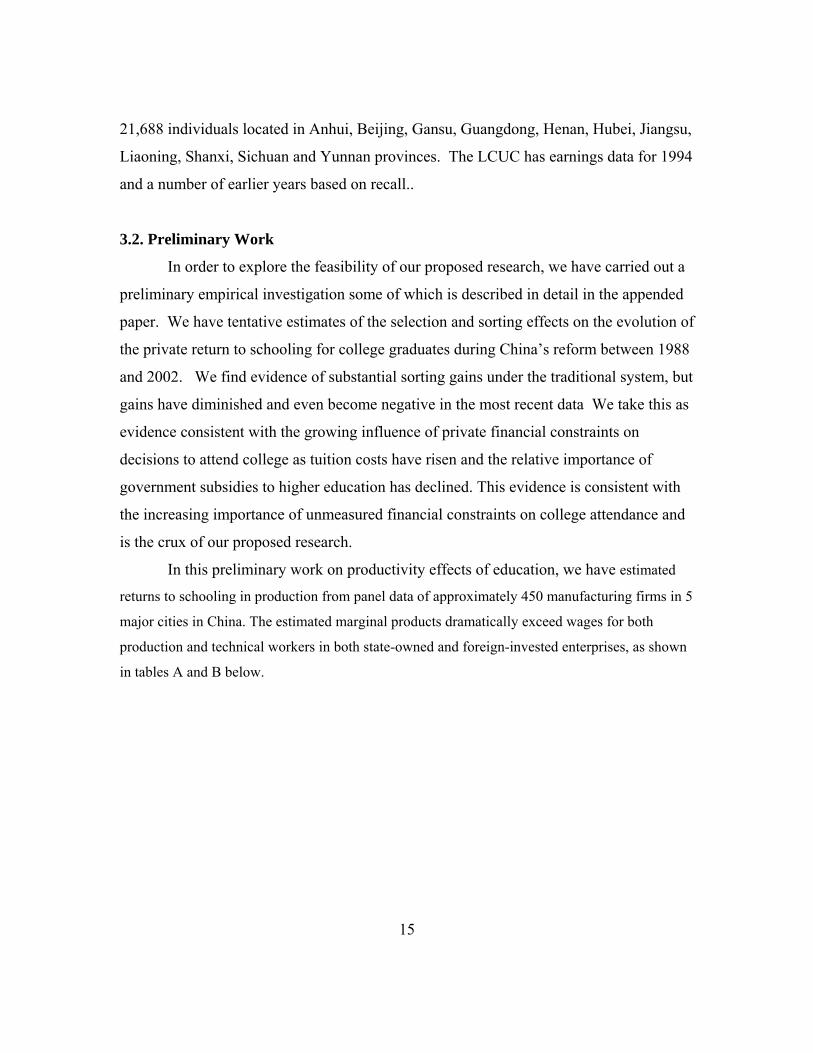
21,688 individuals located in Anhui, Beijing, Gansu, Guangdong, Henan, Hubei, Jiangsu,
In order to explore the feasibility of our proposed research, we have carried out a
ation some of which is described in detail in the appended
ates of the selection and sorting effects on the evolution of
products dramatically exceed wages for both
product
Liaoning, Shanxi, Sichuan and Yunnan provinces. The LCUC has earnings data for 1994
and a number of earlier years based on recall..
3.2. Preliminary Work
preliminary empirical investig
paper. We have tentative estim
the private return to schooling for college graduates during China’s reform between 1988
and 2002. We find evidence of substantial sorting gains under the traditional system, but
gains have diminished and even become negative in the most recent data We take this as
evidence consistent with the growing influence of private financial constraints on
decisions to attend college as tuition costs have risen and the relative importance of
government subsidies to higher education has declined. This evidence is consistent with
the increasing importance of unmeasured financial constraints on college attendance and
is the crux of our proposed research.
In this preliminary work on productivity effects of education, we have estimated
returns to schooling in production from panel data of approximately 450 manufacturing firms in 5
major cities in China. The estimated marginal
ion and technical workers in both state-owned and foreign-invested enterprises, as shown
in tables A and B below.

16
Table A. Total Factor Productivity and Marginal Products based on Production-Function
ed-Effect Estimates
Estimates and Average Annual Pay ( Domestic SOE’s)
Fix(Average Annual Pay)
City TFP Capital Technical
Production Workers Workers
Beijing 16.36 0.080 23.81 379.8 (9.32)
5 (13.32)
Chengdu 11.69 0.060 13.64 (7.26)
231.86 (12.74)
Guangzhou 21.54 0.097 32.23 (14.09)
888.71 (17.14)
Shanghai 21.18 0.131 22.93 (13.31)
740.82 (16.19)
Tianjin 13.74 0.083 22.93 (8.5)
258.21 (10.12)
Table B. Total Factor Productivity and Marginal Products based on Production-Function
Fixed-Effect Estimates
Estimates and Average Annual Pay (Foreign-Invested Firms)
(Average Annual Pay)
City TFP Capital Technical
Production Workers Workers
Beijing 18.96 0.489 145.05 (14.16)
2,405.28 (38.57)
Chengdu 12.14 0.355 41.49 (9.70)
752.42 (30.40)
Guangzhou 16.43 0.761 (76.17 11.65)
1,616.60 (80.78)
Shanghai 20.72 0.736 452.54 (23.01)
3,933.17 (47.70)
Tianjin 15.29 0.783 (87.06 13.48)
1,260.00 (95.59)
The estimated direct returns to schooling in production (based on fixed-effect
production function estimates) are substantial and possibly underestimated given the
crude schooling data at our disposal, generally exceeding 20% after allowing for the
“bricks and mortar” costs of education. These are shown in tables C and D.

17
Table C. Rate of Return Calculations from Fixed-Effect Estimates (Domestic SOE’s)
Equation 3
Retu g MP of Capital Private Return
rn to Schoolin(Production)
(Wages)
Beijing 0.079 0.059 0.76 Chengdu 0.62 0.060 0.090
G uangzhou 0.77 0.097 0.019 Shanghai 0.73 0.13 0.017 Tianjin 0.52 0.083 0.014
Table D. Rate of Return Calculations from Fixed-Effect Estimates (Foreign-Invested Firms)
Equation 3 Retu g
MP of Capital Private Return
rn to Schoolin(Production)
(Wages)
Beijing 0.49 0.19 0.64 Chengdu 0.16 0.36 0.06
G uangzhou 0.14 0.76 0.09 Shanghai 0.26 0.74 0.08 Tianjin 0.18 0.78 0.14
an addition impact of about 6% increase in
We will pursue the critical question of why sorting gains to college attendance
The estimation of the effect of average schooling per firm on firm TFP suggests
TFP per additional year of schooling, but
accounts for only a small proportion of the FE production-function residuals.
Our preliminary research points to the need for further investigation as outlined in
this proposal. Some of the puzzles that we hope to resolve are summarized as follows.
The OLS return to college education increased between 1988 and 1995, but
increased sharply between 1995 and 2002. In the year 2002, it remained
somewhat small by international standards, approximately 7.1% per year of
college. We plan to suggest reasons for this gap, which we suspect lies in the
persistent underpayment of skilled workers in traditional enterprises in China.
have not only declined but become negative. The implications for educational
funding policy are of the utmost importance.

18
The vast gap between estimated marginal products and reported earnings revealed
We will proceed further to investigate “external” effects of schooling operating
Review.
in our preliminary estimates will be investigated intensively. We plan to
incorporate estimates of private returns based on enterprise-provided wage data
with estimates based on data that are possibly more representative of the
population at large.
We will expand coverage of industry sectors to non-manufacturing enterprises.
A major research question will be to establish a sound benchmark for the
opportunity cost of investment in schooling.
through TFP at the firm- and city levels. To the extent that we identify TFP
effects at the firm level, we need to investigate firm-level decision making and
explore what entities may capture this residual effect of schooling on potential
profit.
Ultimately, a sample of enterprises encompassing a wider range of city sizes and a
wider geographical dispersion, with a greater concentration of cities in the interior
of China, would probably enable us to obtain more pronounced policy
implications.
4. Research Team and Labor Allocation
Belton M Fleisher PI
Expertise: Belton Fleisher is Professor of Economics at Ohio State University
He has authored and coauthored over 40 articles in professional journals including
American Economic Review, Journal of Political Economy, the Review of Economics
and Statistics, Journal of Comparative Economics, and China Economic Review and 7
books. Since 1990, his research has focused on economic growth, financial markets, and
labor and productivity in the Chinese economy, and he has published over 20 articles on
topics related to the Chinese economy. He has served on the executive committee of the
Association of Comparative Economic Studies, and he is a co-editor of China Economic
19
Coordinate research of three co-PI’s
ation of production functions with three data sets covering the
conomic
ount
ion, selectivity, and funding-constraint issues.
Expertise: Yifan Hu received her Ph.D in economics from Georgetown
onsultant for the World Bank in Washington,
Institute for International Economics in
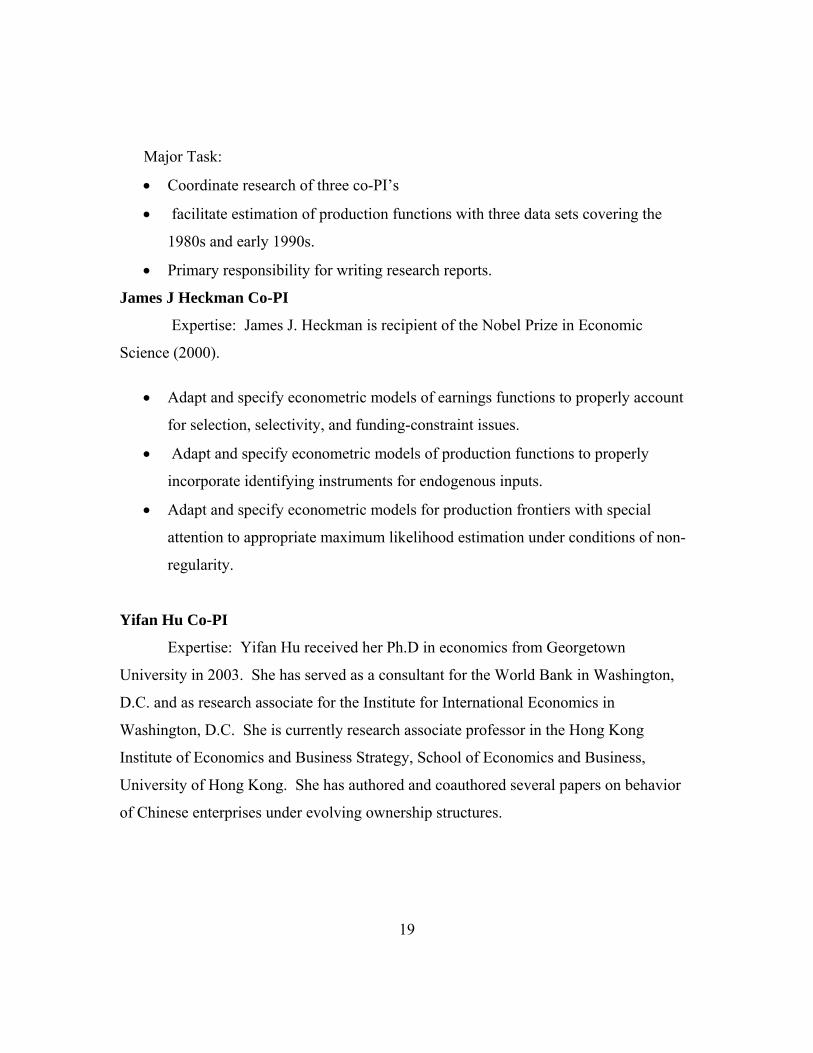
Major Task:
facilitate estim
1980s and early 1990s.
Primary responsibility for writing research reports.
James J Heckman Co-PI
Expertise: James J. Heckman is recipient of the Nobel Prize in E
Science (2000).
Adapt and specify econometric models of earnings functions to properly acc
for select
Adapt and specify econometric models of production functions to properly
incorporate identifying instruments for endogenous inputs.
Adapt and specify econometric models for production frontiers with special
attention to appropriate maximum likelihood estimation under conditions of non-
regularity.
Yifan Hu Co-PI
University in 2003. She has served as a c
D.C. and as research associate for the
Washington, D.C. She is currently research associate professor in the Hong Kong
Institute of Economics and Business Strategy, School of Economics and Business,
University of Hong Kong. She has authored and coauthored several papers on behavior
of Chinese enterprises under evolving ownership structures.

20
Major Task:
Facilitate estimation of production functions with World Bank survey conducted
by China’s National Bureau of Statistics in 2001, which covers 1500 firms across
ten service and manufacturing sectors and five cities over the period of 1998-2000.
Examine the effect of firm’s skill structure on innovative capability.
Investigate the relationship between return on education and marginal
productivity.
Participate in writing research reports.
Haizheng Li Co-PI
Expertise: Haizheng Li is associate professor of economics at the Georgia
Institute of Technology. He received his Ph. D. in Economics from the University of
Colorado at Boulder in 1997, where he specialized in econometrics and labor economics.
His research focuses on applied econometrics, primarily in the areas of labor economics
and industry studies, and he has published several articles in major journals on education,
wage determination and labor supply in the Chinese economy. Li also conducts research
on theoretical econometrics aimed at making advances in the semi-parametric estimation
method for censored models. This research interest is particularly valuable for the
proposed research.
Major Task:
Work on methodology and estimations
Work to obtain CUHS data
Work with CHIP data and CUHS data
Participate in writing research reports.
Xiaojun Wang Co-PI
Expertise: Xiaojun Wang is assistant professor in the department of economics,
University of Hawaii at Manoa. He received his Ph.D. in economics from Ohio State

21
University in 2000. His research specialties are econometrics, macroeconomics, labor
markets, and Chinese economy. He designs the econometric strategy for the
semiparametric estimation of returns to schooling in our project.

22
Shi Li Research Associate
y of
Beijing University
an expert on the Chinese Household Income Project. He supervises our estimation of
returns to schooling based on the 2002 CHIP data.
Heng-fu Zou Research Coordinator
Expertise: Heng-fu Zou is a senior research economist in the Development
Research Group at the World Bank. He received his Ph.D. in economics from Harvard
University in 1989. His research specialties are economic growth, public expenditure,
fiscal federalism, and income distribution.
5. Time Framework and Budget
I. Time frame:
The project is scheduled to be completed in three years, starting from 1 January,
2006. The deliverables are listed as follows.
1 August 2005 – 31 December, 2006):
A research paper on the effect of education on individual’s productivity based
on conventional production function estimation
A research paper on the trend of the effect of education on individual earnings
using multiple year data, focusing on the extent to which individuals who
attend college have sorted efficiently on the basis of their returns to schooling.
A report of the effect of education on production and personal income
A report on China’s human capital policy and policy recommendations on
reducing inequality
Project Completion Date: 31 December, 2006.
Expertise: Shi Li is professor in the Institute of Economics, Chinese Academ
Social Sciences in Beijing. He received his M.A. in economics from
in 1984. He is head of the project on Income Inequality and Social Policy in China and is

23
o Trip to China, $4,000
el support.
($7,000)
Haizheng Li ($13,500)
$10,000
II. Budget Plan
Year 1: Total $73,000
A. PI’s:
Belton Fleisher ($25,500)
o Summer support (1 month), $12,000
o Conference trip: $2,000
o Research Assistant 7,500
James Heckman ($16,000)
o Research Assistance and trav
Yifan Hu
o Field trip/traveling : $4,000
o Conferences: $3,000
o Summer support (1 month),
o Conferences and Trip to China, $2,500
o Research assistant: $1,000
Xiaojun Wang ($7,000)
o Summer Support ($4000)
o Trip to mainland to coordinate with Fleisher and Li ($3000)
B. Research Associate
Shi Li ($4,000) Trip to U. S. to coordinate with Fleisher and Li

24
Table 1. Higher Education and Economic Growth Rates for Selected Countries
Gross Enrollment Ratio in Higher Education (%)b
1980 1993
a 1 2
8
51
7
19
20
Japan 29 32
45
72
Source: World Bank (1997), p.6
parentheses is for 1978-91 and is modified to account for over reporting. See
is the number of all postsecondary students divided by olumn contains data for the 1993 or for the
Kong 1991, United States 1990. cation levels.
Country
Chin
India 4
Korea (Republic) 16
Malaysia 4
Thailand 13
Hong Kong 5
Former USSR 22
United States 56
Notes: aFigure in Wang and Meng (2001). bGross enrollment ratiouniversity-going age group. The second cfollowing dates: India 1992, Hong c This represents spending on all edu

25
Table 2. Public Expenditures on Education as a Percentage of GNP in 1995
World 5.2
China 2.5
Philippines 3
Thailand 4.1
India 3.3
a
Pakistan 2.8
urkey
South Korea
pt
xico
5.1
6.9*
Germany 4.8
Russian Federation 3.5
Poland 5.2
Hungary 5.3
* Data was only available for 1994
Malaysi 4.7
Singapore 3
T 2.2
3.7
Egy 4.8
Me 4.9
Brazil
Argentina 3.8*
United States 5.4*
Japan 3.6*
Canada
Source: UNESCO, 1999

26
(In 100 Million of Yuan)
Year
Government
GDP centage of GDP
Table 3. Investment in Educational Expenditures at All Levels of Government
Appropriations for
Education
Educational Expenditure
As Per
1991 618 21,618 2.9%
1992 729 26,638 2.7%
1993 868 34,634 2.5%
1994 1175 46,759 2.5%
1995 1412 58,478 2.4%
1996 1672 67,885 2.5%
1997 1863 74,463 2.5%
1998 2032 78,345 2.6%
1999 2287 82,068 2.8%
2000 2563 89,468 2.9%
2001 3057 97,315 3.1%
Source: China Statistics Yearbook 2003

27
Table 4. Gross Enrollment Rate of Schools Age 18-22 %
Year Enrollment Rate
1990 3.4
1991 3.5
1992 3.9
1993 5
1994 6
1995 7.2
1996 8.3
1997 9.1
1998 9.8
1999 10.5
2000 12.5
2001 13.3
Source: China Educational Fi tatistical Yea . Notes: The gross enrollment y le ined as the to llment of a school level divided by the total pop within the a for a given school level, which is then multiplied by 100. Junior sec schools include secondary schools and vocational secondary schools.
nance S rbook, 2002rate of schools bulation
vel is defge range
tal enro
ondary

28
(In 2001 Yuan)
n 1998 9 2000 2001
Table 5. Per Pupil Expenditure By Region
Regio 199
Beijing 4,973 7 7,910 10,098 6,34
Tianjin 1,936 63 2,530 3,042
i 586 8 722 856
i 675 7 794 996
Inner Mongolia 926 3 1,106 1,399
ng 1,217 0 1,456 1,627
1,170 3 1,378 1,695
Heilongjiang 1,052 5 1,348 1,688
ai 4,557 1 6,333 6,805
u 1,151 6 1,360 1,474
2,142
Jiangxi 522 567 620 793
Shandong 758 862 984 1,155
Henan 476 520 567 678
Hubei 683 756 831 993
Hunan 580 675 722 857
Guangdong 1,085 1,157 1,286 1,468
Guangxi 555 618 675 836
Hainan 771 890 885 1,046
Chongqing 749 793 855 1,033
Sichuan 639 697 751 918
2,1
Hebe 65
Shanx 74
1,06
Liaoni 1,34
Jilin 1,30
1,26
Shangh 5,33
Jiangs 1,29
Zhejiang 1,255 1,497 1,647
Anhui 554 612 603 705
Fujian 866 1,018 1,163 1,377

29
Guizhou 428 500 561 672
Yunnan 960 1,281
Tibet 1,612 2,004 2,385
Shaanxi 663 761 808 1,040
Gansu 682 801 832 982
Qinghai 1,098
Ningxia 853 1,037 1,350
Xinjiang 1,225 1,319 1,412 1,859
Source: Author's calculation from China Statisti
1,044 1,101
2,044
1,175 1,335 1,645
965
cal Yearbook 1999-2003

30
Table 6. Percent of Population By Level of Education and Region
Fraction Within Each Province
Region: Illiterate
ary
Education
Junior
Secondary
School School
College or
Higher
Level
Population
(Age 6 and
Over,
Thousands)
Prim
Senior
Secondary
Beijing 13239 4.99 14.86 35.67 23.99 20.49
Tianjin 9522 6.36 23.16 10.57
Hebei 62588 6.80 34.41 42.50 11.61 4.69
4.63
Inner Mongolia 22236 11.93 29.70 37.82 14.91 5.64
Liaoning 39676 4.96 29.75 46.68 13.09 5.52
Jilio 25500 4.33 32.23 39.78 17.16 6.50
Heilongjiang 36007 6.12 31.07 43.24 14.71 4.87
Shanghai 15469 7.64 17.50 34.70 25.10 15.07
Jiangsu 69427 12.39 31.96 38.69 13.14 3.83
Zhejiang 43244 12.21 34.23 34.54 13.25 5.77
Anbui 58813 14.66 36.65 38.66 7.39 2.64
Fujian 32162 11.89 38.72 32.04 13.15 4.20
Jiangxi 38249 9.10 41.68 34.83 11.48 2.91
Shandong 83881 10.10 28.06 41.76 14.42 5.67
Henan 88118 7.76 29.51 46.47 11.97 4.30
Hubei 56354 12.41 39.25 32.25 12.23 3.86
Hunan 61435 7.23 37.26 38.69 12.47 4.35
Guangdong 71705 6.41 36.83 37.78 13.84 5.15
Guangxi 44120 8.60 39.57 37.03 11.32 3.48
Hainan 7273 7.88 34.55 39.35 14.62 3.59
37.36 22.57
Shanxi 30192 5.66 31.63 45.41 12.67

31
Chongqing 28823 9.31 42.33 34.63 10.38 3.35
10.44 3.75
Guizhou 34146 16.21 42.71 30.03 7.54 3.52
Yunnan 38413 20.30 46.15 1.99
Tibet 2406 37.99 46.63
18.11
Qinghai 4724 22.25
Ningxia 5068 14.98
Xinjiang 18220
1,178,951 10.23% 34.96% 37.65% 12.45% 4.71%
Sichuan 79863 12.24 39.58 33.99
25.19 6.37
11.72
34.59
2.87
12.99
0.79
3.95 Shaanxi 34241 13.03 35.43
Gansu 23833 38.36 28.86 11.61 3.05
38.02 27.65 8.95 3.15
33.82 33.60 11.94 5.66
7.74 35.80 31.73 14.85 9.88
National Total
Note: The data in this tabl ple Survey on Popu 02. The ractio 8%.
e are obtained fromn is 0.98
the Sam lation Changes in 20 sampling f

32
Table 7. Per Pupil Expenditure By Region
(In 2001 Yuan)
2001 Region 1998 1999 2000
Beijing 10,098 4,973 6,347 7,910
Tianjin 1,936 2,163 2,530 3,042
Hebei 856
996
1,106 1,399
1,627
1,695
Heilongjiang 1,052 1,265 1,348 1,688
4,557 5,331 6,333 6,805
Jiangsu 1,151 1,296 1,360 1,474
Zhejiang 1,255 1,497 1,647 2,142
Anhui 554 612 603 705
Fujian 866 1,018 1,163 1,377
Jiangxi 522 567 620 793
Shandong 758 862 984 1,155
Henan 476 520 567 678
Hubei 683 756 831 993
Hunan 580 675 722 857
Guangdong 1,085 1,157 1,286 1,468
Guangxi 555 618 675 836
Hainan 771 890 885 1,046
Chongqing 749 793 855 1,033
Sichuan 639 697 751 918
586 658 722
Shanxi 675 747 794
Inner Mongolia 926 1,063
Liaoning 1,217 1,340 1,456
Jilin 1,170 1,303 1,378
Shanghai

33
Guizhou 428 500 561 672
1,044 1,101 1,281
1,612 2,044 2,004 2,385
Shaanxi 663 761 808 1,040
Gansu 682 801 832 982
Qinghai
Ningxia 853 1,037 1,350
Xinjiang 1,225 1,319 1,412 1,859
Source: Auth China Statistical Yearbook 1 2003
Yunnan 960
Tibet
1,098 1,175 1,335 1,645
965
or's calculation from 999-

34
Table 8. Government Education Appropriations as a Percent of GDP
Region: 1998 1999 2000 2001
Beijing 5.403 6.213 6.851 7.594
Tianjin 2.576 2.607 2.629 2.907
2.074 2.143 2.101 2.173
Shanxi 2.971 3.283 3.332 3.871
Inner 3.172 3.350 3.184 3.615
Liaoning 2.203 2.219 2.199 2.247
Jilin 3.638 3.697 3.555 3.683
Heilongjiang 2.416 2.724 2.570 2.818
Shanghai 2.880 3.002 3.157 3.098
Jiangsu 2.115 2.205 2.122 2.091
Zhejiang 1.844 2.073 2.120 2.541
Anhui 2.238 2.418 2.379 2.659
Fujian 1.929 2.072 2.148 2.314
Jiangxi 2.191 2.373 2.430 2.822
Shandong 1.874 1.935 1.980 2.022
Henan 2.181 2.270 2.240 2.387
Hubei 2.154 2.265 2.266 2.446
Hunan 2.282 2.407 2.323 2.504
Guangdong 2.175 2.207 2.233 2.411
Guangxi 2.808 2.951 3.073 3.507
Hainan 2.813 3.033 2.822 3.165
Chongqing 2.501 2.616 2.771 3.091
Sichuan 2.426 2.606 2.702 3.026
Guizhou 3.517 3.820 4.140 4.671
Hebei
Mongolia

35
Yunnan 3.799 4.070 4.233 4.705
3.756 4.073 4.023 4.689
Gansu 3.644 4.133 4.322 4.857
Qinghai 3.858 3.893 4.182 4.649
Ningxia
Xinjiang
Source: Auth China Statistical 003
Tibet 6.412 7.017 6.566 6.916
Shaanxi
3.933 4.233 4.356 5.114
4.174 4.399 4.190 5.182
or's Calculation from Yearbook 1999 - 2

36
Battese, G. E. and Coelli, T. J. (1995), “A Model for Technical Inefficiency Effects in a
Sto ontier Produ unc pir onom ): 325-332.
Battese, George E., Rao, D. S. Prasada, and O’Donnell, Christopher J. (2004), “A
Metafrontier Production Function for Estimation of Technical Efficiencies and
Te Gaps for Fir rati r Di Tec ies, Journal of
Productivity Analysis (21): 91-103.
Economic
Development: Evidence from Cross-Country Data,"Journal of Monetary
Economics 34 (1994):143-73
Brown, James N. and Ashengelter, Orley C. (1986), "Testing the Efficiency of
Employment Contracts," Journal of Political Economy 94(3) pt 2: S40-S87.
Card, David (2001). “Estimating the Return to Schooling: Progress on Some Persistent
Econometric Problems.” Econometrica 69(5): 1127-1160
Chang, Gene H. (2002). “The Cause and Cure of China’s Widening Income Disparity.”
China Economic Review 13(4): 335-340.
Carneiro, Pedro, Hansen, Karsten T., and Heckman, James J. (2003), “Estimating
Distributions of Treatment Effects with an Applicatoin to the Returns to
Schooling and Measurement of the Effects of Uncertainty on College Choice,”
International Economic Review 44 (2): 361-422.
Chen, Jian, and Fleisher, Belton (1996). “Regional Income Inequality and Economic
Growth in China.” Journal of Comparative Economics 22(2):141-164.
Dong, Xiao-yuan and Putterman, Louis (1997), “Productivity and Organization in
China’s Rural Industry,” Journal of Comparative Economics 24(2): 181-201.
Fleisher, B. and Jian Chen (1997). “The Coast-Noncoast Income Gap, Productivity and
Regional Economic Policy in China.” Journal of Comparative Economics 25(2):
220-236.
Fleisher, Belton, Sabirianova, Klara, and Wang, Xiaojun (2004). “Returns to Skills and
References
chastic Fr ction F tion, Em ical Ec ics (20
chnology ms Ope ng unde fferent hnolog
Benhabib, Jess and Mark M. Spiegel, "The Role of Human Capital in

37
the Speed of Reforms: Evidence fro urope, China, and
Russia.” Ann Arbor, MI: Will nstitute Working Paper Number 703.
s in
s
Fleishe “Skill Differentials, Return to Schooling, and
ina.”
Fleishe , and Wang, Xiaojun (2005),
volution,
ent
Heckm .” China Economic
Heckm ction Bias, Comparative Advantage
acific
Hong, ,”
ton University.
the
407-457.
n.”
Svejna
(eds.) China's Rural Economy pp 243-254. New York: Oxford
m Centeral and Eatern E
iam Davidson I
Fleisher, Belton, and Wang, Xiaojun (2001). “Efficiency Wages and Work Incentives in
Urban and Rural China.” Journal of Comparative Economics 29(4): 645-662.
Fleisher, Belton and Wang, Xiaojun (2003). “Potential Residual and Relative Wage
Chinese Township and Village Enterprises.” Journal of Comparative Economic
31 (3): 429-443 .
r, Belton and Wang, Xiaojun (2004).
Market Segmentation in a Transition Economy: The Case of Mainland Ch
Journal of Development Economics 73(1): 715-728.
r, Belton, Li, Haizheng, Li, Shi
Giles, John J., Park, Albert, and Zhang, Juwei (2004). “The Great Proletarian Re
Disruptions to Education, and Returns to Schooling in urban China.” Departm
of Economics, University of Michigan.
an, James J. (2004). “China’s Human Capital Development
Review, forthcoming.
an, James J. and Li, Xuesong (2004). “Sele
and Heterogenous Returns to Education: Evidence from China in 2000.” P
Economic Review 9, 155-171.
Han (1999), “Maximum Likelihood Estimation for Nonregular Structural Models
working paper, Department of Economics, Prince
Mankiew, N. Gregory, Romer, David, and Weil, David N. (1992), “A Contribution to
Empirics of Economic Growth, Quarterly Journal of Economics 107(2):
Meng, Xing and Gregory, R. G. (2002). “The Impact of Interrupted Education on
Subsequent Educational Attainment: A Cost of the Chinese Cultural Revolutio
Economic Development and Cultural Change 50(4): 935-959.
r, Jan (1990) "Productive Efficiency and Employment," in William Byrd and Ling
Qingsong
University Pres for the World Bank
38
Yang, Dennis Tao (1999). “Urban-Biased Policies and Rising Income Inequality in
ic
China.” American Economic Review 89(2): 306-310.
Yang, Dennis Tao (2002). “What Has Caused Regional Inequality in China?” China
Economic Review 13(4): 331-334.
Zhang, Junsen, Zhao, Yaohui, Park, Albert, and Song, Xiaoqing (2005), “Econom
Returns to Schooling in urban China, 1988 to 2001. Journal of Comparative
Economics (in production).
metrica 66, 5 (Sept. 1998): 1017-1098.
derivatives include average treatment effect (ATE), treatm
i Econoii These ent on the treated (TT),
): The
iv This a
treatment on the untreated (TUT), bias, selection bias, and sorting gain. iii Fan (1992): Journal of the American Statistical Association 87: 998-1004. Fan (1993
Annals of Statistics 21: 196-216.
pproximates the rule-of-thumb bandwidth selector proposed in Fan and Gilbels (1996).