educator evaluation - us department of education evaluation differentiating levels of ......
TRANSCRIPT

Educator Evaluation
Differentiating Levels of Performance
Jackson Miller & Tony Milanowski, Westat
Mike Christian, University of Wisconsin-Madison

Agenda
1. Why is differentiating performance important?
2. Strategies for ensuring differentiation when observing practice
▪ Questions and discussion
3. Strategies for ensuring differentiation when measuring student growth
▪ Questions and discussion
4. Ensuring differentiation when determining a educator’s overall performance level
▪ Questions and discussion and final wrap up

Why Differentiating Performance Is Important: High-Stakes Decisions
• Differentiation allows grantees to:
▪ Define distinctions between ineffective, effective
and highly effective practice
▪ Create multiple performance categories
▪ Reduce misidentification of educators
▪ Develop criteria for determining educators’ career
advancement and/or compensation

Why Differentiating Performance Is Important: Targeted Support
• Differentiation allow grantees to:
▪ Define the skills and competencies of effective and
highly effective educators
▪ Identify educators who need improvement of those
skills and competencies
▪ Target professional development
▪ Track professional improvements

Long Tradition of Minimal Differentiation • Once certified, all teachers are equal
• Evaluation relied only on classroom observation
• Limited administrator time, will, or skill to make distinctions
• Limited use of evaluation results
• Lack of career advancement
• View of teaching as primarily an art
• “Widget Effect” report

Minimal Differentiation Not Limited to Education • Long tradition of research in organizational psychology
suggests that rating leniency is endemic
▪ According to one meta-analysis, ratings made for
consequential purposes were on average 1/3 of standard
deviation (SD) higher
▪ Has led to interest in “forced distribution” rating systems
(grading on a curve)
▪ Generally agreed that changing the instrument alone will
not solve the problem

Strategies for Ensuring Differentiation When Observing Practice

Systems Approach to Improving Accuracy and Differentiation of Classroom Observations
• Rubric design
• Data collection and decision process design
• Observer training and calibration
• Observer motivation & context

Rubric Design Features That Promote Differentiation and Accuracy • Clarity
▪ Clear articulation of rubric strands or themes
▪ Minimize dependence on vague quantifiers (“usually,” “frequently,” or “consistently”) or provide guidelines on what they mean
▪ Minimize unobservable distinctions
• Rigor ▪ What expectations are communicated by the “proficient”
level? Does “proficient” mean average?
• Number of levels ▪ Are more better?
▪ Scale augmentation

Excerpt from Maricopa REIL Rubric
Domain: Instructional Strategies; Element: Monitor & Adjust
5 4 3 2 1
Checks for understanding by eliciting overt responses from all students at essential sub-objective level
Checks for understanding by eliciting overt responses from all students at essential sub-objective level
Checks for understanding by eliciting overt responses from most students (75% or more) at essential sub-objective level
Elicits overt responses from at least half (50%) of the students to either move forward with or adjust instruction
Elicits overt responses from a few of the students to either move forward with or adjust instruction
Utilizes student responses to appropriately more forward with or adjust one or more of the following at the individual level: • Instructional
approach • Content sub-skills
or complexity • Depth of knowledge • Grouping • Task/product
requirements
Utilizes student responses to appropriately more forward with or adjust one or more of the following at the subgroup level: • Instructional
approach • Content sub-skills
or complexity • Depth of knowledge • Grouping • Task/product
requirements
Utilizes student responses to appropriately more forward with or adjust one or more of the following : • Instructional
approach • Content sub-skills
or complexity • Depth of knowledge • Grouping • Task/product
requirements

Observation Process Design
• Explicit guidelines for identifying and collecting evidence and making a rating judgment
• Separation of evidence collection from rating
▪ Collect evidence judge its relevance make
rating
▪ May reduce tendency to assume performance is
proficient then look only for confirming evidence
• Sufficient time to observe and consider evidence

Observer Training and Calibration
• Calibration
▪ Calibrate on the full range of practice
▪ Many observers have never seen really good performance
(Pianta et al., Science, v.315,2007)
• Provide opportunity for ongoing conversations among
observers
• Some people are simply not good raters
• More information: Joe et al., Foundations of Observation
(MET Project Policy & Practice Brief)

Context and Motivation
• Raters of classroom practice are more lenient when:
▪ They are motivated to maintain good relations with
those they observe
▪ Their own ratings are influenced by how they rate
others
▪ They believe they are expected by their supervisors
to rate high
▪ The norm in the organization is to rate high, or to
give the “benefit of the doubt”

What can be done to influence context and motivation?
• Develop shared consensus on what good classroom practice looks like
• School leadership articulates clear expectations
• Hold observers accountable for their ratings
• Train observers in how to respond to post-observation conflict and how to hold difficult discussions
What can be done to influence context and motivation?
• Share responsibility by using multiple raters
• Provide information to observers about how their ratings compare with:
▪ Other raters in the jurisdiction
▪ Data from walk throughs done by others
▪ Student achievement growth estimates

Strategies for Ensuring Differentiation When Measuring
Student Growth

Differentiation and Growth Measures
• Discussion of precision
• Precision and differentiation
• Creating ratings from growth measures
▪ Statistical measures
▪ Student Learning Objectives (SLOs)

Precision
• Student growth measures draw conclusions about teacher effectiveness from the growth of a finite number (10-30) of students
▪ The more students you have, the more confident you
can be about the conclusion you draw
▪ The fewer students you have, the more randomness
there is in a student growth measure
• Awareness of precision of growth measures is important to ensuring appropriate ratings
Precision example
• A teacher with 5 students might randomly get 5 students who would have grown quickly or slowly, regardless
• A teacher with 50 students, not so much—and you can be more confident about a growth measure based on 50 students rather than 5

Measures of precision
• Precision can be measured
▪ Standard error, confidence interval
• Confidence interval
▪ A range accompanying a measure that shows “give-and-
take” from randomness
▪ Example: Value-added is a 4 on a scale from 1 to 5 and
has a confidence interval from 3.5 to 4.5
▪ Safeguards against over-interpreting imprecise measures
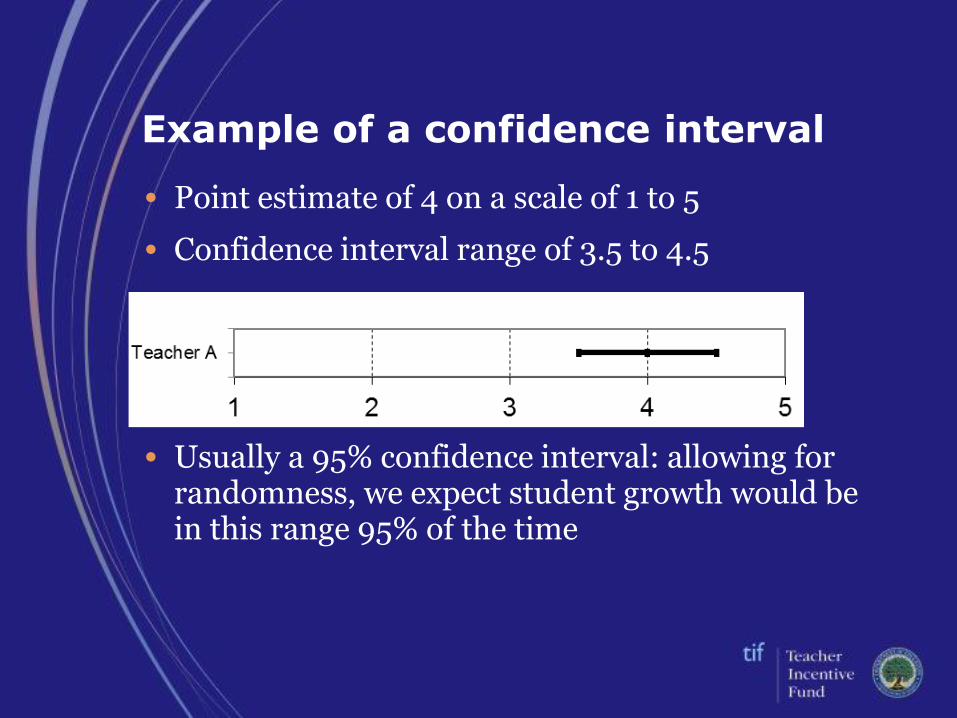
Example of a confidence interval
• Point estimate of 4 on a scale of 1 to 5
• Confidence interval range of 3.5 to 4.5
• Usually a 95% confidence interval: allowing for randomness, we expect student growth would be in this range 95% of the time

Precision and differentiation
• Value-added measures differentiate across teachers more when two things happen:
▪ There are wide differences across teachers in
student growth, and
▪ Student growth is measured precisely, with
relatively less randomness

Example one
• Student growth differs a lot across teachers, and student growth is measured precisely
• It looks like there are big differences by teacher
• And there are! The confidence intervals are small—this isn’t just random

Example two
• Student growth differs a lot across teachers, and student growth is measured imprecisely
• It looks like there are big differences by teacher
• But it might just be randomness! We don’t have confidence in these estimates

Example three
• Student growth differs a little across teachers, and student growth is measured precisely
• It looks like there are small differences by teacher
• And we have confidence in our estimates, which means there really are just small differences

Large differences
• When should we see convincing large differences across teachers?
▪ When there are large underlying differences across
teachers in effectiveness
▪ When the assessment used for growth measures what is
being taught and can capture teacher effectiveness
▪ When you can base value-added measures on large
numbers of students
▪ (Not an exhaustive list)
Large differences, continued.
• Under these circumstances, growth measures will differentiate substantively across teachers
• Compare to more traditional evaluative tools and approaches that may not differentiate as much

Creating ratings from growth measures • Statistical growth measures are often relative
within year and/or subject
▪ Relative to average within year, every year
• One way to help this: compute value-added over a wider reference group
▪ Example: use a value-added measure computed
statewide for setting ratings in a district

Relative measures to ratings
• Position in the distribution among teachers
▪ Standard deviations from average
▪ Percentile rank
• Statistical significance
▪ Is the effect both large and precise enough that it is
unlikely to be explained by randomness?
• You can use a combination of both

Position in distribution of teachers
• Statistical growth measures often have a bell-shaped
distribution
• Lots of teachers in the middle, fewer at the very top or
bottom

Standard deviations from average
• Will likely give more teachers middle ratings rather
than high or low ratings
• Probably reflects reality, but should communicate that
a middle rating is most common and OK
16% 34% 34% 16%

Percentile rank
• Fixes the percentages of teachers who get high, middle,
or low ratings
• Ranges for middle groups will be tighter if the same
percentages get high/middle/low ratings
25% 25% 25% 25%
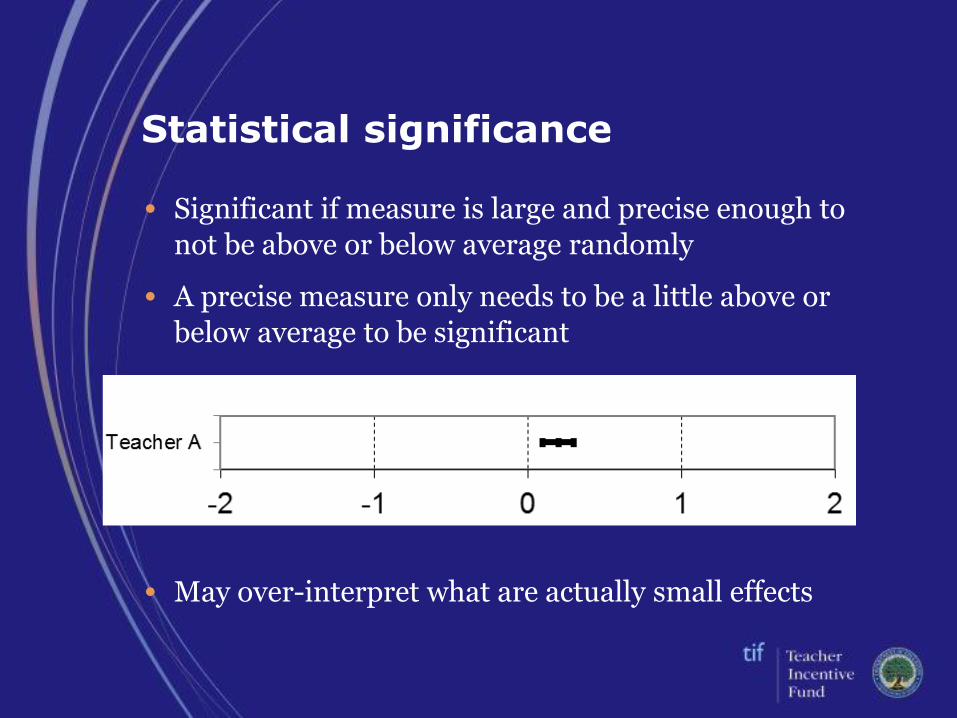
Statistical significance
• Significant if measure is large and precise enough to
not be above or below average randomly
• A precise measure only needs to be a little above or
below average to be significant
• May over-interpret what are actually small effects

“Blowing up”
• If value-added does not differ much across teachers, small differences may get “blown up” when assigning ratings
• Example: if most teachers are about as good as each other, the difference between the 20th and 80th percentiles may be unimportant

Are the differences small?
• If you have growth measures for an entire state, compare the differences within your district to those for the whole state
• You can also compare the standard deviation of value-added across teachers to the standard deviation of achievement across students
▪ If it’s less than 10%, it’s quite small

SLO Target Setting Example
Teacher A Teacher B
Grade / Subject 7th grade science 7th grade science
Assessment District Science Assessment
District Science Assessment
Baseline 70% passing 70% passing
Target 20% growth 15% growth
Outcome 16% growth 16% growth
SLO Goal Met ? No Yes

Sample SLO Scoring Rubric
(4) Student growth has exceeded expectations
(3) Student growth has met expectations
(2) Student growth has partially met expectations
(1) Student growth has minimally met expectations

SLO Scoring Example
Teacher A – Campus 1
Teacher B – Campus 2
Grade / Subject 7th grade science 7th grade science
Assessment District Science Assessment
District Science Assessment
Baseline 70% passing 70% passing
Target 15% growth 15% growth
Outcome 14% growth 14% growth
SLO Rating Partially met expectations (2)
Met expectations (3)

Ensuring Differentiation When Determining the Overall
Performance Level


Combining Measures and Differentiation
• If ratings of practice based on observations and other
sources of evidence differentiate, and student growth
scores differentiate, it is likely that the overall ratings
will, too.
• To ensure differentiation carries through to the overall
ratings:
▪ Don’t leave it to evaluators to make the overall rating
based on a subjective consideration of the evidence
• Use a formula or matrix to translate component scores into a final rating
▪ Consider using more than 4 overall levels

Give Careful Consideration to How Ratings are Combined
Growth Rating
Observation Rating
Below
Expected
Expected Above
Expected
4
Needs Improvement
? Highly Effective
3
Needs Improvement
Effective ?
2
Ineffective? ? ?
1
Ineffective Needs Improvement?
Needs Improvement

Disclaimer
This work was originally produced in whole or in part by Westat with funds from the U.S. Department of
Education under contract number ED-ESE-10-C-0057. The content does not necessarily reflect the position or policy of Westat or the Department of Education, nor does mention or visual representation of trade names,
commercial products, or organizations imply endorsement by Westat or the federal government.