effect of processing variables on quality parameters of ... · effect of processing variables on...
TRANSCRIPT

Effect of Processing Variables on Quality Parameters of Cocadas with Panela
Kevin J. González-Morelo #1, Diofanor Acevedo Correa #2, Piedad Margarita Montero-Castillo #3 # Faculty of Engineering, Food Engineering program, Research Group NUSCA, University of Cartagena
Av. El Consulado, St. 30 No. 48-152. Colombia. 1 [email protected]; 2 [email protected]; 3 [email protected].
Abstract—The effect of processing variables as cooking temperature and time on the thermophysical, colorimetric, textural, sensory properties and proximal chemical composition was evaluated and fitted. It was used 2×2 factorial design made with three replicates, for a total of 12 experimental units. Study factors and levels were cooking temperature (70 and 90 °C) and time (60 and 90 min). The data were analysed through variance analysis using the statistical software Statgraphics Centurion version XVI and Tukey HSD comparison test to identify statistically homogeneous subsets.Low moisture content due to water evaporation during processing of the cocadas was shown, which permitted the fat, protein and ash concentration. Thermophysical properties were affected by temperature and time increasing energy cost in the high temperature and time treatments. Lightness values varied from 86.13 to 53.5 and total color change increased (ΔE), due to the non-enzymatic browning reactions presented.Fracturability, hardness and stiffness values increased at high cooking temperature and time due to the seric protein denaturation that formed a complex between casein proteins.The optimal conditions to make cocadas with panela of good quality were temperature and time of 70 °C and 60 min. This study was the solution to a problem of the manufacturers to improve the elaboration process for this Colombian Caribbean sweet.
Keyword-Cocadas, Cocos nucifera, traditional sweet, texture, color changes, CIELab.
I. INTRODUCTION
Traditional products (TPs) are the relevant elements in the culture, identity and heritage of a region; they contribute to the rural area development and sustainability mitigating the emigration and offering variety and choice to the consumers [1]. They are recognized for the taste and authenticity given by their origin. Generally, TPs have been prepared for large time by a group of people who share a similar lifestyle and using native or produced raw materials in the area that inhabit [1]. In Colombia, TPs production is mainly made by small and medium-size enterprises (SMEs), which do not have standardized processes, breaching the national food regulations for this type of products.
The productive and economics difficult that is being experienced in this country, specifically related to small rural producers, have motivated the beginning of a knowledge, valorisation and innovation process of the local food systems and the most important issue is the possibility of rescuing and adding value to typical agro-food products most desired by consumers, allowing a major development of the local artisanal agro-industry and better income for producers [2,3]. For this, it is necessary to know the basic properties of the products.
Cocada with panela is one of the most recognized traditional sweet in the Colombian Caribbean coast, specifically in the city of Cartagena de Indias, where it represents a desired TP by tourists and city residents.Cocadas are a traditional cooked product composed of grated coconut (Cocos nucifera), cow milk, panela and cinnamon. This is elaborated by cooking at temperatures below 100 °C and random time established by the artisan with constant stirring, in order for the product has its characteristic consistency and appropriate texture. Despite of having a high commercial activity because it is a known product in the region, this food presents differences in its physicochemical, textural and sensory characteristics between manufacturing places due to the lack of the time and temperature control during the cooking process, moreover do not have evidenced of published scientific studies about the quality of cocadas elaborated in the city of Cartagena de Indias. This study would be the solution to a need of the manufacturers to improve their elaboration process besides could be the first published study of Colombian Caribbean traditional sweets. Therefore, the aim of this research was to study the effect of processing variables as the cooking temperature and time on the thermophysical, colorimetric, textural, sensory and chemical composition of cocadas with panela with the purpose of obtaining a quality product.
ISSN (Print) : 2319-8613 ISSN (Online) : 0975-4024 Kevin J. González-Morelo et al. / International Journal of Engineering and Technology (IJET)
DOI: 10.21817/ijet/2017/v9i6/170906102 Vol 9 No 6 Dec 2017-Jan 2018 4238
II. MATERIALS AND METHODS
A. Raw Material
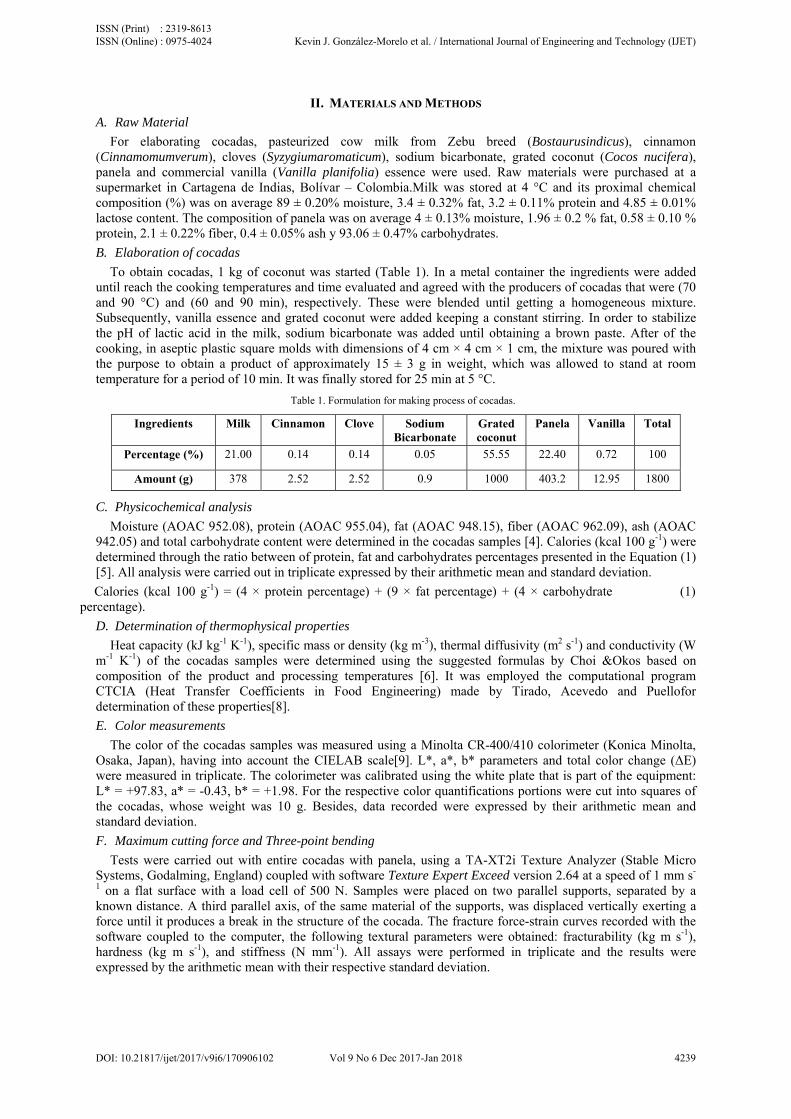
For elaborating cocadas, pasteurized cow milk from Zebu breed (Bostaurusindicus), cinnamon (Cinnamomumverum), cloves (Syzygiumaromaticum), sodium bicarbonate, grated coconut (Cocos nucifera), panela and commercial vanilla (Vanilla planifolia) essence were used. Raw materials were purchased at a supermarket in Cartagena de Indias, Bolívar – Colombia.Milk was stored at 4 °C and its proximal chemical composition (%) was on average 89 ± 0.20% moisture, 3.4 ± 0.32% fat, 3.2 ± 0.11% protein and 4.85 ± 0.01% lactose content. The composition of panela was on average 4 ± 0.13% moisture, 1.96 ± 0.2 % fat, 0.58 ± 0.10 % protein, 2.1 ± 0.22% fiber, 0.4 ± 0.05% ash y 93.06 ± 0.47% carbohydrates.
B. Elaboration of cocadas
To obtain cocadas, 1 kg of coconut was started (Table 1). In a metal container the ingredients were added until reach the cooking temperatures and time evaluated and agreed with the producers of cocadas that were (70 and 90 °C) and (60 and 90 min), respectively. These were blended until getting a homogeneous mixture. Subsequently, vanilla essence and grated coconut were added keeping a constant stirring. In order to stabilize the pH of lactic acid in the milk, sodium bicarbonate was added until obtaining a brown paste. After of the cooking, in aseptic plastic square molds with dimensions of 4 cm × 4 cm × 1 cm, the mixture was poured with the purpose to obtain a product of approximately 15 ± 3 g in weight, which was allowed to stand at room temperature for a period of 10 min. It was finally stored for 25 min at 5 °C.
Table 1. Formulation for making process of cocadas.
Ingredients Milk Cinnamon Clove Sodium Bicarbonate
Grated coconut
Panela Vanilla Total
Percentage (%) 21.00 0.14 0.14 0.05 55.55 22.40 0.72 100
Amount (g) 378 2.52 2.52 0.9 1000 403.2 12.95 1800
C. Physicochemical analysis
Moisture (AOAC 952.08), protein (AOAC 955.04), fat (AOAC 948.15), fiber (AOAC 962.09), ash (AOAC 942.05) and total carbohydrate content were determined in the cocadas samples [4]. Calories (kcal 100 g-1) were determined through the ratio between of protein, fat and carbohydrates percentages presented in the Equation (1) [5]. All analysis were carried out in triplicate expressed by their arithmetic mean and standard deviation.
Calories (kcal 100 g-1) = (4 × protein percentage) + (9 × fat percentage) + (4 × carbohydrate percentage).
(1)
D. Determination of thermophysical properties
Heat capacity (kJ kg-1 K-1), specific mass or density (kg m-3), thermal diffusivity (m2 s-1) and conductivity (W m-1 K-1) of the cocadas samples were determined using the suggested formulas by Choi &Okos based on composition of the product and processing temperatures [6]. It was employed the computational program CTCIA (Heat Transfer Coefficients in Food Engineering) made by Tirado, Acevedo and Puellofor determination of these properties[8].
E. Color measurements
The color of the cocadas samples was measured using a Minolta CR-400/410 colorimeter (Konica Minolta, Osaka, Japan), having into account the CIELAB scale[9]. L*, a*, b* parameters and total color change (ΔE) were measured in triplicate. The colorimeter was calibrated using the white plate that is part of the equipment: L* = +97.83, a* = -0.43, b* = +1.98. For the respective color quantifications portions were cut into squares of the cocadas, whose weight was 10 g. Besides, data recorded were expressed by their arithmetic mean and standard deviation.
F. Maximum cutting force and Three-point bending
Tests were carried out with entire cocadas with panela, using a TA-XT2i Texture Analyzer (Stable Micro Systems, Godalming, England) coupled with software Texture Expert Exceed version 2.64 at a speed of 1 mm s-
1 on a flat surface with a load cell of 500 N. Samples were placed on two parallel supports, separated by a known distance. A third parallel axis, of the same material of the supports, was displaced vertically exerting a force until it produces a break in the structure of the cocada. The fracture force-strain curves recorded with the software coupled to the computer, the following textural parameters were obtained: fracturability (kg m s-1), hardness (kg m s-1), and stiffness (N mm-1). All assays were performed in triplicate and the results were expressed by the arithmetic mean with their respective standard deviation.
ISSN (Print) : 2319-8613 ISSN (Online) : 0975-4024 Kevin J. González-Morelo et al. / International Journal of Engineering and Technology (IJET)
DOI: 10.21817/ijet/2017/v9i6/170906102 Vol 9 No 6 Dec 2017-Jan 2018 4239

G. Sensory evaluation
A five-point hedonic scale was used where 50 non-trained panelists indicated their degree of acceptance in the parameters such as color, odor, taste, hardness and overall acceptability of entire cocadas. The categories in the scale varied from “like very much”, with value of 5 until “dislike very much” with a value of 1. This evaluation was made in an appropriated, ventilated room and controlled conditions of temperature and environment humidity[10]. Data were collected on a spreadsheet and transformed into numerical scores for analysis.
H. Experimental design and data processing
It was used a 2×2 factorial design conformed by four treatments and made with three replicates, for a total of 12 experimental units. The factors and their respective levels were: temperature (70 °C and 90 °C) and time (60 °C and 90 min) (Table 2). The respond variables of the study were the physicochemical, thermophysical, colorimetric, textural and sensory properties of the cocadas.
For data processing, it was made a variance analysis using the statistical software STATGRAPHICS Centurion version XVI coupled with Windows 10, in order to confirm the existence of significant statistical differences in the obtained results, with a significance of 5 % (p ≤ 0.05). Tukey HSD was used as the multiple comparison test[11]. Also, a correlation was made from the r-Pearson test, between each of the parameters of the instrumental texture and those found in the colorimetric tests, in order to analyse the relationships between the variables and find the best characteristics of the final product as a function of time and processing temperature. The correlation was considered significant at the 0.05 level and highly significant at the 0.01 level (bilateral), similar to that performed in other investigations[12]–[14].
Table 2. Experimental design
Experimental units
A= Temperature (°C)
Codes B = Time (s) Codes Interaction(A*B)
1 70 -1 60 -0.5 70°C*60min
2 90 1 60 -0.5 90°C*60min
3 70 -1 90 0.5 70°C*90min
4 90 1 90 0.5 90°C*90min
5 90 1 60 -0.5 90°C*60min
6 70 -1 60 -0.5 70°C*60min
7 70 -1 90 0.5 70°C*90min
8 90 1 90 0.5 90°C*90min
9 70 -1 60 -0.5 70°C*60min
10 70 -1 90 0.5 70°C*90min
11 90 1 90 0.5 90°C*90min
12 90 1 60 -0.5 90°C*60min
Where the statistic model for this two-factor design with interaction is represented in the Equation (2):
μ (2)
is the respond of the experimental design, μis the general average, is the effect of the ith of the factor A (Temperature °C), is the effect of the jth of the factor B (Time, s), is the effect of the interaction between the factors (A*B) and is a random experimental error component. Both factors were assumed to be fixed and the effects of treatments were defined as deviations from the overall average.
III. RESULTS AND DISCUSSIONS
A. Physicochemical composition of cocadas samples
The increasing of the cooking temperature at constant time significantly affected the moisture content (T1 y T3). The highest concentration of fat, protein and ash was evidenced when the temperature was increased to 90 °C for 30 min (T4) (Table 3). Acharya et al.,[15]characterized the physicochemical and microbiological properties of Gundpak, a dairy-based sweet obtained by cooking, which uses dried coconut, similar product to cocadas, where average contents were 16.3 % moisture, 11.40% protein, 22.90% fat, 43.70% carbohydrates and 3.00% ash content.
ISSN (Print) : 2319-8613 ISSN (Online) : 0975-4024 Kevin J. González-Morelo et al. / International Journal of Engineering and Technology (IJET)
DOI: 10.21817/ijet/2017/v9i6/170906102 Vol 9 No 6 Dec 2017-Jan 2018 4240

Table 3. Chemical composition of cocadas
Parameters(%) Treatments
T1 T2 T3 T4 Moisture 8.20 ± 0.65c 7.31 ± 0.50b 7.32 ± 0.55b 6.50 ± 0.50a
Fat 17.86 ± 0.30a 19.80 ±0.31b 19.97 ± 0.29b 22.16 ± 0.28c
Protein 8.01 ± 0.60ab 7.90 ±0.55b 8.05 ±0.47bc 8.13 ± 0.53c
Ash 1.80 ± 0.63a 1.83 ± 0.58a 1,77 ± 0.61a 2.0 ± 0.50b
Crude fiber 3.73 ± 0.10a 3.74 ± 0.09a 3.74 ± 0.11a 3.72± 0.11a
Carbohydrate 61.02 ± 3.39a 61.90 ± 3.43a 60.90 ± 3.3a 62.10 ± 3.50b
Calories (Kcal) 370.32 ± 4.56a 369.63 ± 4.00a 370.50 ± 3.70a 369.85 ± 4.06a
Note: Rows with different letters indicate the existence of statistically significant difference (p ≤ 0.05).T1: T = 70 °C; t = 60 min. T2: T = 70 °C; t = 90 min. T3: T = 90 °C; t = 60 min. T4: T = 90 °C; t = 90 min.
It is assumed the protein content in the cocadas have its origin in the cow milk as base in the elaboration of cocadas which had 3.4 ± 0.32% fat content[16], [17]. No significantly statistical differences were found (p ≥ 0.05) in the fiber content of the treatments. The fiber content was contributed by the grated coconut, which possess an approximately of wet and dry fiber content of 4.53% and 58.71%, respectively[18], [19]. On the other hand, fiber supply in the cocadas provides benefits effects for consumer health due to its intervention in the gut transit control, cholesterol balance and lower risk of cardiovascular diseases[20].
The final carbohydrate content of the cocadas was 61.48 ± 0.69% provided by grated coconut, the panela and milk. A good caloric contribution was obtained in the cocadas (370.07 ± 0.40 kcal), thanks to the amount of carbohydrates and lipids in theirs, therefore, they can be cataloged as a product of good source of energy.
B. Thermophysical properties
Thermal conductivity, thermal diffusivity and heat capacity increased with the temperature and the time (Table 4), which were due to that during the cooking process the material was concentrated, becoming more compact and shrinking, improving the transfer heat by the form of a flat plate that obtained the product at the end of the process of rest and molding, however, the energy cost was highest in comparison of low temperature and time treatments.
Table 4. Thermophysical properties of cocadas samples at different temperatures
Property Treatments
T1 T2 T3 T4
Thermal conductivity(W m-1 K-1) 0.2401 ± 0.27a 0.2656 ± 0.20b 0.2653 ± 0.24b 0.2726 ± 0.25c
Density (kg m-3) 1301.6 ±0.09d 1281.32 ± 0.06c 1278.08 ± 0.07b 1251.1 ± 0.06a
Heat capacity(kJ kg-1 K-1) 1.9740 ± 0.012a 1.9956 ± 0.011b 1.994 ± 0.015bc 2.001 ± 0.013c
Thermal diffusivity × 10-7 (m2 s-1) 1.080 ± 0.004a 1.088 ± 0.003b 1.097 ± 0.001c 1.100 ± 0.017d
Note: Rows with different letters indicate the existence of statistically significant difference (p ≤ 0.05). T1: T = 70 °C; t = 60 min. T2: T = 70 °C; t = 90 min. T3: T = 90 °C; t = 60 min. T4: T = 90 °C; t = 90 min.
Recent researches confirm that the thermophysical properties are relevant parameters in the description of the heat transfer during the heating of solid foods, bringing forward great advantages their knowledge, especially for the energy costs and the quality assurance of the products[21], [22]. Alviset al.,[23]affirm that of the physical properties is essential for the design and periodic improvement of the machinery used in the processing of food products, especially which participates in the unit operations such as pumping and evaporation. The variations of the thermophysical property values in the cocadas depended on the increase of the temperature, such phenomenon was similar to the study reported by Barbosa et al.,[24], where they evaluated the thermophysical and rheological properties of Brazilian dulce de leche with coconut flakes made at different temperatures (28.4, 37.8, 48.2, 59.2, 68.8 and 76.4 °C). In this investigation heat capacity increased from 2 633.2 – 3 101.8 J kg-
1 °C-1, thermal conductivity increased from 0.383-0.452 W m-1 °C-1; and the thermal diffusivity increased from 1.082 × 10⁻⁷ m2 s-1 to 1.130 × 10⁻⁷ m2 s-1. However, a decrease in density was observed, varying from 1 350.7 to 1 310.7 kg m-3, a similar phenomenon occurred in this study for cocadas from 1 301.6 ± 0.09 to 1 251.1 ± 0.33 kg m-3. The decrease in density was possibly due to the fact that during the cooking process, evaporation of the water occurs being more dense than the other constituent as lipids, obtaining a product of lower weight. This phenomenon has also been seen in other food matrices such as fruits[25].
ISSN (Print) : 2319-8613 ISSN (Online) : 0975-4024 Kevin J. González-Morelo et al. / International Journal of Engineering and Technology (IJET)
DOI: 10.21817/ijet/2017/v9i6/170906102 Vol 9 No 6 Dec 2017-Jan 2018 4241
C. Colorimetric measurements
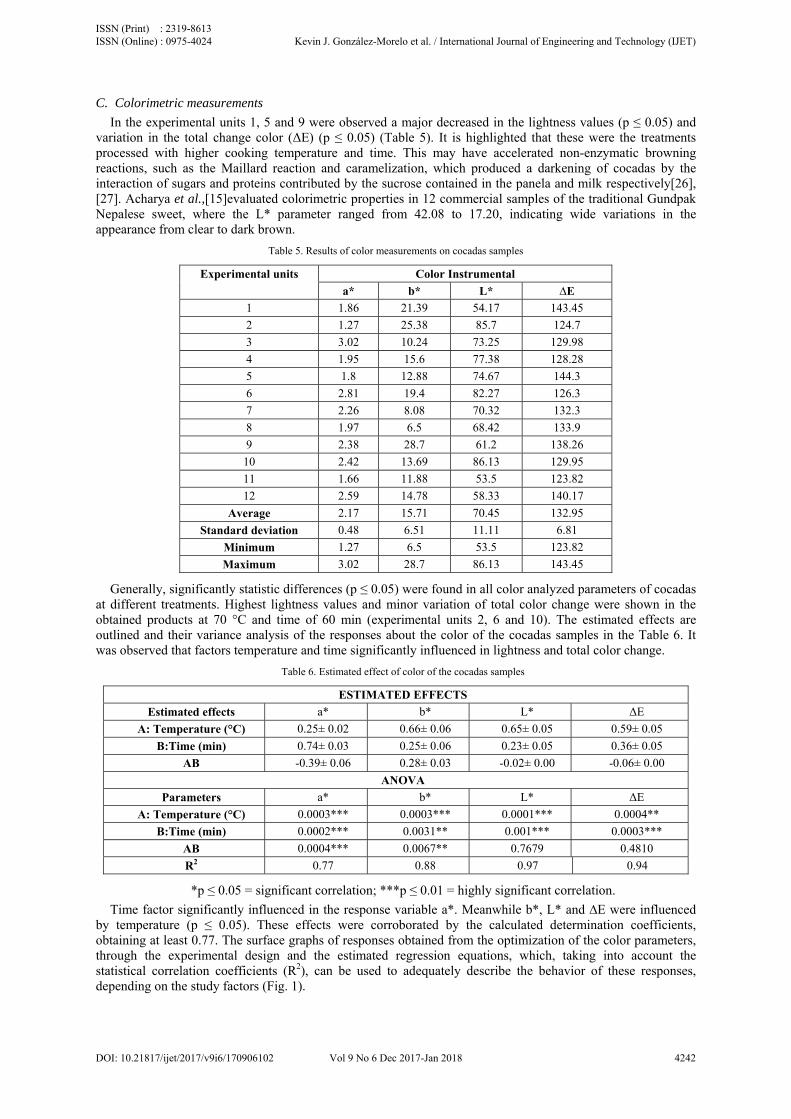
In the experimental units 1, 5 and 9 were observed a major decreased in the lightness values (p ≤ 0.05) and variation in the total change color (ΔE) (p ≤ 0.05) (Table 5). It is highlighted that these were the treatments processed with higher cooking temperature and time. This may have accelerated non-enzymatic browning reactions, such as the Maillard reaction and caramelization, which produced a darkening of cocadas by the interaction of sugars and proteins contributed by the sucrose contained in the panela and milk respectively[26], [27]. Acharya et al.,[15]evaluated colorimetric properties in 12 commercial samples of the traditional Gundpak Nepalese sweet, where the L* parameter ranged from 42.08 to 17.20, indicating wide variations in the appearance from clear to dark brown.
Table 5. Results of color measurements on cocadas samples
Experimental units Color Instrumental
a* b* L* ∆E
1 1.86 21.39 54.17 143.45
2 1.27 25.38 85.7 124.7
3 3.02 10.24 73.25 129.98
4 1.95 15.6 77.38 128.28
5 1.8 12.88 74.67 144.3
6 2.81 19.4 82.27 126.3
7 2.26 8.08 70.32 132.3
8 1.97 6.5 68.42 133.9
9 2.38 28.7 61.2 138.26
10 2.42 13.69 86.13 129.95
11 1.66 11.88 53.5 123.82
12 2.59 14.78 58.33 140.17
Average 2.17 15.71 70.45 132.95
Standard deviation 0.48 6.51 11.11 6.81
Minimum 1.27 6.5 53.5 123.82
Maximum 3.02 28.7 86.13 143.45
Generally, significantly statistic differences (p ≤ 0.05) were found in all color analyzed parameters of cocadas at different treatments. Highest lightness values and minor variation of total color change were shown in the obtained products at 70 °C and time of 60 min (experimental units 2, 6 and 10). The estimated effects are outlined and their variance analysis of the responses about the color of the cocadas samples in the Table 6. It was observed that factors temperature and time significantly influenced in lightness and total color change.
Table 6. Estimated effect of color of the cocadas samples
ESTIMATED EFFECTS
Estimated effects a* b* L* ΔE
A: Temperature (°C) 0.25± 0.02 0.66± 0.06 0.65± 0.05 0.59± 0.05
B:Time (min) 0.74± 0.03 0.25± 0.06 0.23± 0.05 0.36± 0.05
AB -0.39± 0.06 0.28± 0.03 -0.02± 0.00 -0.06± 0.00
ANOVA
Parameters a* b* L* ΔE
A: Temperature (°C) 0.0003*** 0.0003*** 0.0001*** 0.0004**
B:Time (min) 0.0002*** 0.0031** 0.001*** 0.0003***
AB 0.0004*** 0.0067** 0.7679 0.4810
R2 0.77 0.88 0.97 0.94
*p ≤ 0.05 = significant correlation; ***p ≤ 0.01 = highly significant correlation.
Time factor significantly influenced in the response variable a*. Meanwhile b*, L* and ∆E were influenced by temperature (p ≤ 0.05). These effects were corroborated by the calculated determination coefficients, obtaining at least 0.77. The surface graphs of responses obtained from the optimization of the color parameters, through the experimental design and the estimated regression equations, which, taking into account the statistical correlation coefficients (R2), can be used to adequately describe the behavior of these responses, depending on the study factors (Fig. 1).
ISSN (Print) : 2319-8613 ISSN (Online) : 0975-4024 Kevin J. González-Morelo et al. / International Journal of Engineering and Technology (IJET)
DOI: 10.21817/ijet/2017/v9i6/170906102 Vol 9 No 6 Dec 2017-Jan 2018 4242

E0
Equation of 2.
Equation of- 2.2
quation of fit0.0376667*Te
0.0005055Opt
Temperat
f fitted model35389*Time
OptTemperat
f fitted model22511*Time +
OptiTemperat
tted model: aemperature + 556*Temperatimal value= ture = 90°C a
l: b* = 193.70+ 0.0302*Temimal value= 2ture = 70°C a
l: L* = 284.74+ 0.0238556*Timal value = ture = 70°C a
a* = -0.4766670.0355*Time
ature*Time 2.31
and 60 min.
5 - 2.28317*Tmperature*Tim20.99 and 90 min.
42 - 2.38183*Temperature*84.72
and 60 min.
a)
7 + -
b)
Temperature -me
c)
*Temperature Time
-
ISSN (Print) : 2319-8613 ISSN (Online) : 0975-4024 Kevin J. González-Morelo et al. / International Journal of Engineering and Technology (IJET)
DOI: 10.21817/ijet/2017/v9i6/170906102 Vol 9 No 6 Dec 2017-Jan 2018 4243

Accorwith the decreasedvalues, aothers co
Te
T
SeveraprocessedMoyano&of the fostandardidefinition
D. Textu
The frcooking ptextural p(Table 8experimefracturabthe fact interactiolactoalbu
Fig. 1. Colorimet
ding to the obfactors temp
d when the ca significant nolor parameter
Varia
mperature (°C)
Time (s)
a*
b*
L*
*p≤
al researches ad; its study &Pedreschi[29ods, dependinization of pron of the colors
ural properties
racturability, process occasparameters we8). It is impoental units 6, bility, hardnesthat during th
ons as Van deumin and β-lac
E0
tric parameter res
btained correlperature and tcooking tempenegatively corrs were positiv
Table7. Co
ables
r-Pearson
p-value
r-Pearson
p-value
r-Pearson
p-value
r-Pearson
p-value
r-Pearson
p-value
≤0.05 = signif
affirm color iis indispen
9]indicate thang of the foododucts to a qus of human be
s
hardness andsioned by proere in the exportant to high
8 and 10 prs and stiffneshe cooking th
er Waals and hctoglobulins),
Equation of fi0.531167*Tem
0.010283Optim
Temperat
sponse surface gr
lations betweetime (Table 7erature increarrelation was ve (r-Pearson
orrelations betwee
Tem(°
n
n 0
1
n -0
0
n -0
0
n -0
0
ficant correlati
s a quality attsable to pro
at temperature d matrix whicuantifiable maeings is in a no
d stiffness vartein denaturat
perimental unihlight these wrocessed to ms (p ≤ 0.05). Thermal treatmhydrophobic f, which are m
itted model: Δmperature - 0.433*Temperatumal value = 1ture = 70°C a
raphs: a) a* value
en each one o7), it was ob
ased (rho-Pearpresented wi> 0 y p ≤ 0.05
en the color param
mperature °C)
1
0.000
1.000
0.753*
0.004
.736**
0.001
.853**
0.000
ion and p≤0.0
tribute are veromote the cand time in th
ch we are worargin, which on-objective w
riation in the tion of the miits of cocadaswere made w
minor temperaThese differen
ment at high tforces and thu
more thermolab
ΔE = 149.898482056*Time ure*Time 126.98 and 60 min.
es; b) b* values; c
f the color pabserved that vrson < 0 y p ith studied hig5).
meters of the sam
Time (s)
1
0.229
0.394
-0.590
0.230
-0.417
0.336
01 = highly sig
ry important aonsumer acchermal procesrking. The stuis appreciated
way[30], [31].
cocadas can ilk and dehyds 5, 7 and 11;with high temature (70 °C) nces in the firtemperature,
us to the disorbile than case
d)
8 - +
c) L* values; d) D
arameters in thvalues of a*, ≤ 0.05). Reg
gh temperatur
mples of cocadas
a*
1
0.727*
0.059
0.512*
0.046
gnificant corre
as the fresh foceptance[28]. sses affect the udy of color ind and attracti
be explaineddration[32]. Th followed by
mperature (90were obtaine
rmness of the the proteins
rganization of ein. Moreover,
Delta (Δ) E values
he cocadas wb*and L* p
garding to obres and time,
b*
1
0.979**
0.000
elation.
oods as technoOn the oth
colorimetric pn food has allve; the perce
d for changeshe highest val2, 4 and 12 (
0 °C), whereed cocadas wproduct may of milk loss
f lactoseric pro, seric protein
s.
ith panela parameters tained L* and with
L*
1
ologically her hand, properties lowed the
eption and
s after the lues in all (p ≤ 0.05) eas in the with a low
be due to the weak
oteins (Α-ns bind on
ISSN (Print) : 2319-8613 ISSN (Online) : 0975-4024 Kevin J. González-Morelo et al. / International Journal of Engineering and Technology (IJET)
DOI: 10.21817/ijet/2017/v9i6/170906102 Vol 9 No 6 Dec 2017-Jan 2018 4244
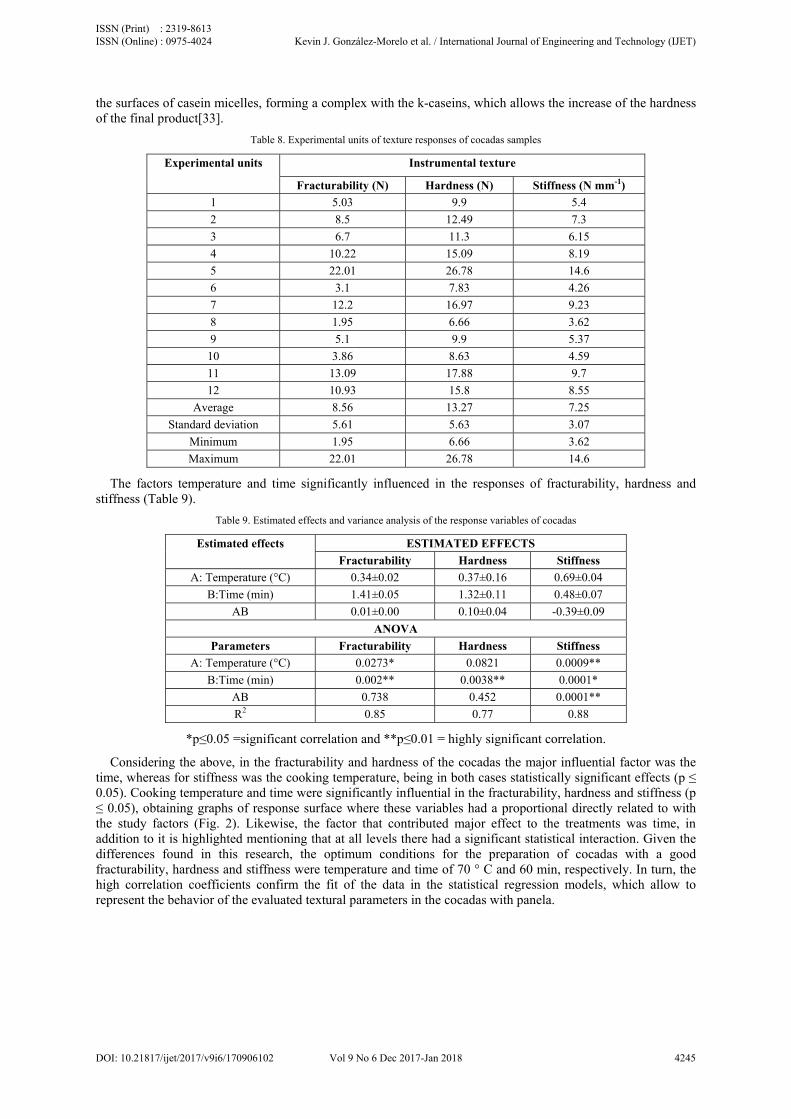
the surfaces of casein micelles, forming a complex with the k-caseins, which allows the increase of the hardness of the final product[33].
Table 8. Experimental units of texture responses of cocadas samples
Experimental units Instrumental texture
Fracturability (N) Hardness (N) Stiffness (N mm-1)
1 5.03 9.9 5.4
2 8.5 12.49 7.3
3 6.7 11.3 6.15
4 10.22 15.09 8.19
5 22.01 26.78 14.6
6 3.1 7.83 4.26
7 12.2 16.97 9.23
8 1.95 6.66 3.62
9 5.1 9.9 5.37
10 3.86 8.63 4.59
11 13.09 17.88 9.7
12 10.93 15.8 8.55
Average 8.56 13.27 7.25
Standard deviation 5.61 5.63 3.07
Minimum 1.95 6.66 3.62
Maximum 22.01 26.78 14.6
The factors temperature and time significantly influenced in the responses of fracturability, hardness and stiffness (Table 9).
Table 9. Estimated effects and variance analysis of the response variables of cocadas
Estimated effects ESTIMATED EFFECTS
Fracturability Hardness Stiffness
A: Temperature (°C) 0.34±0.02 0.37±0.16 0.69±0.04
B:Time (min) 1.41±0.05 1.32±0.11 0.48±0.07
AB 0.01±0.00 0.10±0.04 -0.39±0.09
ANOVA
Parameters Fracturability Hardness Stiffness
A: Temperature (°C) 0.0273* 0.0821 0.0009**
B:Time (min) 0.002** 0.0038** 0.0001*
AB 0.738 0.452 0.0001**
R2 0.85 0.77 0.88
*p≤0.05 =significant correlation and **p≤0.01 = highly significant correlation.
Considering the above, in the fracturability and hardness of the cocadas the major influential factor was the time, whereas for stiffness was the cooking temperature, being in both cases statistically significant effects (p ≤ 0.05). Cooking temperature and time were significantly influential in the fracturability, hardness and stiffness (p ≤ 0.05), obtaining graphs of response surface where these variables had a proportional directly related to with the study factors (Fig. 2). Likewise, the factor that contributed major effect to the treatments was time, in addition to it is highlighted mentioning that at all levels there had a significant statistical interaction. Given the differences found in this research, the optimum conditions for the preparation of cocadas with a good fracturability, hardness and stiffness were temperature and time of 70 ° C and 60 min, respectively. In turn, the high correlation coefficients confirm the fit of the data in the statistical regression models, which allow to represent the behavior of the evaluated textural parameters in the cocadas with panela.
ISSN (Print) : 2319-8613 ISSN (Online) : 0975-4024 Kevin J. González-Morelo et al. / International Journal of Engineering and Technology (IJET)
DOI: 10.21817/ijet/2017/v9i6/170906102 Vol 9 No 6 Dec 2017-Jan 2018 4245

The cothis textuthe respovaried frosignifican
ontours of the ural parameteronse surface gom 4.5 N mmntly the textur
bottom of ther in the codas
graph for hardnm-1 a 9.00 N mre of cocadas.
Equati0
Equa
e response sursamples rangness indicated
mm-1, which i
ion of fitted m.525167*Tem
0.004161Opt
Temperat
ation of fitted0.559*Temp
0.004538
OptTemperat
rface graph forged from 4.70 d that it rangeindicates that
a)
model: Fractumperature + 0.3111*Temperattimal value = ture = 70°C a
b) d model: Harderature + 0.4189*Temperatu
timal value = ture = 70°C a
r fracturabilityN to 12.00 N
ed between 9.0an increase o
urability = -36376167*Timeture*Time 5.15
and 60 min.
dness = -35.213278*Time -ure*Time.
9.65 and 60 min.
y indicated thN. On the othe00 N to 18.00
or a decrease o
.7017 + e –
133 + -
at the optimaler hand, the co0 N and stiffneof the factors
l value for ontours of ess values influence
ISSN (Print) : 2319-8613 ISSN (Online) : 0975-4024 Kevin J. González-Morelo et al. / International Journal of Engineering and Technology (IJET)
DOI: 10.21817/ijet/2017/v9i6/170906102 Vol 9 No 6 Dec 2017-Jan 2018 4246

Texturprocess, of the samevidenceinfluencepropertie62.50 kgcocadas a
Tempe
Ti
Fractu
Har
Stif
It was ≤ 0.01). was not s
E. Senso
Signifacceptabicolor, odwas no sincreasedgeneral aresults wresponsib
ral characteristhe used ingremples[15]. Had information
ed the texturees of dodaburfg m s-1 with tare outlined in
Variables
erature
ime
urability
dness
ffness
observed thaOn the other statistically sig
ory evaluation
ficantly statistiility (Fig. 3).
dor and taste rsignificant stad, the hardnesacceptance po
were reported ble for the col
Equ
Optima
F
stics obtainededients duringardness, fractun on the intee, Chawla et fi, a traditionathe passage on Table 10.
Table 1
s
r-Pearson
p-valor
r-Pearson
p-valor
r-Pearson
p-valor
r-Pearson
p-value
r-Pearson
p-value
at between frachand, betweegnificant (p ≥
n
ical differenceThe increasinrating of the patistical differss increased (ositioning it a
by Torres etor being volat
uation of fitted0.2795*Temp
0.002177al value = 8.45
Fig. 2. Response s
dof the cocadag manufacturiurability and ernal structureal., [34]studi
al Indian sweef hours. The
10. Correlations b
Temperatu
1
0.000
1.000
0.899
0.003
0.799
0.003
0.863
0.003
cturing and haen stiffness, fr
0.05).
e were found ng of cooking panelists, makrence betweenT4).The T1 tr
as the most apt al.,[35]whictilized by the
c)
d model: Stifperature + 0.1778*Temperat5; Temperatu
surface graph for
as with panelaing and proximstiffness data e of cooked ied the effectet obtaining an
correlations m
between the textur
ure Time
1
0.336
0.262
0.375
0.250
0.401
0.211
ardness, thereracturability a
(p ≤ 0.05) regtemperature aking the prodn T1 and T2 reatment obtappropriate proch indicated taction of temp
ffness = -16.9899222*Time ture*Time ure = 70°C an
texture paramete
a in the presemal compositindicated a gcocadas. The
t of the tempn increasing inmade between
ral parameters of
Fractura
1
1.00
0.00
1.00
0.32
e was a direct and hardness,
garding to coland time (T2,
duct darker anin the odor. A
ained the highocess conditiothat this loss peratures.
883 + -
nd 60 min
ers
ent study can tion variation,ood fresh dege freezing weperature in thn the hardnessn textural par
f cocadas
ability Ha
00
00
00
26 0
and highly sithere was a d
lor, odor, tastT3 and T4) c
nd less palatabAs the tempehest qualificaton to elaboratis possibly d
be due to the especially of
gree, while theere another fe textural ands from 47.50 krameters of th
ardness S
1
1.000
0.275
ignificant corrdirect correlati
te, hardness ancaused a decreble. Neverthelrature and fir
tion with respte the cocadadue to the co
e cooking f moisture e stiffness factor that d sensory kg m s-1 to he cooked
Stiffness
1
relation (p ion, but it
nd overall ease in the less, there ring times pect to the s. Similar
omponents
ISSN (Print) : 2319-8613 ISSN (Online) : 0975-4024 Kevin J. González-Morelo et al. / International Journal of Engineering and Technology (IJET)
DOI: 10.21817/ijet/2017/v9i6/170906102 Vol 9 No 6 Dec 2017-Jan 2018 4247

Fig. 3. Average rating of sensory analysis made on samples of cocadas
In other researches, Talwar&Brar[36]who evaluated variants of Pinni, a traditional Indian milk-based sweet obtained good acceptance from panelists. Gupta et al.,[37]performed sensory tests with 10 trained-panelists on a traditional South Indian sweet known as burfi which uses grated coconut. The burfi samples obtained a general acceptance surpassing a threshold of 8.00.
IV. CONCLUSIONS
Colombian traditional milk-based products as cocadas are very important for tourists and resident of the city of Cartagena de Indias, in order to maintain the culture and gastronomy of the region. Among places of elaboration of this sweet, there were not uniformity of the product, which caused differences in their thermophysical, textural, color, sensory properties and chemical composition. In this four established and agreed treatments by the producers of cocadas in the study were shown that at 70 °C and 60 min were obtained the better quality conditions to make cocadas. Cocadas elaborated at high temperature and time presented low moisture content, for water loss occurred in the cooking process, which permitted the fat, protein and ash concentration, in addition to supply more energy in the making process. At major temperatures and times, lightness decreased and total color change (ΔE) increased, due to non-enzymatic browning reactions, likewise the fracturability, hardness and stiffness.
REFERENCES [1] J. Kirstbergsson, K. y Oliveira, Traditional Foods, 1st ed. Springer link, 2016. [2] E. Saldaña, J. H. Behrens, J. S. Serrano, F. Ribeiro, M. A. de Almeida, and C. J. Contreras-Castillo, “Microstructure, texture profile
and descriptive analysis of texture for traditional and light mortadella,” Food Struct., vol. 6, pp. 13–20, 2015. [3] W. Verbeke, L. Guerrero, V. L. Almli, F. Vanhonacker, and M. Hersleth, “European Consumers’ Definition and Perception of
Traditional Foods,” in Traditional Foods, Boston, MA: Springer US, 2016, pp. 3–16. [4] AOAC, Official methods of analysis of AOAC International. AOAC International., 18th ed. 2005. [5] A. Alvis, C. Vélez, M. Rada-Mendoza, A. Villamiel, and H. Villada, “Heat transfer coefficient during deep-fat frying,” Food Control,
vol. 20, no. 4, pp. 321–325, 2009. [6] Y. Choi and M. Okos, “Thermal properties of foods,” in Physical and Chemical properties of foods, 1983, pp. 93–101. [7] D. F. Tirado, D. Acevedo, and P. Puello, “Determinación Computacional del Coeficiente de Transferencia de Calor y Propiedades
Termofísicas de Alimentos,” Inf. tecnológica, vol. 25, no. 3, pp. 53–58, 2014. [8] P. P. Acharya, G. P. Kharel, and M. Bhandari, “Survey on Production , Marketing and Consumption of Gundpak : A Traditional Khoa
Based Milk Product of Nepal,” vol. 6, pp. 43–52, 2011. [9] L. C. Julio, P. M. Montero, and D. Acevedo, “Calidad y Aceptabilidad de Chorizos Formulados con Plasma Sanguíneo Bovino y Pasta
de Ajonjolí,” Inf. tecnológica, vol. 26, no. 3, pp. 25–32, 2015. [10] Statgraphics, “Statpgraphics Centurion Statpoint technologies Inc.” 2009. [11] A. Arias-Méndez, A. Warning, A. K. Dattaand, and E. Balsa-Canto, “Quality and safety driven optimal operation of deep-fat frying of
potato chips.,” J. Food Eng., vol. 119, no. 1, pp. 125–134, 2013. [12] M. Romero de Ávila, M. Isabel Cambero, J. A. Ordóñez, L. de la Hoz, and A. M. Herrero, “Rheological behaviour of commercial
cooked meat products evaluated by tensile test and texture profile analysis (TPA),” Meat Sci., vol. 98, no. 2, pp. 310–315, Oct. 2014. [13] A. M. Paula and A. C. Conti-Silva, “Texture profile and correlation between sensory and instrumental analyses on extruded snacks,” J.
Food Eng., vol. 121, pp. 9–14, Jan. 2014. [14] P. P. Acharya, G. P. Kharel, and R. Chetana, “Physico-Chemical and Microbiological Characteristics of Gundpak – A Traditional Milk
Product of Nepal,” J. Food Res., vol. 4, no. 4, p. 30, 2015. [15] M. H. Enb, A., AbouDonia, M. A., Abd-Rabou, N. S., Abou-Arab, A. A. K., & El-Senaity, “Chemical composition of raw milk and
heavy metals behavior during processing of milk products,” Glob. Vet., vol. 3, no. 3, pp. 268–275, 2009. [16] W. L. Claeys et al., “Consumption of raw or heated milk from different species: An evaluation of the nutritional and potential health
benefits,” Food Control, vol. 42, pp. 188–201, 2014.
4.34.1
3.53.3
4 4.1
3.5 3.4
4.5 4.4
3.23
3.8
4.34
4.74.5
3.6
3.013.2
1
1.5
2
2.5
3
3.5
4
4.5
5
T1 T2 T3 T4
Sco
re
Treatments
Color
Odor
Taste
Hardness
Overall acceptance
ISSN (Print) : 2319-8613 ISSN (Online) : 0975-4024 Kevin J. González-Morelo et al. / International Journal of Engineering and Technology (IJET)
DOI: 10.21817/ijet/2017/v9i6/170906102 Vol 9 No 6 Dec 2017-Jan 2018 4248

[17] M. García, J. Vargas, and D. Molina, “Caracterización de la Funcionalidad Tecnológica de una Fuente Rica en Fibra Dietaria Obtenida a partir de Cáscara de Plátano,” Rev. Fac. Nac. Agron. Medellin, vol. 66, no. 1, pp. 6959–6968, 2013.
[18] D. Dhingra, M. Michael, H. Rajput, and R. T. Patil, “Dietary fibre in foods: a review,” J. Food Sci. Technol., vol. 49, no. 3, pp. 255–266, 2012.
[19] J. Cabrera and M. Cárdenas, “Importancia de la fibra dietética para la nutrición humana,” Rev. Cuba. Salud Publica, vol. 32, no. 4, pp. 100–105, 2006.
[20] G. Arrázola, A. Alvis, and M. Páez, “Composición, Análisis Termofísico y Sensorial de Frutos Colombianos. Parte 2: Acerola (Malpighiaemarginata L.),” Inf. tecnológica, vol. 25, no. 3, pp. 23–30, 2014.
[21] G. Arrázola, M. Páez, and A. Alvis, “Composición, Análisis Termofísico y Análisis Sensorial de Frutos Colombianos: Parte 1: Almendro (TerminaliaCatappa L.),” Inf. tecnológica, vol. 25, no. 3, pp. 17–22, 2014.
[22] A. Alvis, I. Caicedo, and P. Peña, “Determinación de Propiedades Termofísicas de Alimentos en Función de la Concentración y la Temperatura empleando un Programa Computacional,” Inf. tecnológica, vol. 23, no. 1, pp. 111–116, 2012.
[23] V. C. Barbosa, E. E. Garcia-Rojas, J. S. dos R. Coimbra, P. de A. Cipriano, E. B. de Oliveira, and J. Telis-Romero, “Thermophysical and rheological properties of dulce de leche with and without coconut flakes as a function of temperature,” Food Sci. Technol., vol. 33, no. 1, pp. 93–98, Mar. 2013.
[24] Y. Muramatsu, E. Sakaguchi, T. Orikasa, and A. Tagawa, “Simultaneous estimation of the thermophysical properties of three kinds of fruit juices based on the measured result by a transient heat flow probe method,” J. Food Eng., vol. 96, no. 4, pp. 607–613, Feb. 2010.
[25] A. Jha, A. Kumar, P. Jain, H. Om, R. Singh, and D. Bunkar, “Physico-chemical and sensory changes during the storage of lalpeda,” J. Food Sci. Technol., vol. 51, no. 6, pp. 1173–1178, 2014.
[26] M. C. Penci and M. A. Marín, “Dulce de Leche: Technology, Quality, and Consumer Aspects of the Traditional Milk Caramel of South America,” in Traditional Foods, Springer US, 2016, pp. 123–136.
[27] A. M. Paula and A. C. Conti-Silva, “Texture profile and correlation between sensory and instrumental analyses on extruded snacks,” J. Food Eng., vol. 121, no. 1, pp. 9–14, 2014.
[28] P. C. Moyano and F. Pedreschi, “Kinetics of oil uptake during frying of potato slices:,” LWT - Food Sci. Technol., vol. 39, no. 3, pp. 285–291, Apr. 2006.
[29] F. Pedreschi, D. Mery, F. Mendoza, and J. Aguilera, “Classification of Potato Chips Using Pattern Recognition,” J. Food Sci., vol. 69, no. 6, pp. 264–269, 2004.
[30] P. Moyano, E. Troncoso, and F. Pedreschi, “Modeling texture kinetics during thermal processing of potato products,” J. Food Sci., vol. 72, no. 1, pp. 102–107, 2007.
[31] P. P. Acharya, “Optimization of Ingredients in Gundpak – a Traditional Nepalese Milk Sweet by Response Surface Methodology,” vol. 2, pp. 13–17, 2016.
[32] V. Raikos, “Effect of heat treatment on milk protein functionality at emulsion interfaces. A review,” Food Hydrocoll., vol. 24, no. 4, pp. 259–265, Jun. 2010.
[33] R. Chawla, G. R. Patil, and A. K. Singh, “Effect of temperature on sensory and textural attributes of functional dodaburfi (Indian milk cake),” J. Food Sci. Technol., vol. 52, no. 1, pp. 586–591, 2015.
[34] G. J. Torres, K. J. González-Morelo, and D. Acevedo, “Análisis del Perfil de Textura en Frutas, Productos Cárnicos y Quesos,” ReCiTeIA, vol. 14, no. 2, pp. 63–75, 2015.
[35] G. Talwar and S. K. Brar, “Study of physiochemical, sensory and color properties of pinni variants,” Indian J. Food Sci. Technol., vol. 8, no. 7, pp. 629–634, 2015.
[36] V. Gupta et al., “Shelf life enhancement of coconut burfi–an Indian traditional sweet,” J. Food Qual., vol. 33, no. 1, pp. 329–349, 2010.
AUTHOR PROFILE
Kevin José González-Moreloworks as research assistant in the Research Group NUSCA and has a bachelor degree in Food Engineering from the Universidad de Cartagena.
Diofanor Acevedo-Correaworks as a full-time professor at the Universidad de Cartagena. Dr. Acevedo has a doctoral degreein Food Engineering from the Universidad del Valle (Colombia). Furthermore, he has bachelor degrees in Food Engineering and Pharmaceutical Chemistry from the Universidad de Cartagena. He is full-time researcher of the Research Group NUSCA.
Piedad Margarita Montero-Castilloworks as a full-time professor at the Universidad de Cartagena. Dr. Montero-Castillohas a doctoral degree in Sciences from the Universidad Rafael BellosoChacín(Venezuela). She also has a master degree in Food Science and Technology and a bachelor degree in Food Engineering from the Universidad del Zulia (Venezuela) and the Universidad de la Salle (Colombia), respectively. She is director of the Research Group NUSCA.
ISSN (Print) : 2319-8613 ISSN (Online) : 0975-4024 Kevin J. González-Morelo et al. / International Journal of Engineering and Technology (IJET)
DOI: 10.21817/ijet/2017/v9i6/170906102 Vol 9 No 6 Dec 2017-Jan 2018 4249