effects of deer browsing on the early stage of pyrogenic ...the early stage of forest regeneration...
TRANSCRIPT

Ecol. Res. 5: 353-366, 1990
E C O L O G I C A L R E S E A R C H @ by the Ecological Society of Japan 1990
Effects of Deer Browsing on the Early Stage of Pyrogenic Succession on Miyajima Island, Southwestern Japan
Toshinori OKUDA*, Botanical Institute, Faculty of Science, Hiroshima University, Naka-ku, Hiroshima, 730 Japan
and
Kaneyuki NA~CANn, Department of Environmental Studies, Faculty of Integrated Arts and Sciences, Hiroshima University, Naka-ku, Hiroshima, 730 Japan
Abstract
The early stage of forest regeneration on Miyajima Island, southewstern Japan, was studied for three years after a fire in 1984, with respect to the effects of deer browsing. The regeneration patterns of woody species, in terms of the biomass increment and browsing damage to plants, were classified into the following three groups: non- or rare- ly browsed species with little increment of biomass, heavily browsed with little incre- ment, and heavily browsed with large increment. The aboveground biomass increased from 0.4 kg to 2.7 kg per 100 m z during three years, and was less than half of the biomass obtained in other burnt pine forests on the adjacent deer-free islands. About 28 % of the plant biomass was consumed by deer. The effects of browsing on forest regeneration were heavier at lower than that at the higher altitudes. On this island, deer browsing seems to have an important effect on vegetational succession in the burnt areas.
Key words: Aboveground biomass; Deer browsing; Forest fire; Open woodland; Pyrogenic succession.
Introduction
Despite the fact that vertebrate herbivores have a great impact on forest regeneration (Peterken and Tubbs, 1965; Shaw, 1968; Linhart and Whelan, 1980; Piggott; 1983; Dickinson and Kirkpatrick, 1986; Hyt teborn et al., 1987), very few studies have been conducted to evaluate such effects in the course of post-fire forest development in southwestern Japan, where forest fires occur at high frequency (Takahashi, 1986; Nakane, 1987; Nakane et al., 1988). This paucity of data on herbivore and vegetation interaction is partly due to the low density or uncommon distribution of wild animals such as deer (Tokida et al., 1980), except those on small islands like Miyajima, Akune-oshima, the Goto islands and Tsushima.
On Miyajima Island, in the Seto Inland Sea between Honshu and Shikoku, part of the evergreen scrub forest was burnt in March, 1984, and thereafter was browsed by sika deer (Cervus nippon). Hence, the floristic composition of the vegetation there has been heavily influenced by deer (Horikawa, 1942; Okuda, 1984).
Accepted 25 June 1990 *Present address: Global Environment Division, National Institute for Environmental Studies, Tsukuba, Ibaraki, 305 Japan.

354 T. Okuda & K. Nakane
The canopy of the vegetation before the fire was very sparse and consisted mainly of some evergreen species: Camellia japonica, Cleyerajaponica and Myrica rubra. Due to clear-cutting of decayed pine trees (Pinus densiflora) after infection by noxious nematodes, in the mid 1970s, the community structure and physiognomy of the vegetation was completely changed into open forest dominated by evergreen broad-leaved trees (Toyohara et al., 1986).
The overall vegetation of the adjacent area on Miyajima Island shows a complex pattern of pine forest and broad-leaved evergreen open forest (Toyohara and Suzuki, 1975). Some researchers have studied the regeneration processes of burnt pine forests (e.g. Nakagoshi et al., 1981 ; Nakagoshi, 1987), but little attention has been paid to differences in the regene- ration process originating from both types of forest.
Our primary purpose was to clarify the extent of browsing effects on the early stage of forest regeneration, which ultimately affects the successional development of the forest. This paper also describes the differences in the regeneration process between two original forests, on open forest and a pine forest, after fire. For this purpose, we estimated the increment of the aboveground biomass of major woody species in the burnt areas on the island by using an allometric method.
Study Site
The study site is located on the southern part of Miyajima Island (3020 ha), 20 km south of Hiroshima City. Mean annual temperature and precipitation observed at the Miyajima Natural Botanical Garden, Hiroshima University, 4 km northeast of the study area, were 14.4~ and 1741 mm respectively, between 1984 and 1986. The basement rock is mainly granite. The area burnt in 1984 extended for approximately 250 ha (Nakane et al., 1986). The vegetation at the study site prior to the fire was a secondary forest community, Myrsine seguinii sub-association of Symploco-Pinetum densiflorae (Toyohara and Suzuki, 1975). The blight of the canopy pine trees (P. densiflora) due to nematode infection in the 1970s spread over western Japan, and extensively affected the community structure on the southern part of the island. Furthermore, crawler tractors introduced for transportation of the dead pine trees eroded the soil surface and aggravated the damage to the ecosystem. A few canopy evergreen trees were left behind, after the death of the pine trees, and the physiognomy of the vegeta- tion became an open forest of evergreen tree species (Toyohara et al., 1986). The sparse canopy created sunny conditions for an undergrowth of ferns such as Gleichenia japonica and Dicranopteris dichotoma.
The population of sika deer on the entire island has been estimated at 550(Hayashi, 1980). Approximately 80~o of the deer are concentrated in a residential area (50 ha) on the north- eastern side of the island. From these data, the average population density in the non-residen- tial area is estimated to be 0.04 individual ha -1.
Methods
Tree c e n s u s
The growth of seedlings and sprouts in two 10 • 10 m permanent quadrats, named Plots A(150m altitude) and B (30m), was monitored every October in 1984, 1985 and 1986 (Fig. 1). Each plot was divided into 25 subquadrats (2 • 2 m), and all woody plants appearing in the quadrats were identified by a sequential number. The height (H, cm), diameter at 10700 of the

Pyrogenic succession under deer browsing 355
Fig. 1. Map of the study site showing the location of sampling quadrats (solid circles) and outbreak point of fire (cross) in the burnt area (shaded). Plots A and B are permanent quadrats.
height (D0.1) and crown area (C) were measured. C represents the projected area of the crown (cm~), which was calculated using the equation: C = (zr/4)(LW), where L and W are the maximum and minimum diameters of the crown projected area, respectively. Cover-abun- dance (Braun-Blanquet, 1964) was recorded for each herbaceous species appearing in Plots A and B in October of 1984 and 1986. To estimate the aboveground biomass of the forest that existed before the fire, allometry equations (Nakagoshi et al., 1981) were applied using Do.1 and H d a t a obtained just after the fire in 1984, as well as for seral communities regenerat- ed after the fire.
Level of browsing on woody plant species The browsing damage to individual woody plants was categorized into the following four
levels and defined as BL: heavy (level 3), most plant parts (leaved, braches and stems) were browsed and no further growth was expected; moderate (level 2), some leaves, or apices of shoots were browsed; light (level 1), only a small portion was browsed and no significant effect on further growth was expected; and no trace of browsing (level 0). The mean browsing level (MBL) was calculated as follows:
MBL = (l/n) ~, (BL)i (1),

Tab
le 1
. R
egre
ssio
ns a
nd c
orre
lati
on c
oeff
icie
nts
for
the
allo
met
ric
rela
tion
ship
s (a
lso
see
text
).
Spec
ies
nam
e S
ampl
e ra
nge*
N
o. o
f H
eigh
t D
iam
eter
sa
mpl
es
Eq.
(2)
E
q. (
3)
Eq.
(4)
(c
m)
(ram
) a
/3
(r)t
a
b (r
) c
d (r
)
Cam
ellia
japo
nica
8-
110
2.1-
13.5
28
80
.99
1.14
(0
.92)
0.
30
0.97
(0
.99)
12
.71
0.89
(0
.94)
C
leye
raja
poni
ca
17-
75
1.8-
8.9
27
93
.39
0.99
(0
.84)
0.
32
1.02
(0
.98)
14
.63
1.02
(0
.81)
D
iosp
yros
mor
risi
ana
13-
96
1.8-
6.7
13
90
.59
0.84
(0
.65)
0.
40
0,91
(0
.99)
10
.50
0.80
(0
.75)
E
urya
japo
nica
17
-120
1.
8- 6
.7
27
105.
88
0.94
(0
.88)
0.
37
0.97
(0
.99)
17
.45
0.96
(0
.92)
ll
ex p
edun
culo
sa
8-
74
1.5-
11.2
28
86
.61
1.06
(0
.96)
0.
35
1.02
(0
.99)
34
.87
1.27
(0
.93)
ll
lici
um r
elig
iosu
m
11-
80
2.4-
7.6
19
85
.22
1.1
1
(0.8
0)
0.30
1.
04
(0.9
8)
23.1
5 1.
03
(0.8
7)
Mal
lotu
sjap
onic
us
3- 3
2 1.
0- 4
.3
23
191.
00
1.12
(0
.85)
0.
55
0.82
(0
.94)
12
.50
1.04
(0
.75)
M
yric
a ru
bra
7- 5
1 2.
2- 6
.4
14
126.
78
1.64
(0
.86)
0.
54
0.99
(0
.99)
33
.87
1.38
(0
.80)
N
eoli
tsea
aci
cula
ta
13-
49
1.7-
5.8
29
87
.77
0.99
(0
.90)
0.
32
0.97
(0
.98)
21
.13
1.42
(0
.90)
N
eoli
tsea
ser
icea
18
-114
3.
0-11
.0
29
60.4
0 0.
80
(0.6
7)
0.37
0.
98
(0.9
7)
19.4
8 1.
14
(0.8
3)
Rub
us m
icro
phyl
lus
10-
55
0.8-
2.7
26
18
8.12
1.
07
(0.8
5)
0.69
0.
94
(0.9
3)
32.7
4 1.
30
(0.8
8)
Sym
ploc
os g
lauc
a 17
- 79
2.
4-10
.2
21
66.7
1 0.
85
(0.8
8)
0.92
0.
70
(0.8
6)
21.5
2 1.
08
(0.8
0)
Syrn
ploc
os l
ucid
a 14
-109
1.
5-11
.8
10
97.2
6 1.
00
(0.9
8)
0.41
0.
99
(1.0
0)
26.6
9 0.
97
(0.9
6)
Sym
ploc
ospr
unif
olia
7-
56
1.4-
8.0
31
88
.22
1.08
(0
.86)
0.
39
0.86
(0
.98)
11
.83
0.83
(0
.90)
V
acci
nium
bra
ctea
tum
11
- 37
1.
2- 6
.5
17
56.5
1 0.
80
(0.8
0)
0.49
1.
04
(0.9
7)
44.0
3 1.
39
(0.9
7)
Zant
hoxy
lum
sch
inifo
lium
12
- 56
1.
3- 4
.9
26
105.
83
0.96
(0
.93)
0.
63
0.93
(0
.98)
20
.67
1.65
(0
.99)
Reg
ress
ion
and
corr
elat
ion
coef
fici
ents
O
~z
Tot
al
368
70.2
8 0.
78
(0.7
6)
0.44
0.
91
(0.9
6)
18.2
5 1.
06
*Sam
ple
rang
e: m
inim
um a
nd m
axui
mm
val
ues
of h
eigh
t an
d di
amet
er m
easu
red
for
each
of
the
spec
ies.
tc
orre
lati
on c
oeff
icie
nts,
whi
ch a
re a
ll s
igni
fica
nt (
p<0.
01)
exce
pt f
or t
he r
elat
ion
betw
een
D0.
1 an
d H
for
Dio
spyr
os m
orri
sian
a (p
<0.
05).
(0.8
6)

Pyrogenic succession under deer browsing 357
where n is number of plants for each species and (BL)i is BL for each individual i. The brows- ing intensity was observed both in the permanent quadrats (Plot A, B), and in 28 other sam- pling quadrats to analyze the palatability of plants for deer at the study site (Fig. 1) in 1984 and 1986. The browsing frequency (~) , the ratio of browsed plants to the total number observed in these 30 quadrats, was also calculated for each species.
Calculation of regeneration biomass The dry weight of individual seedlings or sprouts, including both the browsed and left-
over fractions, was estimated from the following allometric equations. Unbrowsed woody plants (seedlings and sprouts) were sampled outside the permanent quadrats (Plots A and B). The abbreviations are H (cm), Do.1 (era) and the dry weight of leaves (Wt, g), branches (Wb, g) and stems (Ws, g).
H = aD0ff (2),
Ws+o = a(Do.12H) b (3),
Wt = c(Doff) a (4),
where Ws+o is W~+ WE, and a,/3, a, b, c and d are the allometry coefficients, the values of which were calculated for each species by a least squares method (Table 1). For those species of which insufficient samples were obtained for determining the allometry relationships, we used averaged values of the allometry coefficients determined for all species samples. Since most of the seedlings and sprouts were browsed in Plots A and B, their height before being browsed (H(N)) could not be directly determined. Therefore, this was estimated from Eq. (2) because the D0a of a browsed woody plant (D(M)o.0 measured in the field would be nearly equal to the diameter of the unbrowsed plant, D(N)o.t, that is,
D(M)oa ~-- D(N)oa (5),
and similarly, the height of an unbrowsed plant was derived as follows:
H(N) = aD(M)of f (6).
The dry weight of an individual unbrowsed plant (W(N)t ~ W(N)s+b+ W(N)t) was estimated from Eqs. (3) and (4). The height of the portion lost by browsing (H(B)) was calculated as follows:
H(B) -~ H ( N ) - - H ( M ) (7),
where H(M) is the height of a browsed woody plant, measured in the field. D(B)o.~, D0.1 of H(B), are derived from Eq. (2) as
D(B)oa = (H(B)/oO 1/~ (8).
The dry weight of an individual plant lost by browsing(i.e., the fraction of biomass browsed by deer: W(B)t ~ W(B)~+b+W(B)t), therefore, can be estimated from Eqs. (3), (4), (7)and (8).
The remaining dry weight of an individual plant (the residual fraction of biomass: W(R)t = W(R)s+b+ W(R)t) after browsing is described as
W(R)t : W(N) t - -W(B) t (9).

358 T. Okuda & K. Nakane
Based u p o n these re la t ionships , the browsed p r o p o r t i o n o f the b iomass (BPB, % ) was cal- cula ted as
B P B = W ( B ) d W ( N ) t • lO0 (10).
D e a d or d i sappeared plants , recognized f rom missing labels, were d is t inguished as a lost
f rac t ion o f b iomass (LFB) for each species. Since W(B)t could only be appl ied to plants , L F B does no t const i tute W(B)t.
The var iables for each species ob ta ined f rom the above p rocedures were to ta l coverage (cm ~ per 200 m2), f requency o f occurrence in 50 subquadra t s ( ~ ) , average height (cm) and
coverage per p lan t (cm~), mean browsing level, b rowsing f requency (%) , aboveground bio- mass (mg m-2), b rowsed f rac t ion o f b iomass (mg m -a) and b rowsed p r o p o r t i o n o f b iomass
(%). These faci l i ta ted the use o f pr incipal componen t analysis (PCA) in o rder to summar ize the process o f regenera t ion o f ind iv idua l species.
Results
Grouping of woody species in serial communities P C A ord ina t ion axes-1 and 2 were the first and the second p r inc ipa l components . The
Table 2. Browsing frequency (~) , browsing level of woody plant species observed in 30 sampling quadrats and groups by PCA ordination (also see text).
Species name No. of Browsing Mean browsing Group individuals frequency (%) level
Glochidion obovatum 3 66.7 1.00 II Rosa wichuraiana 3 66.7 1.00 II Ilex pedunculosa 28 50.0 0.86 III Viburnum wrightii 29 55.2 0.83 II Symplocos lucida 10 60.0 0.80 n.a.* Rubus microphyllus 39 61.5 0.79 II Callicarpa mollis 18 56.3 0.78 II Vaccinium bracteatum 34 23.7 0.59 II Myrica rubra 7 28.6 0.57 II Camellia japonica 32 35.7 0.56 III Mallotus japonicus 57 33.3 0.56 II Eurya japonica 547 28.2 0.55 III Rhus trichocarpa 45 38.7 0.53 II Zanthoxylum schinifolium 405 37.8 0.51 III Aralia elata 155 31.6 0.50 II Smilax china 343 34.7 0.48 n.a. Cleyera japonica 18 23.5 0.47 II Myrsine seguinii 20 14.3 0.45 n.a. Diospyros morrisiana 7 28.5 0.43 II Lyonia ovalifolia v. elliptica 49 36.7 0.41 n.a. Rhusjavanica 30 33.3 0.40 II Caesalpinia japonica 3 33.3 O. 33 I Pinus densiflora 3 33.3 0.33 II Rubus palmatus 15 20.0 0.27 II Symplocos prunifolia 42 9.5 0.11 n.a. Neolitsea aciculata 49 2.0 0.02 I lllicium religiosum 17 0.0 0.00 I Neolitsea sericea 17 O. 0 0.00 I Pieris japonica 16 0.0 0.00 I Symplocos theophrastaefolia 2 0.0 0.00 II
*data were not available.

Pyrogenic succession under deer browsing 359
i CO
x <
-2
-2
~ 1984 Gro.~ ,, ~ E -~ ~'-~roup ,,,
Maja
�9 Rural �9 Arel Euja Ca;a
?:c. :_o . ,,: Cpja Nese~
G r o u p ~
I I I I I I I J
-2 0 2 4
1985
G r o u p I
/ Group ~ " - ' ~ I l re Cpja �9 �9 i n c a �9 �9 Z a s c
, . e x i . / . . . . . . m , \ / �9 ] Pid/e � 9 1 4 9 Group I I ~ l l p e 7tuja ~
( .o,.o m / J Z aai-e e / R h j a �9 �9
I I l I ,I I I I J
-2 0 2 4 6
~ o u p II 1986 / Rowi e �9 Valor 2 / ",o~ . \
o
Svth -�9 Eu i . "~Group ill
Group I /�9 �9 Cpja I lpe
S N~ac �9
I I I I I I I I I
-2 0 2 4 6 8
A x i s - 1 Fig. 2. Scattergram of species by PCA ordination. Are/: Aralia elata; Cpja: Caesalpinia japonica; Camo:
Callicarpa moll�9 Caja: Camellia japonica; Clja: Cleyera japonica; Dimo: Diospyros morrisiana; Euja: Eurya japonica; Glob: Glochidion obovatum ; ]lpe: llex pedunculosa ; /Ire: lllicium religiosum ; Maja: Mallotus japonicus; Myru: Myrica rubra; Neac: Neolitsea aciculata; Nese: Neolitsea sericea; Pija: Pieris japonica; Pide: Pinus dens�9 Rhja: Rhus javanica; Rhtr: Rhus trichocarpa; Row�9 Rosa wichuraiana; Rum�9 Rubus microphyllus; Rupa: Rubus palmatus; Syth: Symplocos theophrastaefolia; Vabr: Vaccinium bracteatum; Viwr: Viburnum wright�9 Zaai: Zanthoxylum ailanthoides; Zase: Zanthoxylum schinifolium.

360 T. Okuda & K. Nakane
efficiency of the components for which they accounted for cumultive variation in the samples ranged from 61% to 74% (Fig. 2). These represented the factors related to aboveground bio- mass, coverage and frequency (axis-l) and to browsing frequency, mean browsing level and browsed proportion of biomass (axis-2). Other factors were found to be distinctly unrelated to these principal components. Therefore, axis-1 was recognized as a scale related to species productivity or abundance, whereas axis-2 was a scale for browsing intensity on a species.
Although the distributional pattern of individual species in the scattergrams obtained varied from year to year, we simply classified the species into the following three groups, taking into account the plant morphology (life forms) and browsing intensity (Table 2); species free from browsing (group I), thorn or spine-armed pioneer or deciduous species (group II), and dominants of the tree or sub-tree layer of the community before the fire (group III). Judging from the position of each species in the PCA scattergram (Fig. 2), we also identified group I as that of little biomass increment with low browsing intensity, II as that of little biomass increment with heavy browsing (group II) and III as that of large biomass increment with heavy browsing.
Browsing frequency and mean browsing level The browsing frequency in groups II and III species ranged from 20% to 67% and the
M B L (Eq. (1)) ranged from 0.3 to 1.0 (Table 2). The group II and III species suffered brows- ing mostly to newly emerged leaves, but also to stems or branches.
Altitude of sampling quadrats (m)
10-30
50-120
150-200
Percen tage
0 50 100 . . . . I . . . . I
Total number of plants
400
IIJJJIIIIIIIIIIIIllllllllllllllllll
iiiiiiiiiiiiiiiiiiiiiiiii iiiiiiii iiiii i i i ii !i!iiiiii!iiiiiii!iiiiiiiiiiii i i i i i i!ii iiiiiii! IIIIIIIIIIIIIII]JJIIIIIIIIIIIIIIlU
iii ii i ! !!i!iiiiiiiii i!ii i !iiiiiiiiiii i iiii i i !i! ! !!iiiiiiiiiiiiiii i i ii ! ! i!iiiiiiiiiiiiii!i!iiiiiiii 411 IIIllilllllllllllllllllllli
I II III others
Groop Browsing level [ IIIIIIIIILklllllllllllllllllllllm~
0 1 2 3
Fig. 3. Percentages of the numbers of groups I, II, and III species and those of the numbers of plants observed at browsing level (BL), 0, 1, 2, and 3 at different altitudes. For group categories and browsing levels see text and Table 2.

Pyrogenic succession under deer browsing 361
The following evergreen broad-leaved trees, which were the major components of the com- munity canopy before the fire, Camellia japonica, Eurya japonica and llex pedunculosa were browsed at a frequency of 30%-50%. Rubus microphyllus, Aralia elata, Zanthoxylum schini- folium and Smilax china were all frequently browsed in spite of their thorny or spiny mor- phology. Hardly any lllicium religiosum, Neolitsea sciculata, iV. sericea or Pieris japonica were browsed at the study site.
There was a fluctuation in browsing frequency between the three different altitudinal zones (Fig. 3). The regenerating plants at lower altitudes (0-30 m) were browsed more heavily than those at higher altitudes (150-200 m), despite the fact that there was little compositional difference in terms of the by means of the three groups (Fig. 3).
Changes in vegetation biomass and structure The total amount of aboveground biomass (W(N)t) summed for the three groups in Plots
A and B was estimated to be 0.4 kg per 100 m 2 in 1984, 1.8 kg in 1985 and 2.7 kg in 1986. BPB (%) (Eq. (10)) averaged for the three groups declined from 35% in 1984 to 29% in 1986 (Fig. 4). This declining trend in BPB suggests that the browsing damage to plant growth became generally less intense with time. However, the variation in leftover biomass, W(R)t (Eq. (9)), for three years depended on the group. For example, W(R)t of group I I declined
20
10 E 0")
E o 25 'o 0 c" C3 9 3O
o ~ 20 <
10
YBf YRfO) YRf(II) YRf(III)
I II Ill
I I YBt YRt
~=1YLf
1984
I II III
1985
Year
A
I H HI B
1986
Fig. 4. Changes in aboveground biomass (gm -z) for each group (A) and their totals (B) from 1984 to 1986. YBf: browsed fraction of biomass for every group; Y~(I), YRf(II) and YRf(III): leftover fraction of biomass in groups I, II and III, respectively, Y~3t: browsed fraction of biomass in total, YRt: leftover fraction of biomass in total, Yzf: lost fraction of biomass in total from 1984 to 1985 and from 1985 to 1986.
362 T. Okuda & K .Nakane
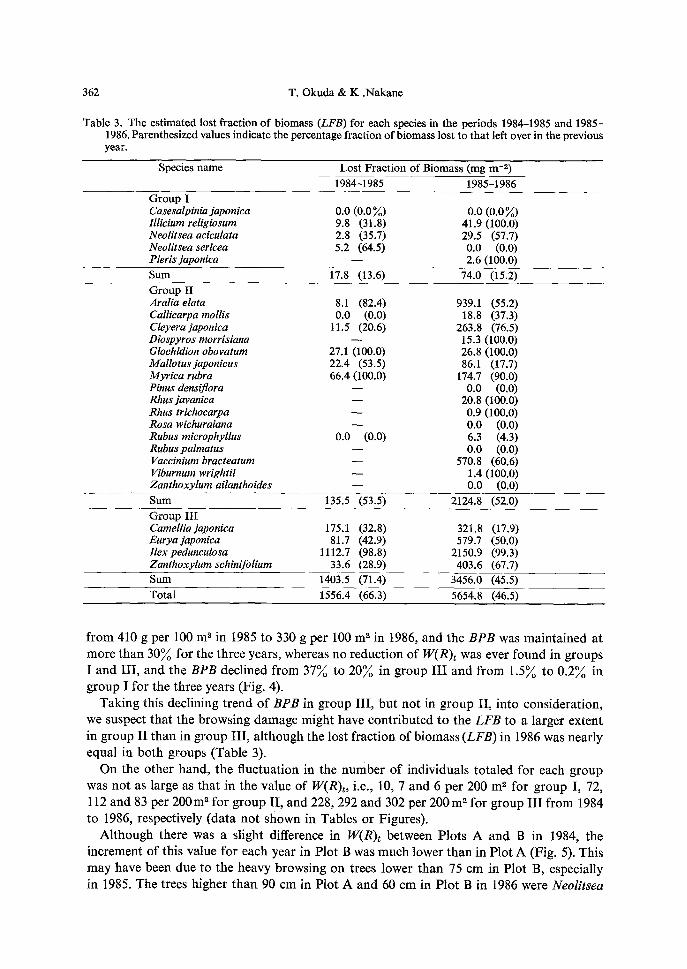
Table 3. The estimated lost fraction of biomass (LFB) for each species in the periods 1984-1985 and 1985- 1986. Parenthesized values indicate the percentage fraction of biomass lost to that left over in the previous year.
Species name Lost Fraction of Biomass (nag m -z) 1984-1985 1985-1986
Group I Casesalpinia japonica 0.0 (0.0 ~) 0.0 (0.0 %) lllicium religiosum 9.8 (31.8) 41.9 (100.0) Neolitseaaciculata 2.8 (35.7) 29.5 (57.7) Neolitsea sericea 5.2 (64.5) 0.0 (0.0) Pieris japonica - - 2.6 (100.0) Sum 17.8 (13.6) 74.0 (15.2) Group II Araliaelata 8.1 (82.4) 939.1 (55.2) Callicarpa mollis 0.0 (0.0) 18.8 (37.3) Cleyerajaponica 11.5 (20.6) 263.8 (76.5) Diospyros morrisiana -- 15.3 (100.0) Glochidion obovatum 27.1 (100.0) 26.8 (100.0) Mallotusjaponicus 22.4 (53.5) 86.1 (17.7) Myrica rubra 66.4 (100.0) 174.7 (90.0) Pinus densiflora - - 0.0 (0.0) Rhusjavanica - - 20.8 (100.0) Rhus trichocarpa - - 0.9 (100.0) Rosa wichuraiana - - 0.0 (0.0) Rubus microphyllus 0.0 (0.0) 6.3 (4.3) Rubus palmatus - - 0.0 (0.0) Vaccinium bracteatum - - 570.8 (60.6) Viburnum wrightii - - 1.4 (100.0) Zanthoxylum ailanthoides - - 0.0 (0.0) Sum 135.5 (53.5) 2124.8 (52.0) Group III Camellia japonica 175.1 (32.8) 321.8 (17.9) Euryajapon&a 81.7 (42.9) 579.7 (50.0) llex pedunculosa 1112.7 (98.8) 2150.9 (99.3) Zanthoxylumschinifolium 33.6 (28.9) 403.6 (67.7) Sum 1403.5 (71.4) 3456.0 (45.5) Total 1556.4 (66.3) 5654.8 (46.5)
f rom 410 g per 100 m 2 in 1985 to 330 g per 100 m z in 1986, and the BPB was ma in ta ined at
more than 30~o for the three years , whereas no reduct ion o f W(R)~ was ever found in groups I and I I I , and the BPB decl ined f rom 3 7 ~ to 2 0 ~ in g roup I I I and f rom 1 .5~ to 0 . 2 ~ in g roup I for the three years (Fig. 4).
Tak ing this decl ining t r end o f BPB in group I I I , bu t no t in g roup II , in to cons idera t ion ,
we suspect tha t the b rows ing damage might have con t r ibu ted to the LFB to a larger extent
in group I I t han in g roup I I I , a l though the lost f rac t ion of b iomass (LFB) in 1986 was near ly equal in bo th groups (Table 3).
On the o ther hand, the f luc tuat ion in the number o f individuals to ta led for each g roup
was no t as large as tha t in the value of W(R)t, i.e., 10, 7 and 6 pe r 200 m z for g roup I, 72, 112 and 83 per 200m ~ for g roup II , and 228, 292 and 302 per 2 0 0 m z for g roup I I I f rom 1984 to 1986, respectively (da ta no t shown in Tables or Figures) .
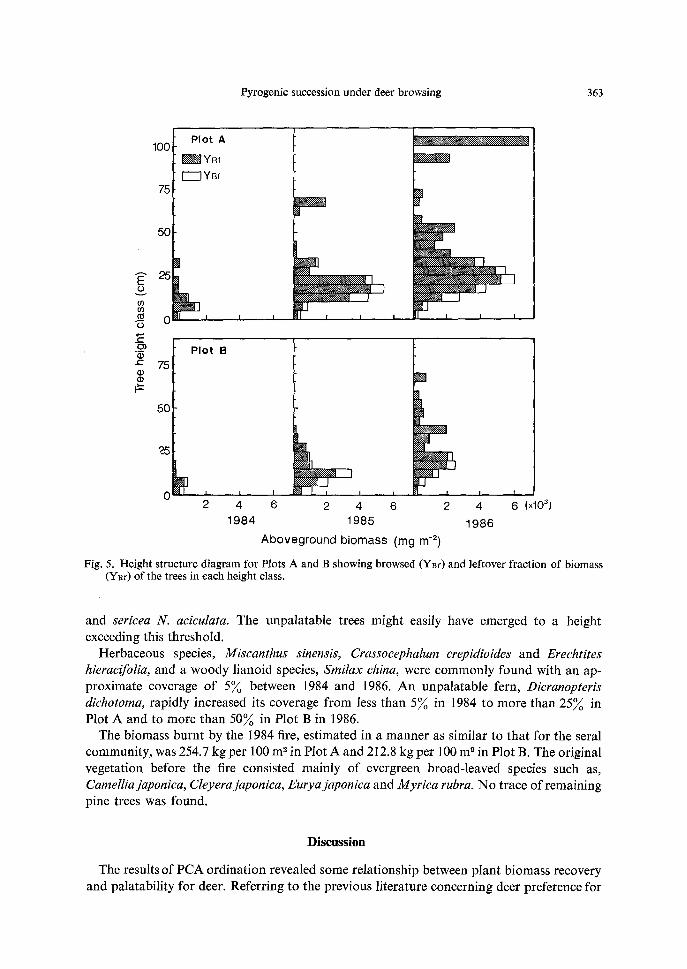
A l t h o u g h there was a slight difference in W(R)t between Plots A and B in 1984, the increment o f this value for each year in Plot B was much lower than in P lo t A (Fig. 5). This may have been due to the heavy browsing on trees lower t han 75 cm in Plo t B, especial ly
in 1985. The trees h igher t han 90 cm in P lo t A and 60 cm in P lo t B in 1986 were Neolitsea
Pyrogenic succession under deer browsing 363
E O
v
6'0
O
E
c-
100
75
50
25
0
75
50
25
Plot A
~ Y R f
[ :Z ] Yaf
P lo t B
2 4 6 2 4 6 2 4 6 (xl03) 1984 1985 1986
Aboveground biomass (mg m -2)
Fig. 5. Height structure diagram for Plots A and B showing browsed (Y~f) and leftover fraction of biomass CYgf) of the trees in each height class.
and sericea N. aciculata. The unpalatable trees might easily have emerged to a height exceeding this threshold.
Herbaceous species, Miscanthus sinensis, Crassocephalum crepidioides and Erechtites hieracifolia, and a woody lianoid species, Smilax china, were commonly found with an ap- proximate coverage of 5% between 1984 and 1986. An unpalatable fern, Dicranopteris dichotoma, rapidly increased its coverage from less than 5% in 1984 to more than 25% in Plot A and to more than 50% in Plot B in 1986.
The biomass burnt by the 1984 fire, estimated in a manner as similar to that for the seral community, was 254.7 kg per 100 m s in Plot A and 212.8 kg per 100 m e in Plot B. The original vegetation before the fire consisted mainly of evergreen broad-leaved species such as, Camellia japonica, Cleyera japonica, Eurya japonica and Myrica rubra. No trace of remaining pine trees was found.
Discussion
The results of PCA ordination revealed some relationship between plant biomass recovery and palatability for deer. Referring to the previous literature concerning deer preference for

364 T. Okuda & K. Nakane
plants (Horikawa, 1942; Takatsuki, 1980, 1982, 1983; Okuda, 1984; Doi et al., 1985)and to the results of the present study, we regarded group I species as unpalatable or avoided, and groups II and III species as palatable or occasionally palatable. Furthermore, there was no overlap among the groups in the PCA ordination scattergram, as shown in Fig. 2. This in- dicates that there were consistent segregations among the three groups in terms of the factors which contribute to ordination axes-1 and 2, in the same way that Mallik and Gimingham (1983) categorized PCA ordination of species in accordance with their regeneration mecha- nism on post-fire heathland.
Although the biomass increment of group I was low in comparison to that of groups II and III, the group I species have a high potential for enlarging their biomass because of their low palatability. However, the group II species do not, as they showed pronounced reduc- tion of biomass from 1985 to 1986. Most of the group III species regenerated by sprouts rather than by seedlings. Thus, they might have maintained a sufficient stock of organic matter for subsequent regenerative growth even though they were exposed to heavy browsing by deer.
The average aboveground biomass estimated in Plots A and B was 42~o of that obtained in the post-fire pine forest in the neighboring area on Miyajima Island. The aboveground biomass of broad-leaved trees before the fire was about ten times higher than that in the post-fire pine forest on a deer-free island for a similar regeneration period (Nakagoshi et al., 1981). The woody legume, Lespedeza eyrtobotrya, which was rarely found in the pre-fire vegetation of the present study site, contributed to 20 ~ -40~ of biomass recovery in the post- fire pine forest. Even if this contribution is subtracted from the total aboveground biomass, the biomass was still lower than that of the post-fire pine forest, implying that the deer browsing partly contributed to the biomass reduction.
The floristic components of the original vegetation on Miyajima Island are known to differ from those on the mainland or other islands of the Seto Inland Sea district (Toyohara and Suzuki, 1975; Seki et al., 1975). Absence of legumes in the seral community mentioned above may be one example to this floristic difference, which needs to be considered in order to com- pare biomass recovery among these districts. However, it is not yet known whether this floristic peculiarity is due mainly to long-term deer grazing upon the original vegetation or to edaphic characteristics of the island.
The difference in biomass between Plots A and B can be attributed to the local difference in browsing intensity: that is, the vegetation in the low-altitude zone (Plot B) was browsed more intensely than that in the high-altitude zone (Plot A) (Fig. 3). This may have been due to the difference in deer habitat utilization relative to elevation (Okuda, 1984).
Woody plants, especially those lower than 75 can in height, near Plot B were heavily browsed by deer. It appears that trees less than 75 cm in height, the so-called browse line (Crawley, 1983), are easily accessible to deer and are heavily browsed. However, it is not clear whether heavy browsing has kept the tree height at less than75 cm, or whether many short trees have made deer browsing easier, ultimately resulting in a dwarf growth habit. For trees exceeding this height, the value of W(B)t might have been underestimated, because vertical hetero- geneity of browsing intensity along a tree height was hardly estimated by Eqs. (7), (8) and (9), i.e., the W(B)t in the lower portion of such trees taller than the browse line might have been undervalued.
Besides the effects of browsing, the rapid increase of fern thickets, especially in Plot B, constituted another suppressive factor against the regeneration of woody plants. Only un-

Pyrogenic succession under deer browsing 365
palatable species (group I) and browsing-tolerant species (group III) would be able to form the regenerating community. In fact, Neolitsea aciculata and N. sericea generally grew well in the burnt areas.
The subseral trend, described phytosociologically by Suzuki et al. (1975), is as follows; a Rubus microphyIlus community emerging after felling or fire is succeeded by a Neolitsea aciculata community, a variant of Symploco-Pinetum densiflorae (Toyohara and Suzuki, 1975), through a intermediate phase, the Rhododendron-Neolitsea transitional community between the two seral communities. The Rubus microphyllus community is composed mainly of pioneer prickly species as in group II, whereas the Neolitsea aciculata variant is dominated by shade-tolerant species such as Neolitsea aciculata and iV. sericea, components of group I (Suzuki et al., 1975). Browsing by deer might have resulted in the elimination of palatable group II species, making their ecological niche available to unpalatable group I species. The rate of subseral process from the Rubus microphyllus community to the Neolitsea aciculata variant may thus be accelerated by deer browsing. A transitional phase such as the Rhododendron-Neolitsea community is expected to appear in the near future of the study sites.
It can be concluded that deer browsing is one of the most important factors responsible for the low biomass recovery, possibly forming the basis of floristic uniqueness of Miyajima Island. If browsing effects continue to be as intense as those on these seral communities, the future vegetation will be composed of trees that are avoided by deer.
Acknowledgments
We wish to express our sincere appreciation to Dr. G. Toyohara and Dr. T. Seki, Mr. H. Yamazaki, Mr. T. Shinoda, Mr. M. Fujihara, and Mr. H. Iuchi, Hiroshima University, for their valuable advice and assistance in the course of the field work, and to anonymous re- viewers for giving us useful comments regarding manuscript. The present study was support- ed by funds from the Nippon Seimei Foundation.
References
BRAUN-BLANQUET, J. (1964) Pflanzensoziologie. 3 Aufl. 865 pp. Springer, Wien. DICKINSON, K. J. M. • KIRKPATRICK, J. B. (1986) The impact of grazing pressure in clearfelled,
burned and undisturbed eucalypt forest. Vegetatio 66: 133-136. Dol, T., INAKAZU, K., ONO, Y. & KAWAHARA, H. (1985) A preliminary study on the effects of sika
deer on natural regeneration of forest. Bull. Nagasaki Inst. Appl. Sci. 26: 13-18. CRAWLEY, J. M. (1983) Herbivory. The dynamics of animal-plant interactions. 437 pp. Univ. Cali-
fornia Press, Berkeley. HYTTEBORN, H., PACKHAM, R. & VERWIJST, T. (1987) Tree population dynamics, stand structure and
species composition in the montane virgin forest of Vallibacken, northern Sweden, Vegetatio 72: 3-19.
HAYASHI, K. (1980) Proposition on the management of tamed sika deer (Cervus nippon) in Miyajima Island. Nature and Culture of Miyajima 2:22-33 (In Japanese).
HORIKAWA, Y. (1942) Ecological studies of Itsukushima Island. Ecol. Rev. 8:101-120 (In Japanese). LINHART, Y. B. & WHELAN, R. J. (1980) Woodland regeneration in relation to grazing and fencing
in Coed Gorswen, North Wales. J. Appl. Ecol. 17: 827-840. MALLIK, A. U. & GIMINGHAM, C. H. (1983) Regeneration of heathland plants following burning.
Vegetatio 53: 45-58.

366 T. Okuda & K. Nakane
NAKAGOSHI, N., NAKANE, K., IMAIDE, H. & NEHIRA, K. (1981) Regeneration of vegetation in the burned pine forest in southern Hiroshima Prefecture, Japan. I. Floristic composition, vegetation structure and biomass in the early stage of regeneration. Mem. Faculty of Integrated Arts and Sciences. Hiroshima Univ. 6:69-113 (In Japanese).
NAKAGOSHI, N. (1987) Post-fire succession of a pine forest in east Setouchi, Japan. "Papers on plant ecology and taxonomy to the memory of Dr. S. Nakanishi" (ed. Editorial board for the papers on plant ecology and taxonomy to the memory of Dr. S. Nakanishi), 383-392. The Kobe Geobotanical Soc., Kobe.
NAKANE, K., YAKUTA, K. & NEHIRA, K. (1986) Assessment of degree of the damage by forest fire based on Landsat MSS data: a case of the Miyajima Island, Hiroshima, Japan. J. Remote Sensing Soc. Jpn. 6: 349-357.
NAKANE, K. (1987) Importance of invasion and spread of the secondary vegetation following human disturbances on an ecosystem management. Res. J. Food Agric. 10:10-15 (In Japanese).
NAKANE, K., YAMAZAKI, H., NEHIRA, K. & FUKUOKA, Y. (1988) Studies on prevention of forest fire. (I) Control line of a fire. J. Jpn. For. Soc. 70:111-118 (In Japanese with English summary).
OKUDA, T. (1984) Food habits of sika deer (Cervus nippon) and their ecological influence on the vegetation of Miyajima Island. Hikobia 9: 93-102.
PETERKEN, G. V. & TUBBS, C. R. (1965) Woodland regeneration in New Forest, Hampshire, since 1650. J. Appl. Ecol. 2: 159-170.
PIGOTT, C. n . (1983) Regeneration of oak-birch woodland following exclusion of sheep. J. Ecol. 71: 629-646.
SEKI, T., NAKANISHI, H., SUZUKI, H. & HORIKAWA, Y. (1975) A flora of vascular plants of Itsuku- shima (Miyajima) Island, southwestern Japan. "Scientific studies of Itsukushima Island" (ed. Horikawa, Y.), 221-332. Miyajima-chou, Hiroshima (In Japanese with English summary).
SI~AW, M. W. (1968) Factors affecting the natural regeneration of sessile oak (Quercus petraea) in North Wales; II. Acron losses and germination under field conditions. J. Ecol. 56: 647-660.
SUZUKI, H., TOYOHARA, G., JINNO, N., HUKUSHIMA, T. & ISHIBASHI, N. (1975) The forest vegetation of Itsukushima (Miyajima) Island, S. W. Japan. "Scientific studies of Itsukushima Island" (ed. (Horikawa, Y.), 119-131. Miyajima-chou, Hiroshima (In Japanese with English summary).
TAKAHASHI, K. (1986) Relationship of forest and fire. The Heredity (Iden) 46: 22-26. (In Japanese). TAKATSUKI, S. (1980) Ecological studies on effect of sika deer (Cervus nippon) on vegetation. II. The
vegetation of Akune Island, Kagoshima Prefecture, with special reference to grazing and browsing effect of sika deer. Ecol. Rev. 19: 123-144.
TAKATSUKI, S. (1982) Ecological studies on effect of sika deer (Cervus nippon) on vegetation. III. The vegetation of Iyo-Kashima Island, southwestern Shikoku, with reference to grazing effect of sika deer. Ecol. Rev. 20: 15-29.
TAKATSUKI, S. (1983) Ecological studies on effect of sika deer (Cervus nippon) on vegetation. IV. Shimayama Island, the Goto Islands, Northwestern Kyushu. Ecol. Rev. 20: 143-157.
TOKIDA, K., MARUYAMA, Y., ITOW, T. FURUBAYASHI, K. & ABE H. (1980) Factors affecting the geographical distribution of sika deer. "Studies on wildlife distribution (Mammals)" (ed. Abe, Y.), 38-68. Japan Wildlife Research Center, Tokyo (In Japanese with English summary).
TOYOHARA, G. & SUZUKI, H. (1975) A phytosociological study of pine forests in Itsukushima (Miya- jima) Island and its neighboring areas of the mainland of Honshu. "Scientific studies of Itsuku- shima Island" (ed. Horikawa, Y.), 119-131. Miyajima-cho, Hiroshima (In Japanese with English summary).
TOYOHARA, G., OKUDA, T., FUKUSHIMA, A. & NlSrlIURA, H. (1986) Change of the vegetation after pine damage in Miyajima Island, Hiroshima. Jpn. J. Ecol. 35:609-619 (In Japanese with English summary).