effects of iso 9000 certification - digilib.teiemt.gr
TRANSCRIPT
Dissertation
Title:
“Effects of ISO 9000 certification
on firms’ financial performance:
The Impact on Greek firms”
Student’s name:
Kypraios Nikolaos
Supervisor’s name:
Dr. Chatzoglou Prodromos
MSc in Finance and Financial Information Systems
2009
_____________________________________________________________________
_________________________________________________________________
- 2 -
Abstract
Purpose: The aim of this research is to shed light on the relationship between
ISO 9000 certification and its’ effects on overall financial
performance of the certified firm. The focus is on Greek companies.
The findings are based on the latest version of the ISO series
(2000), which is generally accepted as it has diminished most of the
disadvantages of the previous (1994) version.
Methods: This research is based on primary data. Firstly, a mailed
questionnaire was answered by the quality managers of the
certified firms. Furthermore, a second questionnaire was the key to
enhance the findings, by collecting some qualitative data. This was
achieved by conducting a case study analysis, in which the
managers and five employees of one listed company were
interviewed.
Results: ISO 9000 certification can increase the quality awareness and
improve all internal procedures. On the contrary, its impact on
market efficiency is not significant. However, it seems that operation
efficiency improvement can lead to an increase on sales revenue
and eventually improve the overall financial performance of the
company. Finally, the assumption that customers’ demand was the
main motivation for implementing a certification has been rejected.
Companies seek for quality due to internal motives.

_____________________________________________________________________
_________________________________________________________________
- 3 -
Acknowledgements I would like to thank my supervisor, Dr Prodromos Chatzoglou, for his
assistance and guidance throughout the whole academic year. This
dissertation has demonstrated some major difficulties, and without his
recommendations it would never be finished on time.
Finally, many thanks should be addressed to my family and my fiancée
for all their support and comprehension during the previous year.

_____________________________________________________________________
_________________________________________________________________
- 4 -
Table of contents_______________________________________________ Introduction ………………………………….…………..……....…………. 5
Chapter 1 (Literature review) ………………………………………….. 7
1.1 Quality Management Systems (QMS) ………………………….. 7
1.2 The ISO 9000 standard series ………………..………...………… 8
1.3 Literature review/theoretical background ……..……………………. 11
1.3.1 Reasons of implementation …………………………...……….. 11
1.3.2 Benefits of implementation ……………………………………… 14
1.3.3 Impact on financial performance ………………………………... 19
1.3.4 Doubts/disadvantages ………………………………………….. 22
1.3.5 The case of ISO 9000 in Greece ………………………………. 26
Chapter 2 (Research model) ………………………………..…………… 31
2.1 Design …………………………………………………………………... 31
2.2 Research model – Hypotheses ……………………………………….. 32
2.3 Research methodology ……………………………………………….. 35
Chapter 3 (Results and discussion) ………………….………………. 41
3.1 Data analysis – results …………………………………………… 41
3.1.1 Validity and reliability ……………………………………………. 41
3.1.2 Structural model fit ………………………………………………… 44
3.2 Further discussion ……………………………………………………... 49
Chapter 4 (Conclusions & Limitations) ………..…………………………. 54
4.1 Conclusions ……………………….…………………………………….. 54
4.2 Limitations – recommendations ……………………………………….. 55
References …………………………………………………………………... 56
Appendices …………………………...…..…………………………………… 64
A. Questionnaire ……..………………….………………………………….. 64
B. Interview questionnaire ………….…………………………………….. 68
C. Statistical analysis …………………………………………………….. 72

_____________________________________________________________________
_________________________________________________________________
- 5 -
Introduction
Nowadays, as competitiveness between firms increases rapidly and
customers’ demands are following the same direction, quality awareness
becomes a primary target for every manager. The quality standards must be
certified, somehow. With the wide use of the internet, and the information
running all over the world instantly, quality certifications needed to be
accepted without any doubts. The ISO 9000 series are aiming at that
particular target and they manage to achieve the expectations and deliver the
best results.
Up to now, the literature has explored different aspects about this topic.
To begin with, one must consider the reasons that make a firm decide to go
on with the certification procedures. These are similar in most cases.
However, the gained benefits from an ISO 9000 certification are questioned.
The benefits concerning the internal processes improvement are the most
common. On the contrary, overall financial improvement as a result from an
ISO certification is often arising many doubts. Although the benefits that
derive from the ISO implementation are the most explored topic globally, in
Greece such researches are limited.
Specifically in Greece, researches concerning ISO implementation
seem to be few. It is stated, though, that there is an overall improvement after
certification to firms’ revenues but it cannot be guaranteed that it will continue
on the long term (Gotzamani et al., 2006). Similarly with the rest of the world,
the main reasons for a firm to proceed with implementation are external
(customer pressure, new market areas opening, to name a few) as Lipovatz et
al., 1999, states. Problems also remain more or less the same: increased
paperwork, costs and employees complains (Lipovatz et al., 1999; Vouzas
and Gotzamani, 2005). Finally, according to a finding by Gotzamani et al
(2006), there is a possible difference between ISO 9000:1994 and ISO
9000:2000 certifications. The second one seems to be more effective to firm’s
performance.
Most of the literature focuses on the relationship between ISO 9000
certification and Total Quality Management (TQM). Furthermore, the previous
researches were made many years ago, thus they are referring to ISO
_____________________________________________________________________
_________________________________________________________________
- 6 -
9000:1994 and the samples are from all over the world. Given all that, this
research aims in shedding light on this issue, investigating its implementation
from Greek companies. Furthermore, in order to be more accurate and
specific, the main focus is on ISO 9000 series and not in Total Quality
Management. At this point it must be mentioned, that the sample, almost in its
total, was certified with the 2000 version of ISO series. Thus, it is of great
importance to compare these findings with previous researches.
This research is based on primary data. Therefore, the main method
that was used to complete this survey was the use of a questionnaire. Based
on previous researches from the literature, one questionnaire was formed
including 39 questions using the Likert scale, which was answered by people
from only 34 companies. The next step was to focus on one of these
companies and to conduct a case study analysis looking now for qualitative
data. Thus, a certified company was chosen. This choice had to fulfill some
conditions: this company is medium sized, listed in Athens stock exchange
and its managers are very concerned about quality matters. The interviews
were taken place in company’s offices, including a variety of people, begging
with the CFO, the quality manager, the sales manager and finally, employees
from different departments.
The dissertation consists of five chapters. In chapter 1, a thorough
literature review is being made, examining in depth every theoretical
background existing about this aspect globally as well as in Greece
specifically. In chapter 2, the research model is being analyzed. Three
aspects are being covered: the model design, the forming of the hypotheses
and the research methodology that has been conducted. Chapter 3 includes
the survey results and further discussion. The main analysis was conducted
with the SPSS version 16, statistical package. Chapter 4 specifies the
limitations of the research and the conclusions. Finally, in chapter 5,
appendices include both questionnaires that were used to complete this
survey: the one that was mailed to certified companies and the other that was
used to conduct the interviews.

_____________________________________________________________________
_________________________________________________________________
- 7 -
CHAPTER 1:
Literature Review
1.1 Quality Management Systems
The Quality Management Systems (QMS) are applicable to all
organizations, regardless of type, size and product / service provided, and can
be used by internal and external parties, including certification bodies /
suppliers, to assess the organization's ability to meet customer, regulatory
and organization's own requirements.
The application of a quality system emphasizes the importance of:
understanding and meeting requirements
obtaining results of process performance and effectiveness
continual improvement of processes based on objective monitoring /
measurement, and subsequently
the need to consider processes in terms of added value
To become more specific, the ISO (International Organization for
Standardization) 9000 series describes standards for a QMS addressing the
principles and processes surrounding the design, development and delivery of
a general product or service.
Recently, an interest to examine the impact of certification to these
firms has occurred. Specifically, there is a promise that after adopting these
programs, a firm can improve efficiency and profitability. This improvement
comes up as a result, no matter if a firm is listed or non-listed. Although many
companies proceed to the certification mostly because their customers
demand so, the upcoming positive results, force them to take one further step:
the implementation of Total Quality Management (TQM).
Sampaio et al. (2009) made a thorough research in literature,
concerning the ISO 9000 series: out of the total sample of almost 100 papers,
70 per cent turn out to be surveys, 17.5 per cent were analysis of financial
indicators, 7 per cent case studies and only 5.5 per cent other, such as
interviews, literature reviews and statistical data analysis.

_____________________________________________________________________
_________________________________________________________________
- 8 -
1.2 The ISO 9000 standard series
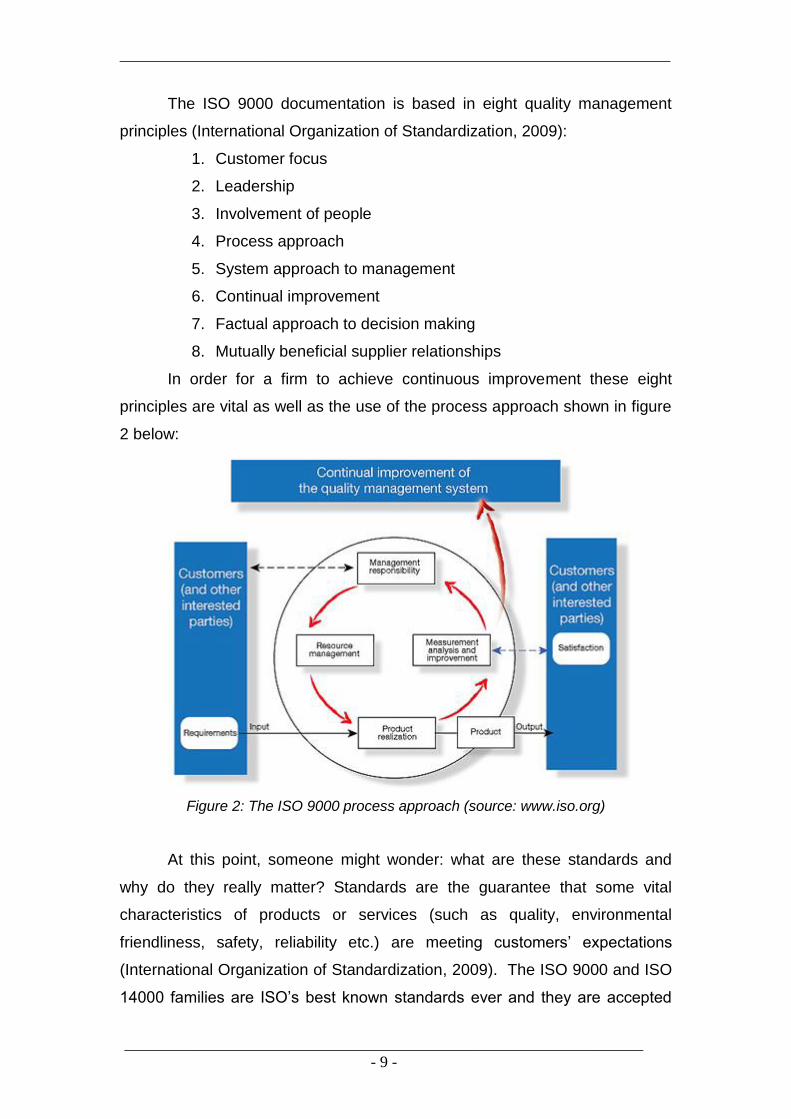
Nowadays, it is more than obvious, that more firms understand and
accept the importance of the quality management and therefore, they seek to
certify the quality of their products, services or processes. Brown et al. (1998),
mentions that the number of managers who point out to the tangible effects of
ISO 9000 series are growing rapidly. This growth over the years is
demonstrated in figure 1:
986
813889
995
1247 1240
1388
11051230
0
200
400
600
800
1000
1200
1400
2000 2001 2002 2003 2004 2005 2006 2007 2008
Standards published
Figure 1: The ISO standards published (source: ISO 2008 annual report)
What is the underlying purpose of ISO 9000? If one considers that
most activities in firms are consisted of repeated tasks, the certification
guarantees that these activities not only can be measured, but they can add
value to the product (or the service) as well (Stevenson and Barnes, 2001). Of
course, all these are referring to documentation, which ensures that whenever
the same activity takes place, it is performed similarly following the same
methods and procedures (McTeer and Dale, 1994). The ultimate achievement
of ISO 9000 is that the procedures and the standards are globally accepted by
customers and suppliers as well. It is a system that supervises all internal
procedures of a company in order to come up with the same result
continuously. Finally, as Sharma (2005) states, certification must be
established only by an independent ISO audit. The company must meet the
requirements at all times. Thus, ISO implementation and maintenance is a
non-stop process.
_____________________________________________________________________
_________________________________________________________________
- 9 -
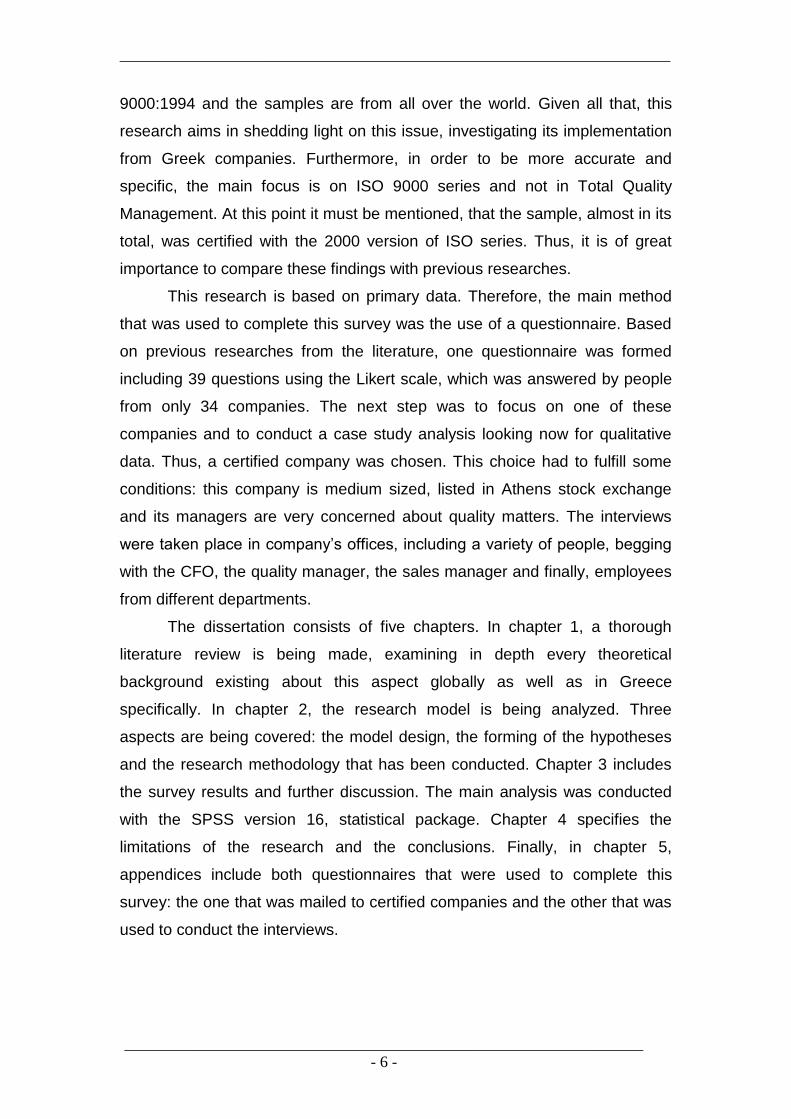
The ISO 9000 documentation is based in eight quality management
principles (International Organization of Standardization, 2009):
1. Customer focus
2. Leadership
3. Involvement of people
4. Process approach
5. System approach to management
6. Continual improvement
7. Factual approach to decision making
8. Mutually beneficial supplier relationships
In order for a firm to achieve continuous improvement these eight
principles are vital as well as the use of the process approach shown in figure
2 below:
Figure 2: The ISO 9000 process approach (source: www.iso.org)
At this point, someone might wonder: what are these standards and
why do they really matter? Standards are the guarantee that some vital
characteristics of products or services (such as quality, environmental
friendliness, safety, reliability etc.) are meeting customers’ expectations
(International Organization of Standardization, 2009). The ISO 9000 and ISO
14000 families are ISO’s best known standards ever and they are accepted
_____________________________________________________________________
_________________________________________________________________
- 10 -
worldwide. For instance, ISO 9001:2000 and ISO 14001:2004 are
implemented by over a million firms in more than 175 countries. The 9000
series refer to “quality management” while the 14000 series to “environmental
management”.
Nowadays, the two series seem to overlap each other. The necessity
to become more environmental friendly applies to the latest 2008 version of
9001 series. Casadesus and Gimenez (2000) made a research including 288
Spanish firms. More than 75 per cent of them indicated that the newest
version of ISO 9000 should include environmental aspects. Companies are
not unconcerned about these matters. For that reason the 9001:2000 version
was embraced with more positive responses (Poksinska et al, 2002, McGuire
and Dilts, 2008) than the previous (9001:1994) one. The 2000 version
achieved more relevance to the service sector, the implementation
procedures became more flexible and thus easier, and finally more synergy
between quality management and environmental management (Terziovski et
al, 2003). In other words, as Bendell and Boulter (2004) indicate, it was given
more emphasis on process management.
However, at this point it must be noticed that, there are also other
findings which differ. ISO 1994 versions (all three of them 9001, 9002, and
9003) reported more benefits than the 2000 version (Dick et al, 2008). It must
be also mentioned that for all versions, a decrease has been occurred
recently.
The successful appearance of the 2000 version was followed recently
by the new 2008 version. In this new version, there are no new requirements,
which enhance the belief that the older version was proved almost perfect.
According to International Organization of Standardization, the 2008 version
aims in shedding light to the existing requirements and in improving the
synergy with the ISO 14001:2004 series.
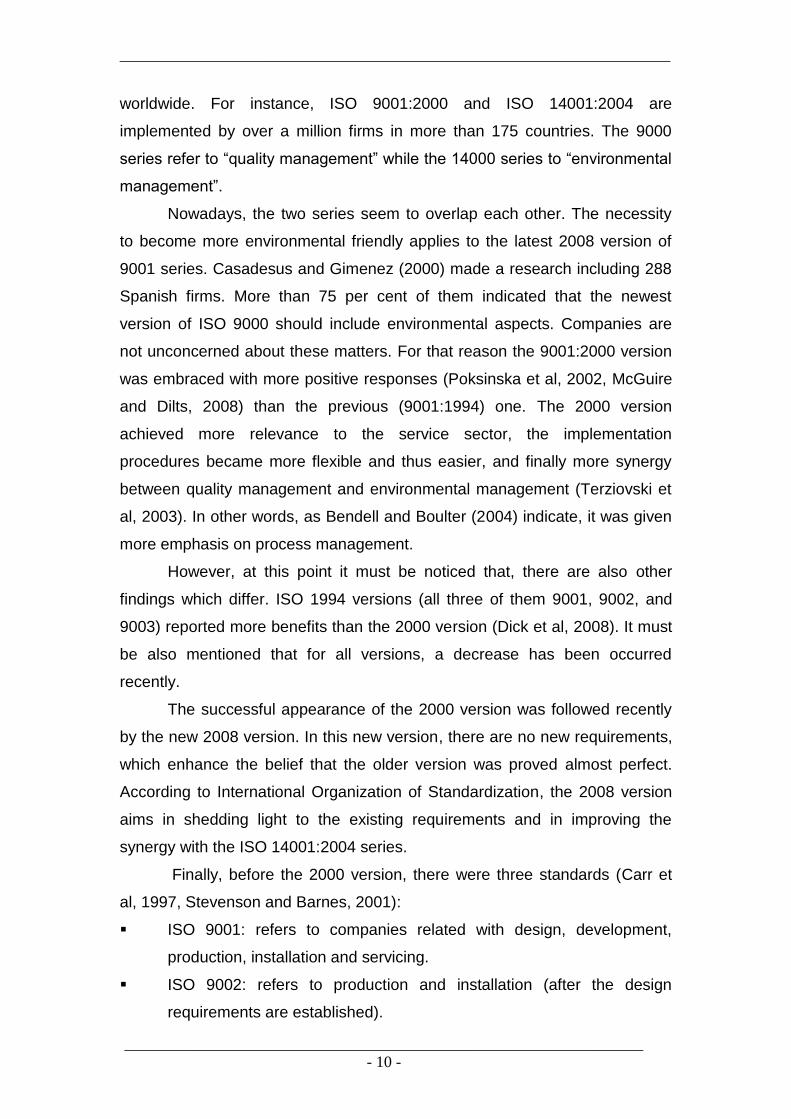
Finally, before the 2000 version, there were three standards (Carr et
al, 1997, Stevenson and Barnes, 2001):
ISO 9001: refers to companies related with design, development,
production, installation and servicing.
ISO 9002: refers to production and installation (after the design
requirements are established).

_____________________________________________________________________
_________________________________________________________________
- 11 -
ISO 9003: refers to final inspection and testing.
As Sun and Cheng (2002) state, it was common that large firms
preceded to ISO 9001 implication, when SMEs (small and medium sized
enterprises) proceeded to ISO 9002. The reason behind this is that usually
there is no product design in SMEs, and thus 9002 series were sufficient.
After the year 2000 revision, all three types are merged into a single
document known as ISO 9001. Additionally, ISO 9004 is developed, referring
to performance improvement.
1.3 Theoretical background
1.3.1 Reasons for implementation / motives
Many surveys have been made during the past years concerning the
motives behind the ISO certification. It is common sense that managers and
firms’ employees are the most appropriate ones to shed light on this aspect.
Boiral (2003) made a survey and he arranged interviews with almost 50
managers and employees, outside their workplaces. There were three
categories found: the typical ones, the enthusiasts and the undecided. The
first category, almost 45 per cent, indicated external reasons, whilst the
second ones (almost 35 per cent), indicated the certification as a marketing
tool (internal reason). One thing is for certain: the motives behind the
implementation can be categorized into two main groups: internal and
external. All the motives found in literature are summarized in table 1.
According to Brown et al. (1998), the reasons differ between small and
large sized companies. Small companies are very concerned about time as
well as money spent for the implementation. These costs compared to their
revenues are not insignificant. Furthermore, there is no internal pressure from
their managers to follow quality standards. Thus, the main reason for
implementation is external and most common: customers’ demand (McTeer
and Dale, 1994, Carr et al, 1997, Terziovski et al, 1997, Brown et al, 1998,
Whithers and Ebrahimpour, 2000, Sun and Cheng, 2002, Boiral, 2003, Chow-
Chua et al, 2003, Stalhane, 2006). On the contrary, large companies proceed
to ISO or other quality management implementations as a result of internal
decisions in order to achieve other goals such as cost reductions (Sun and

_____________________________________________________________________
_________________________________________________________________
- 12 -
Cheng, 2002). In addition to those, McAdam and Canning (2001) also
concluded that implementation decision is strongly correlated to firm’s size.
Reasons for ISO implementation
Internal External
Seek for cost reductions (McTeer and
Dale, 1994, Casadesus and Gimenez,
2000, Sun and Cheng, 2002, Douglas et
al, 2003, Martinez-Costa et al, 2008)
Improve customer service (Casadesus
and Gimenez, 2000)
Improve efficiency (Curkovic and Pagell,
1999, Chow-Chua et al, 2003, Douglas et
al, 2003, Zaramdini, 2007)
Seek for quality improvement (Curkovic
and Pagell, 1999, Chow-Chua et al, 2003,
Zaramdini, 2007)
Company morale improvement (McTeer
and Dale, 1994)
Customers’ demand (McTeer and Dale,
1994, Carr et al, 1997, Terziovski et al,
1997, Brown et al, 1998, Whithers and
Ebrahimpour, 2000, Sun and Cheng,
2002, Boiral, 2003, Chow-Chua et al,
2003, Stalhane, 2006)
Be considered for tenders (Brown et al,
1998, Douglas et al, 2003)
Increase market share (Casadesus and
Gimenez, 2000, Douglas et al, 2003)
Gain marketing benefits (McTeer and
Dale, 1994, Whithers and Ebrahimpour,
2000, Douglas et al, 2003)
Advantage in international markets
(Curkovic and Pagell, 1999)
Anticipate future customer
requirements (Douglas et al, 2003)
Certified competitors (Chow-Chua et al,
2003)
Table 1: Reasons for implementation
Customers’ requirements, as a rationale, are not the motive that will
lead to benefits gains but certainly is the main reason for implementation.
Whithers and Ebrahimpour (2000) made a survey including some European
companies from different sectors. The findings are unquestionable: almost 75
per cent cited customers’ demand as a reason for implementation. All of them
cited this reason to be at the top four reasons. Firms are aiming in increasing
their sales and their market share, in order to balance their implementation
costs with more product sales and eventually increase profits. In practice it is
proved to be all wrong.

_____________________________________________________________________
_________________________________________________________________
- 13 -
The two categories of motives (internal and external) have an effect on
the success of the implementation and thus its benefits. Outside forces such
as customers’ demand are not related with success. In order for a firm to
receive all the benefits of the certification the motives have to be internal
(Brown et al, 1998, Singels et al, 2001, Martinez-Costa et al, 2008).
Furthermore, at this point one vital fact must be considered: employees are
the key to implementation process. Thus, all procedures must be made with
conscientiousness on their behalf, as their participation is not only during the
implementation but mainly after (Brown et al, 1998).
Douglas et al. (2003) indicate another main motive: ISO 9000
certification gives the opportunity to the firms to open to new markets or
obtain businesses they might not achieve otherwise. To begin with, as
Curkovic and Pagell (1999) state, with the certification an organization can
prove its quality awareness and thus, gain a competitive lead to the markets
globally. Furthermore, it should not be forgotten that nowadays with the power
of the internet and e-commerce, one may consider as a market the whole
world. Finally, with the number of certifications increasing and the acceptance
of ISO standards worldwide, it is often a necessary condition the certification
itself in order to make a business agreement, especially when it comes to
government business demands.
Many firms, after taking into consideration the cost aspect, proceed to
implementation phase aiming at cost reduction. They seek to improve their
production process efficiency, achieve marketing benefits and cost reductions
(McTeer and Dale, 1994, Casadesus and Gimenez, 2000, Douglas et al,
2003, Martinez-Costa et al, 2008). All firms seek for better financial results.
One main target is to improve productivity. Many people think that the
certification results may be intangible. On the contrary, ISO certification set
standards in production procedures and thus eliminates the possibility to
come up with inefficiencies as they become simpler and more accurate.
Whithers and Ebrahimpour (2000) found out that these expectations for
productivity improvement are actually one of the top two reasons for
implementation. The two thirds of the companies in their survey agreed to that
aspect.

_____________________________________________________________________
_________________________________________________________________
- 14 -
Despite of the main reasons that lead to an implementation decision,
there are some other reasons that are usually cited: Pressure from the
competition (Whithers and Ebrahimpour, 2000, Chow-Chua et al, 2003), good
management practice (Chow-Chua et al, 2003), and company morale
considerations (McTeer and Dale, 1994). With the continuously growing
number of certifications, many firms are forced to make an implementation by
the already certified competitors. Whithers and Ebrahimpour (2000) came up
with the finding that more than 50 per cent of the companies cited this as a
reason and the three quarters of them identified this as one of the top three
reasons. Actually, this is related to customers’ demand for quality certification.
So far, all the findings indicate a strongly positive relationship between
the motives of implementation and the benefits obtained. Those firms that
proceed to ISO implementation on their own will are more likely to achieve
improvement in their procedures and thus come up with benefits (Terziovski
et al, 2003). In simple words, the motives for implementation influence the
overall upcoming results.
1.3.2 Benefits of implementation
As mentioned before, there is a strong relationship between the
reasons of implementation and the benefits that an organization achieves. To
be more specific, it is found that firms reach maximum benefits if they
implement ISO 9000 internally motivated (Jones et al, 1997, Leung et al,
1999, Yahya and Goh, 2001, Casadesus and Karapetrovic, 2005, Poksinska
et al, 2006, Boiral and Roy, 2007, Sampaio et al, 2009). As Biazzo and
Bernardi (2003) state, when a firm is seeking for process and product
improvements, they manage to gain all these and even more benefits after the
certification. On the contrary, seeking only for marketing objectives or
maximization of profits, the results seem to be negative. Finally, it must be
also noticed that, benefits are supposed to derive not immediately but years
after the certification (Leung et al, 1999).
Furthermore, a firm has to realize that to proceed willingly to
implementation decision is not the only important factor. They have to
understand that this is a time, money and energy investment. According to
Curkovic and Pagell (1999), in order to minimize errors, a company has to find
_____________________________________________________________________
_________________________________________________________________
- 15 -
a way to measure the processes and the problems that occur. This
measurement becomes very easy with the use of ISO documentation, and
thus the path to performance improvement becomes wide open. In simple
terms, certified firms are focusing on quality even more than those who are
not certified or are not planning to do so (Carr et al, 1997).
At this point, it must be mentioned that many times the benefits are
slightly unclear. Furthermore, there are many people whose interpretations
differ or difficulties in proper measurement occur. Little research has been
made with certain financial measures being used, such as Return on Assets
(ROA) or even increase on the stock price (for the listed firms). Even with
these anomalies taken for granted, literature agrees that benefits can be split
into two categories: internal and external (Tsiotras and Gotzamandi, 1996,
Casadesus and Gimenez, 2000). In 2001, Casadesus et al, made a research
considering 502 certified firms in Spain. Over 65 per cent of the sample
achieved significant benefits both internal and external. In addition to that,
only 6 per cent showed lower benefits. In any case, there were no indications
of gaining no benefits at all. All the possible benefits of ISO 9000
implementation are summarized in table 2.
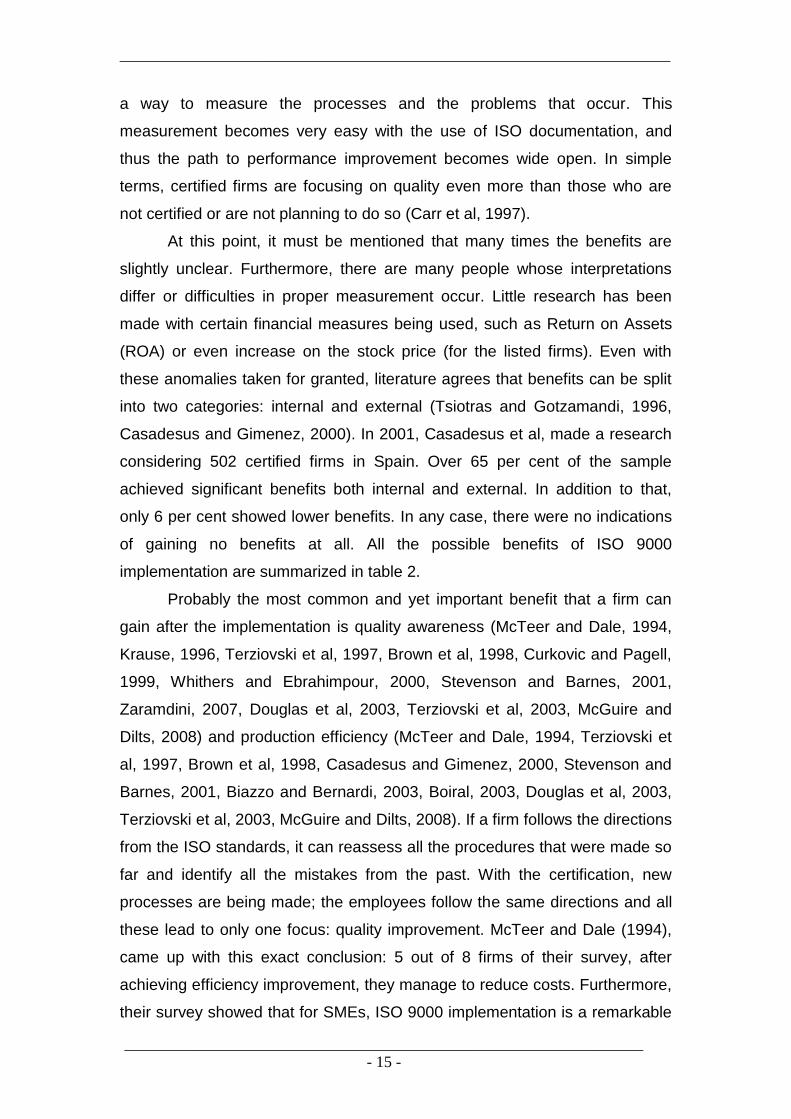
Probably the most common and yet important benefit that a firm can
gain after the implementation is quality awareness (McTeer and Dale, 1994,
Krause, 1996, Terziovski et al, 1997, Brown et al, 1998, Curkovic and Pagell,
1999, Whithers and Ebrahimpour, 2000, Stevenson and Barnes, 2001,
Zaramdini, 2007, Douglas et al, 2003, Terziovski et al, 2003, McGuire and
Dilts, 2008) and production efficiency (McTeer and Dale, 1994, Terziovski et
al, 1997, Brown et al, 1998, Casadesus and Gimenez, 2000, Stevenson and
Barnes, 2001, Biazzo and Bernardi, 2003, Boiral, 2003, Douglas et al, 2003,
Terziovski et al, 2003, McGuire and Dilts, 2008). If a firm follows the directions
from the ISO standards, it can reassess all the procedures that were made so
far and identify all the mistakes from the past. With the certification, new
processes are being made; the employees follow the same directions and all
these lead to only one focus: quality improvement. McTeer and Dale (1994),
came up with this exact conclusion: 5 out of 8 firms of their survey, after
achieving efficiency improvement, they manage to reduce costs. Furthermore,
their survey showed that for SMEs, ISO 9000 implementation is a remarkable
_____________________________________________________________________
_________________________________________________________________
- 16 -
aid, in order to improve in many ways, and eventually to grow bigger.
Whithers and Ebrahimpour (2000), taken sample from different European
companies, concluded with the same undeniable result: after the ISO 9000
certification, quality does actually improve.
Benefits of ISO implementation
Internal External
Quality awareness (McTeer and Dale, 1994, Krause, 1996,
Terziovski et al, 1997, Brown et al, 1998, Curkovic and
Pagell, 1999, Whithers and Ebrahimpour, 2000, Stevenson
and Barnes, 2001, Douglas et al, 2003, Terziovski et al,
2003, McGuire and Dilts, 2008)
Production efficiency (McTeer and Dale, 1994, Terziovski
et al, 1997, Brown et al, 1998, Casadesus and Gimenez,
2000, Stevenson and Barnes, 2001, Biazzo and Bernardi,
2003, Boiral, 2003, Douglas et al, 2003, Terziovski et al,
2003, McGuire and Dilts, 2008)
Increased productivity (Curkovic and Pagell, 1999,
Casadesus and Gimenez, 2000, Biazzo and Bernardi, 2003,
Terlaak and King, 2006, Douglas et al, 2003, McGuire and
Dilts, 2008)
Better documentation (McTeer and Dale, 1994, ,
Terziovski et al, 1997, Stevenson and Barnes, 2001,
Douglas et al, 2003)
Error rates reduction (Boiral, 2003, Terziovski et al, 2003)
Improved internal operations (Whithers and Ebrahimpour,
2000, Stevenson and Barnes, 2001, Douglas et al, 2003)
Easier training of new employees (McTeer and Dale,
1994)
Cost reduction (McTeer and Dale, 1994, Brown et al, 1998,
Terziovski et al, 2003)
Staff motivation (Brown et al, 1998, Terziovski et al, 2003)
Profitability (Stevenson and Barnes, 2001)
Improved response to
customer requirements
(Terziovski et al, 1997, Brown et
al, 1998, Casadesus et al, 2001,
Stevenson and Barnes, 2001,
Biazzo and Bernardi, 2003,
Boiral, 2003)
Market share (Brown et al,
1998, Terziovski et al, 2003,
McGuire and Dilts, 2008)
Overseas market access
(Brown et al, 1998)
Sales increased (McTeer and
Dale, 1994)
Marketing (Buttle, 2001)
Table 2: Benefits of implementation

_____________________________________________________________________
_________________________________________________________________
- 17 -
More internal benefits that arise instead of the external are error rates
reduction (Boiral, 2003, Terziovski et al, 2003). Analyzing this aspect, Brown
et al (1998) realized that a firm manages to achieve this with better internal
communication, and by showing order in procedures as well as discipline from
the employees. With ISO 9000, employees and managers have in their
inventory a powerful tool that helps them to assess quality with more specific
ways (Curkovic and Pagell (1999). This leads to adding value to the product
or the service provided. Moreover, many European firms identified better
communications and relations between the employees in a survey made by
Whithers and Ebrahimpour (2000).
One more aspect that arises internally is the matter of cost reduction.
By minimizing errors, one can assume that cost of products will decrease as
well. There are two – almost opposite – opinions found in literature. McTeer
and Dale (1994) found remarkable reduction in costs, but it must be
mentioned that their survey included only small companies. On the contrary,
there is little or none cost reduction, according to Brown et al (1998) after a
survey in small companies as well. Terziovski et al (2003), however, are
clearer about the non existence of cost reduction, as they contact a survey
including 400 companies.
McGuire and Dilts (2008) in their findings proved that while a firm gains
benefits internally, external metrics seem unchanged. Furthermore, it was
clearly shown that there was absolutely no noticeable effect on the share
price. Similarly, with many internal metrics raised and with the employees’
motivations after the certification, production volume seems to increase as
well (Terlaak and King, 2006). This aspect must be taken into account, in
order to interpret the opposite findings: external metrics can be improved also.
To begin with, Boiral (2003), stands in the middle. He argues that
quality and internal communication is improved as well as monitoring
procedures becomes easier and more accurate. The benefits, though, seem
to continue: Commercial advantages arise, and thus ISO certification,
becomes a remarkable marketing tool. McTeer and Dale (1994) found that 75
per cent of the companies examined verified the marketing possibilities
behind the implementation, even though there was no actual measurement
whatsoever.

_____________________________________________________________________
_________________________________________________________________
- 18 -
Another external benefit that firms seek to gain with the implementation
is an increase in market share. However, the findings concerning this aspect
are contradictory. Stevenson and Barnes (2001) state that, many companies
increased their profitability after the certification. The explanation is quite
simple: ISO 9000 adds credits to sellers as long as the quality is concerned.
Customers are aware of the fact that, certified companies are under external
and credible supervision. Therefore, it is certain that the company follows
quality standards that are globally accepted.
On the contrary, a remarkable number of firms are quite sceptical
about this matter (Brown et al, 1998, Terziovski et al, 2003, McGuire and
Dilts, 2008). Many of them notice it as a benefit but they are not ranking it
over the top. One may consider that it is very difficult to measure whether the
sales increase comes as a result of the ISO implementation or other factors
considering.
Finally, there is no doubt that ISO 9000 certification can lead to
improved response to customer requirements (Terziovski et al, 1997, Brown
et al, 1998, Casadesus et al, 2001, Stevenson and Barnes, 2001, Biazzo and
Bernardi, 2003, Boiral, 2003). It should not be forgotten that customers’
demand is the main reason for ISO implementation. Thus, after fulfilling this
demand, companies may expect for sales increase and maximization of
profits.
Many people consider ISO 9000 series to be beneficial only in
industrial sector. This is also proved by the enormous amount of literature that
is referred on industries. However, there are studies that indicate quite the
opposite. A recent study by Caro and Garcia (2009) demonstrated that
customers’ demands are also fulfilled after the certification in the service
sector as well. Furthermore, such firms achieved significant growth after the
implementation. Given that, Caro and Garcia (2009) strongly suggest that
insurance companies must also consider ISO 9000 as beneficial. In addition,
Singh et al (2006) performed a parallel survey including 149 firms from the
service sector and 160 firms from the industrial sector. No significant
differences were noticed. Firms from the service sector can also gain
improvement, especially in their internal procedures (McAdam and Canning,
2001).
_____________________________________________________________________
_________________________________________________________________
- 19 -
To sum up, ISO 9000 provides the motivation and the aid to a company
in order to improve quality performance. However, its benefits are becoming
more tangible if it is used as a step to TQM (Total Quality Management)
implementation (Sun, 2000). Similarly, Biazzo and Bernardi (2003) are
indicating that ISO 9000 must be used as the foundation for process
management and creating a culture of continuous improvement.
1.3.3 Impact on financial performance
Every finance book explains that the main goal of financial managers is
to maximize shareholders wealth. With this financial perspective, if one may
consider ISO 9000 implementation as an investment with the literal meaning,
comes up with the conclusion that it is a bad investment and it should not be
in the shareholders’ interest (Brealey et al, 2006). On the other hand, there
are many important aspects to be further analyzed and it is not just a simple
thing to interpret: production process, customer satisfaction, employee
motivation, marketing benefits that may assist to increase market share, and
sometimes impact on share price (Aarts and Bos, 2001, Buttle, 2001, Singels
et al, 2001).
Many studies demonstrate that there is no obvious link between ISO
certification and sales growth or overall performance (Dick, 2000, Heras et al,
2002, van der Wiele, 2005). However, it is expected that improvement on
internal procedures may affect the financial performance as well. On the other
hand, it is no secret that firms that already perform will seek for certification
anyway (van der Wiele, 2005).
Previously, it was mentioned that there is a strong correlation between
the motives behind the implementation decision and the financial
improvement on firms’ performance (Douglas et al, 2003). Furthermore, if a
firm’s main target is to use ISO 9000 as an advertisement, then the large
amount of paperwork will transform the implementation success into a total
failure (Sun, 2000). However, only a minimum portion of the literature did
actually shed light on tangible measures of a firm’s economic factors. Most
surveys are referring more to intangible factors such as production efficiency
etc. Nevertheless, a certified company can use some metrics to evaluate the
impact of ISO 9000 series on sales (by achieving higher revenues or by

_____________________________________________________________________
_________________________________________________________________
- 20 -
minimizing costs), on return on assets (ROA), on return on sales (ROS), on its
share price, and after all on its overall financial performance (Aarts and Bos,
2001, Boiral, 2003, Douglas et al, 2003, Sharma, 2005, Ferreira et al, 2008,
McGuire and Dilts, 2008).
Some may consider the fact that financial results are only reflecting a
firm’s business position (Curkovic et al, 2000). Moreover, Venkatraman and
Ramanujam (1986) state that the firm’s financial results are not enough to
measure performance and literature shows this confusion as well. Many
researchers are skeptical and they are taking under consideration primary and
secondary data as well. Best results arise when both of them are used
(Venkatraman and Ramanujam, 1986). In simple terms, on the one hand
there are managers’ and employees answers on surveys which are
subjective, while there are financial data for the company which are more
objective. However, things are more complicated. As Martinez-Costa et al
(2008) state, the first ones are questioned about their reliability, while the
second ones are reflecting the whole sector situation as well. For these
reasons, the best method that must be followed is to interpret company’s
results by taking into account both aspects. After all, even though some
factors are immeasurable (such as flexibility, quality, efficiency to name a
few), there are still some others that are quite tangible (production costs,
stock price etc) (Martinez-Costa et al, 2008).
To begin with, there are surveys that make a research on ISO 9000
series’ impact on sales and/or market share (Sun and Cheng, 2002,
Terziovski et al, 2003, Corbett et al, 2005, Sharma, 2005, Benner and Veloso,
2008). Sun and Cheng (2002) are drawing a line between ISO certification for
SMEs and large companies. As mentioned before, an SME proceeds to ISO
implementation as a result of customers’ pressure. Thus, after the
implementation they meet customers’ expectations and, as a result, their
sales may grow. This relationship is also suggested by the balanced-
scorecard framework (Sharma, 2005). Sharma (2005) suggests three
dimensions of financial performance: operating efficiency – measured with
profit margin -, growth in sales, and overall financial performance measured
by earnings per share. Furthermore, with the certification, they may penetrate
into new markets or make new deals (with government for example) that have

_____________________________________________________________________
_________________________________________________________________
- 21 -
ISO certification as main requirement. All these, may lead the firm to overall
performance improvement (Sun and Cheng, 2002). However, Sharma’s
(2005) findings are pointing that ISO 9000 series’ impact is more obvious on
profit margin than sales.
There are other surveys moving in the same direction. Firstly, operating
efficiency is derived by reduced costs that are achieved by making all
processes more accurate and with fewer mistakes (Terziovski et al, 2003,
Corbett et al, 2005). Furthermore, new markets penetration or an increase on
customers’ satisfaction is the reason for performance improvement (Corbett et
al, 2005, Benner and Veloso, 2008).
Corbett et al, 2005, made a survey in the United States, testing various
hypotheses such as: increase on ROA (return on assets) and ROS (return on
sales), lower cost of goods sold (COGS)/SALES ratio. Their findings led to the
conclusion that there were actually significant improvements in overall firms’
financial performance. However, it is once more mentioned that the way that
every firm is obtaining ISO series is strictly related to benefits that arise.
Proper motives for implementation lead to better performance and benefits
gaining (Corbett et al, 2005).
More recent studies conduct a financial performance measurement, by
investigating ISO 9000 series’ impact on firms’ stock price (Aarts and Bos,
2001, Boiral, 2003, Sharma, 2005, Benner and Veloso, 2008, Ferreira et al,
2008, McGuire and Dilts, 2008). McGuire and Dilts, (2008), used a sample of
204 small and large companies from different sectors, for the years 1999 to
2002. They took under consideration the possible different impacts of the two
ISO 9000 series: the 1994 version and the 2000 version. Their conclusion
was that there was no positive reaction to the stock market after the
announcement or after the implementation itself. However, as far as the
companies that implemented the ISO 9000:2000 series are concerned, they
showed an increase in their market value of equity.
. On the contrary, Ferreira et al (2008) with a sample of 631 firms from
the United States, came to a different conclusion: there is a difference
between small, medium and large sized firms. Large firms, after the ISO
implementation announcement, achieve higher returns in 1 to 3 next year’s

_____________________________________________________________________
_________________________________________________________________
- 22 -
horizon. Medium sized firms show no significant change for the same periods.
Small sized firms, though, showed negative returns.
One recent study is more encouraging. Benner and Veloso (2008)
without separating firms into categories, concluded that there may be a
positive reaction on firm’s share price, and eventually add wealth on
shareholders. In order to interpret this reaction, Benner and Veloso (2008),
assumed that investors’ belief is that ISO implementation will actually improve
firm’s overall financial performance and thus this belief affects their behavior.
On the contrary, Terziovski et al (1997) came up in Australia and New
Zealand, with negative results. Due to the difficulty of measuring the
performance, ISO 9000 implementation has none or little effect. Terziovski et
al (1997) came with this result including one more parameter in their study:
they not only considered ISO certification existence, but they also considered
the presence (or the absence in some cases) of TQM environment.
To sum up, Sun (2000) came up with the conclusion that the truth is
placed somewhere in the middle. One must dig deeper if he wants to interpret
the results with accuracy. Some metrics are unquestionable: ISO certified
companies are showing reduced errors and thus reduced production costs;
they minimize customer complaints and thus may boost sales. On the
contrary, there are no significant differences in the market position of the
firms. To put it in numbers, Douglas et al (2003) after a survey on over 100
UK ISO certified firms concluded that 75 per cent of the firms consider it to be
good value for money.
1.3.4 Doubts/Disadvantages
So far, it is occurred that literature in its whole, examines the benefits
of the ISO 9000 implementation that derive for a certified company. Still, there
is a minority who expresses its doubts or even its negative feelings
(Terziovski et al, 1997). Furthermore, Carr et al (1997), concluded that the
hypothesis of ISO certification equals to financial performance improvement
should be rejected. Nevertheless, even for the surveys with positive
conclusions, there are for certain some disadvantages, occasionally. The two
most common cited disadvantages of the ISO implementation are the large
amount of paperwork needed in order to certify quality after it (McTeer and
_____________________________________________________________________
_________________________________________________________________
- 23 -
Dale, 1994, Terziovski et al, 1997, Brown et al, 1998, Singels et al, 2001,
Douglas et al, 2003, Bendell and Boulter, 2004), and its cost (Terziovski et al,
1997, Stevenson and Barnes, 2001, Singels et al, 2001, Douglas et al, 2003,
Bendell and Boulter, 2004). Moreover, going down on the rank, some other
are also found. These are: time pressure (McTeer and Dale, 1994, Whithers
and Ebrahimpour, 2000), discourage of creative thinking on employees’ behalf
(Singels et al, 2001, Bendell and Boulter, 2004), lack of knowledge from the
consultants (McTeer and Dale, 1994), lack of benefits for late adopters
(Benner and Veloso, 2008).
The most common cited disadvantage of ISO implementation is its cost
(Terziovski et al, 1997, Stevenson and Barnes, 2001, Singels et al, 2001,
Douglas et al, 2003, Bendell and Boulter, 2004). Especially for small sized
companies, cost is always an issue. The cost of implementation is actually
difficult to measure with accuracy. According to Stevenson and Barnes
(2001), four main factors must be included: time needed for the procedures,
training of the staff that is equivalent to lost man-hours, the consultants’
payment, and the registration fee. The first two factors are more intangible
and thus impossible to measure. On the other hand, the latter two could be
more specific.
The matter of cost for a consultant is relevant. First of all, it is related to
the firm size. Furthermore, the complexity of the company is also an issue.
Managers’ and employees’ commitment is also vital, because in that case
there are fewer meetings and thus less money for the consultant. Typically, a
consultant may ask for 3,000 euros (for a common firm) up to 5,000 euros and
more if the company’s sector is a rather new area for the consultant. Usually,
the training is made with seminars. It is calculated that one day seminar to the
quality manager and the staff costs about 500 euros. Finally, the cost of the
registration fee and the cost of auditing are about 4,000 euros for a period of 3
years. That is, 1,500 euros the registration fee and up to 1,200 euros per year
of auditing. These prices are referring to the top consultant firms in the
market. It must be mentioned though, that these costs may differ as they are
influenced by firm’s size and its existing (or not) of a quality management. On
the contrary, considering all these, ISO 9000 might be related with future
payoffs of some kind, otherwise no one would proceed to such a decision
_____________________________________________________________________
_________________________________________________________________
- 24 -
(Stevenson and Barnes, 2001). Finally, McTeer and Dale, (1994), suggested
that the enlarged amount of documentation needed, might add extra cost to
the whole procedure.
Another most cited disadvantage of the ISO certification, always placed
at the top two, is the enormous amount of documentation needed for the
procedures not only during the implementation but mainly after it (McTeer and
Dale, 1994, Terziovski et al, 1997, Brown et al, 1998, Singels et al, 2001,
Douglas et al, 2003, Bendell and Boulter, 2004). Usually this factor is not an
issue for large companies which already follow quality management of some
kind. In small sized companies though, it is a deterrent matter. As Brown et al
(1998) state, a large portion of documentation is needed for the audits.
Furthermore, extra documentation is needed for keeping records in order to
stabilize the procedures and eliminate errors. For some employees, this
paperwork is usually time-consuming. In simple terms, ISO implementation is
considered a bureaucratic procedure for small sized companies which adds
costs and offers no benefits whatsoever (McTeer and Dale, 1994).
Even if a company takes cost and paperwork for granted, there are still
some other disappointments often mentioned in literature. To begin with, there
are some complaints about the consultants’ expertise (McTeer and Dale,
1994). Companies are forced to seek for consultants’ aid in order to achieve
future audit’s expectations. Unfortunately, firms from more complex sectors
find it difficult to employ a consultant with relevant experience (Stevenson and
Barnes, 2001). At this point, it must be noticed that this issue is almost solved
with the ISO 9000:2000 version, which focused (amongst others) more to
service sectors as well (Douglas et al, 2003). The same problem was cited as
ISO 9000 series used to be not specific but quite general (Terziovski et al,
1997, Douglas et al, 2003).
As mentioned before, the most important reason for the ISO
implementation, as far as small sized companies is concerned, is an external
one and more specifically this of customers’ demand. After the
implementation, certified firms are aiming in sales increase, bigger market
share and conducting new deals with organizations that demand ISO
certification as required factor. ISO certification is supposed to become the
powerful marketing tool to assist these goals. Given that, it is a major

_____________________________________________________________________
_________________________________________________________________
- 25 -
disappointment to realize that a non-certified firm can make contracts even
though quality certification is required (Brown et al, 1998).
A recent study demonstrated one other doubt that is actually
remarkable: late adopters are not benefited as early adopters did (Benner and
Veloso, 2008). Early adopters can use ISO certification as a marketing tool,
and become innovators on their sector. On the other hand, as years go by,
quality assurance has become common requirement and eventually it has lost
its marketing power.
According to Whithers and Ebrahimpour (2000), after the
implementation a company is supposed to follow some procedures, and thus
this system change can become also a problem. Many firms cited this as one
of the top three problems derived, and it maybe correlated to implementation
time that will expand in order for the employees to find their “new steps”. This
disadvantage is supposed to be eliminated after a while, as the procedures
become more systematic.
On the contrary, these systematic procedures create one unexpected
disadvantage. According to Singels et al (2001) and Bendell and Boulter
(2004), employees after the implementation are discouraged to achieve
creative thinking. With the whole process becoming more automated, they
have less to care about as fewer errors are arising. This limitation on
maneuvers is a reason for some employees to develop a negative opinion
about the ISO certification. Boiral (2003), in his survey, found that 20 per cent
of the employees disagree with the success and the benefits of certification.
They argue that if the result arises, it is supposed to be the consequence of
the certification and not their effort.
One final issue that must be taken into account is the time of
implementation. There are studies from literature that seem to be conflicting.
Casadesus and Karapetrovic (2005) conducted two surveys: one in 1998 and
another one, four years later, in 2002. Findings have indicated a decrease in
gaining benefits, as time went by. On the contrary, Jones et al (1997)
demonstrated the opposite results. Their hypothesis – that early adopters gain
more benefits than the later ones’ – has been rejected.
To sum up, ISO 9000 implementation has its disadvantages. Still, most
of them are strongly related with firm size. Most of these issues are referring
_____________________________________________________________________
_________________________________________________________________
- 26 -
to small sized companies. On the contrary, large sized companies are often
used to apply quality management of any kind, and most important, they
adopt ISO considering it as the first step to continuous improvement, followed
by total quality management (TQM).
1.3.5 The case of ISO 9000 in Greece
Greek firms hesitated, in the beginning at least, to implement quality
management systems. The numbers prove strongly this truth: only 30 firms in
1993, followed by a huge increase to 222 in 1995 (Lipovatz et al, 1999). As
mentioned before, ISO 9000 implementation is a difficult decision for a small
sized company to make, considering the costs and the paperwork demanded.
According to Lipovatz et al (1999), this is the explanation: at that time the
majority of Greek firms were small sized. Nevertheless, Greek companies
started to seek for quality improvement and increase of their competitiveness.
In 1998, quality awareness was triggered by the Greek Ministry of
Development, which declared that year as Quality Year.
Given all that and globally thinking, ISO 9000 certifications in Greece
must be considered a virgin area, at least until recently. This situation
elucidates two matters: the relatively small amount of surveys based in
Greece, and the reason of why there are more doubts in this country than
clear benefits, including the implementation processes. Most of the findings in
other countries are the same here, but there are still some other aspects that
differ.
Motives for implementation
The same motives that exist in any country exist in Greece as well.
There can be external or internal motives. As expected, mainly, the external
motivation (customers’ demand) is applied (Lipovatz et al, 1999). Greek firms
had to catch with both the domestic and the international standards. The first
focus was to become equal to the competition and penetrate in international
markets or increase their domestic portion. This pressure came on chemical
industries at first (Lipovatz et al, 1999).
Nowadays, the findings of recent studies are partly altered. As
Kostagiolas and Kitsiou (2008) state, possible customers’ demand in the

_____________________________________________________________________
_________________________________________________________________
- 27 -
future, scores high as a reason than current demand. In addition, internal
motives arise as well: improvement in internal procedures is now the main
target. Apart from opening doors to new markets, firms seek to improve
quality, communication between employees and show quality awareness in
general (Kostagiolas and Kitsiou, 2008).
Tsiotras and Gotzamani (1996) conducted one of the first surveys
focused on Greece. They found four motives which they tried to rank. Firstly,
there was the use of ISO 9000 certification as a marketing tool, in order to
increase the market share. Secondly, there was the need to respond to
external pressures from the customers and the market. The third motive
behind the implementation decision was to promote quality and its procedures
behind it, in order to expand internationally. The forth reason was considered
the most vital: to become efficient in production and, simply put, to improve
quality awareness.
Nowadays, firms altered their strategies, while motives’ rank position
altered as well. Gotzamani and Tsiotras (2002), state that quality awareness
and internal procedures improvement were placed as top reason for
implementation. On the contrary, external reasons such as customers’
demand and ISO certified competitors, seem to matter less. However,
although recent studies declare the quite opposite, motives did not differed
according the size of the company.
Benefits of implementation
Another reason of the late increase of ISO implementation cases in
Greece was the fact that many benefits of the implementation are not easily
measured. After the first years in which managers seemed skeptical, benefits
came up to the surface. In order to interpret them, one must recognize two
main categories: internal and external (Tsiotras and Gotzamani, 1996).
Furthermore, in Greece, as well as in every country globally, if the
motives for implementation decision are internally driven, then the benefits are
gained more easily and in large amounts. On the contrary, with externally
driven motives (e.g. customers’ pressure) the benefits seem fewer or none at
all (Gotzamani et al, 2006).

_____________________________________________________________________
_________________________________________________________________
- 28 -
To begin with, internal benefits are more intangible, but still more
important for a company. Product quality improvement, standardization of all
procedures and thus fewer errors, reduction of cost, better internal
communications, are unquestionably vital for overall performance
improvement of a company (Tsiotras and Gotzamani, 1996, Lipovatz et al,
1999, Gotzamani and Tsiotras, 2001, Gotzamani and Tsiotras, 2002, Vouzas
and Gotzamani, 2005, Gotzamani et al, 2006, Aggelogiannopoulos et al,
2007, Kostagiolas and Kitsiou, 2008). The “quality awareness” aspect is the
most important contribution for a company (Gotzamani et al, 2006).
Employees follow the same instructions for every procedure and thus, they
have no reason to force themselves to improvise in order to avoid errors.
Given that, procedures come to an end in less time and human resources can
focus to other, more important, matters such as innovation and research
(Tsiotras and Gotzamani, 1996). Increase in quality awareness on behalf of
the employees, increases productivity and eventually reduces costs. Tsiotras
and Gotzamani, (1996), indicate that this occurs as a result of rework
reduction. Therefore, benefits at this point may become measurable.
Furthermore, all the above, compose a reason of accidents reduction and less
employees get injured (Vouzas and Gotzamani, 2005).
Specific instructions in following standard procedures can create one
more benefit according to Lipovatz et al (1999). Training of new personnel
becomes easier and it can be achieved in less time. In that case, lost man-
hours are minimized. This used to be a major issue, especially because
Greece seemed to be placed in the bottom of quality knowledge level.
On the other hand, the external benefits seem to be more important to
managers. Despite that, Gotzamani and Tsiotras (2002) concluded that a
certified firm gains more internal than external benefits. Meet customers’
expectations, expand in domestic as well as in international markets and
marketing issues, are found almost in every study (Tsiotras and Gotzamani,
1996, Lipovatz et al, 1999, Gotzamani and Tsiotras, 2001, Gotzamani and
Tsiotras, 2002, Vouzas and Gotzamani, 2005, Gotzamani et al, 2006).
Tsiotras and Gotzamani (1996) after the clear segregation between internal
and external benefits, tried to analyze the latter. After the implementation,
customers seem more satisfied as their expectations are fulfilled. This
_____________________________________________________________________
_________________________________________________________________
- 29 -
develops a trust issue for the company’s products and attracts new
customers. Furthermore, suppliers can be evaluated more easily and
properly. All these create a competitive advantage for the certified firm.
Finally, if a company interpret all (or some) of these benefits, realizes
that quality actually matters and a new motive for continuous improvement is
generated (Aggelogiannopoulos et al, 2007). Especially after the ISO
9001:2000 improved version, firms are not only continue to seek for quality
but they move one step further: the TQM implementation (Vouzas and
Gotzamani, 2005).
Doubts/Disadvantages
Three main doubts are found in Greek firms’ case concerning ISO
9000 implementation: the increase of paperwork and bureaucracy (Lipovatz et
al, 1999, Vouzas and Gotzamani, 2005), the decrease in employees’
involvement in procedures (Lipovatz et al, 1999, Vouzas and Gotzamani,
2005), and inevitably costs (Tsiotras and Gotzamani, 1996,
Aggelogiannopoulos et al, 2007).
Increased bureaucracy seems to be the major thorn for companies
implementing ISO series worldwide and by itself is a deterrent factor. This
large amount of paperwork seems to create one further issue: negative
attitude on behalf of employees (Lipovatz et al, 1999). It must be mentioned
that, procedures even though they become standardized, they seem to
become more complex as well. This complexity created doubts among
employees and makes external aid from a consultant vital. According to
Lipovatz et al (1999) the penetration of the consultant in company’s internal
procedures may be important to managers but it seems to be problematic to
employees.
Cost, on the other hand, becomes a disadvantage only for small sized
firms (Tsiotras and Gotzamani, 1996). As mentioned before, in order to
calculate the total cost of implementation, a company must consider four
factors (Aggelogiannopoulos et al, 2007): consultant’s fee, employees’
training costs, lost man-hours, and registration fee.
One secondary doubt that is created is actually the fact that late ISO
adopters are no more benefited as early ones did (Lipovatz et al, 1999,
_____________________________________________________________________
_________________________________________________________________
- 30 -
Gotzamani and Tsiotras, 2001). Early certified firms can actually create a
competitive advantage. As soon as most competitors are certified as well, this
advantage no longer exists.
Finally, it is still under question, whether the ISO implementation
affects firm’s financial performance (Dimara et al, 2004, Tzelepis et al, 2006).
At a quick glance to financial measures, they may seem unaffected after the
certification. However, we must not forget that this issue is positively related to
the type of motives that led the company to the implementation. With the
proper (internal) motives, financial performance can show improvement as
well (Dimara et al, 2004). After all, implementation by itself is not enough for
continuous improvement.
According to Lipovatz et al, (1999), study, the majority of Greek firms
seems to be enthusiastic and tends to keep on the same root. One third of
these firms have plans for TQM, portion that comes up to 50 per cent when it
refers to multinational enterprises. The bottom line is that in the last years,
Greek companies seem to identify ISO 9000 as quality awareness factor and
not as a marketing tool. This is quite promising and they seem to focus on the
right direction.
_____________________________________________________________________
_________________________________________________________________
- 31 -
CHAPTER 2: Research Model
2.1 Methodology design
Almost two decades ago, ISO series as well as quality management
systems were unknown territory, especially in countries like Greece. However,
after the managers being skeptical in the 1990s, the entrance in the new
millennium forced a large number of companies of any size, to implement ISO
9000 series as a proof of their quality awareness. The growing number of
certifications was the sparkle to increase the number of the studies about this
subject and its implications in parallel.
Sampaio et al (2009), in their recent survey, conducted a review on
older studies concerning ISO implications on firm’s performance. An
enormous amount of papers in literature, up to 70 per cent, are surveys based
on primary data. These primary data derived mostly from questionnaires
mailed or personal interviews. These findings are considered doubtful by
many people as they are referring mostly to intangible matters, such as
production efficiency or quality awareness. On the contrary, a smaller portion,
up to 17.5 per cent of the studies, was analysis of financial indicators. They
were based on secondary data, like stock prices before and after the ISO
implementation announcement, return on assets (ROA), and sales growth.
These findings on their majority were standing in neutral position as far as the
impact of implication on overall financial performance (Dick, 2000, Heras et al,
2002, van der Wiele, 2005). The rest of the papers were either case studies
(up to 7 per cent) or literature reviews (5.5 per cent).
This dissertation follows the path of the majority. A formed
questionnaire is the instrument that allows the measure of the impact of ISO
implementation on Greek firms’ performance. The literature with only a few
exceptions, aggress that certified firms gain benefits. Thus, it had to be
examined whether these benefits are real and measurable in Greek industries
as well. Furthermore, another aspect that was examined is the difference
between the internal benefits and the external ones, with the latter to be less
or even not existing at all. One other aspect that was examined is the relation
_____________________________________________________________________
_________________________________________________________________
- 32 -
between the motives of certification and the benefits that a company can gain.
Once more, it was concluded that internal motives are those that lead to
benefits and not the external pressures from customers.
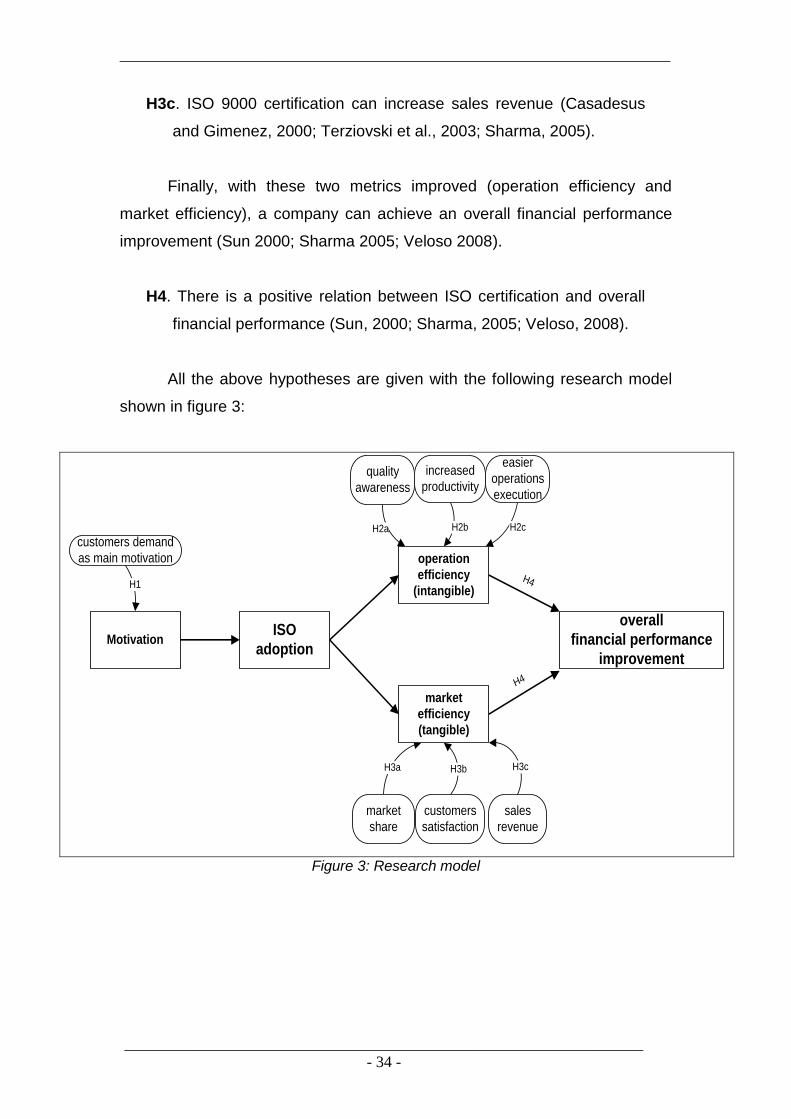
2.2 Research model – Hypotheses
As mentioned before, there is a strong relationship between motives
that lead to implementation and the benefits that derive from it (Biazzo and
Bernardi, 2003, Sampaio et al, 2009). Furthermore, many firms indicate
customers’ demand as main motivation, especially in small sized firms
(McTeer and Dale, 1994, Carr et al, 1997, Terziovski et al, 1997, Brown et al,
1998, Whithers and Ebrahimpour, 2000, Sun and Cheng, 2002, Boiral, 2003,
Chow-Chua et al, 2003, Stalhane, 2006). Given that, the first important factor
that must be investigated is the motivation aspect.
H1. There is a strong relationship between customer’s demand and
obtaining ISO 9000 certification by a firm (McTeer and Dale,
1994).
The benefits of implementation can be categorized into two main
groups: operation efficiency improvement and market efficiency improvement.
The first one is considered to be more intangible while the latter is tangible.
Most common benefits, and more ideal, are those on operation efficiency
(McTeer and Dale, 1994, Krause, 1996, Brown et al, 1998, Curkovic and
Pagell, 1999, Casadesus and Gimenez, 2000, Whithers and Ebrahimpour,
2000, Stevenson and Barnes, 2001, Biazzo and Bernardi, 2003, Boiral, 2003,
Douglas et al, 2003, Terziovski et al, 2003, McGuire and Dilts, 2008). This
improvement can be identified in many directions. Firms after the
implementation can create quality awareness (Terziovski et al. 2003; Sharma
2005), they can increase productivity by standardization of procedures and
minimization of errors (Chua et al. 2003; Terziovski et al. 2003; Sharma
2005), and given that, operations can be executed easier (Terziovski et al.
2003; Sharma 2005).
_____________________________________________________________________
_________________________________________________________________
- 33 -
H2. A firm can improve operation efficiency, and therefore, gain
intangible benefits:
H2a. ISO 9000 certification can create quality awareness (Terziovski
et al., 2003; Sharma, 2005).
H2b. ISO 9000 certification can increase productivity (Chua et al.,
2003; Terziovski et al., 2003; Sharma, 2005).
H2c. With ISO 9000 adoption, operations can be executed easier
(Terziovski et al., 2003; Sharma, 2005).
Similarly, benefits can be gained as market efficiency improvement.
With ISO certification as a powerful market tool, a company can demonstrate
its quality awareness. Customers are reassured that all products and services
are executed with the same certified procedures. Thus, ISO 9000 certification
can improve customer satisfaction (Casadesus and Gimenez 2000; Terziovski
et al. 2003; Sharma 2005), consequently can enlarge market share
(Casadesus and Gimenez 2000; Chua et al. 2003; Terziovski et al. 2003;
Sharma 2005) and eventually can increase sales revenue (Casadesus and
Gimenez 2000; Terziovski et al. 2003; Sharma 2005).
H3. A firm can achieve market efficiency improvement after ISO 9000
adoption:
H3a. ISO 9000 certification enlarges the market share of a company
(Casadesus and Gimenez, 2000; Chua et al., 2003; Terziovski et
al., 2003; Sharma, 2005).
H3b. ISO 9000 certification can improve customers’ satisfaction
(Casadesus and Gimenez, 2000; Terziovski et al., 2003; Sharma,
2005).
_____________________________________________________________________
_________________________________________________________________
- 34 -
H3c. ISO 9000 certification can increase sales revenue (Casadesus
and Gimenez, 2000; Terziovski et al., 2003; Sharma, 2005).
Finally, with these two metrics improved (operation efficiency and
market efficiency), a company can achieve an overall financial performance
improvement (Sun 2000; Sharma 2005; Veloso 2008).
H4. There is a positive relation between ISO certification and overall
financial performance (Sun, 2000; Sharma, 2005; Veloso, 2008).
All the above hypotheses are given with the following research model
shown in figure 3:
H2c
easier
operations
execution
H2b
increased
productivity
H3a H3cH3b
H2a
H1
ISO
adoption
customers demand
as main motivation
quality
awareness
customers
satisfaction
market
share
sales
revenue
Motivation
operation
efficiency
(intangible)
market
efficiency
(tangible)
overall
financial performance
improvement
H4
H4
Figure 3: Research model

_____________________________________________________________________
_________________________________________________________________
- 35 -
2.3 Research methodology
According to Rungtusanatham et al, (2003), the most common type of
survey methodology is the forming of a questionnaire. These types of surveys
have increased after the 1980s, especially those that refer to quality
management as an area of the operations management field. The formed
questionnaire was sent by e-mail to 423 companies which formed the sample.
The questionnaire, originally in English, had to be translated to Greek, in order
to apply with the needs of the survey, as it was concerning Greek firms. It was
e-mailed to the attention of the quality manager, if applicable. Otherwise,
anyone who was in charge of quality for the company should be appropriate
to answer. There were few cases, especially for small sized firms, where there
was no official quality manager, and thus the questionnaire was sent to the
managing director or another person who was appropriate to answer. With the
attachment file, the e-mail included a brief introduction explaining the content
and purpose of the questionnaire. Furthermore, in the beginning of the
questionnaire, there were instructions for its completion, and there were also
a clarification of the anonymity of the participants. Finally, it was also
mentioned that a copy of the results would be sent back to them as feedback,
in order to help them assess the ISO contribution to a firm’s performance. All
of them are presented in Appendix A.
In the begging of the research, certified companies in Greece had to be
found. After a thorough search, it was clear that no official database with all
certified companies existed. Given that, information had to come up from
some certification agencies. After a few meetings with an ISO consultant, six
large ISO consult firms seem to form almost the 100 per cent of the market.
These firms are: Greek Organization of Standardization (ELOT), Eurocert,
TUVRheinland, TUVHellas, DSQHellas and Bureauveritas. All six were mailed
and asked to provide information about which Greek firms are ISO 9000
certified. Unfortunately, no respond came back. Therefore, the only
information retrieved, came up from their web pages. Two of them, ELOT and
Bureauveritas did not provide any lists of certified companies in their web
pages. Therefore, only the other four, Eurocert, TUVRheinland, TUVHellas,
and DSQHellas offered this kind of information in the form of indicative, rather
_____________________________________________________________________
_________________________________________________________________
- 36 -
than complete, lists. All four of them are conducting certifications not only in
Greece but also in Balkans.
From the information retrieved from these web pages, a list of almost
1000 certified companied was formed. The next step was to search the
internet for the official page of every certified company, in order to obtain their
e-mail address or any other way of contact. This step was actually very time-
consuming and frustrating. Many companies, mostly small sized, have not
created an official web page until now. Others seem to lack of information in
the ways of contacting them. Out of the 1000 indicative certified firms, it was
managed to retrieve information and contacts for 423 firms. To be more
specific, 198 firms came from Eurocert, 91 firms came from TUVHellas, 28
firms came from TUVRheinland and 106 firms came from DQSHellas.
At this point two problems emerged: firstly, the lists of certified
companies were not divided into sectors and secondly, the number of
declared certified companies seemed to decrease enormously. Therefore, the
decision was inevitable: certified companies should be mailed and asked to
participate in the survey, without being grouped into sectors. In other words,
the sample of this research had to be totally random. It must be mentioned
though, that the greater portion of the mailed companies belongs to the
manufacturing sector and only a minority of them, to the service sector.
Finally, the total sample of 423 companies was e-mailed. Out of the
423 mailed questionnaires, only 34 of them responded. Fortunately, all
returned questionnaires were valid, and this is interpreted of a response rate
of 8 per cent. Unfortunately, it is apparent that Greek firms are not familiar in
questionnaire completion. Due to this companies’ culture on participation in
surveys, the response rate was obviously very low. On the contrary, it was
partly expected as for this kind of research, a response rate of 15 per cent is
very common (Singels et al, 2001). Firms, before answering any
questionnaire face a dilemma. On the one hand, they are being skeptical as
far as their anonymity. They fear that precious information about their
company will come out in the open. On the contrary, they seem to be no
longer interested in surveys that have been conducted almost daily, from all
over the world.
_____________________________________________________________________
_________________________________________________________________
- 37 -
Of the companies responded, only 4 were very small sized (up to 10
employees), 10 were small sized (10 to 50 employees), 14 were medium
sized (50 to 250 employees), and 6 could be classified as large companies
(over 250 employees).
Furthermore, a few meetings with Dr Stylianos Lamprakopoulos, an
ISO-consultant based in Athens, were arranged, to sum up more information,
especially from someone who is in the area for many years. His help was
crucial in many ways: in forming the questionnaire (validity test) and in
gathering information as well.
A good questionnaire must have three vital characteristics: reliability,
validity and be sharply-defined. Furthermore, it is usually appropriate to be
easy-to-fill, as many of them arrive to the firms daily. Given that, most of the
questions were closed-ended, with frequent use of Likert-scale, one to five
answers.
The structure of the questionnaire was created based on previous
researches found in published articles. It consists of 5 general questions plus
34 main items which cover 9 variables. The 34 questions were supposed to
cover all aspects of performance improvement both tangible and intangible.
Furthermore, there is one variable in order to examine the customers’ demand
as main motivation for implementation. Questions 5, 8, 9, 10, 12, 18 and 20
are from Carr et al (1997). Questions 1, 2, 3, 4, 7, 11, 14, 17, 21, 25, 26 are
from Martinez-Costa et al (2008). Questions 6, 16, 19, 22, 23, 24, 30, 31 are
from Powell (1995). Questions 13, 26, 27, 28, 29 are from Stahlane (2006),
and finally question 15 is from Terziovski et al (1997). Appendix A includes a
copy of the questionnaire.
The questionnaire consists of two sections. Section A, refers to general
information about the company and the respondent. There are five questions
about the number of firm’s employees, the sector of the firm, the percentage
of its sales domestically and internationally, the kind and the year of the
certification and finally the position of the respondent in the company.
Section B, consists of 34 questions to be answered in Likert-type scale
from 1 to 5. The first variable concerns ISO adoption and it is examined by
four questions (1 – not important up to 5 – much more important). The next 30
questions are referring to motivation of ISO adoption and operation and
_____________________________________________________________________
_________________________________________________________________
- 38 -
market efficiency measurement as well as the overall performance
improvement (1 – completely disagree, 5 – completely agree). The other 8
variables examined are the following:
- Motivation for ISO adoption. It is clearly stated by the literature that
customers’ demand is considered as the main motivation (McTeer and
Dale, 1994, Carr et al, 1997, Terziovski et al, 1997, Brown et al, 1998,
Whithers and Ebrahimpour, 2000, Sun and Cheng, 2002, Boiral, 2003,
Chow-Chua et al, 2003, Stalhane, 2006).
- Quality awareness (McTeer and Dale, 1994, Krause, 1996, Terziovski
et al, 1997, Brown et al, 1998, Curkovic and Pagell, 1999, Whithers
and Ebrahimpour, 2000, Stevenson and Barnes, 2001, Zaramdini,
2007, Douglas et al, 2003, Terziovski et al, 2003, McGuire and Dilts,
2008).
- Productivity (McTeer and Dale, 1994, Terziovski et al, 1997, Brown et
al, 1998, Casadesus and Gimenez, 2000, Stevenson and Barnes,
2001, Biazzo and Bernardi, 2003, Boiral, 2003, Douglas et al, 2003,
Terziovski et al, 2003, McGuire and Dilts, 2008).
- Operations execution (Whithers and Ebrahimpour, 2000, Stevenson
and Barnes, 2001, Douglas et al, 2003).
- Market share (Brown et al, 1998, Terziovski et al, 2003, McGuire and
Dilts, 2008).
- Customers’ satisfaction (Terziovski et al, 1997, Brown et al, 1998,
Casadesus et al, 2001, Stevenson and Barnes, 2001, Biazzo and
Bernardi, 2003, Boiral, 2003).
- Sales revenue (McTeer and Dale, 1994).
- Overall financial performance (Douglas et al, 2003).

_____________________________________________________________________
_________________________________________________________________
- 39 -
In order to assess the data retrieved and to test the hypotheses, the
software SPSS (Statistical Package for Social Sciences) version 16 was used
for descriptive statistical analysis. Furthermore, for the hypotheses testing,
AMOS software was used.
The low response rate of the questionnaire created a difficulty to come
up with solid conclusions. In order for the survey to be enhanced, a decision
of conducting interviews was taken.
To fulfill this purpose, a certified company from the food industry sector
(KREKA) was chosen. This company was not chosen randomly, but for
specific reasons. Firstly, it is a medium sized company with 103 employees
and with sales of 24.2 million euros in 2008. This is an important factor
because ISO certification cannot alter the financial results by itself, as it
seems to happen with small sized companies. Secondly, quality aspects
seem to be vital for the firm’s managers. KREKA as a part of its quality policy,
demonstrates many certifications: ISO 9001:2000, the system HACCP (since
2001), and ISO 22000:2005. All these guarantee the quality of the whole
production process and the safety of the products. Finally, the firm is listed in
Athens Stock Exchange since 1991. Therefore, firm’s managers have a clear
view in their company’s results, long before the ISO certification and they can
compare them with the recent results as an effect of the quality adoption.
The interviews took place in their head offices. Ten interviews were
conducted, including the CFO, the internal inspector, the quality manager, the
sales manager, the production financial manager and five employees from the
sales department as well as the supplies department. A structured
questionnaire was used consisted of two parts. The first part included
questions for the managers, while the second part consisted of questions for
the employees. Both two parts of the questionnaire are presented in Appendix
B.
This second questionnaire was also, based on the results of previous
researches and previous published articles. To be more specific, in section A,
questions 1 up to 8 were taken from Buttle (2001), questions 9 to 11 were
taken from Sharma (2005), question 12 from Benner and Veloso (2008) and
question 13 from Terlaak and King (2006). Finally, all 10 questions consisting
section B, were taken from Powell (1995).
_____________________________________________________________________
_________________________________________________________________
- 40 -
The interviews were aiming at two targets. Firstly, the interviewed
managers were asked to comment about the impact of the ISO certification on
overall firm’s financial performance. Secondly, the employees were asked to
comment about whether after the certification the processes became more
accurate, with fewer errors and thus, more easier to complete.
_____________________________________________________________________
_________________________________________________________________
- 41 -
CHAPTER 3: Results & Discussion
3.1 Data Analysis – Results
As mentioned before, the sample of this research was random and
thus, companies from all sectors were included. This means, that especially in
very small-sized companies a quality manager might not exist. However, out
of the total of 34 companies of the sample, in 18 of them the quality manager
was the one who answered the questionnaire (a rate of 52,9 per cent). In 5
more cases (14,7 per cent), a member of the quality department was the most
appropriate person to respond. In 4 more cases it was the general manager
who answered (11,8 per cent) while only in 2 cases it was the production
manager (5,9 per cent). Finally, in 5 cases, some other person was
responsible to answer (the manager of design department, the manager of
research and development department, the IT manager, the owner, and a
sales employee).
Considering the randomness of the sample, the dispersion of the
companies’ size was expected. There were all types of companies’ as far as
their sizes are concerned responding to the survey.
Focusing on the type of the certification, the findings were what it was
expected. Only one company was certified with the ISO 9002:1994 type, while
all the rest were certified with the ISO 9001:2000 standard. Additionally, the
year of the certification differs. 8,8 per cent of the companies were certified in
the year 2000, all of them renewing the previous 1994 version standard. Few
of them were certified in 2004 and 2005 (5,9 and 2,9 per cent, respectively).
Finally, the majority of 23,5 per cent was certified in 2006.
3.1.1 Validity and Reliability
The reliability of scales was evaluated using the Cronbach’s
alpha. Furthermore, for the factor analysis, the Kaiser-Meyer-Olkin (KMO)
measure and the Bartlett’s Test of Sphericity were used. According to Hair et
al (1995), these numbers can measure construct validity. In addition, the Total

_____________________________________________________________________
_________________________________________________________________
- 42 -
Variance Explained (TVE) score was used to measure the cumulative
percentage of the variance that is explained by all factors.
The mailed questionnaire consisted of 34 questions, which examined 9
aspects. Cronbach’s alpha, which measures the reliability of different
variables and the reliability of the factors, should be greater (or equal at least)
to 0.6, which is widely accepted as it indicates minimum chance of random
errors existence (Nunnally and Bernstein, 1994). The factor analysis
performed is demonstrated in Appendix C.
The 9 factors examined are: ISO adoption (A), customers’ demand (B),
quality awareness (C1), increased productivity (C2), operations execution
(C3), market share (D1), customers’ satisfaction (D2), sales revenue (D3),
and overall financial performance improvement (E). The Cronbach’s alpha for
each factor was respectively: (0.682), (0.571), (0.807), (0.880), (0.753),
(0.919), (0.584), (0.762), and (0.866). Only two factors are below 0,600:
Customers’ demand (B) and customers’ satisfaction (D2) are close to 0,600 at
(0,571) and (0,584) respectively. All the above results are demonstrated in
table 3 and prove their reliability.
Aspects Cronbach’s alpha
ISO adoption (A) 0.682
Customers’ demand (B) 0.571
Quality awareness (C1) 0.807
Productivity (C2) 0.880
Operations execution (C3) 0.753
Market share (D1) 0.919
Customers’ satisfaction (D2) 0.584
Sales revenue (D3) 0.762
Overall financial performance improvement (E) 0.866
Table 3: The consistency of all aspects due to their Cronbach’s alpha
Furthermore, as Hair et al (1995) indicates, KMO should be above the
0,500 threshold, while the TVE score above 0,500. As table 4 demonstrates,
all numbers are higher than the acceptable levels except for two factors: ISO
adoption (A) and motivation (B) with a KMO 0,500 which is normal since these

_____________________________________________________________________
_________________________________________________________________
- 43 -
factors are consisted of two variables only. In addition, the factor loadings are
in acceptable levels as well. It must be mentioned though, that 3 out of 34
aspects were dropped: these were A3, A4 and B1.
At this point, it must be stated that factor “quality awareness (C1)” had
to be split in two sub-factors: items C.1.1, C.1.2 and C.1.3 were separated
from items C.1.4 and C.1.5. This was due to the fact that item C.1.4 seem to
have no direct relation to C1 factor, while the two items (C.1.4 and C.1.5)
were related with each other.
1 2 3 4 5 Statistics Mean Std. Dev.
Loadings
ISO adoption
A1 A2 A3 A4
0,0 3,0 6,1 9,1
3,0 9,1 9,1
21,2
9,1 42,4 33,3 36,4
48,5 45,5 36,4 21,2
39,4 0,0
15,2 12,1
K.M.O.=0,500 Bartlett’s Sig=0,002 (TVE)=75,867 Cronbach’s (a)=0,682
4,24 3,30 3,45 3,06
0,751 0,770 1,063 1,144
0,871 0,871
dropped dropped
Motivation
B1 B2 B3
3,0 0,0
18,2
3,0 0,0
27,3
3,0 18,2 15,2
30,3 42,4 24,2
60,6 39,4 15,2
K.M.O.=0,500 Bartlett’s Sig=0,005 (TVE)=73,972 Cronbach’s (a)=0,571
4,42 4,21 2,91
0,936 0,740 1,378
dropped 0,860 0,860
Quality awareness
C.1.1 C.1.2 C.1.3
0,0 0,0 0,0
0,0 0,0 3,0
9,1 9,1 6,1
27,3 45,5 39,4
63,6 45,5 51,5
K.M.O.=0,690 Bartlett’s Sig=0,000 (TVE)=79,460 Cronbach’s (a)=0,807
4,55 4,36 4,39
0,666 0,653 0,747
0,861 0,808 0,819
C.1.4 C.1.5
0,0 0,0
3,0 3,1
12,1 37,5
69,7 43,8
15,2 15,6
Cronbach’s (a)=0,854 3,97 3,72
0,637 0,772
0,953 0,858
Productivity
C.2.1 C.2.2 C.2.3 C.2.4 C.2.5
0,0 2,9 0,0 0,0 3,0
11,8 8,8 8,8
11,8 9,1
20,6 55,9 52,9 52,9 57,6
61,8 23,5 26,5 29,4 27,3
5,8 8,8
11,8 5,9 3,0
K.M.O.=0,803 Bartlett’s Sig=0,000 (TVE)=68,066 Cronbach’s (a)=0,880
3,60 3,26 3,41 3,29 3,18
0,757 0,864 0,821 0,760 0,769
0,867 0,782 0,822 0,872 0,778
Operations execution
C.3.1 C.3.2 C.3.3 C.3.4
18,2 2,9 2,9 5,9
36,4 17,6 11,8 8,8
33,3 58,8 41,2 47,1
12,1 20,6 41,2 32,4
0,0 0,0 2,9 5,9
K.M.O.=0,611 Bartlett’s Sig=0,000 (TVE)=59,634 Cronbach’s (a)=0,753
2,39 2,97 3,29 3,24
0,933 0,717 0,836 0,923
0,659 0,821 0,915 0,663
Market share
D.1.1 D.1.2 D.1.3 D.1.4
5,9 5,9 5,9 0,0
8,8 11,8 17,6 12,1
41,2 47,7 44,1 36,4
38,2 32,4 29,4 33,3
5,9 2,9 2,9
18,2
K.M.O.=0,739 Bartlett’s Sig=0,000 (TVE)=80,606 Cronbach’s (a)=0,919
3,29 3,15 3,06 3,58
0,938 0,892 0,919 0,936
0,917 0,914 0,931 0,825
Customer’s satisfaction
D.2.1 D.2.2 D.2.3
0,0 0,0 2,9
2,9 5,9 8,8
17,6 38,2 38,2
61,8 44,1 41,2
17,6 11,8 8,8
K.M.O.=0,532 Bartlett’s Sig=0,004 (TVE)=56,248 Cronbach’s (a)=0,584
3,94 3,62 3,44
0,694 0,779 0,894
0,772 0,867 0,583
Sales revenue
D.3.1 D.3.2 D.3.3
0,0 0,0 3,1
9,1 18,2 12,5
24,2 42,4 46,9
51,5 33,3 34,4
15,2 6,1 3,1
K.M.O.=0,587 Bartlett’s Sig=0,000 (TVE)=68,957 Cronbach’s (a)=0,762
3,73 3,27 3,22
0,839 0,839 0,832
0,624 0,919 0,914
Overall financial
performance improvement
E1 E2 E3
9,1 9,1 0,0
24,2 30,3 9,1
42,4 27,3 36,4
24,2 33,3 42,4
0,0 0,0
12,1
K.M.O.=0,607 Bartlett’s Sig=0,000 (TVE)=78,867 Cronbach’s (a)=0,866
2,82 2,85 3,58
0,917 1,004 0,830
0,914 0,956 0,785
Table 4: Factor and reliability analysis
The statistical analysis shows that factor “ISO adoption” consists of
only two items, A1 and A2 with mean scores 4,24 and 3,30 respectively. As
mentioned before, the other two items had to be removed. Factor “motivation”,
finally, consisted from items B2 and B3, while B1 was removed. Factor’s
_____________________________________________________________________
_________________________________________________________________
- 44 -
“quality awareness” items were split in two: C.1.1, C.1.2 and C.1.3 items with
significantly high mean scores (4,55 – 4,36 – 4,39, respectively) and C.1.4
and C.1.5 items with lower mean scores (3,97 and 3,72). Factor “productivity”
consists of 5 items with mean scores between 3 and 4. Factor “operations
execution” consists of 4 items with the first two showing mean scores below 3
and the latter two with mean scores between 3 and 4. Factors “market share”
(constructed from 4 items), “customer’s satisfaction” (constructed from 3
items) and “sales revenue” (constructed from 3 items) are achieving mean
scores between 3 and 4. Finally, factor “overall financial performance
improvement” which is consisted from 3 items, demonstrates no significant
positive perception be the respondents, as the two out of three items’ mean
scores are lower than 3.
In order to interpret these results, it must be stated that the most
important factor seems to be the quality awareness, which is created after the
certification. Respondents’ answers proved that this is probably the most
important and common benefit of the implementation. On the contrary, issues
like easier operations execution or overall financial performance improvement
are showing no significant change.
One other aspect of major importance is the fact that customers’
demand as main motivation for ISO certification seem to be of minor
importance. Items B1 to B3 examine this actual aspect: the first two (B1 and
B2) with mean scores a lot higher than 4 demonstrate that companies
consider quality as of major importance, while item B3 with mean score of
2,91, enhances this conclusion (respondents were negative to the fact that
was customers’ pressure that forced them to seek quality certification).
Finally, most of the items with their mean scores slightly over 3,
indicate that beside quality awareness, companies are actually neutral about
the fact that many other aspects are remarkably improved.
3.1.2 Structural Model Fit
At this point, our model (figure 3) had to be tested, in order to accept or
reject the formed hypotheses. This procedure was made with the use of the
Structural Equation Modelling approach. For the evaluation, five measures
were interpreted: chi-square/degree of freedom (x2/df), goodness-of-fit index

_____________________________________________________________________
_________________________________________________________________
- 45 -
(GFI), comparative fit index (CFI), normed fit index (NFI), and root mean
square residual (RMR). For this reason, the AMOS software package was
used to come up with the results. All these are shown at figures 4, 5, and 6.
Firstly, operation efficiency factor measures are indicated in figure 4. It
is clearly shown that, increased productivity is strongly related to operation
efficiency (0,89) while the other two items, quality awareness (0,58) and
easier operations execution (0,48) are at acceptable levels.
However, considering the market efficiency factor as demonstrated in
figure 5, the findings are quite interesting. Market efficiency is relatively
related to market share (0,38), while customers’ satisfaction is also related to
market efficiency (0,52). On the contrary, there is no relation between sales
revenue and market efficiency.
Furthermore, as far as figure 6 is concerned, overall financial
performance seems related to all three factors measured. Especially, is
seems to be strongly related to sales increase (0,87) and to company’s
general performance (0,60), which is something to be quite normal.
Finally, in figure 7, the overall model is demonstrated. The findings are
also very interesting. Customers’ demand and main motivation are negatively
related (-0,26). This was actually expected. As demonstrated in table 4, and
after taking the questionnaire under consideration, the last two items of “ISO
adoption” factor have been dropped out. The first two items that have
remained, demonstrate that quality aspects were under priority for the
companies’ managers. Thus, customers’ demand was not an issue. On the
contrary, ISO adoption is slightly related to sales revenue (0,24).
The most important finding is the fact that there is no direct relation
between operation efficiency and overall financial performance improvement.
The only direct relation is between market efficiency and overall financial
performance. However, it seems to be an indirect relation between operation
efficiency and overall performance. To be more specific, increased
productivity has an indirect relation to overall performance through sales
revenue (0,62x0,41=0,25) and also, through market share (0,33x0,59=0,19).
Finally, an indirect relation exist also between easier operation execution and
overall performance through market share (0,47x0,59=0,28).
_____________________________________________________________________
_________________________________________________________________
- 46 -
Quality awareness and increased productivity are strongly related to
each other (0,67). Furthermore, increased productivity is strongly related to
sales revenue (0,62) and slightly related to market share (0,33). Another vital
finding is that there is no relation between customers’ satisfaction and overall
financial performance improvement. Thus, only market share and sales
revenue are related to overall financial performance improvement at (0,41)
and (0,59) respectively. This result is normal since we are measuring financial
performance and overall performance. Obviously, customer satisfaction has
an impact on market share and sales revenue.
Furthermore, table 5 demonstrates the statistics concerning structural
equation models. As Harrison and Rainer (1996) state, the acceptable levels
of the CMIN/DF score are below 5. Thus, the score of 1,568 concerning the
overall model is more than acceptable. Furthermore, the GFI score has to be
above 0,90 (Bollen and Long, 1993), while the CFI score has to be at the
same levels also (Smith and McMillian, 2001). Only, the overall model scores
GFI at 0,836 and CFI at 0,885, but they are still acceptable. Finally, RMR
scores must be below 0,1 (Bollen, 1989), thus all 3 numbers are acceptable.
To sum up, from the initial four hypotheses, hypothesis 1 (H1) referring
to customers’ demand as main motivation is rejected. This is due to the fact
that the majority of the companies were seeking for quality long before their
certification. Thus, external pressures were not significant, at least not
significant enough as the internal motives. Hypotheses 2 (H2), which
consisted from 3 parts is accepted. ISO 9000 can create quality awareness,
increase productivity and make operations easier to execute. Hypothesis 3
(H3) was partly accepted. ISO 9000 adoption can increase market share
(H3a) and improve customers’ satisfaction (H3b). However, the hypothesis
H3c, that ISO 9000 certification can increase sales revenue is rejected.
Finally, hypothesis 4 (H4) was partly accepted, as there is positive relation
between ISO certification and overall financial performance, but only if market
efficiency is concerned and not operation efficiency.

_____________________________________________________________________
_________________________________________________________________
- 47 -
,34
,89
,48
,58
,00
,23
,79
C1
C3
C2 C
ER1
ER4
ER3
ER2
Figure 4: Operation efficiency
,38
,52
,14
,27 ,00
D1
D2 D.
ER1
ER2
ER4
Figure 5: Market efficiency
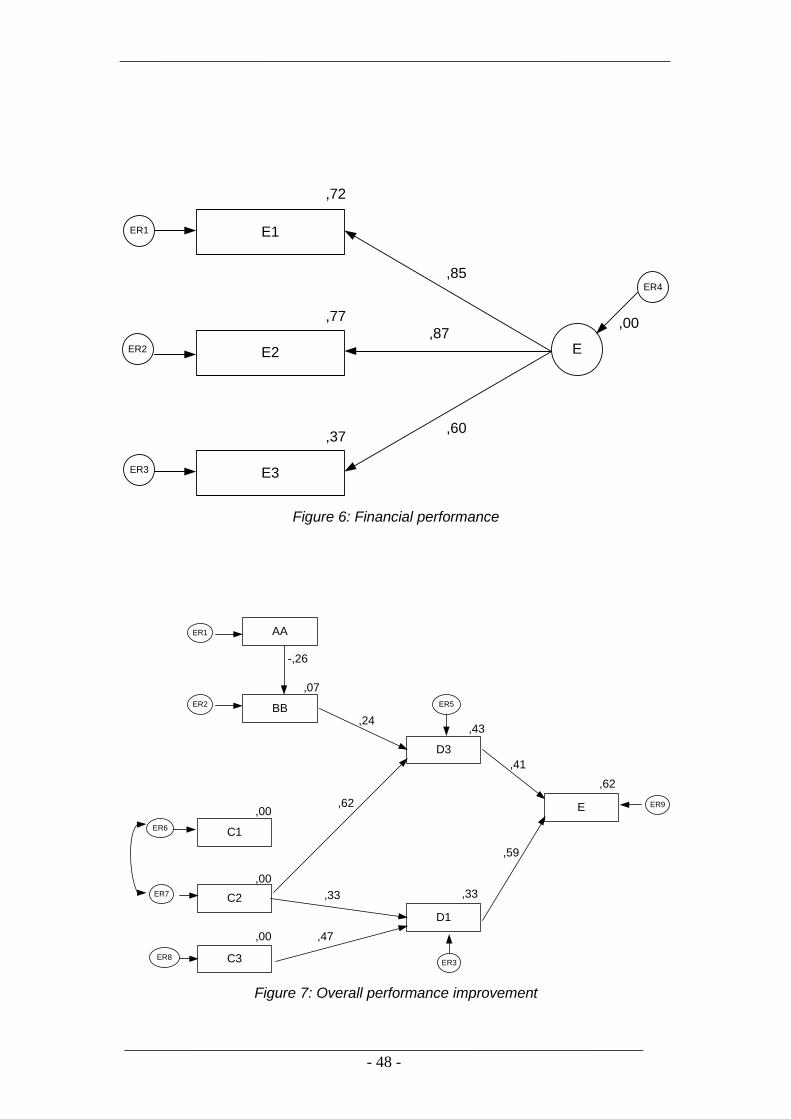
_____________________________________________________________________
_________________________________________________________________
- 48 -
,72
,87
,60
,85
,00
,37
,77
E1
E3
E2 E
ER1
ER4
ER3
ER2
Figure 6: Financial performance
,00
,00
,00
,33
,43
,62
,24
,62
,33
,47
,41
,59
,07
-,26
AA
BB
C1
C2
C3
D3
D1
E
ER1
ER2
ER6
ER7
ER8
ER5
ER3
ER9
Figure 7: Overall performance improvement

_____________________________________________________________________
_________________________________________________________________
- 49 -
CMIN/DF GFI CFI RMR
Operation efficiency
2,572 ,938 ,917 ,092
Market efficiency
3,108 ,877 ,919 ,085
Financial performance
2,755 ,895 ,916 ,091
Overall financial performance improvement
1,568 ,836 ,885 ,073
Table 5: Structural equation models
3.2 Further Discussion
Although the response rate of the questionnaire was low, the findings
were confirmed and enhanced by the interviews. The collection of more
specific answers of the case study was very helpful.
To begin with, the main motivations for the firm to pursue ISO
certification were the same as those found in literature. As the CFO of the
company states:
Our company was seeking for certification in order to achieve five
main targets. Firstly, we were seeking for competitive advantage.
Secondly, we wanted to certify publicly our quality levels. Third was
the possible reputation that we would gain. Fourth, it was our need
for procedures improvement in sections such as supplies,
production, and sales. Finally, after all, we were expecting for our
sales to increase. It must be mentioned though, that these targets
are not ranked.
However, it is obvious that ISO certification alters some procedures
and thus, it creates some problems. These problems can be divided into two
categories: difficulties which are experienced during the implementation
process and difficulties which are experienced following the certification.
According to the quality manager of the company:
_____________________________________________________________________
_________________________________________________________________
- 50 -
Mostly, our difficulties were experienced during the implementation
process. Firstly, we had to understand how the new system works,
and comply with all the new procedures. In addition to that, the staff
training was an issue, which was partly solved with the outside help
from a consultant. On the contrary, whatever operational problems
that arose after the implementation, were easily solved.
As far as the benefits from the ISO certification are concerned, they
seem to be more intangible and they have an impact on internal procedures.
The CFO of the company clearly indicates:
The benefits derived from the implementation were almost equal to
our targets. Quality assurance was the most significant aspect.
Furthermore, company’s organizational issues were improved as
well. Our reputation increased also, and thus, an improvement on
the public image of the company was the inevitable.
At this point, it must be mentioned that probably the main target for
every company that proceeds with the ISO implementation is to increase
sales and improve overall financial performance. Therefore, even though
many benefits are achieved with the certification, managers seem to be
sceptical. As the CFO clearly states:
Although many benefits were achieved with the ISO certification,
and certification seems to meet expectations, we must admit that
we are satisfied only in an average degree.
Although the certification’s main impact is on organizational procedures,
there are still some disappointments concerning this aspect. The production
financial manager of the company makes specific claims:
On the one hand, we must agree that the level of satisfaction with
ISO 9000 series’ organizational impact have reached maximum
level. Certification offers significant help in organizational issues.
_____________________________________________________________________
_________________________________________________________________
- 51 -
However, it does not contribute in product quality improvement.
Thus, the company moved on to other certifications such as ISO
22000:2005 and quality certification for AGROCERT.
Another aspect of great importance is cost. The total cost of the
implementation is not negligible, as it includes consultants’ fee, certification
fee and of course, lost man-hours. However, cost is an issue only for small-
sized companies. On the contrary, large-sized companies are more focused
on quality aspects as main philosophy and quality certifications seem to be
obligatory even though the impact on sales is minimum:
The time that was needed to recover the costs of certification was
not significant. Especially if someone will consider the benefits
(which are not financial but mostly in organizational level) then the
recovering time was almost near to zero (CFO).
As far as the impact on financial aspects of the company, after the
implementation, we must be accurate to state that there was no
improvement on firm’s financial efficiency (e.g. on its profit margin),
nor on firm’s sales growth. Furthermore, if someone studies the
financial numbers of the company, such as earnings per share, he
can conclude that there were no improvements on firm’s overall
financial performance (sales manager).
Many times, the benefits of the certification are being questionable
considering the time of implementation (early or late adopters) and the
existence of non-certified firms. The CFO of the company tried to shed light
on these two aspects:
I completely disagree with the opinion that ISO certification in our
sector benefit early adopters more than the late ones. The
company’s first certification was in 2000 which makes us early
adopters. However, at that time, customers were not aware of the
significance of such certifications, especially in Greece.

_____________________________________________________________________
_________________________________________________________________
- 52 -
Nowadays, certification can actually create a competitive
advantage instead of non-certified firms, but only if it is combined
with other systems’ certifications such as ISO 22000, ISO 14001,
and AGRO.
There seem to be two points of view on the ISO certification’s impact on
procedures. After examining the managers’ point of view, one must consider
the employees’ point of view as well. Procedures are being altered after the
implementation and paperwork seems to increase at undesirable levels.
Certification is supposed to solve many problems and make procedures
easier and with fewer mistakes. Is this real or is just a myth? Five employees
are trying to introduce their opinions:
ISO 9000 certification has slightly increased the employee
involvement in design and planning. Additionally, there was no
significant change in our autonomy in decision-making. One major
change was on offering a more active employee suggestion system
(employee A).
ISO certification made employee interaction with customers and
suppliers to increase in a very large level. We became more active
in those relationships (employee B).
After the implementation, cycle times in all our procedures were not
reduced significantly. This includes all departments and it refers to
new products, service development and overall product delivery
times as well (employee C).
One major change in our jobs after the implementation was for
certain the increase on paperwork. The ISO 9000 series demand
proof of all procedures and works, and this means more papers
and files to be delivered. However, this is an instrument to find
wasted time and costs in all internal processes and it is achieved
through internal revisions and re-examinations by the managers. In
simple terms, ISO 9000 is a program that might create methods to
measure and monitor quality, but to be more specific we must

_____________________________________________________________________
_________________________________________________________________
- 53 -
mention the contribution of the ISO 22000 on these aspects
(employee D).
One of the benefits of the ISO 9000 implementation is that it helped
the training of new employees more easily. An automated training
program is applied, and this reduces time and the effort in training
(employee E).
_____________________________________________________________________
_________________________________________________________________
- 54 -
CHAPTER 4:
Conclusions & Limitations
4.1 Conclusions
ISO 9000 series is just an instrument for the company to be more
organized, although in large companies this is something that already exists in
managers’ culture. The main motivations are customers’ demand for small
sized companies, and internal seek for quality improvement for the large
firms. There are some difficulties during and after the implementation process,
and someone must count the costs of such procedures as well, but they are
considered to be of minor importance. However, the quantity and the quality
of the benefits are still questionable.
This study verifies that companies in Greece are motivated to improve
internal procedures and achieve quality awareness. Companies have met
expectations after the certification at a significant level. However, they admit
that most benefits are not financial, even though that was one of their main
targets.
The findings of this survey are important. The overall financial
performance improvement of a certified company is mostly related to its
market efficiency and not to operation efficiency. On the contrary, to achieve
this target there is a one-way road: a company after the implementation can
improve internal operations and this will lead to sales revenue improvement.
Many companies demonstrate improvement after the implementation.
However, this improvement is not necessary related to the certification. At this
point, one must not forget the human factor. Especially in large companies,
employees have to get used to the new procedures and adjust their needs to
the new functions. Thus, this is the key for the implementation success.
Certification can exist without the system functioning and, reversely, a
company can demonstrate quality awareness without the implementation.
Nowadays, quality aspects have to take under consideration some
other factors as well, such as environmental friendliness. Thus, other ISO
series have to involve in the whole process with the ISO 14000 series to be
the most vital.

_____________________________________________________________________
_________________________________________________________________
- 55 -
4.2 Limitations – Recommendations
This study has some limitations. As it is based on primary data, the use
of a questionnaire is required. This is actually the main limitation. The
questionnaire has to be “user friendly” and this is why Likert scale type
questions are used. However, this reduces the richness of the information
captured. This obstacle has been partly by-passed with the case study
analysis that has been performed (using interviews). The use of the second
questionnaire enhanced this study with much more qualitative information and
shed light on “why?” questions as well.
In addition, although the respondents were reassured for their
anonymity, there is always the possibility that their answers might not be
accurate. This is the result of two factors. Firstly, they seem to be skeptical
about providing information concerning their firm, out in the public.
Furthermore, with the enormous amount of questionnaires arriving daily in
their office, time needed to answer them properly is always an issue.
Third, there are some doubts about the findings of the study.
Measuring the impact of ISO certification on a firm’s financial performance is
tricky. Many parameters, such as quality awareness and productivity seem to
be intangible and thus, are difficult to measure. Additionally, financial
measures as secondary data were not taken in mind.
Fourth, ISO 9000:2008 version was excluded from this study. The
effects of the ISO certification might occur after the period of two years at
least. Thus, it was inevitable to include firms which were certified until the year
2007.
Literature demonstrates that the ISO 9001:2000 series was a major
improvement to the previous version, which eliminated most of the problems.
However, the 9001:2008 version, with many environmental aspects included,
should be examined properly. Additionally, with environmental matters gaining
more and more importance and vitality, future research should emphasize in
ISO 14000 series.
Many researches are based on firms from manufacturing industry.
Recently, there has been a turn, on service sector and the findings seem to
be positive as well. Therefore, future researches should focus on this sector
also.

_____________________________________________________________________
_________________________________________________________________
- 56 -
References
Aarts F. M. and Vos E. (2001), “The impact of ISO registration on New Zealand
firms’ performance: a financial perspective”, The TQM Magazine, Vol. 13,
No3, pp. 180-191
Aggelogiannopoulos D., Drosinos E. H. and Athanasopoulos P. (2007),
“Implementation of a quality management system (QMS) according to the ISO
9000 family in a Greek small-sized winery: A case study”, Food Control, Vol.
18, No9, pp. 1077-1085
Bendell T. and Boulter L. (2004), “ISO 9001:2000, A Survey of Attitudes of
Certificated Firms”, International Small Business Journal, Vol. 22, No3, pp.
295-316
Benner M. J. and Veloso F. M. (2008), “ISO 9000 practices and financial
performance: A technology coherence perspective”, Journal of Operations
Management, Vol. 26, No5, pp. 611-629
Biazzo S. and Bernardi G. (2003), “Process management practices and quality
systems standards: Risks and opportunities of the new ISO 9001
certification”, Business Process Management Journal, Vol. 9, No2, pp. 149-
169
Boiral O. (2003), “ISO 9000: Outside the Iron Cage”, Organization Science, Vol. 14,
No6, pp. 720-737
Boiral O. and Roy M.J. (2007), “ISO 9000: integration rationales and organizational
impacts”, International Journal of Operations & Production Management, Vol.
27, No2, pp. 226-247
R. A. Brealey, S. C. Myers and F. Allen, “Corporate Finance”, 2006, eighth edition,
McGraw-Hill international edition
_____________________________________________________________________
_________________________________________________________________
- 57 -
Brown A., van de Wiele T. and Loughton K. (1998), “Smaller enterprises’
experiences with ISO 9000”, International Journal of Quality & Reliability
Management, Vol. 15, No3, pp. 273-285
Buttle F. (1997), “ISO 9000: marketing motivations and benefits”, International
Journal of Quality & Reliability Management, Vol. 14, No9, pp. 936-947
Caro L.M. and Garcia J.A.M. (2009), “Does ISO 9000 certification affect consumer
perceptions of the service provider?”, Managing Service Quality, Vol. 19, No
2, pp. 140-161
Carr S., Mak Y. K. and Needham J. E. (1997), “Differences in strategy, quality
management practices and performance reporting systems between ISO
accredited and non-accredited companies”, Management Accounting
Research, Vol. 8, No4, pp. 383-403
Casadesus M. and Gimenez G. (2000), “The benefits of the implementation of the
ISO 9000 standard: empirical research in 288 Spanish companies”, The TQM
Magazine, Vol. 12, No6, pp. 432-441
Casadesus M., Gimenez G. and Heras Inaki (2001), “Benefits of ISO 9000
implementation in Spanish industry”, European Business Review, Vol. 13,
No6, pp. 327-335
Casadesus M. and Karapetrovic S. (2005), “Has ISO 9000 lost some of its lustre? A
longitudinal impact study”, International Journal of Operations & Production
Management, Vol. 25, No6, pp. 580-596
Casadesus M. and Karapetrovic S. (2005), “The erosion of ISO 9000 benefits: a
temporal study”, International Journal of Quality & Reliability Management,
Vol. 22, No2, pp. 120-136

_____________________________________________________________________
_________________________________________________________________
- 58 -
Chow-Chua C., Goh M. and Boon Wan T. (2003), “Does ISO 9000 certification
improve business performance?”, International Journal of Quality & Reliability
Management, Vol. 20, No8, pp. 936-953
Corbett C. J., Montes-Sancho M. J. and Kirsch D. A. (2005), “The Financial Impact of
ISO 9000 Certification in the United States: An Empirical Analysis”,
Management Science, Vol. 51, No7, pp. 1046-1059
Curkovic S. and Pagell M. (1999), “A Critical Examination of the Ability of ISO 9000
Certification to Lead to a Competitive Advantage”, Journal of Quality
Management, Vol. 4, No1, pp. 51-67
Curkovic S., Vickery S. and Droge C. (2000), “Quality-related action programs: Their
impact on quality performance and firm performance”, Decision sciences, Vol.
31, No4, pp. 885-905
Dick G.P.M. (2000),”ISO 9000 certification benefits, reality or myth?”, The TQM
Magazine, Vol. 12, No6, pp. 365-371
Dick G.P.M., Heras I. and Casadesus M. (2008), “Shedding light on causation
between ISO 9001 and improved business performance”, International
Journal of Operations & Production Management, Vol. 28, No7, pp. 687-708
Dimara E., Skuras D., Tsekouras K. and Goutsos S. (2004), “Strategic orientation
and financial performance of firms implementing ISO 9000”, International
Journal of Quality & Reliability Management, Vol. 21, No1, pp. 72-89
Douglas A., Coleman S. and Oddy R. (2003), “The case for ISO 9000”, The TQM
Magazine, Vol. 15, No5, pp. 316-324
Ferreira E. J., Sinha A. and Varble D. (2008), “Long-run performance following
quality management certification”, Review of Quantitative Finance and
Accounting, Vol. 30, No1, pp. 93-109

_____________________________________________________________________
_________________________________________________________________
- 59 -
Gotzamani K. D. and Tsiotras G. D. (2001), “An empirical study of the ISO 9000
standards’ contribution towards total quality management”, International
Journal of Operations & Production Management, Vol. 21, No10, pp. 1326-
1342
Gotzamani K. D. and Tsiotras G. D. (2002), “The true motives behind ISO 9000
certification: Their effect on the overall certification benefits and long term
contribution towards TQM”, International Journal of Quality & Reliability
Management, Vol. 19, No2, pp. 151-169
Gotzamani K. D., Theodorakioglou Y. D. and Tsiotras G. D. (2006), “A longitudinal
study of the ISO 9000 (1994) series’ contribution towards TQM in Greek
industry”, The TQM Magazine, Vol. 18, No1, pp. 44-54
Heras I., Dick G.P.M. and Casadesus M. (2002), “ISO 9000 registration’s impact on
sales and profitability: A longitudinal analysis of performance before and after
accreditation”, International Journal of Quality & Reliability Management, Vol.
19, No6, pp. 774-791
Jones R., Arndt G. and Kustin R. (1997), “ISO 9000 among Australian companies:
impact of time and reasons for seeking certification on perceptions of benefits
received”, International journal of Quality & Reliability Management, Vol. 14,
No7, pp. 650-660
Kostagiolas P. A. and Kitsiou M. B. (2008), “Issues and perceptions for ISO 9000
implementation in Greek academic libraries”, Library Management, Vol. 29,
No6/7, pp. 583-599
Krause M. S. Jr, (1996), “ISO 9001 benefits and pitfalls: the path to successful
certification”, Clinical Chemistry, Vol. 42, pp. 1561-1565
Lagodimos A. G., Chountalas P. T. and Chatzi K. (2007), “The state of ISO 14001
certification in Greece”, Journal of Cleaner Production, Vol. 15, No18, pp.
1743-1754

_____________________________________________________________________
_________________________________________________________________
- 60 -
Leung H.K.N., Chan K.C.C. and Lee T.Y. (1999), “Costs and benefits of ISO 9000
series: a practical study”, International Journal of Quality & Reliability
Management, Vol. 16, No7, pp. 675-690
Lipovatz D., Stenos F. and Vaka A. (1999), “Implementation of ISO 9000 quality
systems in Greek enterprises”, International Journal of Quality & Reliability
Management, Vol. 16, No6, pp. 534-551
Martinez-Costa M., Martinez-Lorente A. R. And Choi T. Y. (2008), "Simultaneous
consideration of TQM and ISO 9000 on performance and motivation: An
empirical study of Spanish companies”, International Journal of Production
Economics, Vol. 113, No1, pp. 23-39
McAdam R. and Canning N. (2001), “ISO in the service sector: perceptions of small
professional firms”, Managing Service Quality, Vol. 11, No2, pp. 80-92
McGuire S. J. and Dilts D. M. (2008), “The financial impact of standard stringency:
An event study of successive generations of the ISO 9000 standard”,
International Journal of Production Economics, Vol. 113, No1, pp. 3-22
McTeer M. M. and Dale B. G. (1994), “Are the ISO 9000 series of quality
management system standards of value to small companies?”, European
Journal of Purchasing and Supply Management, Vol. 1, No4, pp. 227-235
Poksinska B., Dahlgaard J.J. and Antoni M. (2002), “The state of ISO 9000
certification: a study of Swedish organizations”, The TQM Magazine, Vol. 14,
No5, pp. 297-306
Poksinska B., Eklund J.A.E. and Dahlgaard J.J. (2006), “ISO 9001:2000 in small
organizations. Lost opportunities, benefits and influencing factors”,
International Journal of Quality & Reliability Management, Vol. 23, No5, pp.
490-512

_____________________________________________________________________
_________________________________________________________________
- 61 -
Powell T. C. (1995), “Total Quality Management as Competitive Advantage: A
Review and Empirical Study”, Strategic Management Journal, Vol. 16, No1,
pp. 15-37
Rungtusanatham M.J., Choi T.Y., Hollingworth D.G., Wu Z. and Forza C. (2003),
“Survey research in operations management: historical analyses”, Journal of
Operations Management, Vol. 21, No4, pp. 475-488
Sampaio P., Saraiva P. and Rodrigues A. G. (2009), “ISO 9001 certification
research: questions, answers and approaches”, International Journal of
Quality & Reliability Management, Vol. 26, No1, pp. 38-58
Sharma D. S. (2005), “The association between ISO 9000 certification and financial
performance”, The International Journal of Accounting, Vol. 40, No2, pp. 151-
172
Singels J., Ruel G. and van de Water H. (2001), “ISO 9000 series: Certification and
performance”, International Journal of Quality & Reliability Management, Vol.
18, No1, pp. 62-75
Singh P.J., Feng M. and Smith A. (2006), “ISO 9000 series of standards: comparison
of manufacturing and service organizations”, International Journal of Quality &
Reliability Management, Vol. 23, No2, pp. 122-142
Stalhane T. (2006), “Implementing an ISO 9001 Certified Process”, Heidelberg:
Springer Berlin, ISSN: 1611-3349
Stevenson T. H. and Barnes F. C. (2001), “Fourteen Years of ISO 9000: impact,
criticisms, costs, and benefits”, Business Horizons, Vol. 44, No3, pp. 45-51
Sun H. (2000), “Total quality management, ISO 9000 certification and performance
improvement”, International Journal of Quality & Reliability Management, Vol.
17, No2, pp. 168-179
_____________________________________________________________________
_________________________________________________________________
- 62 -
Sun H. and Cheng T. K. (2002), “Comparing Reasons, Practices and Effects of ISO
9000 Certification and TQM Implementation in Norwegian SMEs and Large
Firms”, International Small Business Journal, Vol. 20, No4, pp. 421-442
Terlaak A. and King A. A. (2006), “The effect of certification with the ISO 9000
Quality Management Standard: A signaling approach”, Journal of Economic
Behaviour & Organization, Vol. 60, No4, pp. 579-602
Terziovski M., Samson D., and Dow D. (1997), “The business value of quality
management systems certification. Evidence from Australia and New
Zealand”, Journal of Operations Management, Vol. 15, No1, pp. 1-18
Terziovski M., Power D. and Sohal A. S. (2003), “The longitudinal effects of the ISO
9000 certification process on business performance”, European Journal of
Operational Research, Vol. 146, No3, pp. 580-595
Tsiotras G. and Gotzamani K. (1996), “ISO 9000 as an entry key to TQM: the case of
Greek industry”, International Journal of Quality & Reliability Management,
Vol. 13, No4, pp. 64-76
Tzelepis D., Tsekouras K., Skuras D. and Dimara E. (2006), “The effects of ISO
9001 on firms’ productive efficiency”, International Journal of Operations &
Production Management, Vol. 26, No10, pp. 1146-1165
Van der Wiele T., Van Iwaarden J.,Williams R. and Dale B. (2005), "Perceptions
about the ISO 9000 (2000) quality system standard revision and its value: the
Dutch experience“, International Journal of Quality & Reliability Management,
Vol. 22, No2, pp. 101-119
Venkatraman N. and Ramanujam V. (1986), “Measurement of Business
Performance in Strategy Research: A Comparison of Approaches”, The
Academy of Management Review, Vol. 11, No4, pp. 801-814

_____________________________________________________________________
_________________________________________________________________
- 63 -
Vouzas F. K. and Gotzamani K. D. (2005), “Best practices of selected Greek
organizations on their road to business excellence: The contribution of the
new ISO 9000:2000 series of standards”, The TQM Magazine, Vol. 17, No3,
pp. 259-266
Withers B. and Ebrahimpour M. (2000), “Does ISO 9000 certification affect the
dimensions of quality used for competitive advantage?”, European
Management Journal, Vol. 18, No4, pp. 431-443
Yahya S. and Goh W.K. (2001), “The implementation of an ISO 9000 quality
system”, International Journal of Quality & Reliability Management, Vol. 18,
No9, pp. 941-966
Zaramdini W. (2007), “An empirical study of the motives and benefits of ISO 9000
certification: the UAE experience”, International Journal of Quality & Reliability
Management, Vol. 24, No5, pp. 472-491
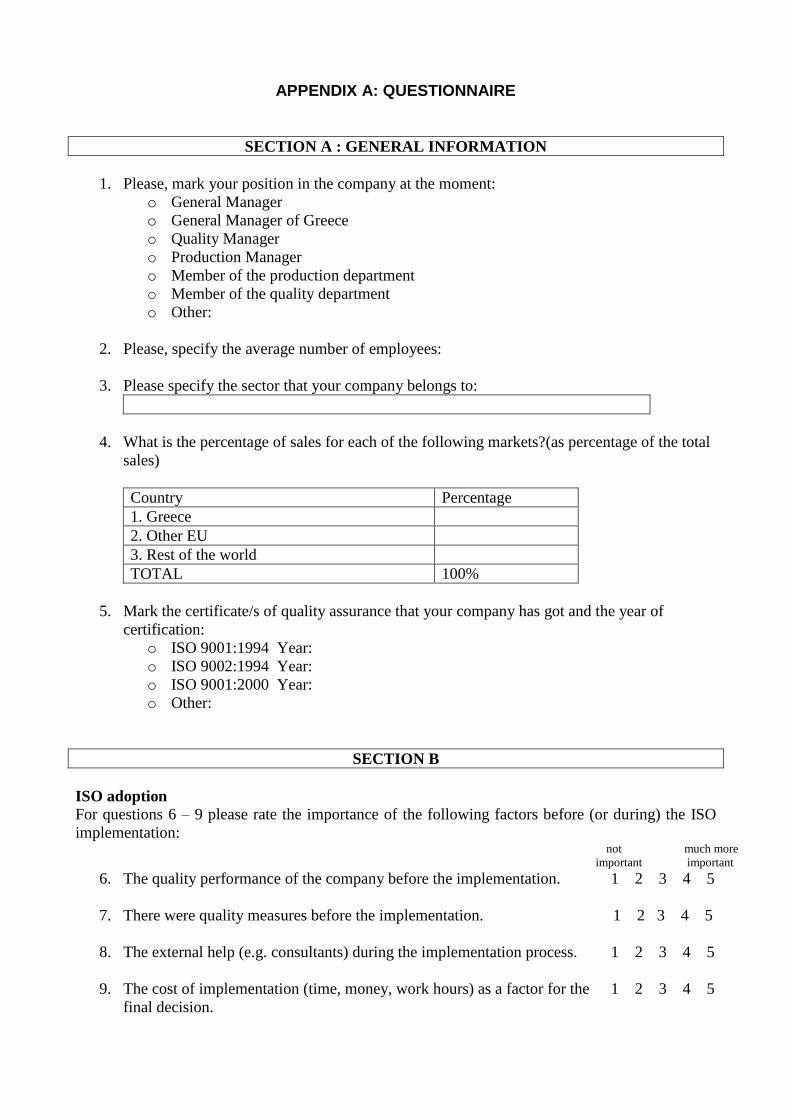
APPENDIX A: QUESTIONNAIRE
SECTION A : GENERAL INFORMATION
1. Please, mark your position in the company at the moment:
o General Manager
o General Manager of Greece
o Quality Manager
o Production Manager
o Member of the production department
o Member of the quality department
o Other:
2. Please, specify the average number of employees:
3. Please specify the sector that your company belongs to:
4. What is the percentage of sales for each of the following markets?(as percentage of the total
sales)
Country Percentage
1. Greece
2. Other EU
3. Rest of the world
TOTAL 100%
5. Mark the certificate/s of quality assurance that your company has got and the year of
certification:
o ISO 9001:1994 Year:
o ISO 9002:1994 Year:
o ISO 9001:2000 Year:
o Other:
SECTION B
ISO adoption
For questions 6 – 9 please rate the importance of the following factors before (or during) the ISO
implementation: not much more
important important
6. The quality performance of the company before the implementation.
7. There were quality measures before the implementation.
8. The external help (e.g. consultants) during the implementation process.
9. The cost of implementation (time, money, work hours) as a factor for the
final decision.
1 2 3 4 5
1 2 3 4 5
1 2 3 4 5
1 2 3 4 5
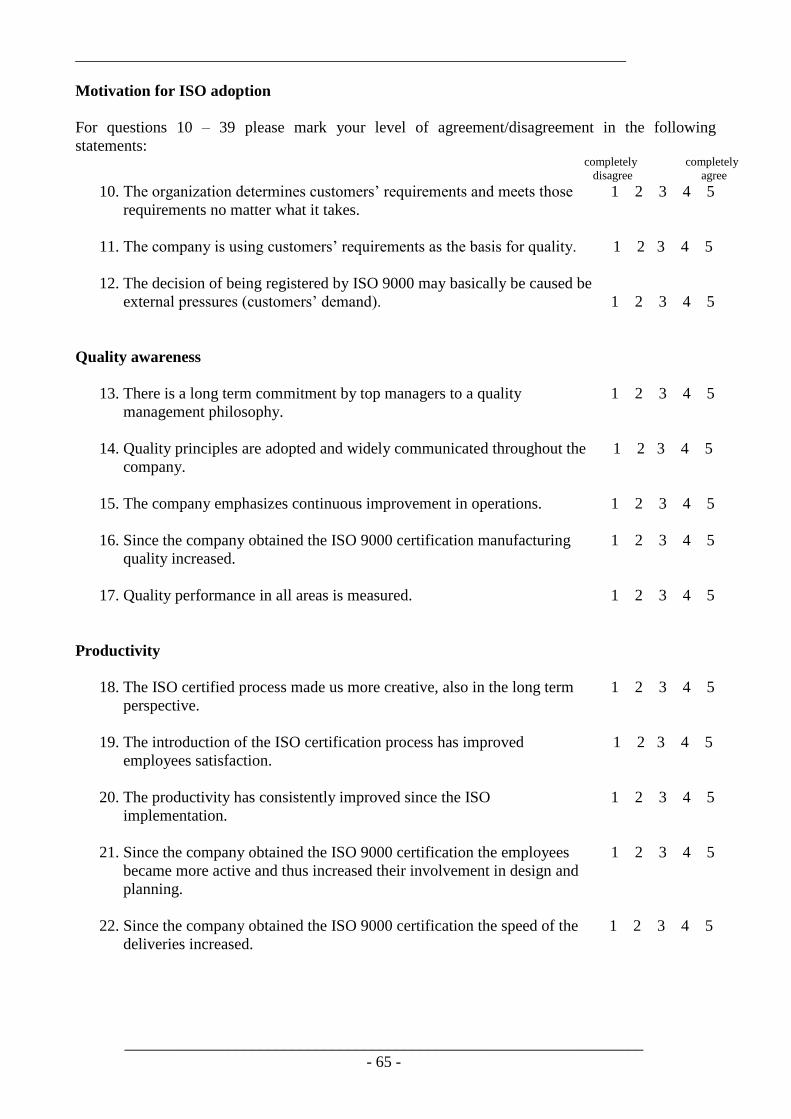
_____________________________________________________________________
_________________________________________________________________
- 65 -
Motivation for ISO adoption
For questions 10 – 39 please mark your level of agreement/disagreement in the following
statements: completely completely
disagree agree
10. The organization determines customers’ requirements and meets those
requirements no matter what it takes.
11. The company is using customers’ requirements as the basis for quality.
12. The decision of being registered by ISO 9000 may basically be caused be
external pressures (customers’ demand).
1 2 3 4 5
1 2 3 4 5
1 2 3 4 5
Quality awareness
13. There is a long term commitment by top managers to a quality
management philosophy.
14. Quality principles are adopted and widely communicated throughout the
company.
15. The company emphasizes continuous improvement in operations.
16. Since the company obtained the ISO 9000 certification manufacturing
quality increased.
17. Quality performance in all areas is measured.
1 2 3 4 5
1 2 3 4 5
1 2 3 4 5
1 2 3 4 5
1 2 3 4 5
Productivity
18. The ISO certified process made us more creative, also in the long term
perspective.
19. The introduction of the ISO certification process has improved
employees satisfaction.
20. The productivity has consistently improved since the ISO
implementation.
21. Since the company obtained the ISO 9000 certification the employees
became more active and thus increased their involvement in design and
planning.
22. Since the company obtained the ISO 9000 certification the speed of the
deliveries increased.
1 2 3 4 5
1 2 3 4 5
1 2 3 4 5
1 2 3 4 5
1 2 3 4 5
_____________________________________________________________________
_________________________________________________________________
- 66 -
Operations execution
23. There is less bureaucracy in the company since the implementation.
24. Since the company obtained the ISO 9000 certification employee
autonomy in decision-making increased.
25. There is less use of cross-department teams.
26. Since the company obtained the ISO 9000 certification, flexibility to
change production volume and inventories increased.
1 2 3 4 5
1 2 3 4 5
1 2 3 4 5
1 2 3 4 5
Market share
27. Over the 3 years after the ISO 9000 implementation, our financial
performance has exceeded our competitors’.
28. Over the 3 years after the ISO 9000 implementation, we have been more
profitable than our competitors.
29. Over the 3 years after the ISO 9000 implementation, our revenue growth
rate has exceeded our competitors’.
30. Since the company obtained the ISO 9000 certification market share
increased.
1 2 3 4 5
1 2 3 4 5
1 2 3 4 5
1 2 3 4 5
Customers’ satisfaction
31. Since the company obtained the ISO 9000 certification there is more
flexibility in our customer relationships.
32. Introducing an ISO certified process gave more satisfied customers after
one year.
33. Introducing an ISO certified process gave more satisfied customers but
only in the long term perspective.
1 2 3 4 5
1 2 3 4 5
1 2 3 4 5
Sales revenue
34. Introducing an ISO certified process gave the company a better control
over the order situation.
35. Over the 3 years after the ISO 9000 implementation, we have been more
profitable than our competitors.
36. Over the 3 years after the ISO 9000 implementation, our revenue (sales)
growth has been outstanding.
1 2 3 4 5
1 2 3 4 5
1 2 3 4 5
_____________________________________________________________________
_________________________________________________________________
- 67 -
Overall financial performance improvement
37. Over the 3 years after the ISO 9000 implementation, our financial
performance has been outstanding.
38. Over the 3 years after the ISO 9000 implementation, there has been a
significant increase in profits.
39. The ISO implementation had a positive effect on the company’s
performance.
1 2 3 4 5
1 2 3 4 5
1 2 3 4 5

_____________________________________________________________________
_________________________________________________________________
- 68 -
APPENDIX B: QUESTIONNAIRE FOR THE CONDUCTED INTERVIEWS
SECTION A : QUESTIONNAIRE ADDRESSED TO MANAGERS
1. What were the main motivations for the firm to pursue certification?
2. What difficulties were experienced during the certification?
3. What problems were experienced following the certification?
4. What benefits were experienced since the certification?
5. Does certification meets expectations?
6. What is the level of satisfaction with ISO 9000 series’ organizational impact?
7. How much time was needed to recover the costs of certification?
8. Which are the disappointments after the certification?
9. Does ISO 9000 certification improve firm’s financial efficiency (e.g. its profit
margin)?

_____________________________________________________________________
_________________________________________________________________
- 69 -
10. Does ISO 9000 certification improve firm’s growth (e.g. its sales growth)?
11. Does ISO 9000 certification improve firm’s overall financial performance? (e.g. its
earnings per share)?
12. Does ISO 9000 certification in your sector benefit early adopters more than the late
adopters?
13. Does ISO 9000 certification actually create a competitive advantage to the certified
firm instead of the non-certified?

_____________________________________________________________________
_________________________________________________________________
- 70 -
SECTION B : QUESTIONNAIRE ADDRESSED TO EMPLOYEES
1. Has ISO 9000 certification increased employee involvement in design and
planning?
2. Has ISO 9000 certification offered a more active employee suggestion system?
3. Has ISO 9000 certification increased employee autonomy in decision-making?
4. Has ISO 9000 certification increased employee interaction with customers and
suppliers?
5. Are ISO 9000 series a program that helped to reduce new product or service development cycle times?
6. Are ISO 9000 series a program that helped to reduce overall product delivery cycle
times?
7. Are ISO 9000 series a program that helped to reduce paperwork?
8. Are ISO 9000 series a program that helped to find wasted time and costs in all
internal processes?
9. Are ISO 9000 series a program that create methods to measure and monitor
quality?

_____________________________________________________________________
_________________________________________________________________
- 71 -
10. Are ISO 9000 series a program that helped to train new employees more easily?
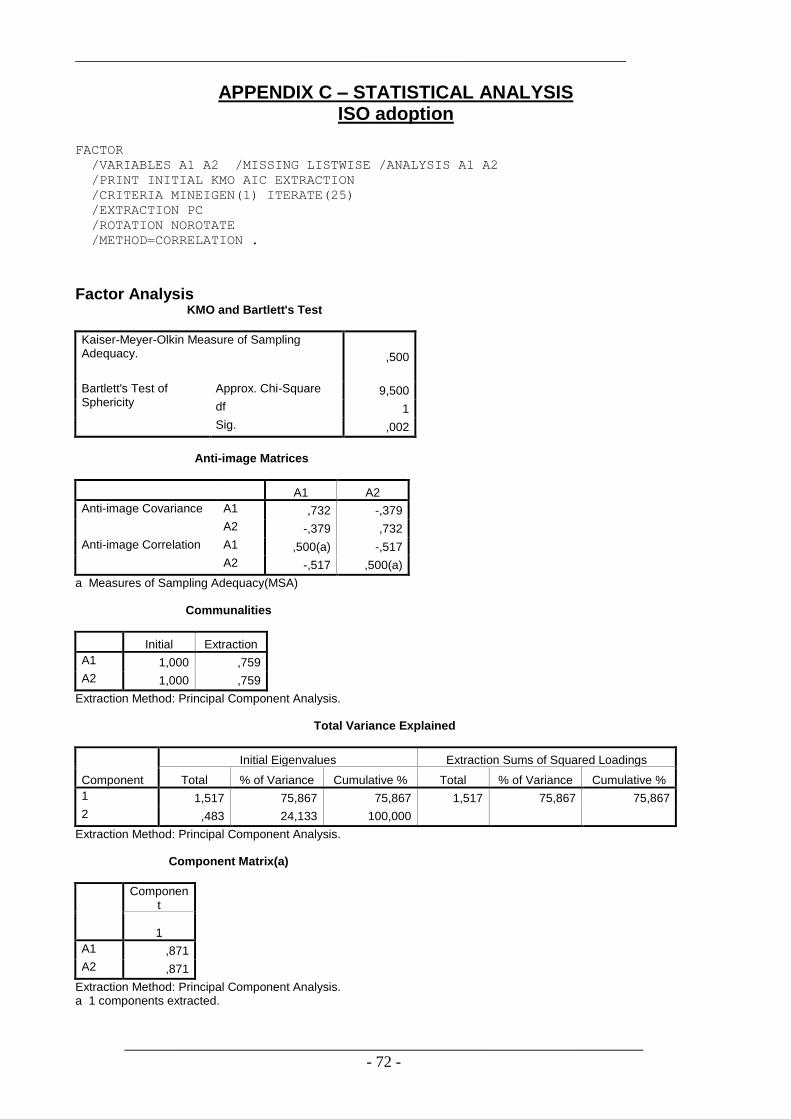
_____________________________________________________________________
_________________________________________________________________
- 72 -
APPENDIX C – STATISTICAL ANALYSIS ISO adoption
FACTOR
/VARIABLES A1 A2 /MISSING LISTWISE /ANALYSIS A1 A2
/PRINT INITIAL KMO AIC EXTRACTION
/CRITERIA MINEIGEN(1) ITERATE(25)
/EXTRACTION PC
/ROTATION NOROTATE
/METHOD=CORRELATION .
Factor Analysis KMO and Bartlett's Test
Kaiser-Meyer-Olkin Measure of Sampling Adequacy. ,500
Bartlett's Test of Sphericity
Approx. Chi-Square 9,500
df 1
Sig. ,002
Anti-image Matrices
A1 A2
Anti-image Covariance A1 ,732 -,379
A2 -,379 ,732
Anti-image Correlation A1 ,500(a) -,517
A2 -,517 ,500(a)
a Measures of Sampling Adequacy(MSA) Communalities
Initial Extraction
A1 1,000 ,759
A2 1,000 ,759
Extraction Method: Principal Component Analysis. Total Variance Explained
Component
Initial Eigenvalues Extraction Sums of Squared Loadings
Total % of Variance Cumulative % Total % of Variance Cumulative %
1 1,517 75,867 75,867 1,517 75,867 75,867
2 ,483 24,133 100,000
Extraction Method: Principal Component Analysis. Component Matrix(a)
Component
1
A1 ,871
A2 ,871
Extraction Method: Principal Component Analysis. a 1 components extracted.
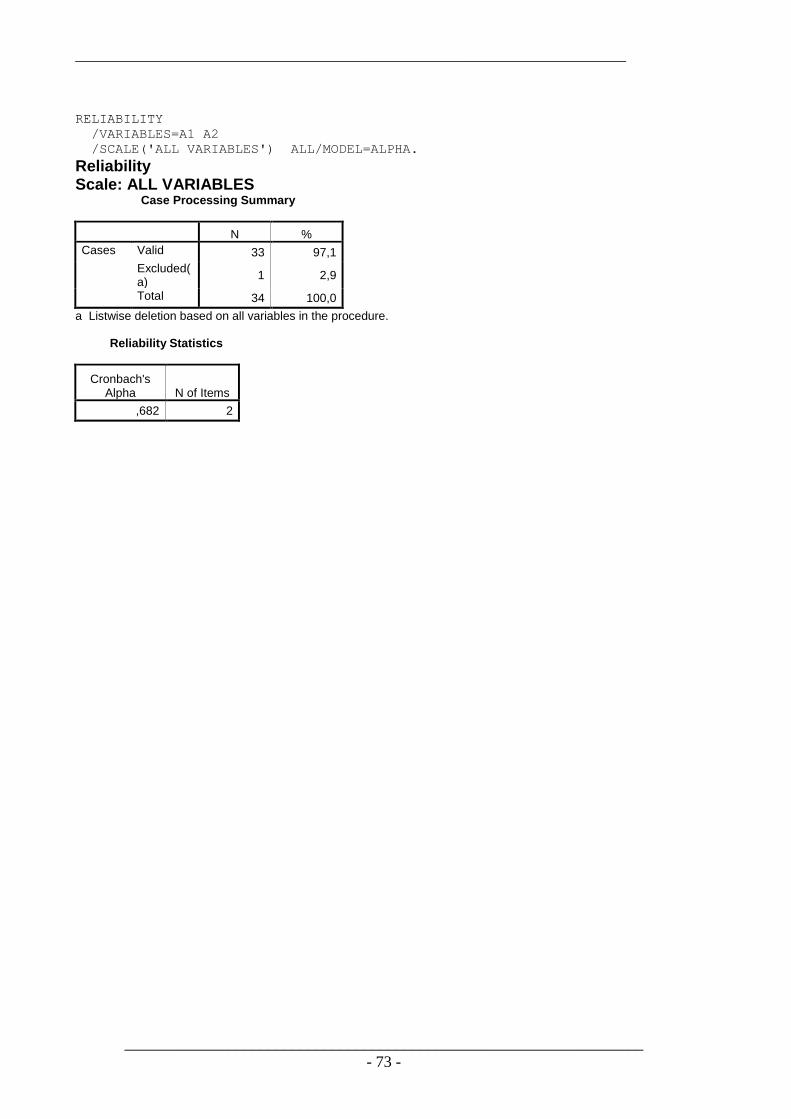
_____________________________________________________________________
_________________________________________________________________
- 73 -
RELIABILITY
/VARIABLES=A1 A2
/SCALE('ALL VARIABLES') ALL/MODEL=ALPHA.
Reliability Scale: ALL VARIABLES Case Processing Summary
N %
Cases Valid 33 97,1
Excluded(a)
1 2,9
Total 34 100,0
a Listwise deletion based on all variables in the procedure. Reliability Statistics
Cronbach's Alpha N of Items
,682 2
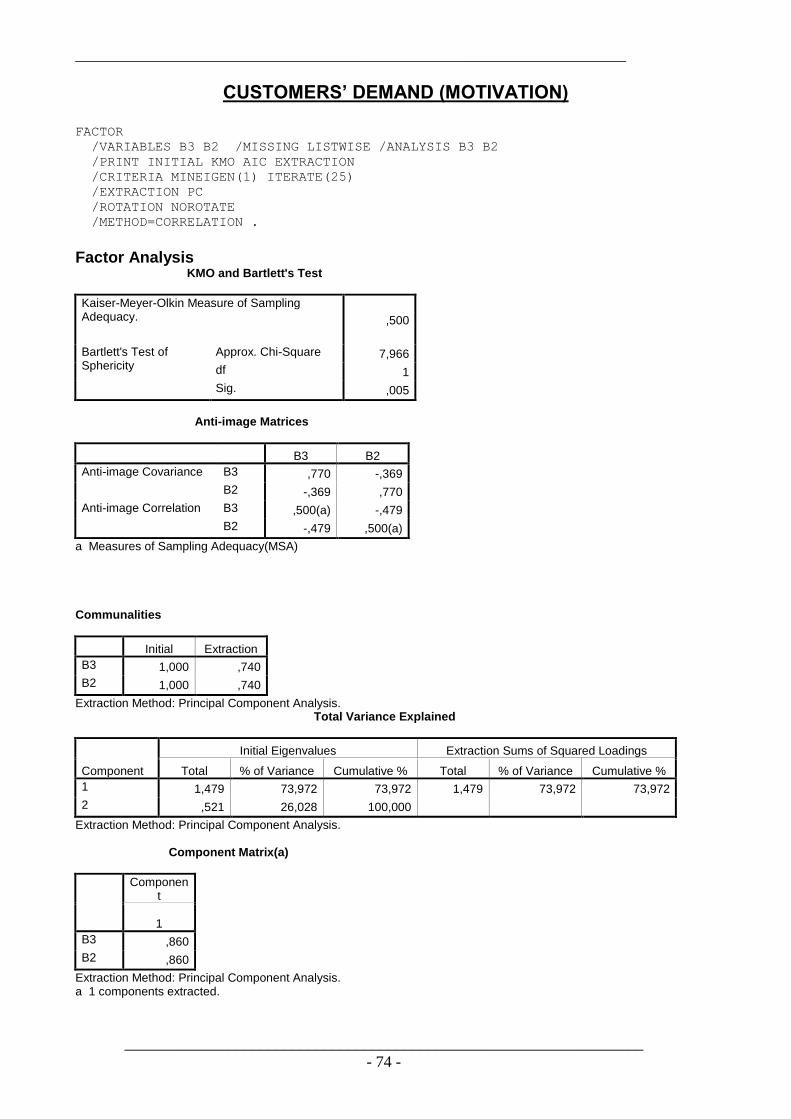
_____________________________________________________________________
_________________________________________________________________
- 74 -
CUSTOMERS’ DEMAND (MOTIVATION)
FACTOR
/VARIABLES B3 B2 /MISSING LISTWISE /ANALYSIS B3 B2
/PRINT INITIAL KMO AIC EXTRACTION
/CRITERIA MINEIGEN(1) ITERATE(25)
/EXTRACTION PC
/ROTATION NOROTATE
/METHOD=CORRELATION .
Factor Analysis KMO and Bartlett's Test
Kaiser-Meyer-Olkin Measure of Sampling Adequacy. ,500
Bartlett's Test of Sphericity
Approx. Chi-Square 7,966
df 1
Sig. ,005
Anti-image Matrices
B3 B2
Anti-image Covariance B3 ,770 -,369
B2 -,369 ,770
Anti-image Correlation B3 ,500(a) -,479
B2 -,479 ,500(a)
a Measures of Sampling Adequacy(MSA) Communalities
Initial Extraction
B3 1,000 ,740
B2 1,000 ,740
Extraction Method: Principal Component Analysis. Total Variance Explained
Component
Initial Eigenvalues Extraction Sums of Squared Loadings
Total % of Variance Cumulative % Total % of Variance Cumulative %
1 1,479 73,972 73,972 1,479 73,972 73,972
2 ,521 26,028 100,000
Extraction Method: Principal Component Analysis. Component Matrix(a)
Component
1
B3 ,860
B2 ,860
Extraction Method: Principal Component Analysis. a 1 components extracted.

_____________________________________________________________________
_________________________________________________________________
- 75 -
RELIABILITY
/VARIABLES=B2 B3
/SCALE('ALL VARIABLES') ALL/MODEL=ALPHA.
Reliability Scale: ALL VARIABLES Case Processing Summary
N %
Cases Valid 33 97,1
Excluded(a)
1 2,9
Total 34 100,0
a Listwise deletion based on all variables in the procedure. Reliability Statistics
Cronbach's Alpha N of Items
,571 2

_____________________________________________________________________
_________________________________________________________________
- 76 -
A. QUALITY AWARENESS FACTOR
/VARIABLES C.1.1 C.1.2 C.1.3 C.1.4 C.1.5 /MISSING LISTWISE /ANALYSIS
C.1.1 C.1.2 C.1.3 C.1.4 C.1.5
/PRINT INITIAL KMO AIC EXTRACTION
/CRITERIA MINEIGEN(1) ITERATE(25)
/EXTRACTION PC
/ROTATION NOROTATE
/METHOD=CORRELATION .
Factor Analysis KMO and Bartlett's Test
Kaiser-Meyer-Olkin Measure of Sampling Adequacy. ,689
Bartlett's Test of Sphericity
Approx. Chi-Square 65,572
df 10
Sig. ,000
Anti-image Matrices
C.1.1 C.1.2 C.1.3 C.1.4 C.1.5
Anti-image Covariance C.1.1 ,487 -,152 -,225 ,053 -,082
C.1.2 -,152 ,528 -,117 ,092 -,137
C.1.3 -,225 -,117 ,574 -,054 ,010
C.1.4 ,053 ,092 -,054 ,393 -,256
C.1.5 -,082 -,137 ,010 -,256 ,298
Anti-image Correlation C.1.1 ,758(a) -,301 -,426 ,120 -,215
C.1.2 -,301 ,765(a) -,213 ,202 -,345
C.1.3 -,426 -,213 ,789(a) -,113 ,023
C.1.4 ,120 ,202 -,113 ,557(a) -,749
C.1.5 -,215 -,345 ,023 -,749 ,631(a)
a Measures of Sampling Adequacy(MSA) Communalities
Initial Extraction
C.1.1 1,000 ,771
C.1.2 1,000 ,691
C.1.3 1,000 ,691
C.1.4 1,000 ,919
C.1.5 1,000 ,886
Extraction Method: Principal Component Analysis. Total Variance Explained
Component
Initial Eigenvalues Extraction Sums of Squared Loadings
Total % of Variance Cumulative % Total % of Variance Cumulative %
1 2,900 57,991 57,991 2,900 57,991 57,991
2 1,058 21,167 79,158 1,058 21,167 79,158
3 ,500 10,004 89,162
4 ,361 7,225 96,387
5 ,181 3,613 100,000
Extraction Method: Principal Component Analysis.
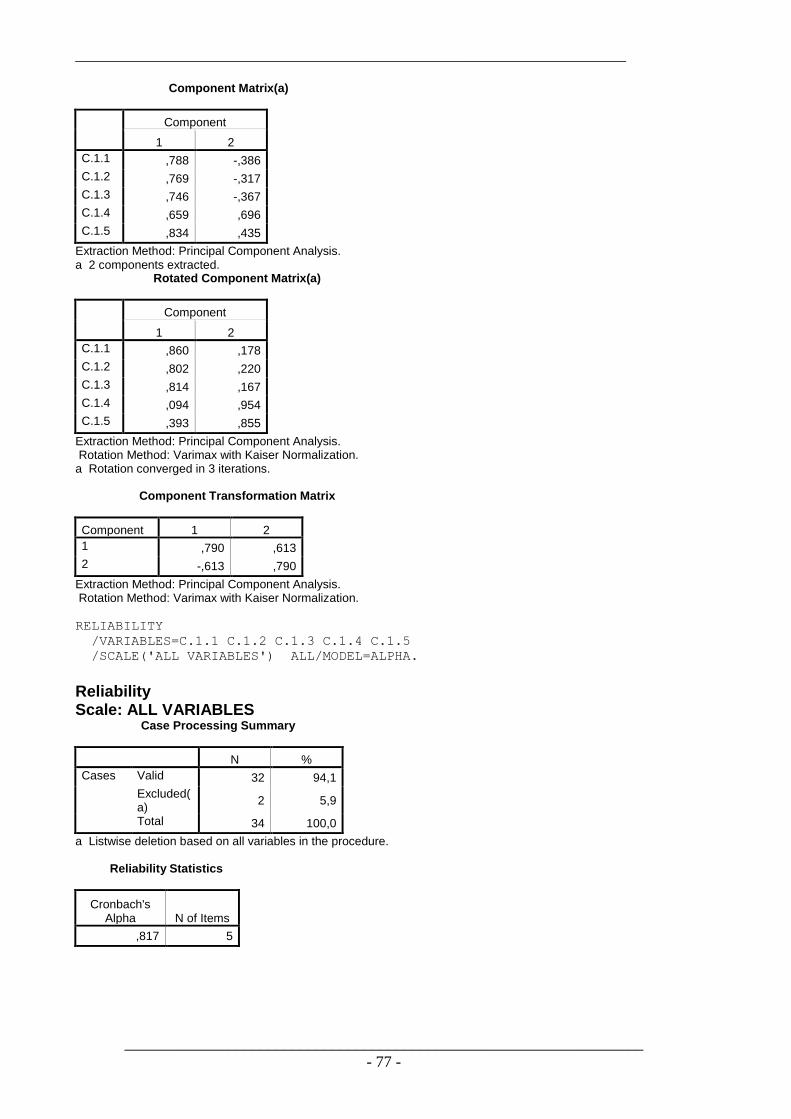
_____________________________________________________________________
_________________________________________________________________
- 77 -
Component Matrix(a)
Component
1 2
C.1.1 ,788 -,386
C.1.2 ,769 -,317
C.1.3 ,746 -,367
C.1.4 ,659 ,696
C.1.5 ,834 ,435
Extraction Method: Principal Component Analysis. a 2 components extracted. Rotated Component Matrix(a)
Component
1 2
C.1.1 ,860 ,178
C.1.2 ,802 ,220
C.1.3 ,814 ,167
C.1.4 ,094 ,954
C.1.5 ,393 ,855
Extraction Method: Principal Component Analysis. Rotation Method: Varimax with Kaiser Normalization. a Rotation converged in 3 iterations. Component Transformation Matrix
Component 1 2
1 ,790 ,613
2 -,613 ,790
Extraction Method: Principal Component Analysis. Rotation Method: Varimax with Kaiser Normalization. RELIABILITY
/VARIABLES=C.1.1 C.1.2 C.1.3 C.1.4 C.1.5
/SCALE('ALL VARIABLES') ALL/MODEL=ALPHA.
Reliability Scale: ALL VARIABLES Case Processing Summary
N %
Cases Valid 32 94,1
Excluded(a)
2 5,9
Total 34 100,0
a Listwise deletion based on all variables in the procedure. Reliability Statistics
Cronbach's Alpha N of Items
,817 5

_____________________________________________________________________
_________________________________________________________________
- 78 -
RELIABILITY
/VARIABLES=C.1.1 C.1.2 C.1.3
/SCALE('ALL VARIABLES') ALL/MODEL=ALPHA.
Reliability Scale: ALL VARIABLES Case Processing Summary
N %
Cases Valid 33 97,1
Excluded(a)
1 2,9
Total 34 100,0
a Listwise deletion based on all variables in the procedure. Reliability Statistics
Cronbach's Alpha N of Items
,807 3
RELIABILITY
/VARIABLES=C.1.4 C.1.5
/SCALE('ALL VARIABLES') ALL/MODEL=ALPHA.
Reliability Scale: ALL VARIABLES Case Processing Summary
N %
Cases Valid 32 94,1
Excluded(a)
2 5,9
Total 34 100,0
a Listwise deletion based on all variables in the procedure. Reliability Statistics
Cronbach's Alpha N of Items
,854 2

_____________________________________________________________________
_________________________________________________________________
- 79 -
B. INCREASED PRODUCTIVITY FACTOR
/VARIABLES C.2.1 C.2.2 C.2.3 C.2.4 C.2.5 /MISSING LISTWISE /ANALYSIS
C.2.1 C.2.2 C.2.3 C.2.4 C.2.5
/PRINT INITIAL KMO AIC EXTRACTION
/CRITERIA MINEIGEN(1) ITERATE(25)
/EXTRACTION PC
/ROTATION NOROTATE
/METHOD=CORRELATION .
Factor Analysis KMO and Bartlett's Test
Kaiser-Meyer-Olkin Measure of Sampling Adequacy. ,803
Bartlett's Test of Sphericity
Approx. Chi-Square 82,123
df 10
Sig. ,000
Anti-image Matrices
C.2.1 C.2.2 C.2.3 C.2.4 C.2.5
Anti-image Covariance C.2.1 ,353 -,150 ,030 -,152 -,132
C.2.2 -,150 ,452 -,207 -,034 ,098
C.2.3 ,030 -,207 ,439 -,091 -,134
C.2.4 -,152 -,034 -,091 ,366 -,110
C.2.5 -,132 ,098 -,134 -,110 ,484
Anti-image Correlation C.2.1 ,794(a) -,376 ,077 -,422 -,319
C.2.2 -,376 ,761(a) -,464 -,084 ,210
C.2.3 ,077 -,464 ,801(a) -,226 -,292
C.2.4 -,422 -,084 -,226 ,845(a) -,262
C.2.5 -,319 ,210 -,292 -,262 ,810(a)
a Measures of Sampling Adequacy(MSA) Communalities
Initial Extraction
C.2.1 1,000 ,751
C.2.2 1,000 ,611
C.2.3 1,000 ,675
C.2.4 1,000 ,760
C.2.5 1,000 ,606
Extraction Method: Principal Component Analysis. Total Variance Explained
Component
Initial Eigenvalues Extraction Sums of Squared Loadings
Total % of Variance Cumulative % Total % of Variance Cumulative %
1 3,403 68,066 68,066 3,403 68,066 68,066
2 ,643 12,859 80,925
3 ,441 8,824 89,749
4 ,297 5,941 95,690
5 ,216 4,310 100,000
Extraction Method: Principal Component Analysis.
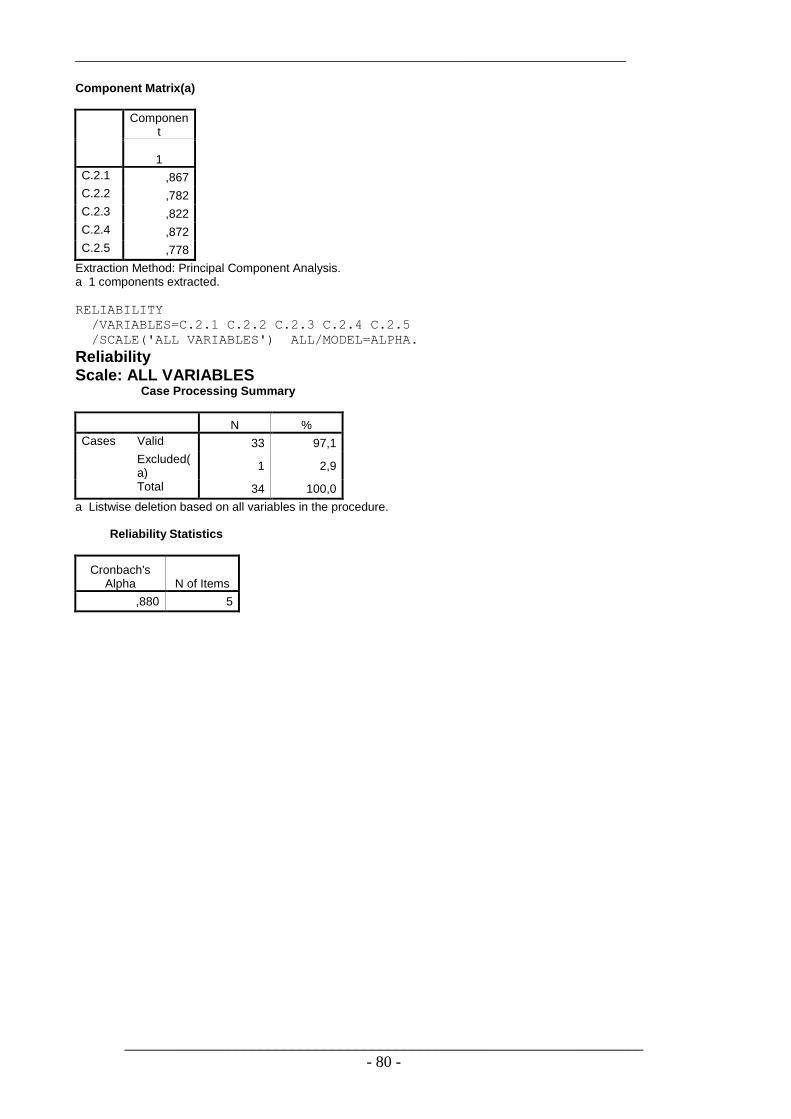
_____________________________________________________________________
_________________________________________________________________
- 80 -
Component Matrix(a)
Component
1
C.2.1 ,867
C.2.2 ,782
C.2.3 ,822
C.2.4 ,872
C.2.5 ,778
Extraction Method: Principal Component Analysis. a 1 components extracted.
RELIABILITY
/VARIABLES=C.2.1 C.2.2 C.2.3 C.2.4 C.2.5
/SCALE('ALL VARIABLES') ALL/MODEL=ALPHA.
Reliability Scale: ALL VARIABLES Case Processing Summary
N %
Cases Valid 33 97,1
Excluded(a)
1 2,9
Total 34 100,0
a Listwise deletion based on all variables in the procedure. Reliability Statistics
Cronbach's Alpha N of Items
,880 5

_____________________________________________________________________
_________________________________________________________________
- 81 -
C. EASIER OPERATIONS EXECUTION FACTOR
/VARIABLES C.3.1 C.3.2 C.3.3 C.3.4 /MISSING LISTWISE /ANALYSIS C.3.1
C.3.2 C.3.3 C.3.4
/PRINT INITIAL KMO AIC EXTRACTION
/CRITERIA MINEIGEN(1) ITERATE(25)
/EXTRACTION PC
/ROTATION NOROTATE
/METHOD=CORRELATION .
Factor Analysis KMO and Bartlett's Test
Kaiser-Meyer-Olkin Measure of Sampling Adequacy. ,611
Bartlett's Test of Sphericity
Approx. Chi-Square 43,768
df 6
Sig. ,000
Anti-image Matrices
C.3.1 C.3.2 C.3.3 C.3.4
Anti-image Covariance C.3.1 ,783 -,102 -,075 -,025
C.3.2 -,102 ,425 -,247 ,127
C.3.3 -,075 -,247 ,313 -,243
C.3.4 -,025 ,127 -,243 ,630
Anti-image Correlation C.3.1 ,886(a) -,177 -,151 -,036
C.3.2 -,177 ,591(a) -,677 ,246
C.3.3 -,151 -,677 ,574(a) -,549
C.3.4 -,036 ,246 -,549 ,564(a)
a Measures of Sampling Adequacy(MSA) Communalities
Initial Extraction
C.3.1 1,000 ,434
C.3.2 1,000 ,674
C.3.3 1,000 ,838
C.3.4 1,000 ,440
Extraction Method: Principal Component Analysis. Total Variance Explained
Component
Initial Eigenvalues Extraction Sums of Squared Loadings
Total % of Variance Cumulative % Total % of Variance Cumulative %
1 2,385 59,634 59,634 2,385 59,634 59,634
2 ,798 19,956 79,589
3 ,622 15,540 95,129
4 ,195 4,871 100,000
Extraction Method: Principal Component Analysis.

_____________________________________________________________________
_________________________________________________________________
- 82 -
Component Matrix(a)
Component
1
C.3.1 ,659
C.3.2 ,821
C.3.3 ,915
C.3.4 ,663
Extraction Method: Principal Component Analysis. a 1 components extracted. RELIABILITY
/VARIABLES=C.3.1 C.3.2 C.3.3 C.3.4
/SCALE('ALL VARIABLES') ALL/MODEL=ALPHA.
Reliability Scale: ALL VARIABLES Case Processing Summary
N %
Cases Valid 33 97,1
Excluded(a)
1 2,9
Total 34 100,0
a Listwise deletion based on all variables in the procedure. Reliability Statistics
Cronbach's Alpha N of Items
,753 4

_____________________________________________________________________
_________________________________________________________________
- 83 -
A. MARKET SHARE FACTOR
/VARIABLES D.1.1 D.1.2 D.1.3 D.1.4 /MISSING LISTWISE /ANALYSIS D.1.1
D.1.2 D.1.3 D.1.4
/PRINT INITIAL KMO AIC EXTRACTION
/CRITERIA MINEIGEN(1) ITERATE(25)
/EXTRACTION PC
/ROTATION NOROTATE
/METHOD=CORRELATION .
Factor Analysis KMO and Bartlett's Test
Kaiser-Meyer-Olkin Measure of Sampling Adequacy. ,739
Bartlett's Test of Sphericity
Approx. Chi-Square 101,401
df 6
Sig. ,000
Anti-image Matrices
D.1.1 D.1.2 D.1.3 D.1.4
Anti-image Covariance D.1.1 ,237 -,133 ,001 -,103
D.1.2 -,133 ,189 -,114 ,072
D.1.3 ,001 -,114 ,215 -,155
D.1.4 -,103 ,072 -,155 ,400
Anti-image Correlation D.1.1 ,776(a) -,628 ,005 -,333
D.1.2 -,628 ,691(a) -,567 ,261
D.1.3 ,005 -,567 ,752(a) -,530
D.1.4 -,333 ,261 -,530 ,743(a)
a Measures of Sampling Adequacy(MSA) Communalities
Initial Extraction
D.1.1 1,000 ,840
D.1.2 1,000 ,836
D.1.3 1,000 ,867
D.1.4 1,000 ,681
Extraction Method: Principal Component Analysis. Total Variance Explained
Component
Initial Eigenvalues Extraction Sums of Squared Loadings
Total % of Variance Cumulative % Total % of Variance Cumulative %
1 3,224 80,606 80,606 3,224 80,606 80,606
2 ,451 11,273 91,879
3 ,221 5,518 97,397
4 ,104 2,603 100,000
Extraction Method: Principal Component Analysis.
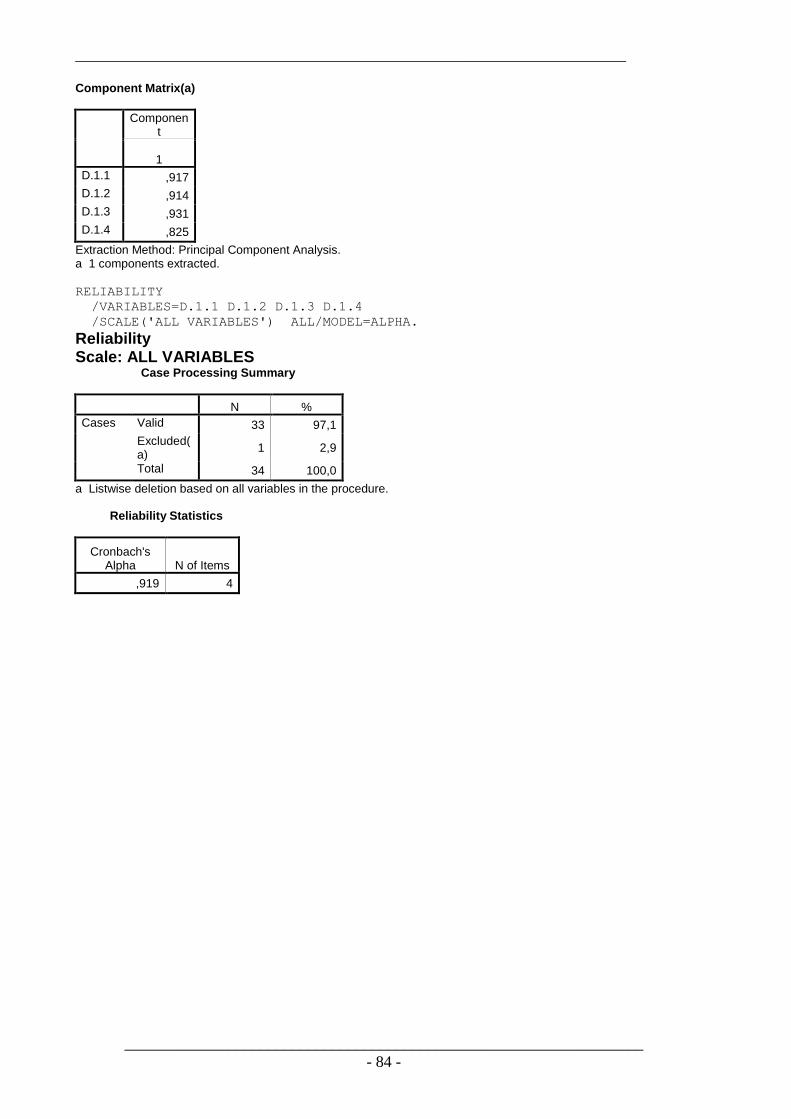
_____________________________________________________________________
_________________________________________________________________
- 84 -
Component Matrix(a)
Component
1
D.1.1 ,917
D.1.2 ,914
D.1.3 ,931
D.1.4 ,825
Extraction Method: Principal Component Analysis. a 1 components extracted. RELIABILITY
/VARIABLES=D.1.1 D.1.2 D.1.3 D.1.4
/SCALE('ALL VARIABLES') ALL/MODEL=ALPHA.
Reliability Scale: ALL VARIABLES Case Processing Summary
N %
Cases Valid 33 97,1
Excluded(a)
1 2,9
Total 34 100,0
a Listwise deletion based on all variables in the procedure. Reliability Statistics
Cronbach's Alpha N of Items
,919 4

_____________________________________________________________________
_________________________________________________________________
- 85 -
B. CUSTOMER SATISFACTION FACTOR
/VARIABLES D.2.1 D.2.2 D.2.3 /MISSING LISTWISE /ANALYSIS D.2.1 D.2.2 D.2.3
/PRINT INITIAL KMO AIC EXTRACTION
/CRITERIA MINEIGEN(1) ITERATE(25)
/EXTRACTION PC
/ROTATION NOROTATE
/METHOD=CORRELATION .
Factor Analysis KMO and Bartlett's Test
Kaiser-Meyer-Olkin Measure of Sampling Adequacy. ,532
Bartlett's Test of Sphericity
Approx. Chi-Square 13,527
df 3
Sig. ,004
Anti-image Matrices
D.2.1 D.2.2 D.2.3
Anti-image Covariance D.2.1 ,731 -,351 ,033
D.2.2 -,351 ,661 -,238
D.2.3 ,033 -,238 ,885
Anti-image Correlation D.2.1 ,529(a) -,505 ,041
D.2.2 -,505 ,520(a) -,311
D.2.3 ,041 -,311 ,574(a)
a Measures of Sampling Adequacy(MSA) Communalities
Initial Extraction
D.2.1 1,000 ,596
D.2.2 1,000 ,752
D.2.3 1,000 ,339
Extraction Method: Principal Component Analysis. Total Variance Explained
Component
Initial Eigenvalues Extraction Sums of Squared Loadings
Total % of Variance Cumulative % Total % of Variance Cumulative %
1 1,687 56,248 56,248 1,687 56,248 56,248
2 ,873 29,084 85,332
3 ,440 14,668 100,000
Extraction Method: Principal Component Analysis. Component Matrix(a)
Component
1
D.2.1 ,772
D.2.2 ,867
D.2.3 ,583
Extraction Method: Principal Component Analysis. a 1 components extracted.

_____________________________________________________________________
_________________________________________________________________
- 86 -
RELIABILITY
/VARIABLES=D.2.1 D.2.2 D.2.3
/SCALE('ALL VARIABLES') ALL/MODEL=ALPHA.
Reliability Scale: ALL VARIABLES Case Processing Summary
N %
Cases Valid 34 100,0
Excluded(a)
0 ,0
Total 34 100,0
a Listwise deletion based on all variables in the procedure. Reliability Statistics
Cronbach's Alpha N of Items
,584 3

_____________________________________________________________________
_________________________________________________________________
- 87 -
C. SALES REVENUE FACTOR
/VARIABLES D.3.1 D.3.2 D.3.3 /MISSING LISTWISE /ANALYSIS D.3.1 D.3.2 D.3.3
/PRINT INITIAL KMO AIC EXTRACTION
/CRITERIA MINEIGEN(1) ITERATE(25)
/EXTRACTION PC
/ROTATION NOROTATE
/METHOD=CORRELATION .
Factor Analysis KMO and Bartlett's Test
Kaiser-Meyer-Olkin Measure of Sampling Adequacy. ,587
Bartlett's Test of Sphericity
Approx. Chi-Square 37,295
df 3
Sig. ,000
Anti-image Matrices
D.3.1 D.3.2 D.3.3
Anti-image Covariance D.3.1 ,854 -,077 -,051
D.3.2 -,077 ,319 -,255
D.3.3 -,051 -,255 ,323
Anti-image Correlation D.3.1 ,895(a) -,147 -,098
D.3.2 -,147 ,555(a) -,794
D.3.3 -,098 -,794 ,556(a)
a Measures of Sampling Adequacy(MSA) Communalities
Initial Extraction
D.3.1 1,000 ,389
D.3.2 1,000 ,844
D.3.3 1,000 ,835
Extraction Method: Principal Component Analysis. Total Variance Explained
Component
Initial Eigenvalues Extraction Sums of Squared Loadings
Total % of Variance Cumulative % Total % of Variance Cumulative %
1 2,069 68,957 68,957 2,069 68,957 68,957
2 ,752 25,081 94,038
3 ,179 5,962 100,000
Extraction Method: Principal Component Analysis. Component Matrix(a)
Component
1
D.3.1 ,624
D.3.2 ,919
D.3.3 ,914
Extraction Method: Principal Component Analysis. a 1 components extracted.
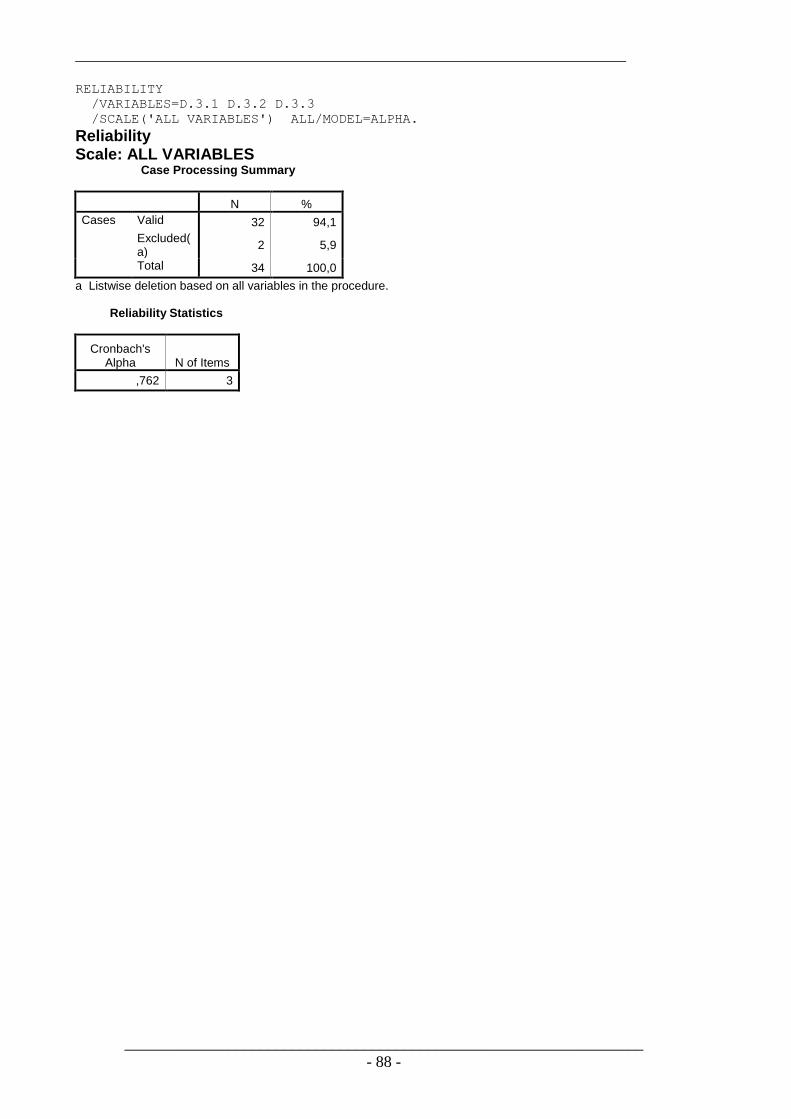
_____________________________________________________________________
_________________________________________________________________
- 88 -
RELIABILITY
/VARIABLES=D.3.1 D.3.2 D.3.3
/SCALE('ALL VARIABLES') ALL/MODEL=ALPHA.
Reliability Scale: ALL VARIABLES Case Processing Summary
N %
Cases Valid 32 94,1
Excluded(a)
2 5,9
Total 34 100,0
a Listwise deletion based on all variables in the procedure. Reliability Statistics
Cronbach's Alpha N of Items
,762 3
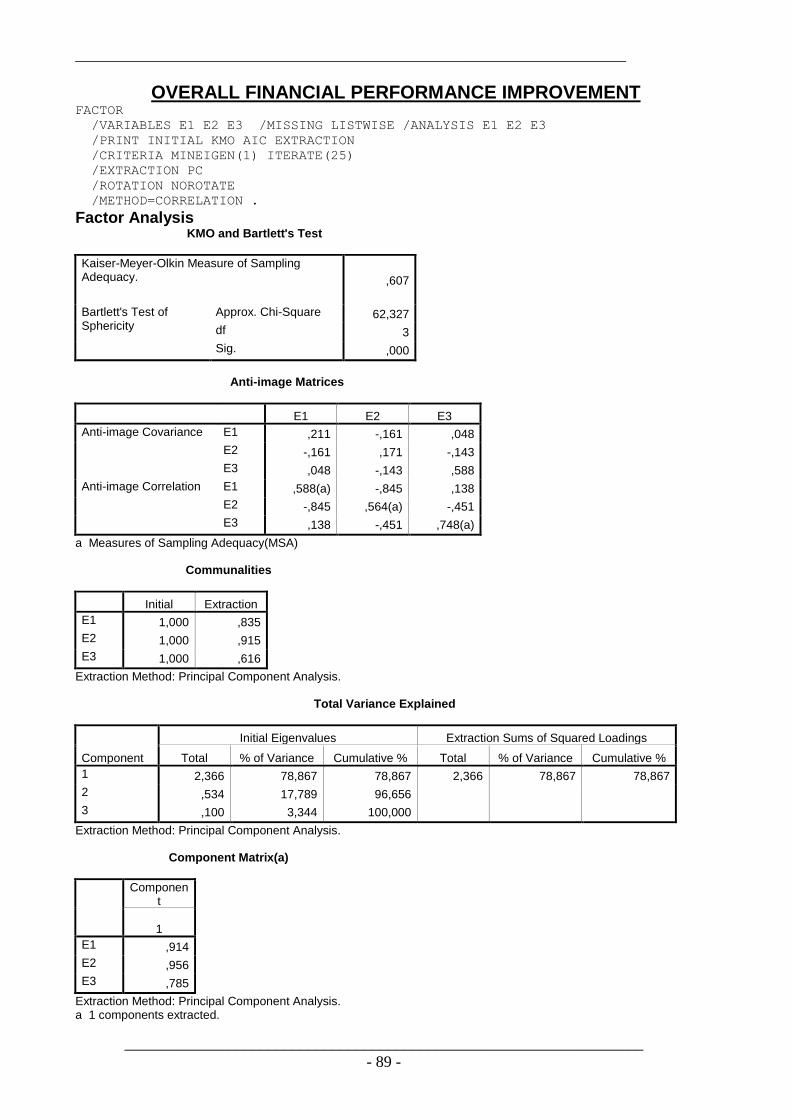
_____________________________________________________________________
_________________________________________________________________
- 89 -
OVERALL FINANCIAL PERFORMANCE IMPROVEMENT FACTOR
/VARIABLES E1 E2 E3 /MISSING LISTWISE /ANALYSIS E1 E2 E3
/PRINT INITIAL KMO AIC EXTRACTION
/CRITERIA MINEIGEN(1) ITERATE(25)
/EXTRACTION PC
/ROTATION NOROTATE
/METHOD=CORRELATION .
Factor Analysis KMO and Bartlett's Test
Kaiser-Meyer-Olkin Measure of Sampling Adequacy. ,607
Bartlett's Test of Sphericity
Approx. Chi-Square 62,327
df 3
Sig. ,000
Anti-image Matrices
E1 E2 E3
Anti-image Covariance E1 ,211 -,161 ,048
E2 -,161 ,171 -,143
E3 ,048 -,143 ,588
Anti-image Correlation E1 ,588(a) -,845 ,138
E2 -,845 ,564(a) -,451
E3 ,138 -,451 ,748(a)
a Measures of Sampling Adequacy(MSA) Communalities
Initial Extraction
E1 1,000 ,835
E2 1,000 ,915
E3 1,000 ,616
Extraction Method: Principal Component Analysis. Total Variance Explained
Component
Initial Eigenvalues Extraction Sums of Squared Loadings
Total % of Variance Cumulative % Total % of Variance Cumulative %
1 2,366 78,867 78,867 2,366 78,867 78,867
2 ,534 17,789 96,656
3 ,100 3,344 100,000
Extraction Method: Principal Component Analysis. Component Matrix(a)
Component
1
E1 ,914
E2 ,956
E3 ,785
Extraction Method: Principal Component Analysis. a 1 components extracted.
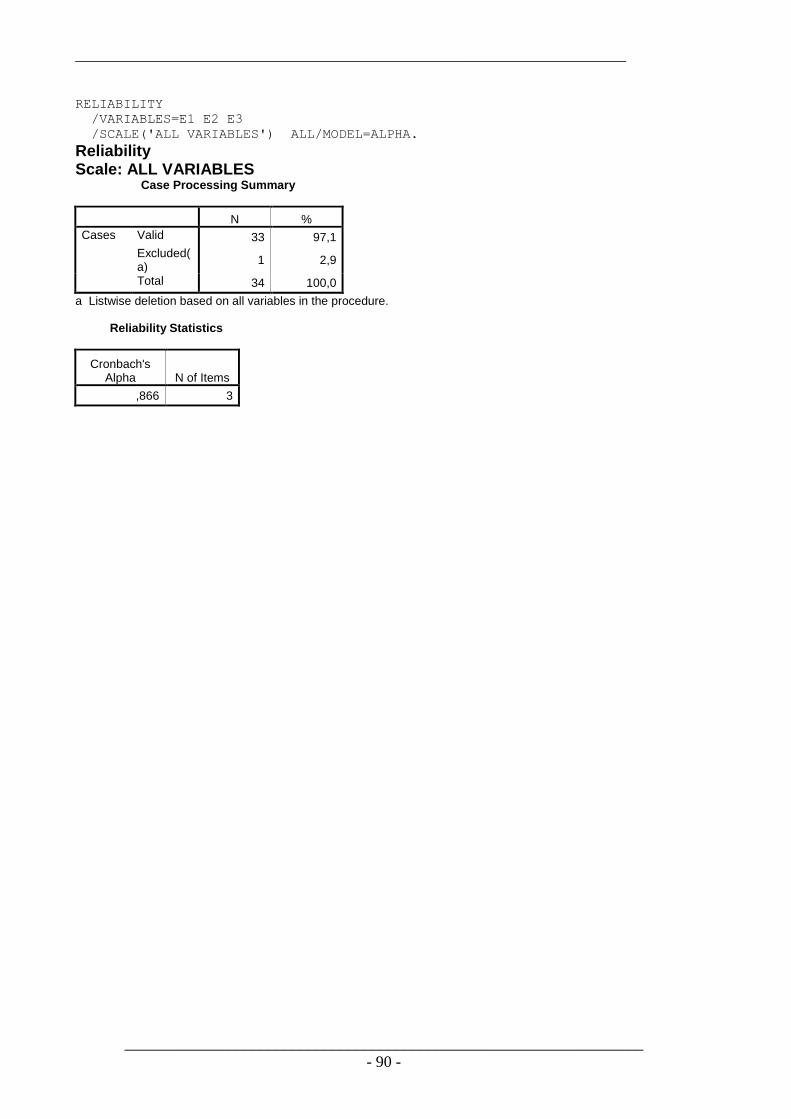
_____________________________________________________________________
_________________________________________________________________
- 90 -
RELIABILITY
/VARIABLES=E1 E2 E3
/SCALE('ALL VARIABLES') ALL/MODEL=ALPHA.
Reliability Scale: ALL VARIABLES Case Processing Summary
N %
Cases Valid 33 97,1
Excluded(a)
1 2,9
Total 34 100,0
a Listwise deletion based on all variables in the procedure. Reliability Statistics
Cronbach's Alpha N of Items
,866 3