efficient contracts for government intervention in ...ftp.zew.de/pub/zew-docs/dp/dp14022.pdf ·...
TRANSCRIPT

Dis cus si on Paper No. 14-022
Efficient Contracts for Government Intervention in Promoting Next Generation Communications Networks
Wolfgang Briglauer and Christian Holzleitner

Dis cus si on Paper No. 14-022
Efficient Contracts for Government Intervention in Promoting Next Generation Communications Networks
Wolfgang Briglauer and Christian Holzleitner
Download this ZEW Discussion Paper from our ftp server:
http://ftp.zew.de/pub/zew-docs/dp/dp14022.pdf
Die Dis cus si on Pape rs die nen einer mög lichst schnel len Ver brei tung von neue ren For schungs arbei ten des ZEW. Die Bei trä ge lie gen in allei ni ger Ver ant wor tung
der Auto ren und stel len nicht not wen di ger wei se die Mei nung des ZEW dar.
Dis cus si on Papers are inten ded to make results of ZEW research prompt ly avai la ble to other eco no mists in order to encou ra ge dis cus si on and sug gesti ons for revi si ons. The aut hors are sole ly
respon si ble for the con tents which do not neces sa ri ly repre sent the opi ni on of the ZEW.

Efficient contracts for government intervention in promoting
next generation communications networks
Wolfgang Briglauera
Christian Holzleitnerb
March 2014
Abstract
Although the future socio-economic benefits of a new fibre-based (“next generation
access”, NGA) telecommunications infrastructure seem to be uncontroversial, a
universal NGA coverage appears to be a rather unrealistic objective without
government intervention. We contend, however, that the current contract practice of
fixing ex ante targets for network expansion is inefficient given the uncertainty about
future returns on NGA infrastructure-based services and the public authorities’
incomplete information about the capital costs of the network provider. This paper puts
forward to delegate the choice of the network expansion to the NGA provider.
Keywords: Contract theory, public utilities, next generation telecommunications
networks, subsidies
JEL: H20, L43, L44, L51, L52, L96
a (Corresponding author) Wolfgang Briglauer, Centre for European Economic Research (ZEW
Mannheim), e-mail: [email protected], phone: +49 (0) 621 1235-279, fax: +49 (0) 621 1235-170. P.O.
Box 103443, 68034 Mannheim, Germany.
b Christian Holzleitner, DG Climate Action, European Commission, e-mail: [email protected],
phone: +32 (0) 2 299 64 52. Office BU24 1/71, B-1000 Brussels, Belgium. The views expressed are
entirely those of the author and do not represent those of the European Commission.

~ 1 ~
1 Introduction
The deployment of fibre-based next-generation access (NGA) telecommunications
networks has become a major challenge for sector-specific regulators, governments
and network providers in recent years. Traditional (first-generation copper-based)
telecommunications networks seem to be outdated and it has become necessary to
speed up these networks to account for the growing demand for bandwidth. Such
needs come from new and interactive services such as file sharing and streaming, high-
quality video conferencing, cloud computing, teleworking, distance learning,
telemedicine and so on. The future importance of ultra-high speed broadband
infrastructure is largely undisputed and mainly related to the potential of significant
productivity improvements and economic growth across all business sectors.1 However,
replacing existing telecommunications networks with fibre optic networks requires
massive investment volumes. These are of much greater magnitude than the previous
investments required for upgrading first-generation copper networks to facilitate
broadband services and add up to billions of Euros for nationwide (second-generation)
NGA deployment.2
1 For empirical evidence, see Röller and Waverman (2001) who investigate the impact of traditional
telecommunications infrastructure on economic growth, Garbacz and Thompson (2007) for the impact
of Internet services and information networks on productive efficiency and Czernich et al. (2011) for
the impact of high-speed broadband networks on economic growth. OECD (2009) also estimates the
positive spillover effects of high-speed broadband infrastructure on other business sectors.
2 Cost estimates for 100% coverage in all member states of the European Union (EU) vary between
€192 billion and €280 billion (FTTH Council Europe, 2012a, p. 10).

~ 2 ~
As private investors are apparently not ready to roll out NGA networks in remote
(unprofitable or “white”)3 regions but only in densely populated areas, it seems that
public subsidies are needed to achieve universal NGA deployment. Indeed, in Asian
countries (such as South Korea and Japan) and northern European countries (such as
Denmark, Norway and Sweden), national governments in the early nineties initiated
broadband strategies as a complementary measure to market liberalization and sector-
specific regulation. In particular, the Asian countries that have provided the highest
public subsidies for NGA deployment (see Table 1 in section 2.3) are heading the
broadband as well as high-speed (fibre-based) broadband rankings by a large margin
today (FTTH Council Europe, 2012b).
A growing branch of the literature focuses on different aspects of the funding of NGA
networks. Diverse funding instruments and cost models have been discussed and
developed by industry consultants (e.g. Neumann, 2010; wik consult, 2008; dot.econ,
2012; Ventura Team & Portland Advisers, 2012), international organizations (e.g. OECD,
2008, 2009; ITU, 2009) and in the policy-oriented work of academics (e.g. Huigen &
Cave, 2008; Cave & Martin, 2010; Falch & Henten, 2010) in recent years. Belloc et al.
(2012) are the first to examine econometrically the distinct effects of demand- and
supply-side policies on the diffusion of conventional broadband technologies. They
3 The European Commission (2009, para 40) “made a distinction between areas where no broadband
infrastructure exists or is unlikely to be developed in the near term (white areas), areas where only
one broadband network operator is present (grey areas) and areas where at least two or more
broadband network providers are present (black areas).”

~ 3 ~
find that although both kinds of funding policies have a positive impact on broadband
diffusion, their effectiveness is dependent on the respective diffusion stage. Jullien et
al. (2010) is a theoretical paper that analyzes the interaction between regulators,
incumbents and local governments with regard to investment in new network
infrastructure. They find that government intervention can be welfare reducing in the
case of asymmetric information or regional externalities. In addition to this more
applied research, a rich literature exists on the general theory of public intervention
under uncertainty. It is developed how a public authority must design optimal contracts
under incomplete information about costs and demand (see e.g. Laffont & Tirole, 1993,
for a seminal theory of incentive regulation under asymmetric information, Armstrong &
Sappington, 2006, 2007, for comprehensive reviews of regulatory theory and
Holzleitner, 2001, for an assessment of regulatory contracts in practice). There is also a
growing literature on public–private partnerships (PPPs) related to this paper (see
Engel et al. (2013) and the literature cited therein). A primary focus of this literature is
on the allocation of risks between the public authority and private provider. Engel et al.
(2001) derive the optimal length of concessionaire contracts under uncertain demand.
Martimort and Pouyet (2008) and Iossa and Martimort (2008) study the optimal
bundling of tasks (e.g. network construction and its operation) in a moral hazard
model. Engel et al. (2013) investigate the optimal choice between financing through
user revenue and public subsidies under demand uncertainty.
According to the best of our knowledge, there has been no systematic attempt at
combining these branches of the literature in terms of evaluating the real-world public

~ 4 ~
funding of NGA deployment in light of information asymmetries and efficiency
considerations. Given the economic and social desirability of universal NGA
deployment and insufficient private investment, we want to examine the following
research question: Is the current practice of funding NGA rollout projects efficient, and,
if not, how can public authorities despite their informational disadvantages design
simple and robust contracts that provide more efficiency-based incentives for
increased NGA deployment but nevertheless minimize public expenditure? Our main
proposition is that the level of network expansion or of other quality criteria should not
be fixed ex ante by the public authority but that this choice should be left to the NGA
provider who has better knowledge of investment costs. Furthermore, we show that
such contracts can be readily implemented based on existing accounting data and that
it is not necessary to undertake any additional verification of cost or demand data.
Finally, as we directly solve for the optimal contract, the trade-off between incentives
for network expansion and the limitation of the NGA provider’s profit can be explained
in a more accessible way to policymakers.
The remainder of this paper is organized as follows. Section 2 briefly provides the
necessary background on the technical context and then outlines the basic economic
rationale for NGA-related subsidies. This is supplemented by a compilation of
representative funding practices in countries leading in fibre deployment and/or most
engaged in public subsidy programmes. Section 3 presents a formal model with
optimal linear contracts for principal/agent settings with complete and incomplete
information. As this paper aims specifically to take account of the real-world
~ 5 ~
characteristics of NGA deployment, section 4 compiles the relevant policy implications
that directly follow from the main results of our model. Section 5 contains some further
relevant policy considerations and, finally, section 6 summarizes and contains some
qualifying remarks.
2 Institutional framework and evidence
2.1 Basic technological concepts and definitions of NGA scenarios
First-generation communications networks provide broadband services by means of
the xDSL transmission technology that allows a connection speed in the range of 256
kbit/s to 20 Mbit/s. In order to further increase the current bandwidth and to fulfil
future broadband demand, it is necessary to shorten the length of the local copper-wire
loops. As a first solution, where a DSL transmission system is deployed in cabinets, the
connection to the backbone network can be replaced by means of optical fibre. In the
remaining copper-wire lines, the latest DSL transmission technology is used. This
solution (“fibre to the curb/cabinet”, FTTC) can provide bandwidths of approximately
20 Mbit/s to 100 Mbit/s depending on the length of the remaining copper lines.
Second, higher bandwidths (above 100 Mbit/s) will be achieved if the final copper-wire
line is shortened further. Fibre to the building (FTTB) is an implementation scenario in
which optical fibre is extended to or into the building. Third, if it feasible to also renew
or replace in-house wiring, it is possible to eliminate copper lines entirely. In such a

~ 6 ~
scenario, the optical line is directly connected to the individual apartment or home
(“fibre to the home”, FTTH).4
2.2 The economic rationale for subsidizing NGA deployment
NGA deployment causes high construction costs related to civil work for digging, in-
house wiring and laying down optical cables, which are literally sunk and account for
60% to 80% of the NGA network’s total costs (ERG, 2007, pp. 16–17), followed by duct
costs and fibreglass. Since access networks branch out in a tree-like structure as they
approach the final consumer, renewing line infrastructure involves fewer customers the
closer one gets to the final consumer. This means that rollout costs will be distributed
among fewer customers and average cost per customer will be higher. In many cases,
access networks therefore represent “natural monopolies”, where economies of scale
in terms of density make it much less expensive to integrate additional customers into
an existing network than to provide them with separate (parallel) networks (RTR, 2010,
p. 192).
In particular, high investment volumes come along with distinctive risks of NGA
deployment. Next to the risks that arise from the sunk cost nature of NGA investment,
potential investors face the following risks, which all influence investment decisions in
4 For the different NGA scenarios, see RTR (2010, pp. 189–191) and Briglauer et al. (2013, p. 3). In
addition, cable television and mobile (wireless) networks might also be used to roll out high-speed
communications networks. Cable and FTTC networks represent hybrid access network technologies
combining existing and new infrastructure that may be sufficient to meet bandwidth demand at least
in the mid-term.

~ 7 ~
a negative way: the long amortization periods (20–25 years) of network infrastructure,
the technical risk of the new technology as well as substantial uncertainties regarding
future demand for new high-speed broadband services. The expected value of those
uncertain revenues may not be sufficient to render profitable an investment into a
nationwide NGA network. Furthermore, NGA investors are confronted with regulatory
risks because the set of ex ante NGA specific regulations is still an open issue in most
countries.5 NGA investors may fear that regulators will be subject to moral hazard and
take away realized profits if business turns out better than initially expected. Of course,
this creates another source of uncertainty, especially for operators who most likely will
be deemed as dominant and therefore subjected to sector-specific regulation in future
decisions.
Given the economics and specific risks of NGA deployment, it is unlikely that private
investment will be induced by competition or sector-specific regulation on a broad or
even nationwide scale.6 However, aggregate societal benefits may exceed private
willingness to pay, which then creates a case for public intervention. As 100 years ago
5 For a recent overview of the regulatory status, see wik consult (2012).
6 The impact of regulation is actually greatly disputed in the academic literature. The vast majority of
the related literature indicates a negative net impact of regulation on investment in general and
broadband, in particular (see Cambini & Jiang (2009), who review the relevant empirical and
theoretical work). Briglauer et al. (2013) and Briglauer (2014), who empirically examine the
determinants of NGA investment and adoption, respectively, also find that service-based competition
in terms of broadband access regulations has a negative impact on both NGA investment and
adoption.

~ 8 ~
with the rollout of first-generation networks, additional public subsidy programmes
seem to be necessary to realize the positive externalities of communications networks
(e.g. increasing efficiency and decreasing costs in other business sectors).7 In addition,
national governments and local municipalities consider high-speed broadband
infrastructure to be a necessity to increase the competitiveness of their countries and
regions and to attract international business (Falch & Henten 2010, p. 2). Finally, owing
to the economies of density, public subsidies will be particularly important for white
areas where NGA provision is unprofitable. For such – mainly rural – areas, public
subsidies are also to be expected, because otherwise a politically unacceptable gap to
urban areas (“digital divide”) would increase. Overall, the economic rationales for
subsidizing NGA deployment projects rest upon market structural characteristics,
macroeconomic reasoning8 and equity motives and, thus, intervention is covered by
mainstream economics (Gomez-Barroso & Feijob, 2010, pp. 488–490).
7 OECD (2009) calculates that even slight spillover effects that accrue in major sectors of the economy
such as health, transport or energy are sufficient for justifying subsidies for nationwide NGA
deployment.
8 The recent economic downturn provided another good reason for national governments to consider
public subsidies for NGA networks. On one hand, the crisis impinges upon private investment
decisions and diminishes access to private capital; on the other hand, NGA deployment constitutes
innovative and reasonable investment options for governments (Bauer, 2010, p. 72).

~ 9 ~
Public subsidies can be targeted towards either the demand or the supply side.9 Direct
supply-side stimuli not only include non-refundable public funds or facilitated loans
but also PPPs, where national governments play a coordination and partial financing
role and where both types of partners contribute with certain comparative advantages.
Cooperating partners are usually telecommunications providers (across the value
chain), other public utilities (most notably, energy utilities), real estate developers and
public entities (municipalities, local authorities, the state). PPPs seem to be especially
attractive for the rollout of NGA networks, which require investments that are normally
beyond the scope of public subsidizing, as they would lead to sharing investment risks
among the partners involved (Cave & Martin, 2010, p. 3). PPPs can be implemented by
means of a purely contractual basis or by creating a new legal entity (Falch & Henten,
2010, p. 2). The most interventionist form of public funding is in terms of direct
infrastructural investment where the government owns parts of or the entire NGA
network.
2.3 Previous NGA funding practice
Table 1 provides an overview of the major NGA subsidy programmes with country-
specific information in columns 2 and 3. The focus is on some of the most prominent
and far-reaching subsidy programmes in Asia, the US and some of the fibre-leading
9 Demand stimuli are not considered in the remainder of this paper, although they might be an
important complementary instrument, but yet far from sufficient given the massive investments
required for a broad scale NGA rollout. According to Belloc et al. (2012), demand-side stimuli become
favourable at more advanced stages of the diffusion process.

~ 10 ~
European countries.10 Column 1 contains a selection of countries11 with FTTH/B
household penetration rates of >5% as of December 2011 (ranks in parentheses).12
Table 1 also includes the EU, which is the only multinational entity with its own funding
activities so far, as well as countries with low current FTTH/B penetration but with most
ambitious public subsidy programmes in per capita terms (AU and NZ). Table 1,
however, excludes some high-ranked countries where there are either no major NGA
public funding projects known or data are not available.13
From Table 1, we infer that in several of the leading FTTH/B countries, major public
subsidies are already in place. Although volumes of public subsidies vary widely
among countries as regards absolute size, institutional design and temporal allocation,
they are, by all means, substantial in their total scope. When looking at the EU as a
whole, the European Commission approved €3.3 billion of public funds spent by
member states for high-speed broadband development projects from 2003 to 2010. In
10 These regions clearly represent the global “NGA hotspots” with 49.5 million FTTH/B subscribers in
Asia, 10.2 million subscribers in Europe (including Russia) and 7.3 million subscribers in the US. The
other regions represent fewer than 1 million FTTH/B subscribers (FTTH Council Europe, 2012b).
11 The two-letter country codes (CC) in column 1 (and below) follow the ISO standard.
12 Source: FTTH Council Europe (2012b).
13 Some of the most advanced fibre nations such as AE (55%/(2)) and TW (29%/(5)) have also
experienced massive public NGA rollout programmes but no information is available for the purposes
of comparison in Table 1. Among the global FTTH/B frontrunners, only a few nations such as HK
(45.5%/(3)) as well as a couple of Eastern European countries have shown massive growth without
any forms of (substantial) public funding initiatives.

~ 11 ~
addition, the European Commission granted an additional €2.3 billion out of its own
funds from 2007 to 2010. The majority of these projects have been undertaken in the
form of PPPs to focus financial resources and to share risk. However, any public
financing of such projects must be in line with the EU principles of state aid control as
well as the specific broadband/NGA state aid guidelines (European Commission, 2009,
2012). Compliance with those rules ensures that public funding does not lead to an
overcompensation of the NGA provider, while equal access to the network is ensured
for competitors.
In order to limit the profits of subsidized NGA providers, public authorities use different
approaches. They may create competition upfront by making the public funding subject
to a competitive tendering process and/or impose an upper limit on realized profit.
According to EU state aid rules (European Commission, 2013, para 79 I; European
Commission, 2009, para 51 h), when public authorities use a claw-back rule on realized
profit, the NGA provider is only allowed to earn an average industry profit. Any realized
profit that goes beyond that benchmark has to be paid back.14
14 See e.g. European Commission (2010c, para 38) on the monitoring and claw-back mechanism for
state aid to the German framework programme on duct support. In order to prevent the chosen
operators from obtaining an unreasonable profit in relation to the state support, the awarding
authority examines as a rule after five years whether demand for broadband services in the
subsidized area grew beyond the estimates given in the operator’s bid. If there is an increase of
demand of more than 30%, the operator will calculate the respective turnover exceeding that 30%.
Any profit calculated on that turnover will be reimbursed to the awarding authority. Similarly, see
European Commission (2010d, para 27) on the claw-back mechanism for state aid to next-generation

~ 12 ~
In all of the countries listed in Table 1, public subsidy programmes typically specify
quality characteristics in terms of bandwidth that has to be reached for a certain
percentage of the population (households) within a predefined timeframe. Quality
characteristics and deployment costs are always subject to some kind of contract
between funding and operating entities, irrespective of the type of public funding
programme at hand. In addition, in most cases public funding is to a greater or lesser
extent directly linked to close supply gaps in white areas. Exceptions (such as SG) are
very few and due to country-specific demographic and topographic conditions.
Finally, it is noteworthy that the NGA subsidies – and the related PPPs – are often
managed by public authorities at the regional or local level. While the national sector-
specific telecommunications regulator is inter alia responsible for setting the level of
access charges, NGA subsidies are implemented by regional or local governments. With
regard to the design of PPPs, it is generally the case that the private provider
constructs, owns and operates the NGA network. The ownership and network
operations are therefore bundled with the private provider.
broadband in North Yorkshire. The preferred bidder will pay back part of the state aid to the UK
authorities if demand for broadband in the target area grows beyond anticipated levels and this leads
to a situation where the support granted is deemed to be higher than the average of the industry
during the lifetime of the project. Any extra profit will be calculated annually and, at the end of the
lifetime of the project, the cumulative calculation will determine the amount of the funding to be paid
back.
~ 13 ~
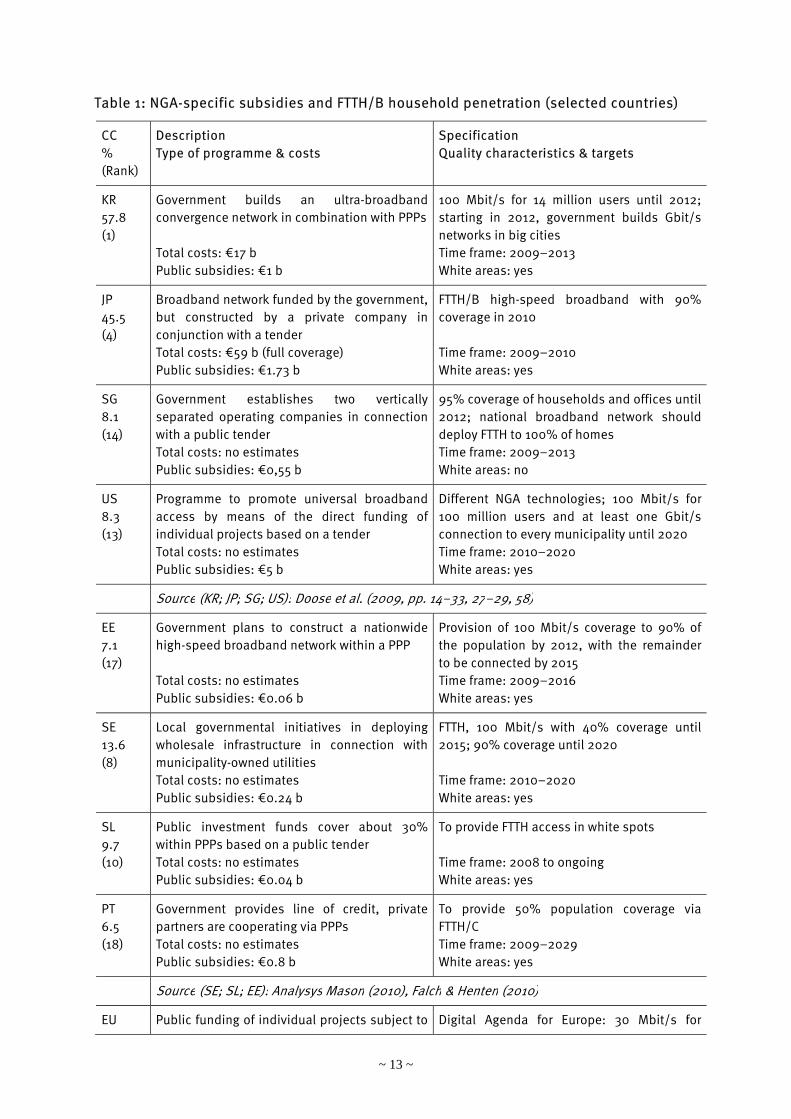
Table 1: NGA-specific subsidies and FTTH/B household penetration (selected countries)
CC % (Rank)
Description Type of programme & costs
SpecificationQuality characteristics & targets
KR 57.8 (1)
Government builds an ultra-broadbandconvergence network in combination with PPPs Total costs: €17 b Public subsidies: €1 b
100 Mbit/s for 14 million users until 2012;starting in 2012, government builds Gbit/s networks in big cities Time frame: 2009–2013 White areas: yes
JP 45.5 (4)
Broadband network funded by the government,but constructed by a private company in conjunction with a tender Total costs: €59 b (full coverage) Public subsidies: €1.73 b
FTTH/B high-speed broadband with 90%coverage in 2010 Time frame: 2009–2010 White areas: yes
SG 8.1 (14)
Government establishes two verticallyseparated operating companies in connection with a public tender Total costs: no estimates Public subsidies: €0,55 b
95% coverage of households and offices until2012; national broadband network should deploy FTTH to 100% of homes Time frame: 2009–2013 White areas: no
US 8.3 (13)
Programme to promote universal broadbandaccess by means of the direct funding of individual projects based on a tender Total costs: no estimates Public subsidies: €5 b
Different NGA technologies; 100 Mbit/s for100 million users and at least one Gbit/s connection to every municipality until 2020 Time frame: 2010–2020 White areas: yes
Source (KR; JP; SG; US): Doose et al. (2009, pp. 14–33, 27–29, 58)
EE 7.1 (17)
Government plans to construct a nationwidehigh-speed broadband network within a PPP Total costs: no estimates Public subsidies: €0.06 b
Provision of 100 Mbit/s coverage to 90% ofthe population by 2012, with the remainder to be connected by 2015 Time frame: 2009–2016 White areas: yes
SE 13.6 (8)
Local governmental initiatives in deployingwholesale infrastructure in connection with municipality-owned utilities Total costs: no estimates Public subsidies: €0.24 b
FTTH, 100 Mbit/s with 40% coverage until2015; 90% coverage until 2020 Time frame: 2010–2020 White areas: yes
SL 9.7 (10)
Public investment funds cover about 30%within PPPs based on a public tender Total costs: no estimates Public subsidies: €0.04 b
To provide FTTH access in white spots Time frame: 2008 to ongoing White areas: yes
PT 6.5 (18)
Government provides line of credit, privatepartners are cooperating via PPPs Total costs: no estimates Public subsidies: €0.8 b
To provide 50% population coverage viaFTTH/C Time frame: 2009–2029 White areas: yes
Source (SE; SL; EE): Analysys Mason (2010), Falch & Henten (2010)
EU Public funding of individual projects subject to Digital Agenda for Europe: 30 Mbit/s for

~ 14 ~
broadband/NGA state aid guidelinesPublic subsidies by EU member states: €3.3 b EU structural funds: €2.3 b
100% of households and 100 Mbit/s for 50%Time frame: 2010–2020 White areas: yes
Source: European Commission (2009, 2010a, 2011)
AU <<5
Government establishes new corporation,holds majority of shares during construction; vertical separation and PPP Total costs: €28.9 b Public subsidies: (at least) 50%
Up to 100 Mbit/s for 90–93% of fibre tohomes, workplaces and schools by 2018; wireless for remaining 7–10% with 12 Mbit/s Time frame: 2010–2018 White areas: yes
NZ <<5
Government establishes PPPs at local levels inconnection with a tender procedure subject to a vertical separation obligation Total costs €1.6 b Public subsidies: (at least) 50%
Up to 100 Mbit/s for 75% of population by2018 Time frame: 2010–2018 White areas: yes
Source (AU; NZ): Given (2010, p. 544)
3 Linear profit-sharing contracts for subsidizing NGA networks in the presence of asymmetric information
From the empirical evidence on the real-world contracts for NGA deployment projects
(Table 1), two features seem to emerge: First, all public authorities fix ex ante the level
of NGA expansion and other quality parameters. One might infer from this practice that
public authorities assume that they are well informed about the cost and demand
parameters of NGA projects and thus they consider the inefficiency bias due to
asymmetric information as negligible. This assumption might be justified in view of the
cumulated experiences of the sector-specific regulation of first-generation
infrastructure for more than a decade now. However, owing to the specific risks and
uncertainties inherent in the migration towards second-generation NGA infrastructure
and future broadband services, the validity of such a line of reasoning seems to be
limited. Generally, regulators, let alone local and regional governments, always have
less information than private firms about the benefits and costs of deploying and

~ 15 ~
operating (NGA) networks, which gets reinforced in view of the current transitional
process. In particular, there seems to be high information asymmetry about the level of
total capital costs, i.e. capital expenditure (CAPEX) at the project start and during
network expansion plus the cost of capital/required rate of return). Note that the risk
premium to be included in the cost of capital depends on a multitude of uncertainties
about wholesale and retail demand, cost conditions and technological progress and
regulatory and market dynamics. (European Commission (2010b, Appendix, section 6).
In particular, demand and willingness to pay for future NGA services seem to still be
highly uncertain for potential investors, and even more so for public authorities,15 and
demand uncertainty thus constitutes a major source of the overall risk associated with
the NGA rollout (dot.econ, 2012, pp. 51–55). With increasing and non-systematic risks,
investors will require a higher expected return, which increases the costs of capital. The
latter, however, which is largely unknown by the public authority, is decisive for the
optimal network size. A small change in the required return on capital for the NGA
provider can have a significant impact on the decision of whether to build the network
(wik consult, 2008, para 21).
Second, the implemented claw-back rules apply profit caps, which leave all downside
risks to the NGA provider but limit its upside earning potential. This rule discriminates
15 See Weyl and Tirole (2012). The authors theoretically explore the best way to reward innovation by
examining different mechanisms such as patent protection in order to determine consumers’
willingness to pay for a certain project. In doing this, the authors also assume that firms are better
informed about consumers’ willingness to pay than the public authority.
~ 16 ~
against riskier NGA projects that show more uncertain and variable returns but are
nevertheless socially desirable. Furthermore, a benchmarking of realized profits
compared with the industry average causes further verification costs and increases the
regulatory risk for the NGA provider because it is uncertain about what future profits to
expect.
In section 3.1, we set up the baseline model with complete information by the public
authority about capital costs. In section 3.2, we construct the optimal linear contract
under incomplete information about capital costs. Linear profit-sharing contracts are
not only easy to implement but also considered to be especially robust and therefore
suitable for situations that involve a high degree of uncertainty about future demand
and costs.16 Furthermore, the linear sharing of realized earnings does not discriminate
against riskier projects because the public authority not only receives a constant share
of the NGA provider’s profits but also participates in its losses in the same proportion.
3.1 The baseline model with complete information
We will analyze the public financing of an NGA network in a region where such a
network would not be commercially viable (white area). The public authority has 16 Linear contracts are considered to be more “robust” compared with non-linear contracts. Caillaud et
al. (1992) analyze the case when profits are influenced not only by the agent’s decision but also by
exogenous stochastic shocks. They show that the principal needs less information about the
distribution of the exogenous shocks when using contracts that are linear in realized profits.
Diamond (1998) shows that linear profit-sharing contracts achieve a higher level of welfare when the
agent has to decide on more than one variable (e.g. the size and quality characteristics of an NGA
network).

~ 17 ~
nevertheless an interest to engage an NGA provider for its construction for the reasons
outlined in section 2.2.
Let us assume that e stands for the expansion level of the NGA network with 0 ≤ e ≤ 1. If
e = 0, the NGA network will not be built at all and if e = 1, the network covers the whole
region. The marginal social surplus that can be achieved from each further unit of
expansion is set to 1. This surplus includes both the private users’ utility and the
positive external effects of the NGA rollout. To emphasize the importance of regional
cohesion (digital divide), each marginal increase in network coverage has the same
social value for the public authority.
The NGA provider expects to earn revenues R(e) = (r + ε)e from private users. The
expected marginal revenue r is constant and 0 < r < 1 but uncertain, where ε is a random
term with the expected value E(ε) = 0. Future demand and revenues are uncertain
because it is not known to which degree users will take up high-speed broadband
services. The construction of the NGA network causes capital costs in the amount of
C(e) = βv(e) + μ.17 Assume that the capital cost parameter β > 0, βv(0) = 0, βv´(e) > 0,
βv´(0) < 1 and βv´´(e) > 0. The random term μ with the expected value E(μ) = 0
represents exogenous cost risks that cannot be influenced by the NGA provider. The 17 To simplify the model, operating expenditure (OPEX, such as administration, personnel, right-of-way
costs, backhaul connection, network maintenance and troubleshooting or subscriber acquisition and
marketing) are set to zero. It seems to be reasonable to assume that the public authorities should
have good knowledge about the level of operating costs because those costs should not differ
significantly between NGA providers. Furthermore, realized OPEX can be reliably verified from the NGA
provider’s cost accounts.

~ 18 ~
capital costs include CAPEX as well as the required rate of return that the private
investor expects from this project taking account of the demand and cost risks.18
Besides revenues from private users, the NGA provider will receive a public transfer T to
finance the capital costs that cannot be covered from these revenues. This gives the
following profit function:
(1) )()( eCTeRU
The public authority includes in its welfare function W the benefits from NGA expansion
e, the expected expenditure re from consumers as well as its own expenditure T. The
welfare function does not include the NGA provider’s profit U because real-world
regulators do not want to allow any excess profits for the NGA provider beyond a
reimbursement of the incurred capital costs (see section 2.3). If the public authority
had complete knowledge about the capital costs, the optimal levels of network
expansion and transfer would be derived as follows subject to the constraint that the
NGA provider has to expect a non-negative profit U:
(2) maxe,T
W e re T
s.t. 0 evreT
Accordingly, the necessary first-order condition for expansion is βv’(e) = 1. The
marginal cost of network expansion must be equal to the marginal benefits of network
expansion. Let e* denote the solution to (2). The optimal transfer T is then given by:
18 The required rate of return will depend on the refinancing costs of the NGA provider on the capital
markets (e.g. evaluated based on the Capital Asset Pricing Model).
~ 19 ~
(3) ** reevT
Thus, the NGA provider is only reimbursed its expected losses from the expansion e* to
minimize the burden on the public budget.
3.2 Linear profit-sharing contract with incomplete information about capital costs
The public authority and NGA provider sign a contract before the investment starts. The
contract grants a subsidy that increases with the level of network expansion and
imposes a sharing of the accounting profits that are realized by the NGA provider from
the operation of the constructed NGA network. This means that the public authority
receives a constant share of realized profits and takes up a similar share of realized
losses.
In the contracting stage, the public authority has incomplete information about the
NGA provider’s capital costs βv(e). Whereas v(e) is assumed to be public knowledge,
the public authority has no precise knowledge about the type parameter β but only
knows that the NGA provider is some type , . The beliefs held by the public
authority are described by the continuous distribution F(β) with density f(β) on the
interval , with 0 and f(β) > 0 for all β. As is generally the case, the NGA
provider’s capital costs also cannot be verified based on the published accounts.
Although certain capital cost items (e.g. amortization, depreciation, interest payments
on loans) are recorded in the accounts, the required rate of return on equity is neither
included in the accounts nor can it be verified in any other way (it remains private
company information). Furthermore, as explained in more detail in section 4.2,

~ 20 ~
depreciation and amortization costs are often prone to accounting manipulations. To
make the contract robust against any accounting manipulations, the contract will only
depend on the EBITDA (= earnings before interest, tax, depreciation and amortization)
of the NGA provider, i.e. the operating profit as the difference between revenues and
operating costs. The contract can therefore be implemented based on readily available
and robust data (i.e. the level of network expansion e and accounting profit EBITDA).
The public authority grants a subsidy of (1 - r), i.e. the expected difference between the
marginal social surplus and marginal private revenue, for each further unit e of network
expansion. Thus, the NGA provider will earn – for a given expansion level of e – a total
income of e(1 + ε), that is the sum of the realized revenue R(e) = (r + ε)e and of the
public subsidy (1 - r)e. As operating costs are assumed to be zero, the accounting profit
EBITDA will equal the total income of e(1 + ε). Based on the realized EBITDA, the NGA
provider will have to pay taxes at a tax rate 1,0t . Furthermore, the public authority
imposes a lump-sum tax z on the NGA provider. Putting the public subsidy and tax
payments together, the public authority offers the following linear contract T(e) to the
NGA provider:
(4) zetereT )1()1()( .
Under the given linear contract, the NGA provider has to solve the expansion level e
that maximizes its expected profit U:
(5) e
max evzetevreeTEU 1)(
~ 21 ~
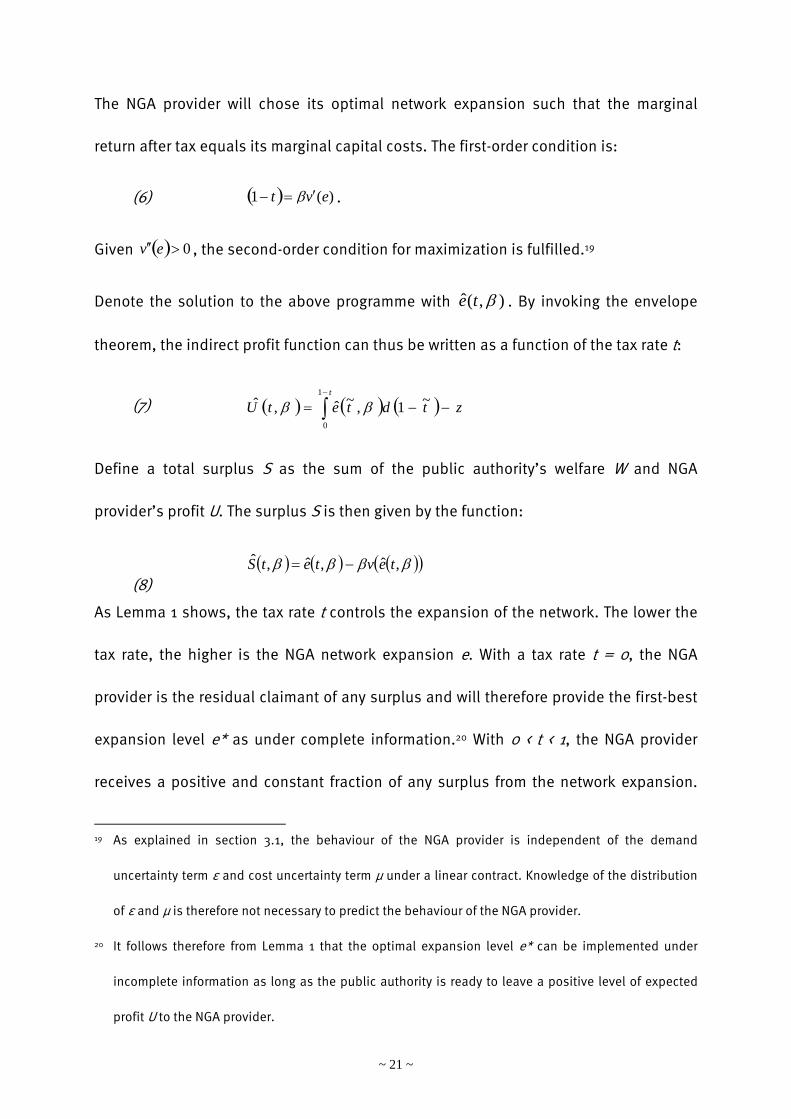
The NGA provider will chose its optimal network expansion such that the marginal
return after tax equals its marginal capital costs. The first-order condition is:
(6) )(1 evt .
Given 0 ev , the second-order condition for maximization is fulfilled.19
Denote the solution to the above programme with ),(ˆ te . By invoking the envelope
theorem, the indirect profit function can thus be written as a function of the tax rate t:
(7) ztdtetUt
1
0
~1,~ˆ,ˆ
Define a total surplus S as the sum of the public authority’s welfare W and NGA
provider’s profit U. The surplus S is then given by the function:
(8) ,ˆ,ˆ,ˆ tevtetS
As Lemma 1 shows, the tax rate t controls the expansion of the network. The lower the
tax rate, the higher is the NGA network expansion e. With a tax rate t = 0, the NGA
provider is the residual claimant of any surplus and will therefore provide the first-best
expansion level e* as under complete information.20 With 0 < t < 1, the NGA provider
receives a positive and constant fraction of any surplus from the network expansion.
19 As explained in section 3.1, the behaviour of the NGA provider is independent of the demand
uncertainty term ε and cost uncertainty term μ under a linear contract. Knowledge of the distribution
of ε and μ is therefore not necessary to predict the behaviour of the NGA provider.
20 It follows therefore from Lemma 1 that the optimal expansion level e* can be implemented under
incomplete information as long as the public authority is ready to leave a positive level of expected
profit U to the NGA provider.

~ 22 ~
Based on the tax rate t, the realized profit is shared ex post between the public
authority and NGA provider. With a tax rate t = 1, the NGA provider does not participate
in the surplus and will thus not invest in the network. Contrary to an ex ante mandated
network size by the public authority, the NGA provider will optimally adjust the
expansion level e to its capital costs. As shown in Lemma 1, a more efficient NGA
provider will expand further and achieve a higher rent as well as a higher surplus for
any given tax rate t < 1.
Lemma 1: Given 1 - t > 0, the optimal expansion ),(ˆ te , the profit ,ˆ tU as well as the
surplus ,ˆ tS decrease in the tax rate t and the type ß.
Proof: See Appendix.
The NGA provider will only enter into the contract given that it receives a non-negative
profit 0,ˆ tU . Lemma 1 showed that for a given contract, a more efficient type
achieves a higher rent. Given that the marginal surplus of network expansion is
positive at e = 0, even for the most inefficient type of NGA provider (i.e. 1 v 0 0),
the public authority wants to undertake network expansion in any case. Thus, the
individual rationality constraint 0,ˆ tU can only be binding for type . Denote the
optimal expansion of the most inefficient type with ,tete . The lump-sum tax z* is
therefore set in such a way that no rent is left to the most inefficient type, i. e. 0,ˆ tU
, which gives – using the utility function (7) – the optimal lump-sum tax:
(9)
t
tdtez1
0
~1~*
~ 23 ~
With hidden cost information, the entire rent can thus only be extracted from the most
inefficient type. All other types will enjoy a positive rent. The difference
,ˆ,ˆ,ˆ tUtUtU for is commonly called information rent. The
information rent of any type β can now be written – substituting the optimal lump-sum
tax (9) into (7) – as:
(10)
tt
tdtetdtetU1
0
1
0
~1~~1,~ˆ,ˆ
To find the optimal tax rate t*, the public authority has to maximize the expected value
of its welfare function ((2) and using (8)) over all types of β:
(11)
dFtUtSt ,ˆ,ˆmax
By using (6), (8) and (10) and defining the expected network expansion as
dFtee ,ˆ~ and the expected marginal tax reaction as
dFt
teet
,ˆ~ , the
first-order condition can be expressed as:
(12) eeet t ~~
Accordingly, the optimal tax rate must be set such that the NGA provider chooses an
expansion level at which the expected marginal gain in rent extraction ee ~ is equal
to the expected marginal loss in surplus ( tet~ ) from a further increase in network size.
If the public authority does not know the efficiency parameter ß, it will trade off the
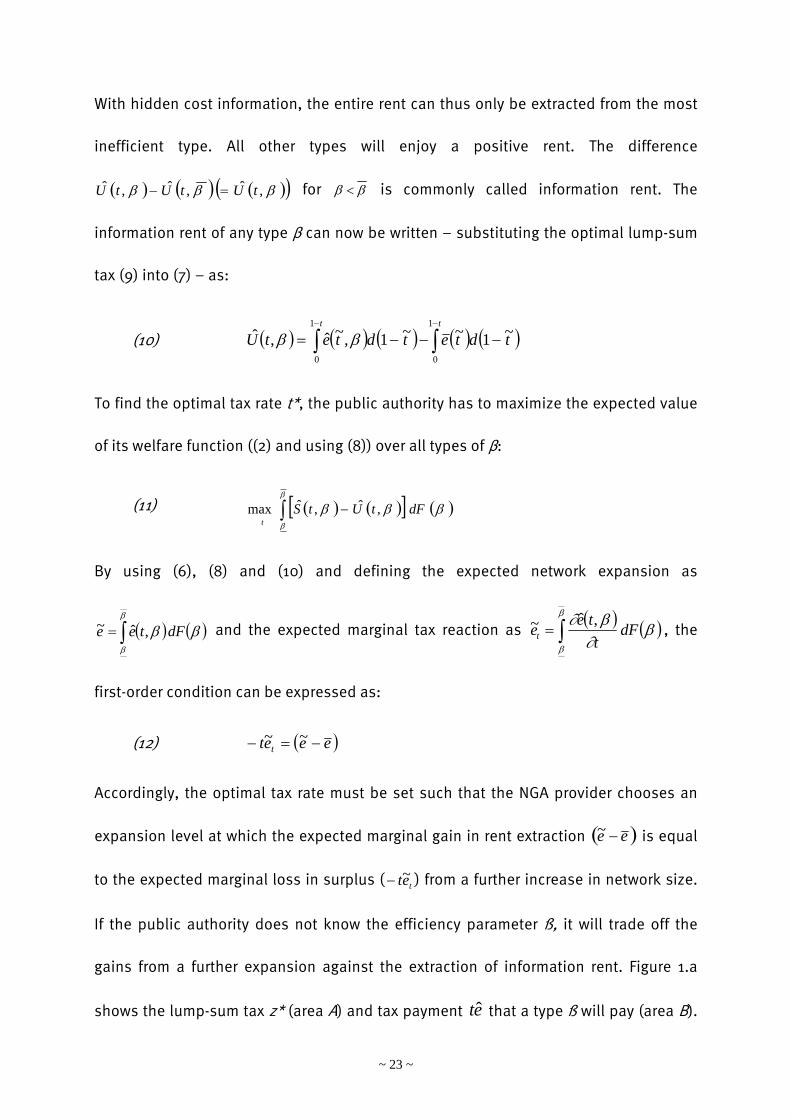
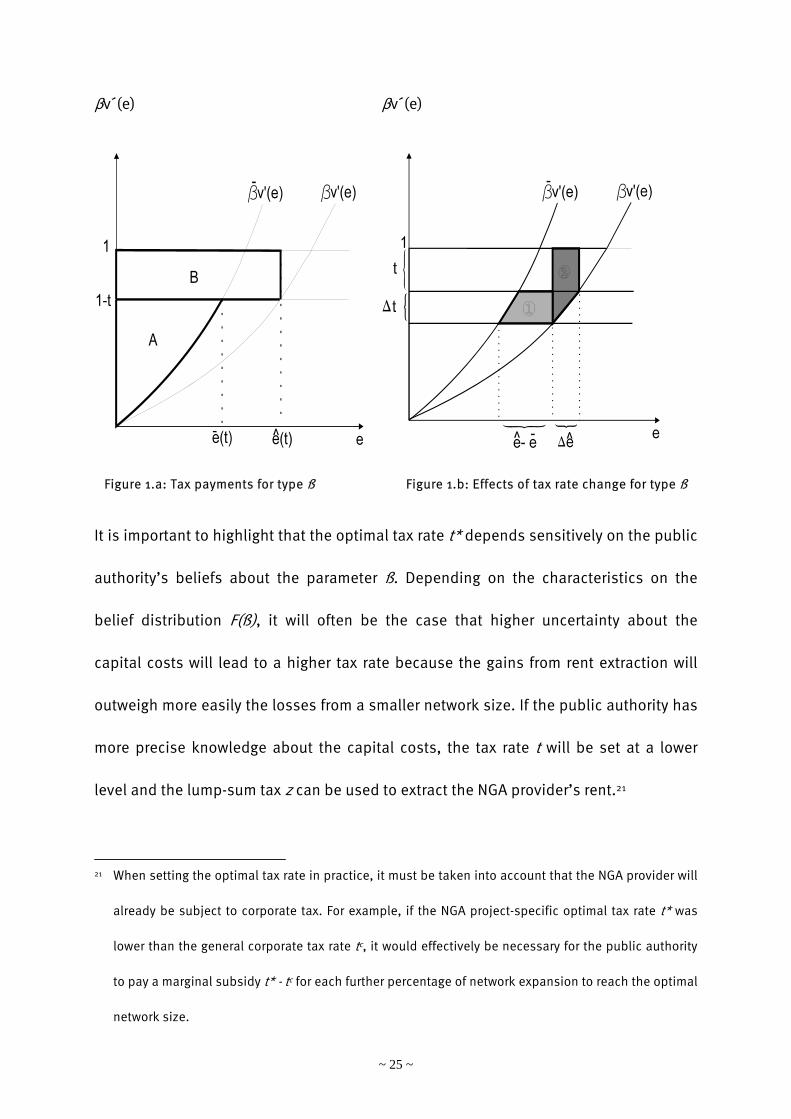
gains from a further expansion against the extraction of information rent. Figure 1.a
shows the lump-sum tax z* (area A) and tax payment etˆ that a type ß will pay (area B).

~ 24 ~
Remember that the lump-sum tax is optimally chosen such that when the NGA provider
is of type , it will earn no rent. The public authority will be able to extract more rent in
the approximate magnitude of tee ˆ from a type if the tax rate is increased by
t . See area in Figure 1.b for the marginal gain in rent extraction for a single type
. However, the public authority also loses surplus from the decreased network
expansion in the approximate magnitude of tet t ˆ . See area in Figure 1.b for the
loss in efficiency for a single type .
In the next proposition, it is shown that the optimal tax rate must lie between 0 and 1.
This states that a necessary condition for optimality is that ex post profit sharing takes
place. It is optimal to sacrifice network expansion for the reduction of information rent.
Under the optimal linear contract, any type – except the most inefficient one – will
enjoy a positive rent U. Any type will build a smaller network than the first-best
expansion e*(ß).
Proposition 1: The optimal tax rate satisfies 1 > t* > 0.
Proof: See Appendix.
~ 25 ~
βv´(e) βv´(e)
Figure 1.a: Tax payments for type ß Figure 1.b: Effects of tax rate change for type ß
It is important to highlight that the optimal tax rate t* depends sensitively on the public
authority’s beliefs about the parameter ß. Depending on the characteristics on the
belief distribution F(ß), it will often be the case that higher uncertainty about the
capital costs will lead to a higher tax rate because the gains from rent extraction will
outweigh more easily the losses from a smaller network size. If the public authority has
more precise knowledge about the capital costs, the tax rate t will be set at a lower
level and the lump-sum tax z can be used to extract the NGA provider’s rent.21
21 When setting the optimal tax rate in practice, it must be taken into account that the NGA provider will
already be subject to corporate tax. For example, if the NGA project-specific optimal tax rate t* was
lower than the general corporate tax rate tc, it would effectively be necessary for the public authority
to pay a marginal subsidy t* - tc for each further percentage of network expansion to reach the optimal
network size.

~ 26 ~
4 Main results and policy implications
The results of the theoretical model call for three immediate changes in the practical
design of contracts for the public financing of NGA networks.
4.1 Endogenous determination of NGA coverage and quality characteristics
As the empirical evidence in section 2.3 showed, public authorities typically predefine
the relevant quality parameters of network expansion. However, such a top-down
approach is not efficient in the presence of asymmetric information about NGA
deployment costs. The theoretical analysis showed that the optimal contract delegates
the decision concerning the expansion level e22 to the much better informed NGA
provider. Public authorities must therefore refrain from determining themselves the
size and quality characteristics of NGA networks but rather design a contract that
contains the appropriate incentives for the provider to optimally deploy the NGA
network with regard to its social benefits and costs. The NGA provider must have the
flexibility to determine the network size based on its superior cost information and it
must be accordingly rewarded for its performance.
4.2 Linear profit sharing as a simple and robust claw-back mechanism
The public authority is confronted with a trade-off between maximizing network
coverage and minimizing total NGA project costs as well as the profits of the provider.
To save public funds, it is recommendable to share the realized profits ex post such 22 The decision variable e could equally be interpreted as the NGA network’s bandwidth level (Mbit/s).
Thus, the public authority would design a contract to leave the NGA provider the choice between the
different quality levels in terms of bandwidth technologies (FTTC/B/H).

~ 27 ~
that the agent is also the residual claimant of the overall profitability of the project. In
this respect, linear profit-sharing contracts seem to be particularly attractive because
they are easily implementable at low information requirements.
Real-world examples of claw-back mechanisms (as cited in footnote 14) are complex
because they will only kick in if the provider realizes high profits because of, say,
higher than expected demand or better performance than the industry average. Thus,
the public authority has to monitor ex post the realization of several variables and
calculate the amount of profit that is deemed to be “excessive”. In practice, it will not
be easy to verify ex post whether the provider has performed better or worse than the
industry average. Such ex post benchmarking will at least incur costs for expert studies
or lead to lengthy legal proceedings subject to a high degree of asymmetric information
and unpredictable decisions.
On the contrary, the proposed linear profit sharing can be easily implemented. The tax
payment only depends on the EBITDA that the NGA provider records in its accounts. As
the tax payment is a constant share of the realized profit, the public authority does not
need to monitor any further exogenous variables (e.g. demand growth, cost trends and
industry-average profitability) to determine when profit sharing must kick in as with the
non-linear claw-back rules (footnote 14).
Moreover, as a linear sharing rule does not put an absolute cap on realized profit, the
NGA provider will always earn an additional profit from further investment. The linear
sharing rule offers better incentives and the NGA provider has more certainty about the
level of realized profit that it can expect. The emphasis on absolute caps for realized
~ 28 ~
profits by real-world regulators (e.g. European Commission, 2013, para 79 i) therefore
seems to be misplaced because it only generates verification costs and increases the
regulatory risk for the NGA provider.
Finally, with a view to having a robust accounting measure for realized profit, the
contract has been based on the EBITDA. Contrary to the EBIT (= earnings before interest
and tax), it is less prone to accounting manipulations because the public authority
does not need to verify whether amortization and depreciation costs were correctly
recorded in the accounts. For example, an NGA provider that has vertically split its
operations (e.g. network construction business, wholesale operations and retailing)
into separate legal entities would be able to shift amortization and depreciation costs
between those entities by manipulating the transfer prices between them. If the EBIT
were used as a tax base, the public authority would need to additionally monitor those
transfer prices to verify that the recorded EBIT took proper account of amortization and
depreciation costs.23
Furthermore, as profit sharing is based on the EBITDA, the NGA provider remains the
residual claimant of any savings in capital costs and has no incentive to decrease its
efforts to control those costs.
23 If amortization and depreciation expenses were verifiable accounting costs (e.g. the NGA provider
could not hide profits by invoicing higher than actually incurred CAPEX), tax could also be based on
the EBIT. In this case, let v(e) denote the publicly known amortization and depreciation costs and γ
the rate of return on which the public authority has ex ante incomplete information. The profit
function (5) would then read as follows: U(e) = (1-t)(e-v(e))-z-γv(e).

~ 29 ~
4.3 Menu of linear profit-sharing contracts at low information costs
The public authority will achieve a Pareto improvement if it offers an additional linear
profit-sharing contract – which has a higher lump-sum fee and a lower tax rate than the
original contract – to the NGA provider. Both the public authority and the NGA provider
will be better off if the NGA provider chooses the additional option because of a
reduction in the transfer T and an increase in the NGA provider’s profit U. Similar to the
literature on non-linear pricing, this menu will be called a Pareto-dominating menu of
contracts (Brown & Sibley, 1986, chapter 4).24
Note that the information requirements for the design of a Pareto-dominating menu of
contracts are very low. A Pareto-dominating menu can be constructed based only on
the public authority’s belief about the expansion level of the most efficient type under
the first contract. There is no need for further information about the properties of the
capital cost function βν(e). The information requirements are thus much less
demanding than those for the design of an optimal single linear contract under
asymmetric information.
Lastly, to reduce information rent even further, the public authority could organize a
tender. The considerations on linear profit sharing can be fully carried over to the
24 See Laffont and Tirole (1993) for the design of an optimal linear contract menu in a different
regulatory setting. Miravete (2007) shows that depending on the shape of the distribution function
F(β), a linear contract or a simple menu with two options can achieve a significant share of
information rent (e.g. above 90%) for the public authority. Adding more options to the menu will only
yield minor additional gains.

~ 30 ~
design of auctions: the public authority will not simply ask the bidders for the lowest
subsidy but choose from a menu of linear contracts with different pairs of marginal
subsidies (1 - t) and average transfer payments (T/e). To win the tender, the most
efficient NGA provider will choose the contract with the highest marginal return (1 - t) in
exchange for the lowest average transfer payments (T/e).
5 Further policy considerations
The foregoing section presented the advantages that directly follow from the proposed
NGA subsidy scheme. This section analyzes the scheme with regard to further criteria
and discusses possible reasons against the use of linear profit sharing.
5.1 Risk allocation
In the case that NGA providers are risk-averse, it would be useful to compare the
position of a provider in a black area without any subsidy with that of a provider in a
white area who benefits from the proposed NGA subsidy scheme. NGA providers in
black areas assume all exogenous demand and cost shocks. To achieve investment
neutrality and a level playing field between the two areas, a risk-averse NGA provider in
a white area should not benefit from a more favourable risk allocation compared with
NGA providers in a black area.
The realized profits of an operator in a black area will be subject to the general
corporate tax. The proposed profit-sharing contract can be expressed as a supplement
to or a deduction from the corporate tax. If t* > tcorp, the provider will have to pay an
additional tax t* - tcorp on realized profits or will receive a respective subsidy on losses

~ 31 ~
compared with the general corporate tax to which a provider in a black area is
subject.25
In the case of t* > tcorp, the proposed NGA subsidy scheme provides an additional
hedging of downward risk, which may be appealing to risk-averse providers. However,
public authorities may dislike these additional loss coverage through public funds – in
particular with t* significantly higher than tcorp – in times of scarce public funds. The
NGA provider would also have to pay an appropriate risk premium to the public
authority.
A full analysis of risk allocation would need to take account of the risk preferences of
the NGA provider and public authority (e.g. a budget-constrained local public authority
may be more risk-averse than a private NGA provider) as well as the differences in
exogenous demand and costs risks between black and white areas.
5.2 Incentives for moral hazard by the NGA provider
To discuss incentives for moral hazard, it should be recalled that profit sharing is
based on the realized EBITDA. This means that while increases in accounted operating
25 For the definition of tcorp, it must be taken into account that the corporate tax rate is calculated based
on the EBIT and not the EBITDA and a comparison must be made with regard to the same tax base.
Furthermore, with regard to the treatment of losses in the general corporate tax, these losses will only
reduce the tax burden in later periods when profits will again be earned and the carried-forward
losses can be deducted from the tax bill. The implicit subsidy may therefore be higher depending on
the interest rate and possibility of fully offsetting losses against future profits.

~ 32 ~
costs will reduce the EBITDA, increases in accounted capital costs will leave the EBITDA
unchanged.
If t* is unequal to tcorp, an NGA provider that operates in both white and black areas will
have an incentive to shift overhead costs for the operations of NGA networks to the
area with the effectively lower tax rate. Additional verifications of accounts may
therefore become necessary but it should be difficult to justify differing allocations of
operating costs. However, some additional verification costs may be necessary
compared with a subsidy scheme without profit sharing.
With regard to capital costs, it has already been explained in section 4.2 that the
provider will have no incentive to inflate capital costs through accounting
manipulations or cost overruns because profit sharing is based on the EBITDA.26
5.3 Political economy
The main benefit of the proposed NGA subsidy scheme lies in its higher efficiency with
regard to the use of public funds. However, in the case that subsidies are managed at
local and regional levels but co-financed by national or supra-national funds, local
politicians may have an incentive to argue for an ex-ante fixed rollout target and be less
concerned about savings in public funds. As savings in public funds will benefit not
only the local budget but also the regional or national budgets, such savings may be of
less concern to the local electorate. In addition, there could be an aspect of a subsidy
race between the different regions, which may trump the savings in public funds. The
26 Only in the case that t* < tcorp would the NGA provider have an incentive to shift costs from white area
to black area accounts.

~ 33 ~
local electorate may respect that more public funds have been secured for their region.
Finally, a fixed target promising high-speed broadband for all areas and households is
much more attractive to communicate than contracts based on more subtle efficiency
considerations. This also allows clear communication to the local electorate and
enables local politicians to show that they have fulfilled their promised targets.
6 Summary and final remarks
Our analysis, which connects recent studies of public financing and investment of new
communications infrastructure with the traditional literature on regulatory theory under
asymmetric information, presented in detail the inefficiencies involved in the previous
practice of NGA subsidy programmes. The analysis indicates that these inefficiencies
will depend on the extent of asymmetric information. Compared with simple linear
profit-sharing contracts, it is not optimal that the public authority mandates an NGA
deployment project of a certain size or quality given its asymmetric information on
capital costs. However, it must be noted that the European Commission (2012) now
puts more emphasis on efficiency incentives for public service contracts, as in its new
Framework on state aid for the compensation for public service obligations, it requires
that public authorities include efficiency incentives when granting state aid to large
public service providers. The proposed linear profit-sharing contracts are good
examples of how to put better efficiency incentives into practice but at the same time
still limit the burden on the public budget. It should be hoped that more innovative
contracts will accordingly be implemented.

~ 34 ~
This analysis was subject to the basic premise that public subsidies for NGA
deployment are necessary and socially desirable. However, funding and cooperation
has become more complex in the case of second-generation networks, as any
subsidies also involve the risk of distorting already established competitive market
developments based on first-generation infrastructure as well as ex ante investment
incentives. Public funds should crowd in but not crowd out any private NGA investment.
Accordingly, public subsidies should not be on the funding agenda for black areas. For
grey areas, with one network already in place, government intervention should be
feasible only in exceptional cases, since there is a high risk of market distortions in
such situations (European Commission, 2013).
Given these warnings in terms of the relevant safeguards for competition and in view of
the basic result of our analysis and the related theoretical literature (Jullien et al.,
2010), one should opt for a narrowly defined role for governments in subsidizing NGA
projects. The efficient amount of government intervention should be determined
endogenously in response to actual costs and demand and be restricted to white areas
only.

~ 35 ~
Appendix
Proof of Lemma 1: The first-order condition (6) evaluated at the optimal expansion
,ˆ te and differentiated with respect to t gives 0ˆ
.1 t
ev
.
From this, it follows that 0ˆ
t
e
. Differentiating ztdtetU
t
1
0
~1,~ˆ,ˆ with
respect to t gives 0,ˆˆ
tet
U . Differentiating ,ˆ,ˆ,ˆ tevtetS with
respect to t gives 0ˆ
1ˆ
t
ev
t
S
.
This is because from the first-order condition the marginal costs of expansion (.)ev
are equal to 11 t . The proof is similar for the comparative statics in relation to type
. Q.E.D.
Proof of Proposition 1: By using (8) and (10), (11) can be rewritten as
(13)
dFtdtetdtetevtett
t
1
0
1
0
)~1(~)~1(,~ˆ),ˆ(),(ˆmax
The first-order condition with respect to the tax rate reads as follows, using
evt 1 from (6):
(14)
0ˆˆ
dFeet
et

~ 36 ~
(a) With 1t , the NGA provider will not build any network. The value of the welfare
function
dFUS ,1ˆ,1ˆ thus equals zero. With any tax rate 01 t , welfare
is greater than zero.
(b) By using the definitions for average network expansion and marginal tax reaction,
(14) simplifies to (12). Evaluated at 0t , the derivative 0~
0
eedt
d
t
. Average
expansion is greater than the expansion by the most inefficient type because 0ˆ
e
from Lemma 1. Q.E.D.
Proof of Proposition 2: (a) It is established that there exist types who accept the
contract eT2 . A type will choose contract eT2 given that 0,ˆ,ˆ12 TUTU .
This is equivalent to writing that the change in the profit resulting from the change in
the tax rate must be at least equal to the change in the lump-sum tax,
121
1
1
)()~1(,~ˆ2
1
etttdtet
t
.
For the most efficient type, the left-hand side is strictly greater than the right-hand side.
The right-hand side is positive because it represents the change in the utility resulting
from the change in the tax rate for 1e units of expansion. From Lemma 1, it is known
that the rent is decreasing in the tax rate. Therefore, the left-hand side is also positive.
Furthermore, it is known from Lemma 1 that the NGA provider will supply a higher
expansion at the lower tax rate 2t . Remember that by definition the NGA provider’s
expansion efforts with the higher tax rate 1t is equal to the expansion level 1e . The left-

~ 37 ~
hand side is therefore greater than the right-hand side by the surplus achieved by the
higher network expansion with the contract eT2 than 1e units with the contract eT1 .
(b) It is now shown that the contract eT2 leads to a reduced amount of T. Let ie and iT
denote the expansion level and transfer under the respective contract i. It must be that
21 TT , which is equivalent to 2211121 ˆˆ etetett .
This expression is fulfilled as long as the tax imposed on the network expansion
increases or at least does not decrease by more than the increase in the lump-sum fee
z. The foregoing expression can be rearranged – by using 1212 ˆˆˆˆ eeee – to
1221121 ˆˆˆ eeteett .
As it is known from Lemma 1 that 0ˆ
t
e
, it follows that the right-hand side is positive.
The left-hand side is zero for the most efficient type because of the definition
,ˆ 11 tee . It is negative for any other type because 0ˆ
e as known from Lemma 1.
Q.E.D.

~ 38 ~
References
Analysys Mason (2008), The Costs of Deploying Fibre-Based Next-Generation
Infrastructure, Final Report (12726-371), Available from
http://www.ictregulationtoolkit.org/en/Publication.3971.html.
Armstrong, M. & D. Sappington (2007), Recent Developments in the Theory of
Regulation, in: Armstrong, M. & R.H. Porter (Eds.), Handbook of Industrial
Organization, Amsterdam.
Armstrong, M. & D. Sappington (2006), Regulation, Competition and Liberalization,
Journal of Economic Literature 44, 325–366.
Bauer, J.M. (2010), Regulation, Public Policy, and Investment in Communications
Infrastructure, Telecommunications Policy 34, 65–79.
Belloc, F., Nicita, A., & M.A. Rossi (2012), Whither Policy Design for Broadband
Penetration? Evidence from 30 OECD Countries, Telecommunications Policy 36,
382–398.
Briglauer, W. (2014), The Impact of Regulation and Competition on the Adoption of
Fiber-Based Broadband Services: Recent Evidence from the European Member
States, Journal of Regulatory Economics (forthcoming).
Briglauer, W., Ecker, G. & K. Gugler (2013), The Impact of Infrastructure and Service-
Based Competition on the Deployment of Next Generation Access Networks:
Recent Evidence from the European Member States, Information Economics and
Policy 25, 142–153.
Brown, S. & D. Sibley (1986), The Theory of Public Utility Pricing, Cambridge.

~ 39 ~
Caillaud, R., Guesnerie, R. & P. Rey (1992), Noisy Observation in Adverse Selection
Models, Review of Economic Studies 59, 595–615.
Cambini, C. & Y. Jiang (2009), Broadband Investment and Regulation: A Literature
Review, Telecommunications Policy 33, 559–574.
Cave, M. & I. Martin (2010), Motives and Means for Public Investment in Nationwide
Next Generation Networks, Telecommunications Policy 34, 505–512.
Czernich, N., Falck, O., Kretschmer, T. & L. Woessmann (2011), Broadband
Infrastructure and Economic Growth, Economic Journal 121, 505–532.
Diamond, P. (1998), Managerial Incentives: On the Near Linearity of Optimal
Compensation, Journal of Political Economy 106, 931–957.
Doose, A.M., Elixmann, D. & S. Jay (2009), Breitband/Bandbreite für Alle: Kosten und
Finanzierung einer Nationalen Infrastruktur, wik-Discussion Paper 330, Bad
Honnef.
dot.econ (2012), Regulatory Policy and the Roll-out of Fibre-to-the-Home Networks,
Report Prepared for the FTTH Council Europe, London, Available from
http://www.dotecon.com/news/fibre-to-the-home-council-europe-publishes-
dotecon-report/.
Engel, E., Fischer, R. & A. Galetovic (2013), The Basic Public Finance of Public-Private
Partnerships, Journal of the European Economic Association 11, 83–111.
Engel, E., Fischer, R. & A. Galetovic (2001), Least-Present-Value-of-Revenue Auctions
and Highway Franchising, Journal of Political Economy 109, 993–1020.

~ 40 ~
European Commission (2013), EU Guidelines for the Application of State Aid Rules in
Relation to the Rapid Deployment of Broadband Networks, Official Journal
C/25/2013, Brussels.
European Commission (2012), Commission Framework on Compensation for Public
Service Obligations, C/8/2012, Brussels.
European Commission (2011), State Aid: Commission Approves Record Amount of State
Aid for the Deployment of Broadband Networks in 2010, Press Release IP/11/54,
Brussels.
European Commission (2010a), Europe 2020: A Strategy for Smart, Sustainable and
Inclusive Growth, COM (2010)2020, Brussels.
European Commission (2010b), European Commission Recommendation on Regulated
Access to Next Generation Access Networks, September 2010, Brussels.
European Commission (2010c), State Aid N 53/2010 – Germany – Federal Framework
Program on Duct Support, Official Journal C/242/2010, Brussels.
European Commission (2010d). State Aid N 559/2009 – United Kingdom – North
Yorkshire – Next Generation Broadband, Official Journal C/316/2010, Brussels.
European Commission (2009), Community Guidelines for the Application of State Aid
Rules in Relation to Rapid Deployment of Broadband Networks, COM (2009)
235/04, Brussels.
European Regulators Group (2007), Opinion on Regulatory Principles of NGA, Brussels,
16rev2, Available from http://erg.ec.europa.eu/doc/publications/erg07_16rev2-
_opinion_on_nga.pdf.
~ 41 ~
Falch, M. & A. Henten (2010), Public Private Partnerships as a Tool for Stimulating
Investments in Broadband, Telecommunications Policy 34, 496–504.
FTTH Council Europe (2012a), Annual Report: April 2011 – April 2012, Available from
http://www.ftthcouncil.eu/documents/Reports/FTTHCE_AnnualReport_2011-
2012.pdf.
FTTH Council Europe (2012b), Creating a Brighter Future – FTTH Global Ranking,
Presentations and Reports, Available from
http://www.ftthcouncil.eu/resources?category_id=7.
Garbacz, C. & H. Thompson Jr. (2007), Mobile, Fixed Line and Internet Service Effects on
Global Productive Efficiency, Information Economics and Policy 19, 189–214.
Given, J. (2010), Take Your Partners: Public Private Interplay in Australian and New
Zealand plans for Next Generation Broadband, Telecommunications Policy 34,
540–549.
Gomez-Barroso, J. L. & C. Feijob (2010), A Conceptual Framework for Public-Private
Interplay in the Telecommunications Sector, Telecommunications Policy 34, 487–
495.
Holzleitner, C. (2001), Evolution of Regulatory Contracts – a Change for the Good? IFO
Studien 47, 365–385.
Huigen, J. & M. Cave (2008), Regulation and the Promotion of Investment in Next
Generation Networks – A European Dilemma, Telecommunications Policy 32, 713–
721.

~ 42 ~
Iossa, E. & D. Martimort (2008), The Simple Microeconomics of Public-Private
Partnerships, Working Paper, University of Toulouse.
ITU – International Telecommunications Union (2009), Developments of Next
Generation Networks (NGN): Country Case Studies, Geneva.
Jullien, B., Pouyet, J. & W. Sand-Zantman (2010), Public and Private Investments in
Regulated Network Industries: Coordination and Competition Issues, Review of
Network Economics 9, Art. 3.
Laffont, J.J. & J. Tirole (1993), A Theory of Incentives in Procurement and Regulation,
Cambridge.
Martimort, D. & J. Pouyet (2008), To Build or not to Build: Normative and Positive
Theories of Private-Public Partnerships, International Journal of Industrial
Organization 26, 393–411.
Miravete, E. (2007), The Limited Gains from Complex Tariffs, CEPR Discussion Paper No.
4235.
Neumann, K.H. (2010), Structural Models for NBN Deployment, wik Discussion Papers
342, Bad Honnef.
OECD (2009), Network Developments in Support of Innovation and User Needs,
DSTI/ICCP/CISP(2009)2/FINAL, December.
OECD (2008), Developments in Fibre Technologies and Investment,
DSTI/ICCP/CISP(2007)4/Final, April.
~ 43 ~
Röller, L.H. & L. Waverman (2001), Telecommunications Infrastructure and Economic
Development: A Simultaneous Approach, American Economic Review 91, 909–
923.
RTR – Austrian Regulatory Authority for Broadcasting and Telecommunications (2010),
Communications Report 2009, Vienna, Available from
http://www.rtr.at/de/komp/alleBerichte.
Tirole, J. & E.G. Weyl (2012), Market Power Screens Willingness-to-Pay, The Quarterly
Journal of Economics 127, 1971–2003.
Ventura Team & Portland Advisers (2012), Financing Stimulus for FTTH, Report Prepared
for FTTH Council Europe, Available from
http://www.ftthcouncil.eu/documents/Reports/FTTH_-Finance_Report.pdf.
wik consult (2012), NGA Progress Report, Report Commissioned by ECTA, Bad Honnef.
wik consult (2008), The Economics of Next Generation Networks, Report Commissioned
by ECTA, Bad Honnef.