eindhoven university of technology master accelerating the
TRANSCRIPT

Eindhoven University of Technology
MASTER
Accelerating the learning curve at ASMLthe effect of increased opportunities to learn
de Kadt, N.
Award date:2015
Link to publication
DisclaimerThis document contains a student thesis (bachelor's or master's), as authored by a student at Eindhoven University of Technology. Studenttheses are made available in the TU/e repository upon obtaining the required degree. The grade received is not published on the documentas presented in the repository. The required complexity or quality of research of student theses may vary by program, and the requiredminimum study period may vary in duration.
General rightsCopyright and moral rights for the publications made accessible in the public portal are retained by the authors and/or other copyright ownersand it is a condition of accessing publications that users recognise and abide by the legal requirements associated with these rights.
• Users may download and print one copy of any publication from the public portal for the purpose of private study or research. • You may not further distribute the material or use it for any profit-making activity or commercial gain

i
Eindhoven, November 2015
Accelerating the Learning Curve at
ASML
- the effect of increased opportunities to learn -
by ing. N. (Niki) de Kadt
Student identity number: 0761491
in partial fulfillment of the requirements for the degree of
Master of Science
in Innovation Management
Supervisors
Dr. T.J.G. Peeters, Eindhoven University of Technology
Prof. Dr. F. Langerak, Eindhoven University of Technology
Dr. A.A. Alblas, Eindhoven University of Technology/ASML F. Zwaans, ASML

ii
Eindhoven University of Technology (TU/e)
Faculty of Industrial Engineering & Innovation Sciences
Subject headings: learning curve, organizational learning, engineering changes, engineering
change management, impact of an engineering change, opportunities to learn, attention, team
diversity, cycle time management, new product development speed.
iii
Acknowledgements This Masters’ thesis presents the results of a research project in partial fulfillment of the degree of Master
of Science in Innovation Management at the Eindhoven University of Technology. First and foremost, I
would like to thank my supervisors Alex Alblas and Thijs Peeters for their support. Alex, for your ever
challenging and inspiring sparring sessions, although it sometimes felt they brought me back to square one,
your ideas always helped me to take the next step with more ease. Your head on approach taught me how
to apply my skills and knowledge in a business environment. Thijs, for your flexibility and quality of your
feedback, for your great skill to give just enough information in order to let me find my own way. Due to
this approach you contributed significantly to the steepness of my learning curve.
The company culture of ASML made me realize how important it is to always keep asking questions. Staying
critical, sharing knowledge, and asking questions leads to valuable new insights. A big thanks to all
employees that allowed me to pick their highly intelligent brains. More specifically, I would like thank Fränk
Zwaans for giving me the opportunity to stay at ASML. His down to earth view of what running an
innovative manufacturing facility is and his way of illustrating these company processes in layman’s terms
were refreshing and enlightening. Furthermore, thanks to the guys of the BE group, in particular with
providing your network to get me around ASML. During lunch breaks you certainly helped to reflect on the
goals of my projects. To the graduate boys, both a thanks and a you’re welcome. Especially for the insights,
encouragements, and the occasional moaning and groaning.
A very big thanks to all of the people who did not have a clue what ASML is about. Their questions and their
need for answers made me reflect on what I was doing and therefore made me understand ASML and my
own research better than before. Thanks to my mom and dad for accommodating a liberal and progressive
environment without which I couldn’t have found my own path. Of course I would like to thank my mom’s
skills to provide hotel like facilities at a five star level. To my siblings, thanks for letting me be the annoying
fellow that I know I can be.
I am thankful for all of my friends who made certain that I am a student for longer than planned. Not only
did they challenge me to keep setting ever more challenging goals, they also made sure I was sufficiently
hydrated with great combinations of malts, hops, yeast and water. Tim, thanks for asking me to join you on
the greatest trip of our lives. Daniel, thanks for inviting me to become a Blinky Boy.
Last, but not least, special thanks goes to my lovely girlfriend Iris, her rationality and solution oriented
approach towards coping with day to day life certainly helped me to stay focused when it was needed.
Having a business engineer at your side makes it a lot easier to just pour your heart out and get honest
advice back. I would like to say sorry for these months and months of student-like frugality that made it
sometimes hard to let of some steam. Thanks for always being at my side.

iv
Management Summary This Master’s thesis is built on two research areas that previously lacked depth and detail when they
met. Organizational Learning, more specifically Learning Curve Theory, and Engineering Change
Management could benefit from studies in which the areas are brought together. Our research tries to
uncover the conditions under which ECs contributes to learning, by researching the effects of
increasing the opportunities to learn during the generation and implementation of such an EC.
We set an academic goal that is two-fold. First of all, there is a need to better understand the
conditions under which ECs contribute to learning (Adler & Clark, 1991). By stepping away from the
aggregate forms of measurement (Argote, 2013), we can uncover the black box that Engineering
Change learning currently is. Second of all, it becomes clear from literature that claims made on how
to cope with changes, largely build on the use of case study research, could benefit from the use of
longitudinal data studies.
ASML is constantly striving for the introduction of new platforms capable of producing chips that are
faster, smaller and greener. In order to achieve these goals the company makes every effort to achieve
reductions in wavelength of light. In recent years this has led to a technology which makes use of
Extreme Ultra Violet light (EUV). This new product program is characterized by high complexity, low
maturity, and therefore long and unstable cycle times. Combined with the highly capital intensiveness
of this technology, the current level of work in progress (WIP), leads to liquidity issues. ASML is trying
to achieve reductions in the cycle times of their projects, it is necessary to reach this goal with an eye
on the future, by balancing speed and learning effects. We set the goal to deliver drivers of the
learning curve, while simultaneously researching related effects of EC-learning.
The research is based on a combination of quantitative and qualitative research. Our focus lies on
building a model that explains how and why learning occurs within the Engineering Change context at
ASML. Thus, we validate EC principles gathered from literature and empirical research with the use of
a statistical model. Research is of course an iterative process, we took steps to gain understanding
both research areas by reading up on existing literature. Simultaneously we tried to understand the
empirical setting by setting up explorative interviews with relevant employees of ASML. We combined
our obtained understanding of the context with documents on the EC process, IT tools, visits to the
factory floor, and we attended meetings relevant to the forthbringing of an EC. This process led to a
conceptual model incorporating different paths for EC learning, while testing the effect of increased
opportunities to learn with the help of moderators. All in all to answer the research question; What
role do Engineering Changes play in the relationship between experience and project cycle time (i.e. the
learning curve)?

v
Theoretical background
As organizations gain experience in the execution of their processes, the outcome parameters typically
decrease at a decreasing rate (Argote, 2013). This phenomenon has been described extensively in
literature and is called the learning curve. Learning curves are characterized in terms of a progress
rate, with each doubling of cumulative output the outcome parameter reduces with a certain
percentage. The use of moderators on a learning curve model is a good method to find conditions that
drive cycle time learning and performance (Wiersma, 2007). Main effects of the moderators tell us if
the number of ECs is influenced, while the interaction variable makes us conclude on the effect on the
learning rate.
Learning curves have been shown to vary in their learning rates (Dutton and Thomas, 1984). More
recent research focused on finding factors that explain the observed variation in these rates. The
aggregate form of measurement of factors that contribute to learning possibly masks that
organizational phenomena are implemented very differently in different contexts (Argote, 2013).
Research on the effect of ECs on learning lack detail, from the exact definition on page 11 we can
characterize ECs based on 1) their impact, 2) time taken, and 3) the number of people involved. The
engineering change process is there to remedy mistakes, integrate new parts or tweak the product
towards perfection due to overlapping development processes. Based on research of Argote et al.
(2003), in combination with various papers on how to reduce the negative effects of ECs (see table 2),
we propose that increasing the opportunities to learn during generation and implementation of ECs
leads to higher levels of learning. Lastly, we conclude our theoretical background with a summation
of the identified gaps.
Hypotheses
Based on said gaps we build up our model step by step. More specifically, we first test whether
project cycle time is a function of experience. Moreover, we expect that ECs partially explains the
progression of a learning curve with outcome measure project cycle time. Thus, we expect that ECs act
as mediator of the relationship experience and project cycle time. We fill one of the gaps by proposing
a decomposition of ECs, we expect that increased opportunities to learn during implementation of an
EC (i.e. operationalized by a split in expected impact) leads to higher levels of learning. Lastly, we
expect that higher of levels of Attention and Team Diversity (i.e. increased opportunities to learn
during generation) contribute to learning, while simultaneously leading to more ECs (i.e. main effects).
Results
Data was gathered from relevant IT tools, a total of more than 30.000 individual ECs were assigned to
the more than 900 machine projects. Results were calculated with the use of the estimation approach
of Hayes (2013). We translated our conceptual model (see fig. 5) into a statistical model, which led to a

vi
set of inferential tests to test the hypotheses. Noteworthy is the use of a bootstrapping method to test
the conditional effects at various values of the moderator based on a spotlight analysis (Spiller et al.,
2013). We started our statistical quest with a stepwise build up of the model (see appendix E section
4), revealing no immediate problems with the incorporation of variables. Thus, allowing us to test our
hypotheses in our proposed complete model (table 8).
A general overview of the hypotheses and results is presented in table 14. Firstly, our results show that
both learning paths through low impact as well as through high impact ECs significantly contribute to
learning. Thereby we can express our hunch that learning takes place at separate environments,
organizations learn due to deliberate engineering and via more autonomous processes. Secondly,
contrary to our expectations not high impact ECs but low impact ECs contribute significantly more to
the progression of the learning curve. This result is explained by the high influx of low impact ECs,
which overpower high impact ECs with a ratio of 8:1. Thirdly, higher levels of Attention do not lead to
more ECs, moreover they are detrimental to learning shown by the positive significant interaction
effects. Overall we expect that high levels of Attention (measured by the cycle times of ECs) could lead
to capacity problems and or codified knowledge becoming obsolete. On the other hand, and lastly,
Team Diversity does lead to higher learning. When ECs are handled by a growing number of business
functions the curve will progress more quickly. Moreover do they lead to a higher number of
Engineering Changes.
Conclusion
Thus, we can conclude that ECs do contribute to learning, part of the progression of the curve is
explained by their presence. Moreover, we have shown that although their beneficial effects are
dominant, ECs have a direct delaying effect on project cycle times. Furthermore, we demonstrated
that increasing the opportunities to learn during generation of an EC is beneficial to learning when
measured in Team Diversity. Higher levels of Attention are detrimental to learning, therefore we
advise to follow strategies proposed by Terwiesch and Loch (1999) to decrease EC cycle times and
Thomke and Fujimoto (2000) to strive for faster cycles of problem solving. We have added to the
literature by providing ways to test the effect of fine-grained characteristics of ECs on the learning
curve. Our model with several paths has shown that moderators have contrasting effects, expected
due to learning taking place in separate environments. Furthermore did we validate previously
untested strategies on how to cope with ECs, with the use of longitudinal data. Lastly, we have shown
that increasing the opportunities to learn is not always contributing to learning. The effects are not so
simple and more delicate than that, additional research is needed to understand the conditions under
which increasing the opportunities to learn leads to learning.

vii
List of Figures Figure 1 The relationship between labor hours and cumulative output p. 04
Figure 2 The relationship between ln of labor hours and ln of cumulative output p. 04
Figure 3 Concurrent engineering p. 09
Figure 4 Conceptual model with hypotheses p. 17
Figure 5 Implementation range choices p. 26
Figure 6 Supply chain of factories p. 27
Figure 7 ASML-Q p. 65
Figure 8 Conceptual model with substituted concepts p. 67
Figure 9 Statistical model p. 67
List of Tables List 1 List of figures p. vii
List 2 List of tables p. vii
List 3 Overview of abbreviations p. viii
Table 1 Six-step Engineering Change process p. 11
Table 2 Overview on recommendations for the management of EC p. 13
Table 3 Phases of the engineering change process p. 25
Table 4 Operationalisation of concepts p. 29
Table 5 Correlations p. 31
Table 6 Descriptive statistics p. 31
Table 7 Inferential tests p. 32
Table 8 Complete model p. 35
Table 9 Comparing specific indirect effects p. 36
Table 10 Conditional indirect effects at various values of the moderators p. 38
Table 11 Conditional indirect effects at various values of the moderators p. 39
Table 12 Formal test of moderated mediation p. 40
Table 13 Conditional direct effect at various values of the moderators p. 41
Table 14 Overview of hypotheses and results p. 43
Table 15 Redesign-overview p. 49
Table 16 Overview of interview quotes p. 60
Table 17 Available data and transformations p. 64
Table 18 Relationship interpretation table p. 68
Table 19 Columns corresponding to regression coefficients p. 72
Table 20 Statistical table for testing moderated mediation p. 72
Table 21 Stepwise build-up of the model p. 75

viii
List of Abbreviations The next overview presents all encountered abbreviations in this master’s thesis, if necessary a more
detailed description is given.
Abbreviation: Description: 12nc Code for part number ACE Developer and supplier of parts ASMI Advanced Semiconductor Materials International ASML Q Software program for keeping track of proposed changes AT Attention Avg Average BCI Bootstrap Confidence Interval BE Business Engineering BoM Bill of Materials CCB Change control board CIB Change implementation board CoG Co Cost of Goods CT Cycle time; more specifically the cabin (or project) cycle time (i.e.FASY – GSD) C-team Change-team D&E Development and engineering DNs Design notifications ecATavg Average Attention of ECs ECM Engineering change management ECOs Engineering change orders ECR Engineering change request EC(s) Engineering change(s) ecTDavg Average Team Diversity of ECs ECtotal Total number of ECs accepted/rejected during build-up of one project EE Electrical Engineering EF EUV Factory ETC Estimated time of completion EUV Extreme ultra violet EXP Experience FASY Final Assembly FAT Factory acceptance test FCO Field change order FLS First line support GSD Goods shipment date HI High impactHI ECs with implementation range WIP or FAT impactLO ECs with implementation range supply chain or stock IP Improvement proposal LC Learning Curve LN Natural log lnCT Natural log of the project cycle time lnEXP Natural log of Experience LO Low ME Manufacturing Engineering MF manufacturing Manufacturing department MQ Manufacturing quality MS Microsoft NPD New product development NPI New product introduction NPL New product logistics NXE Platform of photolithography systems using EUV-technology

ix
NXT Platform of photolithography machines coming after the XT-machines. Greatest
improvements lie in the wafer-stage PL Project leader PS Production support RAMS+C Reasons for change; Reliability, availability, manufacturability, serviceability + costs
RFC Reason for change TD Team Diversity TF Twinscan factory (i.e. XT and NXT) VBA Visual Basic for Applications (i.e. a programming language) VDL Developer and supplier of parts WIP Work in progress X Independent variable X XT Early Twinscan machines XTII Twinscan machines with incremental improvements compared to XT Y Dependent variable Y

x
Contents Acknowledgements ........................................................................................................................... iii
Management Summary ..................................................................................................................... iv
Theoretical background ............................................................................................................... v
Hypotheses ................................................................................................................................. v
Results ........................................................................................................................................ v
Conclusion ................................................................................................................................. vi
List of Figures .................................................................................................................................... vii
List of Tables ..................................................................................................................................... vii
List of Abbreviations ........................................................................................................................ viii
1. Introduction ................................................................................................................................1
2. Literature review .........................................................................................................................3
2.1. Learning curve theory ..........................................................................................................3
2.1.1. Learning rate – formula ................................................................................................4
2.1.2. Components of the curve .............................................................................................5
2.1.3. Organizations vary in learning rates .............................................................................6
2.2. Organizational learning ........................................................................................................7
2.2.1. Learning models ..........................................................................................................7
2.2.2. What, how, and why ....................................................................................................8
2.3. Engineering Change Management .......................................................................................9
2.3.1. Overview of Engineering Change ..................................................................................9
2.3.2. The engineering change process ................................................................................ 10
2.3.3. Key characteristics of engineering change and its process .......................................... 11
2.3.4. Strategies to reduce its negative effects ..................................................................... 13
2.4. Gaps in literature ............................................................................................................... 14
3. Hypotheses ............................................................................................................................... 17
Gap 1: the direct effect ............................................................................................................. 18
Gap 2a, 3 and 4: engineering change contributes to learning..................................................... 18
3.1. Increasing the opportunities to learn ................................................................................. 20
Gap 2b, 3 and 4: Opportunities to learn during implementation of an EC ................................. 20
Gap 2b, 3 and 4: Opportunities to learn during generation of an EC .......................................... 21

xi
4. Empirical setting ....................................................................................................................... 24
4.1. ASML in general ................................................................................................................. 24
4.2. The Engineering Change Process at ASML .......................................................................... 24
4.2.1. Implementation range ............................................................................................... 26
5. Empirical methodology ............................................................................................................. 28
5.1. Operationalisation of variables .......................................................................................... 29
5.2.1. Control variable ............................................................................................................... 30
5.2. Estimation approach .......................................................................................................... 31
5.2.1. Inferential tests .......................................................................................................... 32
6. Results ...................................................................................................................................... 34
6.1. Complete model ................................................................................................................ 34
Hypothesis 1: the effect of experience on cycle time ................................................................. 34
Hypothesis 2: the mediating effect of engineering change......................................................... 34
Hypothesis 3: increasing opportunities to learn during implementation of an EC....................... 36
Increasing opportunities to learn during generation of an EC .................................................... 36
Various tests: netto effects and controlling for passage of time ................................................. 42
7. Discussion & Conclusion ............................................................................................................ 44
7.1. Discussion ......................................................................................................................... 44
7.1.1. Attention ................................................................................................................... 46
7.1.2. Team diversity ........................................................................................................... 46
7.2. Theoretical implications..................................................................................................... 47
7.3. Managerial implications..................................................................................................... 48
7.4. Limitations and future research ......................................................................................... 52
Appendix A: References .................................................................................................................... 54
Appendix B: Overview of quotes ....................................................................................................... 60
Appendix C: ASML-Q ......................................................................................................................... 64
Appendix D: Available data and transformations ............................................................................... 64
Appendix E: Interview guide.............................................................................................................. 66

xii
Appendix F: Quantitative appendix ................................................................................................... 67
1. Conditional Process Analysis - models (Hayes, 2013) ............................................................. 67
1.1. Conceptual model .......................................................................................................... 67
1.2. Statistical model ............................................................................................................ 67
1.3. Relationship interpretation table ................................................................................... 68
2. Conditional Process Analysis - equations (Hayes, 2013) ......................................................... 69
2.1. Three main equations .................................................................................................... 69
2.2. Conditional effects ......................................................................................................... 69
2.2.1. Conditional direct effect ............................................................................................ 70
2.2.2. Conditional indirect effect.......................................................................................... 70
3. Conditional process analysis – moderated mediation (Hayes, 2013) ...................................... 71
3.1. A formal test of moderated mediation ........................................................................... 71
3.2. Constructing bootstrap estimates with syntax ............................................................... 72
4. Stepwise build up of the model ............................................................................................. 73
4.1. Coefficients table ........................................................................................................... 75

1
1. Introduction
ASML, a market leading company which provides lithography systems for the semiconductor industry,
is putting effort in developing systems that make it possible to continue Moore’s Law. Advances in
lithography technology are measured based on the resolution of a system. In order to reach the goal of
an ever higher resolution, ASML incorporates technologies that produce wavelengths which are
measured in the nanometer scale. Their newest platforms make use of extreme ultraviolet (EUV) light,
a radical new technology, resulting in tough new challenges in design and production.
The introduction of such a new platform comes not only with increased complexity. The technologies
used in the machines are significantly more capital intensive. A direct result of the increased
complexity and capital is the inflated work in progress. In order to reduce the WIP it is necessary to
push machines through the factory faster, effectively reducing the cycle time. However, it is necessary
to reach this goal with an eye on the future, by balancing speed and learning effects. Therefore, we
incorporate Learning Curve theory, a concept which describes the relationship between cumulative
experience and a certain outcome parameter (e.g. unit costs), to identify characteristics that drive
learning.
As a result of the combination of the increased complexity and the low maturity of the technology, a
high number of Engineering Changes (ECs) is initiated. ECs introduce functional characteristics to the
product with the goal to increase quality, while simultaneously negatively affecting the cycle time.
ASML is in search of methods to balance the new product development speed and their learning
effects, striving for both a reduction in project cycle times and an increase of product quality. By
uncovering the factors that accelerate the learning curve, it is possible to conclude on managerial
implications helping to achieve faster project cycle times.
Current research on the effect of ECs on cycle times lacks longitudinal evidence. Moreover, they
measure ECs at an aggregate level. In this study we will try to incorporate EC principles obtained via
qualitative research, into a quantitative application of learning curve theory. We will study the effect
of increasing the opportunities to learn, one of the causal mechanisms that facilitates learning, on the
number of engineering changes and on the learning rate of the project cycle time. We build up our
model and hypotheses based on the gaps as found and reported on in the literature section. By
incorporating moderators we can assess the effect on the engineering changes based on the main
effect of said moderator, while the effects on learning are assessed by testing the effect of an
interaction variable (i.e. setting the moderator as a function of the antecedent variable).

2
This leads to the following problem statement:
What role do Engineering Changes play in the relationship between
experience and project cycle time (i.e. the learning curve)?
This problem statement is accompanied by the following research questions:
1) In what way do Engineering Changes contribute to the progression of the learning curve at ASML?
2) Which characteristics and parameters of Engineering Changes can be identified?
3) Which of those characteristics and parameters increase the opportunity to learn?
4) What is the effect of increasing opportunities to learn on the number of Engineering Changes?
5) What is the effect of increasing opportunities to learn on the learning rate (i.e. in total and measured
for each different path)?
The rest of the thesis follows the build-up that is characteristic for research papers. This chapter
introduced the subject and set the research questions. We will follow up with a review of the available
literature, assembled via desk research on search terms such as: learning curve, learning rate, learning
curve factors, organizational learning, knowledge transfer, experience, productivity, new product
development speed, engineering change, engineering change process, engineering change
management, design iterations, impact, consequences of design change, handling of engineering
change, characteristics of engineering change etc. Papers were selected based on the impact-factor of
the journal and the number of citations, a snowballing method was performed on several papers to
uncover relevant older and newer publications. Subsequently, a chapter introducing the hypotheses is
presented, followed by the empirical setting. After the empirical methodology chapter, we will present
the results, which is followed by a chapter that concludes on and discusses these results.

3
2. Literature review
The first objective of this literature review is to provide a wide range of research findings on the
Learning Curve literature; a concept which describes the relationship between cumulative experience
and a certain outcome parameter (e.g. unit costs). Additionally, interest goes out to the fields of
application, the range of outcomes and the explanation of the observed variation in organizational
learning rates. What follows is a paragraph on factors that in all probability facilitate learning and thus,
drive the curve. The second objective is to provide an extensive review on the concept of EC
Management, responsible for the process of implementation of changes to a system. In this literature
review there is a need to identify several general characteristics of the EC-process and strategies to
improve the management of ECs. The third objective is to identify the boundary crossing studies. We
will identify the gaps in research, which in turn will serve as a stepping stone for the build-up of the
conceptual model. The research gap will be identified based on the current overlap, and lack thereof,
of the research areas that focus on Learning Curve and/or EC Management.
2.1. Learning curve theory In the following section first the concept is introduced, followed by a mathematical representation of
the curve. Thereafter, the general components of a learning curve will be discussed. Next up, we will
show that organization differ in their learning rates, subsequently we will present sources of these
variations. In order to break through the boundaries of understanding the conditions under which
factors contribute to steeper curves, we need to understand the complex process underlying learning.
We will end this section with three causal mechanisms can explain variation in learning rates (Argote
et al., 2003).
Typically, the repetition of a specific task increases the dexterity of the execution of said task. This is
not only true for individuals, organizations also show signs of learning. This pattern of learning over
time is found in many companies and is generally depicted by a curved line. As the cumulative output
of organizations increases, outcome parameters (e.g. unit costs or labor hours) typically decrease at a
decreasing rate (Argote, 2013). This phenomenon has been described extensively in literature and is
called the learning curve. Early studies document that individuals require less time to fulfill tasks with
increased experience (Thurstone, 1919). Wright’s (1936) work on the number of labor hours required
for the production of aircrafts was the first to find empirical evidence for the existence of the learning
curve on the organizational level.

4
2.1.1. Learning rate – formula
Figure 1 illustrates the statement that performance improves with increased experience, with the rate
of improvement gradually declining over time (Argote, 2013). This classic form of the learning curve is
expressed mathematically by the following equation (1.1):
Where: y = the number of labor hours per unit
a = the number of labor hours required to produce the first unit
x = the cumulative number of units produced through time period i
b = the learning rate
i = a time subscript
Learning curves are characterized in terms of a progress rate (p). Equation (1.1) describes that with
each doubling of cumulative output the unit cost reduces with a certain percentage (p). The
parameter, b, in equation 1.1 is related to the progress ratio, p, by the following expression (1.2):
For estimation purposes, equation (1.1) can be written in logarithmic form (1.3):
The classic curved learning curve pattern that results out of the power function of equation 1.1
becomes a straight line when the equation is converted to a logarithmic scale. This log-linear model is
by far the most widely used model. Figure (2) plots the same data shown in figure (1) using a
logarithmic scale for both experience and output (Epple, Argote and Murphy, 1996).
We can only conclude that learning has occurred, ceteris paribus, if the outcome variable (e.g.
assembly hours per aircraft) changes as a function of the cumulative number of units produced
(Argote, 2013).
Eq. 1.1
Eq. 1.2
Eq. 1.3
Fig. 1: the relationship between labor hours and cumulative output
Fig. 2: the relationship between logarithm of labor hours and logarithm of cumulative output
Source: Epple,
Argote, and
Murphy
(1996)
Source: Epple,
Argote, and
Murphy
(1996)

5
2.1.2. Components of the curve
By scanning the graphical representation of the curve it immediately shows that the classic learning-
curve figure consists of two components and its relationship; 1) organizational experience (i.e.
cumulative number of machines) on the x-axis, 2) the outcome measure of performance on the y-axis.
The relationship between x and y is displayed as a curved line.
x-axis
Multiple studies have been conducted and indicate that cumulative output is a better predictor of the
measure of outcome than calendar time is (e.g. Lieberman, 1987). Some studies show that calendar
time was not significant (Lieberman, 1984; Rapping, 1965), while another study showed a significance
of both variables included in the productivity study (Argote, Epple, Rao, & Murphy, 1997).
Nevertheless, the results of the study showed that while both variables were significant, the
cumulative output variable had a greater effect than the variable that operationalized time.
y-axis
The y-axis describes both what measure is used as well as in which organizational context this study
was conducted (e.g. the assembly hours per aircraft). Since the 1990s a broader set of organizational
contexts, with an expanded set of outcome measures, have been shown to follow a learning curve
pattern (Argote, 2013). Several decades of work have been focusing on finding evidence in a variety of
industries (Argote, 2013). Research on the differences between machine-intensive and labor-intensive
industries found that as experience increased, the learning rates in assembly work were significantly
higher (Hirsch, 1952). In addition, Baloff (1966, 1971) showed that the learning curves of labor-
intensive industries are less inclined to level-off. Later on the general and misguided believe that
learning is solely due to labor learning was disproved by Dutton et al. (1984) on the basis of research in
the 1960’s. Hirschmann (1964) found evidence for the existence of learning curves in the continuous
process industries. In these contexts learning does not occur due to repetition of tasks by individuals,
instead learning curves follow their pattern due to explicit managerial measures to change the
organization of processes or the technologies in use (Hirschmann, 1964; Baloff, 1966).
Over time research stepped away from using the dominant outcome measures of performance (i.e.
direct labor hours or unit costs), resulting in an expanded set of outcomes for learning curve theory.
Examples include the use of quality parameters (Argote, 1993), the outcome of organizational survival
(Baum & Ingram, 1998), and service timeliness in the production of pizzas (Argote & Darr, 2000). To
date, no research has been published which included the cycle time of a project as a function of
experience. Therefore, we have identified our first gap, research on learning curve theory lacks the use
of cycle time as an outcome measure.

6
The relationship: the curve
Wiersma (2007) dissects the pattern of the classic learning curve by proposing three properties that
characterize the shape. First, the curve shows evidence of downward concavity. Exceptions on this
finding are present in literature (Adler & Clark, 1991), in general however, curves are concave. Second,
after this initial stage, the angle of the curve gradually becomes flat steep and it might reach a plateau.
This property of a learning curve was first observed by Conway and Schultz (1959) and later explored
by Baloff (1971). According to Yelle (1979) this steady-state phase of the learning curve corresponds to
the point at which learning is brought to a halt. Finally, in some cases the curve is characterized by
abrupt reductions in labor hours (Wiersma, 2007). A source of these types of mutations can be found
in contextual influences or managerial actions such as; encountered deficiencies of essential
components, radical new requirements on product characteristics, or the implementation of new
technologies.
2.1.3. Organizations vary in learning rates
Some organizations are more productive than others and are able to keep improving over time.
Research conducted by Dutton and Thomas (1984) exemplifies the dissimilarity of learning rates over
different organizational contexts. Argote (2013) mentions that generally the assumption is made that
the average progress rate is 80%, based on the results of Dutton & Thomas (1984). One of their
extreme cases showed effects of de-learning, each doubling of experience leads to an increased
outcome parameter. Remarkably enough, organizations producing identical products on several
production lines have shown greater diversity in their progress rates than organizations fabricating
dissimilar types of goods (Hayes and Clark, 1986; Chew et al., 1990; Argote and Epple, 1990; Adler and
Clark, 1991). Thus, the aggregate form of measurement of factors that contribute to productivity
gains, possibly masks that organizational phenomena are implemented very differently in different
contexts (Argote, 2013). We identify a second gap, to understand when a variable contributes to
learning, aggregate studies need to be complemented with more fine-grained studies (Argote, 2013).
Sources of variation
The myriad of factors found in research (e.g., Yelle, 1979; Dutton & Thomas, 1984; Lieberman, 1984;
Hayes & Clark, 1986; Adler and Clark, 1991; Bahk & Gort, 1993), shows the necessity of a clear
categorization. Argote (1993) proposed the following classification: 1) increased proficiency of
individuals, 2) improvements in technology, 3) improvements in structure, routines and methods of
coordination. Moreover, in order to be capable of identifying specific factors contributing to steeper
learning curves, there is a need to better understand the complex process underlying learning. Both
Dutton & Thomas (1982) and Adler & Clark (1991) noticed the lack of a behavioral model of the
learning process, possibly explaining the stagnation in explaining the variability of learning curves.

7
2.2. Organizational learning Learning is considered to be the effect of experience on knowledge. Within organizations this implies
that as more products are produced, knowledge is affected in some way. A change in behavior is not
necessary for learning to occur, knowledge is also knowing what not to do. Therefore, a change in
possible actions is considered to be organizational learning (Huber, 1991). Pentland (1992) adds to
that by stating that organizational knowledge expresses itself in the organization’s ability to act
effectively. Thus, organizational learning can be summarized as the process of experience creating
knowledge and using this knowledge to do better. Argote (2013) classifies two groups of knowledge;
declarative knowledge known as facts, and procedural knowledge known as skills and routines. Since
knowledge is hard to quantify, the measurement of knowledge makes use of proxies. How to measure
it is dependent on both the research goal and the environment under research (Argote, 2013).
2.2.1. Learning models
A great number of models explaining how organizational learning occurs have been proposed by many
researchers. Muth (1986) made a comprehensive overview of studies that tried to tackle the question
how learning curves can be explained. Early studies (Crossman, 1959) proposed that individuals tried
different sequences of activities at random, completely disregarding rationality. This behavioral
concept was later taken into account by Roberts (1983). According to him, when processes are
executed certain actions that are anticipated to not provide desirable outcomes are disregarded
(Roberts, 1983). On an organizational level it is believed that production experience creates
knowledge that improves productivity (Arrow, 1962). Anzai and Simon (1979) go a step further and
explain that the mechanism underlying the learning curve lies within the ability of the organization to
acquire knowledge about the effectiveness of its choices of moves and use that knowledge to modify
itself. Consequently, learning occurs over time and is expected to follow the learning curve pattern.
A classification of two learning types is adopted from Dutton and Thomas (1984), these two types of
processes explain the transformation of experience to productivity. They propose, in line with Levy
(1965), that progress may be due to induced or autonomous learning. Autonomous is learning-by-
doing (Adler & Clark, 1991), which builds up knowledge by workers performing the primary tasks of an
organization in repetition. The second type, induced learning, is stimulated by explicit managerial
actions. Adler and Clark (1991) use the term double-loop learning and identify learning to be induced
when managerial actions have an effect on technology, equipment, processes or human capital.
Examples of this type of learning are training of employees, and changes in procedures and design (i.e.
engineering changes).

8
2.2.2. What, how, and why
In previous sections we saw that organizations vary in the rates at which they learn, moreover
research focused on uncovering factors that influence learning rates. Argote (1993) proposed a
classification for the myriad of factors contributing to organizational learning based on what factors
influences knowledge management outcomes. Subsequently, a section on theories that explain
learning curves showed how experience affects knowledge and consequently productivity. But how
this outcome is influenced and by what factor, is different from why the outcome occurs.
The ability, motivation, and opportunity to learn
Argote et al. (2003) classified mechanisms which can explain variation in learning rates. The ability,
motivation, and opportunity to learn are three causal mechanisms that explain why certain contextual
factors lead to individual or organizational learning. The outcome of a learning process is dependent
on these three mechanisms. More specifically, the success of transforming experience into knowledge
(i.e. learning) is determined by the ability, motivation, and opportunity to learn within the
organizational context.
The ability to learn represents the proficiency of individuals to create, retain, or transfer knowledge.
Factors that increase the ability to learn are for example increased training hours (Nadler et al., 2003)
and the degree of temporary employees (Wiersma, 2007). The motivation to learn is affected by
rewards and incentives, which influences people’s willingness to participate in the knowledge
management process (Argote et al., 2003). Providing opportunities to individuals to create, retain, and
transfer knowledge will result in effective knowledge management, and thus learning. Organizations
will benefit from providing employees the opportunity to learn from each other. By reducing the
amount of distance between individuals (either physically or psychologically), organizations promote
the creation, retention, and transfer of knowledge (Argote et al., 2003). Additionally, a more diverse
experience appears to be more beneficial to learning (Schilling et al., 2003). Summarizing,
organizations will benefit from providing employees with (diverse) interpersonal ties, which they
typically acquire via their day to day work.
Within ASML, design iterations and their related process, commonly known as the engineering change
process, facilitate learning and serve as a way to manage and communicate explicit knowledge (Alblas
& Langerak, 2014). Each emergent possible change provides employees with new possibilities to learn.
According to Miner et al. (2001) design iterations can be regarded as a specific source of learning. Their
existence provides the opportunity to consciously search for alternative design choices which can
contribute to generic design knowledge (Miner et al., 2001).

9
Our second gap, as stated, is adopted from Argote (2013). She identifies opportunities for research as
according to her conditions under which variables have a specific effect are not yet uncovered due to
the aggregate measurement of organizational phenomena. Adler & Clark (1991) specifically
mentioned the EC research area, thereby leading to yet another found gap. According to them
managerial actions such as engineering changes have not yet been exhausted in their analysis and
therefore, opportunities for future research exist. Decomposing ECs can complement the current
studies by researching properties of ECs and their effect on learning. We will follow-up with a
paragraph that explores engineering change including sections on its process, characteristics, impact,
and strategies to reduce its negative effects. From there on we will match Engineering Change with
the Learning Curve theory via a gap based model build-up.
2.3. Engineering Change Management ASML is continuously racing to introduce lithography systems to the market that perform at the
present state of Moore’s law. As a product leader it is desirable to cut down the time to market. In
order to do so new product development activities are designed with a certain overlap. In product
engineering design decisions are made early before all information is distilled. Concurrent engineering
(fig. 3) is adopted in many firms to achieve the strategic first to market goal. This process relies on
parallelism and thus the dissemination of
preliminary information. As a consequence, an
iterative process, generally known as the
engineering change process, is necessary to
remedy mistakes, integrate new parts or tweak
the product towards perfection (Smith &
Eppinger, 1997; Loch & Terwiesch, 1998;
Terwiesch et al., 2002).
Each and every iterative step, known as an engineering change, takes the product closer to the final
goal of delivering a product of high quality, low costs and low cycle times. Unfortunately, no
engineering change can solve all problems, engineering changes have a propagative nature, where one
change ripples through to other parts of the design. Fueling the need to solve problems previously
unforeseen.
2.3.1. Overview of Engineering Change
Engineering change and its related terms and concepts all belong to the greater Engineering Change
Management; a viewpoint on how to organize and control the iterative process of change to products.
In the literature three main perspectives on ECs are present. Although often intertwined, both the tool
Fig. 3: Concurrent engineering – Source: Terwiesch et al. (2002)

10
and product perspective lie outside of our scope, these perspectives are concerned with tangible
aspects of ECs. The tool perspective is concerned with methods that provide support to the
engineering change process, such as computer tools that manage the work flow or documentation and
models that provide decision support such as FMEA (i.e. Failure Mode and Effect Analysis). The
product perspective is solely concerned with the physical product and its characteristics. Our focus lies
on the nature and management of the engineering change process.
The most used terms in Engineering Change Management can be categorized in the management of
engineering change, the process of engineering change, the instruction to make a change, and the
change itself, which will be studied first. Several concepts are often used interchangeably in literature,
however authors address the same phenomenon (i.e. engineering change). Terms as EC, EC-process,
EC-order, changes to product or design are defined by many of the authors without providing clear
definitions. For example, terms such as engineering design change (Leech and Turner, 1985), product
change (Inness, 1994), product design change (Huang and Johnstone, 1995), and design change
(Ollinger and Stahovich, 2001) are used. Moreover, no consensus on the scope of change is reached.
Jarratt et al. (2011) reviewed the coverage of a selection of definitions. Wright (1997) ignores the
changes that can be made during design and prototype testing. Huang and Mak (1999) incorporate the
span of a change, but forget to include the timing of change. Terwiesch and Loch (1999) introduce the
notion that change is a revision of design believed to be completed. Ultimately, Jarratt et al. (2011, p.
105) proposed a more complete definition based on Terwiesch and Loch (1999):
“An engineering change is an alteration made to parts, drawings or software that has already
been released during the product design process. The change can be of any size, span or type; the
change can involve any number of people; take any length of time and can be initiated
throughout the product life cycle by any source.”
2.3.2. The engineering change process
Diverse EC processes have been put forward in literature. The process models disagree on the number
of elements and their attention to detail regarding sub-processes. From a macro-perspective, Dale
(1982) suggested two distinct stages. Maull et al. (1992) proposed a total of five steps, whereas Huang
and Mak (1999) propose four process stages; identifying, evaluating, implementing, and auditing ECs.
Later Jarratt et al. (2004a) proposed an all-inclusive process consisting of six steps, which included
generic elements proposed by many authors (Huang and Mak, 1999; DiPrima, 1982; Reidelbach, 1991;
Wright, 1997; Terwiesch and Loch, 1999). The proposed six-step process by Jarratt et al. (2004) which
is triggered by a need for change (see table 1):

11
Process step: Requirements: 1) Request for change Generally, a standardized form is filled out with the reason for change, its type, its
priority, the presumably affected components, etc.
2) Identification of potential solutions
Engineers need to systematically search for possible solutions to the problem. Due
to various constraints (e.g. time pressure, there being only one logical solution, or
costs perspectives) this step many times results in only one solution.
3) Assessment of impact
The consideration of various factors: impact on design and production, how the
change affects the firms ties with suppliers, impact on budget.
4) Selection and
approval of a
solution
The approval is commonly reviewed by an Engineering Change Board, consisting of
staff from different levels and functions. They are responsible for weighing the costs
and benefits and approving the implementation and its timing.
5) Implementation of a solution
Depending on the decision of the Board a change could be implemented right away
or is planned for later stages (determined by the urgency of a change).
6) Review of the
particular change
process
To assess if the change achieved its intended goal the change should be reviewed.
This could result in lessons learned on materials, designs, supporting processes and
the EC-process itself.
The EC-process incorporates break points between process steps in which a go or kill decision is made
by inter-functional committees, consisting of delegates from all organizational levels. The motive
being that communication reduces the negative effect of rework at the expense of communication
time (Loch & Terwiesch, 1998). Moreover, the process allows for iterations of a single change by
sending changes a step back. After analyzing the EC process in three different manufacturing
companies in Sweden, Pikosz and Malmqvist (1998) concluded that the EC process and its
characteristics is affected by company specific factors. Depending on the environment of the
organization, the product it produces and the organization of their processes, the generic engineering
change process is altered so that it serves the company specific goal. For example, when a company
strives for cost leadership, the focus would lie primarily on costs.
2.3.3. Key characteristics of engineering change and its process
Decomposing ECs can complement the current studies by distinguishing properties of ECs and their
effect on learning. The following enumeration of characteristics, based on the before mentioned
definition by (Jarratt et al., 2011), is in no way comprehensive. The context under study is expected to
reveal distinct company-specific characteristics of the EC-process (Pikosz and Malmqvist, 1998).
Volume and cycle times
The amount or volume of ECs within a development project varies considerably. Huang and Mak
(2003) propose three measures to assess the volume of ECs. The first and most obvious measure being
the number of active ECs. Their survey revealed numbers between 5 and quantities that were unable
to estimate. The second, the number of days between initiation and implementation. The number of
Table 1: the six-step Engineering Change process – Source: Jarratt et al. (2004)
Source: Jarratt et al. (2004)

12
days spent on a change ranged from 2 days to the complete duration of the development project. The
third and last measure counts the engineering hours spent from initiation to sign-off of the change.
The number of engineering hours for a change varied from two hours to 36 days. Terwiesch and Loch
(1999) dedicated work to identifying the impact of engineering change volumes. They mentioned
mental set up times to be detrimental to an even workflow. Furthermore, a clogged process results in
changes that lose their value at implementation as the project evolves (Eckert et al. 2004), and result
in a high percentage of non-value added time.
Impact of a change
Engineering changes have a propagative nature, where one change ripples through to other parts of
the design. Therefore, the change itself with all its associated characteristics has an impact over time.
The impact of is not limited to the initial affected components, changes overflow component borders
to entirely different parts of the product (Jarratt et al., 2011). Furthermore, a design change and its
expected impact will be highly specific to the organization under study (Pikosz and Malmqvist, 1998).
Consequently, change and impact should not be seen independently from each other. The ambiguity
and complexity of the engineering change process results in entangled consequences of a change. If
time is impacted, so will be costs or quality.
The consequence, effect, or impact of an engineering change is extremely hard to express in
quantitative values (Huang and Mak, 1999). From an operations perspective, engineering changes do
not only affect the product itself, both the EC support process as well as the supply and manufacturing
processes are affected. As a result the productivity of a firm is hampered (Hayes and Clark, 1986).
Various internal functions and external stakeholders have to adjust their activities in order to deal with
ECs and their impacts (Huang and Mak, 2003). Depending on the context under study (Pikosz and
Malmqvist, 1998), it could be wise to differentiate between changes based on the disturbance of cost,
quality or time (e.g. development time). ASML is on the forefront of technology and is, as the market
leader, always pressuring for innovation. Therefore, the discovery of new knowledge in the form of
engineering changes is desirable.
The impact of a change is composed out of four variables; the magnitude, its timing, and the number
of components and tools affected by the change (Terwiesch and Loch, 1999). Jarratt et al. (2011) take a
product perspective and mention three factors that determine impact; product complexity, product
configuration and product innovativeness. All in all, large changes are detrimental to development
time and result in high costs. Terwiesch and Loch (1999) argue that mainly the implementation time of
a variable affects costs negatively. Thomke and Fujimoto (2000) add to that by stating that costs and

13
time are particularly affected by late change. A practical indication of the effect of implementation
time on costs is the so-called rule-of-10, costs increase with a factor of 10 after each stage of
development (Clark & Fujimoto, 1991; Anderson, 1997; Fricke et al., 2000). Besides the apparent
effects on costs, changes affect business functions and therefore people, especially when introduced
late in the development process. Similarly to costs, the number of people affected grows at each
subsequent development step, both inside (e.g. engineers of other fields) and outside (e.g. suppliers,
customers, service teams) of the own organization (Jarratt et al., 2011).
In one study, over 50% of the investigated companies regarded engineering changes as an extensive
source of problems (Acar et al., 1998). Failures in the organization of the engineering change process
can result in high costs, low product quality, long lead times, unclear product configurations, and low
profitability (Huang and Mak, 2003). Therefore, successful management of engineering changes is
necessary. Acar et al.’s survey results (1998) show that 60% indicated that a well-managed Engineering
Change process could deliver great opportunities (Acar et al., 1998). Nonetheless, Engineering
Changes are not to be seen as solely harmful to the project. Engineering changes are key to product
innovation as they can bring new functions to the product, result in improved quality and cost savings
(Terwiesch & Loch, 1999). Eradicating all engineering changes is both not realistic and unwanted (Clark
& Fujimoto, 1991). Huang and Mak (2003) underline the necessity of engineering changes, they should
be respected as a prospect to competitiveness.
2.3.4. Strategies to reduce its negative effects
Several authors have proposed strategies to improve the handling of engineering change (Terwiesch
and Loch, 1999; Clark & Fujimoto, 1991; Thomke & Fujimoto, 2000; Fricke et al., 2000). Most proposed
strategies, methods, and/or principles have overlap with propositions of other authors. To avoid a
cluttered section on how to manage the Engineering change process an overview of literature and
their recommendation is presented in table 2. However, in general we can identify the following
strategies; reducing the impact (e.g. timing and magnitude); increasing the value added time for ECs;
frontloading; multi-disciplinary communication and reflection.
Author Type of recommendation Clark and Fujimoto (1991) Avoid unnecessary changes by spending more time on first release
Loch and Terwiesch (1999) Use software for early detection
Loch and Terwiesch (1998) Use software for early detection
Pikosz & Malmqvist (1998) Multi-disciplinary communication
Wheelwright and Clark (1992) Design it right the first time
Terwiesch et al. (2002) Early communication with multi-disciplinary teams
Table 2: overview on recommendations for the management of EC with the goal to reduce the negative effects

14
Thomke and Fujimoto (2000) Frontloading is the goal Use software for early detection Communication between subsequent functions Communication should be face to face - Horizontal and vertical Use of software Knowledge transfer Strive for faster cycles of problem solving
Terwiesch and Loch (1999) Reduce the negative impacts of an EC - Decrease the magnitude of change - Timing: late changes have high impacts - Decrease the number of affected components - Decrease the number of affected tools Avoid unnecessary changes - Stop fine-tuning Detect ECs early - Multi-disciplinary communication - Frontloading Speed up the process - Increase value added time - Decrease engineering change cycle times - Decrease complexity of process - Manage capacity and congestion - Setups and batching
Fricke et al. (2000) Reduce emergent changes Frontloading Meaningful vs. meaningless Efficiency Learning and reviewing
2.4. Gaps in literature To date, as stated before, no research has been published which included cycle time as a function of
experience. Over time research did step away from using the dominant outcome measures of
performance (i.e. direct labor hours or unit costs), however not resulting in the use of cycle time as a
function of accumulated experience.
We identify a second gap, as Argote (2013) states that to understand when a variable contributes
positively or negatively to learning, aggregate studies need to be complemented with more fine-
grained studies (Argote, 2013). She based her statement on earlier research (Hayes and Clark, 1986;
Chew et al., 1990; Argote and Epple, 1990; Adler and Clark, 1991), which showed organizations
producing identical products on several production lines have shown greater diversity in their progress
rates than organizations fabricating dissimilar types of goods. Thus, the aggregate form of
measurement of factors that contribute to productivity gains, possibly masks that organizational
phenomena are implemented very differently in different contexts (Argote, 2013). Moreover, Pikosz

15
and Malmqvist (1998) mention that the organization of the development process and consequently
the impact of engineering changes is highly conditional on the product and the organizations strategic
goal. Thereby giving additional incentives to make use of more fine-grained studies.
More specifically, Adler & Clark (1991) mentioned the EC research area as lacking detail in research
models. They regarded engineering changes as a form of induced learning, where learning is
stimulated by explicit managerial actions. Their results showed contrasting effects for two
departments, productivity was impaired at one department, while at the other department
engineering changes facilitated learning. It was suggested these differences could be explained by
their reason for change. They expected that decomposing ECs (gap 2a) can complement the current
studies that tend to hypothesize on the effects of ECs on an aggregate form.
Examples of such studies are the early study of Griffin (1993), she examined the effect of the number
of design iterations on NPD speed. Similarly, Eisenhardt and Tabrizi (1995) hypothesized that more
design iterations are associated with shorter development times. Chen (2010) found that the number
and frequency of design iterations are antecedents of NPD speed. A meta-study by Cankurtaran et al.
(2013) provided a holistic view of NPD speed and its antecedents, providing no salient effects for
design iterations. Hayes and Clark (1986) researched the effects of engineering change on productivity
and found the work-in-process stock, the number of rejections, and the cumulative amount of ECs to
be detrimental to productivity. Therefore, based on the mixed results, we conclude that current
research lacks knowledge under which conditions the EC process has a positive impact on learning.
Decomposing ECs, and their process, can complement the current studies by researching properties of
ECs. One way that comes to mind is a classification based on their expected impact (e.g. on the
product, on costs, on propagative effects, on time, etc).
Another way to research specific conditions of the EC process is by incorporating opportunities to
learn, which serve as a causal mechanism that facilitates learning (Argote et al., 2003). Wiersma
(2007) has shown that incorporating factors classified as increasing the opportunity to learn in a
learning curve model is a an effective technique for identifying the conditions that drive cycle time
learning and performance (Wiersma, 2007). Within ASML, design iterations and their related process,
commonly known as the EC process, facilitate learning and serve as a way to manage and
communicate explicit knowledge. Each emergent possible change provides employees with new
opportunities to learn. We will base factors which increase the opportunities to learn on
characteristics of this EC process as described by both literature and case study documentation (gap
2b).

16
Moreover, Wiersma (2007) states that a source of abrupt reductions in the curve (i.e. learning) can be
found in deliberate managerial actions (e.g. engineering changes). We incorporate engineering
changes in the learning curve as a mediating variable, by doing so we assess the contributing effects of
various properties of engineering changes and open up the black box that covers the function which
describes the relationship between experience and the outcome measure (Argote, 2013).
Furthermore, gap 3 addresses the lack of longitudinal data, as asked for by Adler and Clark (1991).
Their research did not analyze the long term benefits of engineering change and training. They argue
that longer data series would add value to the field. According to Langerak and Alblas (2014), just a
handful of research has been conducted on the longitudinal effects of original project activity on
consecutive projects.
Lastly, engineering change management research area could benefit from the validation of their
proposed principles, which are mainly gathered with the help of case-studies, interviews and surveys
(see table 2). By conducting variability studies which incorporate characteristics of the engineering
change process, we can assess under which conditions they contribute to learning.
To summarize, the found gaps in literature are 1) the lack of using cycle times as an outcome measure
of learning curve theory. The second gap consists of the more general conception that 2) research
could benefit from more fine-grained studies, which uncover conditions under which organizational
phenomenon result in learning. More specifically, research can benefit from 2a) a decomposition of
engineering changes, and 2b) incorporating opportunities to learn. Furthermore, we identified 3) the
lack of longitudinal data series in research on the effect of engineering changes on cycle times. Lastly,
research could benefit 4) from statistical support of proposed empirical principles as for example
shown in table 2. The following chapter will build up the model based on these gaps.
In the upcoming chapter we build our model (figure 4) with the use of the gaps as stepping stones.
With each subsequent step the model is increased in its complexity. Note however that all
hypotheses will be tested in a complete model, with the incorporation of all variables. None of the
hypotheses will be tested in isolation. Therefore, the complete model should be regarded as a
combination of all four parts of the figure, as if transparent and placed on top of each other. We will
discuss each part of figure 4 (i.e. a, b, c, d) and related hypotheses in the coming section.

17
3. Hypotheses
The buildup of the model, based on the identified gaps of previous chapter, is shown in figure 4.
In the upcoming section, we address the gaps with relevant hypotheses, while referring to the
corresponding part of figure 4 (i.e. a, b, c, d). Since the model consists of two specific mediating
paths, all relevant hypotheses (i.e. all except and ) will be tested for low impact ECs (i.e. )
and high impact ECs (i.e. ).
Figure 4a: the direct effect of experience on project cycle time (gap 1)
Figure 4b: ECs (decomposed based on impact) contribute to learning (gap 2a, 3 and 4)
Figure 4c: the main effects of increased opportunities to learn (gap 2b, 3 and 4)
Continued on next page
EXP CT
EXP CT
LOW IMPACT ECs
HIGH IMPACT ECs
Attention
Team Diversity
EXP CT
LOW IMPACT ECs
HIGH IMPACT ECs

18
Figure 4d: the moderation effects of increased opportunities to learn (gap 2b, 3 and 4)
Gap 1: the direct effect
As we know, experience negatively impacts the classical measurement outcomes such as the average
unit costs or the direct labor hours (Argote, 2013). We identified in our gap section that to date cycle
time has not been shown to be a function of experience (i.e. gap 1). However, we assume that learning
contributes to and results in cycle time reduction. Therefore, our first hypothesis will tests the
relationship between cumulative experience and cycle time. Thus (see figure 4a):
: Experience leads to significantly lower project cycle time
Gap 2a, 3 and 4: engineering change contributes to learning
Our next step, which incorporates ECs as a mediating variable, opens up the black box that covers the
function which describes the relationship between experience and the outcome measure (Argote,
2013). At the same time, we address the concerns of Adler & Clark (1991), by decomposing ECs. Thus,
we research properties of ECs and their effect on learning, thereby addressing gap 2a. Moreover, we
address the lack of longitudinal data series in research on the effect of engineering changes on cycle
times (i.e. gap 3). The fourth gap is addressed by testing the effects of impact in a longitudinal setting.
Nevertheless, first we need to take a more general look at the effect of engineering change on
learning. Research on the effect of design iteration on cycle time has been conducted with diverse
terms describing the same concept, while maintaining support for positive effects of design iterations
on NPD-speed (Griffin, 1993; Eisenhardt & Tabrizi, 1995; Chen et al. 2010). Contrastingly, Adler and
Clark (1991) researched the mediating effects of ECs in two departments, in one department ECs
impaired learning, while at the other department it contributed to a steeper learning curve. A meta-
EXP CT
LOW IMPACT ECs
HIGH IMPACT ECs
Attention
Team Diversity
Figure 4: Conceptual model with hypotheses

19
study by Cankurtaran et al. (2013) on antecedents of NPD speed provided no significant effects for
design iterations. Thus, results on the effect of engineering change on learning vary.
Engineering changes do act as a way to learn, design iterations (i.e. ECs) can be seen as a specific
source of learning, as stated by Miner et al. (2001). Their existence provides the opportunity to
consciously search for alternative design choices which can contribute to generic design knowledge
(Miner et al., 2001). Moreover, in line with Alblas and Langerak (2014), we state that engineering
changes and their process are empirically a way to manage and communicate the explicitly knowledge
about changes to the product.
Due to the nature of the EC process, where design decisions are made based on preliminary
information, all engineering changes have contrasting effects. Although ECs are responsible for
improving quality and serve as a source of learning (Miner et al., 2001), ECs also bring about negative
effects. The costs of ECs lie within the need to not only implement the change, but also to get
accustomed to processes, tools, business functions and therefore people affected by a change in the
design. Hayes and Clark (1986) found that for improving productivity in factories, it was advisable to
decrease the number of ECs. Therefore, in line with Alblas and Langerak (2014), we state that the
direct effect of ECs on project cycle time (i.e. path b) is positive: the more ECs, the more work needed
solving the problems, resulting in more cycle time needed to finish the project. Thus, on the short term
more ECs lead to more work, having an adverse effect on the time needed to finish the project.
Contrastingly however, design iterations (i.e. ECs) follow an improvement pattern similar to a learning
curve. The more machines are built the more experienced engineering teams get. ECs frequently
originate from unforeseen problems and progressive insight (Alblas and Langerak, 2014). We expect
that as experience grows, more ECs are solved, the higher the quality of machines, the fewer problems
in the base-line design, resulting in a negative effect on the number of future ECs (i.e. path a).
In line with Alblas and Langerak (2014) we claim that the long term effect of engineering change is
dominant: on the long term, the more changes, the less problems in the base-line design, the less
hours needed in future design work, resulting in a reduction of project cycle time. On basis of previous
arguments we hypothesize that ECs contribute to cycle time performance (see figure 4b):
: The relationship between experience and project cycle time is partially mediated by the
number of low impact engineering changes
: The relationship between experience and project cycle time is partially mediated by the
number of high impact engineering changes
20
3.1. Increasing the opportunities to learn Argote, McEvily, & Reagans (2003) proposed a causal mechanism as to why experience affects
knowledge management outcomes. Providing greater opportunities to learn will result in better
learning (i.e. the extent to which you benefit from accumulated experience). Within ASML, design
iterations and their related process, commonly known as the engineering change process, facilitate
learning and serve as a way to manage and communicate explicit knowledge. Each emergent possible
change provides employees with new opportunities to learn. Wiersma (2007) states that a source of
abrupt reductions in the curve (i.e. learning) can be found in deliberate managerial actions (e.g.
engineering changes). Therefore, we will hypothesize that learning benefits from ECs that are
characterized by greater opportunities to learn, thereby addressing gaps 2a, 2b and 4.
The underlying process, learning, is expected to be affected by three causal mechanisms that facilitate
individual or organizational learning (Argote et al., 2003). In this thesis I will explore EC factors which
increase the opportunities to learn, while ignoring factors that increase the ability and motivation to
learn. In line with Argote et al. (2003), I propose that increasing opportunities to learn contributes to
learning. More specifically, opportunities to learn can be provided at two separate areas of the
Engineering Change Process at ASML. Firstly, during the implementation of Engineering Changes.
Secondly, Engineering Changes provide opportunities to learn during generation of the EC.
Gap 2b, 3 and 4: opportunities to learn during implementation of an EC
The next section describes our expectations on the effect of increasing the opportunities to learn
during the implementation of an EC. We address gap 2a and 2b by a decomposition of engineering
changes and including opportunities to learn, gap 3 is addressed as we make use of longitudinal data,
gap 4 is addressed by incorporating empirical principles previously untested in a longitudinal learning
curve setting.
The implementation of an EC can bring several advantages to the project; it delivers for example new
functions to a project, it reduces costs and/or production times, or it improves quality. In contrast, the
management of ECs is considered to be a burden by many firms and can seriously affect productivity
(Hayes and Clark, 1986; Huang & Mak, 2003). ECs do not only affect the product itself, both the EC
support process as well as the supply and manufacturing processes are impacted. Various internal
functions and external stakeholders have to adjust their activities in order to deal with ECs and their
consequences (Huang and Mak, 2003). However, not every change results in disturbances that
negatively affect development time (Pikosz & Malmqvist, 1998). As an example, minor changes to the
design or changes low in urgency (e.g. a design change for a simple screw) only affect up-stream supply
chain activities and therefore have a low perceived impact.

21
By proposing two specific indirect effects based on the classification of EC impact, we can identify
differences in their learning effects. The impact classification for a change is based on the stage at
which its implementation is set. We differentiate between low and high impact ECs. Whereas low
impact ECs affect cycle time indirectly, via changes in the supply chain and stock, the high impact
changes affect cycle time directly. These changes require down-time for their implementation (within
WIP and FAT stages of development) and thus affect project cycle time directly. ASML focuses
primarily on the cycle time as a performance indicator in the production department. Therefore the
urgency for ECs that result in down time (i.e. high impact changes) is believed to be higher. In
combination with the greater amount of affected upstream activities (e.g. processes, people, tools
etc), there is a clear distinction between two paths, whereas the high impact mediating path is
believed to be providing greater opportunities to learn. Therefore we hypothesize that (see figure 4b):
: The learning rate of the path through high impact engineering changes is greater than
the learning rate of the path through low impact engineering changes
Gap 2b, 3 and 4: opportunities to learn during generation of an EC
Argote (2013) argued that the learning effects are dependent on contingencies, and by using more
fine-grained studies we can uncover these conditions. Therefore, we search for additional
opportunities to learn, thereby addressing gap 2a. In the previous section we treated opportunities to
learn during implementation of an Engineering Change (i.e. impact). The next section treats
opportunities to learn during the generation of an Engineering Change, thereby also addressing gap 2a
and 2b, since we test the hypotheses in a longitudinal learning curve model, gap 3 is also addressed.
Gap 4 is addressed by incorporating empirical principles previously untested in a longitudinal learning
curve setting.
More specifically, we will measure opportunities to learn by the amount of Attention spend on
changes, as well as Team Diversity. Moreover, we will test the effect of increased opportunities to
learn with the use of longitudinal data (i.e. gap 3), via its main effects (i.e. the effect on the number of
ECs), while also testing its effect on the learning rate with the use of moderators. As according to
Wiersma (2007) the use of moderators on a learning curve model is a good method to find conditions
that drive cycle time learning and performance.
Attention spend on changes
Research on attention has been around for a long time, Weick (1979) observed that attention is central
in organizational behavior. Similarly, March (1988) researched attention as an antecedent to
organizational decision making. Recently, effort was made to accumulate the disparate findings in a
meta study (Ocasio, 2011).

22
One of the distinguished forms of attention in organizations is attentional engagement, defined as the
process allocation of cognitive resources to guide problem solving, planning, sense making, and
decision making (Ocasio, 2011). Levinthal and Rerup (2006) argue that attentional engagement is
similar to the concept of mindful information processing, which leads to knowledge and learning.
Furthermore, attentional engagement generates sense making activities (Nigam and Ocasio, 2010). In
line with cognitive neuroscience, Ocasio (2011) argues that all relevant activities to organizational
effectiveness (e.g. problem solving, sense making, decision making, etc.) rely on alternating shifts of
attention. The combination of previous observations retrieved from memory, with current thought
processes caused by attentional engagement result in desirable outcomes. The organizational capacity
to engage attention involves the application of time, energy, and effort to operational processes
(Ocasio, 2007). Therefore we argue that increasing the opportunities to learn by spending more
attention on ECs, is favorable to learning (see figure 4c and 4d):
: More attention spend on engineering change has a positive impact on the number of low
impact engineering changes (i.e. main effect)
: More attention spend on engineering change has a positive impact on the number of
high impact engineering changes (i.e. main effect)
: More attention spend on engineering change has a positive impact on the learning rate
via low impact engineering changes (i.e. moderated mediation)
: More attention spend on engineering change has a positive impact on the learning rate
via high impact engineering changes (i.e. moderated mediation)
: More attention spend on engineering change has a positive impact on the learning rate
of the direct effect (i.e. moderation)
Team diversity
ASML manufactures high-tech industrial machinery, the firm delivers lithography systems for the
semiconductor industry and is market leader. Such a setting is characterized by technological
turbulence and an innovative firm climate. Furthermore, their engineering work is causally ambiguous
as the relationship between cause and effect during production of ECs is unclear (Argote, 2013). In
such an environment, it is necessary to interpret accumulated experience via the use of creativity.
These types of organizations benefit from heterogeneity. According to Jackson, May, & Whitney
(1995) organizations performing creative tasks are more likely to benefit from heterogeneity. In a
similar vein, Moorman & Miner (1997) argue that organizations characterized by turbulent
environments are more likely to benefit from heterogeneity.

23
Diversity (i.e. heterogeneity) fosters creativity (Jackson et al., 1995). Therefore diversity fosters the
development of new knowledge. When comparing groups with diverse members to groups of similar
members, the latter were better able to generating new or emergent knowledge and developed more
sophisticated solutions (Argote, 2013). This can be explained by work of Stasser and Titus (1987);
suggesting that members possess different information are more likely to share their unshared
information.
Jackson et al. (1995) found that more diverse groups performed better at decision making and were
more creative and innovative. Additionally, Williams and O’Reilly (1998) emphasized that functional
diversity had a positive effect on group performance. Furthermore, diversity is most likely to be
beneficial in the phases of development, design, and initial launching (Argote, 2013). Together, these
arguments lead to the following hypotheses (see figure 4c and 4d):
: A higher degree of team diversity has a positive impact on the number of low impact
engineering changes (i.e. main effect)
: A higher degree of team diversity has a positive impact on the number of high impact
engineering changes (i.e. main effect)
: A higher degree of team diversity has a positive impact on the learning rate via low
impact engineering changes (i.e. moderated mediation)
: A higher degree of team diversity has a positive impact on the learning rate via high
impact engineering changes (i.e. moderated mediation)
: A higher degree of team diversity has a positive impact on the learning rate of the direct
effect (i.e. moderation)

24
4. Empirical setting
4.1. ASML in general ASML puts focus on the design, development and production of advanced lithography systems. The
company offers an integrated portfolio for manufacturing complex integrated circuits, commonly
known as chips. Since the foundation of the company, ASML strived for the introduction of new
platforms capable of producing chips that are faster, smaller and greener. In order to achieve these
goals the company needs to make every effort to achieve reductions in wavelength of light. In recent
years this resulted in the so-called EUV-technology, where extreme ultra violet light is used to transfer
a pattern on the light-sensitive wafers. This technology is disruptive, as it discontinued the use of
lenses and switched to the use of capital intensive plasma-technology in vacuum chambers.
The organization is structured in such a way that there is focus on both exploration of new
technologies and the exploitation of standardized systems. The TWINSCAN Factory (TF) is responsible
for the development and production of standardized lithography systems, characterized by their low
cycle times and high volume. In contrast, the machines produced with the EUV technology are
characterized by unpredictable disturbances on the factory floor due to high complexity and low
maturity, leading to long and unstable cycle times. A direct result is the inflated work in progress, more
expensive machines are staying longer on the factory floor. In order to reduce the WIP it is necessary
to push machines through the factory faster, effectively reducing the cycle time.
Of special interest for the problem is the manufacturing (MF) department of the EUV factory (EF). This
department receives input from the different projects in the form of ECs, changes that drive the
technology to greater heights in both costs, quality and time. Consequently, the implemented EC
impacts the operation processes in the manufacturing department. As a result, the cycle time of the
affected machine will increase. However, due to repetition of the iterative processes the organization
in its whole will learn on how to cope with these changes. In the end cycle times will decrease over
time as experience is gained.
4.2. The Engineering Change Process at ASML Disturbances on the factory floor arise in the form of engineering changes (ECs) due to the nature of
ASML’s forth bringing of their systems. These systems are upgraded while being produced and
assembled on the factory floor. ECs are the embodiment of ASML’s goal to continuously improve the
machine’s quality. These artifacts are the starting ground for the process steps that implement new
technologies in the final product. These steps combine work of all sorts of business functions.

25
The following description of the EC-process resulted from our case study at ASML, which incorporated
documentation as well as interviews. The Engineering Change Process serves as mechanism to handle
change requests (IP) for changes on part and introduction of new parts in the product configuration.
The EC process brings forth an Engineering Change (EC), which is defined as the proposed introduction
of a new or a modified part, on a Part Number (12NC) level. An Engineering Change (EC) is described in
a formal document to register and communicate to all parties involved. An EC will be accepted or
rejected during a Change Control Board meeting, after acceptation the Board will decide on the
implementation range (see section 4.2.1). Thereafter, the EC follows separate paths based on their
implementation range. Ultimately an EC will desirably result in successful implementation of a change
on the factory floor.
Several IT solutions are used to keep track of all engineering changes. ASML-Q is such a solution (see
appendix C), giving overview on the engineering change and allowing for comprehensive outputs in
the MS Excel format. This IT-tool keeps track of information such as the type of EC, the modules
affected, the days passed since initiation, the people involved, the steps taken in design, and so on.
From a high level view the EC-process consists of a total of four phases (table 3): the validation and
prioritization phase, the investigation and approval phase, the realization and sign-off phase and the
implementation phase. The different phases have the following goals: (1) to validate any engineering
request (IP) on potential benefits and to prioritize within the operational sector and program, (2) to
investigate the effort required to execute and implement the IP, (3) to realize the EC and seek approval
for implementation and the last goal (4) being the successful implementation of the EC. Below
APPENDIX the four phases of the Engineering Change process will be discussed shortly (table 3). All
these phases contribute to a successful implementation in the factory or at the customer site.
Phase of the EC process
Discussion of characteristics and goals
Validation and prioritization
Starting point of Problem IPs To create an improvement proposal (IP) To validate any engineering request (IP) on potential benefits To assign and prioritize an IP to a project leader (PL)
Investigation and approval
Project based under lead of PL To investigate the effort required to execute and implement the IP - Design and implementation To validate the impact of design change on building blocks To accept or reject the IP
Table 3: Phases of the engineering change process

26
Realization and sign-off
To create an EC out of an approved IP To develop the EC - Design/Implementation/Cost estimates To complete the EC by ways of a sign-off procedure - Agree upon proposed plan with all parties involved
Implementation
To have the EC implemented Ensuring that complete implementation data is delivered by the EC project team (EC locked) Approving the implementation range chosen by the EC project team (EC closed) Making material demand visible for all necessary EC implementation actions Matching the available upgrade time to the requested EC implementations Documenting the configuration changes due to EC implementations for all affected hardware
Unfortunately, case study research (see table 16 in appendix B) showed that ASML lacks a process step
for reflection on each implementation. Neither the documentation nor the interviews showed
evidence for the existence of such a step. Literature (Jarratt et al., 2011) already mentioned that this
step is not always carried out properly. Fricke et al. (2000) concluded that learning from the EC-process
by reviewing the implemented ECs contributes to the reduction of the negative effects. Moreover,
Thomke and Fujimoto (2000) argue that knowledge transfer helps to accelerate the curve.
4.2.1. Implementation range
As stated before, the steps taken to implement an EC are dependent on the chosen range. The
implementation range of the EC is chosen based on factors such as its perceived urgency, the expected
effects on time and costs, and the expected propagative effects of the change. The range is approved
by a team consisting of multiple members out of different business functions (i.e. CCB). A total of four
options (vertical) exist for the implementation range choice: supply chain, stock, WIP1, and FAT2. Each
choice affects part of the supply chain (horizontal) of ASML, while each subsequent choice also carries
the characteristics of all previous ranges (see figure 5).
Engineering change - implementation range
Supply Chain Stock WIP FAT
Options
Supply Chain
Stock
WIP
FAT
1 WIP: Work in Progress -
2 FAT: Factory Acceptance Test -
3 FASY: Final Assembly
Source: Engineering Change Process documentation [case study]
Figure 5: Implementation range choices Source: Engineering Change Implementation Process documentation [case study]

27
Figure 6 depicts the complete supply chain of ASML’s factories, both the external and internal steps
are displayed. The possible implementation options are displayed in light blue; supply chain, stock,
WIP, and FAT. Supply chain ECs are changes that have effect on the design within SAP; the BoM is
changed due to the change. Stock ECs make the current stock obsolete, re-orders for new parts are
necessary. Until this point disturbances are minimal, the costs of change are low and development
time is hardly affected. Therefore, these two implementation range choices are expected to be of low
impact.
In contrast, ECs with implementation range WIP and FAT are expected to have a high impact. Basically
there are two moments during manufacturing (see orange blocks in fig. 6) where upgrades have the
opportunity to land: during FASY and during FAT. WIP changes affect all machines on the work floor
and needs a swap of modules. Contrary to the previous range, the upgrade-slot for FAT is only usable
in case of must-have ECs. An engineering change that is implemented during FAT (i.e. the latest stage
before shipment, the factory acceptance test) results in large dissembling work and commonly a
change in specs and thus, a change in test procedures.
Both the supply chain and the stock implementation range choices have no direct disturbance effects
on cycle time. In contrast, the WIP and FAT implementation range choices do affect the progress of the
machines. In both cases components have to be mounted which are new to manufacturing employees,
depending at the progress of the machine disassembly of the machine is necessary. We will classify
each engineering change on impact and assign them to low impact (i.e. supply chain and stock) and
high impact (i.e. WIP and FAT).
3
supply
chain
Figure 6: Supply chain of ASML’s factories
Source: Engineering Change Implementation Process documentation [case study]
supply
chain

28
5. Empirical methodology
In order to achieve an operationalisation of a set of factors that play a role in the relationship between
experience and cycle time we took a split approach. On the one hand we took steps to get to
understand the company under study by doing field research (i.e. case study). Initially, explorative
interviews (see appendix B: table 16) were held with employees working with the Engineering change
process. This resulted in an overview of the complete process and the ability to understand the
organizational structure. Thereafter, their knowledge was supplemented with documents that
describe the engineering change procedures, containing matrices on responsibility assignment (RACI-
matrix). On the other hand, the general theoretical concepts of managing an engineering change
process and the learning curve were consulted in existent literature. To validate and control the
statements of employees as well as the statements of literature the research steps taken were
iterative. Thus, after reading up on the literature, proposed factors were validated by organizing semi-
structured meetings with key players working with the EC-process. These meetings were held to
discuss the theoretical concepts related to engineering changes, learning curve, and cycle time
management. Furthermore, observations were made by being a passive participant in all relevant
meetings that deal with engineering change and their approval process.
To satisfy the aim of the study to test the longitudinal effects of NPD-decisions on cycle time, two
business lines (i.e. TWINSCAN’s XT and NXT) were chosen which have been running long enough to
document during stages of both low and high maturity. Unfortunately the most recent business line
(i.e. EUV) is still in its infancy resulting in irregular and low production capabilities and therefore lacks
the desired data richness.
Subsequently, data lines from internal reporting systems were collected that describe the properties
of the design iterations over time. The data on these alterations to process or technology are
documented on the engineering change level, containing information on dates, affected subsystems,
expected costs and benefits, source of change, implementation range and so on. In addition, cycle
time data of machines belonging to the two mentioned business lines (i.e. XT and NXT) were obtained.
As a follow-up the data was examined on reliability by interviewing personnel committed to reporting
on cycle time improvements. As a result several projects of machines were excluded as the
measurements of the two primary methods of documenting cycle times differed abnormally. During
the transformation of the data, semi-structured interviews followed the explorative ones to
anecdotally test which proxies would be relevant (see appendix E for the interview guide).

29
The engineering change data was aggregated to the machine level. A total of more than 30.000
individual ECs were assigned to the more than 900 machine projects. The data contains projects of the
business lines XT and NXT, brought to market as early as 2005 to October 2014. In order for an
engineering change to be assigned to a specific project it needed to satisfy two rules. The first being
that business lines matched (i.e. XT or NXT), the second being that the completion date of an
engineering change lies between the start and end dates of machine production.
5.1. Operationalisation of variables The standard learning curve model is the basis of the analysis, as this is an effective way of identifying
conditions that shape the learning curve (Wiersma, 2007). A log transformation is issued to explore the
learning rates of this research setting. In the following table the several theoretical concept and their
operationalisation are presented. All of the those are operationalized on machine-level with the use of
MS Excel, meaning that each concept counts the characteristic of an EC between the start of machine
development (i.e. start FASY) and the delivery to the customer (i.e. GSD). Advanced MS Excel skills
were applied such as VBA programming, vlookups, if/then/else, pivot tables and so on. For an
overview of concepts and their operationalisation see table 4. An overview of all possible and relevant
concepts and proxies created during our stay at ASML is provided in appendix D in table 17.
Concept Operationalisation Variable
Experience Natural log of the number of machines that have been
shipped at time t-1, satisfying matching platform and roman numeral
Cycle time Natural log of the number of days between start of machine
development (i.e. start FASY) until the delivery to the customer (i.e. GSD)
Attention The average number of days that an EC was ‘in process’, based
on ECs that were closed during the cycle time of the corresponding machine
Team diversity The average number of functional departments assigned to the ECs,
based on ECs that were closed during the cycle time of the corresponding machine
Low Impact Accumulation of all ECs satisfying Supply chain or Stock implementation closed
during development
High Impact Accumulation of all ECs satisfying WIP or FAT implementation closed during
development
To operationalise the outcome variable cycle time (lnCTt), the input variable experience (lnExp+1t-1),
the mediator engineering changes (ECt), and the moderators Team Diversity (TDt), and Attention (ATt)
several computational alterations were made to the obtained data. For all the following calculations
engineering change data was assigned to a specific machine. Engineering changes were assigned to a
specific machine if they matched both business line and generation number (e.g. XT-III) and if
engineering change close date fell within the production dates of the specific machine.
Table 4: Operationalisation of concepts

30
The dependent variable, cycle time (lnCTt), is the natural log of the cabin cycle time, and thus is
measured based on machine project data. The cabin cycle time is calculated by counting the days
between the start of assembly (start FASY) and the shipment date (GSD). A more detailed subdivision
was used internally, where the number of days were tallied per process step. In some cases a
comparison between these two methods resulted in a discrepancy. If these differences exceeded
more than 10 percent the cases were deleted. The independent variable, cumulative experience
(lnExp+1t-1), is the natural log of the number of completed and shipped machines within their specific
business line and generation number (e.g. NXT-II) at time t-1, plus 1 to prevent ln(0)= undefined.
The mediating variable of engineering changes (ECt) is measured by counting the engineering changes
that were closed (e.g. approved, closed, rejected) during time period t belonging to their specific
business line and generation number (e.g. XT-IV). Note that all ECs are considered to bring knowledge
to the table, even engineering changes that are not approved and thus will not be implemented result
in knowledge on process and machine. As a result these changes will be taken into account in this
research. Based on the allocated implementation range of an EC, we either assigned them to be of HI
or LO impact. HI impact engineering changes are those that are assigned to implementation range WIP
or FAT. While LO impact engineering changes are engineering changes that are implemented in the
supply chain or stock range.
The indicator used to measure the moderating variable Team Diversity (TDt) is the average number of
functional departments involved in engineering work at time period t. Per machine the number of
people working on engineering changes were accumulated and averaged by the number of
engineering changes closed during the machine’s cycle time. The average attention spend on an
engineering change from initiation to closing (ATt), is calculated from the engineering change data.
Counting the days between the start (i.e. date_improcess) and closing of the engineering change (i.e.
date_closed or date_rejected), excluding the days the engineering change was put on hold (i.e.
date_onhold to date_resumed), yields the amount of attention it took to finish the engineering change
measured in days. The following step was to accumulate the attention spend on ECs per machine and
average these by the number of engineering changes closed during the machine’s cycle time.
5.2.1. Control variable
Part of the learning curve might be attributed to general technological improvements in the external
environment (Solow, 1957). Argote (2013) adds to this by stating that including the passage of time as
a control variable determines if learning can be attributed to improvements in the external
environment or to the experience of the own organization. In line with Argote et al. (1997) we expect

31
the passage of time to have a significant effect on cycle time, nevertheless we expect the magnitude of
experience to be greater. To operationalise the passage of time (Timet-t0), we counted the days from
start of assembly (i.e. FASY) to each of the machines FASY-start-date.
5.2. Estimation approach To test the proposed hypotheses we have built a conceptual model based on the classic learning curve
model with specific paths for learning via low and high impact engineering changes. Our moderators,
testing whether Attention or Team Diversity provides greater opportunities to learn, affect the
relationship between the antecedent- and the consequent-variables. In a parallel multiple moderated
mediation model, antecedent variable (i.e. experience) influences consequent variable (i.e.
project cycle time) directly as well as indirectly through multiple parallel mediators (Hayes, 2013). This
model assumes causal independency of the parallel mediators, no mediator is modeled as influencing
another mediator in the model. Although our parallel mediators are highly correlated (table 5), this
does not imply causation. Analysis on multicollinearity did not indicate any problems (i.e. VIF-factors
are under 5). Table 6 reports descriptive statistics of all variables.
CT EXP Low
impact ECs
High
Impact
ECs Attention
average
Team
diversity
average CT
EXP
Low impact ECs
High impact ECs
Attention average
Team diversity average
**. Correlation (Pearson) is significant at the 0.01 level (2-tailed).
Mean Median sd Minimum Maximum Skewness
ln(CT) 4.76 4.76 .58 3.43 6.97 .66
ln(EXP+1) 3.53 4.04 1.82 0.00 5.91 -.72
Low impact ECs 145.57 75.00 167.63 2.00 1431.00 2.62
High impact ECs 24.90 12.00 37.00 0.00 416.00 4.50
Attention average 162.91 137.76 101.59 51.43 870.81 3.30
Team diversity average 10.06 10.36 1.12 4.83 12.67 -.45
Passage of time 1584.42 1618.50 653.09 0.00 2760.00 -.330
Table 6: Descriptive statistics
Table 5: Correlations

32
In conditional effects, a coefficient estimates the difference in the consequent variable between two
cases that differ by one unit, when moderators are 0. If 0 is not a meaningful value for the moderator,
the coefficient and its test of significance is meaningless and have no substantive interpretation
(Hayes, 2013). Therefore, we follow the recommendation of Aiken and West (1991), by mean-
centering the antecedent variable and the moderator variables and we will get coefficients that
are always meaningful and interpretable.
5.2.1. Inferential tests
We will follow the estimation procedure of Hayes (2013) as shown in appendix F, which first translates
the conceptual model into a statistical model. Every consequent variable is then converted to an
equation, from there algebra can be used to determine combinations of coefficients that test certain
hypotheses. Hayes´ PROCESS-tool, a plug-in for SPSS, is used for the statistical analyses. Our model is
based on Model Templates for PROCESS for SPSS and SAS number 10 (obtained via
www.afhayes.com), with the use of two mediators.
On the basis of inferential tests we conclude whether a hypothesis is significant. Table 7 gives an
overview of all hypotheses, their description, their corresponding inferential approach, as well as the
statistical artifacts from the use of the PROCESS-tool.
Hypothesis: Description: Inferential approach: Direct effect Makes use of -values for testing the null-hypothesis.
Mediating effect Estimation of the conditional indirect effects for average values of the
moderators alongside a bootstrapping method Path a Makes use of -values for variables and , which should be
interpreted as the effect of on or when W and V are average (0
since we mean-centered).
Path b Makes use of -values for estimates and , which predict the
effect of the mediators on the -variable
Effect size
comparison Pairwise comparisons between specific indirect effects for multiple
mediator models with moderators are not possible using the PROCESS-tool. Therefore, a bootstrapping confidence interval without use of the
moderators will determine significance.
+
Main effect
Makes use of -values for testing the null-hypothesis.
+
Conditional indirect
effect (i.e. a formal test of moderated mediation)
Through a syntax-option, a new data file containing 10000 bootstrap
estimates of every regression coefficient in the model is created. We
determine significance based on a percentile-based 95% bootstrap
confidence interval for the difference of any two values of the
moderator.
+ Conditional direct
effect Makes use of -values for testing the null-hypothesis at values of the
moderators based on spotlight analysis (i.e. percentiles).
Table 7: Inferential tests

33
Spotlight and floodlight analysis
Conditional effects are dependent on various values of the moderators and therefore it is necessary to
determine their significance at different levels of the moderators. In research two methods are
prevalent; floodlight analysis, and spotlight analysis (Spiller et al., 2013). When moderators do not
have specific focal values, which is the case in our data, it is recommended to use floodlight analysis
(i.e. Johnson-Neyman tests). Unfortunately, Hayes’ PROCESS-tool does not allow for the use of this
option with our model (i.e. 10) due to model complexity. The spotlight analysis uses arbitrary levels for
low, medium and high values of the moderator (i.e. the mean ), resulting in three main
problems (Spiller et al., 2013). First, it hinders generalization over studies. Secondly, if moderators are
skewed the levels may lie outside the minimum or maximum. Lastly, when the moderator uses a
coarse scale the mean might represent an impossible value. Based on the descriptive statistics
of the moderators (see table 6) both the second and the third problem are no immediate drawbacks.
However, due to skewness of the moderator Attention (3.30) a classification of low, medium, and high
does not represent the full scale of the moderator. We opt for the use of percentiles at levels 10, 25,
50, 75, and 90, which can be interpreted as very low, low, moderate, high, and very high levels of the
moderator (Hayes, 2013).
Bootstrapping
We adopt the bootstrapping confidence interval (BCI) approach as proposed by Hayes (2013). The
rationale being that BCI is the better approach when the original data can be used for analysis since no
assumptions about the shape of the sampling distribution are necessary (Hayes, 2013). BCI generates
its own representative sampling distribution, unlike for instance the Sobel-test. We do not use this test
due two flaws. One, normality cannot easily be assumed (Hayes, 2013). Second, its confidence
intervals are likely to be less accurate (MacKinnon et al., 2004). Moreover, BCI is likely to be more
powerful than alternative methods (i.e. normal theory) (Preacher et al., 2007).

34
6. Results
A stepwise build up of the model, as well as a description of tests and results, is shown in Appendix F.
The found significant effects of the indirect paths of experience on project cycle time through both low
and high impact ECs, in combination with the significant effects of the proposed moderators Attention
and Team Diversity, lead to a model which incorporates all variables mentioned. Thus, all hypothesis
will be tested and reported on, based on the results of this complete model (table 8).
6.1. Complete model Hypothesis 1: the effect of experience on cycle time
We start with hypothesis 1, which tests whether Experience leads to a decrease in project cycle time.
From table 8 we see that the direct effect of lnExp on lnCT is statistically significant, as indicated by the
result of coefficient at –.0809 . Thereby, we can accept . As
experience grows, the cycle time decreases with a decreasing rate. The direct learning rate is 94,547%
(i.e. .
Hypothesis 2: the mediating effect of engineering change
Next up is hypothesis 2, stating that the relationship between experience and project cycle time is
mediated by the number of ECs. The significant negative effects in model 2 and 3 (appendix F: section
4) showed that this hypothesis is supported when tested in isolation. A mediating effect is determined
by the effects of two paths, the first path predicts that experience leads to a significantly lower number
of ECs, the second path predicts that the amount of ECs is positively related to project cycle time. Since
our complete model (table 8) incorporates several mediators as well as moderators, we now speak of
specific conditional indirect effects.
The first path can be interpreted as the effect of on or when and are 0, therefore
variables and represent the effect of experience on both low and high impact ECs at average
values of the moderator. Coefficient at , indicates that as
experience grows the number of low impact ECs decreases. Since is negative
, the effect is similar for experience on high impact ECs. The second path, with
estimates, indicates whether the amount of ECs is positively related to project cycle time. Low impact
ECs have a positive effect on project cycle time, indicated by a of .
The result of coefficient at , shows that high impact ECs positively
relate to project cycle time. These significant positive results are consistent with prior results of
stepwise-model 2 and 3 (see appendix F: section 4).

35
Table 8: Results of complete model
Consequent
(impactLO) (impactHI) (lnCT)
Antecedent Coeff. Coeff. Coeff. (lnEXP) –38.5630 4.0623 .0000 –3.8960 .9576 .0001 –.0809 .0138 .0000
(impactLO) — — — — — — .0014 .0002 .0000 (impactHI) — — — — — — .0044 .0008 .0000 (ecATavg) –.3600 .1039 .0006 –.1163 .0245 .0000 .0016 .0003 .0000 (int_1) .2116 .0459 .0000 .0633 .0108 .0000 –.0005 .0001 .0003 (ecTDavg) 41.6592 8.6517 .0000 9.3562 2.0395 .0000 .0075 .0278 .7883 (int_2) –6.4401 2.3560 .0064 .7576 .5554 .1734 –.0333 .0076 .0000
Time (daysFASY) –.0768 .0158 .0000 –.0208 .0037 .0000 .0001 .0001 .2808 Constant
255.9180 26.2453 .0000 52.4513 6.1868 .0000 4.4295 .0879 .0000
001 001

36
From table 8 we can calculate the specific mediating effects of experience on project cycle time via ECs
at average values of the moderators by taking the product of the first and second path. For low impact
ECs the conditional indirect effect is , while the conditional indirect effect via high
impact ECs is . The BCI of 95% at average values of the moderators do not straddle
zero for both the low impact (table 10: -0,0801 to -0,0365), as well as the high impact ECs (table 11: -
0,0336 to -,0071). This provides evidence for the claim that the relationship between experience and
project cycle time (i.e. lnCT) is indeed mediated by the number of ECs, thereby we
can accept hypothesis and hypothesis .
Hypothesis 3: increasing opportunities to learn during implementation of an EC
Hypothesis 3 predicts that the opportunities to learn during the implementation of an EC are higher
when ECs have an higher impact. Technically, this means we expect that the specific indirect path
through high impact ECs contributes more to learning than the specific indirect path going
through low impact ECs . Thus, the learning rate of the path through high impact ECs is
expected to be greater.
Unfortunately, the PROCESS-tool provides no pairwise comparisons between specific indirect effects
for multiple mediator models with moderators (Hayes, 2013). Therefore, hypothesis 2 will be tested
without the moderators Attention and Team Diversity in play. The comparison is found in table 9 in
row C1, along with a corresponding bootstrapping confidence interval. The point estimate of the
difference between specific indirect effects is , the 95% BCI does not
straddle zero to . Therefore, we can say with 95% confidence that these indirect
effects are statistically different from each other. Since the specific indirect effect of impactLO is
higher in magnitude, the hypothesis is rejected. Contrary to our expectations, not high impact ECs, but
low impact ECs contribute more to the learning effect.
Table 9: Comparing specific indirect effects
Indirect effect of X on Y Effect Boot SE BootLLCI BootULCI TOTAL impactLO impactHI (C1) 0581 0189 * Specific indirect effect contrast definitions: (C1) = impactLO minus impactHI ** Without the use of moderators
Increasing opportunities to learn during generation of an EC
We predicted that increasing the opportunities to learn during the generation of ECs leads to an
increase of the number of ECs, as well as having a positive impact on the learning rate. Thus, we expect
that the number of ECs rises, tested by its main effects. Contrastingly, we expect the learning curve to
become steeper as the values of the moderator increase.

37
Hypothesis 4 and 6: the main effect
Hypothesis 4 and hypothesis 6 predict that Attention and Team diversity have a positive direct impact
on the number of ECs. The main effects and show if at increased levels of Attention and Team
Diversity the number of ECs is impacted directly. The values of and can be seen in table 8, for both
their effect on low impact ECs as well as for their effect on high impact ECs.
predicts that Attention leads to a higher number of ECs, we should reject this hypothesis,
indicated by a significant and negative of . For Attention on
high impact ECs we have a negative significant value of at .
Indicating that higher levels of Attention lead to less ECs, thus rejecting . Higher levels of Attention
do not contribute to an increase of the number of engineering changes.
The same procedure is repeated for the moderator Team Diversity. For low impact ECs, , Team
Diversity has a positive effect on the number of ECs, indicated by the effect at 41.6592
. The result of at , , indicates a positive and
significant effect. These results lead us to accepting both hypothesis and , higher levels of
Team Diversity lead to an increase of the number of engineering changes.
Hypothesis 5 and 7: the conditional indirect effects
Hypothesis 5 and hypothesis 7 predict that Attention and Team diversity moderate the relationship
between experience and the project cycle time. With increased opportunities to learn the learning
rate is expected to greater. These expectations are tested for both indirect effects, as well as for the
direct effect. For indirect effects, which we will treat first, we need to look at the interaction effects of
path , and at the effects of ECs on project cycle time (i.e. path ).
The interaction terms and shows if ’s effect on ECs depends on values of the moderators
(table 8). Attention positively affects the relationship between experience and the number of low
impact ECs, indicated by a significant of . For high impact ECs we
have a positive significant value of at . Indicating that Attention
moderates the effect of experience on ECs in such a way that the learning curve of ECs becomes less
steep. Team Diversity has a negative effect on the relationship between experience and engineering
change, indicated by the interaction effect at . The result of
at , , indicates a positive but insignificant effect. These results lead us to
concluding that at higher levels of Team Diversity the learning curve of low impact ECs becomes
steeper. Contrastingly, higher levels of Team Diversity does not significantly affect the learning curve
of high impact ECs.

38
Learning, measured by the effect of higher Attention and Team Diversity on the number of ECs, does
also have a cost. Engineering changes have a direct and positive effect on the project cycle time as
indicated by the significant -coefficients (i.e. = .0014 and = .0044). Therefore, the more
Engineering Changes, the longer project cycle times. By taking the product of path and path , we
can test the learning effect of increased opportunities to learn at various values of Attention and Team
Diversity (i.e. percentiles). The resulting effects are called the conditional indirect effects (see table 10
and 11).
Table 10: Conditional indirect effects of lnEXP on lnCT via impactLO at values of the moderators
Attention ( ) Team Diversity ( ) Effect Boot SE BootLLCI BootULCI
94,80
8,50 -0,0602 0,0141 -0,0936 -0,0368 8,95 -0,0642 0,0137 -0,0958 -0,0411
10,36 -0,0770 0,0141 -0,1072 -0,0520 11,04 -0,0831 0,0153 -0,1158 -0,0567 11,33 -0,0857 0,0159 -0,1219 -0,0591
109,64
8,50 -0,0558 0,0133 -0,0914 -0,0345 8,95 -0,0598 0,0128 -0,0897 -0,0380
10,36 -0,0726 0,0131 -0,1010 -0,0492 11,04 -0,0787 0,0142 -0,1110 -0,0544 11,33 -0,0813 0,0148 -0,1143 -0,0565
137,75
8,50 -0,0474 0,0123 -0,0795 -0,0280 8,95 -0,0515 0,0116 -0,0807 -0,0327
10,36 -0,0642 0,0115 -0,0917 -0,0443 11,04 -0,0703 0,0126 -0,1007 -0,0494 11,33 -0,0730 0,0132 -0,1030 -0,0503
169,47
8,50 -0,0380 0,0122 -0,0672 -0,0176 8,95 -0,0421 0,0114 -0,0702 -0,0235
10,36 -0,0548 0,0107 -0,0813 -0,0368 11,04 -0,0609 0,0116 -0,0901 -0,0425 11,33 -0,0636 0,0122 -0,0945 -0,0442
238,92
8,50 -0,0174 0,0155 -0,0445 0,0156 8,95 -0,0215 0,0145 -0,0484 0,0091
10,36 -0,0342 0,0131 -0,0627 -0,0103 11,04 -0,0403 0,0134 -0,0697 -0,0173 11,33 -0,0429 0,0137 -0,0752 -0,0209
Mean: 162,91 Mean: 10,06 -0,0541 0,0106 -0,0801 -0,0365 *moderator values represent real values, no need to correct for mean-centering *values for moderators are 10
th, 25
th, 50
th, 75
th, and 90
th percentiles.
A bootstrapping method is used for determining significance (shown in bold). A close examination of
the effects of the specific indirect path via low impact ECs (i.e. table 10) makes us conclude that the
conditional indirect effect increases when Attention is relatively higher (i.e. the effect becomes less
negative). On the other hand, when Team Diversity is relatively higher the conditional indirect effect
decreases. Based on a 95% BCI, the conditional indirect effect is not statistically significant from zero
for only ECs characterized by very high Attention in combination with very low/low Team Diversity.
Note however that the conditional indirect effect is consistently negative, learning is taking place at all
values of the moderators.

39
Table 11: Conditional indirect effects of lnEXP on lnCT via impactHI at values of the moderators
Attention ( ) Team Diversity ( ) Effect Boot SE BootLLCI BootULCI
94,80
8,50 -0,0414 0,0100 -0,0634 -0,0237 8,95 -0,0399 0,0096 -0,0606 -0,0228
10,36 -0,0352 0,0093 -0,0544 -0,0181 11,04 -0,0329 0,0097 -0,0535 -0,0160 11,33 -0,0320 0,0100 -0,0536 -0,0154
109,64
8,50 -0,0373 0,0093 -0,0591 -0,0215 8,95 -0,0358 0,0089 -0,0555 -0,0205
10,36 -0,0311 0,0085 -0,0500 -0,0166 11,04 -0,0288 0,0089 -0,0486 -0,0139 11,33 -0,0278 0,0092 -0,0480 -0,0130
137,75
8,50 -0,0294 0,0084 -0,0504 -0,0154 8,95 -0,0279 0,0079 -0,0473 -0,0149
10,36 -0,0232 0,0073 -0,0409 -0,0119 11,04 -0,0210 0,0077 -0,0398 -0,0094 11,33 -0,0200 0,0080 -0,0393 -0,0082
169,47
8,50 -0,0206 0,0080 -0,0402 -0,0067 8,95 -0,0191 0,0074 -0,0387 -0,0075
10,36 -0,0144 0,0066 -0,0316 -0,0047 11,04 -0,0121 0,0070 -0,0305 -0,0022 11,33 -0,0111 0,0073 -0,0303 -0,0008
238,92
8,50 -0,0012 0,0098 -0,0184 0,0212 8,95 0,0003 0,0092 -0,0158 0,0214
10,36 0,0050 0,0082 -0,0106 0,0230 11,04 0,0073 0,0083 -0,0090 0,0246 11,33 0,0083 0,0085 -0,0088 0,0256
Mean: 162,91 Mean: 10,06 -0,0172 0,0066 -0,0336 -0,0071 *moderator values represent real values, no need to correct for mean-centering *values for moderators are 10th, 25th, 50th, 75th, and 90th percentiles.
The conditional indirect effects of experience on project cycle time through (i.e. high impact ECs)
are shown in table 11. By eye-balling the table we see that at increasing levels of Attention and Team
Diversity the conditional indirect effect increases. The effect stays negative for all values of Team
Diversity, except in combination with very high attention. Similarly, based on a 95% bootstrap
confidence interval, the conditional indirect effect is not statistically different from zero amongst ECs
very high in Attention.
Hypothesis 5a/b and 7a/b: a formal test of moderated mediation
To formally answer the question if increased opportunities to learn are indeed detrimental to learning
via the indirect paths, we need to ask ourselves the question whether the conditional indirect effect at
one value of the moderator is statistically different, compared to some other value of the moderator.
So, does the indirect effect of experience on project cycle time through ECs differ between teams low
versus high in Attention (or Team Diversity)?

40
Therefore, we estimate the difference between the conditional indirect effect at two values of the
moderator of interest. Once the difference is estimated, we need to undertake a bootstrapping
inferential test to test whether the difference is equal to zero. By applying algebra on equation 10 (see
appendix F: 1.3.) we obtain regression coefficients for low impact changes differing on
Attention, . The same method results in for Team Diversity.
Similarly for high impact changes, applying algebra results in equations for Attention
, and in for Team Diversity.
The PROCESS-tool of Hayes (2013) makes it possible to construct a bootstrap confidence interval
through a syntax-option. PROCESS creates a new data file containing 10,000 bootstrap estimates of
every regression coefficient in the model. A subsequent step in the analysis constructs a percentile-
based 95% bootstrap confidence interval for the difference. Notice that is a constant for all
values of W and therefore the outcome of the test does not rely on values of W (or V). Consequently, a
95% confidence interval for that does not contain zero means that any two conditional
indirect effects are significantly different from each other. The tests for this and other combinations of
moderator and mediator can be found in table 12.
Table 12: Formal test of moderated mediation
Mediator x
moderator Test Column Table 8
values Point
estimate Lower
bound Upper
bound
Attention via low impact
COL4*COL16
,0001 ,0006
Attention via high impact
COL11*COL17
.0044 ,0001 ,0005
Team diversity via low impact
COL6*COL16
-,0186 -,0010
Team diversity via high impact
COL13*COL17
.0044 -,0018 ,0089
Increasing attention via low impact has an effect of on project cycle time, with bounds
between and . Similarly increasing attention via high impact has an effect of
with bounds between and . Thereby we can conclude that more Attention spend on
engineering change does not have a favorable impact on the learning via both low and high impact
ECs, thereby rejecting and . For Team diversity we have a result of on project cycle time
via low impact ECs, with bootstrapping bounds that do not straddle zero ( to ).
Therefore, we can accept , since we can conclude that increased levels of Team Diversity are
beneficial to learning via low impact ECs. The bootstrapping bounds of Team Diversity through high
impact ECs however does straddle zero ( to ), and thus we reject based on
insignificance.

41
Hypothesis 5c and 7c: the conditional direct effect
Hypothesis and hypothesis state that increased opportunities to learn are beneficial to learning
via the direct effect of experience on project cycle time. Once again, this effect is moderated and thus
conditional. Due to mean-centering, conditional effects should be interpreted as the effect of on
when moderators are 0. Therefore, direct effect can be interpreted as the effect of on when W
and V are average (0). The direct effect of experience on project cycle time (i.e. lnCT) is, consistent with
the results of stepwise models 1, 2 and 3, negative as indicated by the significant of
. Experience impacts the cycle time, as it grows the cycle time decreases with a
decreasing rate. The direct learning rate is 94,547% (i.e. .
From model 8, we see that moderator Attention has a favorable impact on the learning rate of
experience on project cycle time. The empirical results show that higher Attention is associated with a
higher learning rate, indicated by the significant of . In a similar
vein, higher Team Diversity leads to a steeper curve. The results show that a more diverse team is
beneficial to learning, indicated by the significant of .
Table 13: Conditional direct effect of Experience ( ) on Cycle time ( ) at values of the moderators
Attention ( ) Team Diversity ( ) Effect -values -values
94,80
8,50 0,0074 0,4403 0,6598 8,95 -0,0075 -0,5126 0,6084
10,36 -0,0545 -4,3903 0,0000 11,04 -0,0770 -5,3395 0,0000 11,33 -0,0867 -5,5097 0,0000
109,64
8,50 -0,0005 -0,0312 0,9751 8,95 -0,0154 -1,0716 0,2842
10,36 -0,0624 -5,1621 0,0000 11,04 -0,0849 -6,0080 0,0000 11,33 -0,0946 -6,1160 0,0000
137,75
8,50 -0,0155 -0,9141 0,3609 8,95 -0,0304 -2,0517 0,0405
10,36 -0,0773 -6,1638 0,0000 11,04 -0,0998 -6,8824 0,0000 11,33 -0,1096 -6,9313 0,0000
169,47
8,50 -0,0324 -1,7470 0,0810 8,95 -0,0472 -2,8495 0,0045
10,36 -0,0942 -6,4710 0,0000 11,04 -0,1167 -7,1787 0,0000 11,33 -0,1265 -7,2580 0,0000
238,92
8,50 -0,0693 -2,7825 0,0055 8,95 -0,0842 -3,5855 0,0004
10,36 -0,1312 -5,9520 0,0000 11,04 -0,1537 -6,6337 0,0000 11,33 -0,1634 -6,8133 0,0000
Mean: 162,91 Mean: 11,19 -0,0809 -5,8515 0,0000 *moderator values represent real values, no need to correct for mean-centering *values for moderators are 10th, 25th, 50th, 75th, and 90th percentiles.

42
The conditional direct effect of experience on project cycle time at various values of the moderators is
shown in table 13. By eye-balling the table we see that at increasing levels of Attention and Team
Diversity the conditional direct effect decreases, thus having a beneficial effect on the learning rate.
Based on significance values ( ), the conditional direct effect is not statistically different from zero
amongst ECs with combinations of very low Team Diversity with very low/low/moderate/high
Attention levels. Similarly, the conditional direct effect is not significantly different from zero for
combinations of low Team Diversity and very low/low Attention.
Various tests: netto effects and controlling for passage of time
Netto effects of increased moderator values
Thus, increased opportunities to learn during the generation of ECs have an indirect effect via low and
high impact ECs. While on the other hand, increased opportunities to learn also influence the direct
effect. Simple addition of the moderator effects on indirect and direct effects determines the netto
effect of increased moderator values. Since both effects are using the same parameters/variables, this
simple addition method is justified. Increasing attention has a total effect on the learning rate via both
indirect paths of .00057116, a simple addition of both point estimates from table 12. On the direct
path it has an effect of ( ). This leads us to conclude that increased attention is slightly more
detrimental to learning, .0006 – .0005 = .0001. Which corresponds to a progress rate of
.
Increasing Team diversity has an effect on the learning rate via the indirect paths of +
= –,0056827 (table 12). On the direct path it has an effect of ( ).
Increasing opportunities to learn by higher Team Diversity thus leads to a steeper curve. Without the
insignificant moderator, increased team diversity leads to a progress rate of =
=
Comparing direct and indirect effects
A comparison of the total effects with the indirect effects reveals almost similar effects for direct and
the combined indirect paths. The conditional direct effect at average moderator values is (see
table 13), with confidence intervals unequal to zero ( to ). Whereas the total indirect
effect is , consisting of a summation of the indirect effect of low impact ECs at with
confidence intervals (table 10: to ) and the indirect effect of high impact ECs at
with confidence intervals (table 11: to ). The total learning effect is ,
corresponding to a progress rate of .

43
Control variables
Part of the learning curve might be attributed to external effects, controlled for by the addition of the
passage of time. Table 8 shows two significant negative coefficients of Time, for low impact ECs
and for high impact ECs . This
means that the number of ECs for both types decreases not only as a result of the production of
machines (i.e. experience), based on Argote (2013) we state that external factors are also responsible
for the initiation of ECs. The effect of Time on the project cycle time is however positive and not
significant . Therefore we can conclude that the learning rates of project
cycle time can be attributed to the experience of the own organization (Argote, 2013).
Table 14: Overview of hypotheses and their results
Hypotheses Expected Result Table Accepted?
– 0.0809 * 8 Accepted
LO – 0.0541* 10 Accepted
HI _ 0.0172* 11 Accepted
HI > LO
LO**=
HI**=
HI – LO**=
.0824*
.0242*
.0581*
9 Rejected
LO + Main effect .3600* 8 Rejected
HI + Main effect .1163* 8 Rejected
LO – .000293* 12 Rejected
HI – .000279* 12 Rejected
Direct – .0005* 8 & 13 Accepted
LO + Main effect 41.6592* 8 Accepted
HI + Main effect 9.3562* 8 Accepted
LO – .00902* 12 Accepted
HI – .00333 12 Rejected
Direct – * 8 & 13 Accepted
* significant on the bases of p-values (<0,05) or on the basis of 95% bootstrapping confidence intervals
** tested without moderators

44
7. Discussion & Conclusion
This chapter will discuss the overall conclusions of the thesis project, it will start with a section in which
we will answer the research questions. In the following sections we will first discuss the redesign and
the related managerial implications, next up we discuss the implications for the theory. Lastly, we will
discuss the limitations of this thesis and set possible directions for future research.
7.1. Discussion We started this Master’s thesis with a practical goal, ASML is in need of shorter cycle times in order to
reduce its inflated WIP. In order to bring relevant knowledge to the table, we set a few research
questions that guided us in our quest. Engineering changes were known to bring the product closer to
its end state step by step, while at the same time prolonging the time a machine is assembled. ASML is
in search of methods to balance the speed of their development processes and their learning effects,
striving for both a reduction in project cycle times and an increase of product quality. By uncovering
the factors that accelerate the learning curve, it is possible to conclude on managerial implications
which contribute to a more steep learning curve. We set the following research question:
What role do Engineering Changes play in the relationship between experience and
project cycle time (i.e. the learning curve)?
Our results show that learning takes place via different paths, we found significant results for indirect
and direct paths. Moreover, stepping away from the aggregate form of measurement of ECs allowed
us to study the effects of several types and characteristics of ECs. With the help of Argote et al. (2003)
we gained understanding on why learning occurs, they showed that by providing opportunities to
learn, knowledge could grow. Research by Miner et al. (2001) stated that ECs can be seen as a specific
source of learning, our results underline these findings. We saw the possibility to test detailed
characteristics of ECs by focusing on identifying opportunities to learn during the process of an EC.
More specifically, we identified two separate parts of this EC process; the generation and the
implementation. Engineering changes are implemented at the end, based on their expected impact an
implementation range is assigned to the change. We saw that distinct paths have distinct effects on
learning. Moreover, by setting different paths for low and high impact engineering changes in the
conceptual model, we were able to differentiate between effects of increasing opportunities to learn
during generation of an EC. As a result, our complete model can answer questions on the effect of
increased attention and team diversity on the number of engineering changes and the learning effects
for both high and low impact engineering changes. Thus, we are able to compare paths in the ways
they contribute to the steepness of the learning curve. Furthermore, we saw that ECs bring about
costs of learning, as shown by the positive path b effects.

45
To date the effect of engineering change on new product development speed has been reported with
mixed results. Early research by Adler and Clark (1991) showed contrasting effects for two
departments, they suggested that these differences could possibly be explained by the aggregate form
of measurements. Chen (2010) found that the number and frequency of design iterations are
antecedents of NPD speed. Whereas, a meta-study by Cankurtaran et al. (2013) provided no salient
effects for design iterations. Research lacks both in detail of measurement and longitudinal evidence
of effects.
Our findings suggest that ECs have both direct effects and longitudinal effects on cycle time. On the
one hand do ECs require extra project cycle time, on the other hand ECs contribute to learning. The
longitudinal effects however are dominant, although ECs have a direct prolonging effect on project
cycle time, in the long run they significantly contribute to a steeper curve. These findings are in line
with the hypotheses and results of Alblas and Langerak (2014), who state that the positive effects of
design iterations prevail over the negative effects.
Moreover, by splitting ECs in two groups and still remaining significant results we have shown that
learning follows different paths. This provides evidence for the statement of Miner et al. (2001) that
design iterations (i.e. ECs) can be seen as a specific source of learning. Our hunch is that the paths
describe specific environment in which learning takes place, in which we identify EC learning for the
indirect paths, possibly related to induced or second-order learning, whereas the direct path describes
a more autonomous form of learning.
An EC brings about changes to both product and process, thereby disturbing current operations. For
low impact ECs this results in new to order parts and obsolete stocks, thereby delaying progress of the
machines. High impact ECs are charged with the before mentioned drawbacks of change and
moreover, have direct delaying effects on the machines that are already in production. High impact
changes are must-haves, and unfortunately this leads to large dissembling work, and a change of specs
and thus, test procedures. Their magnitude is therefore, as expected based on research by Terwiesch
and Loch (1999) and Thomke and Fujimoto (2000), greater. Contrastingly to our expectations, not high
impact ECs but low impact ECs are shown to be contributing more to a steeper curve. This effect is
explained by the large influx of low impact ECs, they outnumber the high impact ECs with a ratio of 8:1,
in combination with the less severe direct effect on project cycle time.
Furthermore, the study sought to identify characteristics of Engineering Change that allow for
opportunities to learn. As said, we adopted Argote et al.’s (2003) research, we expected that providing
opportunities to learn facilitates learning. Let us take a more in depth look at the effect of Attention
and Team Diversity.

46
7.1.1. Attention
Remarkably, in contrast to the expectations based on Ocasio’s meta-study (2011) on the effects of
attention, we did not find Attention to be contributing to the number of ECs, nor did we find evidence
that Attention contributes to learning. Our results suggest that increasing Attention does impact the
number of ECs and it also impacts learning, however it does so at the complete opposite of our
expectations. Increasing attention leads to de-learning and lowers the number of ECs. One of the
explanations to these finding might be that at increased levels of Attention, measured by the number
of hours spent on the EC, the EC process gets congested. Terwiesch and Loch (1999) argued that
managing congestion and capacity benefits the EC process. Another explanation could be that due to
the long time spent on ECs (i.e. Attention), the solution might become obsolete. Thomke and Fujimoto
(2000) argue that striving for faster cycles of problem solving reduces the negative effects of ECs. Our
results might have proven their claims with the use of longitudinal data.
Contrastingly, the effect of increased Attention on the direct effect is significant and negative. More
time spent on engineering change (i.e. increased Attention) leads to lower project cycle times. One of
the possible explanations for the significant negative effect of increased Attention on the factory
learning (i.e. direct) effect is the thoroughness of the engineering change. As the knowledge of
engineers is codified in the change and its related documents, the interpretability for the factory
worker benefits from increased time spent (i.e. Attention) on the change. Additionally, we like to
argue that a meticulous change will most likely lead to less adverse propagative effects.
7.1.2. Team diversity
The effects of Team Diversity are different from Attention. In the upcoming paragraph we will walk
through the results of increased levels of Team Diversity on the number of ECs and the direct effect.
The result that higher Team Diversity leads to a higher number of engineering changes (i.e. main
effect) could suggest that cooperation with diverse business functions results in better opportunities
to learn (Argote et al., 2013). We expect that the addition of engineers to a change reduces the
amount of structural holes (Burt, 1992) and therefore opens up new synergetic possibilities. The
results suggest that, in line with Jackson et al. (1995) and Argote (2013), a more diverse group is better
able to combine different types of knowledge, is more creative and innovative, resulting in more ideas
and better decision making, leading to additional engineering changes. Moreover, the moderating
effect of Team Diversity on engineering changes is negative and significant (for only the low impact
ECs) suggesting that Team Diversity contributes to learning via the low impact ECs. Thus, Team
Diversity also leads to learning, at higher levels of the moderator the learning curve going via ECs will
get steeper. Team diversity also impacts the direct effect, it significantly contributes to a more
negative learning rate shown by the significant negative effect on the direct path. In line with the

47
previous moderator Attention, our hunch is that learning takes place in two separate environments.
Higher levels of Team Diversity lead to a more thorough and meticulous change, increasing the
interpretability for the factory worker and thus making his work easier. Moreover, we expect that a
more thoughtful engineering process involving other business functions will lead to less adverse
propagative effects.
7.2. Theoretical implications
The upcoming section will answer how the gaps, as summarized in the last paragraph of the
literature section, are filled. For clarity, the gaps are 1) the lack of using cycle times as an outcome
measure of learning curve theory. 2) current studies lack conditions under which organizational
phenomenon result in learning, more specifically we miss a decomposition of ECs based on increased
opportunities to learn. 3) current research on the effect of ECs lacks longitudinal data. 4) empirical
principles need statistical support.
Classic learning curve literature makes use of two dominant outcome measures, unit costs or number
of labor hours. Our study showed evidence that project cycle time is a function of Experience, adding
another outcome variable that have been found to follow a learning curve. Moreover, our research is
one of the first studies that links ECs to cycle time with longitudinal evidence. Adler and Clark (1998)
found evidence for this relationship, but their research lacked longitudinal evidence. Our results add to
the literature by showing that ECs have both direct and longitudinal effects. Thus, ECs affect both the
cycle time as well as the learning curve.
Furthermore, we add to the literature by stepping away from the aggregate form of measurement
(Argote, 2013) and proposing an EC classification based on impact. High impact ECs have greater
delaying effects on the project cycle time. Contrary to our expectations, low impact ECs contribute
more to learning than do high impact ECs. Research should try to answer the question whether this is
due the large difference in number of implemented changes.
Our research is the first that searched for opportunities to learn (Argote et al., 2003) which increase
the number of future ECs. We found Team Diversity to contribute to more changes. Our results for
Attention, which did not contribute to learning, suggest that just providing the opportunity to learn in
its own does not always lead to learning. Other factors are in play which affect the process of learning.
By testing the effect of opportunities to learn on separate paths we opened a black box. We saw
contradicting effects of increased opportunities to learn, on the one hand it was disadvantageous to
learning via the mediated path, on the other hand the direct effect benefits from increased values.
Future research should set goals to try and understand why these differences exist.

48
The application of quantitative research validated research that gave suggestions on how to cope with
the process of Engineering Change Management. Most literature is based on case study research, and
thus lacks quantitative evidence. With the use of longitudinal data, we showed that the following
claims on reducing the negative effects of ECs are true; decreasing the impact of a change (Terwiesch
& Loch, 1999), speeding up the process by decreasing EC cycle times (Terwiesch & Loch, 1999),
communicate between functions both horizontal and vertical (Thomke and Fujimoto, 2000), strive for
faster cycles of problem solving (Thomke and Fujimoto, 2000), and communication with multi-
disciplinary teams (Terwiesch et al., 2002).
7.3. Managerial implications
Our results provides ASML with knowledge on the delaying effects of ECs (i.e. the cost of learning) in
which we can differentiate between low and high impact ECs. Moreover, our results show that
increasing the diversity of teams lead to learning in the EC process, the number of ECs increases and
the learning curve gets steeper. Contrary to our expectations, increased levels of attention lead to de-
learning. In the previous section we suggested that this might be due to knowledge becoming obsolete
and the process becoming congested. Therefore, we advise to strive for faster cycles of problem
solving.
Employees of ASML told us that especially the large influx of low impact engineering changes was
killing for project cycle times and did not contribute as much to learning as the high impact engineering
changes. Our results tell us otherwise, the low impact engineering changes contribute significantly
more to the learning curve. As expected, the delaying effect for high impact engineering changes was
greater than those engineering changes labeled as low impact. Although the large amount of low
impact changes show clear negative effects on project cycle time, the learning effect is significantly
improving their learning curve.
7.3.1. Redesign
Based on our research, that combined qualitative and quantitative research, we see a couple of
opportunities to increase the effectiveness of the EC-process. Literature on learning curve theory and
engineering change management provides us with general knowledge on how to handle engineering
change processes and how to reduce their negative consequences. This knowledge is shown in table
15, combined with the results of the quantitative research and lastly complemented with the
qualitative research in the form of the interviews (see appendix B, table 16). Based on table 15 we
would like to propose several improvement points.
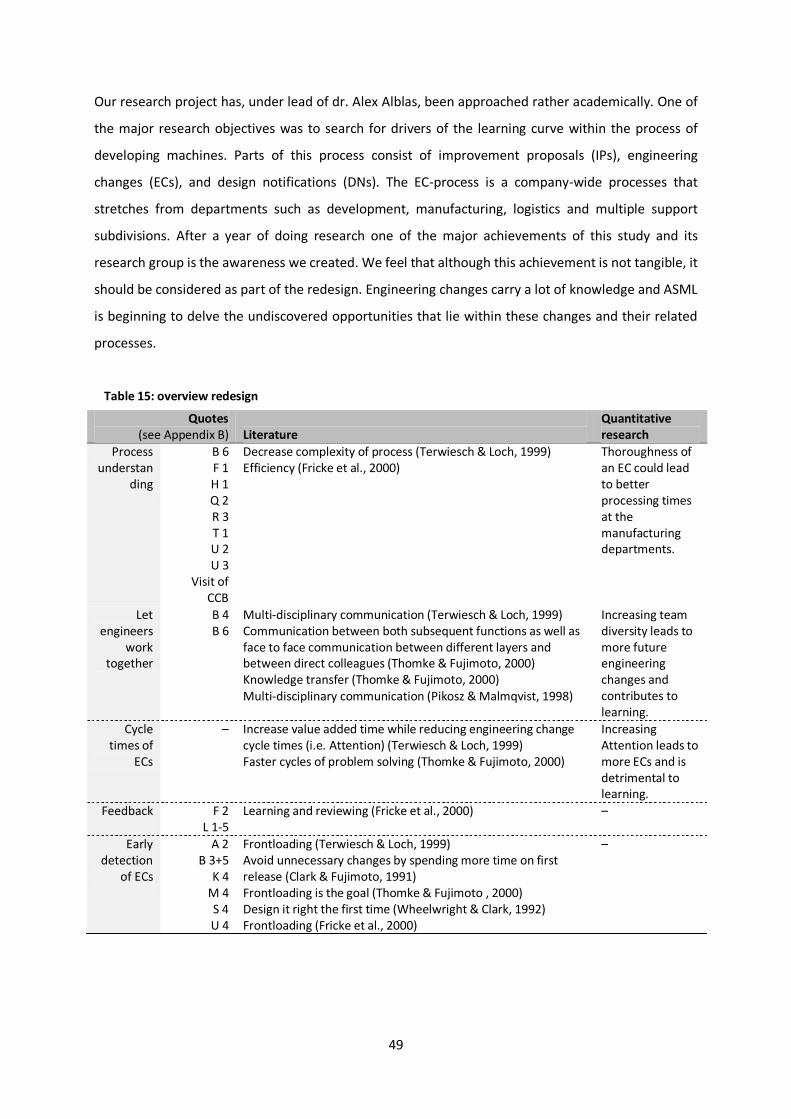
49
Our research project has, under lead of dr. Alex Alblas, been approached rather academically. One of
the major research objectives was to search for drivers of the learning curve within the process of
developing machines. Parts of this process consist of improvement proposals (IPs), engineering
changes (ECs), and design notifications (DNs). The EC-process is a company-wide processes that
stretches from departments such as development, manufacturing, logistics and multiple support
subdivisions. After a year of doing research one of the major achievements of this study and its
research group is the awareness we created. We feel that although this achievement is not tangible, it
should be considered as part of the redesign. Engineering changes carry a lot of knowledge and ASML
is beginning to delve the undiscovered opportunities that lie within these changes and their related
processes.
Quotes (see Appendix B)
Literature
Quantitative
research
Process
understanding
B 6 F 1 H 1 Q 2 R 3 T 1 U 2 U 3
Visit of CCB
Decrease complexity of process (Terwiesch & Loch, 1999) Efficiency (Fricke et al., 2000)
Thoroughness of an EC could lead
to better
processing times
at the
manufacturing
departments.
Let
engineers
work
together
B 4 B 6
Multi-disciplinary communication (Terwiesch & Loch, 1999) Communication between both subsequent functions as well as
face to face communication between different layers and
between direct colleagues (Thomke & Fujimoto, 2000) Knowledge transfer (Thomke & Fujimoto, 2000) Multi-disciplinary communication (Pikosz & Malmqvist, 1998)
Increasing team
diversity leads to
more future
engineering
changes and
contributes to
learning.
Cycle
times of ECs
–
s Increase value added time while reducing engineering change
cycle times (i.e. Attention) (Terwiesch & Loch, 1999) Faster cycles of problem solving (Thomke & Fujimoto, 2000)
Increasing
Attention leads to
more ECs and is
detrimental to
learning.
Feedback
F 2 L 1-5
Learning and reviewing (Fricke et al., 2000) –
Early
detection
of ECs
A 2 B 3+5
K 4 M 4 S 4 U 4
Frontloading (Terwiesch & Loch, 1999) Avoid unnecessary changes by spending more time on first
release (Clark & Fujimoto, 1991) Frontloading is the goal (Thomke & Fujimoto , 2000) Design it right the first time (Wheelwright & Clark, 1992) Frontloading (Fricke et al., 2000)
–
Table 15: overview redesign

50
Process understanding
During my visits of several meetings concerning a go/no-go decision for individual ECs, it came to my
attention that owners of the ECs (i.e. developers/engineers) lacked process understanding. Although
information on what to prepare before visiting a meeting such a CCB or CIB is available, employees
presented ECs that lack essential elements, thereby unwillingly postponing their GO-decision with half
a week. We would like to argue that employees who are sufficiently educated on the need of a
delivering a meticulous engineering change with all its vital elements are more aware of the common
pitfalls and therefore will less likely be shown back to the drawing board to complement an EC. This
will lead to higher value added times, less postponed ECs, faster cycles of problem solving, and makes
capacity and congestion better manageable. Even more so, a highly meticulous EC will probably result
in higher interpretability for the manufacturing employees, leading to faster cycle times. Additionally,
we like to argue that a meticulous change will most likely lead to less adverse propagative effects.
Let engineers work together
All types of evidence (e.g. literature, data, and interviews) show us that a more diverse team leads to
an increase of engineering change. Multi-disciplinary teams are already put in action, therefore we
would like to propose to underline the need for knowledge-asking and –sharing in the engineering
change process. It clearly leads to better, and more ideas. The current descriptions of the EC-process
and related processes are highly technical process-wise, they could benefit from recalling the need for
multi-disciplinary knowledge-asking and –sharing.
Cycle times of ECs
Based on literature of Terwiesch and Loch (1999) we see improvements for efficiency of the EC-
process. They argue that the process benefits from bringing it to higher speeds, this can be achieved by
increasing value added times, decreasing engineering change cycle times, decreasing the complexity
of the process, by managing capacity and congestion, and by performing setups and batching. In
recent years plans have been initiated to increase the efficiency of the process. Many times these
plans were proven to be too ambitious, partly since the change of the EC-process will have
companywide implications, partly since there is no time left to make major changes to the process.
Therefore, we keep our recommendations as modest as possible. Employees need to be educated on
all process steps of an EC, this process is the backbone of ASML, responsible for bringing new functions
to the product, reducing costs, and improving quality. Small improvements, that reduce the amount of
iterations necessary for each EC due to lack of process understanding, will lead to increased value
added times, lower EC cycle times, and lower complexity by better understanding of the process.

51
Feedback
ASML’s engineering change process does a lot of things right, what the current process clearly lacks is a
moment for feedback. The interviews revealed that due to time and capacity constraints engineers are
constantly in a hurry to achieve their next goals, and therefore are not able to reflect on their work.
Literature shows however that feedback and reflection could result in better learning, leading to a
steeper curve. Even more remarkable are the problems that are caused by the separation of
responsibility for changes on machines on the floor, and at the field (i.e. the customer). The current
division of implementation range options leads to changes that are postponed since their effects
would seriously disturb the project cycle time goals and thereby the assessment rating of development
and manufacturing. As a result, expense and time consuming FCOs (i.e. ECs for the field) are executed.
Furthermore, major upgrades, which could lead to lots of learning, are postponed based on cycle time
priority. We would like to address that a restructuring of the implementation range could solve this
issue.
Early detection of ECs
This concept is already embraced by ASML, at early stages of product maturity (i.e. proto-phase) the
one and only goal is to detect mistakes in the design and initiate lots of ECs to tackle problems and
introduce new product functionalities. In a later stage (i.e. pilot and volume-phases) manufacturing
takes over the responsibility for the machines from D&E and strives for controllable lower cycle times.
Many interviewees warned that a too early shift of responsibility could lead to a seesaw-effect,
whereas cycle times in later stages go up instead of down. The holy grail is considered to be
frontloading, a concept whereby the majority of ECs is executed in the early stages of product
development. The frontloading values is calculated by taking the percentage of ECs implemented in
each sub-period of the total cycle time. By averaging out the sub-period percentages we get a value
that represents the frontloading-value, where this figure can be graphically represented by a curve
which can be more concave (i.e. low average frontloading) and more convex (i.e. high average
frontloading). Unfortunately we were not able to test at what values of frontloading the learning curve
contributes since current research methods did not provide enough opportunities to include this
platform-wide values.
Data
This leads us to speak out our concerns on data and how to deploy this data to create knowledge. First
of all, we noticed that in the current EUV-factory exact cycle times are not sufficiently logged. The
common reason given is that since cycle times are not important in these stages of development, as
well as cycle times are highly flexible and uncertain so the ambiguity leads to unmanageable
processes. We feel that ASML could benefit from a system that links current ECs to past ECs in order to

52
get to understand their propagative effects. By studying these effects and their antecedents the
process could be fine-tuned and unnecessary or unwanted changes could be identified. Future
research at ASML, as conducted by dr. Alex Alblas, could benefit from operationalisations of concepts
that I choose to set aside. These concepts can be found in appendix D, in table 17.
7.4. Limitations and future research
These results are based on data obtained from the XT and NXT programs. Although these programs
and the NXE program share similarities in the forth bringing processes of engineering change
differences in technology and ambiguity could result in unexpected consequences of our managerial
implications. Future research should try to control for the increased ambiguity and the incorporation
of overseas business functions. The NXE-program is still very much in the early stages of development
and production is already invited to take part in development. Several employees told us that data on
NXE is not sufficiently logged, could have large errors and has too few data entries to study
longitudinal. We would urge the program to start logging all engineering changes in detail, while also
entering precise dates for the production of machines. Since the NXE program tries to benefit from our
insight future research should incorporate controls for the stage of development. We foresee
differences in the effects of moderators at various stages in development.
We would like to underline that the used variables are all proxies in that they approach certain
concepts but do not precisely describe them. Attention is measured by the number of hours that an
engineering change was in process. However, the degree of Attention may differ in various stages of
advancing the engineering change. To more accurately describe the amount of attention spend on a
change we would like research to look at more precise ways to measure this concept. For example, the
amount of slack (i.e. excess capacity) determines if an engineering change is rushed or is given the
proper amount of attention it needs. Higher values of slack could result in more experimentation,
resulting in innovative insights and thorough knowledge search actions.
Team Diversity is also a proxy, we would like to see future research that tries to see which types of
business functions contribute to the engineering change and how much they bring to the table. Our
data made it only possible to see what functions cooperated, not how many hours they put into the
engineering change. Moreover, research could focus on which combinations of business functions
contribute to learning effects. These limitations and/or reservations on/off our data show that
although we definitely dived deeper into the aggregate form of measuring engineering changes there
is still room for improvement. We could expand the characteristics in both width and depth.

53
Another point of interest is the classification of engineering changes, more changes does not
automatically mean better changes. First of all with the data currently available it is impossible to
classify the propagative effects of engineering changes. Future research should answer the question
what types of engineering changes lead to optimal learning. Our research focused on the energy that is
put into a change, not on the quality of the change. We cannot diversify between changes, we need to
further understand the characteristics that make one change a foolish undertaking and the other the
predecessor of innovative insights. Without further going into this discussion, we like to underline that
all engineering changes increase knowledge, even when it tells engineers on what not to do.
Our conceptual model which uses moderators shows us at what levels of the moderator it has a
certain effect on the consequent variables. Although we were not able to perform the desired
floodlight analysis, we specifically chose for the most generalizable method for spotlight analysis. By
using a percentiles approach we have a broad scale of Attention and Team Diversity. It is important to
interpret the very low, low, moderator, high, and very high levels of the moderators as relative to the
context under study.
Attention and Team Diversity, classified as opportunities to learn were adopted from Argote et al.
(2003). Besides opportunities to learn, they suggested that learning benefits from increased capability
and motivation of employees. Especially the combination of said contributors to learning was an
effective way to stimulate learning. Therefore, we would like to see the question answered if
interactions of the causal mechanisms are even more effective to learning.
Furthermore, we found several characteristics of engineering change that we assume affect the
relationship between experience and project cycle time. Unfortunately, we were not always able to
incorporate these effects due to the statistical model and its limitations. We would like to see research
that is able to incorporate characteristics ECs at a higher hierarchical level such as a frontloading ratio,
which tells us how many of the changes were executed early in the life of a program. Another example
is the pace of engineering changes over time, ranging from a steady flow to a highly fluctuating influx.
Other characteristics that were found (see appendix D, table 17) but not tested are for instance; the
skewness and kurtosis of changes on modules, the number of iterations before a engineering change is
approved, the reason for change, and the source of the change.
Future research can also look into reducing the negative consequences of engineering change by
studying characteristics of the changes and testing their moderating effects. In that way management
could oversee both the benefits of learning (i.e. more knowledge in the form of ECs) as well as the
costs of learning (i.e. the delaying effects of ECs), and consider the right balance for beneficial learning.

54
Appendix A: References
Acar BS, Benedetto-Neto H, Wright IC (1998) Design change: problem or opportunity. In: Proceedings of engineering design conference ‘98, Brunel University, UK, Professional Engineering Publishing, Bury St. Edmunds, pp 445–454 Adler, P. S., & Clark, K. B. (1991). Behind the learning curve: A sketch of the learning process. Management
Science, 37(3), 267-281. Aiken, L. S., & West, S. G. (1991). Multiple regression: Testing and interpreting interactions. Thousand Oaks, CA: Sage Publications.
Alblas, A., & Langerak, F. The impact of design debugging on new product development speed: the
significance of improvisational and trial-and-error learning. Pomsmeetings.org, 2014 Anderson DM (1997) Agile product development for mass customisation. Irwin Professional Publishing, Chicago Anzai, Y., & Simon, H. A. (1979). The theory of learning by doing. Psychological review, 86(2), 124. Argote, L. (1993). Group and organizational learning curves: Individual, system and environmental components. British Journal of Social Psychology, 32 , 31–51. Argote, L. (2013). Organizational learning: Creating, retaining and transferring knowledge. Springer. Argote, L., & Darr, E. (2000). Repositories of knowledge in franchise organizations: Individual, structural and
technological. The nature and dynamics of organizational capabilities, 82(1), 51-65. Argote, L., & Epple, D. (1990). Learning curves in manufacturing. Science,247(4945), 920-924. Argote, L., & Miron-Spektor, E. (2011). Organizational learning: From experience to knowledge. Organization
Science, 22(5), 1123-1137. Argote, L., & Todorova, G. (2007). Organizational learning. International review of industrial and
organizational psychology, 22, 193. Argote, L., Beckman, S. L., & Epple, D. (1990). The persistence and transfer of learning in industrial settings. Management science, 36(2), 140-154. Argote, L., Epple, D., Rao, R. D., & Murphy, K. (1997). The acquisition and depreciation of knowledge in a
manufacturing organization: Turnover and plant productivity. Unpublished manuscript, Carnegie Mellon
University. Argote, L., McEvily, B., & Reagans, R. (2003). Managing knowledge in organizations: An integrative framework
and review of emerging themes. Management science, 49(4), 571-582. Arrow, K. (1962). Economic welfare and the allocation of resources for invention. In The rate and direction of inventive activity: Economic and social factors (pp. 609-626). Nber. Bahk, B. H., & Gort, M. (1993). Decomposing learning by doing in new plants. Journal of Political Economy, 561-583. Balcerak KJ, Dale BG (1992) Engineering change administration: the key issues. Comput-Integr Manuf Syst
5(2):125–132

55
Baldwin CY, Clark KB (1997) Managing in an age of modularity. Harv Bus Rev 75(5):84–93 Baloff, N. (1966). The learning curve--some controversial issues. The Journal of Industrial Economics, 275-282.
Baloff, N. (1971). Extension of the Learning Curve--Some Empirical Results. Operational Research Quarterly, 329-340.
Baum, J. A., & Ingram, P. (1998). Survival-enhancing learning in the Manhattan hotel industry, 1898–1980. Management Science, 44(7), 996-1016
Burt, 2009 Burt, R. S. (2009). Structural holes: The social structure of competition. Harvard university press.
Cankurtaran, P., Langerak, F., & Griffin, A. (2013). Consequences of New Product Development Speed: A
Meta‐Analysis. Journal of Product Innovation Management, 30(3), 465-486.
Carter, D. E., & Baker, B. S. (1992). CE, concurrent engineering: the product development environment for the
1990s (pp. 1-2). Reading, MA: Addison-Wesley.
Chen, J., F. Damanpour, and R. R. Reilly. 2010. Understanding antecedents of new product development
speed:Ameta-analysis. Journal of Operations Management 28 (1): 17–33.
Chew, W. B., Bresnahan, T. F., & Clark, K. B. (1990). Measurement, coordination, and learning in a multi-plant
network. Measures for manufacturing excellence, 129-162.
Clark KB, Fujimoto T (1991) Product development performance: strategy, organization and management in
the world auto industry. Harvard Business School Press, Boston Wright IC (1997) A review of research into
engineering change management: implications for product design. Des Stud 18:33–42
Conway, R. and A. Schultz, "The Manufacturing Progress Function," J. Industrial Engineering, 10, 1 (1959), 39-53. Cooper, R. G. (2008). Perspective: The Stage‐Gate® idea‐to‐launch process—Update, what's new, and NexGen
systems*. Journal of Product Innovation Management, 25(3), 213-232. Crawford, C. M., & Di Benedetto, C. A. (2011). New products management. Tata McGraw-Hill Education. Crossman, E. R. F. W. (1959). A THEORY OF THE ACQUISITION OF SPEED-SKILL. Ergonomics, 2(2), 153-166. Dale BG (1982) The management of engineering change procedure. Eng Manag Int 1(3):201–208 Darr, E. D., Argote, L., & Epple, D. (1995). The acquisition, transfer, and depreciation of knowledge in service
organizations: Productivity in franchises. Management science, 41(11), 1750-1762. DiPrima MR (1982) Engineering change control and implementation considerations. Prod Inventory Manag
23(1):81–87 Dutton, J. M., & Thomas, A. (1984). Treating progress functions as a managerial opportunity. Academy of Management Review, 9(2), 235-247. Eckert CM, Clarkson PJ, Zanker W (2004) Change and customization in complex engineering domains. Res Eng
Des 15(1):1–21 Eisenhardt, K. M., & Tabrizi, B. N. (1995). Accelerating adaptive processes: Product innovation in the global computer industry. Administrative science quarterly, 84-110.

56
Epple, D., Argote, L., & Murphy, K. (1996). An empirical investigation of the microstructure of knowledge
acquisition and transfer through learning by doing. Operations Research, 44(1), 77-86. Fiol, C. M., & Lyles, M. A. (1985). Organizational learning. Academy of management review, 10(4), 803-813. Fricke E, Gebhard B, Negele H, Igenbergs E (2000) Coping with changes: causes, findings and strategies. Syst
Eng 3(4):169–179 Greenberg, L. (1971). Why the mine injury picture is out of focus. Mining Engineering, 23, 51–53. Hayes, A. F. (2013). Introduction to mediation, moderation, and conditional process analysis: A regression-based approach. Guilford Press. Hayes, R. H., & Clark, K. B. (1986). Why some factories are more productive than others. Harvard Business
Review, 64(5), 66-73. Hirsch, W. Z. (1952). Manufacturing progress functions. Review of Economics and Statistics, 34, 143–155. Hirschmann, W. B. (1964). Pro fi t from the learning curve. Harvard Business Review, 42 (1), 125–139. Huang GQ, Johnstone G (1995) CMCEA: change mode, cause and effects analysis—a concurrent engineering
approach to costeffective management of product design changes. In: Proceedings of 10th international conference on engineering design, Prague, Czech Republic, 2, pp 496–501 Huang GQ, Mak KL (1999) Current practices of engineering change management in UK manufacturing
industries. Int J Oper Prod Manag 19(1):21–37 Huang GQ, Yee WY, Mak KL (2003) Current practice of engineering change management in Hong Kong
manufacturing industries. J Mater Process Technol 139(1/3):481–487 Huber, G. P. (1991). Organizational learning: The contributing processes and the literatures. Organization
Science, 2 , 88–115. Ingram, P., & Baum, J. A. C. (1997). Opportunity and constraint: Organizations’ learning from the operating
and competitive experience of industries. Strategic Management Journal, 18 , 75–98. Inness J (1994) Achieving successful product change. Financial Times/Pitman Publishing, London Jackson, S. E., May, K. E., & Whitney, K. (1995). Understanding the dynamics of diversity in decision-making
teams. Team effectiveness and decision making in organizations, 204, 261. Jarratt TAW, Eckert CM, Clarkson PJ (2004) Engineering change. In: Clarkson PJ, Eckert CM (eds) Design
process improvement. Springer, New York Jarratt, T. A. W., Eckert, C. M., Caldwell, N. H. M., & Clarkson, P. J. (2011). Engineering change: an overview
and perspective on the literature. Research in engineering design, 22(2), 103-124. Joskow, P. L., & Rozanski, G. A. (1979). The effects of learning by doing on nuclear plant operating reliability. Review of Economics and Statistics, 61 , 161–168. Kelsey, S. F., Mullin, S. M., Detre, K. M., Mitchell, H., Cowley, M. J., Gruentzig, A. R., & Kent, K. M. (1984). Effect
of investigator experience on percutaneous transluminal coronary angioplasty. American Journal of Cardiology, 53 , 56C–64C.

57
Leech DJ, Turner BT (1985) Engineering design for profit. Ellis Horwood Ltd, Chichester Lester, R. K., & McCabe, M. J. (1993). The effect of industrial structure on learning by doing in nuclear power
plant operation. The Rand Journal of Economics, 418-438. Levinthal, D., & Rerup, C. (2006). Crossing an apparent chasm: Bridging mindful and less-mindful perspectives
on organizational learning. Organization Science, 17(4), 502-513. Levitt, B., & March, J. G. (1988). Organizational learning. Annual review of sociology, 319-340. Levy, F. K. (1965). Adaptation in the production process. Management Science, 11 (6), B136–B154. Lieberman, M. B. (1984). The learning curve and pricing in the chemical processing industries. The Rand
Journal of Economics, 15 , 213–228. Lieberman, M. B. (1987). The learning curve, diffusion, and competitive strategy. Strategic Management
Journal, 8 , 441–452. Lincke, W. (1995). Simultaneous engineering: neue Wege zu überlegenen Produkten. Hanser. Lindemann U, Reichwald R (1998) Integriertes Änderungsmanagement. Springer, Berlin Loch CH, Terwiesch C (1999) Accelerating the process of engineering change orders: capacity and congestion
effects. J Prod Innov Manag 16(2):145–159 Loch, C. H., & Terwiesch, C. (1998). Communication and uncertainty in concurrent engineering. Management
Science, 44(8), 1032-1048. MacKinnon, D. P., Lockwood, C. M., & Williams, J. (2004). Confidence limits for the indirect effect: Distribution
of the product and resampling methods. Multivariate Behavioral Research, 39, 99–128. Maull R, Hughes D, Bennett J (1992) The role of the bill-of-materials as a CAD/CAPM interface and the key
importance of engineering change control. Comput Control Eng J 3(2):63–70 Miner, A. S., Bassof, P., & Moorman, C. (2001). Organizational improvisation and learning: A field study. Administrative science quarterly, 46(2), 304-337 Monahan RE (1995) Engineering documentation control practices and procedures. Marcel Dekker Inc, New
York, USA Moorman, C., & Miner, A. S. (1997). The impact of organizational memory on new product performance and
creativity. Journal of marketing research, 91-106. Muth, J. F. (1986). Search theory and the manufacturing progress function. Management Science, 32 , 948–962. Nadler, J., L. Thompson, L. Van Boven. 2003. Learning negotiation skills: Four models of knowledge creation
and transfer. Man-agement Sci. 49(4) 529-540.
Nigam, A., & Ocasio, W. (2010). Event attention, environmental sensemaking, and change in institutional logics: An inductive analysis of the effects of public attention to Clinton's health care reform initiative. Organization Science, 21(4), 823-841. Ocasio, W. 1997. Towards an attention-based view of the firm. Strategic Management J. 18(S1) 187–206

58
Ollinger GA, Stahovich TF (2001) ReDesignIT—a constraint-based tool for managing design changes. In: Proceedings of ASME design engineering technical conferences, Pittsburgh, USA, CD-ROM, paper no. DETC2001/DTM-21702 Pentland, B. (1992). Organizing moves in software support hot lines. Administrative Science Quarterly, 37 , 527–548. Pikosz, P., & Malmqvist, J. (1998, September). A comparative study of engineering change management in
three Swedish engineering companies. Proceedings of Design Engineering Technical Conference, Atlanta (Vol. 1). Pisano, G. P., Bohmer, R. M. J., & Edmondson, A. C. (2001). Organizational differences in rates of learning: Evidence from the adoption of minimally invasive cardiac surgery. Management Science, 47 (6), 752–768. Preacher, K. J., Rucker, D. D.,&Hayes, A. F. (2007). Assessing moderated mediation hypotheses: Theory, methods, and prescriptions. Multivariate Behavioral Research, 42, 185–227. Preston, L., & Keachie, E. (1964). Cost functions and progress functions: An integration. American Economic
Review, 54 (2), 100–107. Rapping, L. (1965). Learning and World War II production functions. Review of Economics and Statistics, 47 , 81–86. Reidelbach MA (1991) Engineering change management for long lead-time production environments. Prod
Inventory Manag J 32(2):84–88 Roberts, P. C. (1983). A theory of the learning process. Journal of Operations Research, 34, 71–79 Rouibah, K., & Caskey, K. R. (2003). Change management in concurrent engineering from a parameter
perspective. Computers in Industry, 50(1), 15-34. Rowell WF, Duffy AHB, Boyle IM, Masso, N (2009) The nature of engineering change in a complex product
development cycle. In: Kalawsky RS (ed) Proceedings of 7th annual conference on systems engineering
research 2009 (CSER 2009). Available at http://cser.lboro.ac.uk/abstracts/S04-25.html Schilling, M. A., P. Vidal, R. Ployhart, A. Marangoni (2003). Learning by doing something else: Variation, relatedness, and organizational learning. Management Sci. 49(1) 39-56. Searle, A. D., & Gody, C. S. (1945). Productivity changes in selected wartime shipbuilding programs. Monthly
Labor Review, 61 , 1132–1147. Smith, R. P., & Eppinger, S. D. (1997). A predictive model of sequential iteration in engineering design. Management Science, 43(8), 1104-1120. Soderberg, L. G. (1989). Facing up to the engineering gap. McKinsey Quarterly, Spring, 3-23. Solow, R. (1957). Technical change and the aggregate production function. Review of Economics and
Statistics, 39 , 312–320. Spiller, S. A., Fitzsimons, G. J., Lynch, J. G., & McClelland, G. H. (2013). Spotlights, floodlights, and the magic
number zero: Simple effects tests in moderated regression. Journal of Marketing Research, 50, 277–288.

59
Stasser, G., & Titus, W. (1987). Effects of information load and percentage of shared information on the
dissemination of unshared information during group discussion. Journal of Personality and Social Psychology, 53 , 81–93. Terwiesch C, Loch CH (1999) Managing the process of engineering change orders: the case of the climate
control system in automobile development. J Prod Innov Manag 16(2):160–172 Terwiesch, C., Loch, C. H., & Meyer, A. D. (2002). Exchanging preliminary information in concurrent
engineering: Alternative coordination strategies.Organization Science, 13(4), 402-419. Thomke, S., & Fujimoto, T. (2000). The Effect of “Front‐Loading” Problem‐Solving on Product Development
Performance. Journal of product innovation management, 17(2), 128-142. Thurstone, L. L. (1919). The learning curve equation. Psychological Monographs: General and Applied, 26(3), i-51. Ulrich KT (1995) The role of product architecture in the manufacturing firm. Res Policy 24:419–440 Weick, K. E. (1979). The social psychology of organizing (Topics in social psychology series) Wheelwright, S. C., & Clark, K. B. (1992). Creating project plans to focus product development. Harvard
Business School Pub.. Wiersma, E. (2007). Conditions that shape the learning curve: Factors that increase the ability and
opportunity to learn. Management Science, 53(12), 1903-1915. Williams, K. Y., & O’Reilly, C. A. (1998). Demography and diversity in organizations: A review of 40 years of research. Research in Organizational Behavior, 20 , 77–140. Womer, N. K. (1984). Estimating learning curves from aggregate monthly data. Management Science, 30 , 982–992. Woodman, R. W., Sawyer, J. E., & Griffin, R. W. (1993). Toward a theory of organizational creativity. Academy
of management review, 18(2), 293-321. Wright IC (1997) A review of research into engineering change management: implications for product design. Des Stud 18:33–42 Wright, T. P. (1936). Factors affecting the costs of airplanes. Journal of the Aeronautical Sciences, 3 , 122–128. Yelle, L. E. (1979). The learning curve: Historical review and comprehensive survey. Decision Sciences, 10 , 302–328.

60
Appendix B: Overview of quotes In the following table (table 16) the most interesting quotes obtained during multiple interview
sessions are presented. Both quotes made during explorative interviews, as well as during the
conduction of the semi-structured interviews, are shown in the second column. The first column
shows the name and function of the interviewee.
Table 16: overview of interview quotes
Person Quotes
A 1. The LC is different for several modules, for instance the scanner module is faster in its
maturity than the source module. 2. During the proto phase of development the main priority is to detect errors in the design. 3. There are several reasons to implement an EC, such as CoG (cost of goods), RAMS
(reliability, availability, manufacturability, serviceability), Safety (for a more comprehensive
overview see ASML-Q in appendix C). An EC that is developed with good delta management in mind results in less negative
propagative effects.
B
1. The effects of ECs on the factory floor (i.e. production) are influenced by the priority and
planning of the EC. 2. CIB (change implementation board) and the CCB (change control board) are the
institutions that control and deliver the ECs to the factory floor. The implementation range
is determined, at later stages of implementation the downtime and costs will be higher. 3. Priorities per phase Proto: due to ambiguous effects of ECs the goal is to find as much errors by implementing a
lot of ECs without much implementation control. Almost all ECs are accepted. Pilot: these machines will go to the customer. The organization changes from matrix to a
line-organization. 4. In order to make the most out of ECs it’s important to let developers work together, together they will come to greater results.
5. The early detection of issues is essential since D&E is still involved and responsible for the
machines. In later phases (pilot/volume) manufacturing is responsible for machines and
their goal is low cycle times. 6. We have a daily meeting with the guys from development, we tell them as the guys from
production what we have encountered, what we tackled and what still are issues. These
short lines, in combination with the broad knowledge of all functionalities, make it easier to
appoint responsibility. This is especially done for the NPI-phase.
C 1. ECs solve issues but also create new DNs and ECs, therefore, we could say they have
propagative effects. 2. Unfortunately, solving problems at ASML (i.e. DNs and ECs) are guided by the wrong
priorities. Low hanging fruit is done first, later on there is not enough time to solve the hard
ones (of which we could learn the most), leading to the abortion of these changes.

61
Person Quotes
D 1. The initiation of ECs could be due to the implementation of another EC.
E 1. After asking the question how knowledge flows from D&E to manufacturing he argues
that it’s hard to balance learning and cycle time due to pressure for delivery. Leads to lack of knowledge for FLS. 2. Even more so, some changes are seen only a couple of times in the total lifetime of a
product. Therefore this knowledge is difficult to disseminate.
F 1. His team takes part in the CRB (change release/review board) where they approve the EC
together with the developer, which takes place after the CIB. A visit of the researcher at this
meeting resulted in a detection of inefficient processes, developers did not comply to the
process requirements of ECs. Thereby delaying the delivery of their EC to the next meeting. 2. After implementation there is no feedback, learning after doing is not taking place. Learning is unfortunately not the first priority, although it should be, due to capacity
constraints we focus on short term advancements and timing goals. We need to reflect to
learn.
G 1. At the C-team we bring together functional reviewers of ECs.
H 1. At different modules there are different cultures, for instance at the source there is a
cowboy culture. Due to the fact that many employees are new, they are preoccupied with
learning their own processes than contributing to the process.
I 1. NPL (new product logistics) and ME (manufacturing engineering) are responsible for
making the implementation plan of an EC.
J 1. The WIP/FAT data tells you about the implementation range of an EC and is a good
indicator for the impact of a change. 2. Generic EC processes are used for NXE/NXT. Not much has changed for the storage of data in the ASML-Q application, nothing radical at least.
K 1. The CCB looks at the expected impact of an EC and makes the go/no-go decision. 2. Over the different phases the basic process does not change. The types of problems on
the other hand does change. 3. The encountered issues keep coming, that’s a given. Whenever stability is reached, you
could go on with accepting changes that are nice to have. 4. D&E does not care about cycle time, it’s of low priority to them. The amount of issues
that needs to be solved is so big, therefore it is of no importance to prioritize cycle time. 5. Prioritizing is mainly based on RAMS classification. 6. The EUV processes are different compared to the old NXT processes in that ASML needs
to vertically integrate processes with more suppliers and new business units from overseas. This is outside the normal scope of ASML.

62
Person Quotes
L 1. The current implementation range leads to changes that are postponed since their
effects would seriously disturb the project cycle time goals and thereby the assessment
rating of development and manufacturing. 2. The break in responsibility between machines on the floor, and at the customer (the
field), results in unnecessary FCO changes (field change orders). 3. Major upgrades, which could lead to lots of learning, are postponed based on cycle time
priority. 4. A restructuring of the implementation range could solve this issue.
M 1. ASML sells their machines at a certain configuration before these requirements are met. We have to work towards these goals, there are huge time constraints and priorities. More
specifically, clients order at proto-stage for pilot machines. 2. We stepped away from the method of NXT where we put a design freeze. We do want to
work towards this process again in the future. 3. There is a difference in maturity for different modules or building blocks. Priorities
change as maturity is greater, we reduce the mandatory ECs (due to getting to the base-line) and increase the nice to haves. We also expect the downtime to drop in later stages. 4. During proto-phase we are not only guided by ECs, we also try to gain knowledge by trial and error. We change and improvise, not based on configuration.
N 1. The number of changes increases exponentially with every new platform. 2. Approving of ECs does not take a lot of time in the CIB, all relevant information is present. And moreover, based on time constraints and delivery times of suppliers we need to have
the relevant materials as early as possible. 3. The propagative effects are planned to be at a minimum, in an ideal situation we would
test a change on a test bench, after qualification of the EC. Unfortunately, due to time
constraints, we approve ECs and they sometimes have unplanned negative consequences
leading to more ECs.
O 1. There is a rule at ASML which is used as a loophole for getting your change noticed. By
filing an IP twice it is seen as structural, thereby resulting in higher priority.
P 1. Many times material is ordered and purchased even before an EC is accepted, just to
make sure that material need is secure. This is purely done to met the time goals. A supply
risk analysis for all ECs is done with D&E. 2. What is different for NXT compared to NXE is that complexity of the product is much
higher. This is caused by the growth of the number of components, the greater concern of cleanliness, the outsourcing of products, the greater number of suppliers, the use of plants
such as (ACE and VDL), she agrees that this could be seen as vertical integration.
Q 1. What are the goals of the CCB? They do not engage the choice of what type of EC gets
approved. That step is made at the IP stage of the EC-process. (We do need to work on that
stage). The CCB does a check of all consequences of a change are clear to all parties
involved. All ECs that are approved will be added to the baseline configuration. 2. Jeroen Zuurhout admitted that during the CCB sometimes engineers have to postpone
the GO-decision of their EC due to failure to meet the requirements.
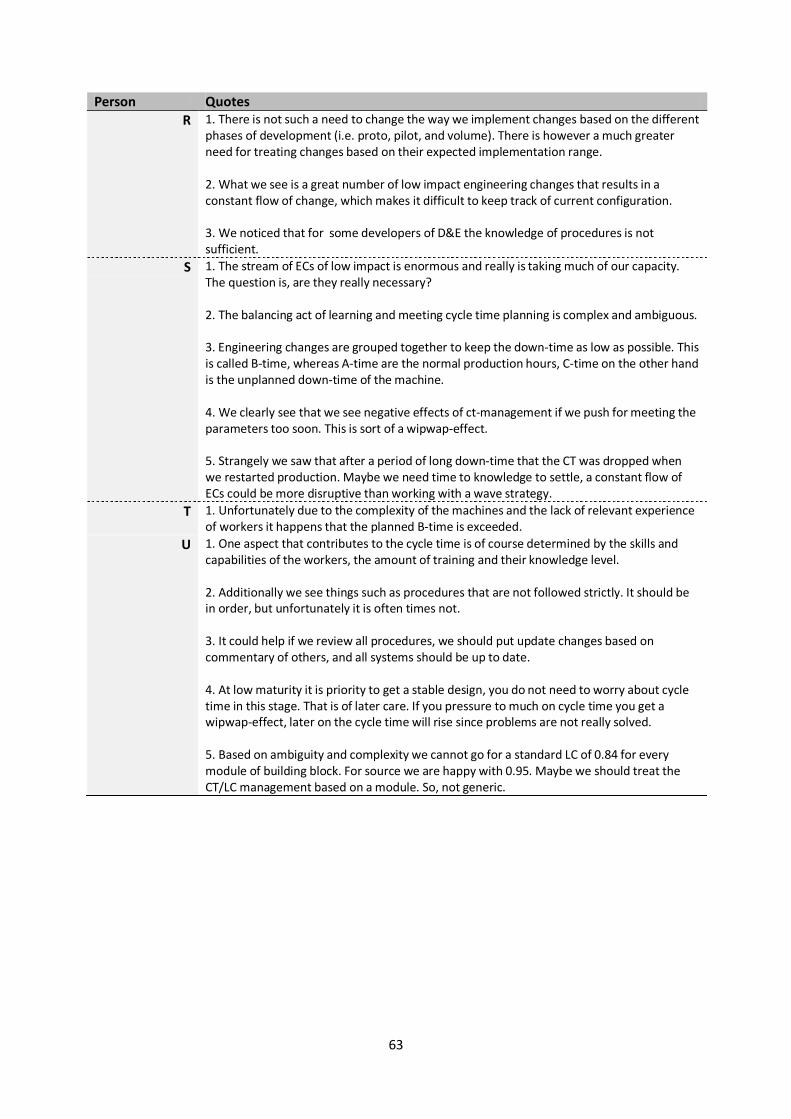
63
Person Quotes
R 1. There is not such a need to change the way we implement changes based on the different
phases of development (i.e. proto, pilot, and volume). There is however a much greater
need for treating changes based on their expected implementation range. 2. What we see is a great number of low impact engineering changes that results in a
constant flow of change, which makes it difficult to keep track of current configuration. 3. We noticed that for some developers of D&E the knowledge of procedures is not sufficient.
S 1. The stream of ECs of low impact is enormous and really is taking much of our capacity. The question is, are they really necessary? 2. The balancing act of learning and meeting cycle time planning is complex and ambiguous. 3. Engineering changes are grouped together to keep the down-time as low as possible. This
is called B-time, whereas A-time are the normal production hours, C-time on the other hand
is the unplanned down-time of the machine. 4. We clearly see that we see negative effects of ct-management if we push for meeting the
parameters too soon. This is sort of a wipwap-effect. 5. Strangely we saw that after a period of long down-time that the CT was dropped when
we restarted production. Maybe we need time to knowledge to settle, a constant flow of ECs could be more disruptive than working with a wave strategy.
T 1. Unfortunately due to the complexity of the machines and the lack of relevant experience
of workers it happens that the planned B-time is exceeded.
U 1. One aspect that contributes to the cycle time is of course determined by the skills and
capabilities of the workers, the amount of training and their knowledge level. 2. Additionally we see things such as procedures that are not followed strictly. It should be
in order, but unfortunately it is often times not. 3. It could help if we review all procedures, we should put update changes based on
commentary of others, and all systems should be up to date. 4. At low maturity it is priority to get a stable design, you do not need to worry about cycle
time in this stage. That is of later care. If you pressure to much on cycle time you get a
wipwap-effect, later on the cycle time will rise since problems are not really solved. 5. Based on ambiguity and complexity we cannot go for a standard LC of 0.84 for every
module of building block. For source we are happy with 0.95. Maybe we should treat the
CT/LC management based on a module. So, not generic.

64
Appendix C: ASML-Q
Figure 7: ASML-Q
Appendix D: Available data and transformations
Table 17: overview of data and transformations
Proxy ECs Proxy ECs specific Proxy ECs description
# of ECs In period Number of ECs rejected and accepted between start FASY –
GSD
In platform Number of ECs rejected and accepted between start FASY –
GSD + matching platform (i.e. XTIV)
In aggregated
type
Number of ECs rejected and accepted between start FASY –
GSD + matching aggregated type (i.e. XTIV:19XX)
In specific type Number of ECs rejected and accepted between start FASY –
GSD + matching specific type (i.e. XTIV:1950Hi)
Batching Sum For every EC all the directly assigned IPs are summed
(between FASY and GSD)
Average For every EC all the directly assigned IPs are averaged
(between FASY and GSD)
IP type For every EC all the directly assigned IPs are summed and
averaged based on a specific IP-type (between FASY and GSD)
Cycle time of EC Sum The accumulated number of days that ECs were in process
Average The average number of days that ECs were in process
Pace The relative standard deviation (i.e. average/st.dev) was
calculated based on the number of ECs per week for the total cycle time of each machine.

65
Proxy ECs Proxy ECs specific Proxy ECs description
Ambiguity The number of steps that each EC took before being approved
or rejected is a proxy for the ambiguity of the change. We
based this parameter on by counting all steps in the tables of history, conclusions, remarks, and problem.
Team diversity The number of people working on a change is a proxy for the
amount of knowledge consulted. Based on the directly
assigned employees to functional engineers.
Failure rate of ECs Percentage of the number of ECs between FASY – GSD
satisfying a rejected state divided by the total number of ECs.
Direct ECs The number of ECs accumulated that have been assigned
directly to machines, satisfying platform and between FASY –
GSD
Skewness & Kurtosis The values of the skewness and kurtosis over FCs and/or
subsystems
Reason for change The count of all ECs satisfying a specific RFC (i.e. old ECR; RAMS+C; new part; admin; must; functional/spec; red. cost
price)
Implementation
range
The count of all ECs satisfying a specific implementation range
(i.e. supply chain; stock; WIP;FAT)
HI & LO The count of ECs based on an aggregation of ECs satisfying no
direct influence on cycle time (i.e. LO-ECs: supply chain and
stock) and ECs satisfying direct influence on cycle time (i.e. HI-ECs: WIP; FAT).
Source of EC The count of all ECs satisfying a specific implementation range
(e.g. ME; NPI; EE)
Frontloading Based on the first and last machine of a platform we
determined all the ECs and their specific implementation time
in this complete period. By calculating the percentage of ECs
implemented in each sub-period relative to the total amount of ECs we can calculate an average percentage. This figure is
graphically represented by a curve which can be more
concave (i.e. low average frontloading) and convex (i.e. high
average frontloading)
Proxy machines Proxy machines
specific Proxy machines description
Days Total days The number of days between FASY – GSD
Natural log of total days
The natural log of days between FASY – GSD
Experience Total experience The number of shipped machines before begin of FASY
Ln of total experience +1
The natural log of the number of shipped machines before
begin of FASY. (+1 since ln(0)=error).
Phases Based on the experience we could assign a maturity level to
the machines. (i.e. <10 proto; 10-25 pilot; >25 volume)
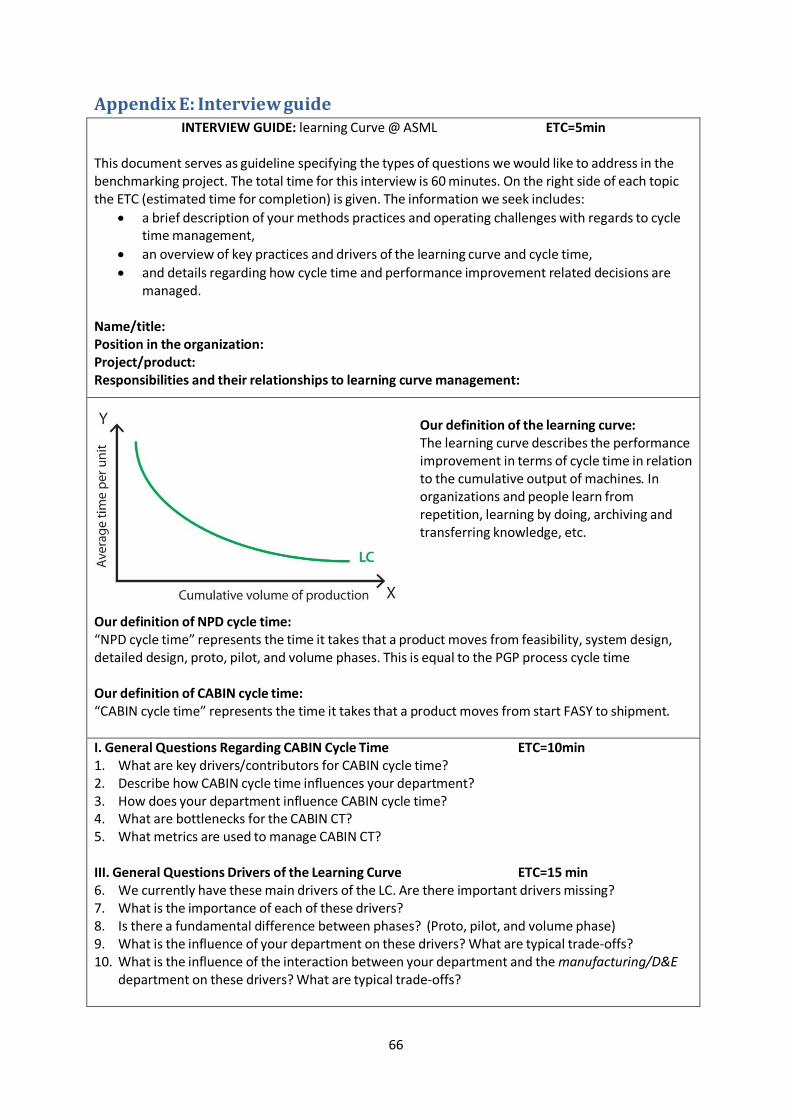
66
Appendix E: Interview guide INTERVIEW GUIDE: learning Curve @ ASML ETC=5min
This document serves as guideline specifying the types of questions we would like to address in the
benchmarking project. The total time for this interview is 60 minutes. On the right side of each topic
the ETC (estimated time for completion) is given. The information we seek includes:
a brief description of your methods practices and operating challenges with regards to cycle
time management,
an overview of key practices and drivers of the learning curve and cycle time,
and details regarding how cycle time and performance improvement related decisions are
managed. Name/title: Position in the organization: Project/product: Responsibilities and their relationships to learning curve management:
Our definition of the learning curve: The learning curve describes the performance
improvement in terms of cycle time in relation
to the cumulative output of machines. In
organizations and people learn from
repetition, learning by doing, archiving and
transferring knowledge, etc.
Our definition of NPD cycle time: “NPD cycle time” represents the time it takes that a product moves from feasibility, system design, detailed design, proto, pilot, and volume phases. This is equal to the PGP process cycle time Our definition of CABIN cycle time: “CABIN cycle time” represents the time it takes that a product moves from start FASY to shipment.
I. General Questions Regarding CABIN Cycle Time ETC=10min 1. What are key drivers/contributors for CABIN cycle time? 2. Describe how CABIN cycle time influences your department? 3. How does your department influence CABIN cycle time? 4. What are bottlenecks for the CABIN CT? 5. What metrics are used to manage CABIN CT? III. General Questions Drivers of the Learning Curve ETC=15 min 6. We currently have these main drivers of the LC. Are there important drivers missing? 7. What is the importance of each of these drivers? 8. Is there a fundamental difference between phases? (Proto, pilot, and volume phase) 9. What is the influence of your department on these drivers? What are typical trade-offs? 10. What is the influence of the interaction between your department and the manufacturing/D&E
department on these drivers? What are typical trade-offs?

67
Appendix F: Quantitative appendix
1. Conditional Process Analysis - models (Hayes, 2013)
1.1. Conceptual model
The analysis starts with the conceptual model in which the theoretical concepts are substituted by the
variables (Experience), (Low impact ECs), (High impact ECs), (Cycle time), (Attention), and (Team Diversity).
1.2. Statistical model
The conceptual model with variables is translated into a statistical model (which includes statistical artifacts resulting from the use of the PROCESS-tool for a moderated mediation model):
Figure 8: Conceptual model
Figure 9: Statistical model

68
1.3. Relationship interpretation table
What follows is a description of all the relationships shown in red in the statistical model. Each
relationship is represented by a path, the following table (18) presents how to interpret the
coefficients of each path.
Table 18: relationship interpretation table Path Antecedent - consequent How to interpret
a-path
Effect of X on M1 when W and V are 0
Conditional effect of W on M1 when X is 0 and V is constant
How much of the conditional effect of X on M1 changes as W changes with one unit holding V constant
Conditional effect of W on M1 when X is 0 and W is constant
How much of the conditional effect of X on M1 changes as V changes with one unit holding W constant
Effect of X on M2 when W and V are 0
Conditional effect of W on M1 when X is 0 and V is constant
How much of the conditional effect of X on M2 changes as W changes with one unit holding V constant
Conditional effect of W on M1 when X is 0 and V is constant
How much of the conditional effect of X on M2 changes as V changes with one unit holding W constant
b-path
Two cases that differ by one unit on M1 but that are equal on X and equal on M2 are estimated to differ by b units on Y
Two cases that differ by one unit on M2 but that are equal on X and equal on M1 are estimated to differ by b units on Y
c-path
Two cases that differ by one unit on X differ on Y holding M1, M2 constant.
How much of the conditional direct effect of X on Y changes as W changes with one unit, holding V constant
How much of the conditional direct effect of X on Y changes as V changes with one unit, holding W constant

69
2. Conditional Process Analysis - equations (Hayes, 2013)
2.1. Three main equations
All consequent variables are translated in an equation which contains regression coefficients for the
intercept, an array of predictors variables, and the errors. For the statistical model as shown in
appendix F: section 1, the equations are as follows:
(1)
(2)
(3)
Substituting the generic symbols of in equation (1), (2), and (3) for the
operationalizations of the variables (exp, EC_lo, EC_hi, ct, ATavg, TDavg) results in the following
equations:
(4)
(5)
(6)
2.2. Conditional effects
By grouping terms in equations (1), (2), and (3) involving and by subsequently factoring out , it
becomes clear that the effect of depends on and and therefore is conditional (see equation
(7.1, 8.1, and 9.1).
(7.1)
(8.1)
(9.1)

70
2.2.1. Conditional direct effect
When a direct effect is a function of both W and V it is considered to be a conditional direct effect, and
in this case it is defined as equation 9.2. We mean-centered the data using the PROCESS-tool (Hayes,
2013), since a zero is no meaningful value for the moderator, the coefficient and its test of significance
is meaningless and has no substantive interpretation (Hayes, 2013). Therefore, we follow the
recommendation of Aiken and West (1991) to mean-center. The PROCESS-tool mean-centers all the
variables which are part of interaction effects, therefore lnEXP, ecATavg, and ecTDavg are mean
centered. The mean of each variable is subtracted from every value of the variable in the data,
resulting in a mean of 0 and unchanged standard deviation. Conditional (in)direct effects should
always be interpreted as the effect of on when moderators are 0. Therefore, with mean-centered
variables, can be interpreted as the effect of on when W and V are average (0).
(9.2)
2.2.2. Conditional indirect effect
Path a
To determine that the amount of engineering changes mediates the relationship between experience
and project cycle time ( ) we need to calculate the specific indirect effects. Specific indirect effects
are determined by multiplying coefficients of single paths. The first components of the specific indirect
effects of on through and are:
(7.2)
(8.2)
Path a path b
To determine the indirect effect of on through (i.e. impactLO) and (i.e. impactHI) we need
to multiply the first component (equation (7.2) and (8.2)) with the second component. The second
component is the effect of and on controlling for . Since this effect is not modeled to be
moderated, the effect can be represented with a single estimate (see equation (10) and (11)).
(10)
(11)

71
Substituted values of the moderators
The total conditional indirect effect of on through the number of engineering changes can be
calculated by taking equation (10) and (11) and filling in all values and substituting 0 for both
moderators (since moderators are mean-centered). Subsequently both specific indirect effects need
to be summed:
(10.1)
(10.2)
3. Conditional process analysis – moderated mediation (Hayes, 2013) To formally answer the question if the learning rate benefits from a certain value of the moderator
(i.e. ) we need to first ask ourselves the question whether the conditional indirect effect at one
value of the moderator is statistically different from the conditional indirect effect at some different
value of the moderator. So, does the indirect effect of experience on project cycle time through
engineering changes differ between teams low versus high in Attention (or Team Diversity).
3.1. A formal test of moderated mediation
We must estimate the difference between the conditional indirect effect at two values of the
moderator of interest. Once the difference is estimated, we need to undertake a bootstrapping
inferential test to test whether the difference is equal to zero. The conditional indirect effect for low
impact engineering changes is given in equation 10, whereas the conditional indirect effect for high
impact engineering changes is given in equation 11. Thus, the difference between the conditional
indirect effect of on through when the moderator Attention is at values of versus
is
This can also be done for equation 10 when assessing the difference for different values of V, resulting
in . Similarly for high impact changes this results in the following equation for
Attention , and in for Team Diversity.

72
3.2. Constructing bootstrap estimates with syntax
The SPSS syntax below saves a new data file after performing 10,000 bootstrap estimates.
PROCESS vars=lnCT lnEXP impactLO impactHI nrdayFSY ecATavg ecTDavg /y=lnCT/x=lnEXP/m=impactLO impactHI/w=ecATavg/z=ecTDavg /model =10/boot=10000/center=1/save=1.
A new data-file is constructed saved as ‘save conditional indirect effect at values of the
moderators.sav’. Each column corresponds to a regression coefficient (see table 19).
Table 19: Columns corresponding to regression coefficients
Column 1 Column 8
Column 15
Column 2 Column 9 Column 16 Column 3 Column 10 Column 17 Column 4 Column 11 Column 18 Column 5 Column 12 Column 19 Column 6 Column 13 Column 20 Column 7 cov Column 14 cov Column 21 Column 22 Column 23 cov
For a bias-corrected bootstrap confidence interval, we use the BCCI command built into PROCESS, appending it to the end of the code above. In SPSS, the command would be: compute diff= colX*colX. frequencies variables=diff/percentiles=2.5 97.5/format=notable /bcci var=diff/point=X/conf=95.
Table 20: Formal test of moderated mediation - specific syntax for the hypotheses
Effect Col Col Coeff Coeff SPSS-syntax
Attention via
low impact
compute diff= col4*col16. frequencies variables=diff/percentiles=2.5 97.5/format=notable /bcci var=diff/point=.00029624/conf=95.
Attention via
high impact .0044
compute diff= col11*col17. frequencies variables=diff/percentiles=2.5 97.5/format=notable /bcci var=diff/point=.00027852/conf=95.
Team diversity
via low impact
compute diff= col6*col16. frequencies variables=diff/percentiles=2.5 97.5/format=notable /bcci var=diff/point=-.00901614/conf=95.
Team diversity
via high impact
.0044
compute diff= col13*col17. frequencies variables=diff/percentiles=2.5 97.5/format=notable /bcci var=diff/point=.00333344/conf=95.

73
4. Stepwise build up of the model A simple learning curve model (model 1 of table 21) shows that experience negatively influences
project cycle time (i.e. lnCT) with a learning rate of , corresponding
to a progress rate of . To test whether the relationship between experience and project cycle
time is mediated by the number of engineering changes we add the variable ECtotal as a mediating
variable (model 2). As experience grows the number of engineering changes decreases, as shown by
the significant negative variable lnEXP, . On the other hand,
engineering changes have a significant positive impact on lnCT shown by an effect of
, indicating increased project cycle time when changes are implemented. Since both
variables are significant we find supportive evidence that engineering changes mediate the
relationship between experience and project cycle time.
To better understand the conditions under which engineering changes are beneficial or detrimental to
learning we need to step away from the aggregate measurement of organizational phenomena
(Argote, 2013). Therefore, earlier on in the hypotheses section, we proposed a decomposition of
engineering changes based on their expected impact. To test their contribution to learning, we assess
their effects simultaneously (model 3). Experience has a significant negative effect on low impact
engineering changes , as well as a significant negative effect on high
impact engineering changes . The negative consequence of
engineering changes is shown by positive effects on lnCT for both low impact engineering changes
, and for high impact engineering changes .
To further specify their effects we can distinguish between direct and indirect effects. By decomposing
engineering changes in changes with low and high impact we see that the direct effect of X on Y is
, whereas the total indirect effect is a significant effect of , indicated by
their bootstrap confidence intervals.
Besides the decomposition of engineering changes based on impact, we strive for other ways to
uncover conditions under which variables have a specific learning effect. Argote (2013) argued that
the learning effects are dependent on contingencies, by using more fine-grained studies we can
uncover these conditions. Our proposed moderators, that test whether Attention (i.e. ecATavg) or
Team Diversity (i.e. ecTDavg) provide greater opportunities to learn, affect the relationship between
the antecedent x-variable and the consequent-variables. The interaction of experience with average
Attention (0 since we mean-centered the data) spent on low impact engineering changes (model 4)
has a positive effect of , indicating that when more Attention is spent on
low impact engineering changes more possibilities for change are discovered. Higher Team Diversity

74
(model 5) does not significantly influence the number of low impact engineering changes, indicated by
the interaction effect of . The results for high impact engineering
changes are somewhat different. Similar to low impact engineering changes, the effect of average
Attention spent on changes (model 6) is positive, , indicating that when
more Attention is spent on high impact engineering changes more possibilities for change are
discovered. In contrast to the low impact engineering changes, the high impact engineering changes
(model 7) significantly benefit from higher Team Diversity, .

75
4.1. Coefficients table
Table 21: Stepwise build-up of model
Consequent
Model
1 Model
2 Model
3 Model
4 Model
5 Model
6 Model
7 Complete
model
Antecedent
lnCT
ECtotal
lnCT impactLO
impactHI
lnCT impactLO
impactLO
impactHI
impactHI
See table 8
–
–
–
–
–
–
–
–
–
–
–
–
–
–
–
–
–
–
–
–
–
–
–
–
–
–
–
–
–
–
–
–
–
–
–
–
–
–
–
–
–
–
–
–
–
–
–
–
–
–
–
–
–
–
–
–
–
–
–
.166 .304 .441 .312 .196 .440 .335 .322 .235 .205
*, ** significance at 0.05 or 0.01, respectively. (…) -values