eindhoven university of technology master plasma ... in the thermal atomic layer deposition process...
TRANSCRIPT

Eindhoven University of Technology
MASTER
Plasma-assisted atomic layer deposition of Al2O3 studied by infrared transmissionspectroscopy
Keijmel, J.
Award date:2008
DisclaimerThis document contains a student thesis (bachelor's or master's), as authored by a student at Eindhoven University of Technology. Studenttheses are made available in the TU/e repository upon obtaining the required degree. The grade received is not published on the documentas presented in the repository. The required complexity or quality of research of student theses may vary by program, and the requiredminimum study period may vary in duration.
General rightsCopyright and moral rights for the publications made accessible in the public portal are retained by the authors and/or other copyright ownersand it is a condition of accessing publications that users recognise and abide by the legal requirements associated with these rights.
• Users may download and print one copy of any publication from the public portal for the purpose of private study or research. • You may not further distribute the material or use it for any profit-making activity or commercial gain
Take down policyIf you believe that this document breaches copyright please contact us providing details, and we will remove access to the work immediatelyand investigate your claim.
Download date: 26. May. 2018
Eindhoven University of Technology Department of Applied Physics Plasma & Materials Processing
Plasma-Assisted Atomic Layer Deposition of Al2O3 studied by
Infrared Transmission Spectroscopy
J. Keijmel
January 2008 PMP 08 - 01
Under supervision of: Ir. E. Langereis Dr. Ir. W.M.M. Kessels Graduation Professor: Prof. Dr. Ir. M.C.M. van de Sanden


Abstract Atomic layer deposition (ALD) is considered one of the primary candidates for the deposition of ultrathin high-k metal oxides e.g. Al2O3, essential for the application as insulator in 3D capacitors and gate dielectrics in semiconductor industry. To allow for depositions at low temperatures and to improve the film quality of ALD metal oxides, oxygen sources other than H2O are researched. In precious work the plasma-assisted ALD process of Al2O3 employing Al(CH3)3 (TMA, trimethylaluminum) and an O2 plasma was investigated. In particular gas phase reaction products of the Al(CH3)3 exposure and O2 plasma properties were studied, thereby leaving the exact surface chemistry involved in the film growth unresolved. In order to further unravel the surface chemistry and further exploit the benefits of this ALD process, the determination of the chemical surface groups involved in plasma-assisted ALD of Al2O3, is essential. The ALD reactor was adapted to study both plasma-assisted and thermal ALD of Al2O3 for substrate temperatures between 25 ºC and 150 ºC, on the same setup. In situ transmission infrared spectroscopy was installed and used to probe ALD surface chemistry on KBr windows mounted in the reactor walls. Most experiments focused on the plasma-assisted ALD process, however, since thermal ALD is a well known process, a direct comparison of plasma-assisted and thermal ALD was performed at 150 ºC. During plasma-assisted ALD of Al2O3 –OH and –CH3 surface groups were predominantly formed after the O2 plasma and TMA exposure, respectively. Similar surface groups were found for thermal ALD of Al2O3 with H2O as an oxidant. At lower deposition temperatures (� 100 ºC) higher –OH densities and equal –CH3 densities are involved in the surface reactions, which indicated more bifunctional chemisorption of TMA on the hydroxylated surface at lower temperatures. After the O2 plasma exposure at 25 ºC, carbon related surface groups were observed and incorporated in the film. However, these impurities in the film could be reduced by extending the O2 plasma exposure time, suggesting that the combustion like removal of the –CH3 surface groups by the plasma was initially not complete. This process is therefore supposed to be partially temperature driven. Besides surface groups, the formation of CH4 as a gas phase reaction product during the TMA exposure was confirmed by means of in situ infrared transmission spectroscopy. The amount of CH4 produced has been estimated from the data and supports the possibility of bifunctional chemisorption of TMA. By combining the results on the surface groups and the gas phase reaction products, the reaction mechanism of plasma-assisted ALD of Al2O3 was further resolved and more insight was obtained into the plasma-assisted ALD process of Al2O3 at low substrate temperatures.


1
Contents 1 Introduction 3
1.1 Atomic Layer Deposition of Al2O3 3 1.2 Thermal ALD and Al2O3 Surface Properties 4 1.3 Reaction Mechanism of Plasma-Assisted ALD 6 1.4 Research Questions 8 1.5 Outline of This Report 8
2 Experimental Details 9
2.1 The ALD Reactor 9 2.2 Plasma-Assisted and Thermal ALD cycles for Al2O3 deposition 11 2.3 Fourier Transform Infrared Transmission Spectroscopy 11 2.4 Spectroscopic Ellipsometry and Rutherford Back Scattering 13 2.5 Experimental Layout 13
2.5.1 Continuous ALD 14 2.5.2 Intermittent ALD 15
3 Al2O3 Bulk Film Growth 17
3.1 ALD Growth on Reactor Wall 17 3.2 Al2O3 Growth on KBr Windows 18 3.3 Discussion 19
4 Results 21
4.1 Determination of Surface Groups Formed in Plasma-Assisted ALD 21 4.1.1 –CH3 Features 21 4.1.2 –OH Features 23 4.1.3 Al2O3 bulk growth 23
4.2 Comparison of Plasma-Assisted and Thermal ALD 23 4.3 Plasma-Assisted ALD at Different Temperatures 27
4.3.1 –CH3 Features 28 4.3.2 –OH Related Features 29 4.3.3 Discussion on 900 cm-1 feature 30
4.4 Low Temperature Film Quality 32 5 Gas Phase Reaction Products 37 6 Reaction Mechanism of Plasma-Assisted ALD of Al2O3 43
6.1 Main Reactions 43 6.2 Additional Reactions 45
7 Conclusions & Future Directions 47
7.1 Conclusions 47 7.2 Recommendations 48
Acknowledgments 51 Bibliography 53 Appendices 56

2

3
1 Introduction
1.1 Atomic Layer Deposition of Al2O3 Al2O3 ultrathin films can be used for a wide variety of applications, such as so-called high-k dielectrics for 3D capacitors and in CMOS transistors in the semiconductor industry [1,2]. Solar cells benefit from Al2O3 as a surface passivation layer to reduce electron hole recombination [3,4]. Furthermore Al2O3 thin films can be used as moisture permeation barriers on flexible polymers for OLEDs [5] and they form a good corrosion resistant coating. Different deposition techniques, such as (plasma enhanced) chemical vapor deposition (PECVD) and physical vapor deposition (PVD) can be used for the deposition of thin Al2O3 films [6,7]. However some of the abovementioned applications, especially 3D capacitors, require highly conformal and uniform films with monolayer thickness control. This is where the technique of atomic layer deposition (ALD) excels. ALD can generally be applied in two ways, thermally or using a plasma. In thermal ALD, the reaction energy for the surface reactions is provided by heating the substrate. For low temperature depositions, where the thermal energy is insufficient for ALD reactions, additional reactivity can be provided by radicals formed in a plasma. Plasma-assisted ALD, can therefore be utilized if high substrate temperatures are not allowed, for example when depositing on polymers, which are temperature sensitive. In Fig. 1.1 the principle of ALD of a metal oxide is illustrated. In this figure a full ALD cycle for a metal oxide is shown and it consists of two half cycles, one for the exposure of the precursor and one for the exposure of the oxidant. The precursor is exposed to the surface and reacts with the existing surface groups, replacing them with new ones and creating gas phase reaction products. The selective chemisorption of the precursor with the existing surface groups makes this process self limiting and therefore ends when all surface groups are replaced. In the purge step gas phase reaction products and the excess of precursor are pumped away and the surface is left with the newly created surface groups. The oxidation half cycle starts with the exposure of the oxidant, which only reacts with the surface groups created by the precursor exposure. Like in the precursor exposure step new surface groups and gas phase reaction products are created which are pumped off during the purge step. The separation of the two exposures by purge steps is essential for the separation the precursor and oxidant which prevents them form direct reactions. By the consecutive exposure and purging of the precursor and oxidant, the metal oxide film is grown layer by layer, yielding a highly uniform and conformal deposited film and providing digital thickness control.
Fig. 1.1 Schematic illustration of the principle of the atomic layer deposition (ALD) process which is based on two separate half cycles. The schematic shows the deposition of a metal oxide film.

4
In the thermal atomic layer deposition process of Al2O3, trimethylaluminum (TMA, Al(CH3)3) is used as the precursor and H2O as the oxidant, as will be discussed more in depth in the next section. Water is not easy to pump out of a reactor, especially at lower temperatures. This leads to longer purge times in order to fully separate the two exposures and therefore to a lower growth rate per unit of time. This makes this thermal ALD process less applicable at lower temperatures. In order to obviate this problem the thermally activated oxidation with water can be replaced by other oxidants e.g. ozone or an oxygen plasma exposure. Contrary to the extensively studied thermal ALD process of Al2O3, the reaction pathway of plasma-assisted ALD is not yet fully resolved. Knowledge of the reaction pathway may lead to better application of the technique and improved film quality. Hence, the research focus of this report will be on the exploration of the reaction pathway of plasma-assisted ALD of Al2O3, with TMA as metal precursor and an O2 plasma as the oxidant.
1.2 Thermal ALD and Al2O3 Surface Properties The reaction pathway of thermal ALD of Al2O3, with TMA as metal precursor and H2O as an oxidant, has extensively been studied [8-12]. Surface groups that participate in the surface reactions of these processes were measured using Fourier transform infrared spectroscopy. This technique detects chemical bonds by its absorption frequency which corresponds to the vibration frequency of the bond. From these studies the reaction mechanism of thermal ALD was determined and are stated in the two half reactions below. These reactions are illustrated in Fig. 1.2 and further discussed here. –OH + Al(CH3)3 (g) � –OAl(CH3)2 + CH4 (g) (1)
–AlCH3 + H2O (g) � –AlOH + CH4 (g) (2) During the TMA metal precursor dosing, a methyl (CH3) group from the TMA splits off taking up a hydrogen atom from the hydroxilated surface and leaves as CH4. The remaining dimethylaluminum binds to the created oxygen site at the surface. After reaching saturation of the surface reactions the excess of TMA and CH4 gas phase reaction products are subsequently purged out of the reactor. Next, the surface is exposed to the oxidant (H2O vapor) that reacts with the CH3 surface groups replacing them with –OH surface groups and splitting of CH4 as a gas phase reaction product. After purging the reactor, the ALD cycle is complete and typically a sub-monolayer of Al2O3 is grown.
Fig. 1.2 Schematic overview of a thermal ALD process of Al2O3. The trimethylaluminum (TMA) metal precursor dosing and H2O dosing are separated by purge steps, and one sub-monolayer is deposited per ALD cycle.
TMA dosing Purge step Purge step H2O dosing
ALD cycle

5
Besides H2O as oxidant in thermal ALD of Al2O3 O3 can be used and has been studied by Goldstein et al. [13]. He reported that the thermal process with O3 results in similar –CH3 surface groups after TMA exposure and –OH surface groups after O3 exposure, as in the water based thermal process. However, additionally formate surface groups (HCOO) were found after the O3 dosing. It should be noted that the observation of these surface groups is in a preliminary stage and still subject of discussion [14]. In Fig. 1.3 the infrared absorbance frequencies of the different kind of –OH surface groups on Al2O3 and formate are shown. Formate surface groups appear at two main positions simultaneously (around 1600 and 1400 cm-1), since the group consists of multiple bonds.
Fig. 1.3 Overview of the possible OH [15] and formate [13] surface groups on an alumina surface with their typical IR spectral ranges. Number indexes at H position indicate the net “OH” charge. The octahedral (o) and tetrahedral (t) coordination of the Al atom is also indicated.
The model that supports the assignments for the –OH groups was introduced by Peri [16] and has been refined by others [15,17-22]. This model differentiates two main –OH surface species, unassociated and associated hydroxyls, as displayed in Fig. 1.3. Unassociated hydroxyls (3800-3700 cm-1) are only bound to the surface via the oxygen atom. Associated hydroxyls (3600-3200cm-1) which are also called bridged –OH, form an extra weak bond with a neighboring –OH. The –OH surface groups have a dipole in which the oxygen is the electron acceptor. This dipole causes the groups to line up and form bridges to their neighbors. It is most seen on surfaces that have a higher degree of hydroxylation. Since this dipole interaction can have different strengths, the induced absorption feature can be very broad in terms of frequency range. Unassociated hydroxyls, also called isolated –OH, can be found in different forms depending on their back bonding to the bulk Al2O3. The oxygen can be single, dual or triple bonded to alumina in the bulk. The –OH bond frequency shifts to lower wavenumbers if the oxygen is bound to multiple aluminum atoms in the bulk. These aluminum atoms can be part of different coordination configurations existing in the Al2O3 bulk. The Al atom can be bond in a tetrahedral or octahedral configuration, also referred to as AlO4 or AlO6, respectively [20]. This leads to different net charges of –OH groups at an Al2O3 surface, when back bonded to Al atoms with different configuration. More and tighter back bonding of the O atom to the bulk leads to a shift to lower wavenumbers. By combining different combinations of tetrahedral and octahedral geometries different alumina phases can be built, depending on temperature and environmental conditions [23-25]. When AlOOH is heated it dehydroxylizes to Al2O3. If this Al2O3 is heated further, different phase transitions take place, in the end changing to �-Al2O3 at around 1200 ºC. This �–Al2O3 consists of purely octahedral coordinated structures, while the transitional

6
phases passed in the heating process from AlOOH to �-Al2O3 all consist of both tetrahedral and octahedral geometries.
1.3 Reaction Mechanism of Plasma-Assisted ALD Having discussed the well known thermal ALD process with H2O as an oxidant, this paragraph will focus on status of the research on O2 plasma-assisted ALD of Al2O3. The Plasma and Materials Processing (PMP) research group at the TU/e has extensively studied this technique [5,26,27]. In one of these studies [27] the growth per cycle and film quality obtained by plasma-assisted ALD was compared with thermal ALD using H2O as an oxidant. The stoichiometry and impurity content of the deposited layers are listed in Table A.1 in Appendix A. This table shows stoichiometry and impurity levels of the films for both ALD methods, at the same temperatures. At lower temperatures the oxygen content of these films increased and more impurities (C and H) were incorporated in the layer. In Fig. 1.4 the growth per cycle from this work is compared with thermal ALD growth reported in the literature.
0 100 200 300 400 5000.00
0.04
0.08
0.12
0.16O
2 plasma
Van Hemmen
H2O thermal
Van HemmenElliotGronerMatero
O3 thermal
ElliotHa
Gro
wth
-per
-cyc
le (n
m)
Temperature (oC)
Fig. 1.4 Comparison of the growth per cycle of plasma-assisted ALD and thermal ALD (with H2O and O3 as an oxidant). Literature: Van Hemmen [27], Elliot [14], Groner [28], Matero [29] and Ha [30]
Despite the different oxidant sources employed in the ALD processes of Al2O3, the ALD growth behaves similar as is observed in the dependence of growth per cycle on the deposition temperature in Fig. 1.4. For higher deposition temperatures (>100 ºC), the growth per cycle of the ALD processes is decreasing with increasing deposition temperature. This behavior points towards similar (dominant) surface groups being created in these ALD processes. The decrease in growth per cycle is often related to the thermal stability of the –OH surface groups and thus by the limitation in available surface sites for TMA adsorption [8,29]. The difference between plasma-assisted and thermal ALD at lower deposition temperatures could be caused by a different chemistry or the stronger oxidative power of the O2 plasma, but it also reported that a decrease in growth per cycle of the thermal ALD process is due to difficulties in obtaining a surface saturating H2O dose at lower deposition temperatures [27,29].
7
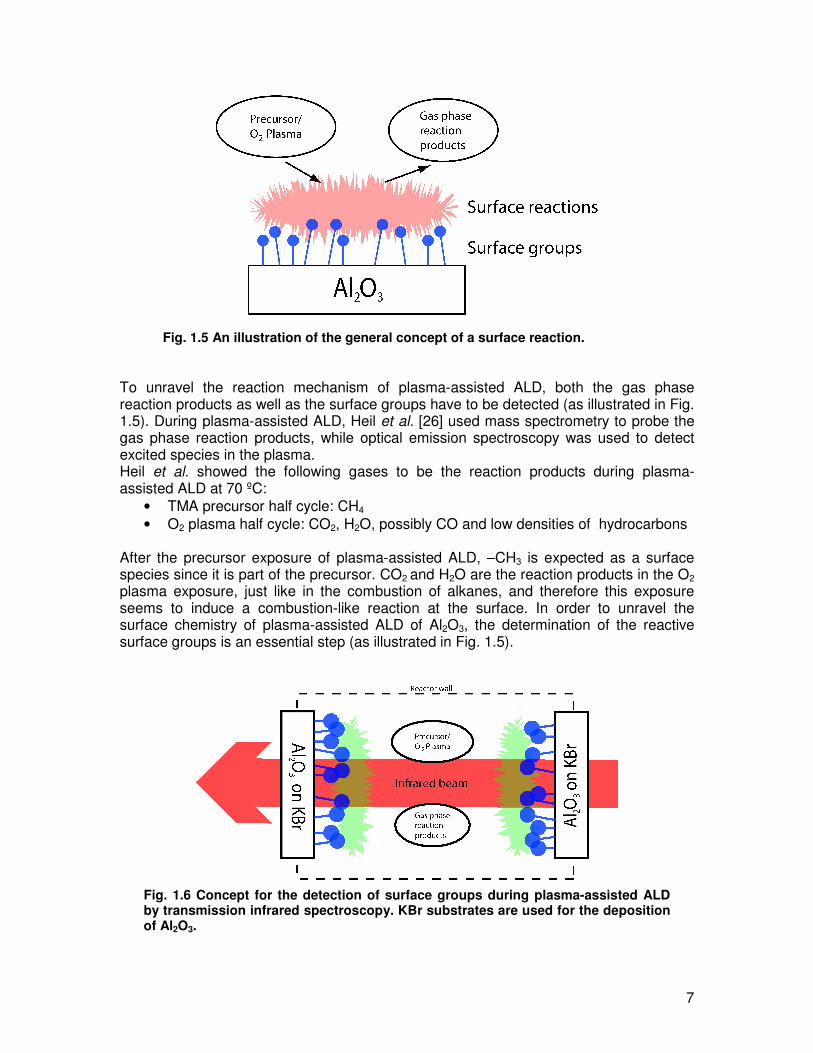
Fig. 1.5 An illustration of the general concept of a surface reaction.
To unravel the reaction mechanism of plasma-assisted ALD, both the gas phase reaction products as well as the surface groups have to be detected (as illustrated in Fig. 1.5). During plasma-assisted ALD, Heil et al. [26] used mass spectrometry to probe the gas phase reaction products, while optical emission spectroscopy was used to detect excited species in the plasma. Heil et al. showed the following gases to be the reaction products during plasma-assisted ALD at 70 ºC:
• TMA precursor half cycle: CH4 • O2 plasma half cycle: CO2, H2O, possibly CO and low densities of hydrocarbons
After the precursor exposure of plasma-assisted ALD, –CH3 is expected as a surface species since it is part of the precursor. CO2 and H2O are the reaction products in the O2 plasma exposure, just like in the combustion of alkanes, and therefore this exposure seems to induce a combustion-like reaction at the surface. In order to unravel the surface chemistry of plasma-assisted ALD of Al2O3, the determination of the reactive surface groups is an essential step (as illustrated in Fig. 1.5).
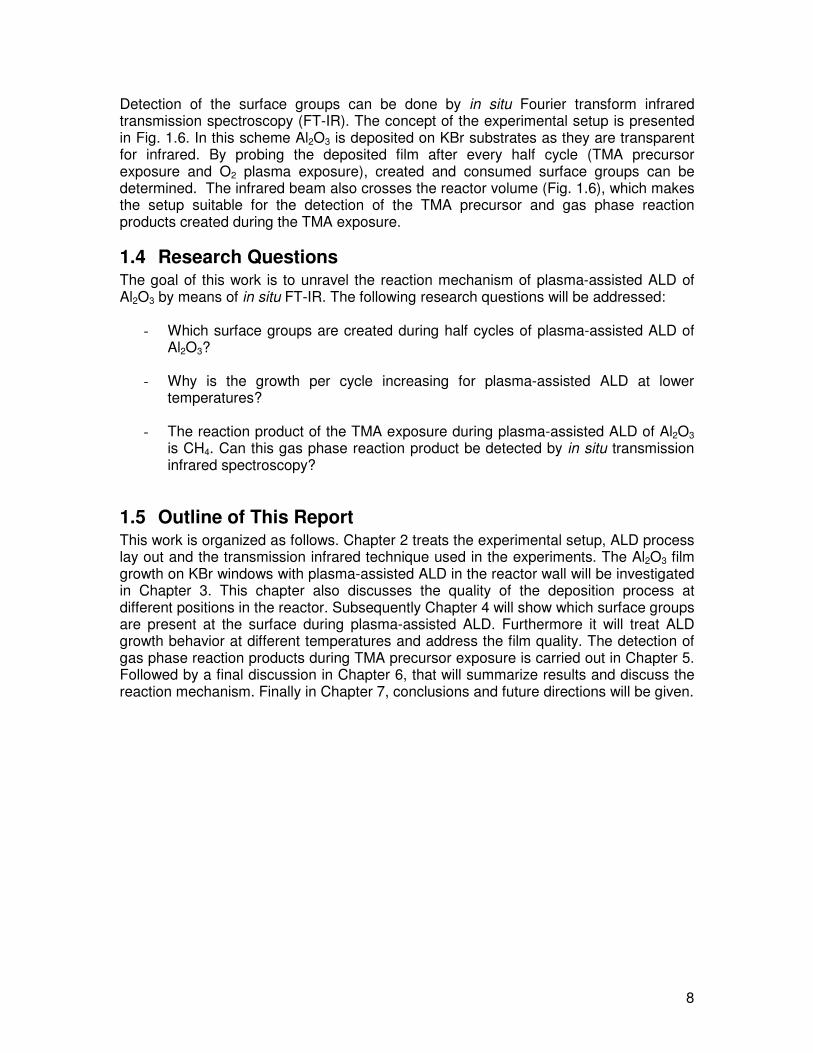
Fig. 1.6 Concept for the detection of surface groups during plasma-assisted ALD by transmission infrared spectroscopy. KBr substrates are used for the deposition of Al2O3.
8
Detection of the surface groups can be done by in situ Fourier transform infrared transmission spectroscopy (FT-IR). The concept of the experimental setup is presented in Fig. 1.6. In this scheme Al2O3 is deposited on KBr substrates as they are transparent for infrared. By probing the deposited film after every half cycle (TMA precursor exposure and O2 plasma exposure), created and consumed surface groups can be determined. The infrared beam also crosses the reactor volume (Fig. 1.6), which makes the setup suitable for the detection of the TMA precursor and gas phase reaction products created during the TMA exposure.
1.4 Research Questions The goal of this work is to unravel the reaction mechanism of plasma-assisted ALD of Al2O3 by means of in situ FT-IR. The following research questions will be addressed:
- Which surface groups are created during half cycles of plasma-assisted ALD of Al2O3?
- Why is the growth per cycle increasing for plasma-assisted ALD at lower
temperatures?
- The reaction product of the TMA exposure during plasma-assisted ALD of Al2O3 is CH4. Can this gas phase reaction product be detected by in situ transmission infrared spectroscopy?
1.5 Outline of This Report This work is organized as follows. Chapter 2 treats the experimental setup, ALD process lay out and the transmission infrared technique used in the experiments. The Al2O3 film growth on KBr windows with plasma-assisted ALD in the reactor wall will be investigated in Chapter 3. This chapter also discusses the quality of the deposition process at different positions in the reactor. Subsequently Chapter 4 will show which surface groups are present at the surface during plasma-assisted ALD. Furthermore it will treat ALD growth behavior at different temperatures and address the film quality. The detection of gas phase reaction products during TMA precursor exposure is carried out in Chapter 5. Followed by a final discussion in Chapter 6, that will summarize results and discuss the reaction mechanism. Finally in Chapter 7, conclusions and future directions will be given.

9
2 Experimental Details This chapter describes the thermal and remote plasma ALD setup with its infrared diagnostics. First the ALD reactor is described in §2.1. The layout and time settings of the ALD cycles performed on the setup will be discussed in §2.2. Furthermore the approach on how the FT-IR data was analyzed will be elucidated.
2.1 The ALD Reactor The home built ALD system was customized for remote plasma and thermal ALD of Al2O3 to study both processes on the same reactor. A schematic overview of the ALD system is shown in Fig. 2.1.
Fig. 2.1. Schematic overview of ALD setup showing the reactor chamber, the remote plasma source, H2O & TMA precursors, in situ FT-IR and in situ SE.
The setup consists of a reactor chamber with a RF plasma source, various in situ diagnostics and connected precursors. The whole is pumped to a base pressure of ~10-5 mbar using a turbo pump and a rotary vane pump. The inductively coupled plasma (ICP) is created by a copper coil winding around the quartz tube, generating 100W plasma power. KBr windows in the reactor walls are used for in situ probing of the deposition process by Fourier transform infrared spectroscopy (FT-IR). The reactor walls are heated by heating wire and a maximum wall temperature of 150 ºC could be used to avoid deterioration of the KBr windows and the O-sealing rings of the reactor. Thermocouples are placed at the reactor table and at the outside of the reactor wall, close to the KBr windows, to monitor the deposition temperature.

10
Fig. 2.2. Schematic representation of the valve system of the remote plasma ALD reactor. The pressure gauge and vacuum pump configuration are also indicated.
For the delivery of H2O and TMA into the reactor, fast (~20 ms switching time) ALD valves were used, to secure accurate dosing. Since TMA is highly reactive with water, argon gas is available to purge the bubbler crossover and the connection-line to the reactor, in case the TMA bubbler needs to be removed. The O2 inlet flow into the plasma source is regulated by a manually adjustable needle valve and a pneumatic valve. A N2 line directly into the chamber is utilized as purge gas during the thermal ALD process and to pressurize the chamber. The turbopump is cooled by water and a N2 backflow is used to protect it against corrosion. Valves at the top and bottom of the reactor chamber are available to close the chamber off from the plasma tube and from pump system respectively. These valves can be used to contain precursors and reaction products in the reactor for some time if desired. Three pressure gauges are connected to the system. A Pfeiffer combination gauge (5x10⁻⁹ to 103 mbar) monitors the chamber base pressure. An automatic valve protects it against corrosion from precursor gases ration. The Baratron pressure gauge (10-4 to 1 mbar) is applied to set purge gas pressures during operation, it gives a gas type independent pressure read out. The Pfeiffer Pirani pressure gauge checks the pressure of the first pump stage, which is typically about 10-1 mbar.

11
2.2 Plasma-Assisted and Thermal ALD cycles for Al2O3 deposition
The ALD of Al2O3 has been studied for two different processes. A plasma-assisted process with O2 plasma as oxidant and a thermal process with H2O as oxidant. This paragraph discusses the cycle lay out of both ALD processes. A plasma-assisted ALD cycle typically used in the experiments is schematically shown in Fig. 2.3(a). The top and bottom valve are open during this cycle and a constant O2 purge gas flow is present (0.01 mbar chamber pressure). A TMA exposure time of 25 ms is known to saturate the half reaction. The 2 s O2 plasma time also saturates the oxidation half reaction, which is supported by OES measurements performed by Heil et al. [26]. The total cycle time of plasma-assisted ALD of Al2O3 is approximately 5 s. In Fig. 2.3(b) a typically thermal ALD cycle is shown. The TMA precursor dosing is the same as during the plasma cycle. As an oxidant, H2O (Ultrapur, nr 1.01262 by Merck) is used in two consecutive exposures of 240 ms. This setting is copied from experience with another ALD system within the PMP group [27]. The two separate exposures lead to lower maximum reactor pressures, protecting the pump system from overload. Due to the use of H2O as an oxidant a long pump and purge time is used extending the total cycle time to 16 s. This is needed to remove the residual water and achieve reactor base pressure (<10-4
mbar). Inert N2 gas is used to purge the reactor via the side inlet on the reactor. Because of this position of the N2 inlet, the top valve can be closed to reduce the reactor volume leading to a more effective purge.
2.3 Fourier Transform Infrared Transmission Spectroscopy The main diagnostic of this report is the Fourier Transform Infrared Transmission Spectroscopy (FT-IR) technique. For this purpose a Tensor 27 of Bruker Optics (mid-IR, >1cm-1 resolution) is used which has a mid infrared light (MIR) source that produces a broad spectrum of infrared light (~7000-350 cm-1 range).
Fig. 2.3. Schematic layout of a typical plasma-assisted ALD cycle (a) and a thermal ALD cycle (b) of Al2O3, time indicated in seconds. Total cycle time about 5 and 16 seconds respectively.

12
Fig. 2.4. FT-IR setup, with in situ and ex situ beam paths from MIR light source, via interferometer to designated detectors. In situ and ex situ beam paths are indicated. The whole infrared beam area is N2 purged or vacuum.
In Fig. 2.4 a schematic overview of the FT-IR setup is shown built around the ALD reactor. The setup was applied in a in situ and a ex situ configuration. The in situ beam path leads from the interferometer through the ALD reactor to a liquid N2 cooled Mercury Cadmium Telluride (MCT) detector (Model: Bruker D 313, Range: 10,000 – 750 cm-1, sensitivity: > 4 x 1010 cm Hz½ W-1). The beam is focused on the detector by an off axis parabolic mirror with a gold coating designated for infrared. In the setup the infrared beam passes through two infrared transparent KBr windows in the ALD reactor walls. The whole beam path is enclosed in a continuously N2 purged box and tube system, to prevent H2O and CO2 from perturbing the infrared signal. The ALD deposition process is probed by FT-IR on the KBr windows. The signal from the detector is digitalized by an AD converter, redirecting the signal to the Tensor 27. The transmitted signal is then automatically Fourier transformed into a frequency spectrum by the software provided with the Bruker system. This technique provides information on the vibrational frequencies of the chemical bonds that are present in the layer and thereby on its chemical composition. The portion of the IR beam that is absorbed by chemical bonds at the window surface is very low and can not be observed in a raw IR spectrum. The transmitted spectrum after a surface treatment or deposition has to be compared with the transmitted spectrum before this treatment or deposition. Equation 2.1 shows how the absorbance is calculated from these two spectra, where Aι and Bι are the transmitted signal intensity before and after a
surface treatment, respectively. Note that with this technique also gasses in the reactor can be detected if the reactor is not pumped vacuum. This can be used to check precursor composition or detect reaction products during deposition. Furthermore if samples are taken out of the reactor, ex situ measurements can be performed placing the sample in the sample chamber of the Bruker interferometer. The internal detector has a detection range from 7000 to 350 cm-1, therefore also providing information on the lower energy phonon bulk modes.
� log B
A
ιι� �
= − � �� �
(2.1)

13
2.4 Spectroscopic Ellipsometry and Rutherford Back Scattering The Al2O3 growth process was also monitored on the substrate table by in situ spectroscopic ellipsometry (J.A. Woollam M-2000) as shown in Fig. 2.1. The SE windows were protected against deposition by pneumatic gate valves. This technique was used to determine the film thickness and refractive index of the Al2O3 films. Rutherford back scattering (RBS) is used to determine material composition and stoichiometric properties of ALD deposited films. This technique makes use of the scattering of Helium ions at the surface. RBS measurements were carried out by Phillips Research at the TU/e.
2.5 Experimental Layout
Fig. 2.5. Typical FT-IR and SE measurement scheme during plasma-assisted ALD. It consists of three basic building blocks, ALD process steps, FT-IR measurements and ellipsometry measurements. For thermal ALD the O2 plasma exposure is substituted with a H2O dosing.
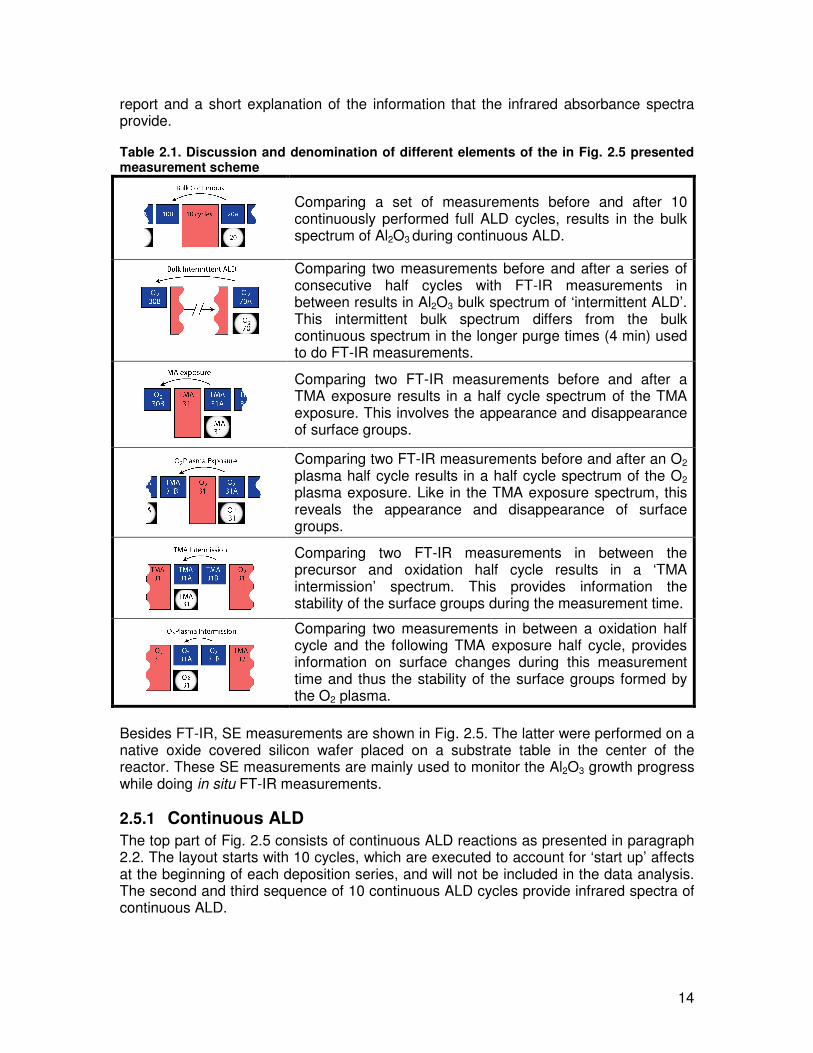
In Fig. 2.5 a schematic representation is shown of the measurement procedure used for the probing of surface groups and Al2O3 bulk growth, with FT-IR and SE, during plasma-assisted ALD. In-between ALD process steps, two in situ FT-IR measurements are performed before and after an ALD process step. This is done to prevent correlation in the analysis of the data and to be able to check the stability of surface groups over time. The measurement scheme presented in Fig. 2.5 consists of a top part containing full ALD cycles and a bottom part containing ALD half cycles (only the TMA or the O2 plasma). These two parts will be discussed more thoroughly in §2.5.1 and §2.5.2. In order to extract information from the transmission FT-IR measurements, one measurement has to be referred to another one. The infrared absorbance spectrum from these two measurements is determined via equation 2.1. Table 2.1 provides examples of IR measurements can be referenced, how the methods are named in this
14
report and a short explanation of the information that the infrared absorbance spectra provide. Table 2.1. Discussion and denomination of different elements of the in Fig. 2.5 presented measurement scheme
Comparing a set of measurements before and after 10 continuously performed full ALD cycles, results in the bulk spectrum of Al2O3 during continuous ALD.
Comparing two measurements before and after a series of consecutive half cycles with FT-IR measurements in between results in Al2O3 bulk spectrum of ‘intermittent ALD’. This intermittent bulk spectrum differs from the bulk continuous spectrum in the longer purge times (4 min) used to do FT-IR measurements.
Comparing two FT-IR measurements before and after a TMA exposure results in a half cycle spectrum of the TMA exposure. This involves the appearance and disappearance of surface groups.
Comparing two FT-IR measurements before and after an O2 plasma half cycle results in a half cycle spectrum of the O2 plasma exposure. Like in the TMA exposure spectrum, this reveals the appearance and disappearance of surface groups.
Comparing two FT-IR measurements in between the precursor and oxidation half cycle results in a ‘TMA intermission’ spectrum. This provides information the stability of the surface groups during the measurement time.
Comparing two measurements in between a oxidation half cycle and the following TMA exposure half cycle, provides information on surface changes during this measurement time and thus the stability of the surface groups formed by the O2 plasma.
Besides FT-IR, SE measurements are shown in Fig. 2.5. The latter were performed on a native oxide covered silicon wafer placed on a substrate table in the center of the reactor. These SE measurements are mainly used to monitor the Al2O3 growth progress while doing in situ FT-IR measurements.
2.5.1 Continuous ALD The top part of Fig. 2.5 consists of continuous ALD reactions as presented in paragraph 2.2. The layout starts with 10 cycles, which are executed to account for ‘start up’ affects at the beginning of each deposition series, and will not be included in the data analysis. The second and third sequence of 10 continuous ALD cycles provide infrared spectra of continuous ALD.

15
2.5.2 Intermittent ALD The bottom part of Fig. 2.5 shows a part of the intermittent ALD, comprising ALD half cycles with two FT-IR and an SE measurement in between. As illustrated referring an FT-IR measurement after a half cycle with one before, results in the infrared absorbance spectrum of that particular comparison. The absorbance difference amplitudes at the surface are extremely small (order 10-5), therefore an above average of 256 scans (4 cm-1 resolution) per FT-IR measurement is used to improve the signal to noise ratio. Due to these measurements an intermittent ALD cycle takes about 8 minutes (a continuous ALD cycle takes ~5s).
Fig. 2.6(a) shows a single differential spectrum of a precursor half cycle, and although signal noise is challenging the data interpretation, some spectral features can already be identified. By averaging 40 half cycles the signal to noise level is substantially improved as shown in, Fig. 2.6(b). To make the graph more appealing and for comparison purposes, a manual baseline correction is performed and a 21 point Savitzky-Golay smoothening was executed. Savitzky-Golay is a second order smoothening technique than does not affect the maxima of features as long as the width of these features is larger that the range over which the smoothening is performed. The result is presented
4000 3500 3000 2500 2000 1500 1000
5x10⁻⁵
5x10⁻⁵
appear
disappear
(c)
(b)
Abs
orba
nce
Abs
orba
nce
5x10⁻⁵
Wavenumber (cm-1)
Abs
orba
nce
(a)
Fig. 2.6 Single differential spectrum (a), 40 times averaged spectrum (b) and Savitzky-Golay smoothened & baseline corrected spectrum (c) of a precursor half cycle (plasma-assisted ALD of Al2O3 at 150 oC)

16
in Fig. 2.6(c). For the spectrum below 1500 cm-1 the baseline correction is very hard to perform because no clear baseline can be assigned there. Therefore the exact absorbance magnitude for these frequencies cannot be fully related to changes caused by the ALD process. The RMS noise levels in Fig. 2.6 (a), (b) to (c), within the 2750-1250 cm-1 range, are 1.53x10⁻⁵, 2.77x10⁻⁶ and 1.99x10⁻⁶, respectively. The amplitude of the spectral features ranges from 1.5x10⁻⁵ up to 5x10⁻⁵ per cycle, signal to noise ratio’s from 7.5 to 25 are typical for this type of experiment. This is sufficient to distinguish spectral features from the rest of the spectrum.

17
3 Al2O3 Bulk Film Growth Before the start of this work the characterization of the ALD Al2O3 films has always been performed on films deposited on Si-based substrates on the substrate holder central in the reactor. For the experiments involved in this work, KBr windows placed in the reactor wall will be used as the substrate for Al2O3 film growth. Therefore, two questions can be raised. Firstly, does the plasma-assisted ALD process deposit Al2O3 at the reactor wall, where the KBr windows are situated? Secondly, what is the film quality of Al2O3 deposited on KBr? In order to answer these questions two experiments were conducted and will be discussed in the following two paragraphs.
3.1 ALD Growth on Reactor Wall In a first approach to investigate whether the plasma-assisted ALD growth process takes place at the position of the reactor wall, the following experiment was conducted. Two Si pieces were positioned on the reactor wall close to the position of the KBr windows. A third Si sample was positioned at the reactor table. The whole reactor was heated to 100 ºC by wall heating, and 250 cycles of plasma-assisted ALD were carried out, resulting in a typical thickness of ~ 30 nm at the substrate holder. As presented in Table 3.1 the thickness and refractive index of the substrates were determined with ex situ SE. Furthermore Rutherford Back Scattering (RBS) measurements were performed on the samples located at the table and right wall. This provides information on the stoichiometry and contamination levels of the Al2O3 films as summarized in Table 3.1.
Table 3.1 Characterization of the film growth on the Si samples positioned at different positions in the reactor, analyzed by RBS and ex situ SE. In this experiment 250 cycles of plasma-assisted ALD of Al2O3 were deposited at 100 ºC.
Table Right wall Left wall
Al2O3 thickness (nm) 33.0 ± 0.5 34.2 ± 0.5 34.4 ± 0.5 Growth per cycle (nm) 0.132 ± 0.002 0.1368 ± 0.002 0.1376 ± 0.002
Refractive index n 1.65 ± 0.01 1.64 ± 0.01 1.64 ± 0.01 Stoichiometry [O]/[Al] 1.60 ± 0.05 1.60 ± 0.05 - Al2O3 deposited (at/cm2) 2.8x10¹⁷ ± 10% 2.9x10¹⁷ ± 10% - Mass density (g/cm3) 2.8 ± 0.1 2.9 ± 0.1 - C (at. %) <2 <2 -
The deposition on the wall samples shows a marginally thicker layer of Al2O3 with a higher density. This difference could be caused by a slightly lower substrate temperature at the wall, which leads to higher growth per cycle. The density and stoichiometry of the deposited material on both samples is in line with earlier performed depositions with plasma-assisted ALD at 100 ºC (see Table A.1). Furthermore the growth per cycle (0.132-0.138 nm/cycle) of the depositions in Table 3.1 is in good agreement with earlier measurements (0.137 nm/cycle) for plasma-assisted ALD [27]. It can therefore be
18
concluded that Al2O3 can successfully be deposited at the wall position with plasma-assisted ALD.
3.2 Al2O3 Growth on KBr Windows In this paragraph the Al2O3 growth on KBr substrates (also used as windows in this work) will be characterized. 400 cycles of plasma-assisted ALD of Al2O3 at 25 ºC (4s plasma exposure) were deposited on KBr substrates positioned at the following locations:
• In the reactor wall, the position used for the in situ transmission infrared spectroscopy measurements
• On the reactor wall, below the window position, same as the position of the ‘wall’ Si sample in previous section
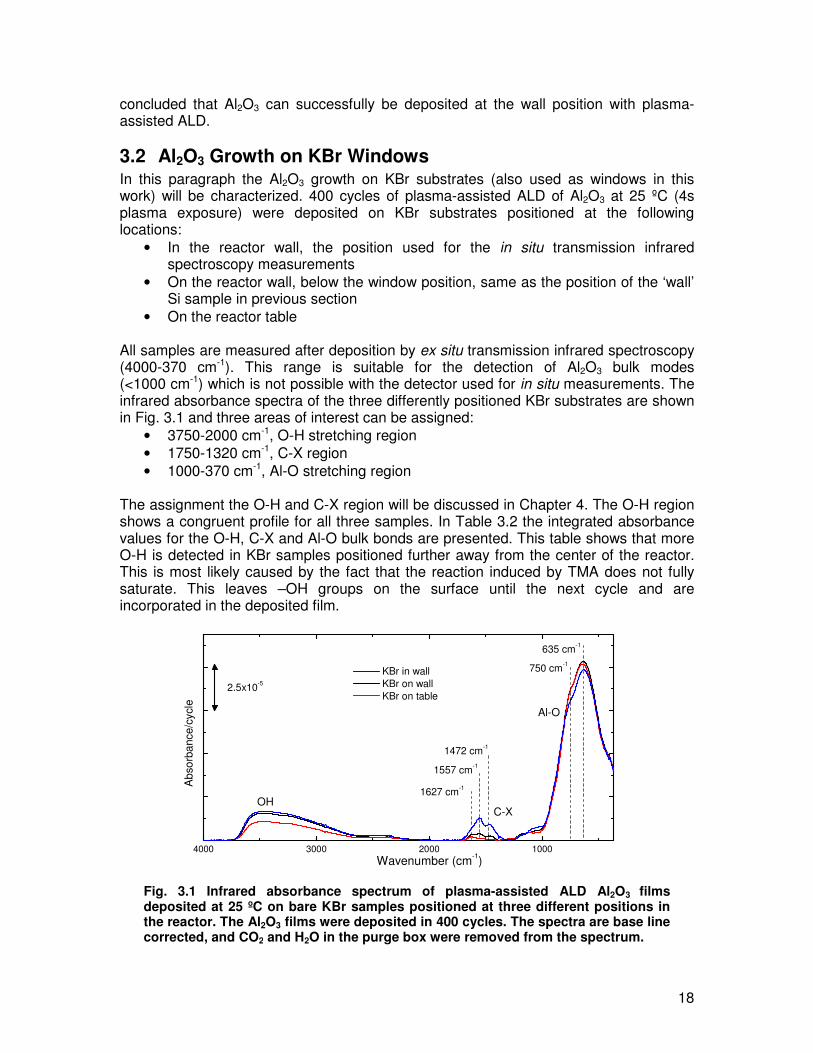
• On the reactor table All samples are measured after deposition by ex situ transmission infrared spectroscopy (4000-370 cm-1). This range is suitable for the detection of Al2O3 bulk modes (<1000 cm-1) which is not possible with the detector used for in situ measurements. The infrared absorbance spectra of the three differently positioned KBr substrates are shown in Fig. 3.1 and three areas of interest can be assigned:
• 3750-2000 cm-1, O-H stretching region • 1750-1320 cm-1, C-X region • 1000-370 cm-1, Al-O stretching region
The assignment the O-H and C-X region will be discussed in Chapter 4. The O-H region shows a congruent profile for all three samples. In Table 3.2 the integrated absorbance values for the O-H, C-X and Al-O bulk bonds are presented. This table shows that more O-H is detected in KBr samples positioned further away from the center of the reactor. This is most likely caused by the fact that the reaction induced by TMA does not fully saturate. This leaves –OH groups on the surface until the next cycle and are incorporated in the deposited film.
4000 3000 2000 1000
750 cm-1
635 cm-1
Al-O
OH
1472 cm-1
1627 cm-1 Abs
orba
nce/
cycl
e
Wavenumber (cm-1)
KBr in wall KBr on wall KBr on table
2.5x10⁻⁵
1557 cm-1
C-X
Fig. 3.1 Infrared absorbance spectrum of plasma-assisted ALD Al2O3 films deposited at 25 ºC on bare KBr samples positioned at three different positions in the reactor. The Al2O3 films were deposited in 400 cycles. The spectra are base line corrected, and CO2 and H2O in the purge box were removed from the spectrum.
19
In the carbon impurity region (1750-1320 cm-1) in Fig. 3.1, three features can be distinguished, 1627, 1557 and 1472 cm-1. The 1557 and 1472 cm-1 features scale equally in magnitude, indicating they have the same chemical structure as their origin. The 1627 cm-1 feature appears if the other two features decrease indicating it might be related to a stronger carbon bond which is more difficult to remove. The integrated absorbance of carbon impurities in the bulk Al2O3 increases from ‘on table’, ‘on wall’ to the ‘in wall’ spectrum. The ‘in wall’ sample showed the highest amount of carbon impurities, most likely because this sample is most difficult to reach by the reactive species during the O2 plasma exposure. Preliminary data from RBS measurements on the ‘in wall’ sample, showed that the carbon content is <~7 at. %. This illustrates how sensitive transmission infrared spectroscopy is for the detection of carbon impurities and that the film quality is better than one would suggest from the initial impression of this infrared data.
Table 3.2 Integrated absorbance per cycle (cm-1 /cycle) for given wavenumber ranges of the in Fig. 3.1 presented spectra. Assigned chemical bonds are indicated for a given wavenumber range.
O-H C-X Al-O 3750-2000 cm-1 1750-1320 cm-1 1000-370 cm-1
On table 7.95E-03 2.50E-04 3.96E-02 On wall 1.18E-02 6.60E-04 4.06E-02 In wall 1.28E-02 2.41E-03 3.91E-02
Although there are noticeable differences in the amount of impurities found in the different KBr samples, the amount of Al-O bond integrated absorbance is very similar (within 4% difference). This is in line with the findings for depositions on Si substrates of the previous section where differences in the same order were measured with RBS and ex situ SE. The difference in growth per cycle was partly attributed to a possible slightly lower deposition temperature at the wall position. However this experiment is done at room temperature and therefore here, this argument does not hold. The deposition rate (from the integrated absorbance Al-O mode) at the ‘in wall’ sample might be slightly lower than the other two because reactions induced by the precursor and plasma exposures are saturated to a lesser extent. The shape of the Al-O mode peaks is identical for all three KBr positions. It is therefore clear that the same type of Al2O3 is grown. The features at 635 cm-1 and 750 cm-1 are fairly broad which indicates the Al2O3 films are not only built out of octahedral AlO6 which is found in �-Al2O3 and �-AlOOH as concluded by Tarte [31] and Schroeder [24]. The structure consists of both octahedral AlO6 and tetrahedral AlO4, and matches most with the �-Al2O3 phase as it is presented in the literature [23,31].
3.3 Discussion The thickness of the Al2O3 layer deposited at the wall position is consistent with what can be expected from plasma-assisted ALD (at 100 ºC). The same Al2O3 phase was deposited at all three samples of KBr with differences in Al-O mode integrated absorbences of less than 4% (at 25 ºC). Hydroxyl and carbon impurities were found in the deposited films; the levels are relatively low however the amount of impurities increases when the substrate is located farther away form the active plasma zone. In

20
retrospect with an increase in TMA and O2 plasma exposures the impurity levels could probably have been reduced.

21
4 Results
4.1 Determination of Surface Groups Formed in Plasma-Assisted ALD
In order to unveil the reaction mechanism of the plasma-assisted ALD growth of Al2O3 the determination of the chemical surface groups is essential and one of the main objectives of this work. The determination of these groups for plasma-assisted ALD at 150 ºC will be presented in this section, since at this temperature the growth per cycle and film quality of the Al2O3 ALD process are well known.
4000 3500 3000 2500 2000 1500 1000
TMA + O2 plasma exposure half cycle
TMA exposure half cycle O
2 plasma exposure half cycle
CH3 Rocking
CH3 Bending
CH3 Stretching
Abs
orba
nce
Wavenumber (cm-1)
5x10⁻⁵
OH groups
12
3
Fig. 4.1. Infrared absorbance spectra of both plasma-assisted ALD half cycles and their sum, during Al2O3 deposition at 150 ºC. Spectral features of –OH and –CH3 surface groups have been indicated. 1, 2 and 3 indicate spectral positions 2937, 2896 and 2831 cm-1 respectively. The spectra have been shifted vertically for clarity.
In Fig. 4.1 the infrared absorbance spectra of the TMA and O2 plasma half cycles are shown, as well as their sum. The appearance of –CH3 surface groups during the TMA exposure half cycle is observed in the stretching (3050-2770 cm-1), bending (1235-1160 cm-1) and rocking (<800 cm-1) modes. During this half cycle –OH surface groups (3750-3050 cm-1) disappear. The opposite happens during the O2 plasma half oxidation cycle; CH3 surface groups disappear and –OH surface groups appear. The sum spectrum shows a significant feature below 900 cm-1 and that indicates the Al2O3 bulk growth in the ALD cycle. A more thorough description of all these features as well as the spectral behavior in both half cycles around 1000 cm-1 will be discussed in the next sections.
4.1.1 –CH3 Features The CH3 stretching signal peaks at 2937 cm-1 and there are two lower maxima at 2896 cm-1 and 2831 cm-1. These CH3 modes agree with features observed for TMA adsorption on Al2O3 and H-terminated Si [8,9,12,32,33] and CH3 features in the TMA

22
monomer [34,35] and dimer [36]. Table 4.1 shows the observed positions in this work and their assignment in comparison with different sources in the literature. Note that there is in some cases no consensus about exact assignments in the literature. Assignments made in this work are based on the judgment of the majority. Around 1207 cm-1 the CH3 bending mode appears during the TMA exposure. It matches the bending mode assignment of the TMA dimer. For the adsorption of TMA an Al2O3 and H-terminated Si substrates this mode is found slightly higher at 1217 and 1219 cm-1 respectively [32,33].
Table 4.1 Overview of CH3 vibrational modes (in cm-1) for TMA adsorbed on H-terminated Si (H-Si) and Al2O3 and for the monomer and dimer of TMA.
Literature This work
position condition reference 2942 TMA on H-Si [32] 2943 TMA on Al2O3 [33] 2942 TMA on �-Al2O3 [8] 2941 TMA dimer [36]
2937 ±4 asymmetric stretching
2989 TMA monomer [34] 2900 TMA on H-Si [32] 2897 TMA on Al2O3 [33] 2898 TMA on �-Al2O3 [8] 2901 TMA dimer [36]
2896 ±4 symmetric stretching
2901 TMA monomer [34] 2837 TMA on H-Si [32] 2827 TMA on Al2O3 [33] 2834 TMA on �-Al2O3 [8]
2831 ±4 bending overtone
2839 TMA dimer [36] 1217 TMA on H-Si [32] 1219 TMA on Al2O3 [33] 1207 TMA dimer [36]
1207 ±4 bending
1202 TMA monomer [34] 775 and 702 TMA dimer [36] <770
rocking 754 and 744 TMA monomer [34]
Below 1200 cm-1 different concurrent vibrational modes are seen. These modes overlap and are therefore not easy to isolate. Here the focus will be on the clear feature that appears during the TMA exposure below 770 cm-1. Based on literature about the TMA precursor this feature is assigned to a CH3 rocking mode [34,36]. As reported for the TMA monomer and dimer spectra, the absorption of the rocking mode is much stronger than the CH3 stretching and bending modes. In the oxidation half cycle the CH3 peaks are completely removed, resulting in no CH3 feature in the sum spectrum for the stretching and bending region. The different observed CH3 features are in good agreement with previously observed peaks reported for TMA adsorption on Al2O3. Therefore it is concluded that –CH3 surface groups are present at the surface after the TMA exposure. In general one can conclude that –CH3 groups participate in the reaction mechanism of plasma-assisted ALD at 150 ºC.

23
4.1.2 –OH Features In Fig. 1.3 an overview of possible –OH surface groups on Al2O3 was shown [15]. Unassociated –OH groups that are single, double or triple bonded to bulk Al atoms are possible, as well as associated –OH groups that are single or double bonded. The stretching vibrational region of these groups ranges from 3800 to 3700 cm-1 for unassociated single bonded, up to 3200 cm-1 for associated groups. Examining Fig. 4.1 reveals that during the O2 plasma half cycle –OH surface groups, ranging from 3750 cm-1 down to 3050 cm-1, appear at the surface. Apparently a wide range of differently configured –OH surface groups are present at the surface after the O2 plasma exposure. Single bonded –OH surface groups were not observed (no feature in 3800-3775 range), and therefore not created at this deposition temperature. Most of the –OH surface groups that were created during the oxidation half cycle were removed in the precursor half cycle; however a low broad –OH feature is visible in the sum spectrum. This indicates that some of the –OH surface groups are built into the bulk Al2O3 film.
4.1.3 Al2O3 bulk growth The region below 1200 cm-1 in Fig. 4.1, is not easy to expound, since different vibrational modes of surface groups and bulk phonon modes overlap. Furthermore in this part of the spectrum the detector sensitivity decreases and baseline shifts are hard to correct for. The sum spectrum shows a strong peak below 900 cm-1, which is assigned to bulk Al2O3, longitudinal optical Al-O-Al phonon mode as reported in the literature [37]. During the oxidation half cycle a broad feature appears around 900 cm-1. Its maximum peak position is hard to define since it interferes with the disappearance of the CH3 rocking mode. The assignment of this feature, which almost disappears during the precursor exposure, will be discussed in §4.3.3.
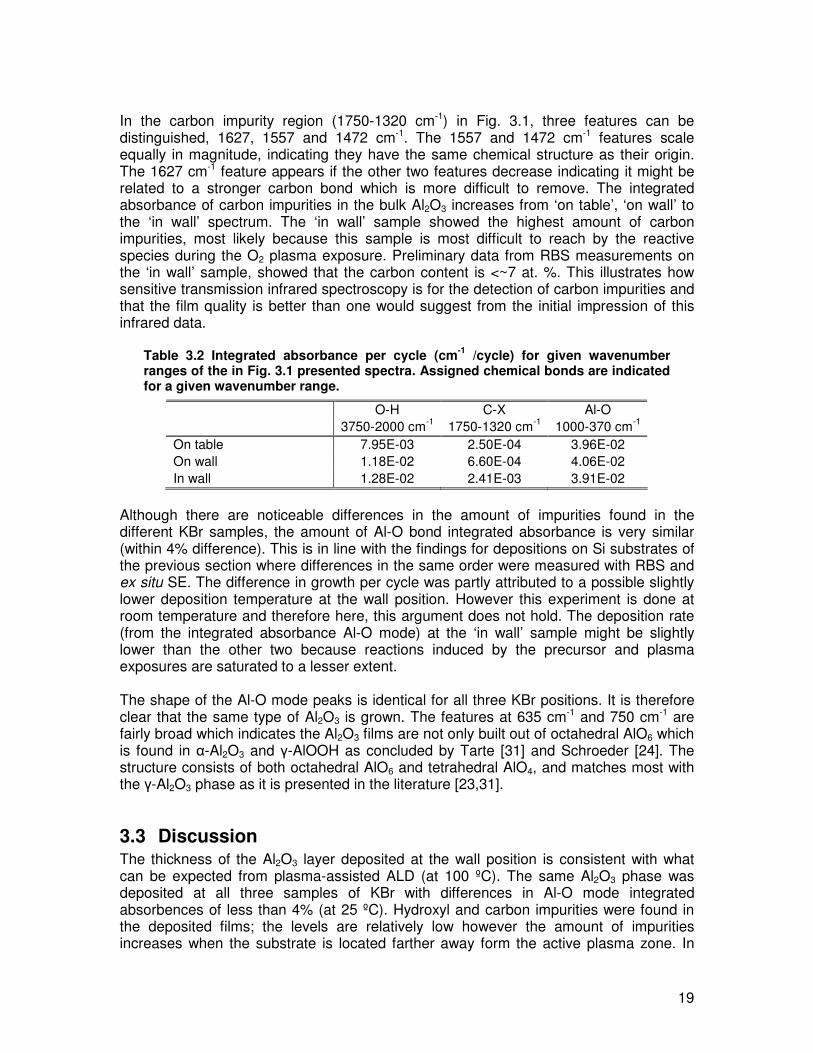
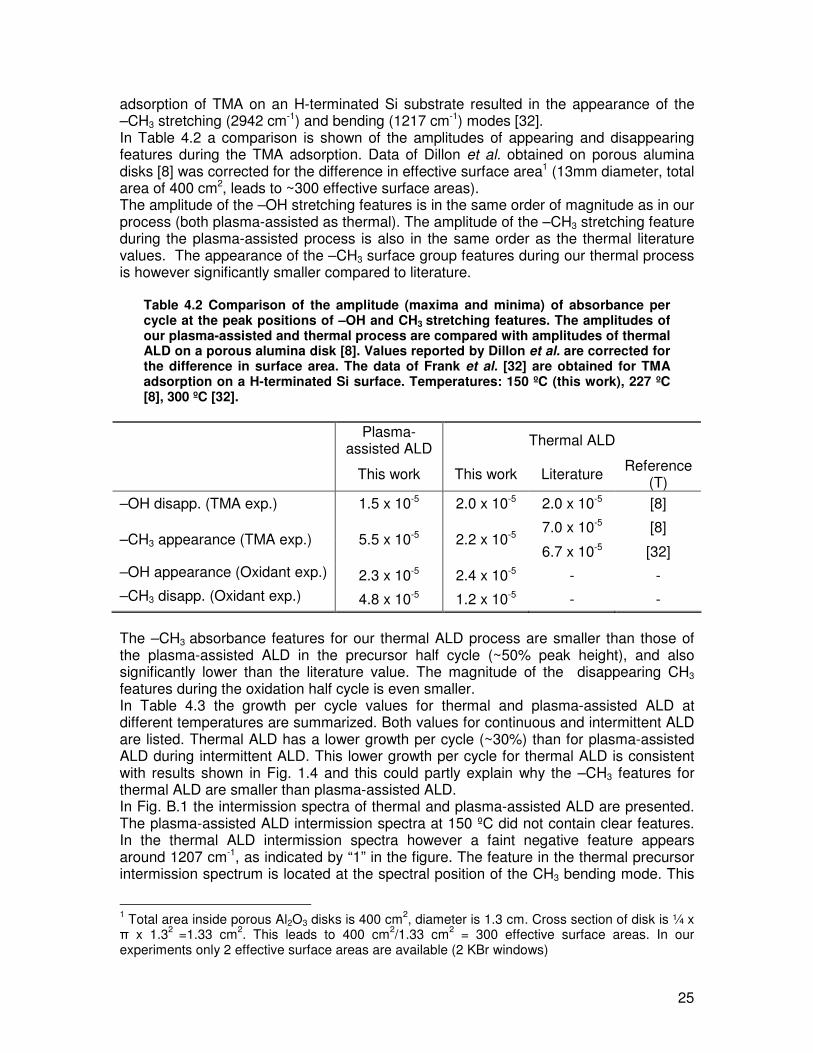
4.2 Comparison of Plasma-Assisted and Thermal ALD Like the plasma-assisted ALD process at 150 ºC, also the thermal ALD process was studied at 150 ºC. This offers not only the possibility of a direct comparison of the plasma-assisted with the thermal ALD process, but also can the results of thermal ALD on our setup be compared to results of thermal ALD reported in the literature [8]. In Fig. 4.2 the absorbance spectra of the thermal ALD half cycles are shown together with the plasma-assisted process at 150 ºC.
24
4000 3500 3000 2500 2000 1500 1000
1207 cm-1
Abs
orba
nce
Wavenumber (cm-1)
5x10⁻⁵
2937 cm-1
O2 plasma and H
2O exposure half cycle
Plasma-assisted ALD Thermal ALD5x10-5
TMA exposure half cycle
Fig. 4.2. Infrared absorbance spectra of the precursor and oxidation half cycle during plasma-assisted and thermal ALD of Al2O3 at 150 ºC
The first observation is that the peak positions for –OH (3700-3100 cm-1) and –CH3 (2937, 1207 and <800 cm-1) surface groups of both processes are very similar. The position of the spectral features for –OH and CH3 groups also correspond to previous observations for thermal ALD reported in the literature [8-11,38]. The absorbance cross section of chemical groups located at a substrate surface can vary because of changes in the composition of the surface (e.g. other surface groups). Therefore these absorbances measured in experiments can not directly be linked to surface group densities and only be compared at comparable surfaces. The amplitude of the –OH removal signal during the TMA exposure half cycle is slightly larger for the thermal ALD process, compared to the plasma-assisted process. From this observation, one could conclude that the TMA exposure during the thermal TMA half cycle seems to remove –OH surface groups a little more efficiently from the surface. No cause was found for this observation. Dillon et al. showed in their thermal ALD experiments on a porous alumina disk similar –OH (3750-2600 cm-1) and –CH3 (2942 cm-1) stretching features [8]. Furthermore the
25
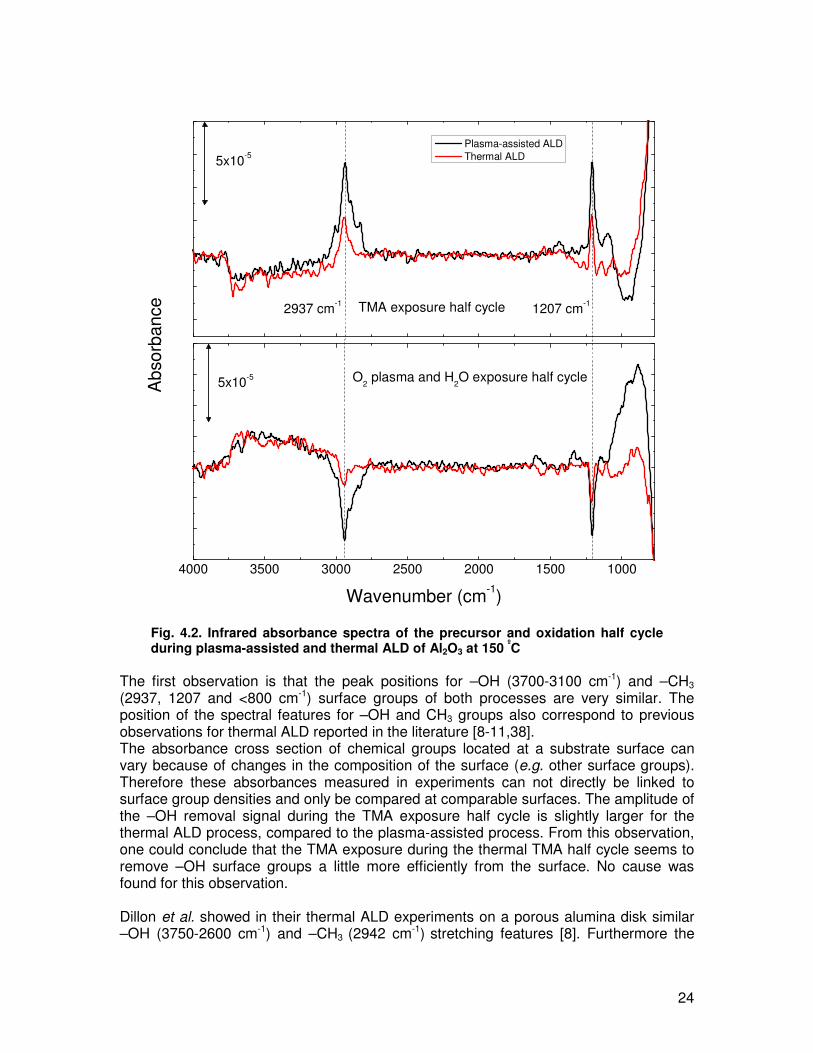
adsorption of TMA on an H-terminated Si substrate resulted in the appearance of the –CH3 stretching (2942 cm-1) and bending (1217 cm-1) modes [32]. In Table 4.2 a comparison is shown of the amplitudes of appearing and disappearing features during the TMA adsorption. Data of Dillon et al. obtained on porous alumina disks [8] was corrected for the difference in effective surface area1 (13mm diameter, total area of 400 cm2, leads to ~300 effective surface areas). The amplitude of the –OH stretching features is in the same order of magnitude as in our process (both plasma-assisted as thermal). The amplitude of the –CH3 stretching feature during the plasma-assisted process is also in the same order as the thermal literature values. The appearance of the –CH3 surface group features during our thermal process is however significantly smaller compared to literature.
Table 4.2 Comparison of the amplitude (maxima and minima) of absorbance per cycle at the peak positions of –OH and CH3 stretching features. The amplitudes of our plasma-assisted and thermal process are compared with amplitudes of thermal ALD on a porous alumina disk [8]. Values reported by Dillon et al. are corrected for the difference in surface area. The data of Frank et al. [32] are obtained for TMA adsorption on a H-terminated Si surface. Temperatures: 150 ºC (this work), 227 ºC [8], 300 ºC [32].
Plasma-
assisted ALD Thermal ALD
This work This work Literature Reference (T)
–OH disapp. (TMA exp.) 1.5 x 10⁻⁵ 2.0 x 10⁻⁵ 2.0 x 10⁻⁵ [8]
7.0 x 10⁻⁵ [8] –CH3 appearance (TMA exp.) 5.5 x 10⁻⁵ 2.2 x 10⁻⁵
6.7 x 10⁻⁵ [32] –OH appearance (Oxidant exp.) 2.3 x 10⁻⁵ 2.4 x 10⁻⁵ - - –CH3 disapp. (Oxidant exp.) 4.8 x 10⁻⁵ 1.2 x 10⁻⁵ - - The –CH3 absorbance features for our thermal ALD process are smaller than those of the plasma-assisted ALD in the precursor half cycle (~50% peak height), and also significantly lower than the literature value. The magnitude of the disappearing CH3 features during the oxidation half cycle is even smaller. In Table 4.3 the growth per cycle values for thermal and plasma-assisted ALD at different temperatures are summarized. Both values for continuous and intermittent ALD are listed. Thermal ALD has a lower growth per cycle (~30%) than for plasma-assisted ALD during intermittent ALD. This lower growth per cycle for thermal ALD is consistent with results shown in Fig. 1.4 and this could partly explain why the –CH3 features for thermal ALD are smaller than plasma-assisted ALD. In Fig. B.1 the intermission spectra of thermal and plasma-assisted ALD are presented. The plasma-assisted ALD intermission spectra at 150 ºC did not contain clear features. In the thermal ALD intermission spectra however a faint negative feature appears around 1207 cm-1, as indicated by “1” in the figure. The feature in the thermal precursor intermission spectrum is located at the spectral position of the CH3 bending mode. This
1 Total area inside porous Al2O3 disks is 400 cm2, diameter is 1.3 cm. Cross section of disk is ¼ x � x 1.32 =1.33 cm2. This leads to 400 cm2/1.33 cm2 = 300 effective surface areas. In our experiments only 2 effective surface areas are available (2 KBr windows)
26
indicates that during the first infrared measurement after the TMA exposure, more –CH3 groups are on the surface than in the second measurement. It seems that these groups disappear as a function of time. This could explain why more –CH3 features disappear during H2O exposure than appear during the TMA exposure. It also explains why larger features are observed in literature. However the question what causes this disappearance still remains. Firstly, one could argue that this issue is related to thermal stability of the –CH3 surface groups. However this is not a logical argument since than the same effect would be expected for plasma-assisted ALD. Another possibility is the consumption of CH3 surface groups by residual water in the reactor; probably because of the extensive water dosing which is part of the thermal process. During our experiment an increase in reactor base pressure was observed during a full day of infrared measurements, indicating residual species in the reactor. This is most likely water affecting the surface –CH3 groups during our measurements. Dillon et al. and Frank et al. did not have this problem because during their experiments, TMA was dosed for a period of time (Dillon 210 s, Frank 60 s vs. 25 ms in this work). If residual water consumed the –CH3 groups in their experiments, new TMA molecules would restore the CH3 surface groups. This could explain why appearing –CH3 groups are significantly larger in literature experiments compared to our results, both for plasma-assisted and thermal ALD.
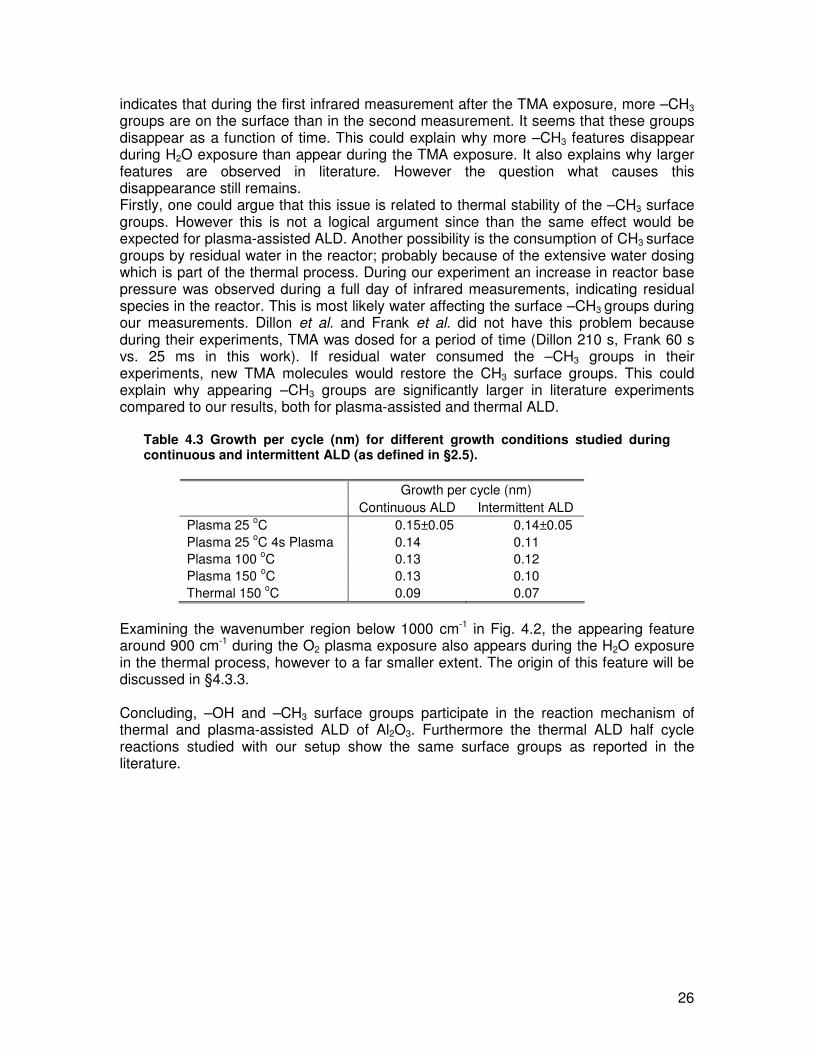
Table 4.3 Growth per cycle (nm) for different growth conditions studied during continuous and intermittent ALD (as defined in §2.5).
Growth per cycle (nm)
Continuous ALD Intermittent ALD Plasma 25 oC 0.15±0.05 0.14±0.05 Plasma 25 oC 4s Plasma 0.14 0.11 Plasma 100 oC 0.13 0.12 Plasma 150 oC 0.13 0.10 Thermal 150 oC 0.09 0.07
Examining the wavenumber region below 1000 cm-1 in Fig. 4.2, the appearing feature around 900 cm-1 during the O2 plasma exposure also appears during the H2O exposure in the thermal process, however to a far smaller extent. The origin of this feature will be discussed in §4.3.3. Concluding, –OH and –CH3 surface groups participate in the reaction mechanism of thermal and plasma-assisted ALD of Al2O3. Furthermore the thermal ALD half cycle reactions studied with our setup show the same surface groups as reported in the literature.

27
4.3 Plasma-Assisted ALD at Different Temperatures In an attempt to understand the increase in growth per cycle for lower temperatures of plasma-assisted ALD of Al2O3, the surface groups were detected for depositions at different substrate temperatures. In Fig. 4.3 the infrared absorbance spectra are shown for both half cycles for depositions at 150, 100 and 25 ºC. In the 3600-3100 cm-1 range the –OH stretching absorbance increases from 150 to 25 ºC. In the 2800-2200 cm-1 range an additional broad shoulder for depositions at 100 and 25 ºC appears. The CH3 stretching (2937 cm-1), bending (1207 cm-1) and rocking (<800 cm-1) features show up at the same positions at all temperatures and with similar amplitudes after TMA dosing. A more quantitative analysis is presented in Fig. 4.4 and will be discussed in the next sections. The CH3 rocking feature is not included since most part of this feature is out of the range or the detector. The features at 1660 cm-1 and 1600-1450 cm-1 are most likely carbon related features also observed in Fig. 3.1 and will be discussed later.
4000 3500 3000 2500 2000 1500 1000
1660 cm-1
3687 cm-1
Abs
orba
nce
Wavenumber (cm-1)
5x10-53735 cm
-1
O2 plasma exposure half cycle
150 oC 100 oC 25 oC
TMA exposure half cycle
5x10⁻⁵
Fig. 4.3. Infrared absorbance spectra of the precursor and oxidation half cycle during plasma-assisted ALD of Al2O3 at different deposition temperatures.

28
-3 -2 -1 0 1 2 3
3064-2758 cm-1
3064-2758 cm-1
1241-1162 cm-1
1241-1162 cm-1
OH
OH
Disappearing Surface Groups
O2 plasma exposure
half cycle
Integrated absorbance (10-1 cm-1)
150 oC 100 oC 25 oC
3853-3630 cm-1
3630-3109 cm-1
3109-2200 cm-1
CH3 Stretching
CH3 Bending
CH3 Bending
CH3 Stretching
3109-2200 cm-1
3630-3109 cm-1
3853-3630 cm-1
TMA exposure half cycle
Appearing Surface Groups
Fig. 4.4 Integrated absorbance of the –OH and –CH3 spectral features during precursor and oxidation half cycle of plasma-assisted ALD of Al2O3 at different temperatures.
Integrated absorbancies displayed in Fig. 4.4 are calculated from Fig. 4.3. For the values of OH and CH3 stretching, a correction was performed for the fact that their wavenumber regions overlap. This was done by using a baseline that extends from the OH main feature (3500-3000 cm-1) to the OH shoulder (2800-2200 cm-1).
4.3.1 –CH3 Features Based on the larger growth per cycle at lower temperatures in Table 4.3 one would expect a larger integrated absorbance for all the surface groups. However the area of the CH3 stretching features is constant for the deposition temperatures studied. Also for the bending mode, changes are within the measurement error. Concluding, the amount of –CH3 surface groups at the surface shows no clear trend within the measured temperature window. It is however not necessarily true to have more –CH3 at the surface when more TMA molecules are adsorbed on the oxidized surface. The TMA molecule could also land bifunctionally, consuming two –OH sites and leaving only one methyl group at the surface for oxidation. The bifunctionally adsorption of TMA on a hydroxylised surface was earlier suggested in the literature during plasma-assisted ALD [26] and during thermal ALD of Al2O3 [39]. If on average more TMA molecules chemisorb bifunctionally at lower temperatures, more Al atoms are actually deposited while inducing a (possibly) equal amount of –CH3 absorbance, since on average more CH3 was split off. Thus a higher growth per cycle does not necessary require an increase in –CH3 surface density. Simulations of Elliot et al. [40] have shown that a TMA molecule which reacts with one free O site and one –OH group on the surface can reach lower energy levels by consuming an extra –OH group creating tetrahedrally oriented aluminum (in this case 3 bonds to O, 1 to –CH3), if such a site is available. Elliot et al. however also states that the consumption of two protons instead of one (and therefore –OH groups) at the surface is more likely at higher temperatures. It should be noted that a higher –OH
29
density at the surface at lower temperatures is however not addressed in his simulations, and that might influence the outcome of the simulations.
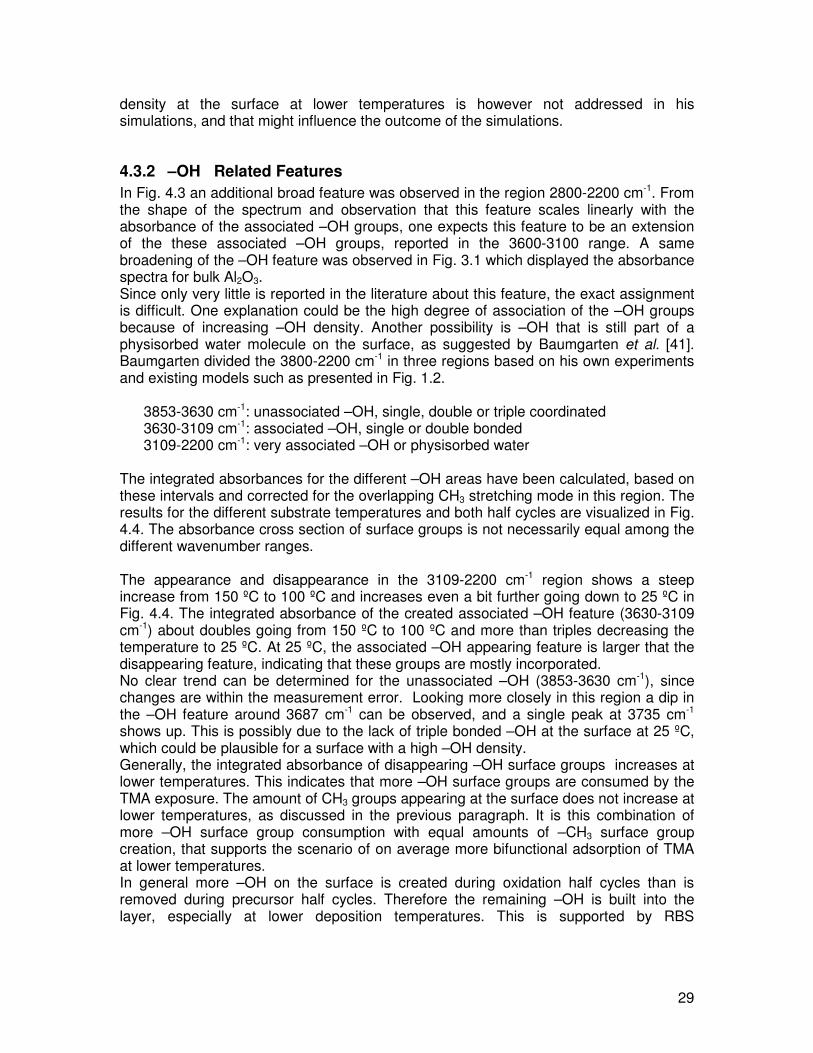
4.3.2 –OH Related Features In Fig. 4.3 an additional broad feature was observed in the region 2800-2200 cm-1. From the shape of the spectrum and observation that this feature scales linearly with the absorbance of the associated –OH groups, one expects this feature to be an extension of the these associated –OH groups, reported in the 3600-3100 range. A same broadening of the –OH feature was observed in Fig. 3.1 which displayed the absorbance spectra for bulk Al2O3. Since only very little is reported in the literature about this feature, the exact assignment is difficult. One explanation could be the high degree of association of the –OH groups because of increasing –OH density. Another possibility is –OH that is still part of a physisorbed water molecule on the surface, as suggested by Baumgarten et al. [41]. Baumgarten divided the 3800-2200 cm-1 in three regions based on his own experiments and existing models such as presented in Fig. 1.2.
3853-3630 cm-1: unassociated –OH, single, double or triple coordinated 3630-3109 cm-1: associated –OH, single or double bonded 3109-2200 cm-1: very associated –OH or physisorbed water
The integrated absorbances for the different –OH areas have been calculated, based on these intervals and corrected for the overlapping CH3 stretching mode in this region. The results for the different substrate temperatures and both half cycles are visualized in Fig. 4.4. The absorbance cross section of surface groups is not necessarily equal among the different wavenumber ranges. The appearance and disappearance in the 3109-2200 cm-1 region shows a steep increase from 150 ºC to 100 ºC and increases even a bit further going down to 25 ºC in Fig. 4.4. The integrated absorbance of the created associated –OH feature (3630-3109 cm-1) about doubles going from 150 ºC to 100 ºC and more than triples decreasing the temperature to 25 ºC. At 25 ºC, the associated –OH appearing feature is larger that the disappearing feature, indicating that these groups are mostly incorporated. No clear trend can be determined for the unassociated –OH (3853-3630 cm-1), since changes are within the measurement error. Looking more closely in this region a dip in the –OH feature around 3687 cm-1 can be observed, and a single peak at 3735 cm-1
shows up. This is possibly due to the lack of triple bonded –OH at the surface at 25 ºC, which could be plausible for a surface with a high –OH density. Generally, the integrated absorbance of disappearing –OH surface groups increases at lower temperatures. This indicates that more –OH surface groups are consumed by the TMA exposure. The amount of CH3 groups appearing at the surface does not increase at lower temperatures, as discussed in the previous paragraph. It is this combination of more –OH surface group consumption with equal amounts of –CH3 surface group creation, that supports the scenario of on average more bifunctional adsorption of TMA at lower temperatures. In general more –OH on the surface is created during oxidation half cycles than is removed during precursor half cycles. Therefore the remaining –OH is built into the layer, especially at lower deposition temperatures. This is supported by RBS

30
measurements [27] (see Table A.1, Appendix A), where higher O and H content in the films was detected at lower substrate temperatures. The increase in –OH surface group appearance and disappearance for lower temperatures, and the increasing growth per cycle for lower temperatures, supports the vision that the plasma-assisted ALD of Al2O3 growth is dominated by the creation of hydroxyl groups at the surface at which the TMA precursor adsorbs.
4.3.3 Discussion on 900 cm-1 feature Around 900 cm-1 in the O2 plasma half cycle of Fig. 4.3, a broad feature appears which disappears in the TMA exposure half cycle. This appearance and disappearance was also observed in the absorbance spectra of thermal ALD in Fig. 4.2. The following two observations were made of this 900 cm-1 feature:
1. During plasma-assisted ALD, the amplitude decreases and the peak position shifts to lower wavenumbers (890�865 cm-1) at lower deposition temperatures.
2. The amplitude during the thermal ALD process is (~80%) smaller than during plasma-assisted ALD at 150 ºC.
Goldstein et al. [13] reported a feature around 975 cm-1 assigning it to Al-O bulk and Frank et al. [32] reported a feature around 830 cm-1 which was assigned to Al-O. In the bulk of AlOOH, an –OH bending mode and an Al=O stretching mode were reported around 1100 cm-1 and 1000 cm-1, respectively [42].
Based on these reports from literature the following two assignments are presented, and illustrated in Fig. 4.5:
a) “Al-O bulk mode”. During the O2 plasma half cycle oxygen atoms are connected to the surface creating an Al-O or Al=O bond which induces the 900 cm-1 peak. During the TMA exposure half cycle the heavier Al atom is connected to the bond, shifting the stretching peak to lower wavenumbers (<770 cm-1) (heavier atoms result in a lower oscillator frequency of the mass-spring system). Consequently after a complete ALD cycle (i.e. after O2 plasma exposure), a part of this resulting feature is observed and assigned to bulk Al2O3. b) “-OH bending mode” The 900 cm-1 peak, which appears during the oxidation half cycle, is caused by –OH bending mode at the surface. During the TMA precursor exposure these surface groups are removed, and the addition of a new Al atom to the structure induces the bulk Al2O3 seen in the sum spectrum.
Fig. 4.5 Two illustrations supporting possible assignments of the feature around 900 cm-1 that disappeared in the TMA exposure half cycle. The double arrow illustrate vibrational modes detected by the infrared light, (a) Al-O or Al=O stretching mode at the surface, (b) –OH bending mode at the surface.

31
So how can the first observation be explained? First part of the observation is the decrease in the 900 cm-1 feature amplitude at lower temperatures. At these lower temperatures more –OH surface groups appeared at the surface during the O2 plasma exposure. As a consequence less Al=O bonds could be present at the surface at lower temperatures and thus result in a decrease in amplitude. Besides the decrease in amplitude, also a shift in the peak position to lower wavenumbers was observed. This could be caused by the fact that the still existing Al=O at lower temperatures are influenced by the change in bond type in their surrounding (e.g. more neighboring –OH groups), and that lowers the peak position of the Al=O features. There are also good arguments that support the detection of an –OH bending mode at the surface with respect to first observation. Again, first the decrease in amplitude of the 900 cm-1 feature. At lower deposition temperatures more –OH surface groups appear during the O2 plasma exposure, especially associated –OH groups. This higher degree of association creates extra bonds in-between –OH groups. That could obstruct –OH surface groups from bending. This also leads to the decrease of the amplitude of the peak around 900 cm-1. The observed shift in peak position to lower wavenumbers at lower temperatures, can again be related to the fact that the –OH bending mode is influenced by the neighbouring –OH features and the peak position is shifted to lower wavenumbers. How can the second observation be explained? In this observation the amplitude of the discussed feature in the thermal process is lower than the plasma-assisted process. Both explanations do not seem very likely. If it is related to bulk Al=O, than it would mean that plasma-assisted ALD results in a different Al=O bonding than thermal ALD. Although one could argue that in both cases Al2O3 is deposited it could be that there is a different ratio in tetrahedral and octahedral coordinated structures, however than also a difference in –OH stretching spectrum would be expected. Since the amount and type of –OH stretching mode is the same for plasma-assisted and thermal ALD, one would also expect the same kind of Al-OH bending around 900 cm-1. This would exclude the “Al-OH” bending possibility. Another possibility might be that there are still –OH surface groups on the –CH3 dominated surface after TMA exposure. The cross section of –OH bending mode and Al=O could be suppressed by the neighboring –CH3 groups and thus by removal of the –CH3 surface groups by the plasma, these modes are not suppressed anymore and result in a large appearing feature. The difference in surface –CH3 groups between plasma-assisted and thermal ALD could in turn explain the difference in the 900 cm-1 feature. Concluding, different possible assignments for the appearing and disappearing 900 cm-1 feature in the infrared absorbance spectra are discussed. Both an Al-O bulk and an –OH bending mode were discussed and compared with different observations in the infrared spectra. No clear conclusion could however be drawn form this discussion.
32
4.4 Low Temperature Film Quality In the infrared absorbance spectra for the deposition at 25 ºC in Fig. 4.3 a additional feature appeared in the oxidation half cycle around 1660 cm-1. In the precursor half cycle this feature disappeared while a broader feature from 1600 to 1450 cm-1 appeared. These last features were incorporated into the film which was also observed in Fig. 3.1. Assigning the nature of a feature within the 1700-1300 cm-1 region is not straightforward since multiple assignments are reported, which can be categorized in carbon, hydroxyl and nitrogen related features. The latter will be left out of the discussion since nitrogen atoms do not take part in our processes. Table 4.4 shows an overview of different carbon and hydroxyl related assignments. The carbon related features can basically be divided into three groups: carboxylate (CO2), carbonate (CO3) and formate (COOH). These ligands can be connected to the bulk structure via one or two bonds, making them monodentate or bidentate, respectively and are observed at the surface as well as incorporated into the bulk. The detected wavenumbers are usually caused by C=O stretching or COO (asymmetric or symmetric) stretching.
Table 4.4 Overview of different vibrational assignments for carbon and hydroxyl related surface groups and bulk impurities.
Group Region Reference
Formate 1660-1590 1410-1390 1390-1355
[13,43]
1675-1650 [43] (bidentate) Carboxylate 1620-1550
1500-1320 [44]
Sur
face
gro
ups
Carbonate 1700-1600 [45] (bidentate) 1850-1300 [37] 1700-1500 [46] Carboxylate 1500-1600
1380 [16]
1600-1590 1400-1390 [47] (bidentate)
1570-1560 1480-1430 [47] (monodentate) Carbonate
1500-1600 1380 [16]
1590-1550 [8,48,49] 1475-1460 [8,48]
Bul
k in
corp
orat
ed
Water (bending) 1390-1370 [48]
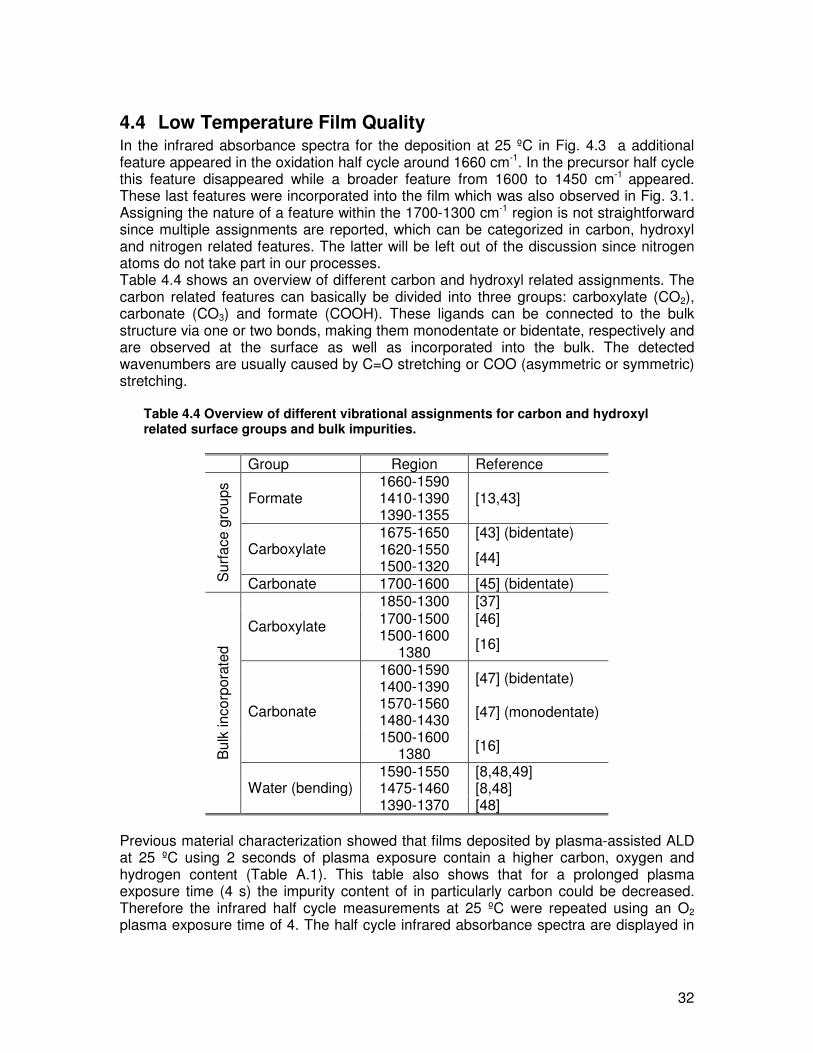
Previous material characterization showed that films deposited by plasma-assisted ALD at 25 ºC using 2 seconds of plasma exposure contain a higher carbon, oxygen and hydrogen content (Table A.1). This table also shows that for a prolonged plasma exposure time (4 s) the impurity content of in particularly carbon could be decreased. Therefore the infrared half cycle measurements at 25 ºC were repeated using an O2 plasma exposure time of 4. The half cycle infrared absorbance spectra are displayed in
33
Fig. 4.6 together with the deposition using 2 s of plasma exposure to make a direct comparison.
In these spectra –OH (3750-2200 cm-1) and –CH3 (2935, 1207, <800 cm-1)surface group features appear at the same positions and similar amplitudes for both experiments at 25 ºC. The spectra below 1300 cm-1 are clearly different; however the same spectral features can be recognized in both the oxidation and the precursor half cycle spectra. The difference is most likely caused by detector baseline shift. Second an approximate 40% decrease in the 1660 cm-1 feature is visible for the 4 vs. 2 second experiment. However, in a first examination, the incorporated 1600-1450 cm-1 feature does not seem to decease. Although, taking the indicated baseline shift into account, the feature might decrease slightly. If the 1660 cm-1 and 1600-1450 cm-1 features are related to the same source, one would expect both to decrease an approximate same amount. In a next step to elucidate the origin of the 1660 cm-1 and 1600-1450 cm-1 features is to look at the Al2O3 bulk spectra. These spectra have better signal to noise ratios and suffer less from shifts in baselines than the half cycle spectra.
4000 3500 3000 2500 2000 1500 1000
Abs
orba
nce
Wavenumber (cm-1)
5x10⁻⁵
1660 cm-1
2s O2 plasma
4s O2 plasma
5x10⁻⁵
1600-1450 cm-1
Baseline shift
Fig. 4.6. Infrared absorbance spectra of both half cycles during plasma-assisted ALD of Al2O3 at 25 oC using two different plasma exposure times (2 s and 4 s) in the ALD cycle. The shift in baseline below 1300 cm-1 is indicated
34
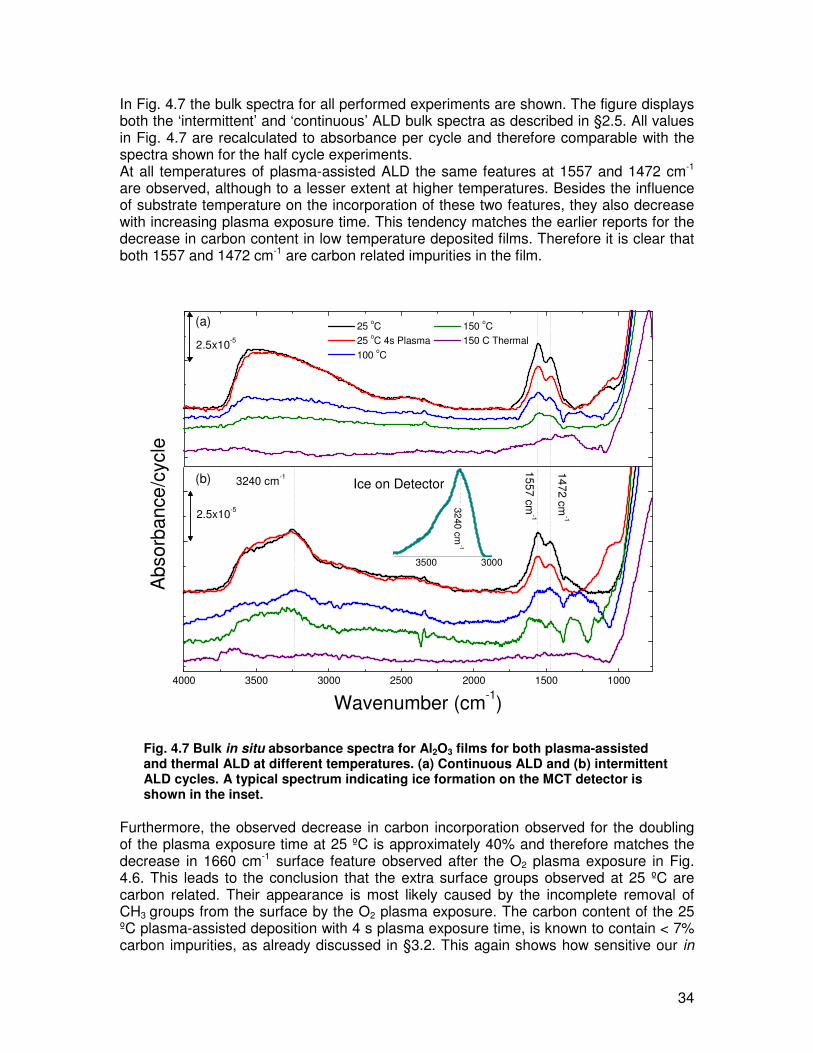
In Fig. 4.7 the bulk spectra for all performed experiments are shown. The figure displays both the ‘intermittent’ and ‘continuous’ ALD bulk spectra as described in §2.5. All values in Fig. 4.7 are recalculated to absorbance per cycle and therefore comparable with the spectra shown for the half cycle experiments. At all temperatures of plasma-assisted ALD the same features at 1557 and 1472 cm-1
are observed, although to a lesser extent at higher temperatures. Besides the influence of substrate temperature on the incorporation of these two features, they also decrease with increasing plasma exposure time. This tendency matches the earlier reports for the decrease in carbon content in low temperature deposited films. Therefore it is clear that both 1557 and 1472 cm-1 are carbon related impurities in the film.
Fig. 4.7 Bulk in situ absorbance spectra for Al2O3 films for both plasma-assisted and thermal ALD at different temperatures. (a) Continuous ALD and (b) intermittent ALD cycles. A typical spectrum indicating ice formation on the MCT detector is shown in the inset.
Furthermore, the observed decrease in carbon incorporation observed for the doubling of the plasma exposure time at 25 ºC is approximately 40% and therefore matches the decrease in 1660 cm-1 surface feature observed after the O2 plasma exposure in Fig. 4.6. This leads to the conclusion that the extra surface groups observed at 25 ºC are carbon related. Their appearance is most likely caused by the incomplete removal of CH3 groups from the surface by the O2 plasma exposure. The carbon content of the 25 ºC plasma-assisted deposition with 4 s plasma exposure time, is known to contain < 7% carbon impurities, as already discussed in §3.2. This again shows how sensitive our in
3500 3000
4000 3500 3000 2500 2000 1500 1000
(a)
25 oC 150 oC 25 oC 4s Plasma 150 C Thermal 100 oC
(b)
3240 cm-1
Ice on Detector3240 cm-1
1472 cm-1
Abs
orba
nce/
cycl
e
Wavenumber (cm-1)
2.5x10⁻⁵
1557 cm-1
2.5x10⁻⁵
35
situ infrared technique is in the detection of these impurities and that mainly Al2O3 is grown. Besides carbon like features, also OH groups are incorporated since a broad feature is observed from 3750-2250 cm-1 in Fig. 4.7. The amount of OH incorporation decreases with increasing deposition temperature, especially from 25 to 100 ºC. No significant difference in OH incorporation was observed for different plasma exposure times at 25 ºC. Comparing the continuous ALD with intermittent ALD a difference in the shape of the OH feature is observed. The intermittent spectrum shows an extra feature around 3240 cm-1, which corresponds the peak position of ice formation on the N2 cooled MCT detector (shown in the inset in Fig. 4.7). The continuous ALD spectrum does not show this ice feature since the time in-between the two infrared measurements is far shorter (~5 min vs. ~6 hours) for this spectrum and thus ice formation in the detector is minimal. Comparing thermal ALD and plasma-assisted ALD at 150 ºC, it can be observed that a lower amount of OH and carbon is incorporated in the thermally deposited film, in both continuous and intermittent ALD. Especially the difference in OH incorporation is remarkable since the TMA exposure that is believed to be mainly responsible for the consumption of –OH surface groups is the same (as already discussed in §4.2). Concluding, the 1660 cm-1 surface group feature observed after the plasma exposure of plasma-assisted ALD at 25 ºC is related to a carbon containing surface group that is incorporated in the film during TMA exposure. The amount of incorporated carbon and hydroxyls increases for lower deposition temperatures. The small carbon content in the film can be reduced using a longer O2 plasma exposure in the ALD process and thus indicated that the plasma exposure time was not fully saturating the surface reactions at the position of the KBr windows in the reactor.

36
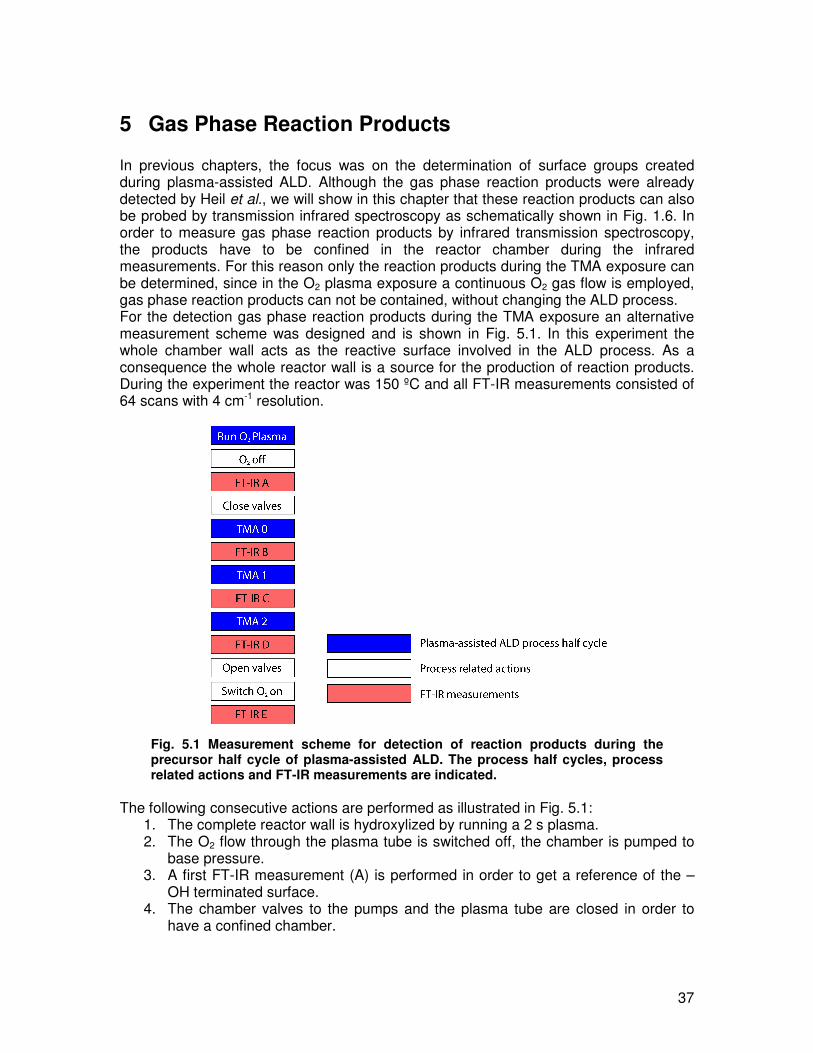
37
5 Gas Phase Reaction Products In previous chapters, the focus was on the determination of surface groups created during plasma-assisted ALD. Although the gas phase reaction products were already detected by Heil et al., we will show in this chapter that these reaction products can also be probed by transmission infrared spectroscopy as schematically shown in Fig. 1.6. In order to measure gas phase reaction products by infrared transmission spectroscopy, the products have to be confined in the reactor chamber during the infrared measurements. For this reason only the reaction products during the TMA exposure can be determined, since in the O2 plasma exposure a continuous O2 gas flow is employed, gas phase reaction products can not be contained, without changing the ALD process. For the detection gas phase reaction products during the TMA exposure an alternative measurement scheme was designed and is shown in Fig. 5.1. In this experiment the whole chamber wall acts as the reactive surface involved in the ALD process. As a consequence the whole reactor wall is a source for the production of reaction products. During the experiment the reactor was 150 ºC and all FT-IR measurements consisted of 64 scans with 4 cm-1 resolution.
Fig. 5.1 Measurement scheme for detection of reaction products during the precursor half cycle of plasma-assisted ALD. The process half cycles, process related actions and FT-IR measurements are indicated.
The following consecutive actions are performed as illustrated in Fig. 5.1:
1. The complete reactor wall is hydroxylized by running a 2 s plasma. 2. The O2 flow through the plasma tube is switched off, the chamber is pumped to
base pressure. 3. A first FT-IR measurement (A) is performed in order to get a reference of the –
OH terminated surface. 4. The chamber valves to the pumps and the plasma tube are closed in order to
have a confined chamber.
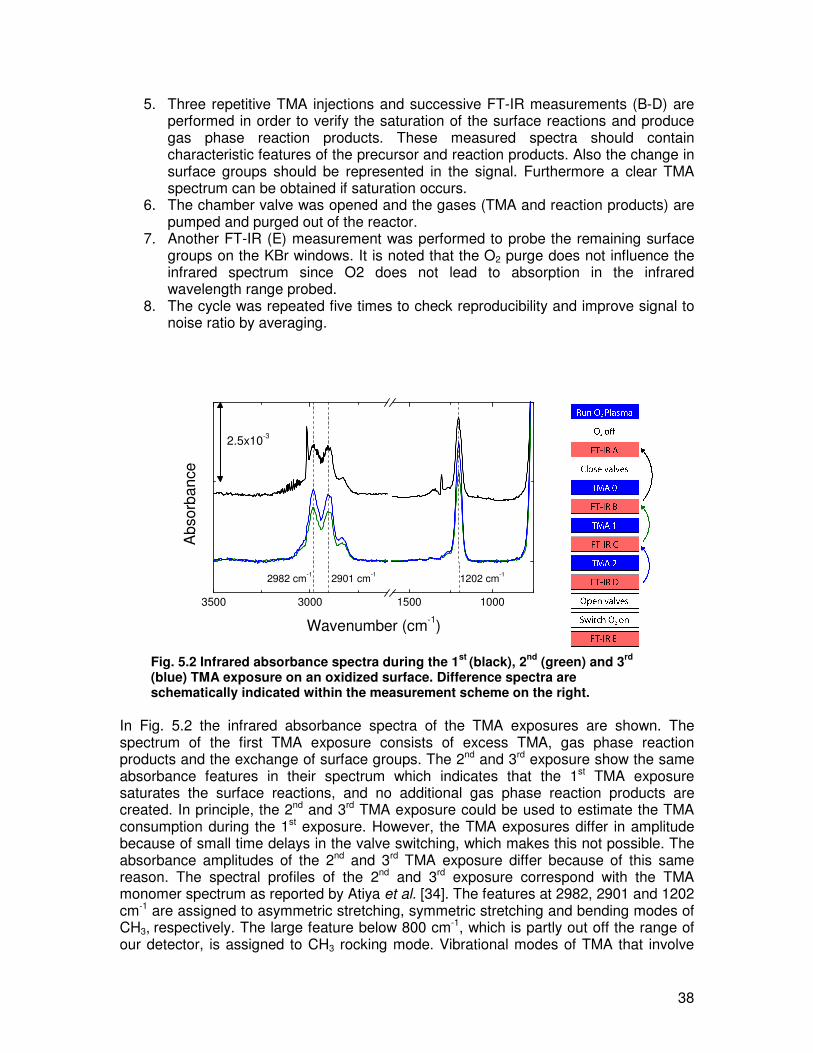
38
5. Three repetitive TMA injections and successive FT-IR measurements (B-D) are performed in order to verify the saturation of the surface reactions and produce gas phase reaction products. These measured spectra should contain characteristic features of the precursor and reaction products. Also the change in surface groups should be represented in the signal. Furthermore a clear TMA spectrum can be obtained if saturation occurs.
6. The chamber valve was opened and the gases (TMA and reaction products) are pumped and purged out of the reactor.
7. Another FT-IR (E) measurement was performed to probe the remaining surface groups on the KBr windows. It is noted that the O2 purge does not influence the infrared spectrum since O2 does not lead to absorption in the infrared wavelength range probed.
8. The cycle was repeated five times to check reproducibility and improve signal to noise ratio by averaging.
3500 3000 1500 1000
2901 cm-1
Abs
orba
nce
Wavenumber (cm-1)
2.5x10⁻³
1202 cm-12982 cm-1
Fig. 5.2 Infrared absorbance spectra during the 1st (black), 2nd (green) and 3rd (blue) TMA exposure on an oxidized surface. Difference spectra are schematically indicated within the measurement scheme on the right.
In Fig. 5.2 the infrared absorbance spectra of the TMA exposures are shown. The spectrum of the first TMA exposure consists of excess TMA, gas phase reaction products and the exchange of surface groups. The 2nd and 3rd exposure show the same absorbance features in their spectrum which indicates that the 1st TMA exposure saturates the surface reactions, and no additional gas phase reaction products are created. In principle, the 2nd and 3rd TMA exposure could be used to estimate the TMA consumption during the 1st exposure. However, the TMA exposures differ in amplitude because of small time delays in the valve switching, which makes this not possible. The absorbance amplitudes of the 2nd and 3rd TMA exposure differ because of this same reason. The spectral profiles of the 2nd and 3rd exposure correspond with the TMA monomer spectrum as reported by Atiya et al. [34]. The features at 2982, 2901 and 1202 cm-1 are assigned to asymmetric stretching, symmetric stretching and bending modes of CH3, respectively. The large feature below 800 cm-1, which is partly out off the range of our detector, is assigned to CH3 rocking mode. Vibrational modes of TMA that involve

39
the Al-C bond are reported around 691 cm-1 and are therefore out off our detection range.
3500 3000 1500 1000
1207 cm-1
A
bsor
banc
e
Wavenumber (cm-1)
2x10⁻⁴
5x10⁻³
2935 cm-1
Fig. 5.3 Infrared absorbance spectra for the reactor pump off (red, TMA and reaction products) and surface groups (green). Difference spectra are schematically indicated within the measurement scheme on the right.
In Fig. 5.3 the absorbance spectra are shown for the reactor pump down and the remaining surface groups. The gases that are pumped out of the reactor contain the reaction products and excess of injected TMA. The only signal that remains in the FT-IR beam path is the absorbance of the surface groups, which is determined by comparing the first and last FT-IR measurement in the scheme. Although the signal to noise ratio of this spectrum is not as good as previously shown results, the three CH3 features (stretching: 2935 cm-1, bending: 1207 cm-1 and Rocking: <800 cm-1) are clearly distinguishable. To determine the gas phase reaction product from the measured spectra, the spectrum recorded after the first TMA exposure has to be cleared from the excess of TMA molecules and the surface species. In order to remove all typical TMA spectral features from the spectrum of the 1st exposure the 3rd TMA spectrum was used and subtracted using a correction factor of 0.85, to compensate for the difference in amplitude. Figure 5.4 shows the absorbance spectra of the 1st and 3rd TMA exposure and the surface groups, as well as the deduced gas phase reaction product spectrum. This reaction product spectrum matches the spectrum of CH4. As a comparison the NIST (National Institute of Standards) spectrum for CH4 is displayed in Fig. 5.4. Sharp features are observed at 1303 cm-1 and 3016 cm-1 and can be assigned to bending and stretching modes within the CH4 molecule, respectively. Methane being the reaction product of the TMA exposure during plasma-assisted ALD of Al2O3 matches earlier measurements by Heil et al. [26].
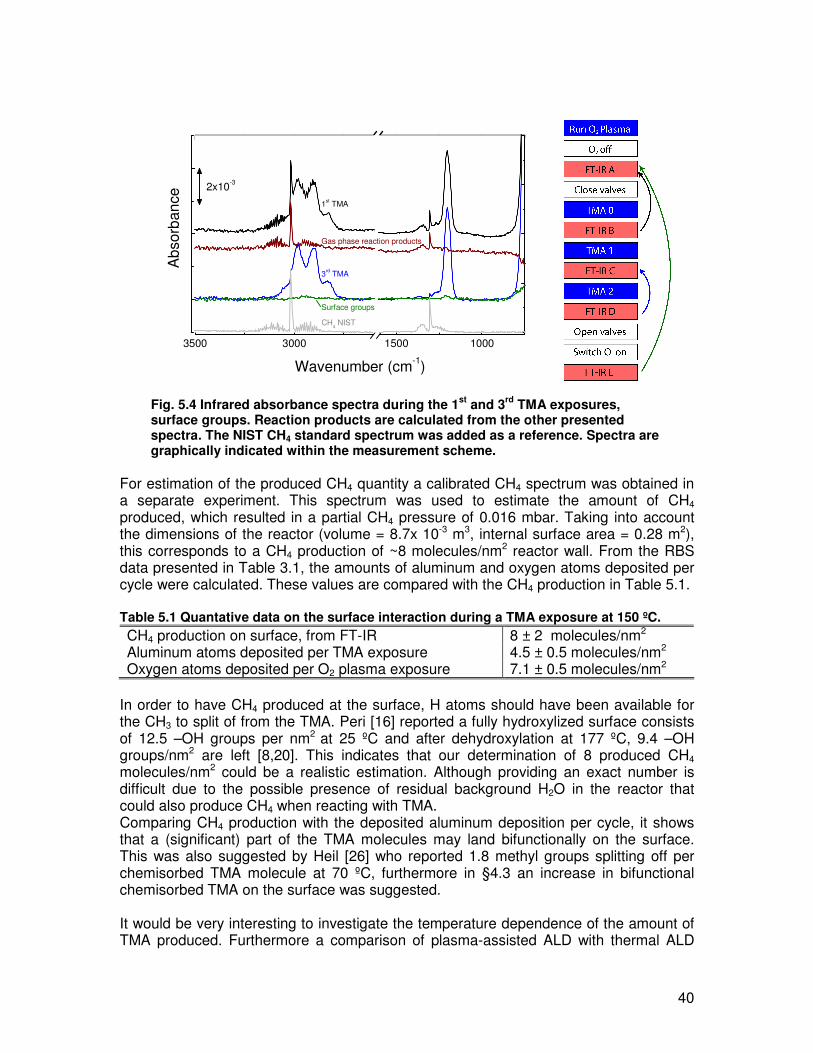
40
3500 3000 1500 1000
Abs
orba
nce
Wavenumber (cm-1)
CH4 NIST
Surface groups
Gas phase reaction products
3rd TMA
2x10⁻³
1st TMA
Fig. 5.4 Infrared absorbance spectra during the 1st and 3rd TMA exposures, surface groups. Reaction products are calculated from the other presented spectra. The NIST CH4 standard spectrum was added as a reference. Spectra are graphically indicated within the measurement scheme.
For estimation of the produced CH4 quantity a calibrated CH4 spectrum was obtained in a separate experiment. This spectrum was used to estimate the amount of CH4 produced, which resulted in a partial CH4 pressure of 0.016 mbar. Taking into account the dimensions of the reactor (volume = 8.7x 10⁻³ m3, internal surface area = 0.28 m2), this corresponds to a CH4 production of ~8 molecules/nm2 reactor wall. From the RBS data presented in Table 3.1, the amounts of aluminum and oxygen atoms deposited per cycle were calculated. These values are compared with the CH4 production in Table 5.1. Table 5.1 Quantative data on the surface interaction during a TMA exposure at 150 ºC. CH4 production on surface, from FT-IR 8 ± 2 molecules/nm2 Aluminum atoms deposited per TMA exposure 4.5 ± 0.5 molecules/nm2
Oxygen atoms deposited per O2 plasma exposure 7.1 ± 0.5 molecules/nm2 In order to have CH4 produced at the surface, H atoms should have been available for the CH3 to split of from the TMA. Peri [16] reported a fully hydroxylized surface consists of 12.5 –OH groups per nm2
at 25 ºC and after dehydroxylation at 177 ºC, 9.4 –OH groups/nm2 are left [8,20]. This indicates that our determination of 8 produced CH4 molecules/nm2 could be a realistic estimation. Although providing an exact number is difficult due to the possible presence of residual background H2O in the reactor that could also produce CH4 when reacting with TMA. Comparing CH4 production with the deposited aluminum deposition per cycle, it shows that a (significant) part of the TMA molecules may land bifunctionally on the surface. This was also suggested by Heil [26] who reported 1.8 methyl groups splitting off per chemisorbed TMA molecule at 70 ºC, furthermore in §4.3 an increase in bifunctional chemisorbed TMA on the surface was suggested. It would be very interesting to investigate the temperature dependence of the amount of TMA produced. Furthermore a comparison of plasma-assisted ALD with thermal ALD

41
would provide additional insight in the growth mechanism of these two processes. This work is currently being conducted by M. Bouwman. Concluding, it was shown that our in situ infrared setup, which was initially designed for the detection of surface groups, is also suited for the detection of gas phase reaction products. CH4 was confirmed to be the gas phase reaction product of the TMA exposure of plasma-assisted ALD of Al2O3. In a first approximation, the amount of CH4 produced is in fair agreement with the expectations based on the literature and amount of Al atoms deposited per cycle.

42

43
6 Reaction Mechanism of Plasma-Assisted ALD of Al2O3
One of the main research objectives of this work was to unravel the surface chemistry of plasma-assisted ALD by the determination of the surface groups using infrared spectroscopy. In the first paragraph the main reaction mechanism of plasma-assisted ALD of Al2O3 will be discussed based on results from this work and the gas phase reaction products determined by Heil et al. [26]. The second paragraph will focus on alternative and additional reactions and the temperature dependency of the surface chemistry.
6.1 Main Reactions From the detection of surface groups during plasma-assisted ALD it is concluded that –CH3 surface groups are created during the TMA exposure and –OH surface groups during the O2 plasma exposure (as presented in Chapter 4). Consequently, the following two half reactions can be proposed for TMA and O2 plasma exposure:
–OH + Al(CH3)3 (g) � –OAl(CH3)2 + CH4 (g) (1) –AlCH3 + 4 O (g) � –AlOH + CO2 (g) + H2O (g) (2)
TMA Exposure In the first half cycle of plasma-assisted ALD of Al2O3 the TMA molecules are exposed to the surface. The TMA chemisorbs on the surface using protons from the existing –OH surface groups to split off –CH3 from the TMA molecule. CH4 is formed (which was confirmed in Chapter 5) and emerges from the surface as a gas phase reaction product as illustrated in Fig. 6.1(a). The chemisorbed TMA at the surface has formed an O-Al bond as shown in reaction (1). Depending on substrate temperature the TMA molecule can either predominantly adsorb monofunctionally, as described above, or bifunctionally consuming two –OH sites and producing two CH4 molecules as illustrated in Fig. 6.1(b). When all the –OH surface groups have reacted with the TMA molecules, a –CH3 terminated surface is formed after the TMA half cycle.
The reaction pathway of the TMA exposure during plasma-assisted ALD of Al2O3 turns out to be similar to thermal ALD. Both processes make use of –OH surface groups during the TMA exposure and create –CH3 surface groups and CH4 as gas phase reaction products.

44
Fig. 6.1 Illustration of the (a) mono- and (b) bifunctional chemisorption of TMA on a hydroxylized surface leading to the formation of (a) one or (b) two CH4 molecules.
O2 Plasma Exposure In the second half cycle the –CH3 covered surface is exposed to an O2 plasma. This plasma delivers mainly oxygen radicals (O) to the surface that react with the –CH3 surface groups resulting in a combustion like reaction which leads mainly to the formation of CO2 and H2O as illustrated in Fig. 6.2. Additionally also the formation of CO and small amounts of hydrocarbons were reported [26]. The detection of CO by Heil et al. [26], can originate from surface chemistry (by incomplete combustion reactions) or from destructive excitation of CO2 by electrons in the plasma. In this work it has been shown that double and triple bonded unassociated as well as associated –OH surface groups are formed as illustrated in Fig. 6.2(b,c). With the creation of these hydroxyls, Al-O bonds are formed as shown in reaction (2). The composition of different surface groups has been proven to differ depending on substrate temperature and plasma exposure time. At lower temperatures also carbon related surface groups and physisorbed water (Fig. 6.2(e)) were observed and this will be further discussed in the next section. The O2 plasma exposure of plasma-assisted ALD of Al2O3 creates the same surface groups as thermal ALD with H2O as an oxidant, although other gas phase reaction products are created.
Fig. 6.2 O2 plasma exposure on a –CH3 saturated surface, resulting in (a) single- (not observed), (b) double-, (c) triple bonded –OH, (d) associated –OH and (e) physisorbed H2O. CO2 and H2O are formed as gas phase reaction products.

45
6.2 Additional Reactions Temperature Dependency of Surface –OH In this work it is shown that –OH surface groups play an important role in the reaction mechanism of plasma-assisted ALD. Depending on substrate temperature, varying amounts of different types of –OH surface groups are created and removed in the different ALD half reactions. If after TMA exposure still some residual –OH surface groups remain, they will likely be incorporated in the film. At lower temperatures (� 100 ºC), more –OH surface groups participate in the reaction process every cycle. Especially the amount of associated –OH surface groups increases, even resulting the possible formation of physisorbed H2O. Contrary to the –OH surface density, no trend was found in the –CH3 surface group density, as a function of temperature. The higher amount of consumed –OH surface groups together with the equal amount –CH3 surface groups participating in the process, is believed to lead to the on average more bifunctionally landing of TMA at the surface. This induces more deposition of O and Al atoms at the surface, which matches the higher growth per cycle observed at lower temperatures. The bifunctionally adsorption of TMA at the hydroxylized surface was earlier suggested by Heil et al. [26] for plasma-assisted ALD and by Dillon et al. [8] for thermal ALD. Furthermore, the rough determination of the amount of CH4 produced at the surface during the TMA exposure showed also that bifuncionally landing of TMA at 150 ºC is very likely. At even lower temperatures (25 ºC) the unassociated –OH surface group and physisorbed H2O density increases further. At this low temperature more OH is incorporated in the film, indicating that the TMA exposure possibly is not sufficient to fully saturate the ALD half reaction. Besides OH, also carbon related groups are incorporated at 25 ºC substrate temperatures. Increasing the plasma exposure time decreased this incorporation, indicating that the combustion like reaction of the O2 plasma is less effective at this temperature. The incorporation of carbon in the Al2O3 film at lower temperatures was shown to be less at positions closer to the O2 plasma source. The latter indicates a dependence on the O flux, at lower temperatures a higher O flux is required to remove all the carbon from the surface. During the continuous ALD process of both thermal and plasma-assisted ALD, the growth per cycle was generally higher than for intermittent ALD during the FT-IR experiments. This might be related to the thermal instability of the surface groups. The intermittent ALD cycles introduce more time in-between half cycles, providing –OH surface groups time (~4 min) to leave from the surface through a dehydroxilation reaction. H2O Reaction Product in concurrent thermal ALD-like reactions During the O2 plasma exposure H2O is produced as one of the reaction products in the combustion of the –CH3 surface groups. Such an H2O molecule can induce a concurrent thermal ALD-like reaction producing –OH surface groups and CH4 as a gas phase reaction product [26]. Traces of CH4 during the O2 plasma exposure were only detected in the beginning of the O2 plasma exposure and this thermal ALD-like reaction pathway is therefore considered only to be likely when the CH3 coverage is still high and it will have a minor effect on the final –OH surface group configuration. Influence of Residual water H2O produced during the O2 plasma exposure and which is normally pumped off, can also remain especially at lower temperatures. This residual H2O in the reactor can

46
induce a thermal ALD-like reaction during the purge time after the TMA exposure. In this effect –CH3 surface groups created during the TMA exposure can directly be consumed again like in the thermal ALD H2O exposure resulting in a –OH surface group. This effect is supposed to take place during plasma-assisted ALD at lower temperatures when H2O is difficult to pump out. With thermal ALD this effect is supposed to be noticeable already at 150 ºC. This reaction is different from reaction in the previous paragraph, since this phenomenon consumes newly created –CH3 groups during the TMA exposure while the previous paragraph addresses an alternative reaction during the O2 plasma exposure.

47
7 Conclusions & Future Directions
7.1 Conclusions The conclusions of this work can roughly be divided into the following parts: Implementation of in situ transmission infrared spectroscopy In situ transmission infrared spectroscopy was implemented on the ALD setup, by mounting infrared transparent KBr windows in the reactor wall. The experimental ALD setup was successfully reconfigured for the thermal and plasma-assisted ALD of Al2O3 films and the KBr windows were utilized as substrates. Because of the sequential repetitive nature of the ALD process, one particular exposure induces the same changes at the film surface every time. Based on this idea a measurement approach with referencing and averaging was developed and proved to be sensitive enough for the detection of submono-layers of chemical surface groups of the films. Furthermore the current configuration was also shown to be suited for the detection and quantification of gas phase reaction products during the adsorption of the TMA precursor. The reaction mechanism of plasma-assisted ALD of Al2O3
By the utilization of in situ infrared spectroscopy the chemical surface groups involved in the plasma-assisted ALD process of Al2O3 were unveiled. At a deposition temperature of 150 ºC, –OH and –CH3 surface groups were predominantly created after the O2 plasma and TMA exposure, respectively. Based on these results and previous work, the following mechanism is proposed as main reaction channel:
–OH + Al(CH3)3 (g) � –OAl(CH3)2 + CH4 (g) (1) –AlCH3 + 4 O (g) � –AlOH + CO2 (g) + H2O (g) (2)
The oxidation step is a combustion like reaction. Additional to these proposed reactions, the adsorption of TMA (half reaction (1)) was found to predominantly proceed bifunctionally at low substrate temperatures. The lower temperature mechanism At lower temperatures –OH surface group densities tend to increase; it is likely that this is related to the increase in growth per cycle observed at lower temperatures. The combustion like reaction that is responsible for the removal of –CH3 from the surface during the O2 plasma exposure, was shown to be a temperature dependent process. At lower temperatures this half reaction appears to proceed more difficult or slower. It was shown that extending the plasma exposure time can compensate this in order to fully complete the combustion half reaction. To further address and completely understand the effect of the deposition temperature on the growth per cycle and the Al2O3 film quality, additional research is required in order to isolate the role of O radicals in creating –OH surface groups at lower temperatures.

48
7.2 Recommendations Based on the conclusion of this work, the following improvements to the experimental setup and research topics are recommended: Improving the experimental setup In situ infrared spectroscopy probing was performed on two Al2O3 surfaces corresponding to the two KBr windows. To be able to detect surface groups with a sufficient signal to noise ratio, averaging was used, resulting in long measurement times. By the stacking of multiple substrates, easily reachable by the O2 plasma, inside the reactor (as illustrated in Fig. 7.1), more Al2O3 surface are can be created in the infrared beam path and therefore increasing the signal to noise ratio of a single scan. This could substantially decrease the time required for a measurement while maintaining a good signal to noise ratio.
Fig. 7.1 Illustration of the stacking of substrates in the infrared bem
Extend process temperature dependence The reaction process and the probing of surface groups in particular have been researched for deposition temperatures from 25 to 150 ºC for plasma-assisted ALD and 150 ºC for thermal ALD. Extending the measured temperature range to room temperature for thermal ALD could reveal why for this process the growth per cycle decreases at low temperatures. Studying both processes at higher temperatures could reveal if the reaction mechanisms change as a function of temperature. This would require temperature controlled substrates that can be heated above 150 ºC, since the whole reactor is currently heated by wall heating which cannot exceed 150 ºC. Besides the investigation of the surface groups, also the amount of CH4 reaction products during TMA exposure was determined and led to the mainly bifunctionally chemisorption of TMA at 150 ºC. Repeating this experiment at lower and higher temperatures would lead to understanding about the way TMA reacts at the Al2O3 surface step, and would provide insight in the interpretation of the infrared surface group experiments. For the thermal experiment this experiment could also performed for the H2O exposure, which could lead to more exact information on the mono- and bifunctionally chemisorption of TMA as well as growth per cycle information. Investigation of the influence of the TMA and O2 plasma exposure times At low temperatures (25 ºC) additional carbon related surface groups were observed after the O2 plasma exposure. By extending the plasma exposure time the amount of these groups decreased. Furthermore during previous research on the O2 plasma exposure showed that the reaction products changed over plasma exposure time. These two findings indicate that the surface chemistry during the O2 plasma exposure consists of more than one process step. By exposing the O2 plasma in multiple short strokes and probing the surface with infrared spectroscopy in-between, these different partial process steps can possible be
49
revealed, thereby creating more insight in the complete reaction mechanism of plasma-assisted ALD of Al2O3. Besides the carbon related surface groups and their incorporation in the film at lower temperatures, -OH surface groups were found not to be completely removed from the surface at low temperatures and consequently these groups are incorporated in the Al2O3 films. There was no sign that the incorporation of OH groups decreased with increasing O2 plasma exposure time. TMA is supposed to be involved in the consumption of –OH surface groups, therefore investigating the influence of multiple TMA exposures on the effective removal of the –OH surface groups is a logical step. By the probing of the surface with infrared measurements in-between these exposures this process of –OH removal could be monitored.

50

51
Acknowledgments Finishing your master degree and writing a master thesis is something one does not do every day and it sometimes can be a tough job. Fortunately I had great people to support me during my project. First of all I greatly thank my direct supervisor Erik Langereis, he has been an inexhaustible source of enthusiasm, energy and ideas. His greatest contribution is possibly the thorough reading and correcting of this report for which I owe him lots. I want to thank my other supervisor Erwin Kessels for his fruitful discussions, comments and patience. Richard van de Sanden for his comments on the report, it provided a welcome additional view on the work. During my practical work in the lab, one sometimes needs a solution quickly. That is why Ries van de Sande and Janneke Zeebregts have to be thanked for their ever lasting technical support. I want to thank the rest of the PMP group for the cozy coffee breaks and the members of the student room for their nice (physics and no physics) discussions, you guys were always there if I needed to drain some frustration or excitement. Besides all support from the group, I would also like to thank my parents for their ever lasting financial and emotional support during my whole educational career. Although I have not come home often this last year, I always knew there was a warm place to go to when it was needed.

52
53
Bibliography
[1] G.D. Wilk, R.M. Wallace, and J.M. Anthony, Journal of Applied Physics, 89, 5243-5275
(2001).
[2] W.K. Kim, W.H. Nam, S.H. Kim, and S.W. Rhee, Journal of Chemical Engineering of Japan, 38, 578-587 (2005).
[3] B. Hoex, S.B.S. Heil, E. Langereis, M.C.M. van de Sanden, and W.M.M. Kessels, Applied Physics Letters, 89 (2006).
[4] B. Hoex, J. Schmidt, R. Bock, P.P. Altermatt, M.C.M. van de Sanden, and W.M.M. Kessels, Applied Physics Letters, 91 (2007).
[5] E. Langereis, M. Creatore, S.B.S. Heil, M.C.M. van de Sanden, and W.M.M. Kessels, Applied Physics Letters, 89 (2006).
[6] S. Blittersdorf, N. Bahlawane, K. Kohse-Hoinghaus, B. Atakan, and J. Muller, Chemical Vapor Deposition, 9, 194-198 (2003).
[7] C.E. Chryssou and C.W. Pitt, Applied Physics A, 65, 469-475 (1997).
[8] A.C. Dillon, A.W. Ott, J.D. Way, and S.M. George, Surface Science, 322, 230-242 (1995).
[9] J.D. Ferguson, A.W. Weimer, and S.M. George, Chemistry of Materials, 12, 3472-3480 (2000).
[10] A.W. Ott, J.W. Klaus, J.M. Johnson, and S.M. George, Thin Solid Films, 292, 135-144 (1997).
[11] A.W. Ott, J.W. Klaus, J.M. Johnson, S.M. George, K.C. McCarley, and J.D. Way, Chemistry of Materials, 9, 707-714 (1997).
[12] R.L. Puurunen, M. Lindblad, A. Root, and A.O.I. Krause, Physical Chemistry Chemical Physics, 3, 1093-1102 (2001).
[13] D.N. Goldstein and S.M. George, American Vacuum Society Conference 2006 (2006).
[14] S.D. Elliott, G. Scarel, C. Wiemer, M. Fanciulli, and G. Pavia, Chemistry of Materials, 18, 3764-3773 (2006).
[15] D.B. Mawhinney, J.A. Rossin, K. Gerhart, and J.T. Yates, Langmuir, 16, 2237-2241 (2000).
[16] J.B. Peri, Journal of Physical Chemistry, 69, 220 (1965).
[17] T.H. Ballinger and J.T. Yates, Langmuir, 7, 3041-3045 (1991).
[18] M.M. Bhasin, C. Curran, and G.S. John, Journal of Physical Chemistry, 74, 3973-3980 (1970).
[19] M. Breysse, G. Coudurier, B. Claudel, and L. Faure, Journal of Luminescence, 26, 239-250 (1982).
54
[20] H. Knozinger and P. Ratnasamy, Catalytic Review Science and Engineering, 17, 31-7 (1978).
[21] X.S. Liu and R.E. Truitt, Journal of the American Chemical Society, 119, 9856-9860 (1997).
[22] A.A. Tsyganenko and P.P. Mardilovich, Journal of the Chemical Society-Faraday Transactions, 92, 4843-4852 (1996).
[23] C. Morterra and G. Magnacca, Catalysis Today, 27, 497-532 (1996).
[24] R.A. Schroeder and L.L. Lyons, Journal of Inorganic and Nuclear Chemistry, 28, 1155-1163 (1966).
[25] S. Soled, Journal of Catalysis, 81, 252-257 (1983).
[26] S.B.S. Heil, P. Kudlacek, E. Langereis, R. Engeln, M.C.M. van de Sanden, and W.M.M. Kessels, Applied Physics Letters, 89, 131505 (2006).
[27] J.L. van Hemmen, S.B.S. Heil, J.H. Klootwijk, F. Roozeboom, C.F. Hodson, M.C.M. van de Sanden, and W.M.M. Kessels, Journal of the Electrochemical Society, 154, 165-169 (2007).
[28] M.D. Groner, F.H. Fabreguette, J.W. Elam, and S.M. George, Chemistry of Materials, 16, 639-645 (2004).
[29] R. Matero, A. Rahtu, M. Ritala, M. Leskela, and T. Sajavaara, Thin Solid Films, 368, 1-7 (2000).
[30] S.C. Ha, E. Choi, S.H. Kim, and J. Sung Roh, Thin Solid Films, 476, 252-257 (2005).
[31] P. Tarte, Spectrochimica Acta Part A-Molecular Spectroscopy, A 23, 2127 (1967).
[32] M.M. Frank, G.D. Wilk, D. Starodub, T. Gustafsson, E. Garfunkel, Y.J. Chabal, J. Grazul, and D.A. Muller, Applied Physics Letters, 86 (2005).
[33] H. Liu, D.C. Bertolet, and J.W. Rogers, Surface Science, 340, 88-100 (1995).
[34] G.A. Atiya, A.S. Grady, D.K. Russell, and T.A. Claxton, Spectrochimica Acta Part A-Molecular and Biomolecular Spectroscopy, 47, 467-476 (1991).
[35] S. Kvisle and E. Rytter, Spectrochimica Acta Part A: Molecular Spectroscopy, 40, 939-951 (1984).
[36] T. Shinzawa, F. Uesugi, I. Nishiyama, K. Sugai, S. Ishida, and H. Kabayashi, 1, 14, 14-24.
[37] Y. Catherine and A. Talebian, Journal of Electronic Materials, 17, 127-135 (1988).
[38] G. Krishna Prya, K.G.K. Warrier, A.D. Damodaran, and G. Aruldhas, Journal of Materials Science Letters, 16, 1584-1587 (1997).
[39] A. Rahtu, T. Alaranta, and M. Ritala, Langmuir, 17, 6506-6509 (2001).
[40] S.D. Elliott and J.C. Greeg, 14, 3246-3250 (2004).

55
[41] E. Baumgarten, R. Wagner, and C. Lenteswagner, Fresenius Zeitschrift fur Analytische Chemie, 334, 246-251 (1989).
[42] S. Ram, Infrared Physics & Technology, 42, 547-560 (2001).
[43] G. Busca and V. Lorenzelli, Materials Chemistry, 7, 89-126 (1982).
[44] G. Socrates, Infrared and Raman Characteristic Group Frequencies, (John Wiley & Sons, LTD, England, 2001)
[45] J. Baltrusaitis, J.H. Jensen, and V.H. Grassian, Journal of Physical Chemistry B, 110, 12005-12016 (2006).
[46] Y.C. Kim, H.H. Park, J.S. Chun, and W.J. Lee, Thin Solid Films, 237, 57-65 (1994).
[47] A. Iordan, M.I. Zaki, and C. Kappenstein, Physical Chemistry Chemical Physics, 6, 2502-2512 (2004).
[48] L. Vlaev, D. Damyanov, and M.M. Mohamed, Colloids and Surfaces, 36, 427-437 (1989).
[49] A.V. Uvarov, Zhurnal Fizicheskoi Khimii, 36, 1346-1349 (1962).

56
Appendix A
Table A.1 Overview of chemical composition, obtained by RBS (Rutherford Back Scattering) measurements, of Al2O3 layers deposited at different ALD deposition temperatures [27]
Plasma-assisted ALD
Tdep[°C] Plasma time [s] O/Al at% H at% C Density
[g/cm3] GPC [Å] Al
atoms/nm2 /cycle
O atoms/nm2
/cycle
300 2 1.52 <1 <1 3.0 1.00 3.52 1.41 200 2 1.53 2.5 <1 3.1 1.18 4.25 1.38 100 2 1.65 6.9 <1 2.8 1.37 4.32 1.35 25 2 2.13 >15 5 2.6 1.75 4.02 1.33 25 4 1.88 14.8 <1 2.7 1.70 4.87 1.27
Thermal ALD 300 14 1.50 1.2 <1 2.9 0.94 3.15 1.40 200 14 1.53 2.7 <1 2.9 0.80 3.35 1.38 100 26 1.6 7.9 <1 2.7 0.98 2.48 1.32
Table A.1 shows an overview of data regarding film quality and growth per cycle of Al2O3 films deposited with thermal and plasma assisted ALD at different temperatures. For both ALD process the impurity levels of H and C atoms increase for lower film temperatures. Also the stoichiometry changes from close to ideal (1.5) at 300 ºC to more oxygen rich layers at lower temperatures. With plasma-assisted ALD at lower temperatures (25 ºC), the level of carbon impurities can be reduced significantly and the stoichiometry can be improved by extending the plasma exposure time. All depositions were preformed on a different reactor than the experiments of this work which may caused slight differences in the film quality.

57
Appendix B
4000 3500 3000 2500 2000 1500 1000
2
3
150 oC Thermal ALD
25 oC 4s plasma
25 oC 2s plasma
100 oC 2s plasma
Abs
orba
nce
Wavenumber (cm-1)
TMA Intermission O
2 plasma and H
2O Intermission
2.5*10-5
150 oC 2s plasma
1
Fig. B.1 Intermission infrared absorbance spectra for plasma-assisted and thermal ALD of Al2O3 at different temperatures. In Fig. B.1 the intermission spectra, as explained in §2.5, for all experiments reported in this work are shown. In these spectra changes at the surface can be observed during the infrared measurement time in-between a half cycle. In general all spectra look relatively flat, with the exception of signal noise and baseline shift in the region below 1000 cm-1. This implies that the chemical groups at the surface of the substrate are relatively stable over time. Looking more closely however, faint negative features exist in the 150 ºC thermal and 25 ºC plasma spectrum around 1207 cm-1 and indicated with ‘1’ and ‘2’, respectively in the figure. 1207 cm-1 is the position of the CH3 wagging mode, indicating that these groups do disappear from the surface in small amounts during the measurement time after the TMA exposure. If the disappearance of CH3 from the surface is caused by residual H2O in the reactor, also the appearance of –OH surface groups is expected in the TMA intermission spectrum. This is observed for the 25 ºC plasma-assisted process with 4 s plasma as indicated with ‘3’. In the 150 ºC thermal TMA intermission spectrum this is not observed, however it should be noted that one is looking here at features of amplitudes in the same order of the signal noise and are therefore hard to see.