el 713: digital signal processing extra problem...
TRANSCRIPT

1.11 Consider the following 9-point signals, 0 ≤ n ≤ 8.
(a) [3, 2, 1, 0, 0, 0, 0, 2, 1]
(b) [3, 2, 1, 0, 0, 0, 0, −2, −1]
(c) [3, 2, 1, 0, 0, 0, 0, −2, −1]
(d) [0, 2, 1, 0, 0, 0, 0, −2, −1]
(e) [0, 2, 1, 0, 0, 0, 0, 2, 1]
(f) [3, 2, 1, 0, 0, 0, 0, 1, 2]
(g) [3, 2, 1, 0, 0, 0, 0, −1, −2]
(h) [0, 2, 1, 0, 0, 0, 0, −1, −2]
(i) [0, 2, 1, 0, 0, 0, 0, 1, 2]
Which of these signals have a real-valued 9-point DFT? Which of these signals have an imaginary-valued 9-point DFT? Do not use MATLAB or any computer to solve this problem and do not explicitlycompute the DFT; instead use the properties of the DFT.
Solution:
Signals (f) and (i) both have purely real-valued DFT. Signal (h) has a purly imaginary-valued DFT.
• • •
14
EL 713: Digital Signal Processing Extra Problem Solutions
Prof. Ivan Selesnick, Polytechnic University

1.12 Matching. Match each discrete-time signal with its DFT by filling out the following table. You shouldbe able to do this problem with out using a computer.
Signal DFT12345678
15
EL 713: Digital Signal Processing Extra Problem Solutions
Prof. Ivan Selesnick, Polytechnic University

0 10 20 30−1.5
−1
−0.5
0
0.5
1
1.5SIGNAL 1
0 10 20 30−1.5
−1
−0.5
0
0.5
1
1.5SIGNAL 2
0 10 20 30−1.5
−1
−0.5
0
0.5
1
1.5SIGNAL 3
0 10 20 30−1.5
−1
−0.5
0
0.5
1
1.5SIGNAL 4
0 10 20 30−1.5
−1
−0.5
0
0.5
1
1.5SIGNAL 5
0 10 20 30−1.5
−1
−0.5
0
0.5
1
1.5SIGNAL 6
0 10 20 30−1.5
−1
−0.5
0
0.5
1
1.5SIGNAL 7
0 10 20 30−1.5
−1
−0.5
0
0.5
1
1.5SIGNAL 8
16
EL 713: Digital Signal Processing Extra Problem Solutions
Prof. Ivan Selesnick, Polytechnic University

0 10 20 300
10
20
30
DFT 1
0 10 20 300
10
20
30
DFT 2
0 10 20 300
10
20
30
DFT 3
0 10 20 300
10
20
30
DFT 4
0 10 20 300
10
20
30
DFT 5
0 10 20 300
10
20
30
DFT 6
0 10 20 300
10
20
30
DFT 7
0 10 20 300
10
20
30
DFT 8
Solution:
Signal 1 has exactly two cycles of a cosine, so you would expect X(2) and X(−2) to be nonzero, andother DFT coefficients to be 0; that gives DFT 4. Note that X(−2) is really X(N − 2).
Signal 2 has two and a half cycles of a cosine, so you would expect the DFT to have a peak at indexk = 2.5, but that is not an integer — there is no DFT coefficient at that index. So the largest DFTcoefficients would be at k = 2 and k = 3 and there would be ‘leakage’. There would also be a peak
17
EL 713: Digital Signal Processing Extra Problem Solutions
Prof. Ivan Selesnick, Polytechnic University

around k = N − 2.5. This gives DFT 6.
Similar reasons are used for signals 3 and 4.
The DFT of a constant is an impulse, so signal 6 corresponds to DFT 7. The DFT of an impulse is aconstant, so signal 7 corresponds to DFT 3.
The DTFT of a rectangular pulse is a digital sinc function, so the DFT of a rectangular pulse is samplesof the sinc function. So signal 8 corresponds to DFT 5.
That leaves signal 5 and DFT 8. Signal 5 can be written as a cosine times a rectangular pulse, so theDFT of signal 5 will be the convolution of a DFT of a cosine with the DFT of rectangular pulse — thatis a sum of two shifted digital sinc functions.
Signal DFT1 42 63 14 25 86 77 38 5
• • •
18
EL 713: Digital Signal Processing Extra Problem Solutions
Prof. Ivan Selesnick, Polytechnic University
1.25 The analog signal x(t) is band-limited to 40 Hz. Suppose the signal is sampled at the rate of 100samples per second and that at this rate 200 samples are collected. Then 200 zeros are appended tothe 200 samples to form a 400-point vector. Then the 400-point DFT of this vector is computed to getX(k) for 0 ≤ k ≤ 399.
(a) Which DFT coefficients are free of aliasing?
(b) The DFT coefficient X(50) represents the spectrum of the analog signal at what frequency f?(Give your answer in Hz).
Solution:
(a) All of the DFT coefficients are free of aliasing. The sampling rate is more that twice the maximumsignal frequency.
(b) The DFT bin width is 100/400 or 0.25 Hz. The 50th DFT coefficient corresponds to the frequency50 times 0.25 Hz or 12.5 Hz .
• • •
34
EL 713: Digital Signal Processing Extra Problem Solutions
Prof. Ivan Selesnick, Polytechnic University

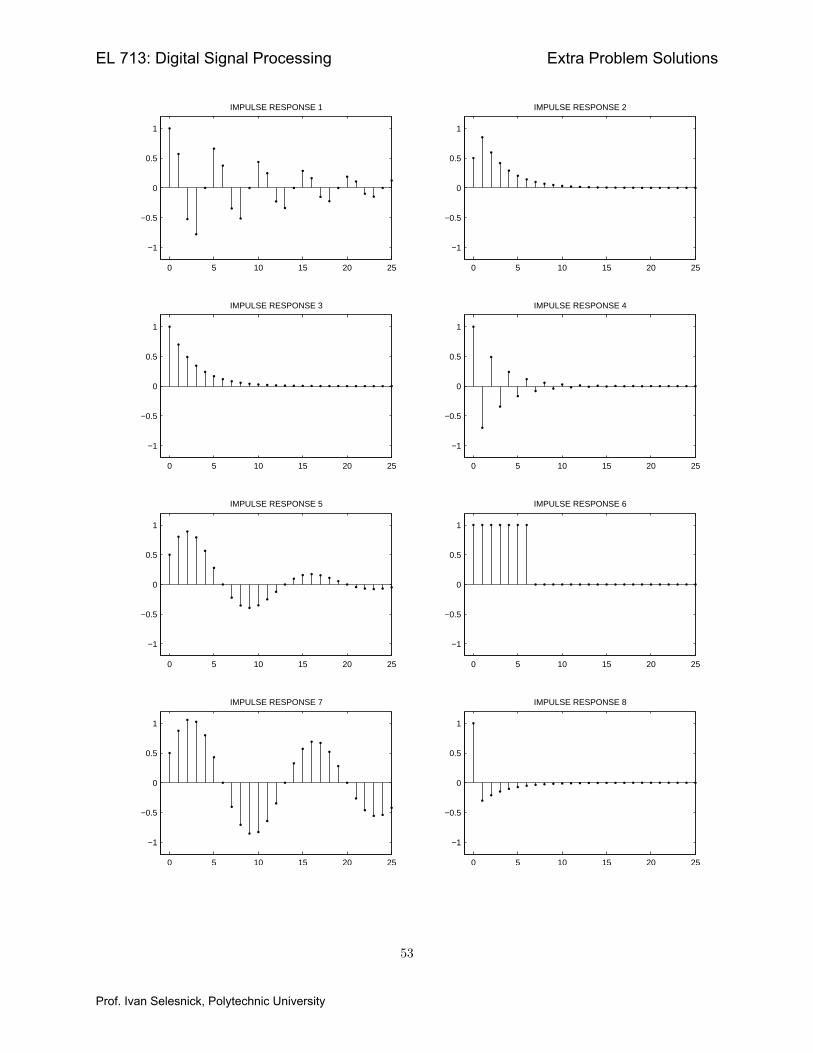
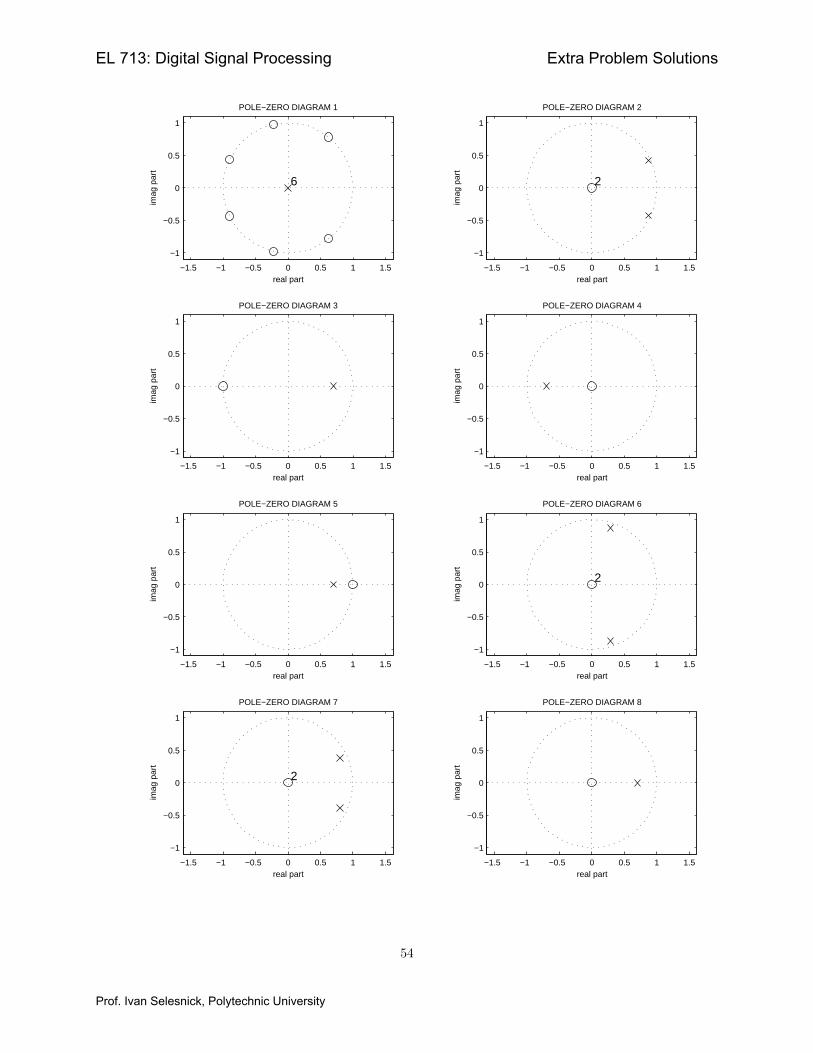
3.3 Matching. The diagrams on the following three pages show the impulse responses, pole-zero diagrams,and frequency responses magnitudes of 8 discrete-time causal LTI systems. But the diagrams are outof order. Match each diagram by filling out the following table.
Impulse response Pole-zero Frequency response12345678
52
EL 713: Digital Signal Processing Extra Problem Solutions
Prof. Ivan Selesnick, Polytechnic University
0 5 10 15 20 25
−1
−0.5
0
0.5
1
IMPULSE RESPONSE 3
0 5 10 15 20 25
−1
−0.5
0
0.5
1
IMPULSE RESPONSE 4
0 5 10 15 20 25
−1
−0.5
0
0.5
1
IMPULSE RESPONSE 7
0 5 10 15 20 25
−1
−0.5
0
0.5
1
IMPULSE RESPONSE 1
0 5 10 15 20 25
−1
−0.5
0
0.5
1
IMPULSE RESPONSE 8
0 5 10 15 20 25
−1
−0.5
0
0.5
1
IMPULSE RESPONSE 2
0 5 10 15 20 25
−1
−0.5
0
0.5
1
IMPULSE RESPONSE 6
0 5 10 15 20 25
−1
−0.5
0
0.5
1
IMPULSE RESPONSE 5
53
EL 713: Digital Signal Processing Extra Problem Solutions
Prof. Ivan Selesnick, Polytechnic University
−1.5 −1 −0.5 0 0.5 1 1.5
−1
−0.5
0
0.5
1
real part
imag
par
t
POLE−ZERO DIAGRAM 8
−1.5 −1 −0.5 0 0.5 1 1.5
−1
−0.5
0
0.5
1
real part
imag
par
t
POLE−ZERO DIAGRAM 4
−1.5 −1 −0.5 0 0.5 1 1.5
−1
−0.5
0
0.5
1
2
real part
imag
par
t
POLE−ZERO DIAGRAM 2
−1.5 −1 −0.5 0 0.5 1 1.5
−1
−0.5
0
0.5
1
2
real part
imag
par
t
POLE−ZERO DIAGRAM 6
−1.5 −1 −0.5 0 0.5 1 1.5
−1
−0.5
0
0.5
1
real part
imag
par
t
POLE−ZERO DIAGRAM 5
−1.5 −1 −0.5 0 0.5 1 1.5
−1
−0.5
0
0.5
1
real part
imag
par
t
POLE−ZERO DIAGRAM 3
−1.5 −1 −0.5 0 0.5 1 1.5
−1
−0.5
0
0.5
1
6
real part
imag
par
t
POLE−ZERO DIAGRAM 1
−1.5 −1 −0.5 0 0.5 1 1.5
−1
−0.5
0
0.5
1
2
real part
imag
par
t
POLE−ZERO DIAGRAM 7
54
EL 713: Digital Signal Processing Extra Problem Solutions
Prof. Ivan Selesnick, Polytechnic University

−1 −0.5 0 0.5 10.5
1
1.5
2
2.5
3
3.5
ω/π
FREQUENCY RESPONSE 7
−1 −0.5 0 0.5 10.5
1
1.5
2
2.5
3
3.5
ω/π
FREQUENCY RESPONSE 5
−1 −0.5 0 0.5 10
5
10
15
20
ω/π
FREQUENCY RESPONSE 6
−1 −0.5 0 0.5 10
1
2
3
4
5
6
7
ω/π
FREQUENCY RESPONSE 8
−1 −0.5 0 0.5 10
0.2
0.4
0.6
0.8
1
1.2
1.4
ω/π
FREQUENCY RESPONSE 1
−1 −0.5 0 0.5 10
0.5
1
1.5
2
2.5
3
3.5
ω/π
FREQUENCY RESPONSE 4
−1 −0.5 0 0.5 10
1
2
3
4
5
6
7
ω/π
FREQUENCY RESPONSE 2
−1 −0.5 0 0.5 10
1
2
3
4
5
6
ω/π
FREQUENCY RESPONSE 3
Solution:
55
EL 713: Digital Signal Processing Extra Problem Solutions
Prof. Ivan Selesnick, Polytechnic University

Impulse response Pole-zero Frequency response1 6 82 3 43 8 74 4 55 7 36 1 27 2 68 5 1
• • •
56
EL 713: Digital Signal Processing Extra Problem Solutions
Prof. Ivan Selesnick, Polytechnic University
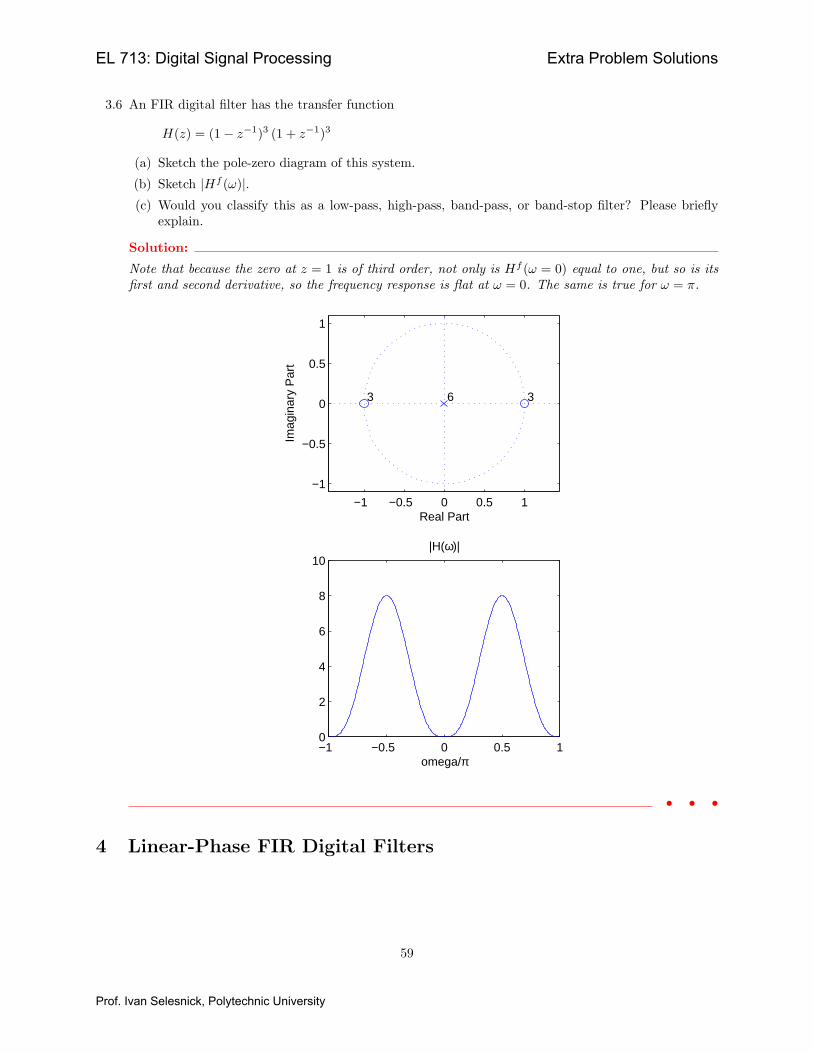
3.6 An FIR digital filter has the transfer function
H(z) = (1− z−1)3 (1 + z−1)3
(a) Sketch the pole-zero diagram of this system.
(b) Sketch |Hf (ω)|.(c) Would you classify this as a low-pass, high-pass, band-pass, or band-stop filter? Please briefly
explain.
Solution:
Note that because the zero at z = 1 is of third order, not only is Hf (ω = 0) equal to one, but so is itsfirst and second derivative, so the frequency response is flat at ω = 0. The same is true for ω = π.
−1 −0.5 0 0.5 1
−1
−0.5
0
0.5
1
33 6
Real Part
Imag
inar
y P
art
−1 −0.5 0 0.5 10
2
4
6
8
10
omega/π
|H(ω)|
• • •
4 Linear-Phase FIR Digital Filters
59
EL 713: Digital Signal Processing Extra Problem Solutions
Prof. Ivan Selesnick, Polytechnic University
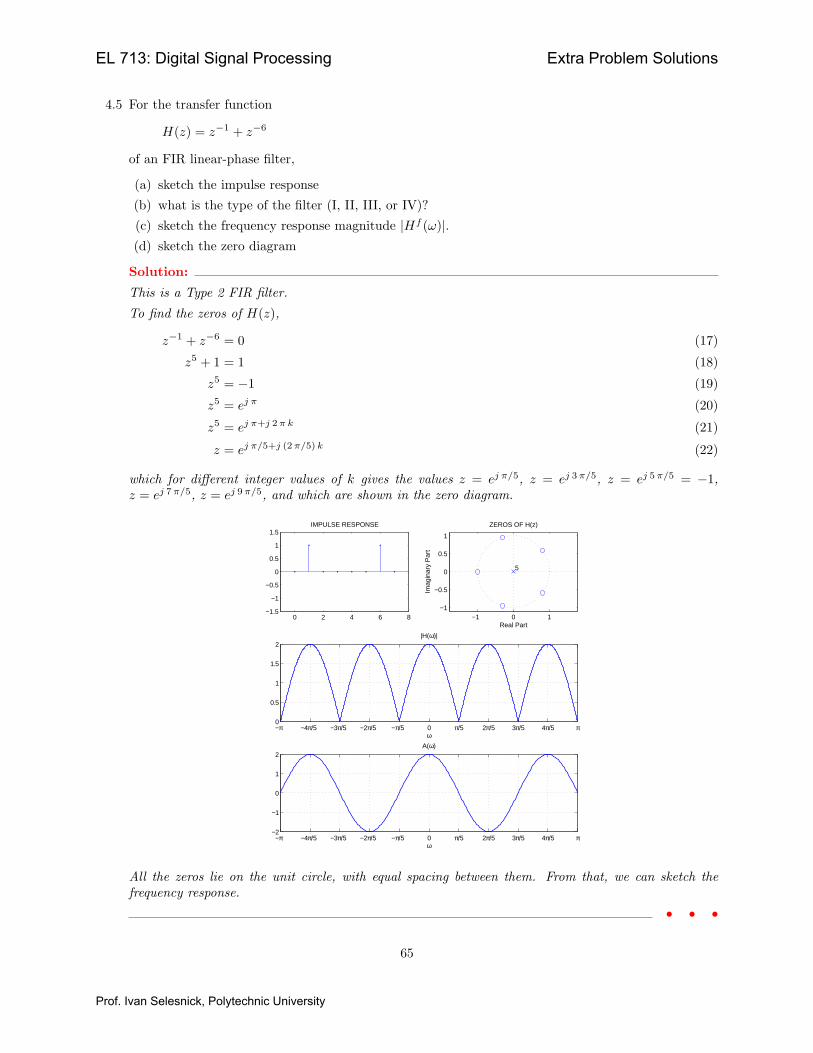
4.5 For the transfer function
H(z) = z−1 + z−6
of an FIR linear-phase filter,
(a) sketch the impulse response
(b) what is the type of the filter (I, II, III, or IV)?
(c) sketch the frequency response magnitude |Hf (ω)|.(d) sketch the zero diagram
Solution:
This is a Type 2 FIR filter.
To find the zeros of H(z),
z−1 + z−6 = 0 (17)
z5 + 1 = 1 (18)
z5 = −1 (19)
z5 = ej π (20)
z5 = ej π+j 2 π k (21)
z = ej π/5+j (2 π/5) k (22)
which for different integer values of k gives the values z = ej π/5, z = ej 3 π/5, z = ej 5 π/5 = −1,z = ej 7 π/5, z = ej 9 π/5, and which are shown in the zero diagram.
0 2 4 6 8−1.5
−1
−0.5
0
0.5
1
1.5IMPULSE RESPONSE
−1 0 1−1
−0.5
0
0.5
1
5
Real Part
Imag
inar
y P
art
ZEROS OF H(z)
−π −4π/5 −3π/5 −2π/5 −π/5 0 π/5 2π/5 3π/5 4π/5 π0
0.5
1
1.5
2|H(ω)|
ω
−π −4π/5 −3π/5 −2π/5 −π/5 0 π/5 2π/5 3π/5 4π/5 π−2
−1
0
1
2A(ω)
ω
All the zeros lie on the unit circle, with equal spacing between them. From that, we can sketch thefrequency response.
• • •
65
EL 713: Digital Signal Processing Extra Problem Solutions
Prof. Ivan Selesnick, Polytechnic University
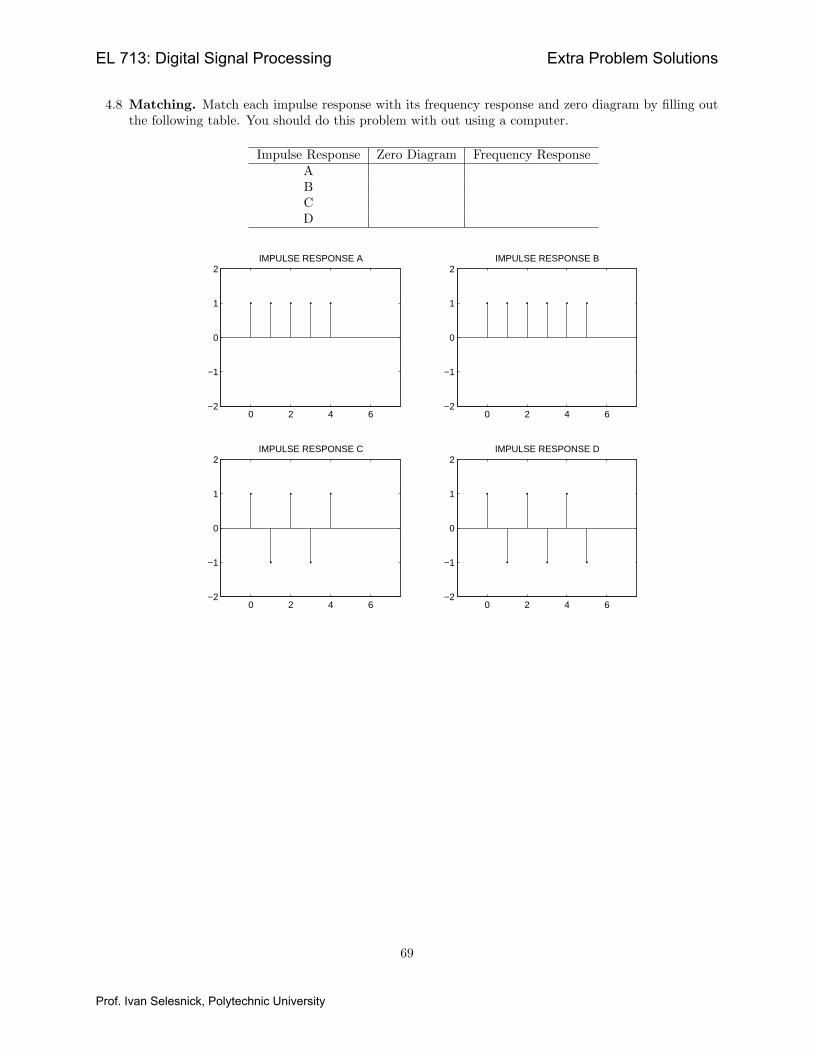
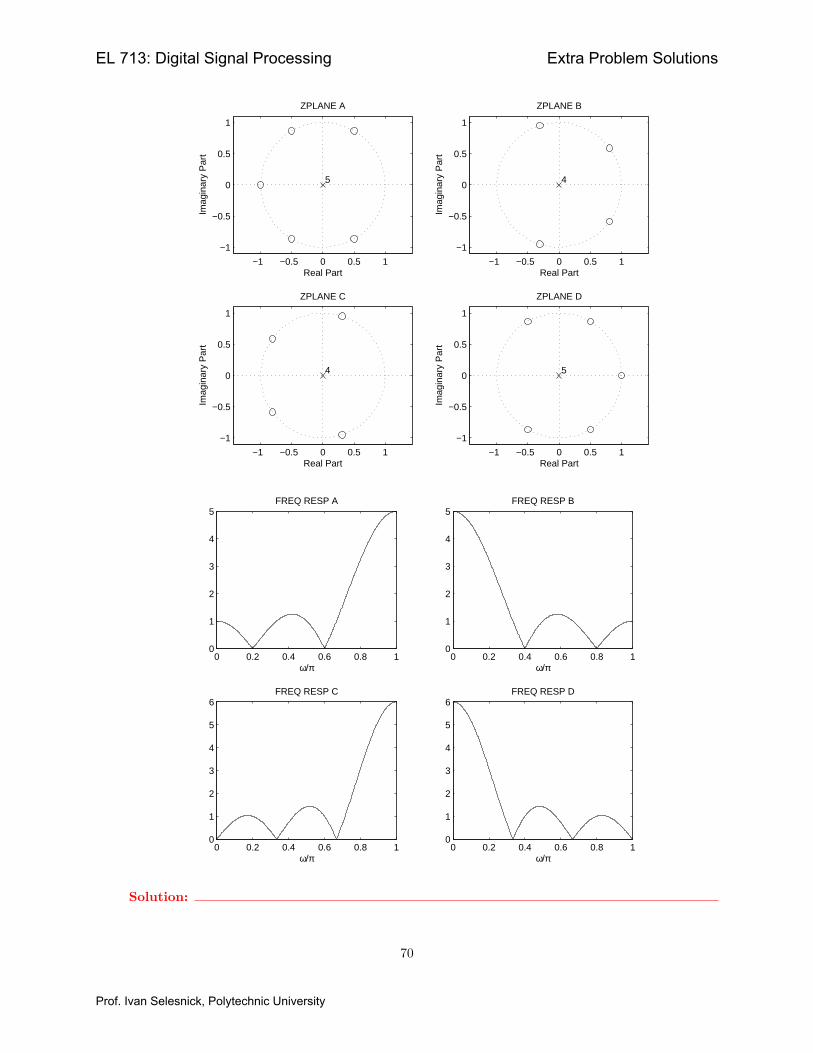
4.8 Matching. Match each impulse response with its frequency response and zero diagram by filling outthe following table. You should do this problem with out using a computer.
Impulse Response Zero Diagram Frequency ResponseABCD
0 2 4 6−2
−1
0
1
2IMPULSE RESPONSE A
0 2 4 6−2
−1
0
1
2IMPULSE RESPONSE B
0 2 4 6−2
−1
0
1
2IMPULSE RESPONSE C
0 2 4 6−2
−1
0
1
2IMPULSE RESPONSE D
69
EL 713: Digital Signal Processing Extra Problem Solutions
Prof. Ivan Selesnick, Polytechnic University
−1 −0.5 0 0.5 1
−1
−0.5
0
0.5
1
5
Real Part
Imag
inar
y P
art
ZPLANE A
−1 −0.5 0 0.5 1
−1
−0.5
0
0.5
1
4
Real Part
Imag
inar
y P
art
ZPLANE B
−1 −0.5 0 0.5 1
−1
−0.5
0
0.5
1
4
Real Part
Imag
inar
y P
art
ZPLANE C
−1 −0.5 0 0.5 1
−1
−0.5
0
0.5
1
5
Real Part
Imag
inar
y P
art
ZPLANE D
0 0.2 0.4 0.6 0.8 10
1
2
3
4
5
ω/π
FREQ RESP A
0 0.2 0.4 0.6 0.8 10
1
2
3
4
5
ω/π
FREQ RESP B
0 0.2 0.4 0.6 0.8 10
1
2
3
4
5
6
ω/π
FREQ RESP C
0 0.2 0.4 0.6 0.8 10
1
2
3
4
5
6
ω/π
FREQ RESP D
Solution:
70
EL 713: Digital Signal Processing Extra Problem Solutions
Prof. Ivan Selesnick, Polytechnic University

Impulse Response Zero Diagram Frequency ResponseA C BB A DC B AD D C
• • •
71
EL 713: Digital Signal Processing Extra Problem Solutions
Prof. Ivan Selesnick, Polytechnic University
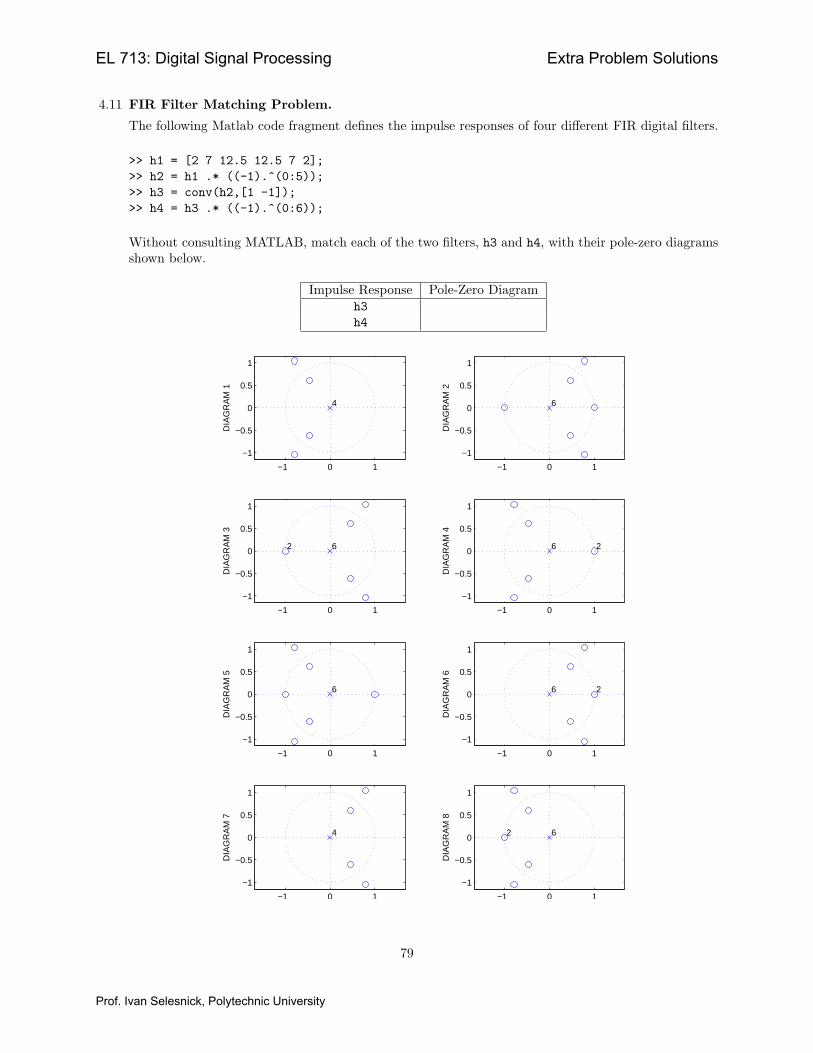
4.11 FIR Filter Matching Problem.
The following Matlab code fragment defines the impulse responses of four different FIR digital filters.
>> h1 = [2 7 12.5 12.5 7 2];>> h2 = h1 .* ((-1).^(0:5));>> h3 = conv(h2,[1 -1]);>> h4 = h3 .* ((-1).^(0:6));
Without consulting MATLAB, match each of the two filters, h3 and h4, with their pole-zero diagramsshown below.
Impulse Response Pole-Zero Diagramh3h4
−1 0 1
−1
−0.5
0
0.5
1
4
DIA
GR
AM
1
−1 0 1
−1
−0.5
0
0.5
1
6
DIA
GR
AM
2
−1 0 1
−1
−0.5
0
0.5
1
2 6
DIA
GR
AM
3
−1 0 1
−1
−0.5
0
0.5
1
26
DIA
GR
AM
4
−1 0 1
−1
−0.5
0
0.5
1
6
DIA
GR
AM
5
−1 0 1
−1
−0.5
0
0.5
1
26
DIA
GR
AM
6
−1 0 1
−1
−0.5
0
0.5
1
4
DIA
GR
AM
7
−1 0 1
−1
−0.5
0
0.5
1
2 6
DIA
GR
AM
8
79
EL 713: Digital Signal Processing Extra Problem Solutions
Prof. Ivan Selesnick, Polytechnic University

Solution:
Note that h1 is a lowpass filter of Type 2. Also, from the code, we see that h2(n) = (−1)n h1(n), so h2is a highpass filter of Type 4. From the code we have that H3(z) = H2(z) (1 − z−1) which puts a nullin the frequency response at ω = 0. Since h2 already has a zero at z = 1, h3 will have a double zero atz = 1 and will be a Type 1 filter. So h3 will correspond to pole-zero diagram 4 or 6. (This is not sucha good exercise!) From the code we have h4(n) = (−1)n h3(n) or H4(z) = H3(−z) which will negateall the zeros of H3(z) so h4 will correspond to pole-zero diagram 3 or 8.
• • •
80
EL 713: Digital Signal Processing Extra Problem Solutions
Prof. Ivan Selesnick, Polytechnic University
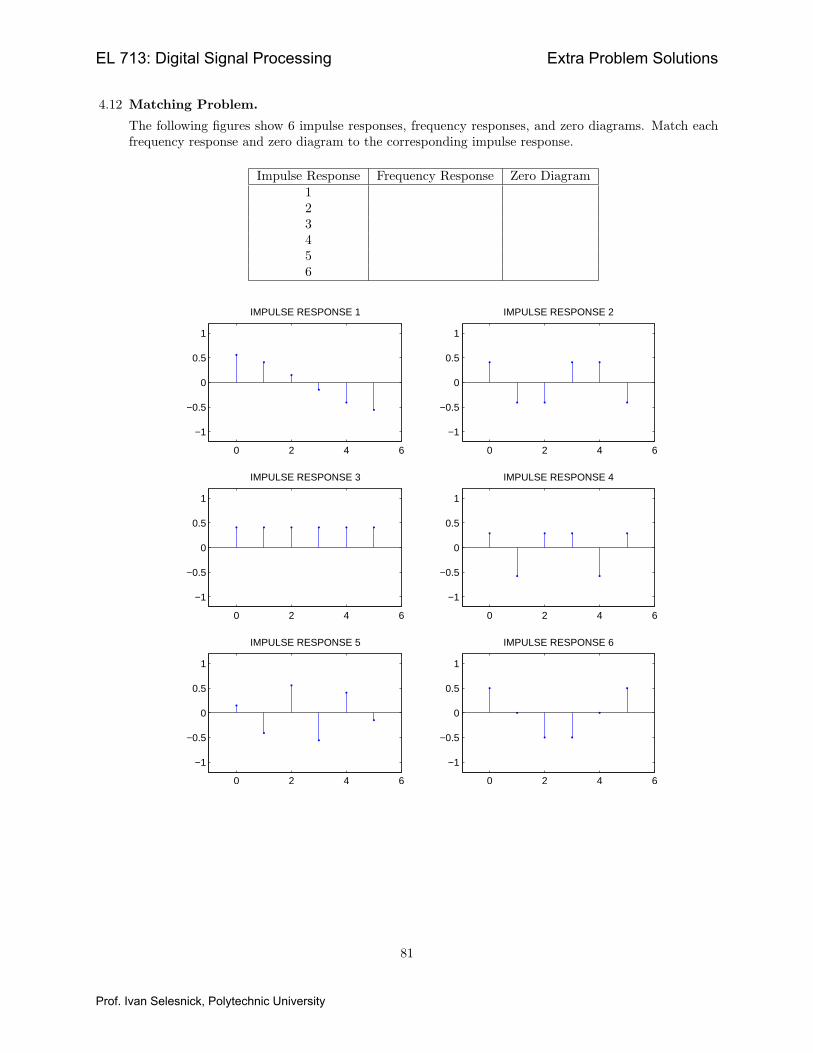
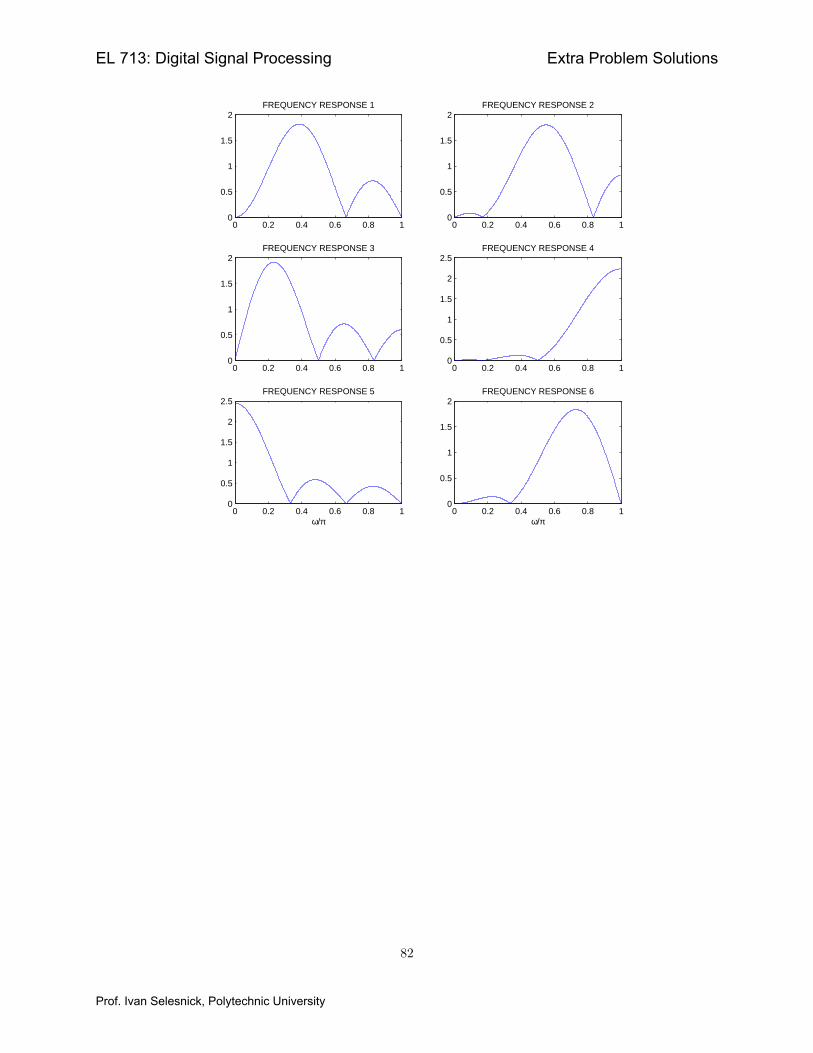
4.12 Matching Problem.
The following figures show 6 impulse responses, frequency responses, and zero diagrams. Match eachfrequency response and zero diagram to the corresponding impulse response.
Impulse Response Frequency Response Zero Diagram123456
0 2 4 6
−1
−0.5
0
0.5
1
IMPULSE RESPONSE 1
0 2 4 6
−1
−0.5
0
0.5
1
IMPULSE RESPONSE 2
0 2 4 6
−1
−0.5
0
0.5
1
IMPULSE RESPONSE 3
0 2 4 6
−1
−0.5
0
0.5
1
IMPULSE RESPONSE 4
0 2 4 6
−1
−0.5
0
0.5
1
IMPULSE RESPONSE 5
0 2 4 6
−1
−0.5
0
0.5
1
IMPULSE RESPONSE 6
81
EL 713: Digital Signal Processing Extra Problem Solutions
Prof. Ivan Selesnick, Polytechnic University
0 0.2 0.4 0.6 0.8 10
0.5
1
1.5
2FREQUENCY RESPONSE 1
0 0.2 0.4 0.6 0.8 10
0.5
1
1.5
2FREQUENCY RESPONSE 2
0 0.2 0.4 0.6 0.8 10
0.5
1
1.5
2FREQUENCY RESPONSE 3
0 0.2 0.4 0.6 0.8 10
0.5
1
1.5
2
2.5FREQUENCY RESPONSE 4
0 0.2 0.4 0.6 0.8 10
0.5
1
1.5
2
2.5FREQUENCY RESPONSE 5
ω/π0 0.2 0.4 0.6 0.8 1
0
0.5
1
1.5
2FREQUENCY RESPONSE 6
ω/π
82
EL 713: Digital Signal Processing Extra Problem Solutions
Prof. Ivan Selesnick, Polytechnic University
−1 0 1−1
−0.5
0
0.5
1
5
Real PartIm
agin
ary
Par
t
ZERO DIAGRAM 1
−1 0 1−1
−0.5
0
0.5
1
5
Real Part
Imag
inar
y P
art
ZERO DIAGRAM 2
−1 0 1−1
−0.5
0
0.5
1
25
Real Part
Imag
inar
y P
art
ZERO DIAGRAM 3
−1 0 1−1
−0.5
0
0.5
1
5
Real Part
Imag
inar
y P
art
ZERO DIAGRAM 4
−1 0 1−1
−0.5
0
0.5
1
25
Real Part
Imag
inar
y P
art
ZERO DIAGRAM 5
−1 0 1−1
−0.5
0
0.5
1
5
Real Part
Imag
inar
y P
art
ZERO DIAGRAM 6
Solution:
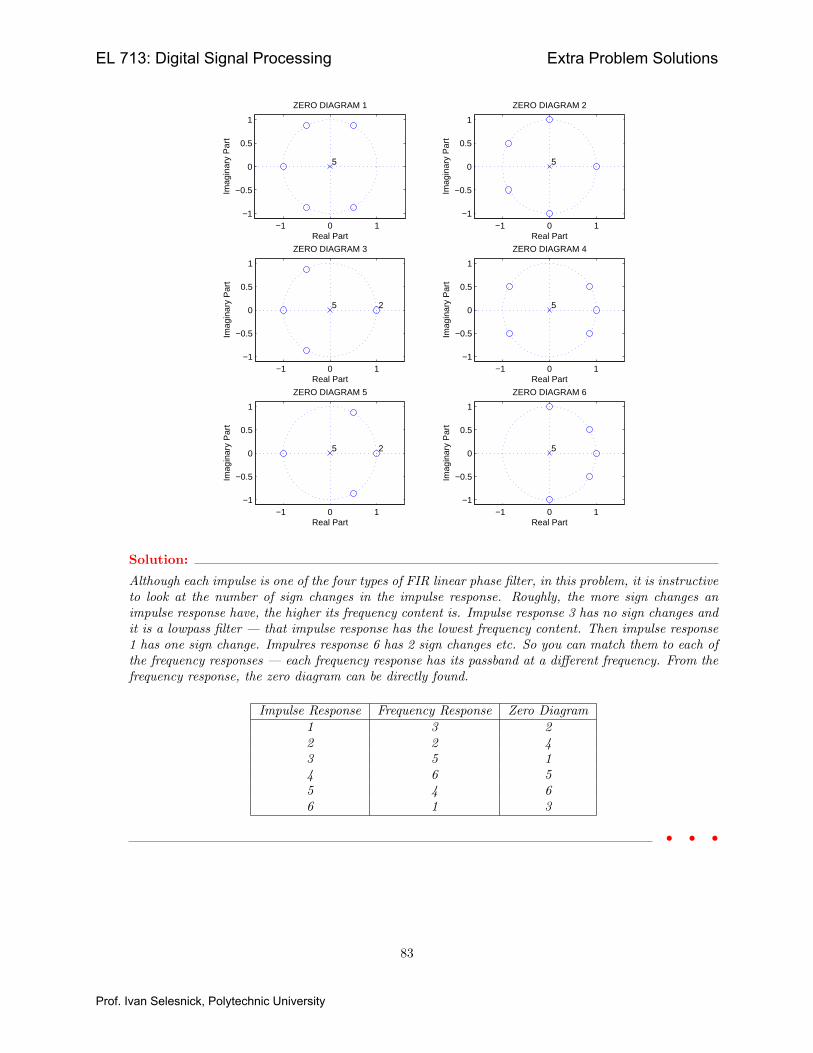
Although each impulse is one of the four types of FIR linear phase filter, in this problem, it is instructiveto look at the number of sign changes in the impulse response. Roughly, the more sign changes animpulse response have, the higher its frequency content is. Impulse response 3 has no sign changes andit is a lowpass filter — that impulse response has the lowest frequency content. Then impulse response1 has one sign change. Impulres response 6 has 2 sign changes etc. So you can match them to each ofthe frequency responses — each frequency response has its passband at a different frequency. From thefrequency response, the zero diagram can be directly found.
Impulse Response Frequency Response Zero Diagram1 3 22 2 43 5 14 6 55 4 66 1 3
• • •
83
EL 713: Digital Signal Processing Extra Problem Solutions
Prof. Ivan Selesnick, Polytechnic University

4.15 A student is asked to design a Type I and a Type II low-pass FIR linear-phase filter using DFT-basedinterpolation. The student turns in the work shown on the next page, which has two problems.
(a) The student does not provide an explanation.
(b) One of the solutions is correct, the other solution is fake (the student just made up the vector h,it does not follow from the MATLAB commands).
Identify which solution is correct and provide an explanation for it. Why does the fake solution notwork? You should be able to do this problem with out actually using MATLAB.
89
EL 713: Digital Signal Processing Extra Problem Solutions
Prof. Ivan Selesnick, Polytechnic University

TYPE I FIR IMPULSE RESPONSE:
>> H = [1 1 1 1 1 0 0 0 0 0 0 1 1 1 1]’;>> v = ifft(H);>> h = [v(9:15); v(1:8)]
h =
0.0394-0.0667
00.0853-0.0667-0.09630.30500.60000.3050-0.0963-0.06670.0853
0-0.06670.0394
TYPE II FIR IMPULSE RESPONSE:
>> H = [1 1 1 1 1 0 0 0 0 0 1 1 1 1]’;>> v = ifft(H);>> h = [v(9:14); v(1:8)]
h =
-0.0318-0.04940.0891-0.0255-0.12870.28920.64290.64290.2892-0.1287-0.02550.0891-0.0494-0.0318
Solution:
The Type II filter solution is incorrect. The Type I filter solution is right.For the Type I solution, note that the vector H is of length 15 and that it is real and circularly symmetric.That means that the inverse DFT, (v in the code) is also real and circularly symmetric, and also oflength 15. The vector v will have the following symmetry pattern:
90
EL 713: Digital Signal Processing Extra Problem Solutions
Prof. Ivan Selesnick, Polytechnic University
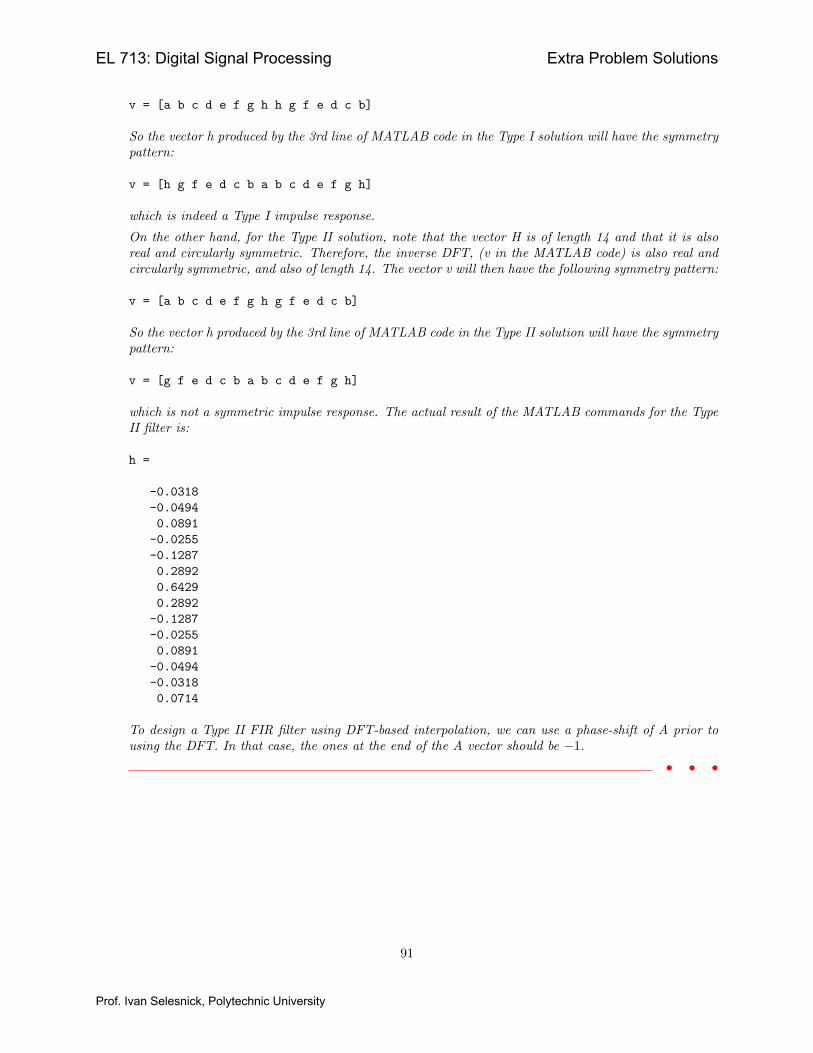
v = [a b c d e f g h h g f e d c b]
So the vector h produced by the 3rd line of MATLAB code in the Type I solution will have the symmetrypattern:
v = [h g f e d c b a b c d e f g h]
which is indeed a Type I impulse response.
On the other hand, for the Type II solution, note that the vector H is of length 14 and that it is alsoreal and circularly symmetric. Therefore, the inverse DFT, (v in the MATLAB code) is also real andcircularly symmetric, and also of length 14. The vector v will then have the following symmetry pattern:
v = [a b c d e f g h g f e d c b]
So the vector h produced by the 3rd line of MATLAB code in the Type II solution will have the symmetrypattern:
v = [g f e d c b a b c d e f g h]
which is not a symmetric impulse response. The actual result of the MATLAB commands for the TypeII filter is:
h =
-0.0318-0.04940.0891-0.0255-0.12870.28920.64290.2892-0.1287-0.02550.0891-0.0494-0.03180.0714
To design a Type II FIR filter using DFT-based interpolation, we can use a phase-shift of A prior tousing the DFT. In that case, the ones at the end of the A vector should be −1.
• • •
91
EL 713: Digital Signal Processing Extra Problem Solutions
Prof. Ivan Selesnick, Polytechnic University

4.16 Optional : Mitra 4.19. (But use the frequencies 0.2π, 0.4π, 0.9π)
Solution:
This is an interpolation problem:
A(ω) = 0 for ω = 0.2π, 0.9π, and A(0.4π) = 1.
We can use the general interpolation approach described in the notes. The impulse response we get asa solution is
h(n) = [−0.3968, −0.1127, 0.4276, −0.1127, −0.3968]
The frequency response we obtain is shown in the figure.
−1 0 1 2 3 4 5−1
−0.8
−0.6
−0.4
−0.2
0
0.2
0.4
0.6
0.8
1
n
IMPULSE RESPONSE h(n)
0 0.1 0.2 0.3 0.4 0.5 0.6 0.7 0.8 0.9 10
0.2
0.4
0.6
0.8
1
1.2
1.4|A(ω)|
ω/π
N = 5;
M = (N-1)/2;
wk = [0.2 0.4 0.9]’*pi;
Ak = [0 1 0]’;
C = cos(wk*[0:M]);
a = C\Ak;
h = (1/2)*[a([M:-1:1]+1); 2*a([0]+1); a([1:M]+1)];
figure(1)
clf
subplot(2,1,1)
stem(0:N-1,h,’.’)
xlabel(’n’)
title(’IMPULSE RESPONSE h(n)’)
axis([-1 5 -1 1])
[A,w] = firamp(h,1);
subplot(2,1,2)
93
EL 713: Digital Signal Processing Extra Problem Solutions
Prof. Ivan Selesnick, Polytechnic University

5.3 (Porat 6.1) We saw that the height of the largest side-lobe of the rectangular window is about -13.5dB relative to the main-lobe. What is the relative height of the smallest side-lobe? You may assumethe window length N is odd. (Hint: At what frequency will it be located?).
Solution:
The smallest side lobe of the Dirichlet kernel is at ω = π. The formula is
Sf (ω) =sin(
N2 ω
)sin(
12 ω) .
so
Sf (π) =sin(
N2 π)
sin(
12 π) = 1
when N is odd. Recall that Sf (0) = N . The relative height of the smallest side-lobe is therefore 1/N .
• • •
99
EL 713: Digital Signal Processing Extra Problem Solutions
Prof. Ivan Selesnick, Polytechnic University

5.15 The following spectrogram is taken from the HW submitted by an EL 713 student.
Which of the following three parameters would you suggest the student modify to best improve the ap-pearance of this spectrogram? What change would you make to that parameter? The three parametersare:
R = block length.
L = time lapse between blocks.
N = FFT length. (Each block is zero-padded to length N .)
Explain your answer.
Solution:
The student should reduce L the time-lapse between blocks. (Equivalently, the overlap fraction shouldbe increased.) Making that change will reduce the step like appearance of the spectrogram.
• • •
119
EL 713: Digital Signal Processing Extra Problem Solutions
Prof. Ivan Selesnick, Polytechnic University

5.17 The following figures show a signal and its spectrogram, computed with different sets of parameters,
R ∈ {30, 60}, N ∈ {64, 256}
whereR = block lengthN = FFT length (nfft in the Matlab specgram function). (Each block is zero-padded to length N .)
(a) For each of the spectrograms, indicate what you think R and N are, and explain your choices.(b) Describe how the spectrogram would change if the time-skip (L in the notes), is increased.
0 20 40 60 80 100 120 140 160 180 200−1
−0.5
0
0.5
1
SIG
NA
L
time
freq
uenc
y
SPECTROGRAM A
0 50 100 1500
0.1
0.2
0.3
0.4
0.5
time
freq
uenc
y
SPECTROGRAM B
0 50 100 1500
0.1
0.2
0.3
0.4
0.5
time
freq
uenc
y
SPECTROGRAM C
0 50 100 1500
0.1
0.2
0.3
0.4
0.5
Solution:
For spectrogram B, the vertical width of the bar with respect to the frequency axis is less than forspectrogram A, so spectorgram B uses a longer block length than spectrogram A. In addition, the pointin the middle where the frequency starts to decrease is blurred, which also suggests that spectrogram Buses a longer block length.The horizontal stripe effect in spectrogram C is due to discontinuities along the frequency axis — so forspectrogram C there is less zero padding that for A and B. Except for the stripe artifact, spectrogramC appears to be similar to spectram A, so it appears that they use the same block length.
Spectrogram R NA 30 256B 60 256C 30 64
• • •
127
EL 713: Digital Signal Processing Extra Problem Solutions
Prof. Ivan Selesnick, Polytechnic University