el camino real - viva dona ana · p. 3 may 2013 approach this report summarizes existing conditions...
TRANSCRIPT

EL CAMINO REAL CORRIDOR MANAGEMENT PLANSnapshot Report May 2013


P. 3
MAY 2013
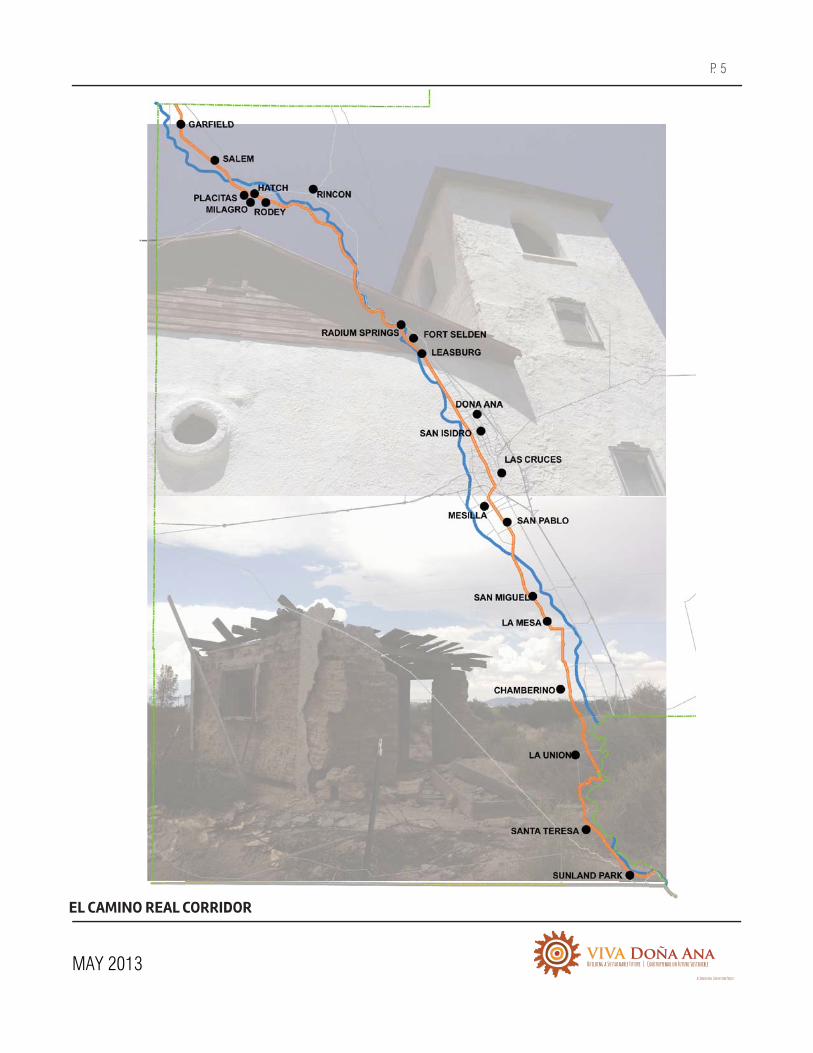
APPROACHThis report summarizes existing conditions for the 92-mile Camino Real Corridor Management Plan. The corridor runs parallel to the Rio Grande and stretches from the northern boundary of Doña Ana County, near the settlement of Garfield, down to the town of Sunland Park on the county’s southern border. For the purposes of this report, the study area is defined as being a one mile buffer along the roadway (1/2 mile on either side) for the 92-mile length. The Camino Real Corridor Plan profiles communities along the corridor, including incorporated municipalities and “census designated places”- communities for which 2010 Census data is available.
This project is part of a larger “Viva Doña Ana” initiative that is focused on improving the overall “livability” of the county. The Viva Doña Ana regional project is sponsored by the Camino Real Consortium and funded by a grant through the Partnership for Sustainable Communities. It has seven distinct but related initiatives: the Doña Ana Comprehensive Plan, the Camino Real Corridor Management Plan, the Colonias Master Plan, the Border Economic Development Plan, the Regional Capital Needs Plan, the Unified Development Code and a community participation and engagement initiative. All of this work builds off of the foundation established by the One Valley, One Vision 2040 Plan (Vision 2040 Plan) that was adopted by the County in 2012.
The seven projects are also grounded in six “livability principles” that link transportation, economic development, and quality of life initiatives. The six principles are as follows:
• Provide more transportation choices• Promote equitable, affordable housing• Enhance economic competitiveness• Support existing communities• Coordinate policies and leverage public investment• Value communities and neighborhoods
These principles, along with public input will guide decisions on El Camino Real Corridor project priorities, goals, and objectives. El Camino Real

4P.
MAY 2013
In the spirit of the livability principles, this report introduces the overall conditions along the corridor in three broad categories: People/Places/Prosperity. These topics help to introduce the overall character of the corridor in a manner that matters to the average citizen and to integrate the six livability principles into the analysis. The format is intended to concisely summarize information in an easily readable format.
Following the People/Places/Prosperity section, the corridor is analyzed in twelve segments, each about eight miles. Each segment is characterized by location-specific information on communities, the economy, roadway conditions, and historical/cultural attributes. The segment by segment analysis helps to define the overall character and highlight the differences between the north and south halves of the corridor. At the end of this segment by segment analysis, the corridor’s attributes are summarized into the overall condition of the northern versus southern half. One of the core objectives of the corridor plan is to identify and detail four catalytic projects, two on the northern half and two on the southern half of the corridor, with Interstate 10 as the dividing line between north and south. Catalytic projects are intended to spur new economic activity and/or improve the area’s quality of life.
This Corridor Snapshot Report constitutes the first phase of El Camino Real Corridor Plan. Future phases will identify catalytic projects and implementation strategies, all of which will be informed by stakeholder and public input. The overall project is anticipated to be completed in late 2013/early 2014.
HOW THIS REPORT IS ORGANIZED
P. 5
MAY 2013
EL CAMINO REAL CORRIDOR

6P.
MAY 2013
p.07 PEOPLE Population Median Age Race Household & Family types Children and Seniors
p.09 PLACES Owner-Occupied Units Mobile Homes Residential Building Permits / Development Activity Housing Stock, by Age Transportation
p.12 PROSPERITY Median Household Income Gross Receipts Tax Revenues Crop Mix Agricultural Employment Farms and Acres Utilized
TABLE OF CONTENTSp.16 EL CAMINO REAL CORRIDOR PLAN Segment 1. Garfield and Salem Segment 2. Hatch, Placitas, Milagro and Rodey Segment 3. Rincon Segment 4. North of Radium Springs Segment 5. Radium Springs, Fort Selden and Leasburg Segment 6. Doña Ana and San Isidro Segment 7. Las Cruces, Mesilla and San Pablo Segment 8. San Miguel and La Mesa Segment 9. Chamberino Segment 10. La Union Segment 11. Santa Teresa Segment 12. Sunland Park
p.29 SUMMARY Overall North South

P. 7
MAY 2013
PopulationThe population of places1 along the corridor (not including Las Cruces) is 32,752, or approximately 16 percent of the population of the County. The northern end of the corridor is significantly less populated than the southern end: 7,480 (23 percent) live in the northern half of the corridor (Garfield to San Isidro), while 25,272 (77 percent) are in the southern portion (Mesilla to Sunland Park). When Las Cruces is included, the corridor population is 130,370, or 62 percent of the county population.
From Census Place Data 2010 ACS 5-Year Estimates
Median AgeThe median age along the corridor is 35, compared to 32 in both Doña Ana County and the City of Las Cruces. The median age in the northern portion of the corridor is 31, while it increases to 39 in the southern half.
1 There is no perfect way to gather data for a plan that examines an area at a smaller scale like the half-mile buffer along the Camino Real used in this study. County level data and even Census Tracts are much too large to give any clear representation of the conditions along the corridor. Numerous data points have historically been available at the Census Block level, but as of 2010, many of those categories are no longer tracked by the decennial Census. Although in many cases those categories are now tracked by the American Community Survey estimates, those estimates are available only for the Tract level and above. Thus, for this study, the population and other demographic statistics are based on Incorporated Places or Census Designated Places (CDP) which are “delineated to provide data for settled concentra-tions of population that are identifiable by name but are not legally incorporated under the laws of the state in which they are located.” There are three places along the Corridor which are not captured by one of these two metrics, and thus not reflected in the statistics presented here: Milagro, Fort Selden, and Leasburg.
PEOPLE

8P.
MAY 2013
RaceThe Hispanic proportion of the population in New Mexico is 46 percent and in Doña Ana County is 65.7 percent. Along the corridor, this proportion is 81 percent, evenly distributed between the northern and southern halves.
Household & Family typesHousehold types are also found in different proportions along the corridor compared to the rest of Doña Ana County. In the county and in the state as a whole, family households are generally 66 percent of the total, while non-family households account for 33 percent. In contrast, along the corridor, family households account for 79 percent of the total (with a slight difference between the northern half -81 percent – and the southern half – 77 percent).
From Census Place Data 2010 ACS 5-Year Estimates
Children and SeniorsIn addition, those family households are composed somewhat differently along the corridor, with higher proportions of both children and seniors than in the rest of the county. In the towns along the corridor, 45 percent of households have children under 18 (compared to 37 percent in the county) and 28 percent of households have people over the age of 65 (compared to 25 percent in the county). The corridor has only slightly larger average household and family sizes compared to the county, although both measures are noticeably higher along the northern half in comparison to the southern half.
PEOPLE

P. 9
MAY 2013
Owner-Occupied UnitsThe corridor has a higher percentage of owner-occupied units (75 percent) than either Doña Ana County (64 percent) or the State as a whole (68.5 percent). However, the median value of an owner-occupied unit along the corridor ($128,000) is approximately 7 percent lower than in the County as a whole ($137,000). This discrepancy is even more interesting when comparing the average values in the northern half ($101,000) and the southern half ($152,000).
Mobile HomesSome of the variation in average home values is explained by the prevalence of mobile homes as an affordable housing choice in different areas. The corridor as a whole (24.4 percent) has a slightly higher proportion of mobile homes (as a percentage of total housing units) compared to the county (22.2 percent). Similar to the discrepancy found in the values of owner-occupied units, there is a significant difference between the northern and southern halves of the corridor. In the northern half, approximately 43 percent of housing units are mobile homes, while this number drops to 19 percent in the southern half.
Residential Building Permits / Development ActivityFrom 2005 through 2012, approximately 31,800 residential building permits were issued by Doña Ana County. Of those, 6,400 permit sites (21 percent) were located within the half mile corridor buffer, almost evenly split between the northern and southern segments. The Las Cruces Extra-Territorial Zone (ETZ) is a five mile buffer around the City of Las Cruces boundaries, within which the Doña Ana County Planning Department reviews and approves building permits, while the City of Las Cruces Community Development Department reviews subdivision proposals. Approximately 1,800 permit sites were located within this important Las Cruces ETZ, while 4,600 permits (14.5 percent of the county total) were located along the corridor outside of the ETZ.
PLACES

10P.
MAY 2013
Housing Stock, by Age (not including mobile homes)The age of housing stock along the corridor is mostly comparable to the county as a whole; however, there are several interesting contrasts as indicated in the chart below. The corridor has a much higher percentage of houses built before 1939, especially in the southern segment where Mesilla accounts for almost half of the homes of this age. The corridor then has a lower percentage of housing built during the 1940’s, 1950’s, and 1960’s (11 percent) compared to the County (17 percent). In contrast, 66 percent of the corridor’s housing was built between 1970 and 1999, compared to only 60 percent in the county as a whole. Finally, while 7 percent of housing was built in the county since 2005, only 4 percent was built in the corridor since that time.
From Census Place Data 2010 ACS 5-Year Estimates
PLACES

P. 11
MAY 2013
PLACES
TransportationThe 92-mile long El Camino Real Corridor is made up of a collection of roadways. It begins with NM 187 in the north connecting to NM 185 via a small section of NM 26 in Hatch. The corridor then follows NM 185 all of the way into Las Cruces where it is referred to as Valley Drive. As it enters the Town of Mesilla, the name changes to Avenida de Mesilla and then connects with Calle de El Paso (NM 28) before heading south. NM 28 takes the corridor all of the way south to Sunland Park where it connects with McNutt Road (NM 273) and finishes at the Texas State Line.Along the rural sections of the corridor, the roadway is primarily 2 lanes, no bicycle/pedestrian facilities, and unimproved shoulders. The urban sections in Las Cruces, Mesilla, and Sunland Park gain additional travel lanes and sidewalks, but lose the shoulder.
Dedicated bicycle facilities do not exist in any location along the corridor. However, the corridor through Las Cruces and south along NM 28 is currently identified as an existing bike route by the Las Cruces MPO and is often used by bicyclists as they share the road with vehicular traffic. Closer to Las Cruces, NM 28 can see as many as 10,000 vehicles a day. The rural sections within the County (NM 28/NM 185/NM187) get between 2500-4000 vehicles per day. Crash data from 2009 -2011 provides some insight into what is happening along the corridor: • No accidents (that were reported) involving pedestrians or bicycles.• Only 2% of the accidents involve motorcycles.• Corridor-long, almost 40% of the accidents occur on weekends.• Along NM 185, deer were a contributing factor in several accidents.
Corridor IdentityThe corridor is part of the 299 mile long El Camino Real Scenic Byway. El Camino Real de Tierra Adentro, (the Royal Road of the Interior Land) first travelled by Don Juan de Oñate in 1598, became the main trade route between Mexico City and Santa Fe. The National Scenic Byways Program is administered by the U.S. Department of Transportation, Federal Highway Administration. The program helps to recognize, preserve and enhance selected roads throughout the United States. While the designation helps to attract visitors to a recognized corridor, there are limited Federal funds at this time for improvements on Scenic Byways.
The section of the scenic byway in Doña Ana County has some signs that call out the history of the area – a series of signs identify the road as the Oñate Trail. But the signage is not consistent and does not project a strong identity for the corridor as a whole. Some corridors, such as the old Route 66, have a strong, recognizable brand that is instantly recognizable. Most of the businesses along the corridor currently do not associate their marketing with the history of El Camino Real.

12P.
MAY 2013
Median Household IncomeOn average, median household incomes along the corridor in 2010 were approximately $35,500. This is 3 percent lower than the average for Doña Ana County ($36,700) and 8 percent lower than the average in Las Cruces ($38,400). (There is very little differentiation between north and south, however there is a very wide range between different communities along the corridor).
PROSPERITY

P. 13
MAY 2013
Gross Receipts Tax RevenuesAlthough data is not available to specify Gross Receipts Tax (GRT) revenues along the corridor, the trend over the period from 2004 to 2011 showed Las Cruces accounting for a lower percentage of the County’s overall GRT, dropping from 77 percent in 2004 to 71 percent in 2011 (see chart below). This indicates a possible trend toward other parts of the corridor contributing a higher percentage of the county’s GRT revenues over the past eight years.
From Census Place Data 2010 ACS 5-Year Estimates
PROSPERITY

14P.
MAY 2013
Crop MixFive crops account for the majority of Doña Ana County’s agricultural output, as seen in the table and chart below. Cotton and orchards (almost entirely pecan production), together account for over 50 percent of agricultural acreage in the county.
From Census Place Data 2010 ACS 5-Year Estimates
PROSPERITY

P. 15
MAY 2013
Agricultural EmploymentAlthough specific data is not available for the corridor, in Doña Ana County as a whole, agriculture accounted for 3.6 percent of employment or 3,000 jobs on average from 2001 to 2011. The last U.S. Census of Agriculture occurred in 2007 and reported that Doña Ana County had 4,867 hired farm workers; of those only 2,063 (42 percent) worked 150 days or more.
Farms and Acres UtilizedThe 2007 U.S. Census of Agriculture indicated that Doña Ana County had 1,762 farms which utilized almost 590,000 acres (24 percent of the land in the county). These farms are predominantly smaller in scale (as seen in the table below) with almost 60 percent smaller than 10 acres.
PROSPERITY

16P.
SEGMENT 1. Garfield and Salem
SEGMENT 2. Hatch, Placitas, Milagro and Rodey
SEGMENT 3. Rincon
SEGMENT 4. North of Radium Springs
SEGMENT 5.Radium Springs, Fort Selden and Leasburg
SEGMENT 6. Doña Ana and San Isidro
SEGMENT 7. Las Cruces, Mesilla and San Pablo
SEGMENT 8. San Miguel and La Mesa
SEGMENT 9. Chamberino
SEGMENT 10. La Union
SEGMENT 11. Santa Teresa
SEGMENT 12. Sunland Park
EL CAMINO REAL CORRIDOR
Doña Ana County, New Mexico

P. 17
At a Glance
• Communities: - Garfield: 137 - Salem: 942 - Predominately Hispanic
population - Large average family size
(4.41/family in Salem)
• Economy - Agriculture primary
economic driver – chile and crop production
• Roadway Profile – NM 187
- Lane miles: 8.01 - Travel Lanes: 2 - Bicycle/Pedestrian: No - Shoulders : Yes
• What’s Unique - Gateway for the
corridor on the north end.
SEGMENT 1. Garfield and Salem
DRAFT-APRIL 17, 2013

18P.
At a
Gla
nce
• Co
mm
uniti
es:
-H
atch
: 1,6
48
- Pla
cita
s: 5
76
-Rod
ey: 3
88•
Econ
omy
- A
gric
ultu
re a
nd To
uris
m
- P
oten
tial g
atew
ay to
the
Spac
epor
t
SEGM
ENT
2. H
atch
, Pl
acita
s, M
ilagr
o an
d Ro
dey
• Ro
adw
ay P
rofil
e –
NM 1
87/N
M 2
6 /
NM 1
85
- Lan
e m
iles:
7.7
0
- Tra
vel L
anes
: 2
- Bic
ycle
/ Ped
estri
an: N
o
- Sid
ewal
k: Y
es (N
M 2
6)
- Sho
ulde
rs :
Yes
• W
hat’s
Uni
que
- V
illag
e of
Hat
ch: t
he C
hile
Cap
ital o
f the
W
orld
- I
ncre
ased
traf
fic o
n po
rtion
of c
orrid
or d
ue
to c
onne
ctin
g ro
ute
betw
een
I-25
and
I-10.

P. 19
At a Glance
• Communities -Rincon: 271 • Economy - Agricultural production,
almost all on east side of roadway
- Railroad siding and operations yard in Rincon
• Roadway Profile – NM 185
- Lane miles: 6.61 - Travel Lanes: 2 - Bicycle/Pedestrian: No - Shoulders: Yes
• What’s Unique - Open, undeveloped
character of this stretch
SEGMENT 3. Rincon
Doña Ana County, New Mexico

20P.
Doña Ana County, New Mexico
At a Glance
• Communities - Few residents along this
stretch
• Economy - Virtually no agricultural,
residential, or commercial development
• Roadway Profile – NM 185
- Lane miles: 7.95 - Travel Lanes: 2 - Bicycle/Pedestrian: No - Shoulders: Yes
• What’s Unique - Open, undeveloped
character of this stretch - Proximity to the river - Relationship between the
river and rocky terrain to the west
SEGMENT 4. North of Radium Springs

P. 21
At a Glance
• Communities - Radium springs: 1,699 - Fort Selden, Leasburg:
not a census designated place
• Economy - Some recreation with
Fort Selden and Leasburg State Park
- Agriculture
• Roadway Profile – NM 185
- Lane miles: 7.14 - Travel Lanes: 2 - Bicycle/Pedestrian: No - Shoulders:Yes
• What’s Unique -Radium Springs tourist destination in early 1900’s
- Fort Selden – active fort in the late 1800’s
- Leasburg – NM State Park recreation facilities
SEGMENT 5. Radium Springs, Fort Selden and
Leasburg
Doña Ana County, New Mexico

22P.
Doña Ana County, New Mexico
At a Glance
• Communities - San Isidro: 2,090 - Doña Ana: 1,211
• Economy - Agriculture
• Roadway Profile – NM 185 (Valley Drive)
- Lane miles: 8.62 - Travel Lanes: 2 to 4 - Bicycle/Pedestrian:
Limited - Shoulders: Yes (in 2
lane configuration)
• What’s Unique - Historic Plaza in Doña
Ana
SEGMENT 6. Doña
Ana and San Isidro
P. 23
At a Glance
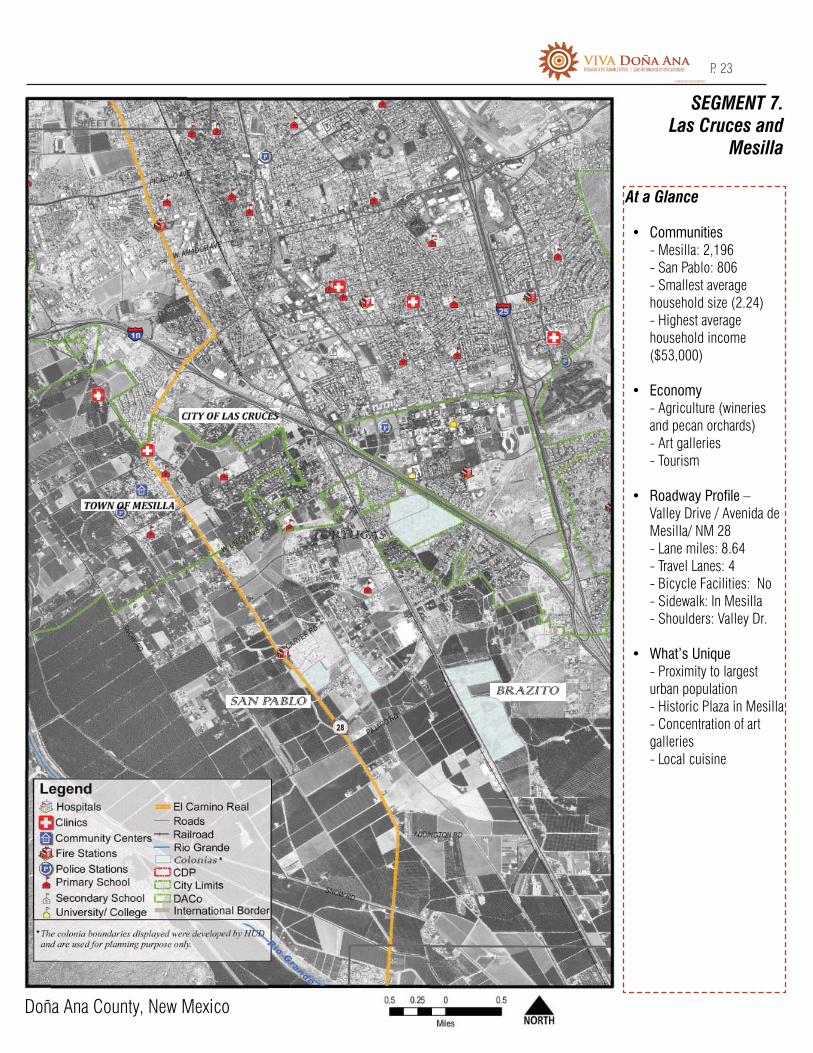
• Communities - Mesilla: 2,196 - San Pablo: 806 - Smallest average
household size (2.24) - Highest average
household income ($53,000)
• Economy - Agriculture (wineries
and pecan orchards) - Art galleries - Tourism
• Roadway Profile – Valley Drive / Avenida de Mesilla/ NM 28
- Lane miles: 8.64 - Travel Lanes: 4 - Bicycle Facilities: No - Sidewalk: In Mesilla - Shoulders: Valley Dr.
• What’s Unique - Proximity to largest
urban population - Historic Plaza in Mesilla - Concentration of art
galleries - Local cuisine
SEGMENT 7. Las Cruces and
Mesilla
Doña Ana County, New Mexico

24P.
Doña Ana County, New Mexico
At a Glance
• Communities - San Miguel: 1,153 - La Mesa: 728
• Economy - Agriculture (wineries
and pecan orchards) - Art galleries - Tourism
• Roadway Profile –NM 28
- Lane miles: 9.63 - Travel Lanes: transitions
from 4-3-2 lanes - Bicycle/Pedestrian: No - Shoulders: Yes (in 2
lane configuration)
• What’s Unique - Art galleries - Local cuisine - Pecan orchards
SEGMENT 8. San Miguel and La Mesa

P. 25
Doña Ana County, New Mexico
At a Glance
Communities - Chamberino: 919
• Economy - Agriculture (pecan
orchards, alfalfa, cattle grazing)
• Roadway Profile –NM 28
- Lane miles: 8.14 - Travel Lanes: 2 - Bicycle/Pedestrian: No - Shoulders: Yes
• What’s Unique - Area part of Mexico
until Gadsden Purchase
SEGMENT 9. Chamberino

26P.
At a
Gla
nce
• Co
mm
uniti
es
- La
Unio
n: 1
,106
• Ec
onom
y
- Pec
an o
rcha
rds
and
wine
ries
- A
nnua
l Blu
es/J
azz f
estiv
al a
t loc
al w
iner
y
SEGM
ENT
10.
La U
nion
Doña
Ana
Cou
nty,
New
Mex
ico
• Ro
adw
ay P
rofil
e –N
M 2
8
- Lan
e m
iles:
5.1
4
- Tra
vel L
anes
: 2
- Bic
ycle
/Ped
estri
an: N
o
- Sho
ulde
rs: Y
es
• W
hat’s
Uni
que
- N
amed
for t
he u
nion
of t
wo
flood
ed c
omm
uniti
es: L
os O
jitos
an
d Lo
s Am
oles
-O
rigin
ally
a re
fuge
for M
exic
an
settl
ers
that
did
not
wan
t to
be p
art
of th
e U.
S. a
fter T
reat
y of
Gua
dalu
pe
Hida
lgo

P. 27
Doña
Ana
Cou
nty,
New
Mex
ico
At a
Gla
nce
• Co
mm
uniti
es
- San
ta Te
resa
: 4, 2
58
- S
unla
nd P
ark:
14,
106
• Ec
onom
y
- Uni
on P
acifi
c Ra
il Fa
cilit
y
- War
ehou
sing
and
Dis
tribu
tion
SEGM
ENT
11.
Sant
a Te
resa
• Ro
adw
ay P
rofil
e –
McN
utt R
oad
(NM
273
)
- Lan
e m
iles:
6.9
8
- Tra
vel L
anes
: 2
to 4
- B
icyc
le/P
edes
trian
: Yes
- S
houl
ders
: Yes
• W
hat’s
Uni
que
- E
arly
arc
haeo
logi
cal s
ite
(Pre
-Pue
blo
Revo
lt –
1500
’s)
- W
ar E
agle
s Ai
r Mus
eum
(n
ear S
anta
Tere
sa a
irpor
t)
- Pro
ximity
to b
orde
r cro
ssin
g at
San
ta Te
resa

28P.
Doña
Ana
Cou
nty,
New
Mex
ico At a
Gla
nce
• Co
mm
uniti
es
- Sun
land
Par
k: 1
4,10
6
• Ec
onom
y
- Rac
etra
ck/C
asin
o
- Com
mer
cial
act
ivity
for S
unla
nd P
ark
SEGM
ENT
12.
Sunl
and
Park
• Ro
adw
ay P
rofil
e –
McN
utt R
oad
(NM
273
)
- Lan
e m
iles:
7.2
9
- Tra
vel L
anes
: 2 to
4
- B
icyc
le/P
edes
trian
: Yes
- S
houl
ders
: No
• W
hat’s
Uni
que
- P
roxim
ity to
bot
h Te
xas
and
Mex
ico
- H
isto
ric c
ross
ing
of R
io G
rand
e an
d “e
ntra
da”
into
New
Mex
ico
by D
on J
uan
de O
ñate
in 1
598

P. 29
MAY 2013
SUMMARYGiven the twelve segments of the corridor, there are a number of ways to aggregate and characterize what differentiates and what binds the northern half versus the southern half. A few of the differentiators are:
• the northern half is less populated, more rural in character• the southern half has a higher concentration of art galleries and restaurants• chile production is concentrated in the northern portion of the corridor• there is more opportunity for economic development in the southern half
Yet there are also many similarities:
• the entire corridor essentially parallels the Rio Grande • agricultural uses dominate the landscape • the communities tend to be small and economically disadvantaged • there is a lack of local, quality jobs• the roadways are mostly two lane, rural in character with little to no shoulder
or sidewalk
The challenge for El Camino Real Corridor Plan is to identify what differentiates the north from the south and also identify what creates a coherent identity for the corridor as a whole. The next section summarizes the overall character of the two halves of the corridor, identifies opportunities that can inform potential catalytic projects, and suggests a range of themes for the overall corridor identity.
OVERALL OPPORTUNITIES
• Given the sustained drought and competition for water, what will keep agriculture as a viable and profitable economic activity?
• How can the County expand regional transportation to link residents with employment and educational opportunities?
• Where does it make sense to encourage new housing activity along the corridor? What types of housing would best serve the smaller communities?
• What improvements to the roadways would help create a more cohesive and livable corridor?
• Should the corridor have one overall identity or different themes for different segments?

30P.
MAY 2013
NorthSummary: • Natural features: The northern half of the corridor, from Garfield to Las Cruces,
ranges from verdant, cultivated fields of chile to rugged, scenic and open stretches of road.
• Cultural/Recreational: With places like Fort Selden and Leasburg State Park, there is a range of recreational and historic assets that can inform the identity and potentially draw additional visitors.
• Socio-Economic: Apart from Las Cruces, the Village of Hatch is the largest community. For most settlements along the northern half, community gathering places tend to be the schools. Outside of the Village of Hatch, there is little in the way of commercial/retail operations. Medical services are also concentrated in Hatch and Las Cruces. The average household income is lower than the County as a whole and economic activity mostly centers on crop production and dairy farms.
• Transportation: The roadways are generally two lanes, with limited bicycle and pedestrian facilities. There is some access to on-demand transit from Hatch to Las Cruces. There are multiple connections to Interstate 25 that could be used to draw visitors off of the freeway to experience the different pace and character of the corridor.
Potential themes/identities for the northern half of the corridor:• Chile • Spaceport• Military history• Recreation• Rocks and river• Churches/cemeteries• Historical plazas
OPPORTUNITIES
• How can the County best preserve and leverage the corridor’s rural, open character?
• How will the Spaceport impact the local economy?
• Where does it make sense to have gateways and introduce the “brand” of the corridor?

P. 31
MAY 2013
NORTH
SOUTH

32P.
MAY 2013
SouthSummary:• Natural features: The southern half of the corridor, from Las Cruces to Sunland
Park, features extensive groves of pecan trees that gradually give way to more open agricultural land and then transitions to a more settled and developed pattern near the border.
• Cultural/Recreational: Mesilla Plaza is a renowned destination for both its historical significance and for its concentration of art galleries and restaurants. The southern half of the corridor is punctuated with small concentrations of cuisine and culture in places such as Mesilla, La Mesa and Sunland Park.
• Socio-Economic: With a population of over 25,000, the southern half of the corridor has three times the number of people than the northern half (this excludes Las Cruces). Outside of Mesilla and Sunland Park, most of the population is in small settlements. Like the northern half, agriculture is the dominant economic activity but the Union Pacific intermodal rail facility is expected to generate more jobs and related economic development.
• Transportation: As in the northern half, the roadways are generally two lanes with minimal bicycle or pedestrian facilities and no transit connections outside of Las Cruces. The connections to Texas and to Mexico both create opportunities to draw visitors onto the corridor.
Potential themes/identities for the southern half of the corridor:• Pecan orchards• Wineries/local cuisine/art galleries• Churches/cemeteries• Historical Plazas
• Gaming/gateway to El Paso and Mexico
OPPORTUNITIES
• How can the County leverage existing cultural amenities like wineries and art galleries to create a stronger regional destination?
• What role can the corridor play in cross-border economic development? Texas and Mexico?
• How will new economic activity in the Santa Teresa area impact development along the corridor?

P. 33
MAY 2013
PUBLIC OUTREACH
NEXT STEPS This Snapshot Report will form the first part of the larger El Camino Real Corridor Management Plan, due to be completed in 2014. It will also serve as a starting point for discussions with County residents about the future direction of the County. The next phase of work on the project, Opportunities and Vision, will build upon the findings of this report to start a dialogue with Doña Ana residents about choices that the County can make. The goal of this next phase is to create a strategic plan and vision that helps guide future policy and investment for the County. This strategic plan and vision should be informed by an honest assessment of the corridor’s strengths and weaknesses. The existing conditions summarized in this report can also be used as a baseline to gauge progress on key indicators for the County moving forward, after completion of the overall El Camino Real Corridor Management Plan.
2014
2013 J F M A M J J A S O N D J F M A
Mobile Workshops
SnapShot Report
Opportunity and Vision
Growth Strategies
DraftPlan
FInal Plan
El Camino Real Corridor Management Plan
34P.
MAY 2013
For more information on this project and to track its progress, go to: http://www.vivadonaana.org