electric power megawatt daily - platts
TRANSCRIPT
Tuesday, June 21, 2016
MEGAWATT DAILY
www.platts.com www.twitter.com/PlattsPower ELECTRIC POWER
News HeadliNes
Cal-isO faces heat wave with little aliso help �� Monday sets highest price year to date�� Heat pushes power burn to YTD high
Vestas eyeing 2,000-Mw turbine sale to Midam �� MidAm signs agreement for 1,000, 2-MW turbines�� Project may be North America’s biggest wind farm
iea sees slowdown in Us gas demand growth �� Slower gas demand growth driven by power-sector dynamics�� US production more sensitive to external markets
Power storage push draws differing reactions �� Pumped hydro, compressed air have best costs�� Costs must dip for storage to ‘make ... sense’: expert
FTR volume and prices fall in June’s auction �� FTR volume down 2,308 GWh to 164,273 GWh�� ISO New England, Cal-ISO post modest gains
APS likely to see low plant prices: UBS 7FirstEnergy new rate plan protested at FERC 8
iNside THis issUe
Key Drivers/MarKet HigHligHts
�� NYisO Zone a falls to upper $40s/Mwh�� PJM west stays in low $40s/Mwh�� eRCOT dailies rise $1.75 to $29.75/Mwh�� sP15 dailies slip to mid-$40s/Mwh on demand
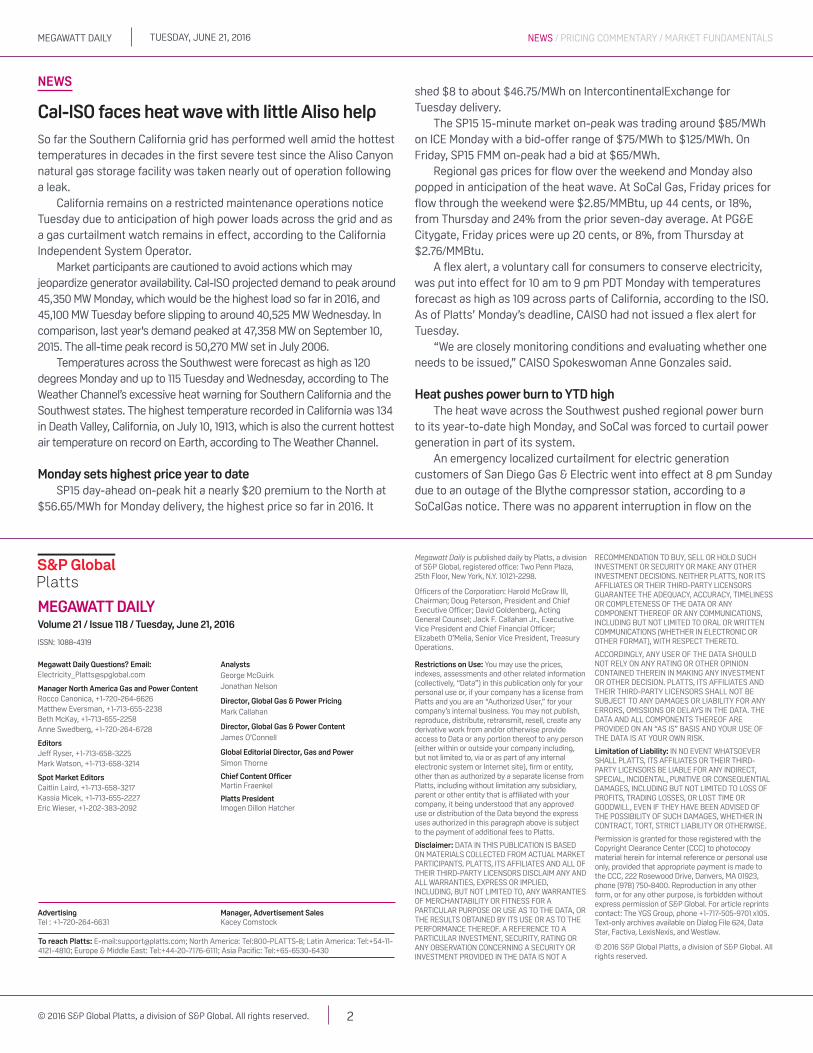
regional Day-aHeaD price cHanges day-ahead peak prices Regional weather trends
daily Prior daily 7-day 21-Jun chg 7-day avg 21-Jun chg forecast
isO Price locations
CAISO NP 15 38.37 1.84 ▲ 28.14 72.1 -3.0 ▼ 72.9ERCOT North Hub 28.95 1.40 ▲ 30.06 84.3 0.9 ▲ 85.1ISONE Internal Hub 39.07 3.68 ▲ 27.34 72.8 2.1 ▲ 69.2MISO Indiana Hub 33.57 -7.79 ▼ 33.65 73.8 -5.6 ▼ 75.1NYISO Zone G 38.75 0.52 ▲ 28.60 74.8 -0.8 ▼ 72.1PJM West Hub 35.48 -9.25 ▼ 31.87 76.8 -1.3 ▼ 74.1SPP South Hub 31.59 -4.63 ▼ 33.90 81.8 -0.5 ▼ 83.2
Bilateral indexes
Into Southern 29.50 -0.25 ▼ 34.14 80.6 2.3 ▲ 82.3Palo Verde 59.50 -6.67 ▼ 28.35 76.7 -2.3 ▼ 77.4COB 30.28 -21.60 ▼ 24.74 64.1 -2.7 ▼ 67.6Mid-C 23.89 -11.82 ▼ 20.20 64.1 -2.7 ▼ 67.6
Source: Platts
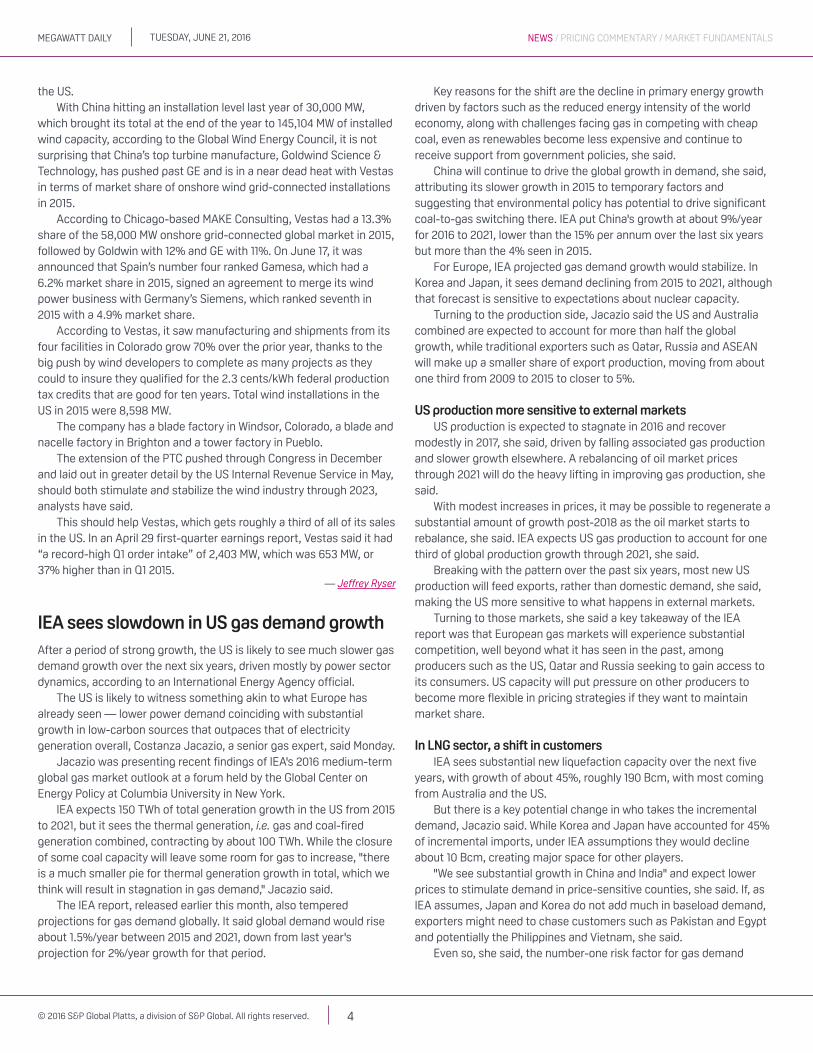
PlaTTs Peak dailY deMaNd (gW) daily change Five day forecast season season average
isO 17-Jun 18-Jun 19-Jun 20-Jun 21-Jun Chg % Chg 22-Jun 23-Jun 24-Jun 25-Jun 26-Jun Min Max 2016 2015 Chg % ChgBPA-Puget 6.60 6.19 5.91 6.75 6.62 -0.13 -1.93 6.72 6.63 6.61 6.23 6.36 4.96 8.02 6.71 7.02 -0.31 -4.42IESO 20.75 21.05 21.74 24.28 20.17 -4.11 -16.93 19.80 20.17 20.95 20.31 21.83 16.84 21.74 18.86 20.26 -1.40 -6.91CAISO 33.16 32.79 38.50 42.35 37.61 -4.74 -11.19 37.02 38.81 38.65 35.65 35.22 26.81 40.09 32.39 36.47 -4.08 -11.19ERCOT 64.82 62.68 57.05 54.00 55.72 1.72 3.19 56.34 56.20 56.34 54.51 57.16 36.93 64.86 54.81 60.43 -5.62 -9.30SPP 43.89 40.81 41.98 38.99 38.87 -0.12 -0.31 41.62 39.57 38.05 35.98 39.47 28.72 47.73 39.61 38.21 1.40 3.66MISO 107.27 98.77 102.50 105.92 98.15 -7.77 -7.34 96.82 95.12 98.77 94.63 96.62 71.63 107.30 93.97 99.42 -5.45 -5.48PJM 112.45 109.63 116.74 130.41 125.63 -4.78 -3.67 114.03 116.17 111.80 101.79 107.45 90.80 130.45 111.64 118.45 -6.81 -5.75NYISO 22.61 21.89 22.32 25.26 24.13 -1.13 -4.47 23.10 22.78 23.55 21.75 22.50 17.61 23.99 21.05 24.28 -3.23 -13.30NEISO 16.86 15.54 15.81 19.00 19.31 0.31 1.63 18.30 17.30 18.45 16.81 17.30 12.36 18.27 15.45 18.59 -3.14 -16.89AESO 8.91 8.53 8.64 9.37 9.27 -0.10 -1.07 9.42 9.54 9.24 8.81 8.99 8.19 9.51 8.84 9.72 -0.88 -9.05
Seasons are defined as: Summer (June – August), Fall (September – November), Winter (December – February), and Spring (March – May).
Source: Platts
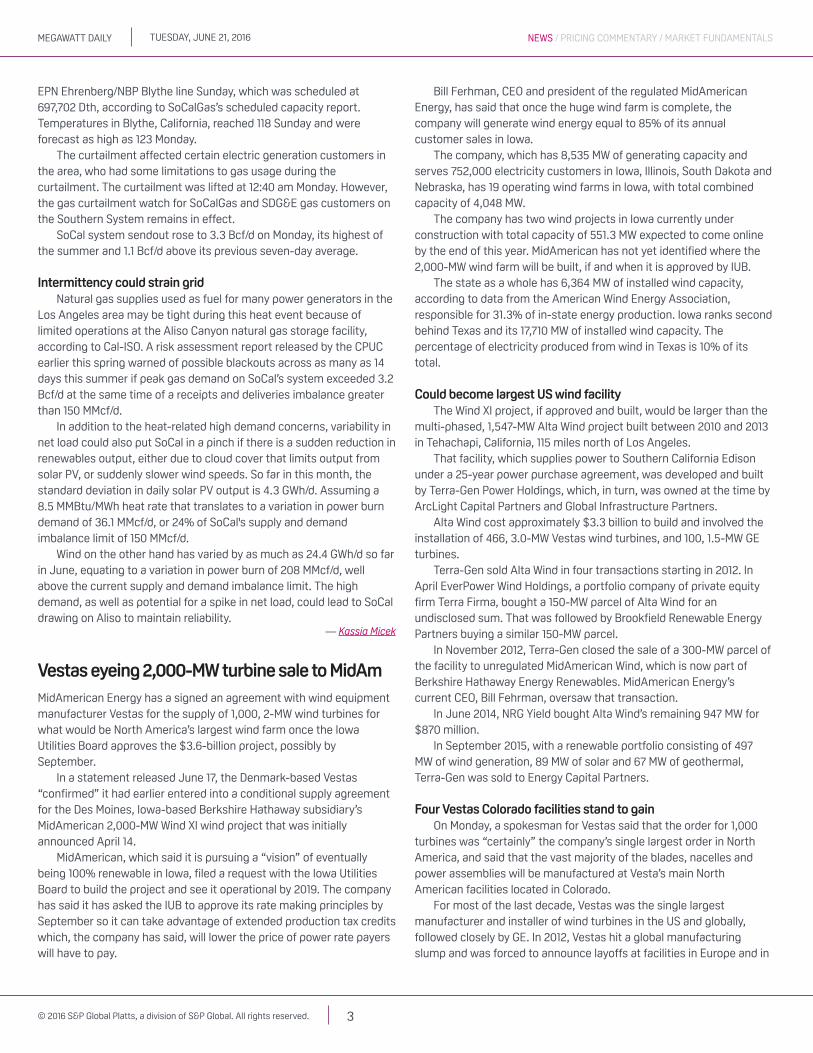
COAL-VS-GAS $/MWH FUEL COST RATIOS
The Platts coal-vs-gas fuel cost ratios indicate the regional competitiveness of gas versus coal for power generation. The ratio is calculated by dividing the $/MWh fuel cost for coal by that of gas. Gas generation is cheaper than coal generation when the ratio is greater than one. All price data re�ects prompt month fuel contracts.
Source: Platts daily OTC coal prices and M2MS gas prices
0.5
1.0
1.5
2.0
2.5
3.0
17-Jun19-May21-Apr23-Mar24-Feb26-Jan24-Dec
Into SouthernPJM WestMISO Indiana
SPP SouthERCOT NorthThreshold
(continued on page 2)
(continued on page 3)
(continued on page 4)
(continued on page 5)
(continued on page 6)
Tuesday, June 21, 2016MegawaTT daily
2© 2016 S&P Global Platts, a division of S&P Global. All rights reserved.
NEWS / PRICING COMMENTARY / MARkET FuNdAMENTAls
Officers of the Corporation: Harold McGraw III, Chairman; doug Peterson, President and Chief Executive Officer; david Goldenberg, Acting General Counsel; Jack F. Callahan Jr., Executive Vice President and Chief Financial Officer; Elizabeth O’Melia, senior Vice President, Treasury Operations.
Megawatt Daily Questions? Email:[email protected]
Manager North America Gas and Power ContentRocco Canonica, +1-720-264-6626Matthew Eversman, +1-713-655-2238Beth Mckay, +1-713-655-2258Anne swedberg, +1-720-264-6728
EditorsJeff Ryser, +1-713-658-3225Mark Watson, +1-713-658-3214
Spot Market EditorsCaitlin laird, +1-713-658-3217kassia Micek, +1-713-655-2227Eric Wieser, +1-202-383-2092
AnalystsGeorge McGuirkJonathan Nelson
Director, Global Gas & Power PricingMark Callahan
Director, Global Gas & Power ContentJames O’Connell
Global Editorial Director, Gas and Powersimon Thorne
Manager, Advertisement Saleskacey Comstock
Volume 21 / Issue 118 / Tuesday, June 21, 2016
Chief Content OfficerMartin Fraenkel
Platts PresidentImogen dillon Hatcher
IssN:
AdvertisingTel : +1-720-264-6631
1088-4319
MEGAWATT DAILY
© 2016 S&P Global Platts, a division of S&P Global. All rights reserved.
To reach Platts: E-mail:[email protected]; North America: Tel:800-PlATTs-8; latin America: Tel:+54-11-4121-4810; Europe & Middle East: Tel:+44-20-7176-6111; Asia Pacific: Tel:+65-6530-6430
Restrictions on Use: You may use the prices, indexes, assessments and other related information (collectively, “data”) in this publication only for your personal use or, if your company has a license from Platts and you are an “Authorized user,” for your company’s internal business. You may not publish, reproduce, distribute, retransmit, resell, create any derivative work from and/or otherwise provide access to data or any portion thereof to any person (either within or outside your company including, but not limited to, via or as part of any internal electronic system or Internet site), firm or entity, other than as authorized by a separate license from Platts, including without limitation any subsidiary, parent or other entity that is affiliated with your company, it being understood that any approved use or distribution of the data beyond the express uses authorized in this paragraph above is subject to the payment of additional fees to Platts.
Disclaimer: dATA IN THIs PuBlICATION Is BAsEd ON MATERIAls COllECTEd FROM ACTuAl MARkET PARTICIPANTs. PlATTs, ITs AFFIlIATEs ANd All OF THEIR THIRd-PARTY lICENsORs dIsClAIM ANY ANd All WARRANTIEs, EXPREss OR IMPlIEd, INCludING, BuT NOT lIMITEd TO, ANY WARRANTIEs OF MERCHANTABIlITY OR FITNEss FOR A PARTICulAR PuRPOsE OR usE As TO THE dATA, OR THE REsulTs OBTAINEd BY ITs usE OR As TO THE PERFORMANCE THEREOF. A REFERENCE TO A PARTICulAR INVEsTMENT, sECuRITY, RATING OR ANY OBsERVATION CONCERNING A sECuRITY OR INVEsTMENT PROVIdEd IN THE dATA Is NOT A
RECOMMENdATION TO BuY, sEll OR HOld suCH INVEsTMENT OR sECuRITY OR MAkE ANY OTHER INVEsTMENT dECIsIONs. NEITHER PlATTs, NOR ITs AFFIlIATEs OR THEIR THIRd-PARTY lICENsORs GuARANTEE THE AdEQuACY, ACCuRACY, TIMElINEss OR COMPlETENEss OF THE dATA OR ANY COMPONENT THEREOF OR ANY COMMuNICATIONs, INCludING BuT NOT lIMITEd TO ORAl OR WRITTEN COMMuNICATIONs (WHETHER IN ElECTRONIC OR OTHER FORMAT), WITH REsPECT THERETO.
ACCORdINGlY, ANY usER OF THE dATA sHOuld NOT RElY ON ANY RATING OR OTHER OPINION CONTAINEd THEREIN IN MAkING ANY INVEsTMENT OR OTHER dECIsION. PlATTs, ITs AFFIlIATEs ANd THEIR THIRd-PARTY lICENsORs sHAll NOT BE suBJECT TO ANY dAMAGEs OR lIABIlITY FOR ANY ERRORs, OMIssIONs OR dElAYs IN THE dATA. THE dATA ANd All COMPONENTs THEREOF ARE PROVIdEd ON AN “As Is” BAsIs ANd YOuR usE OF THE dATA Is AT YOuR OWN RIsk.
Limitation of Liability: IN NO EVENT WHATsOEVER sHAll PlATTs, ITs AFFIlIATEs OR THEIR THIRd-PARTY lICENsORs BE lIABlE FOR ANY INdIRECT, sPECIAl, INCIdENTAl, PuNITIVE OR CONsEQuENTIAl dAMAGEs, INCludING BuT NOT lIMITEd TO lOss OF PROFITs, TRAdING lOssEs, OR lOsT TIME OR GOOdWIll, EVEN IF THEY HAVE BEEN AdVIsEd OF THE POssIBIlITY OF suCH dAMAGEs, WHETHER IN CONTRACT, TORT, sTRICT lIABIlITY OR OTHERWIsE.
Permission is granted for those registered with the Copyright Clearance Center (CCC) to photocopy material herein for internal reference or personal use only, provided that appropriate payment is made to the CCC, 222 Rosewood drive, danvers, MA 01923, phone (978) 750-8400. Reproduction in any other form, or for any other purpose, is forbidden without express permission of s&P Global. For article reprints contact: The YGs Group, phone +1-717-505-9701 x105. Text-only archives available on dialog File 624, data star, Factiva, lexisNexis, and Westlaw.
Megawatt Daily is published daily by Platts, a division of s&P Global, registered office: Two Penn Plaza, 25th Floor, New York, N.Y. 10121-2298.
News
Cal-isO faces heat wave with little aliso helpSo far the Southern California grid has performed well amid the hottest temperatures in decades in the first severe test since the Aliso Canyon natural gas storage facility was taken nearly out of operation following a leak.
California remains on a restricted maintenance operations notice Tuesday due to anticipation of high power loads across the grid and as a gas curtailment watch remains in effect, according to the California Independent System Operator.
Market participants are cautioned to avoid actions which may jeopardize generator availability. Cal-ISO projected demand to peak around 45,350 MW Monday, which would be the highest load so far in 2016, and 45,100 MW Tuesday before slipping to around 40,525 MW Wednesday. In comparison, last year's demand peaked at 47,358 MW on September 10, 2015. The all-time peak record is 50,270 MW set in July 2006.
Temperatures across the Southwest were forecast as high as 120 degrees Monday and up to 115 Tuesday and Wednesday, according to The Weather Channel’s excessive heat warning for Southern California and the Southwest states. The highest temperature recorded in California was 134 in Death Valley, California, on July 10, 1913, which is also the current hottest air temperature on record on Earth, according to The Weather Channel.
Monday sets highest price year to dateSP15 day-ahead on-peak hit a nearly $20 premium to the North at
$56.65/MWh for Monday delivery, the highest price so far in 2016. It
shed $8 to about $46.75/MWh on IntercontinentalExchange for Tuesday delivery.
The SP15 15-minute market on-peak was trading around $85/MWh on ICE Monday with a bid-offer range of $75/MWh to $125/MWh. On Friday, SP15 FMM on-peak had a bid at $65/MWh.
Regional gas prices for flow over the weekend and Monday also popped in anticipation of the heat wave. At SoCal Gas, Friday prices for flow through the weekend were $2.85/MMBtu, up 44 cents, or 18%, from Thursday and 24% from the prior seven-day average. At PG&E Citygate, Friday prices were up 20 cents, or 8%, from Thursday at $2.76/MMBtu.
A flex alert, a voluntary call for consumers to conserve electricity, was put into effect for 10 am to 9 pm PDT Monday with temperatures forecast as high as 109 across parts of California, according to the ISO. As of Platts’ Monday’s deadline, CAISO had not issued a flex alert for Tuesday.
“We are closely monitoring conditions and evaluating whether one needs to be issued,” CAISO Spokeswoman Anne Gonzales said.
Heat pushes power burn to YTd highThe heat wave across the Southwest pushed regional power burn
to its year-to-date high Monday, and SoCal was forced to curtail power generation in part of its system.
An emergency localized curtailment for electric generation customers of San Diego Gas & Electric went into effect at 8 pm Sunday due to an outage of the Blythe compressor station, according to a SoCalGas notice. There was no apparent interruption in flow on the
Tuesday, June 21, 2016MegawaTT daily
3© 2016 S&P Global Platts, a division of S&P Global. All rights reserved.
NEWS / PRICING COMMENTARY / MARkET FuNdAMENTAls
EPN Ehrenberg/NBP Blythe line Sunday, which was scheduled at 697,702 Dth, according to SoCalGas’s scheduled capacity report. Temperatures in Blythe, California, reached 118 Sunday and were forecast as high as 123 Monday.
The curtailment affected certain electric generation customers in the area, who had some limitations to gas usage during the curtailment. The curtailment was lifted at 12:40 am Monday. However, the gas curtailment watch for SoCalGas and SDG&E gas customers on the Southern System remains in effect.
SoCal system sendout rose to 3.3 Bcf/d on Monday, its highest of the summer and 1.1 Bcf/d above its previous seven-day average.
intermittency could strain gridNatural gas supplies used as fuel for many power generators in the
Los Angeles area may be tight during this heat event because of limited operations at the Aliso Canyon natural gas storage facility, according to Cal-ISO. A risk assessment report released by the CPUC earlier this spring warned of possible blackouts across as many as 14 days this summer if peak gas demand on SoCal’s system exceeded 3.2 Bcf/d at the same time of a receipts and deliveries imbalance greater than 150 MMcf/d.
In addition to the heat-related high demand concerns, variability in net load could also put SoCal in a pinch if there is a sudden reduction in renewables output, either due to cloud cover that limits output from solar PV, or suddenly slower wind speeds. So far in this month, the standard deviation in daily solar PV output is 4.3 GWh/d. Assuming a 8.5 MMBtu/MWh heat rate that translates to a variation in power burn demand of 36.1 MMcf/d, or 24% of SoCal's supply and demand imbalance limit of 150 MMcf/d.
Wind on the other hand has varied by as much as 24.4 GWh/d so far in June, equating to a variation in power burn of 208 MMcf/d, well above the current supply and demand imbalance limit. The high demand, as well as potential for a spike in net load, could lead to SoCal drawing on Aliso to maintain reliability.
— Kassia Micek
Vestas eyeing 2,000-Mw turbine sale to MidamMidAmerican Energy has a signed an agreement with wind equipment manufacturer Vestas for the supply of 1,000, 2-MW wind turbines for what would be North America’s largest wind farm once the Iowa Utilities Board approves the $3.6-billion project, possibly by September.
In a statement released June 17, the Denmark-based Vestas “confirmed” it had earlier entered into a conditional supply agreement for the Des Moines, Iowa-based Berkshire Hathaway subsidiary’s MidAmerican 2,000-MW Wind XI wind project that was initially announced April 14.
MidAmerican, which said it is pursuing a “vision” of eventually being 100% renewable in Iowa, filed a request with the Iowa Utilities Board to build the project and see it operational by 2019. The company has said it has asked the IUB to approve its rate making principles by September so it can take advantage of extended production tax credits which, the company has said, will lower the price of power rate payers will have to pay.
Bill Ferhman, CEO and president of the regulated MidAmerican Energy, has said that once the huge wind farm is complete, the company will generate wind energy equal to 85% of its annual customer sales in Iowa.
The company, which has 8,535 MW of generating capacity and serves 752,000 electricity customers in Iowa, Illinois, South Dakota and Nebraska, has 19 operating wind farms in Iowa, with total combined capacity of 4,048 MW.
The company has two wind projects in Iowa currently under construction with total capacity of 551.3 MW expected to come online by the end of this year. MidAmerican has not yet identified where the 2,000-MW wind farm will be built, if and when it is approved by IUB.
The state as a whole has 6,364 MW of installed wind capacity, according to data from the American Wind Energy Association, responsible for 31.3% of in-state energy production. Iowa ranks second behind Texas and its 17,710 MW of installed wind capacity. The percentage of electricity produced from wind in Texas is 10% of its total.
Could become largest Us wind facilityThe Wind XI project, if approved and built, would be larger than the
multi-phased, 1,547-MW Alta Wind project built between 2010 and 2013 in Tehachapi, California, 115 miles north of Los Angeles.
That facility, which supplies power to Southern California Edison under a 25-year power purchase agreement, was developed and built by Terra-Gen Power Holdings, which, in turn, was owned at the time by ArcLight Capital Partners and Global Infrastructure Partners.
Alta Wind cost approximately $3.3 billion to build and involved the installation of 466, 3.0-MW Vestas wind turbines, and 100, 1.5-MW GE turbines.
Terra-Gen sold Alta Wind in four transactions starting in 2012. In April EverPower Wind Holdings, a portfolio company of private equity firm Terra Firma, bought a 150-MW parcel of Alta Wind for an undisclosed sum. That was followed by Brookfield Renewable Energy Partners buying a similar 150-MW parcel.
In November 2012, Terra-Gen closed the sale of a 300-MW parcel of the facility to unregulated MidAmerican Wind, which is now part of Berkshire Hathaway Energy Renewables. MidAmerican Energy’s current CEO, Bill Fehrman, oversaw that transaction.
In June 2014, NRG Yield bought Alta Wind’s remaining 947 MW for $870 million.
In September 2015, with a renewable portfolio consisting of 497 MW of wind generation, 89 MW of solar and 67 MW of geothermal, Terra-Gen was sold to Energy Capital Partners.
Four Vestas Colorado facilities stand to gainOn Monday, a spokesman for Vestas said that the order for 1,000
turbines was “certainly” the company’s single largest order in North America, and said that the vast majority of the blades, nacelles and power assemblies will be manufactured at Vesta’s main North American facilities located in Colorado.
For most of the last decade, Vestas was the single largest manufacturer and installer of wind turbines in the US and globally, followed closely by GE. In 2012, Vestas hit a global manufacturing slump and was forced to announce layoffs at facilities in Europe and in
Tuesday, June 21, 2016MegawaTT daily
4© 2016 S&P Global Platts, a division of S&P Global. All rights reserved.
NEWS / PRICING COMMENTARY / MARkET FuNdAMENTAls
the US.With China hitting an installation level last year of 30,000 MW,
which brought its total at the end of the year to 145,104 MW of installed wind capacity, according to the Global Wind Energy Council, it is not surprising that China’s top turbine manufacture, Goldwind Science & Technology, has pushed past GE and is in a near dead heat with Vestas in terms of market share of onshore wind grid-connected installations in 2015.
According to Chicago-based MAKE Consulting, Vestas had a 13.3% share of the 58,000 MW onshore grid-connected global market in 2015, followed by Goldwin with 12% and GE with 11%. On June 17, it was announced that Spain’s number four ranked Gamesa, which had a 6.2% market share in 2015, signed an agreement to merge its wind power business with Germany’s Siemens, which ranked seventh in 2015 with a 4.9% market share.
According to Vestas, it saw manufacturing and shipments from its four facilities in Colorado grow 70% over the prior year, thanks to the big push by wind developers to complete as many projects as they could to insure they qualified for the 2.3 cents/kWh federal production tax credits that are good for ten years. Total wind installations in the US in 2015 were 8,598 MW.
The company has a blade factory in Windsor, Colorado, a blade and nacelle factory in Brighton and a tower factory in Pueblo.
The extension of the PTC pushed through Congress in December and laid out in greater detail by the US Internal Revenue Service in May, should both stimulate and stabilize the wind industry through 2023, analysts have said.
This should help Vestas, which gets roughly a third of all of its sales in the US. In an April 29 first-quarter earnings report, Vestas said it had “a record-high Q1 order intake” of 2,403 MW, which was 653 MW, or 37% higher than in Q1 2015.
— Jeffrey Ryser
iea sees slowdown in Us gas demand growthAfter a period of strong growth, the US is likely to see much slower gas demand growth over the next six years, driven mostly by power sector dynamics, according to an International Energy Agency official.
The US is likely to witness something akin to what Europe has already seen — lower power demand coinciding with substantial growth in low-carbon sources that outpaces that of electricity generation overall, Costanza Jacazio, a senior gas expert, said Monday.
Jacazio was presenting recent findings of IEA's 2016 medium-term global gas market outlook at a forum held by the Global Center on Energy Policy at Columbia University in New York.
IEA expects 150 TWh of total generation growth in the US from 2015 to 2021, but it sees the thermal generation, i.e. gas and coal-fired generation combined, contracting by about 100 TWh. While the closure of some coal capacity will leave some room for gas to increase, "there is a much smaller pie for thermal generation growth in total, which we think will result in stagnation in gas demand," Jacazio said.
The IEA report, released earlier this month, also tempered projections for gas demand globally. It said global demand would rise about 1.5%/year between 2015 and 2021, down from last year's projection for 2%/year growth for that period.
Key reasons for the shift are the decline in primary energy growth driven by factors such as the reduced energy intensity of the world economy, along with challenges facing gas in competing with cheap coal, even as renewables become less expensive and continue to receive support from government policies, she said.
China will continue to drive the global growth in demand, she said, attributing its slower growth in 2015 to temporary factors and suggesting that environmental policy has potential to drive significant coal-to-gas switching there. IEA put China's growth at about 9%/year for 2016 to 2021, lower than the 15% per annum over the last six years but more than the 4% seen in 2015.
For Europe, IEA projected gas demand growth would stabilize. In Korea and Japan, it sees demand declining from 2015 to 2021, although that forecast is sensitive to expectations about nuclear capacity.
Turning to the production side, Jacazio said the US and Australia combined are expected to account for more than half the global growth, while traditional exporters such as Qatar, Russia and ASEAN will make up a smaller share of export production, moving from about one third from 2009 to 2015 to closer to 5%.
Us production more sensitive to external marketsUS production is expected to stagnate in 2016 and recover
modestly in 2017, she said, driven by falling associated gas production and slower growth elsewhere. A rebalancing of oil market prices through 2021 will do the heavy lifting in improving gas production, she said.
With modest increases in prices, it may be possible to regenerate a substantial amount of growth post-2018 as the oil market starts to rebalance, she said. IEA expects US gas production to account for one third of global production growth through 2021, she said.
Breaking with the pattern over the past six years, most new US production will feed exports, rather than domestic demand, she said, making the US more sensitive to what happens in external markets.
Turning to those markets, she said a key takeaway of the IEA report was that European gas markets will experience substantial competition, well beyond what it has seen in the past, among producers such as the US, Qatar and Russia seeking to gain access to its consumers. US capacity will put pressure on other producers to become more flexible in pricing strategies if they want to maintain market share.
in lng sector, a shift in customersIEA sees substantial new liquefaction capacity over the next five
years, with growth of about 45%, roughly 190 Bcm, with most coming from Australia and the US.
But there is a key potential change in who takes the incremental demand, Jacazio said. While Korea and Japan have accounted for 45% of incremental imports, under IEA assumptions they would decline about 10 Bcm, creating major space for other players.
"We see substantial growth in China and India" and expect lower prices to stimulate demand in price-sensitive counties, she said. If, as IEA assumes, Japan and Korea do not add much in baseload demand, exporters might need to chase customers such as Pakistan and Egypt and potentially the Philippines and Vietnam, she said.
Even so, she said, the number-one risk factor for gas demand
Tuesday, June 21, 2016MegawaTT daily
5© 2016 S&P Global Platts, a division of S&P Global. All rights reserved.
NEWS / PRICING COMMENTARY / MARkET FuNdAMENTAls
globally is coal policy in China, noting that a 1% change in coal use there is equivalent to two big LNG trains. Policies favorable to gas are more likely if prices remain low she said. A key question for the gas industry's future in the Asian market will be whether those countries perceive the abundance, security and sustainability of gas prices as attractive enough to make long-term decisions on environmental policies and the energy mix that are advantageous for gas, she said.
The shift in who is buying LNG also may have the ripple effect of further delaying how long it takes for contracts to be signed and investments in LNG facilities to go through, she said, suggesting there could be three years of very low investment. If demand recovers by 2025, then the period following could feature a tighter market. "I think this is a real risk," she said.
Addressing the overall LNG market, she said IEA expects it will start to balance by 2021, though it is not likely to be as tight as it was in 2011 and 2012. One risk factor to that projection would be a growing trend in capacity being offline because of feed-gas security issues, she said.
— Maya Weber
Power storage push draws differing reactions ANALYSIS The White House and academics in recent weeks have raised the volume of the discussion about energy storage's value in power markets, with differing reactions from power market professionals and observers.
On Thursday, the Obama administration conducted a "Summit on Scaling Renewable Energy and Storage with Smart Markets," in which the administration announced executive actions and 33 state and private-sector commitments designed to add at least 1.3 GW of energy storage over the next five years.
On June 13, Nature Climate Change published an article, "Value of storage technologies for wind and solar energy," which concluded that optimally sized energy storage can already add value to solar and wind generation in California and Texas. The article's authors included Jessika Trancik of the Santa Fe Institute of Santa Fe, New Mexico, and William Braff and Joshua Mueller, both from the Massachusetts Institute of Technology
In May, two other MIT researchers, Jesse Jenkins and Audun Botterud, worked with Fernando de Sisternes of the Argonne National Laboratory in Argonne, Illinois, (where Botterud is on the research staff), to produce another article, "The value of energy storage in decarbonizing the electricity sector," in another journal, Applied Energy. The article concluded, in effect, that a zero-carbon grid requires no energy storage, if enough flexible nuclear power generation is available to help balance the grid with a high penetration of intermittent renewables.
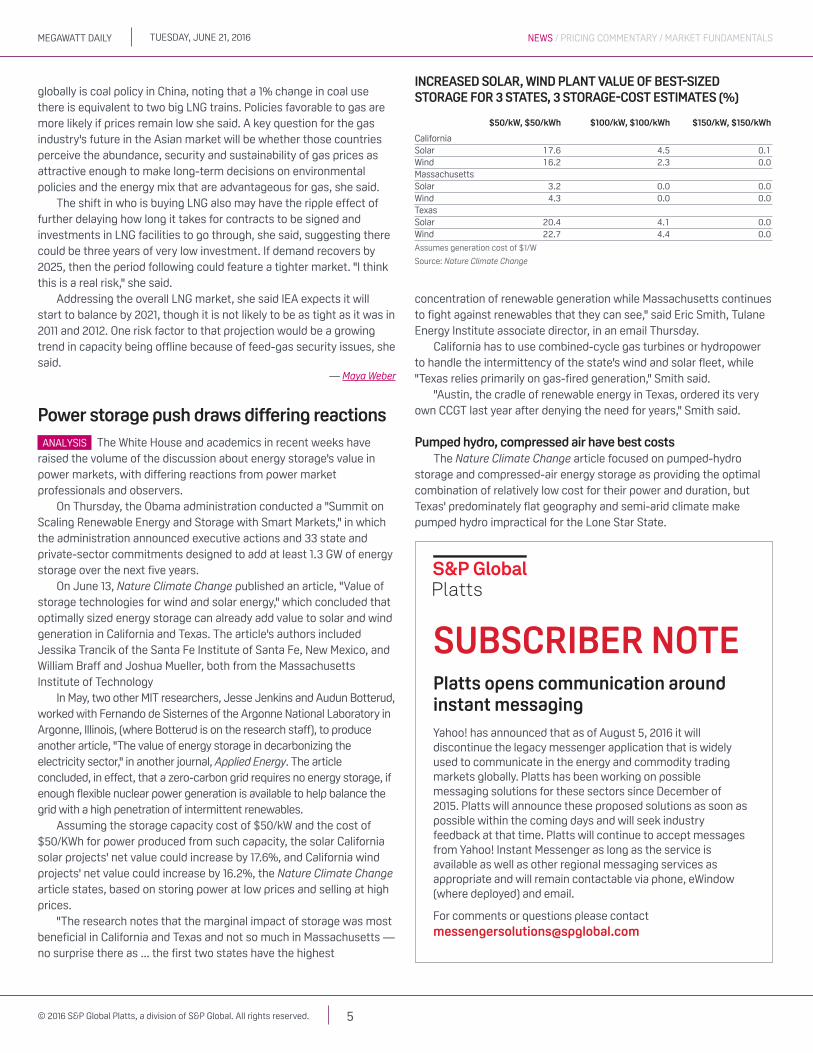
Assuming the storage capacity cost of $50/kW and the cost of $50/KWh for power produced from such capacity, the solar California solar projects' net value could increase by 17.6%, and California wind projects' net value could increase by 16.2%, the Nature Climate Change article states, based on storing power at low prices and selling at high prices.
"The research notes that the marginal impact of storage was most beneficial in California and Texas and not so much in Massachusetts — no surprise there as ... the first two states have the highest
concentration of renewable generation while Massachusetts continues to fight against renewables that they can see," said Eric Smith, Tulane Energy Institute associate director, in an email Thursday.
California has to use combined-cycle gas turbines or hydropower to handle the intermittency of the state's wind and solar fleet, while "Texas relies primarily on gas-fired generation," Smith said.
"Austin, the cradle of renewable energy in Texas, ordered its very own CCGT last year after denying the need for years," Smith said.
Pumped hydro, compressed air have best costsThe Nature Climate Change article focused on pumped-hydro
storage and compressed-air energy storage as providing the optimal combination of relatively low cost for their power and duration, but Texas' predominately flat geography and semi-arid climate make pumped hydro impractical for the Lone Star State.
increaseD solar, WinD plant value of best-sizeD storage for 3 states, 3 storage-cost estiMates (%) $50/kw, $50/kwh $100/kw, $100/kwh $150/kw, $150/kwh
California Solar 17.6 4.5 0.1Wind 16.2 2.3 0.0Massachusetts Solar 3.2 0.0 0.0Wind 4.3 0.0 0.0Texas Solar 20.4 4.1 0.0Wind 22.7 4.4 0.0
Assumes generation cost of $1/W
Source: Nature Climate Change
sUBsCRiBeR NOTePlatts opens communication around instant messagingYahoo! has announced that as of August 5, 2016 it will discontinue the legacy messenger application that is widely used to communicate in the energy and commodity trading markets globally. Platts has been working on possible messaging solutions for these sectors since December of 2015. Platts will announce these proposed solutions as soon as possible within the coming days and will seek industry feedback at that time. Platts will continue to accept messages from Yahoo! Instant Messenger as long as the service is available as well as other regional messaging services as appropriate and will remain contactable via phone, eWindow (where deployed) and email.
For comments or questions please [email protected]
Tuesday, June 21, 2016MegawaTT daily
6© 2016 S&P Global Platts, a division of S&P Global. All rights reserved.
NEWS / PRICING COMMENTARY / MARkET FuNdAMENTAls
Assuming the storage capacity cost of $50/kW and the cost of $50/KWh for power produced from such capacity, the solar California solar projects' net value could increase by 17.6%, and California wind projects' net value could increase by 16.2%, the Nature Climate Change article states, based on storing power at low prices and selling at high prices.
Under the same assumptions, Texas solar projects' net value could increase by 20.4% and wind projects by 22.7%, the article states. In contrast, Massachusetts solar projects' net value could increase by just 3.2%, and wind projects by 4.3%.
Stephen Naeve, COO at Houston's Apex Compressed Air Energy Storage, said, "Lower energy prices and higher ancillary prices resulting from high levels of wind production during low demand hours are what make CAES a good investment in today’s [Electric Reliability Council of Texas] market."
"Furthermore, the trend in ERCOT of increasingly higher levels of wind generation and more extreme prices (lower energy and higher ancillary services) is highly favorable for CAES," Naeve said in an email Monday.
In addition to recognizing the value of balancing a high-renewables energy grid, the Nature Climate Change article also focused on energy storage's ability to shift the time at which renewable power is sold from low-price periods of low demand or high supply, toward high-pride periods of high demand and low supply.
But the Nature Climate Change article also shows that as the assumptions for energy storage costs increase, energy storage's value decreases for renewable projects, and as the cost of renewable power decreases, so must the cost of storage, to make it economically beneficial.
Costs must dip for storage to 'make ... sense': expert"Unless storage is a lot cheaper than it is right now, it's not going to
make any sense," said Robert Fares, postdoctoral fellow in the Webber Energy Group and University of Texas Energy Institute.
"No, we're certainly not there yet when it comes to bulk energy shifting" from low-price periods to high-price periods, Fares said Friday, and the market for short-term ancillary services such as frequency regulation and power balancing "is very small."
In ERCOT, "merchant storage just does not seem to be able to pull together all of the revenue streams" to make the process profitable.
Dave Tuttle, UT Energy Institute research fellow, said, "Cheap natural gas isn't helping this."
"When power is cheap already, it's hard to take that cheap power and add cost to it and sell it," Tuttle added in an interview Friday.
Fares noted that storage does make sense in places such as Hawaii, which have substantially higher power prices than the mainland US.
Jeff McAulay, senior manager of strategic partnerships for distributed energy resources at EnerNOC, a provider of energy management software and services, said the PJM Interconnection is the independent system operator with the largest energy storage market, and data centers around the world have been deploying battery storage in places worldwide where lost power could impose high costs.
"We've seen the same type of evolving horizon in solar," McAulay said in an email Friday. "Technologies first make sense in an initial
market, then expand as costs come down. Same thing will be true of storage alone and solar plus storage."
Apex CAES' Naeve said that in addition to Texas, Southwest Power Pool may benefit from energy storage's ability to shift the time of renewable power sales and to provide ancillary services.
"Other markets in North America are trending toward higher renewable concentrations and may be attractive in the next 5 years, such as Colorado, the Pacific Northwest, Alberta, Saskatchewan, Ontario and western [Midcontinent Independent System Operator]," Naeve said.
— Mark Watson
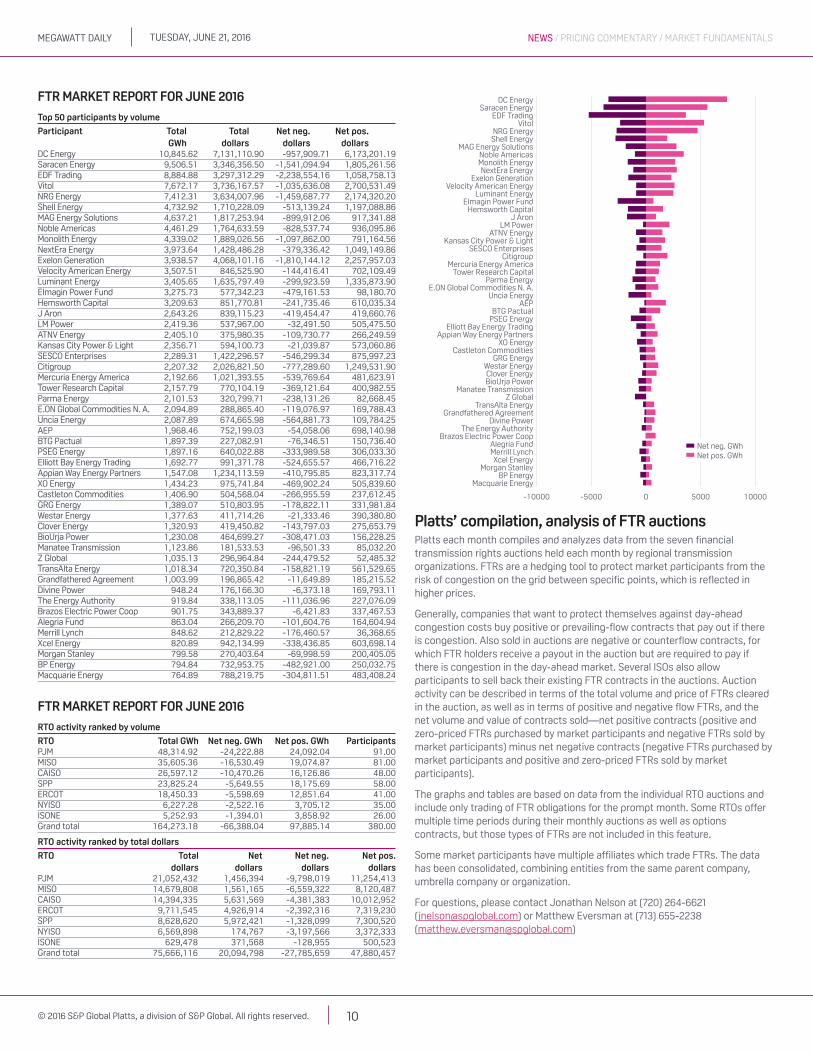
FTR volume and prices fall in June’s auctionTotal volume for prompt-month financial transmission rights obligations in all grid operators’ markets for June 2016 fell for the third consecutive time to 164,273 GWh, down 2,308 GWh from May but up 6,553 GWh from a year ago (see FTR Market Report, pages 10-13).
The absolute value of all FTR obligation contracts also fell month-on-month along with the lower cleared volumes to roughly $75.6 million, down $9.14 million from May, although up $3.21 million from a year ago, according to data from the independent system operators.
FTRs — also known as congestion revenue rights, transmission congestion contracts, and transmission congestion rights in some markets — are financial instruments that allow market participants to hedge against congestion on the electric grid. An FTR obligation
Advertisement
Trim the risk with your hedge
Nodal Exchange active traders enjoy free access to superior risk management services, including Straight-Through Processing (STP) of Trades, End of Day Price & Trade Data, and Margin & Position Limit Monitoring.
the next generation of power tradingnodal
(703) 962.9800 • nodalexchange.com
Tuesday, June 21, 2016MegawaTT daily
7© 2016 S&P Global Platts, a division of S&P Global. All rights reserved.
NEWS / PRICING COMMENTARY / MARkET FuNdAMENTAls
rggi carbon alloWance futures, Jun 17 ($/allowance)ICE Settlement Volume
Dec16 V15 5.75 0Dec17 V15 5.89 0Dec18 V15 6.09 0Dec16 V16 5.76 170Dec17 V16 5.90 0Dec18 V16 6.10 0Dec16 V17 5.76 0Dec17 V17 5.90 0Dec16 V18 5.76 0Dec17 V18 5.90 0Dec18 V18 6.10 0Dec19 V18 6.30 0
The Regional Greenhouse Gas Initiative is a carbon cap-and-trade program for power generators in nine Northeast and Mid-Atlantic US states. One RGGI allowance is equivalent to one short ton of CO2. The volume listed is the number of futures contracts traded. Each futures contract represents 1,000 RGGI allowances.
dailY CsaPR allOwaNCe assessMeNTs, JUN 20 ($/st) $/st 2016 Range $/st 2017 Range
NOx Annual 25.00 5.00-45.00 25.00 5.00-45.00NOx Seasonal 225.00 200.00-250.00 225.00 200.00-250.00SO2 Group 1 2.00 1.00-5.00 2.00 1.00-5.00SO2 Group 2 3.50 1.00-6.00 3.50 1.00-6.00
contract entitles the contract owner to either be charged or receive compensation when there is congestion between specific points on the grid in day-ahead electricity markets.
The lower contract value was a result of lower overall prices for all contract types. The weighted average price for June positive contracts, both for buy and sell trade types and all hour types, was 49 cents/MWh, 12 cents lower than May’s weighted average contract price and 18 cents lower than a year ago. For negative contracts, both for buy and sell trade types and all hour types, the weighted average price was negative 38 cents/MWh, a 12-cent decline from May and a 14-cent decline from a year ago.
With FTRs, a positive price means that the contract buyer had to pay the ISO for the contract. A negative price means that buyers are being paid by the ISO to take on the risk of congestion in the opposite direction of the historical prevailing path flow.
isO New england, Cal-isO post modest gainsPositive contracts were discounted from May in every ISO except
for Cal-ISO and ISO-NE. In the Cal-ISO, prices were up 6 cents/MWh from May and 12 cents/MWh from a year ago. In ISO-NE prices were up 7 cents/MWh from May and unchanged from a year ago. Among the ISOs that experienced price declines, PJM experienced the most significant month-over-month declines with prices coming down 36% relative to May. MISO experienced the second most significant decline with weighted average prices clearing 27% lower relative to prices in May.
Focusing on negative contracts, prices were down in all ISOs with the exception of ERCOT and ISO-NE. Negative prices were up 407% from May, increasing to negative 28 cents/MWh. ERCOT saw slightly more modest increases, with weighted average prices for negative contracts rising 23% to negative 35 cents/MWh. Across the ISOs that saw price declines, the steepest was in SPP where prices for negative contracts slid 65% from the previous month.
Looking at the breakdown between contracts that were bought and sold, about 139,914 GWh of contracts were purchased in the prompt-month auction for June while 24,358 GWh of contracts were sold back to the ISOs.
ISOs also allow market participants to use the monthly auctions to sell off FTRs that they had acquired in previous auctions. Market participants receive funds for positively priced contracts they sell in the auction and must pay to sell off negatively priced FTRs.
Purchased contracts in June’s auctions were up 2,796 GWh from May, with ERCOT, MISO, NYISO, and SPP seeing increases in purchased volumes. For sold contracts, volumes were down 5,104 GWh with declines occurring in all ISOs except for MISO and NYISO.
Focusing on purchased contracts for specific hour types, positive on-peak contracts made up 36% of purchased contracts, up 4 percentage points from May’s auctions at the expense of lower market share for off-peak contracts in both the positive and negative price categories. In terms of total market value, purchased on-peak contracts comprised 45% of overall transactions with positive off-peak contracts accounting for the second largest share of transactions at 21%. For sold contracts, market share volumes for baseload and negative on-peak contracts climbed at the expense of lower market share for negative off-peak, and positive on- and off-peak contracts.
As for total market value, positive on-peak contracts comprised 41% of overall market value, up nearly 4 percentage points from May.
As for how the market participants stacked up this past auction cycle, DC Energy claimed the first place spot for acquiring the most gigawatt-hours’ worth of contracts with a total portfolio volume of 10,845 GWh and total spend of $7.13 million. In second place was Saracen Energy with a total portfolio volume of 9,506 GWh and total spend of $3.35 million. EDF Trading came in third place with a total volume of 8,884 GWh and total spend of $3.30 million. Following with the firm’s established trend of buying more negative contracts than positives, the EDF procured 2,238 GWh worth of negative contracts and only 1,059 GWh of positive contracts.
— Jonathan Nelson
aPs likely to see low plant prices: UBsWith a surplus of natural gas-fired merchant generation in the Southwest, UBS Securities expects Arizona Public Service to be able to buy low-cost generation through the utility’s pending request for proposals.
APS customers stand to benefit from the overbuild in the region, UBS said in a report released late Friday. “We think the best chance for these assets remains to be acquired by utilities and entered into ratebase, rather than further capacity and energy tolling” contracts, the report said.
Phoenix-based APS in March issued an all-source RFP for 400 MW to 600 MW that could be available by June 1, 2020. Bids were due June 9.
Recent Arizona power plant transactions have averaged $533/kW but UBS said it expects future transactions to be “materially lower,” partly because the power plants are mainly only needed from May through September, and for handling intermittent generation.
Arizona has seven merchant natural gas-fired power plants totaling
Tuesday, June 21, 2016MegawaTT daily
8© 2016 S&P Global Platts, a division of S&P Global. All rights reserved.
NEWS / PRICING COMMENTARY / MARkET FuNdAMENTAls
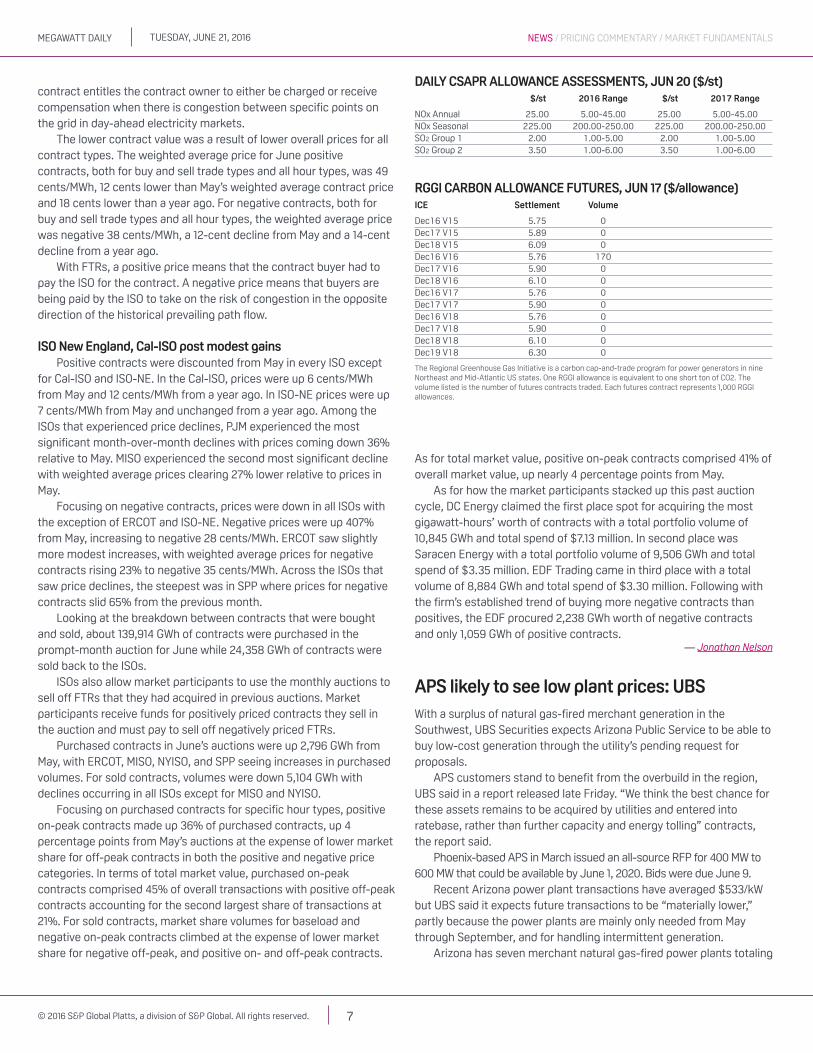
OUTAGES
generation unit outage reportPlant/Operator Cap Fuel state status Return shut
Northeast
Atikokan/OPG 205 b Ont. MO Unk 06/09/16Beck-2 PGS 103 h Ont. MO Unk 04/11/16Bruce-3/Bruce Power 780 n Ont. PMO Unk 05/02/16Darlington-4/OPG 875 n Ont. MO Unk 04/08/16Lake Superior/Brookfield 120 g Ont. PMO Unk 11/04/14Lennox-2/OPG 525 g Ont. MO Unk 03/03/16Millstone-3/Dominion 1235 n CT MO Unk 06/13/16Pickering-8/OPG 500 n Ont. MO Unk 01/08/16
PJM & MisO
Salem-1/PSEG 1174 n NJ PMO Unk 04/15/16Susquehanna-1/Talen 1282 n PA PMO Unk 06/07/16
southeast & Central
west
Henrietta/SunPower 100 s Calif. MO Unk 06/16/16Ivanpah-2/NRG 133 s Calif. MO Unk 04/20/16La Paloma-4/La Paloma 260 g Calif. PMO Unk 03/01/16LaRosita/Intergen 180 g Mex. PMO Unk 05/30/16Ormond-2/NRG 775 g Calif. MO Unk 05/25/16Pio Pico-1/Apex 103 g Calif. PMO Unk 06/05/16Pio Pico-2/Apex 103 g Calif. MO Unk 05/26/16Pio Pico-3/Apex 103 g Calif. MO Unk 05/26/16Solar Star-1/BHE 310 s Calif. MO Unk 05/30/16Sutter/Calpine 525 g Calif. MO Unk 06/06/16Tranquility/SOCO 200 s Calif. PMO Unk 06/06/16
Daily generation outage references: MO=unplanned maintenance outage; RF=refueling outage; PMO=planned maintenance outage; Unk=unknown; OA=offline/available. Fuels: Nuclear=n; Coal=c; Natural gas=g; Hydro=h ; Wind=w; Solar=s
Sources: Generation owners, public information and other market sources.
6,725 MW, according to the UBS report. The plants were built in the early 2000s during an upswing in the merchant cycle. After they were built, the robust load growth in Arizona slowed and power prices have dropped recently on low natural gas prices.
The entire 2017-2020 around-the-clock forward curve for the Palo Verde hub is below $30/MWh, among the lowest price in traded markets, according to UBS.
UBs sees plant values below $200/kwBeyond the APS solicitation, UBS said power plant valuation will
likely be below $200/kW, outside of utility acquisitions. “The question is whether the steady trend back towards utility held consolidation will enable companies to acquire at discounted prices,” UBS said.
Most recently, NV Energy agreed to buy Calpine's 550-MW, natural gas-fired South Point power plant near Bullhead City, Arizona. Without disclosing the purchase price, NV Energy and Calpine told the US Federal Energy Regulatory Commission earlier this month that the deal presents a “unique value” to NV Energy's customers (EC16-130). UBS estimates the plant’s value at about $130 million.
The South Point merchant facility, which started operating in 2001, has been operating at a loss in the oversupplied Southwest market and will likely exit the market if the proposed transaction does not close, according to the filing. Calpine has been unable to land a long-term contract for the plant in the last five years, the filing said.
Star West Generation owns the 577-MW Arlington Valley and the 570-MW Griffiths power plants that are under contract to APS and NV Energy during the summer months through September 2019 and 2017, respectively. The plants could potentially be bought by the two utilities, according to UBS.
In its report, UBS noted that Talen Energy has considered moving its 1,040-MW Harquahala plant in Arizona, but the equity firm doubts it is a realistic option given the $300/kW to $400/kW in transportation costs.
California also feels market ‘distress’The market distress extends beyond Arizona to other less
competitive markets, according to UBS. Recent deals in California, for example, appear to be in the $100/kW range, the report said.
Other uncontracted plants in the West to keep an eye on include Calpine’s 635-MW Hermiston facility in Oregon and its 605-MW Metcalf plant in California, which UBS values at $250/kW.
Dynegy is trying to sell its California portfolio, which includes two plants totaling 1,664 MW. UBS pegs their value at about $163 million.
The market for natural gas-fired power plants in the West could improve, according to UBS. For example, Nevada’s gaming industry is leading an effort to effectively restructure the state again for larger consumers. Under state law, large customers are allowed to shop for power and two casino companies have asked the Nevada Public Utilities Commission for permission to leave their incumbent utility, NV Energy. Increased shopping could create more robust demand for merchant generation, according to UBS.
On the downside for merchant generators, the emerging Western energy imbalance market, which is set to include APS later this year, could reduce energy prices by making the grid system more efficient, according to the report.
— Ethan Howland
Firstenergy new rate plan protested at FeRCOhio's utility consumer watchdog is mounting a formal protest at the US Federal Energy Regulatory Commission over a "virtual power purchase agreement" it claims FirstEnergy filed with state regulators to get around an April 27 ruling by the federal agency that effectively blocked a proposed PPA covering more than 3,000 MW of coal and nuclear generation.
In its April decision, FERC rescinded affiliate waivers for both FirstEnergy and American Electric Power for PPA agreements the Ohio Public Utilities Commission approved on March 31.
FirstEnergy and AEP argued the separate PPAs were needed to ensure reliability, supply diversity and protect customers in the future from volatile wholesale market prices.
FirstEnergy also maintained the PPA would avoid an estimated $4.1 billion in electric transmission projects that would be needed if the older coal and nuclear plants were forced to retire.
The Ohio Consumers' Counsel and other customer groups, however, argued the PPAs amounted to "subsidies" and should be rejected.
Soon after the April ruling, FirstEnergy asked the PUC to approve a plan that retains monthly retail customer surcharges the PPA was designed to replace.
Firstenergy 'tellingly ... did not seek rehearing': OCCIn its Friday protest, the OCC and several communities in the
Northwest Ohio Aggregation Coalition asked FERC to "issue a further order to prevent FirstEnergy from circumventing the requirements [of

Tuesday, June 21, 2016MegawaTT daily
9© 2016 S&P Global Platts, a division of S&P Global. All rights reserved.
NEWS / PRICING COMMENTARY / MARkET FuNdAMENTAls
the April order] and the commission's affiliate restrictions."OCC said FirstEnergy "tellingly ... did not seek rehearing of the April
27 order. Instead, it immediately went to work on the virtual PPA as a means of evading the strictures of the April 27 order and the commission's affiliate restrictions."
In its refiled application with the PUC, FirstEnergy proposed "a narrow change' that essentially "replaces the affiliate PPA with the virtual PPA," OCC said.
Under the PPA, Akron-based FirstEnergy would have passed through to customers actual costs of the PPA units — the 2,233-MW Sammis coal plant and 908-MW Davis-Besse nuclear plant, both in Ohio, and the company's roughly 200-MW ownership in Ohio Valley Electric Corp.'s Kyger Creek and Clifty Creek coal plants in Ohio and Indiana, respectively.
"On rehearing," the OCC said, "the FirstEnergy utilties have proposed to substitute projected costs of the PPA units and projected volumes of re-sales into the PJM markets. The backing for the 'hedge' that the FirstEnergy Ohio utilities claim to be providing would be 'more generic' than the specific 3,256 MW of capacity from the PPA units."
Molly McGuire, an OCC spokeswoman for Consumers' Counsel Bruce Weston, said the consumer agency has asked federal officials, "who oversee the nation's electric system, to protect 1.9 million Ohio consumers regarding FirstEnergy's new proposal."
If FERC grants the request, FirstEnergy would be ordered to "show cause" why its new plan does not violate federal protections for consumers and competitive markets, she added.
FirstEnergy spokesman insisted in a Monday email that FERC has
no jurisdiction over his company's pending PUC application.
OCC says it wants to avoid $4.1B in additional charges"Our request is designed to be solely under the PUC's jurisdiction,"
Colafella said. "We were clearly disappointed by the FERC's order because our original proposal allowed us to achieve three important objectives — protect customers against future price increases, preserve vital baseload plants and avoid up to $4.1 billion in additional charges to Ohio customers for new transmission projects if plants prematurely retired."
FirstEnergy's modified proposal "will still allow us to provide a valuable hedge for our Ohio customers while keeping total bills below current levels in the first two years of the plan," he said.
Paul Patterson, a Glenrock Associates analyst in New York, said in a Monday email that while he was uncertain how FERC would respond to the OCC protest, "I think it might be pushing it to say it's a 'virtual PPA.' ''
Essentially, FirstEnergy's PUC application is a retail proceeding at this point, Patterson said. As a result, he does know know if the federal agency will agree with OCC's argument that FERC should get involved in the case.
"And although the revised FE 'hedge' may seem to be an effort to avoid FERC affiliate transaction concerns, I am not sure it won't succeed," Patterson concluded.
The PUC is expected to issue a final order on FirstEnergy's revised application later this summer.
— Bob Matyi
Tuesday, June 21, 2016MegawaTT daily
10© 2016 S&P Global Platts, a division of S&P Global. All rights reserved.
NEWS / PRICING COMMENTARY / MARkET FuNdAMENTAls
FTR MaRkeT RePORT FOR JUNe 2016
Top 50 participants by volume
Participant Total Total Net neg. Net pos. gWh dollars dollars dollarsDC Energy 10,845.62 7,131,110.90 -957,909.71 6,173,201.19Saracen Energy 9,506.51 3,346,356.50 -1,541,094.94 1,805,261.56EDF Trading 8,884.88 3,297,312.29 -2,238,554.16 1,058,758.13Vitol 7,672.17 3,736,167.57 -1,035,636.08 2,700,531.49NRG Energy 7,412.31 3,634,007.96 -1,459,687.77 2,174,320.20Shell Energy 4,732.92 1,710,228.09 -513,139.24 1,197,088.86MAG Energy Solutions 4,637.21 1,817,253.94 -899,912.06 917,341.88Noble Americas 4,461.29 1,764,633.59 -828,537.74 936,095.86Monolith Energy 4,339.02 1,889,026.56 -1,097,862.00 791,164.56NextEra Energy 3,973.64 1,428,486.28 -379,336.42 1,049,149.86Exelon Generation 3,938.57 4,068,101.16 -1,810,144.12 2,257,957.03Velocity American Energy 3,507.51 846,525.90 -144,416.41 702,109.49Luminant Energy 3,405.65 1,635,797.49 -299,923.59 1,335,873.90Elmagin Power Fund 3,275.73 577,342.23 -479,161.53 98,180.70Hemsworth Capital 3,209.63 851,770.81 -241,735.46 610,035.34J Aron 2,643.26 839,115.23 -419,454.47 419,660.76LM Power 2,419.36 537,967.00 -32,491.50 505,475.50ATNV Energy 2,405.10 375,980.35 -109,730.77 266,249.59Kansas City Power & Light 2,356.71 594,100.73 -21,039.87 573,060.86SESCO Enterprises 2,289.31 1,422,296.57 -546,299.34 875,997.23Citigroup 2,207.32 2,026,821.50 -777,289.60 1,249,531.90Mercuria Energy America 2,192.66 1,021,393.55 -539,769.64 481,623.91Tower Research Capital 2,157.79 770,104.19 -369,121.64 400,982.55Parma Energy 2,101.53 320,799.71 -238,131.26 82,668.45E.ON Global Commodities N. A. 2,094.89 288,865.40 -119,076.97 169,788.43Uncia Energy 2,087.89 674,665.98 -564,881.73 109,784.25AEP 1,968.46 752,199.03 -54,058.06 698,140.98BTG Pactual 1,897.39 227,082.91 -76,346.51 150,736.40PSEG Energy 1,897.16 640,022.88 -333,989.58 306,033.30Elliott Bay Energy Trading 1,692.77 991,371.78 -524,655.57 466,716.22Appian Way Energy Partners 1,547.08 1,234,113.59 -410,795.85 823,317.74XO Energy 1,434.23 975,741.84 -469,902.24 505,839.60Castleton Commodities 1,406.90 504,568.04 -266,955.59 237,612.45GRG Energy 1,389.07 510,803.95 -178,822.11 331,981.84Westar Energy 1,377.63 411,714.26 -21,333.46 390,380.80Clover Energy 1,320.93 419,450.82 -143,797.03 275,653.79BioUrja Power 1,230.08 464,699.27 -308,471.03 156,228.25Manatee Transmission 1,123.86 181,533.53 -96,501.33 85,032.20Z Global 1,035.13 296,964.84 -244,479.52 52,485.32TransAlta Energy 1,018.34 720,350.84 -158,821.19 561,529.65Grandfathered Agreement 1,003.99 196,865.42 -11,649.89 185,215.52Divine Power 948.24 176,166.30 -6,373.18 169,793.11The Energy Authority 919.84 338,113.05 -111,036.96 227,076.09Brazos Electric Power Coop 901.75 343,889.37 -6,421.83 337,467.53Alegria Fund 863.04 266,209.70 -101,604.76 164,604.94Merrill Lynch 848.62 212,829.22 -176,460.57 36,368.65Xcel Energy 820.89 942,134.99 -338,436.85 603,698.14Morgan Stanley 799.58 270,403.64 -69,998.59 200,405.05BP Energy 794.84 732,953.75 -482,921.00 250,032.75Macquarie Energy 764.89 788,219.75 -304,811.51 483,408.24
FTR MaRkeT RePORT FOR JUNe 2016
RTO activity ranked by volume
rto total gWh net neg. gWh net pos. gWh participantsPJM 48,314.92 -24,222.88 24,092.04 91.00MISO 35,605.36 -16,530.49 19,074.87 81.00CAISO 26,597.12 -10,470.26 16,126.86 48.00SPP 23,825.24 -5,649.55 18,175.69 58.00ERCOT 18,450.33 -5,598.69 12,851.64 41.00NYISO 6,227.28 -2,522.16 3,705.12 35.00ISONE 5,252.93 -1,394.01 3,858.92 26.00Grand total 164,273.18 -66,388.04 97,885.14 380.00
RTO activity ranked by total dollars
RTO Total Net Net neg. Net pos. dollars dollars dollars dollarsPJM 21,052,432 1,456,394 -9,798,019 11,254,413MISO 14,679,808 1,561,165 -6,559,322 8,120,487CAISO 14,394,335 5,631,569 -4,381,383 10,012,952ERCOT 9,711,545 4,926,914 -2,392,316 7,319,230SPP 8,628,620 5,972,421 -1,328,099 7,300,520NYISO 6,569,898 174,767 -3,197,566 3,372,333ISONE 629,478 371,568 -128,955 500,523Grand total 75,666,116 20,094,798 -27,785,659 47,880,457
-10000 -5000 0 5000 10000
Macquarie EnergyBP Energy
Morgan StanleyXcel Energy
Merrill LynchAlegria Fund
Brazos Electric Power CoopThe Energy Authority
Divine PowerGrandfathered Agreement
TransAlta EnergyZ Global
Manatee TransmissionBioUrja PowerClover Energy
Westar EnergyGRG Energy
Castleton CommoditiesXO Energy
Appian Way Energy PartnersElliott Bay Energy Trading
PSEG EnergyBTG Pactual
AEPUncia Energy
E.ON Global Commodities N. A.Parma Energy
Tower Research CapitalMercuria Energy America
CitigroupSESCO Enterprises
Kansas City Power & LightATNV Energy
LM PowerJ Aron
Hemsworth CapitalElmagin Power Fund
Luminant EnergyVelocity American Energy
Exelon GenerationNextEra Energy
Monolith EnergyNoble Americas
MAG Energy SolutionsShell EnergyNRG Energy
VitolEDF Trading
Saracen EnergyDC Energy
Net neg. GWhNet pos. GWh
Platts’ compilation, analysis of FTR auctionsPlatts each month compiles and analyzes data from the seven financial transmission rights auctions held each month by regional transmission organizations. FTRs are a hedging tool to protect market participants from the risk of congestion on the grid between specific points, which is reflected in higher prices.
Generally, companies that want to protect themselves against day-ahead congestion costs buy positive or prevailing-flow contracts that pay out if there is congestion. Also sold in auctions are negative or counterflow contracts, for which FTR holders receive a payout in the auction but are required to pay if there is congestion in the day-ahead market. Several ISOs also allow participants to sell back their existing FTR contracts in the auctions. Auction activity can be described in terms of the total volume and price of FTRs cleared in the auction, as well as in terms of positive and negative flow FTRs, and the net volume and value of contracts sold—net positive contracts (positive and zero-priced FTRs purchased by market participants and negative FTRs sold by market participants) minus net negative contracts (negative FTRs purchased by market participants and positive and zero-priced FTRs sold by market participants).
The graphs and tables are based on data from the individual RTO auctions and include only trading of FTR obligations for the prompt month. Some RTOs offer multiple time periods during their monthly auctions as well as options contracts, but those types of FTRs are not included in this feature.
Some market participants have multiple affiliates which trade FTRs. The data has been consolidated, combining entities from the same parent company, umbrella company or organization.
For questions, please contact Jonathan Nelson at (720) 264-6621 ([email protected]) or Matthew Eversman at (713) 655-2238 ([email protected])
Tuesday, June 21, 2016MegawaTT daily
11© 2016 S&P Global Platts, a division of S&P Global. All rights reserved.
NEWS / PRICING COMMENTARY / MARkET FuNdAMENTAls
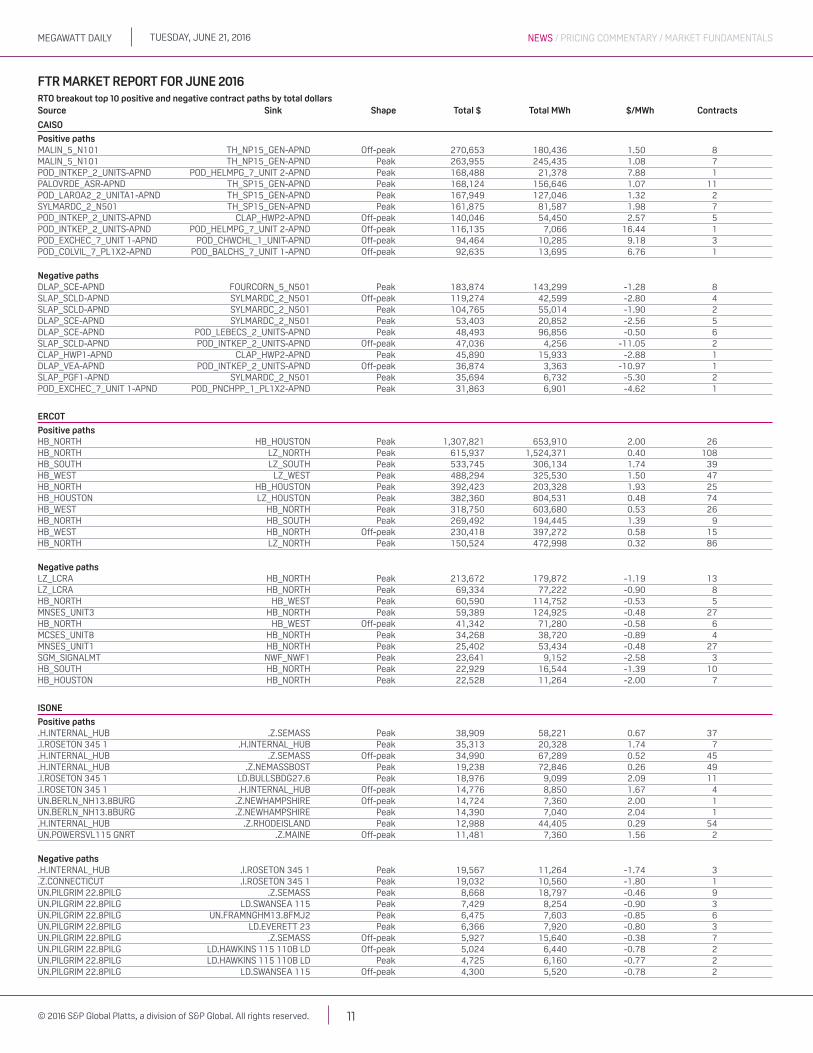
FTR MaRkeT RePORT FOR JUNe 2016RTO breakout top 10 positive and negative contract paths by total dollarssource sink shape Total $ Total Mwh $/Mwh Contracts
CaisO
Positive pathsMALIN_5_N101 TH_NP15_GEN-APND Off-peak 270,653 180,436 1.50 8MALIN_5_N101 TH_NP15_GEN-APND Peak 263,955 245,435 1.08 7POD_INTKEP_2_UNITS-APND POD_HELMPG_7_UNIT 2-APND Peak 168,488 21,378 7.88 1PALOVRDE_ASR-APND TH_SP15_GEN-APND Peak 168,124 156,646 1.07 11POD_LAROA2_2_UNITA1-APND TH_SP15_GEN-APND Peak 167,949 127,046 1.32 2SYLMARDC_2_N501 TH_SP15_GEN-APND Peak 161,875 81,587 1.98 7POD_INTKEP_2_UNITS-APND CLAP_HWP2-APND Off-peak 140,046 54,450 2.57 5POD_INTKEP_2_UNITS-APND POD_HELMPG_7_UNIT 2-APND Off-peak 116,135 7,066 16.44 1POD_EXCHEC_7_UNIT 1-APND POD_CHWCHL_1_UNIT-APND Off-peak 94,464 10,285 9.18 3POD_COLVIL_7_PL1X2-APND POD_BALCHS_7_UNIT 1-APND Off-peak 92,635 13,695 6.76 1
Negative pathsDLAP_SCE-APND FOURCORN_5_N501 Peak 183,874 143,299 -1.28 8SLAP_SCLD-APND SYLMARDC_2_N501 Off-peak 119,274 42,599 -2.80 4SLAP_SCLD-APND SYLMARDC_2_N501 Peak 104,765 55,014 -1.90 2DLAP_SCE-APND SYLMARDC_2_N501 Peak 53,403 20,852 -2.56 5DLAP_SCE-APND POD_LEBECS_2_UNITS-APND Peak 48,493 96,856 -0.50 6SLAP_SCLD-APND POD_INTKEP_2_UNITS-APND Off-peak 47,036 4,256 -11.05 2CLAP_HWP1-APND CLAP_HWP2-APND Peak 45,890 15,933 -2.88 1DLAP_VEA-APND POD_INTKEP_2_UNITS-APND Off-peak 36,874 3,363 -10.97 1SLAP_PGF1-APND SYLMARDC_2_N501 Peak 35,694 6,732 -5.30 2POD_EXCHEC_7_UNIT 1-APND POD_PNCHPP_1_PL1X2-APND Peak 31,863 6,901 -4.62 1
eRCOT
Positive pathsHB_NORTH HB_HOUSTON Peak 1,307,821 653,910 2.00 26HB_NORTH LZ_NORTH Peak 615,937 1,524,371 0.40 108HB_SOUTH LZ_SOUTH Peak 533,745 306,134 1.74 39HB_WEST LZ_WEST Peak 488,294 325,530 1.50 47HB_NORTH HB_HOUSTON Peak 392,423 203,328 1.93 25HB_HOUSTON LZ_HOUSTON Peak 382,360 804,531 0.48 74HB_WEST HB_NORTH Peak 318,750 603,680 0.53 26HB_NORTH HB_SOUTH Peak 269,492 194,445 1.39 9HB_WEST HB_NORTH Off-peak 230,418 397,272 0.58 15HB_NORTH LZ_NORTH Peak 150,524 472,998 0.32 86
Negative pathsLZ_LCRA HB_NORTH Peak 213,672 179,872 -1.19 13LZ_LCRA HB_NORTH Peak 69,334 77,222 -0.90 8HB_NORTH HB_WEST Peak 60,590 114,752 -0.53 5MNSES_UNIT3 HB_NORTH Peak 59,389 124,925 -0.48 27HB_NORTH HB_WEST Off-peak 41,342 71,280 -0.58 6MCSES_UNIT8 HB_NORTH Peak 34,268 38,720 -0.89 4MNSES_UNIT1 HB_NORTH Peak 25,402 53,434 -0.48 27SGM_SIGNALMT NWF_NWF1 Peak 23,641 9,152 -2.58 3HB_SOUTH HB_NORTH Peak 22,929 16,544 -1.39 10HB_HOUSTON HB_NORTH Peak 22,528 11,264 -2.00 7
isONe
Positive paths.H.INTERNAL_HUB .Z.SEMASS Peak 38,909 58,221 0.67 37.I.ROSETON 345 1 .H.INTERNAL_HUB Peak 35,313 20,328 1.74 7.H.INTERNAL_HUB .Z.SEMASS Off-peak 34,990 67,289 0.52 45.H.INTERNAL_HUB .Z.NEMASSBOST Peak 19,238 72,846 0.26 49.I.ROSETON 345 1 LD.BULLSBDG27.6 Peak 18,976 9,099 2.09 11.I.ROSETON 345 1 .H.INTERNAL_HUB Off-peak 14,776 8,850 1.67 4UN.BERLN_NH13.8BURG .Z.NEWHAMPSHIRE Off-peak 14,724 7,360 2.00 1UN.BERLN_NH13.8BURG .Z.NEWHAMPSHIRE Peak 14,390 7,040 2.04 1.H.INTERNAL_HUB .Z.RHODEISLAND Peak 12,988 44,405 0.29 54UN.POWERSVL115 GNRT .Z.MAINE Off-peak 11,481 7,360 1.56 2
Negative paths.H.INTERNAL_HUB .I.ROSETON 345 1 Peak 19,567 11,264 -1.74 3.Z.CONNECTICUT .I.ROSETON 345 1 Peak 19,032 10,560 -1.80 1UN.PILGRIM 22.8PILG .Z.SEMASS Peak 8,668 18,797 -0.46 9UN.PILGRIM 22.8PILG LD.SWANSEA 115 Peak 7,429 8,254 -0.90 3UN.PILGRIM 22.8PILG UN.FRAMNGHM13.8FMJ2 Peak 6,475 7,603 -0.85 6UN.PILGRIM 22.8PILG LD.EVERETT 23 Peak 6,366 7,920 -0.80 3UN.PILGRIM 22.8PILG .Z.SEMASS Off-peak 5,927 15,640 -0.38 7UN.PILGRIM 22.8PILG LD.HAWKINS 115 110B LD Off-peak 5,024 6,440 -0.78 2UN.PILGRIM 22.8PILG LD.HAWKINS 115 110B LD Peak 4,725 6,160 -0.77 2UN.PILGRIM 22.8PILG LD.SWANSEA 115 Off-peak 4,300 5,520 -0.78 2
Tuesday, June 21, 2016MegawaTT daily
12© 2016 S&P Global Platts, a division of S&P Global. All rights reserved.
NEWS / PRICING COMMENTARY / MARkET FuNdAMENTAls
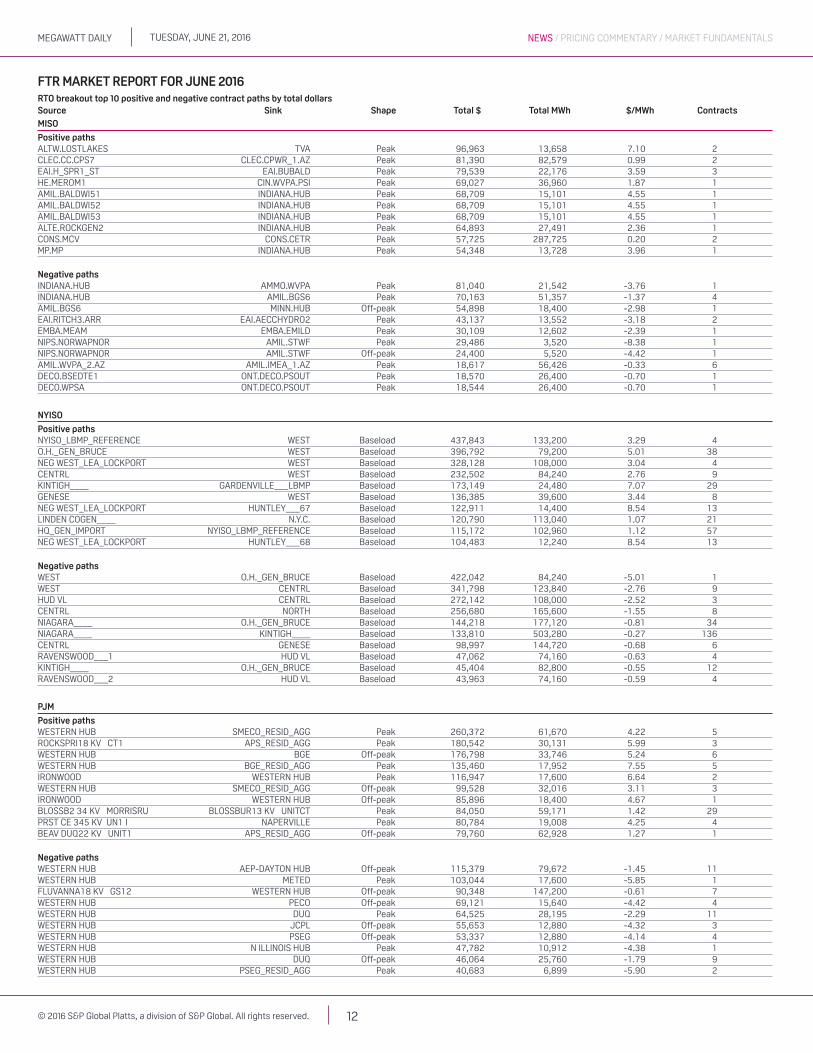
MisO
Positive pathsALTW.LOSTLAKES TVA Peak 96,963 13,658 7.10 2CLEC.CC.CPS7 CLEC.CPWR_1.AZ Peak 81,390 82,579 0.99 2EAI.H_SPR1_ST EAI.BUBALD Peak 79,539 22,176 3.59 3HE.MEROM1 CIN.WVPA.PSI Peak 69,027 36,960 1.87 1AMIL.BALDWI51 INDIANA.HUB Peak 68,709 15,101 4.55 1AMIL.BALDWI52 INDIANA.HUB Peak 68,709 15,101 4.55 1AMIL.BALDWI53 INDIANA.HUB Peak 68,709 15,101 4.55 1ALTE.ROCKGEN2 INDIANA.HUB Peak 64,893 27,491 2.36 1CONS.MCV CONS.CETR Peak 57,725 287,725 0.20 2MP.MP INDIANA.HUB Peak 54,348 13,728 3.96 1
Negative pathsINDIANA.HUB AMMO.WVPA Peak 81,040 21,542 -3.76 1INDIANA.HUB AMIL.BGS6 Peak 70,163 51,357 -1.37 4AMIL.BGS6 MINN.HUB Off-peak 54,898 18,400 -2.98 1EAI.RITCH3.ARR EAI.AECCHYDRO2 Peak 43,137 13,552 -3.18 2EMBA.MEAM EMBA.EMILD Peak 30,109 12,602 -2.39 1NIPS.NORWAPNOR AMIL.STWF Peak 29,486 3,520 -8.38 1NIPS.NORWAPNOR AMIL.STWF Off-peak 24,400 5,520 -4.42 1AMIL.WVPA_2.AZ AMIL.IMEA_1.AZ Peak 18,617 56,426 -0.33 6DECO.BSEDTE1 ONT.DECO.PSOUT Peak 18,570 26,400 -0.70 1DECO.WPSA ONT.DECO.PSOUT Peak 18,544 26,400 -0.70 1
NYisO
Positive pathsNYISO_LBMP_REFERENCE WEST Baseload 437,843 133,200 3.29 4O.H._GEN_BRUCE WEST Baseload 396,792 79,200 5.01 38NEG WEST_LEA_LOCKPORT WEST Baseload 328,128 108,000 3.04 4CENTRL WEST Baseload 232,502 84,240 2.76 9KINTIGH____ GARDENVILLE___LBMP Baseload 173,149 24,480 7.07 29GENESE WEST Baseload 136,385 39,600 3.44 8NEG WEST_LEA_LOCKPORT HUNTLEY___67 Baseload 122,911 14,400 8.54 13LINDEN COGEN____ N.Y.C. Baseload 120,790 113,040 1.07 21HQ_GEN_IMPORT NYISO_LBMP_REFERENCE Baseload 115,172 102,960 1.12 57NEG WEST_LEA_LOCKPORT HUNTLEY___68 Baseload 104,483 12,240 8.54 13
Negative pathsWEST O.H._GEN_BRUCE Baseload 422,042 84,240 -5.01 1WEST CENTRL Baseload 341,798 123,840 -2.76 9HUD VL CENTRL Baseload 272,142 108,000 -2.52 3CENTRL NORTH Baseload 256,680 165,600 -1.55 8NIAGARA____ O.H._GEN_BRUCE Baseload 144,218 177,120 -0.81 34NIAGARA____ KINTIGH____ Baseload 133,810 503,280 -0.27 136CENTRL GENESE Baseload 98,997 144,720 -0.68 6RAVENSWOOD___1 HUD VL Baseload 47,062 74,160 -0.63 4KINTIGH____ O.H._GEN_BRUCE Baseload 45,404 82,800 -0.55 12RAVENSWOOD___2 HUD VL Baseload 43,963 74,160 -0.59 4
PJM
Positive pathsWESTERN HUB SMECO_RESID_AGG Peak 260,372 61,670 4.22 5ROCKSPRI18 KV CT1 APS_RESID_AGG Peak 180,542 30,131 5.99 3WESTERN HUB BGE Off-peak 176,798 33,746 5.24 6WESTERN HUB BGE_RESID_AGG Peak 135,460 17,952 7.55 5IRONWOOD WESTERN HUB Peak 116,947 17,600 6.64 2WESTERN HUB SMECO_RESID_AGG Off-peak 99,528 32,016 3.11 3IRONWOOD WESTERN HUB Off-peak 85,896 18,400 4.67 1BLOSSB2 34 KV MORRISRU BLOSSBUR13 KV UNITCT Peak 84,050 59,171 1.42 29PRST CE 345 KV UN1 I NAPERVILLE Peak 80,784 19,008 4.25 4BEAV DUQ22 KV UNIT1 APS_RESID_AGG Off-peak 79,760 62,928 1.27 1
Negative pathsWESTERN HUB AEP-DAYTON HUB Off-peak 115,379 79,672 -1.45 11WESTERN HUB METED Peak 103,044 17,600 -5.85 1FLUVANNA18 KV GS12 WESTERN HUB Off-peak 90,348 147,200 -0.61 7WESTERN HUB PECO Off-peak 69,121 15,640 -4.42 4WESTERN HUB DUQ Peak 64,525 28,195 -2.29 11WESTERN HUB JCPL Off-peak 55,653 12,880 -4.32 3WESTERN HUB PSEG Off-peak 53,337 12,880 -4.14 4WESTERN HUB N ILLINOIS HUB Peak 47,782 10,912 -4.38 1WESTERN HUB DUQ Off-peak 46,064 25,760 -1.79 9WESTERN HUB PSEG_RESID_AGG Peak 40,683 6,899 -5.90 2
FTR MaRkeT RePORT FOR JUNe 2016RTO breakout top 10 positive and negative contract paths by total dollarssource sink shape Total $ Total Mwh $/Mwh Contracts
Tuesday, June 21, 2016MegawaTT daily
13© 2016 S&P Global Platts, a division of S&P Global. All rights reserved.
NEWS / PRICING COMMENTARY / MARkET FuNdAMENTAls
THe BaRRelThe Platts blog that spans the commodities spectrumRead and respond to posts from Platts editors and analysts on issues affecting a wide range of the world’s energy, petchem, and agriculture resources.
oil, natural gas, electricity and coal, steel and Metals, Petrochemicals, Biofuels and agriculture, Renewables
…as well as commentary, analysis and observations on everything from global politics, to market dynamics. The Barrel strives to be the world’s most complete commodities blog, and its comment section is always open for your thoughts.
Visit http://blogs.platts.com/ now!
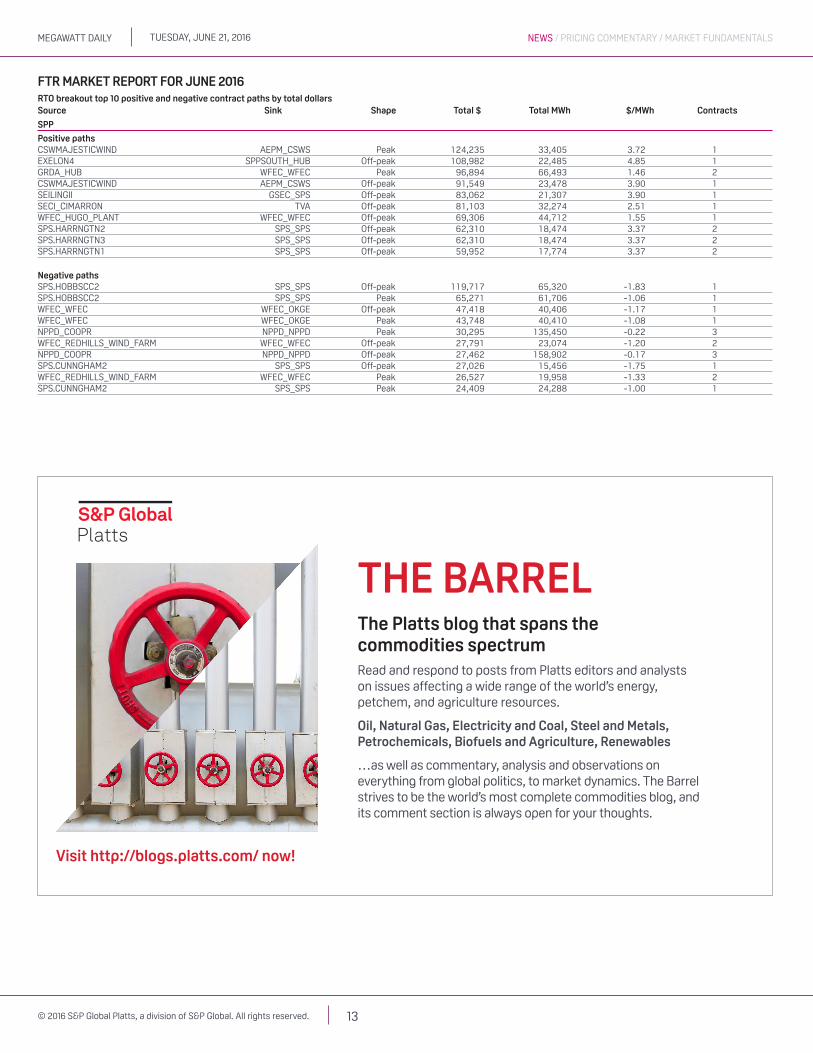
sPP
Positive pathsCSWMAJESTICWIND AEPM_CSWS Peak 124,235 33,405 3.72 1EXELON4 SPPSOUTH_HUB Off-peak 108,982 22,485 4.85 1GRDA_HUB WFEC_WFEC Peak 96,894 66,493 1.46 2CSWMAJESTICWIND AEPM_CSWS Off-peak 91,549 23,478 3.90 1SEILINGII GSEC_SPS Off-peak 83,062 21,307 3.90 1SECI_CIMARRON TVA Off-peak 81,103 32,274 2.51 1WFEC_HUGO_PLANT WFEC_WFEC Off-peak 69,306 44,712 1.55 1SPS.HARRNGTN2 SPS_SPS Off-peak 62,310 18,474 3.37 2SPS.HARRNGTN3 SPS_SPS Off-peak 62,310 18,474 3.37 2SPS.HARRNGTN1 SPS_SPS Off-peak 59,952 17,774 3.37 2
Negative pathsSPS.HOBBSCC2 SPS_SPS Off-peak 119,717 65,320 -1.83 1SPS.HOBBSCC2 SPS_SPS Peak 65,271 61,706 -1.06 1WFEC_WFEC WFEC_OKGE Off-peak 47,418 40,406 -1.17 1WFEC_WFEC WFEC_OKGE Peak 43,748 40,410 -1.08 1NPPD_COOPR NPPD_NPPD Peak 30,295 135,450 -0.22 3WFEC_REDHILLS_WIND_FARM WFEC_WFEC Off-peak 27,791 23,074 -1.20 2NPPD_COOPR NPPD_NPPD Off-peak 27,462 158,902 -0.17 3SPS.CUNNGHAM2 SPS_SPS Off-peak 27,026 15,456 -1.75 1WFEC_REDHILLS_WIND_FARM WFEC_WFEC Peak 26,527 19,958 -1.33 2SPS.CUNNGHAM2 SPS_SPS Peak 24,409 24,288 -1.00 1
FTR MaRkeT RePORT FOR JUNe 2016RTO breakout top 10 positive and negative contract paths by total dollarssource sink shape Total $ Total Mwh $/Mwh Contracts
Tuesday, June 21, 2016MegawaTT daily
14© 2016 S&P Global Platts, a division of S&P Global. All rights reserved.
NEWS / PRICING COMMENTARY / MARkET FuNdAMENTAlsNEWs / PRICING COMMENTARY / MARkET FuNdAMENTAls
NORTHeasT daY aHead POweR PRiCes ($/MWh)
Marginal spark spread Price change Prior 7-day Month Month Yearly changeHub/index symbol 21-Jun heat rate @7k @12k Chg % Chg average Min Max Jun-16 Jun-15 Chg % Chg
On-Peak
ISONE Internal Hub IINIM00 39.07 12705 17.54 2.17 3.68 10.4 27.34 16.98 39.07 24.25 24.34 -0.09 -0.4ISONE NE Mass-Boston IINNM00 44.79 14565 23.26 7.89 9.61 27.3 27.20 16.99 44.79 24.47 24.77 -0.30 -1.2ISONE Connecticut IINCM00 39.86 13209 18.74 3.65 3.68 10.2 27.94 17.34 39.86 24.68 25.36 -0.68 -2.7NYISO Zone G INYHM00 38.75 15313 21.04 8.38 0.52 1.4 28.60 20.38 38.75 27.11 28.84 -1.73 -6.0NYISO NYC Zone INYNM00 40.55 16023 22.83 10.18 2.21 5.8 29.15 22.34 40.55 27.97 30.36 -2.39 -7.9NYISO West Zone INYWM00 47.63 22849 33.04 22.62 -45.87 -49.1 48.02 19.18 93.50 35.00 30.91 4.09 13.2NYISO Capital Zone INYCM00 34.97 14013 17.50 5.02 -1.84 -5.0 26.73 15.82 36.81 24.94 24.21 0.73 3.0
Off-Peak
ISONE Internal Hub IINIP00 22.18 9095 5.11 -7.08 5.14 30.2 16.59 9.48 22.18 15.01 14.79 0.22 1.5ISONE NE Mass-Boston IINNP00 21.97 9008 4.90 -7.30 5.04 29.8 16.41 9.47 21.97 14.92 14.82 0.10 0.7ISONE Connecticut IINCP00 22.65 8915 4.87 -7.84 5.31 30.6 16.91 9.59 22.65 15.21 14.95 0.26 1.7NYISO Zone G INYHP00 20.94 9472 5.46 -5.59 1.15 5.8 17.11 11.54 20.94 16.13 13.95 2.18 15.6NYISO NYC Zone INYNP00 21.17 9576 5.69 -5.36 1.21 6.1 17.35 11.85 21.17 16.37 14.14 2.23 15.8NYISO West Zone INYWP00 19.44 10060 5.91 -3.75 0.25 1.3 13.71 6.85 19.44 12.72 11.96 0.76 6.4NYISO Capital Zone INYCP00 20.63 9026 4.63 -6.80 1.31 6.8 17.69 12.62 20.63 16.57 13.49 3.08 22.8
NORTHEAST AVG. DAY-AHEAD/REAL-TIME PEAK PRICE SPREAD
Source: Platts
($/MWh)
-150
-120
-90
-60
-30
0
30
19-Jun17-Jun15-Jun13-Jun10-Jun08-Jun06-Jun
NYISO Zone J NYISO Zone G NYISO Zone A NEPOOL Mass Hub
NORTHEAST PLATTS M2MS FORWARD CURVE: ON-PEAK
Source: Platts
($/MWh)
20
40
60
80
100
Jul-18Apr-18Jan-18Oct-17Jul-17Apr-17Jan-17Oct-16Jul-16
East NY ZnJ East NY ZnG West NY ZnA Mass Hub
NORTHEAST PLATTS M2MS LOCATIONAL SPREADS: ON-PEAK
Source: Platts
($/MWh)
-20
-10
0
10
20
30
40
Jul-18Apr-18Jan-18Oct-17Jul-17Apr-17Jan-17Oct-16Jul-16
NYISO ZnJ/NYISO ZnGNYISO ZnG/PJM WestNYISO ZnG/NEPOOL Mass Hub
NEPOOL Mass Hub/PJM WestNYISO G/NYISO A
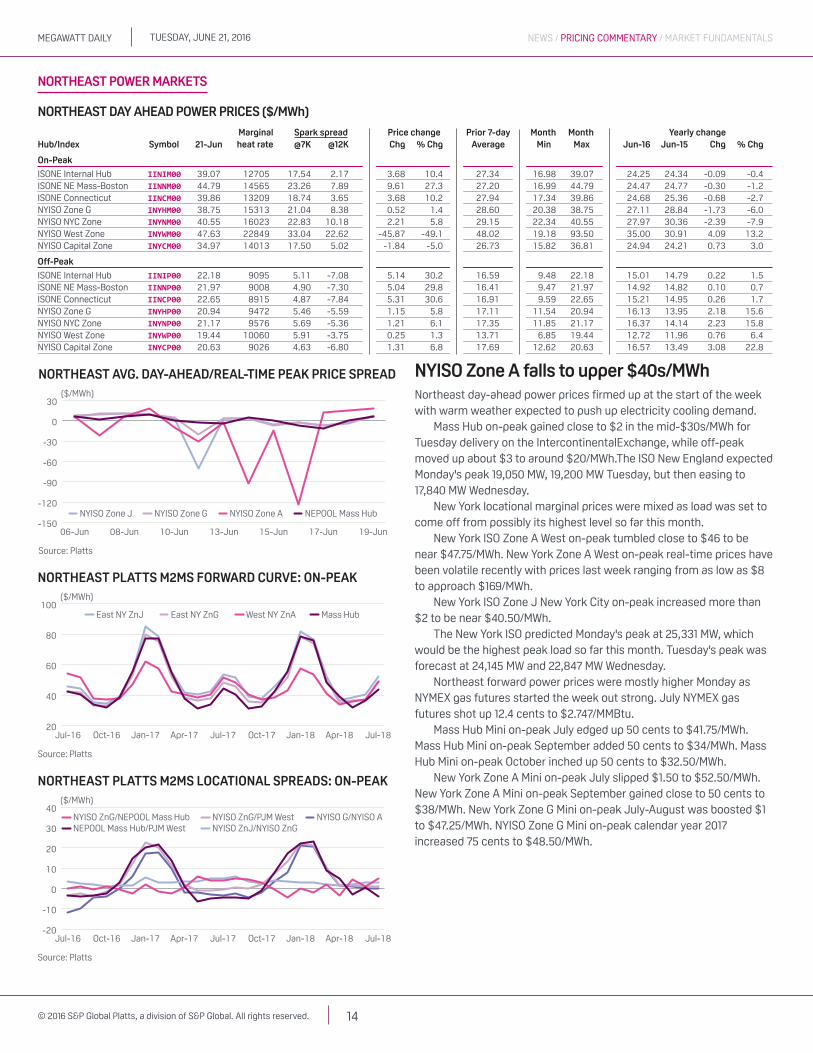
NYisO Zone a falls to upper $40s/MwhNortheast day-ahead power prices firmed up at the start of the week with warm weather expected to push up electricity cooling demand.
Mass Hub on-peak gained close to $2 in the mid-$30s/MWh for Tuesday delivery on the IntercontinentalExchange, while off-peak moved up about $3 to around $20/MWh.The ISO New England expected Monday's peak 19,050 MW, 19,200 MW Tuesday, but then easing to 17,840 MW Wednesday.
New York locational marginal prices were mixed as load was set to come off from possibly its highest level so far this month.
New York ISO Zone A West on-peak tumbled close to $46 to be near $47.75/MWh. New York Zone A West on-peak real-time prices have been volatile recently with prices last week ranging from as low as $8 to approach $169/MWh.
New York ISO Zone J New York City on-peak increased more than $2 to be near $40.50/MWh.
The New York ISO predicted Monday's peak at 25,331 MW, which would be the highest peak load so far this month. Tuesday's peak was forecast at 24,145 MW and 22,847 MW Wednesday.
Northeast forward power prices were mostly higher Monday as NYMEX gas futures started the week out strong. July NYMEX gas futures shot up 12.4 cents to $2.747/MMBtu.
Mass Hub Mini on-peak July edged up 50 cents to $41.75/MWh. Mass Hub Mini on-peak September added 50 cents to $34/MWh. Mass Hub Mini on-peak October inched up 50 cents to $32.50/MWh.
New York Zone A Mini on-peak July slipped $1.50 to $52.50/MWh. New York Zone A Mini on-peak September gained close to 50 cents to $38/MWh. New York Zone G Mini on-peak July-August was boosted $1 to $47.25/MWh. NYISO Zone G Mini on-peak calendar year 2017 increased 75 cents to $48.50/MWh.
Northeast PoWer MarKets
Tuesday, June 21, 2016MegawaTT daily
15© 2016 S&P Global Platts, a division of S&P Global. All rights reserved.
NEWS / PRICING COMMENTARY / MARkET FuNdAMENTAlsNEWs / PRICING COMMENTARY / MARkET FuNdAMENTAls
pJM/Miso Day aHeaD poWer prices ($/MWh)
Marginal spark spread Price change Prior 7-day Month Month Yearly ChangeHub/index symbol 21-Jun heat rate @7k @12k Chg % Chg average Min Max Jun-16 Jun-15 Chg % Chg
On-Peak
PJM AEP Dayton Hub IPADM00 32.17 13523 15.52 3.62 -7.58 -19.1 31.77 22.73 39.75 29.78 35.57 -5.79 -16.3PJM Dominion Hub IPDMM00 33.63 12579 14.92 1.55 -7.06 -17.4 32.55 25.56 40.69 31.12 40.16 -9.04 -22.5PJM Eastern Hub IPEHM00 47.32 22947 32.88 22.57 -0.48 -1.0 27.81 21.68 47.80 27.77 33.10 -5.33 -16.1PJM Northern Illinois Hub IPNIM00 31.75 11965 13.17 -0.09 -7.17 -18.4 31.39 21.74 38.92 29.25 30.79 -1.54 -5.0PJM Western Hub IPWHM00 35.48 16771 20.67 10.09 -9.25 -20.7 31.87 24.64 44.73 30.90 37.26 -6.36 -17.1MISO Indiana Hub IMIDM00 33.57 15058 17.96 6.82 -7.79 -18.8 33.65 24.10 41.36 31.37 31.67 -0.30 -0.9MISO Minnesota Hub IMINM00 31.07 12453 13.61 1.13 2.72 9.6 26.67 13.21 31.59 23.91 25.60 -1.69 -6.6
Off-Peak
PJM AEP Dayton Hub IPADP00 19.16 8590 3.55 -7.61 3.77 24.5 16.36 13.49 19.37 15.74 20.29 -4.55 -22.4PJM Dominion Hub IPDMP00 19.06 7508 1.29 -11.40 3.75 24.5 16.41 13.46 19.63 15.82 21.39 -5.57 -26.0PJM Eastern Hub IPEHP00 20.27 11564 8.00 -0.76 4.79 30.9 15.16 12.18 20.27 15.16 16.69 -1.53 -9.2PJM Northern Illinois Hub IPNIP00 18.74 7330 0.84 -11.94 3.70 24.6 16.09 10.68 19.12 15.11 16.26 -1.15 -7.1PJM Western Hub IPWHP00 19.24 9944 5.70 -3.98 4.24 28.3 16.01 13.12 19.24 15.62 20.18 -4.56 -22.6MISO Indiana Hub IMIDP00 20.29 9625 5.53 -5.01 0.26 1.3 19.07 14.64 20.42 18.02 19.24 -1.22 -6.3MISO Minnesota Hub IMINP00 17.59 7270 0.65 -11.44 1.98 12.7 15.73 9.59 18.00 14.39 14.55 -0.16 -1.1
PJM/MISO AVG. DAY-AHEAD/REAL-TIME PEAK PRICE SPREAD
Source: Platts
($/MWh)
-15
-12
-9
-6
-3
0
3
6
9
12
09-Nov19-Jun17-Jun15-Jun13-Jun10-Jun08-Jun06-Jun
MISO IndianaMISO Minnesota
PJM AD HubPJM NI HubPJM West Hub
PJM/MISO PLATTS M2MS FORWARD CURVE: ON-PEAK
Source: Platts
($/MWh)
30
35
40
45
50
55
60
65
Jul-18Apr-18Jan-18Oct-17Jul-17Apr-17Jan-17Oct-16Jul-16
PJM AEP/Dayton PJM NI Hub MISO Ind. Hub PJM West
PJM/MISO PLATTS M2MS LOCATIONAL SPREADS: ON-PEAK
Source: Platts
($/MWh)
-12
-9
-6
-3
0
3
6
9
12
15
Jul-18Apr-18Jan-18Oct-17Jul-17Apr-17Jan-17Oct-16Jul-16
PJM West/MISO Ind. HubPJM West/PJM AD Hub
PJM West/PJM NI HubPJM West/NYISO ZnA
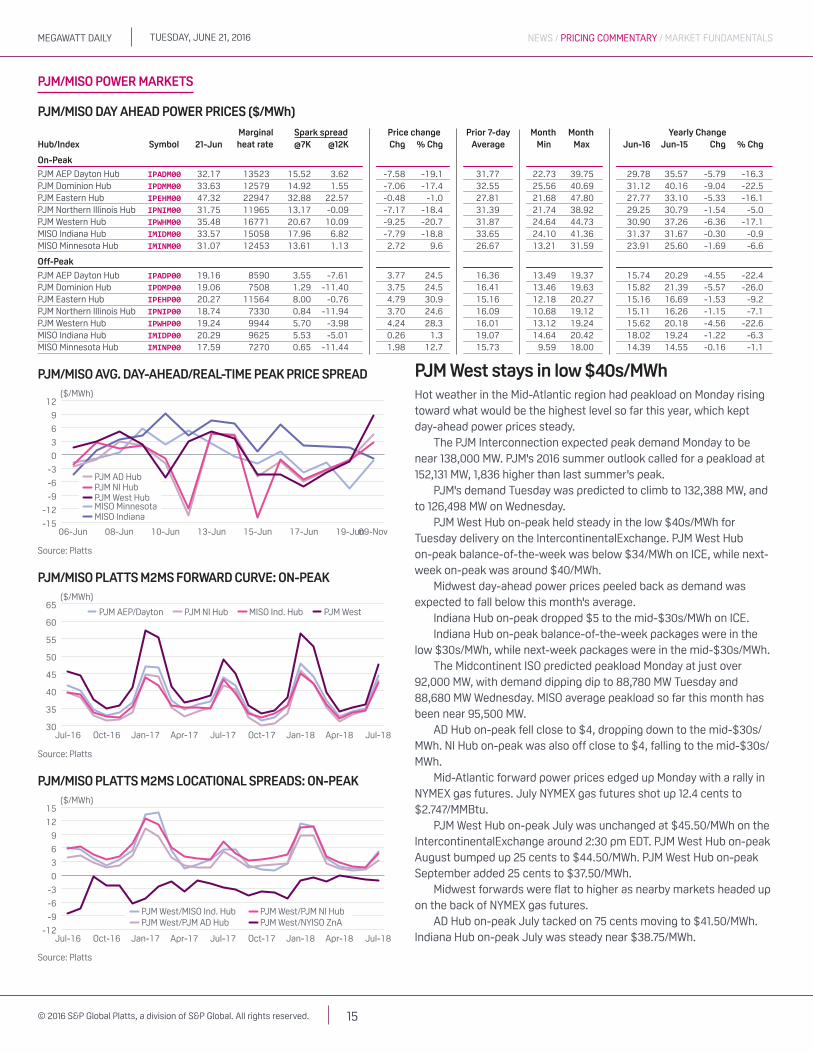
PJM west stays in low $40s/MwhHot weather in the Mid-Atlantic region had peakload on Monday rising toward what would be the highest level so far this year, which kept day-ahead power prices steady.
The PJM Interconnection expected peak demand Monday to be near 138,000 MW. PJM's 2016 summer outlook called for a peakload at 152,131 MW, 1,836 higher than last summer's peak.
PJM's demand Tuesday was predicted to climb to 132,388 MW, and to 126,498 MW on Wednesday.
PJM West Hub on-peak held steady in the low $40s/MWh for Tuesday delivery on the IntercontinentalExchange. PJM West Hub on-peak balance-of-the-week was below $34/MWh on ICE, while next-week on-peak was around $40/MWh.
Midwest day-ahead power prices peeled back as demand was expected to fall below this month's average.
Indiana Hub on-peak dropped $5 to the mid-$30s/MWh on ICE.Indiana Hub on-peak balance-of-the-week packages were in the
low $30s/MWh, while next-week packages were in the mid-$30s/MWh.The Midcontinent ISO predicted peakload Monday at just over
92,000 MW, with demand dipping dip to 88,780 MW Tuesday and 88,680 MW Wednesday. MISO average peakload so far this month has been near 95,500 MW.
AD Hub on-peak fell close to $4, dropping down to the mid-$30s/MWh. NI Hub on-peak was also off close to $4, falling to the mid-$30s/MWh.
Mid-Atlantic forward power prices edged up Monday with a rally in NYMEX gas futures. July NYMEX gas futures shot up 12.4 cents to $2.747/MMBtu.
PJM West Hub on-peak July was unchanged at $45.50/MWh on the IntercontinentalExchange around 2:30 pm EDT. PJM West Hub on-peak August bumped up 25 cents to $44.50/MWh. PJM West Hub on-peak September added 25 cents to $37.50/MWh.
Midwest forwards were flat to higher as nearby markets headed up on the back of NYMEX gas futures.
AD Hub on-peak July tacked on 75 cents moving to $41.50/MWh. Indiana Hub on-peak July was steady near $38.75/MWh.
PJM/MISO POWER MARKETS
Tuesday, June 21, 2016MegawaTT daily
16© 2016 S&P Global Platts, a division of S&P Global. All rights reserved.
NEWS / PRICING COMMENTARY / MARkET FuNdAMENTAls
SOUTHEAST POWER MARKETS
NEWs / PRICING COMMENTARY / MARkET FuNdAMENTAls
soutHeast & central Day-aHeaD poWer prices ($/MWh)
Marginal spark spread Price change Prior 7-day Month Month Yearly changeHub/index symbol 21-Jun heat rate @7k @12k Chg % Chg average Min Max Jun-16 Jun-15 Chg % Chg
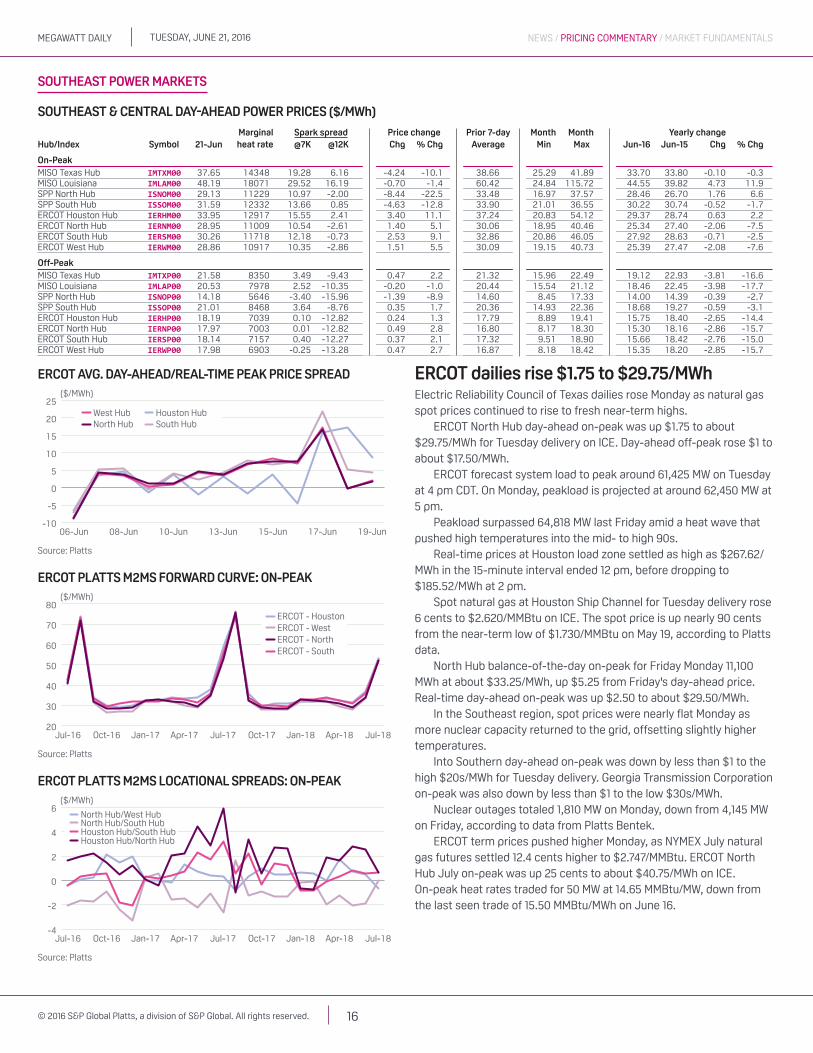
On-PeakMISO Texas Hub IMTXM00 37.65 14348 19.28 6.16 -4.24 -10.1 38.66 25.29 41.89 33.70 33.80 -0.10 -0.3MISO Louisiana IMLAM00 48.19 18071 29.52 16.19 -0.70 -1.4 60.42 24.84 115.72 44.55 39.82 4.73 11.9SPP North Hub ISNOM00 29.13 11229 10.97 -2.00 -8.44 -22.5 33.48 16.97 37.57 28.46 26.70 1.76 6.6SPP South Hub ISSOM00 31.59 12332 13.66 0.85 -4.63 -12.8 33.90 21.01 36.55 30.22 30.74 -0.52 -1.7ERCOT Houston Hub IERHM00 33.95 12917 15.55 2.41 3.40 11.1 37.24 20.83 54.12 29.37 28.74 0.63 2.2ERCOT North Hub IERNM00 28.95 11009 10.54 -2.61 1.40 5.1 30.06 18.95 40.46 25.34 27.40 -2.06 -7.5ERCOT South Hub IERSM00 30.26 11718 12.18 -0.73 2.53 9.1 32.86 20.86 46.05 27.92 28.63 -0.71 -2.5ERCOT West Hub IERWM00 28.86 10917 10.35 -2.86 1.51 5.5 30.09 19.15 40.73 25.39 27.47 -2.08 -7.6
Off-PeakMISO Texas Hub IMTXP00 21.58 8350 3.49 -9.43 0.47 2.2 21.32 15.96 22.49 19.12 22.93 -3.81 -16.6MISO Louisiana IMLAP00 20.53 7978 2.52 -10.35 -0.20 -1.0 20.44 15.54 21.12 18.46 22.45 -3.98 -17.7SPP North Hub ISNOP00 14.18 5646 -3.40 -15.96 -1.39 -8.9 14.60 8.45 17.33 14.00 14.39 -0.39 -2.7SPP South Hub ISSOP00 21.01 8468 3.64 -8.76 0.35 1.7 20.36 14.93 22.36 18.68 19.27 -0.59 -3.1ERCOT Houston Hub IERHP00 18.19 7039 0.10 -12.82 0.24 1.3 17.79 8.89 19.41 15.75 18.40 -2.65 -14.4ERCOT North Hub IERNP00 17.97 7003 0.01 -12.82 0.49 2.8 16.80 8.17 18.30 15.30 18.16 -2.86 -15.7ERCOT South Hub IERSP00 18.14 7157 0.40 -12.27 0.37 2.1 17.32 9.51 18.90 15.66 18.42 -2.76 -15.0ERCOT West Hub IERWP00 17.98 6903 -0.25 -13.28 0.47 2.7 16.87 8.18 18.42 15.35 18.20 -2.85 -15.7
ERCOT AVG. DAY-AHEAD/REAL-TIME PEAK PRICE SPREAD
Source: Platts
($/MWh)
-10
-5
0
5
10
15
20
25
19-Jun17-Jun15-Jun13-Jun10-Jun08-Jun06-Jun
Houston HubSouth Hub
West HubNorth Hub
ERCOT PLATTS M2MS FORWARD CURVE: ON-PEAK
Source: Platts
($/MWh)
20
30
40
50
60
70
80
Jul-18Apr-18Jan-18Oct-17Jul-17Apr-17Jan-17Oct-16Jul-16
ERCOT - HoustonERCOT - West
ERCOT - SouthERCOT - North
ERCOT PLATTS M2MS LOCATIONAL SPREADS: ON-PEAK
Source: Platts
($/MWh)
-4
-2
0
2
4
6
Jul-18Apr-18Jan-18Oct-17Jul-17Apr-17Jan-17Oct-16Jul-16
North Hub/West HubNorth Hub/South HubHouston Hub/South HubHouston Hub/North Hub
eRCOT dailies rise $1.75 to $29.75/MwhElectric Reliability Council of Texas dailies rose Monday as natural gas spot prices continued to rise to fresh near-term highs.
ERCOT North Hub day-ahead on-peak was up $1.75 to about $29.75/MWh for Tuesday delivery on ICE. Day-ahead off-peak rose $1 to about $17.50/MWh.
ERCOT forecast system load to peak around 61,425 MW on Tuesday at 4 pm CDT. On Monday, peakload is projected at around 62,450 MW at 5 pm.
Peakload surpassed 64,818 MW last Friday amid a heat wave that pushed high temperatures into the mid- to high 90s.
Real-time prices at Houston load zone settled as high as $267.62/MWh in the 15-minute interval ended 12 pm, before dropping to $185.52/MWh at 2 pm.
Spot natural gas at Houston Ship Channel for Tuesday delivery rose 6 cents to $2.620/MMBtu on ICE. The spot price is up nearly 90 cents from the near-term low of $1.730/MMBtu on May 19, according to Platts data.
North Hub balance-of-the-day on-peak for Friday Monday 11,100 MWh at about $33.25/MWh, up $5.25 from Friday's day-ahead price. Real-time day-ahead on-peak was up $2.50 to about $29.50/MWh.
In the Southeast region, spot prices were nearly flat Monday as more nuclear capacity returned to the grid, offsetting slightly higher temperatures.
Into Southern day-ahead on-peak was down by less than $1 to the high $20s/MWh for Tuesday delivery. Georgia Transmission Corporation on-peak was also down by less than $1 to the low $30s/MWh.
Nuclear outages totaled 1,810 MW on Monday, down from 4,145 MW on Friday, according to data from Platts Bentek.
ERCOT term prices pushed higher Monday, as NYMEX July natural gas futures settled 12.4 cents higher to $2.747/MMBtu. ERCOT North Hub July on-peak was up 25 cents to about $40.75/MWh on ICE. On-peak heat rates traded for 50 MW at 14.65 MMBtu/MW, down from the last seen trade of 15.50 MMBtu/MWh on June 16.
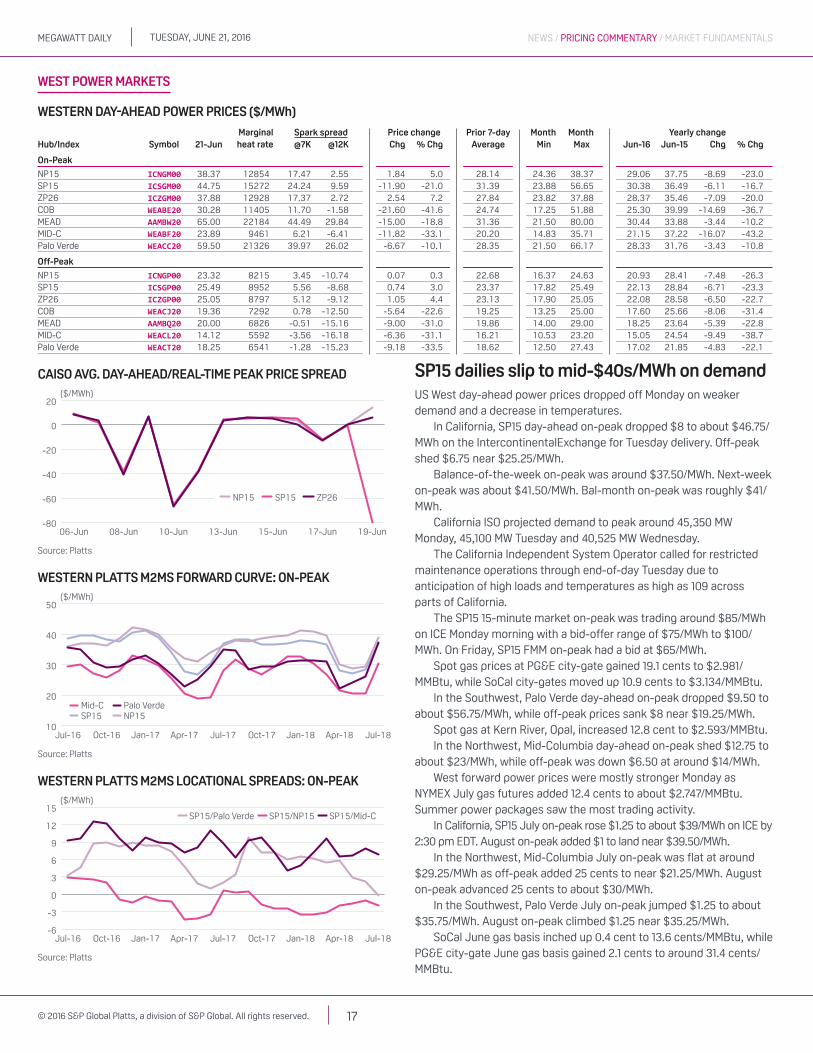
Tuesday, June 21, 2016MegawaTT daily
17© 2016 S&P Global Platts, a division of S&P Global. All rights reserved.
NEWS / PRICING COMMENTARY / MARkET FuNdAMENTAls
WEST POWER MARKETS
NEWs / PRICING COMMENTARY / MARkET FuNdAMENTAls
Western Day-aHeaD poWer prices ($/MWh)
Marginal spark spread Price change Prior 7-day Month Month Yearly changeHub/index symbol 21-Jun heat rate @7k @12k Chg % Chg average Min Max Jun-16 Jun-15 Chg % Chg
On-Peak
NP15 ICNGM00 38.37 12854 17.47 2.55 1.84 5.0 28.14 24.36 38.37 29.06 37.75 -8.69 -23.0SP15 ICSGM00 44.75 15272 24.24 9.59 -11.90 -21.0 31.39 23.88 56.65 30.38 36.49 -6.11 -16.7ZP26 ICZGM00 37.88 12928 17.37 2.72 2.54 7.2 27.84 23.82 37.88 28.37 35.46 -7.09 -20.0COB WEABE20 30.28 11405 11.70 -1.58 -21.60 -41.6 24.74 17.25 51.88 25.30 39.99 -14.69 -36.7MEAD AAMBW20 65.00 22184 44.49 29.84 -15.00 -18.8 31.36 21.50 80.00 30.44 33.88 -3.44 -10.2MID-C WEABF20 23.89 9461 6.21 -6.41 -11.82 -33.1 20.20 14.83 35.71 21.15 37.22 -16.07 -43.2Palo Verde WEACC20 59.50 21326 39.97 26.02 -6.67 -10.1 28.35 21.50 66.17 28.33 31.76 -3.43 -10.8
Off-Peak
NP15 ICNGP00 23.32 8215 3.45 -10.74 0.07 0.3 22.68 16.37 24.63 20.93 28.41 -7.48 -26.3SP15 ICSGP00 25.49 8952 5.56 -8.68 0.74 3.0 23.37 17.82 25.49 22.13 28.84 -6.71 -23.3ZP26 ICZGP00 25.05 8797 5.12 -9.12 1.05 4.4 23.13 17.90 25.05 22.08 28.58 -6.50 -22.7COB WEACJ20 19.36 7292 0.78 -12.50 -5.64 -22.6 19.25 13.25 25.00 17.60 25.66 -8.06 -31.4MEAD AAMBQ20 20.00 6826 -0.51 -15.16 -9.00 -31.0 19.86 14.00 29.00 18.25 23.64 -5.39 -22.8MID-C WEACL20 14.12 5592 -3.56 -16.18 -6.36 -31.1 16.21 10.53 23.20 15.05 24.54 -9.49 -38.7Palo Verde WEACT20 18.25 6541 -1.28 -15.23 -9.18 -33.5 18.62 12.50 27.43 17.02 21.85 -4.83 -22.1
CAISO AVG. DAY-AHEAD/REAL-TIME PEAK PRICE SPREAD
Source: Platts
($/MWh)
-80
-60
-40
-20
0
20
19-Jun17-Jun15-Jun13-Jun10-Jun08-Jun06-Jun
NP15 SP15 ZP26
WESTERN PLATTS M2MS FORWARD CURVE: ON-PEAK
Source: Platts
($/MWh)
10
20
30
40
50
Jul-18Apr-18Jan-18Oct-17Jul-17Apr-17Jan-17Oct-16Jul-16
SP15 NP15Mid-C Palo Verde
WESTERN PLATTS M2MS LOCATIONAL SPREADS: ON-PEAK
Source: Platts
($/MWh)
-6
-3
0
3
6
9
12
15
Jul-18Apr-18Jan-18Oct-17Jul-17Apr-17Jan-17Oct-16Jul-16
SP15/Palo Verde SP15/NP15 SP15/Mid-C
sP15 dailies slip to mid-$40s/Mwh on demandUS West day-ahead power prices dropped off Monday on weaker demand and a decrease in temperatures.
In California, SP15 day-ahead on-peak dropped $8 to about $46.75/MWh on the IntercontinentalExchange for Tuesday delivery. Off-peak shed $6.75 near $25.25/MWh.
Balance-of-the-week on-peak was around $37.50/MWh. Next-week on-peak was about $41.50/MWh. Bal-month on-peak was roughly $41/MWh.
California ISO projected demand to peak around 45,350 MW Monday, 45,100 MW Tuesday and 40,525 MW Wednesday.
The California Independent System Operator called for restricted maintenance operations through end-of-day Tuesday due to anticipation of high loads and temperatures as high as 109 across parts of California.
The SP15 15-minute market on-peak was trading around $85/MWh on ICE Monday morning with a bid-offer range of $75/MWh to $100/MWh. On Friday, SP15 FMM on-peak had a bid at $65/MWh.
Spot gas prices at PG&E city-gate gained 19.1 cents to $2.981/MMBtu, while SoCal city-gates moved up 10.9 cents to $3.134/MMBtu.
In the Southwest, Palo Verde day-ahead on-peak dropped $9.50 to about $56.75/MWh, while off-peak prices sank $8 near $19.25/MWh.
Spot gas at Kern River, Opal, increased 12.8 cent to $2.593/MMBtu.In the Northwest, Mid-Columbia day-ahead on-peak shed $12.75 to
about $23/MWh, while off-peak was down $6.50 at around $14/MWh.West forward power prices were mostly stronger Monday as
NYMEX July gas futures added 12.4 cents to about $2.747/MMBtu. Summer power packages saw the most trading activity.
In California, SP15 July on-peak rose $1.25 to about $39/MWh on ICE by 2:30 pm EDT. August on-peak added $1 to land near $39.50/MWh.
In the Northwest, Mid-Columbia July on-peak was flat at around $29.25/MWh as off-peak added 25 cents to near $21.25/MWh. August on-peak advanced 25 cents to about $30/MWh.
In the Southwest, Palo Verde July on-peak jumped $1.25 to about $35.75/MWh. August on-peak climbed $1.25 near $35.25/MWh.
SoCal June gas basis inched up 0.4 cent to 13.6 cents/MMBtu, while PG&E city-gate June gas basis gained 2.1 cents to around 31.4 cents/MMBtu.
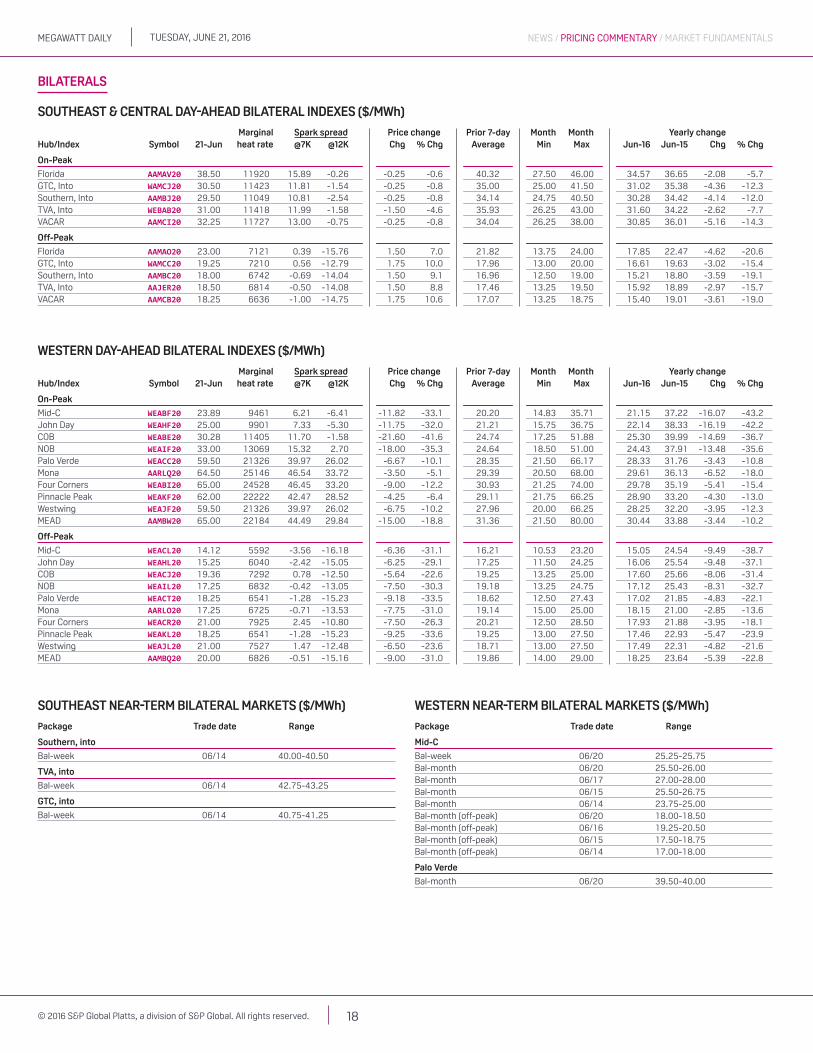
Tuesday, June 21, 2016MegawaTT daily
18© 2016 S&P Global Platts, a division of S&P Global. All rights reserved.
NEWS / PRICING COMMENTARY / MARkET FuNdAMENTAls
Bilaterals
NEWs / PRICING COMMENTARY / MARkET FuNdAMENTAls
soutHeast & central Day-aHeaD bilateral inDexes ($/MWh)
Marginal spark spread Price change Prior 7-day Month Month Yearly changeHub/index symbol 21-Jun heat rate @7k @12k Chg % Chg average Min Max Jun-16 Jun-15 Chg % Chg
On-Peak
Florida AAMAV20 38.50 11920 15.89 -0.26 -0.25 -0.6 40.32 27.50 46.00 34.57 36.65 -2.08 -5.7GTC, Into WAMCJ20 30.50 11423 11.81 -1.54 -0.25 -0.8 35.00 25.00 41.50 31.02 35.38 -4.36 -12.3Southern, Into AAMBJ20 29.50 11049 10.81 -2.54 -0.25 -0.8 34.14 24.75 40.50 30.28 34.42 -4.14 -12.0TVA, Into WEBAB20 31.00 11418 11.99 -1.58 -1.50 -4.6 35.93 26.25 43.00 31.60 34.22 -2.62 -7.7VACAR AAMCI20 32.25 11727 13.00 -0.75 -0.25 -0.8 34.04 26.25 38.00 30.85 36.01 -5.16 -14.3
Off-Peak
Florida AAMAO20 23.00 7121 0.39 -15.76 1.50 7.0 21.82 13.75 24.00 17.85 22.47 -4.62 -20.6GTC, Into WAMCC20 19.25 7210 0.56 -12.79 1.75 10.0 17.96 13.00 20.00 16.61 19.63 -3.02 -15.4Southern, Into AAMBC20 18.00 6742 -0.69 -14.04 1.50 9.1 16.96 12.50 19.00 15.21 18.80 -3.59 -19.1TVA, Into AAJER20 18.50 6814 -0.50 -14.08 1.50 8.8 17.46 13.25 19.50 15.92 18.89 -2.97 -15.7VACAR AAMCB20 18.25 6636 -1.00 -14.75 1.75 10.6 17.07 13.25 18.75 15.40 19.01 -3.61 -19.0
Western Day-aHeaD bilateral inDexes ($/MWh)
Marginal spark spread Price change Prior 7-day Month Month Yearly changeHub/index symbol 21-Jun heat rate @7k @12k Chg % Chg average Min Max Jun-16 Jun-15 Chg % Chg
On-Peak
Mid-C WEABF20 23.89 9461 6.21 -6.41 -11.82 -33.1 20.20 14.83 35.71 21.15 37.22 -16.07 -43.2John Day WEAHF20 25.00 9901 7.33 -5.30 -11.75 -32.0 21.21 15.75 36.75 22.14 38.33 -16.19 -42.2COB WEABE20 30.28 11405 11.70 -1.58 -21.60 -41.6 24.74 17.25 51.88 25.30 39.99 -14.69 -36.7NOB WEAIF20 33.00 13069 15.32 2.70 -18.00 -35.3 24.64 18.50 51.00 24.43 37.91 -13.48 -35.6Palo Verde WEACC20 59.50 21326 39.97 26.02 -6.67 -10.1 28.35 21.50 66.17 28.33 31.76 -3.43 -10.8Mona AARLQ20 64.50 25146 46.54 33.72 -3.50 -5.1 29.39 20.50 68.00 29.61 36.13 -6.52 -18.0Four Corners WEABI20 65.00 24528 46.45 33.20 -9.00 -12.2 30.93 21.25 74.00 29.78 35.19 -5.41 -15.4Pinnacle Peak WEAKF20 62.00 22222 42.47 28.52 -4.25 -6.4 29.11 21.75 66.25 28.90 33.20 -4.30 -13.0Westwing WEAJF20 59.50 21326 39.97 26.02 -6.75 -10.2 27.96 20.00 66.25 28.25 32.20 -3.95 -12.3MEAD AAMBW20 65.00 22184 44.49 29.84 -15.00 -18.8 31.36 21.50 80.00 30.44 33.88 -3.44 -10.2
Off-Peak
Mid-C WEACL20 14.12 5592 -3.56 -16.18 -6.36 -31.1 16.21 10.53 23.20 15.05 24.54 -9.49 -38.7John Day WEAHL20 15.25 6040 -2.42 -15.05 -6.25 -29.1 17.25 11.50 24.25 16.06 25.54 -9.48 -37.1COB WEACJ20 19.36 7292 0.78 -12.50 -5.64 -22.6 19.25 13.25 25.00 17.60 25.66 -8.06 -31.4NOB WEAIL20 17.25 6832 -0.42 -13.05 -7.50 -30.3 19.18 13.25 24.75 17.12 25.43 -8.31 -32.7Palo Verde WEACT20 18.25 6541 -1.28 -15.23 -9.18 -33.5 18.62 12.50 27.43 17.02 21.85 -4.83 -22.1Mona AARLO20 17.25 6725 -0.71 -13.53 -7.75 -31.0 19.14 15.00 25.00 18.15 21.00 -2.85 -13.6Four Corners WEACR20 21.00 7925 2.45 -10.80 -7.50 -26.3 20.21 12.50 28.50 17.93 21.88 -3.95 -18.1Pinnacle Peak WEAKL20 18.25 6541 -1.28 -15.23 -9.25 -33.6 19.25 13.00 27.50 17.46 22.93 -5.47 -23.9Westwing WEAJL20 21.00 7527 1.47 -12.48 -6.50 -23.6 18.71 13.00 27.50 17.49 22.31 -4.82 -21.6MEAD AAMBQ20 20.00 6826 -0.51 -15.16 -9.00 -31.0 19.86 14.00 29.00 18.25 23.64 -5.39 -22.8
soutHeast near-terM bilateral MarKets ($/MWh)
Package Trade date Range
southern, into
Bal-week 06/14 40.00-40.50
TVa, into
Bal-week 06/14 42.75-43.25
gtc, into
Bal-week 06/14 40.75-41.25
Western near-terM bilateral MarKets ($/MWh)
Package Trade date Range
Mid-C
Bal-week 06/20 25.25-25.75Bal-month 06/20 25.50-26.00Bal-month 06/17 27.00-28.00Bal-month 06/15 25.50-26.75Bal-month 06/14 23.75-25.00Bal-month (off-peak) 06/20 18.00-18.50Bal-month (off-peak) 06/16 19.25-20.50Bal-month (off-peak) 06/15 17.50-18.75Bal-month (off-peak) 06/14 17.00-18.00
Palo Verde
Bal-month 06/20 39.50-40.00
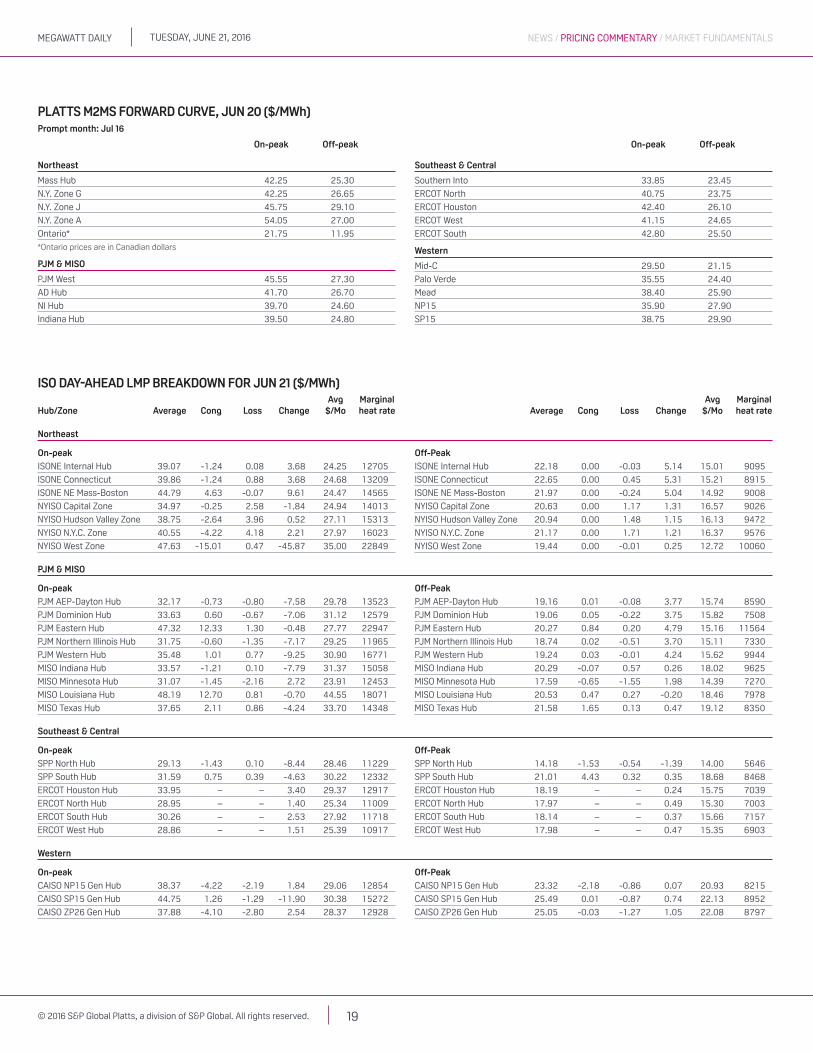
Tuesday, June 21, 2016MegawaTT daily
19© 2016 S&P Global Platts, a division of S&P Global. All rights reserved.
NEWS / PRICING COMMENTARY / MARkET FuNdAMENTAlsNEWs / PRICING COMMENTARY / MARkET FuNdAMENTAls
PlaTTs M2Ms FORwaRd CURVe, JUN 20 ($/MWh)Prompt month: Jul 16
On-peak Off-peak On-peak Off-peak
Northeast
Mass Hub 42.25 25.30
N.Y. Zone G 42.25 26.65
N.Y. Zone J 45.75 29.10
N.Y. Zone A 54.05 27.00
Ontario* 21.75 11.95
*Ontario prices are in Canadian dollars
PJM & MisO
PJM West 45.55 27.30
AD Hub 41.70 26.70
NI Hub 39.70 24.60
Indiana Hub 39.50 24.80
southeast & Central
Southern Into 33.85 23.45
ERCOT North 40.75 23.75
ERCOT Houston 42.40 26.10
ERCOT West 41.15 24.65
ERCOT South 42.80 25.50
western
Mid-C 29.50 21.15
Palo Verde 35.55 24.40
Mead 38.40 25.90
NP15 35.90 27.90
SP15 38.75 29.90
iso Day-aHeaD lMp breaKDoWn for Jun 21 ($/MWh) avg Marginal avg MarginalHub/Zone average Cong loss Change $/Mo heat rate average Cong loss Change $/Mo heat rate
Northeast
On-peak
ISONE Internal Hub 39.07 -1.24 0.08 3.68 24.25 12705
ISONE Connecticut 39.86 -1.24 0.88 3.68 24.68 13209
ISONE NE Mass-Boston 44.79 4.63 -0.07 9.61 24.47 14565
NYISO Capital Zone 34.97 -0.25 2.58 -1.84 24.94 14013
NYISO Hudson Valley Zone 38.75 -2.64 3.96 0.52 27.11 15313
NYISO N.Y.C. Zone 40.55 -4.22 4.18 2.21 27.97 16023
NYISO West Zone 47.63 -15.01 0.47 -45.87 35.00 22849
Off-Peak
ISONE Internal Hub 22.18 0.00 -0.03 5.14 15.01 9095
ISONE Connecticut 22.65 0.00 0.45 5.31 15.21 8915
ISONE NE Mass-Boston 21.97 0.00 -0.24 5.04 14.92 9008
NYISO Capital Zone 20.63 0.00 1.17 1.31 16.57 9026
NYISO Hudson Valley Zone 20.94 0.00 1.48 1.15 16.13 9472
NYISO N.Y.C. Zone 21.17 0.00 1.71 1.21 16.37 9576
NYISO West Zone 19.44 0.00 -0.01 0.25 12.72 10060
PJM & MisO
On-peak
PJM AEP-Dayton Hub 32.17 -0.73 -0.80 -7.58 29.78 13523
PJM Dominion Hub 33.63 0.60 -0.67 -7.06 31.12 12579
PJM Eastern Hub 47.32 12.33 1.30 -0.48 27.77 22947
PJM Northern Illinois Hub 31.75 -0.60 -1.35 -7.17 29.25 11965
PJM Western Hub 35.48 1.01 0.77 -9.25 30.90 16771
MISO Indiana Hub 33.57 -1.21 0.10 -7.79 31.37 15058
MISO Minnesota Hub 31.07 -1.45 -2.16 2.72 23.91 12453
MISO Louisiana Hub 48.19 12.70 0.81 -0.70 44.55 18071
MISO Texas Hub 37.65 2.11 0.86 -4.24 33.70 14348
Off-Peak
PJM AEP-Dayton Hub 19.16 0.01 -0.08 3.77 15.74 8590
PJM Dominion Hub 19.06 0.05 -0.22 3.75 15.82 7508
PJM Eastern Hub 20.27 0.84 0.20 4.79 15.16 11564
PJM Northern Illinois Hub 18.74 0.02 -0.51 3.70 15.11 7330
PJM Western Hub 19.24 0.03 -0.01 4.24 15.62 9944
MISO Indiana Hub 20.29 -0.07 0.57 0.26 18.02 9625
MISO Minnesota Hub 17.59 -0.65 -1.55 1.98 14.39 7270
MISO Louisiana Hub 20.53 0.47 0.27 -0.20 18.46 7978
MISO Texas Hub 21.58 1.65 0.13 0.47 19.12 8350
southeast & Central
On-peak
SPP North Hub 29.13 -1.43 0.10 -8.44 28.46 11229
SPP South Hub 31.59 0.75 0.39 -4.63 30.22 12332
ERCOT Houston Hub 33.95 – – 3.40 29.37 12917
ERCOT North Hub 28.95 – – 1.40 25.34 11009
ERCOT South Hub 30.26 – – 2.53 27.92 11718
ERCOT West Hub 28.86 – – 1.51 25.39 10917
Off-Peak
SPP North Hub 14.18 -1.53 -0.54 -1.39 14.00 5646
SPP South Hub 21.01 4.43 0.32 0.35 18.68 8468
ERCOT Houston Hub 18.19 – – 0.24 15.75 7039
ERCOT North Hub 17.97 – – 0.49 15.30 7003
ERCOT South Hub 18.14 – – 0.37 15.66 7157
ERCOT West Hub 17.98 – – 0.47 15.35 6903
western
On-peak
CAISO NP15 Gen Hub 38.37 -4.22 -2.19 1.84 29.06 12854
CAISO SP15 Gen Hub 44.75 1.26 -1.29 -11.90 30.38 15272
CAISO ZP26 Gen Hub 37.88 -4.10 -2.80 2.54 28.37 12928
Off-Peak
CAISO NP15 Gen Hub 23.32 -2.18 -0.86 0.07 20.93 8215
CAISO SP15 Gen Hub 25.49 0.01 -0.87 0.74 22.13 8952
CAISO ZP26 Gen Hub 25.05 -0.03 -1.27 1.05 22.08 8797
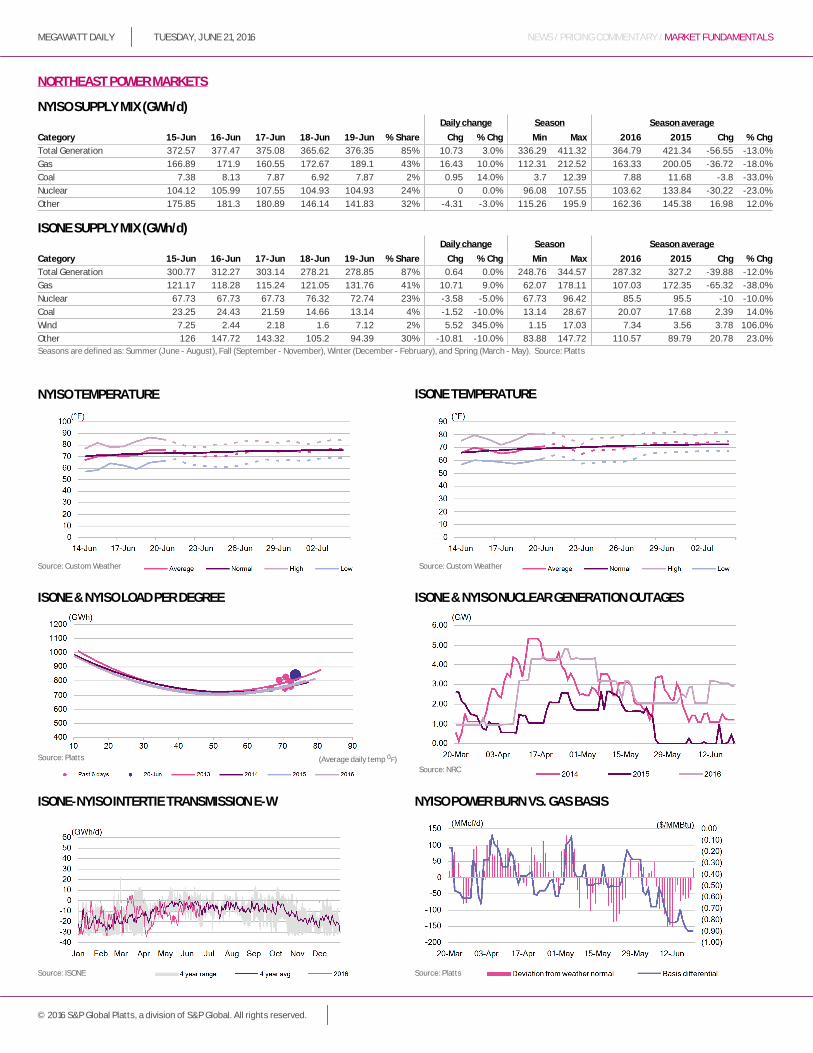
MEGAWATT DAILY NEWS / PRICING COMMENTARY / MARKET FUNDAMENTALSTUESDAY, JUNE 21, 2016
© 2016 S&P Global Platts, a division of S&P Global. All rights reserved.
NORTHEAST POWER MARKETS
NYISO SUPPLY MIX (GWh/d)Daily change Season Season average
Category 15-Jun 16-Jun 17-Jun 18-Jun 19-Jun % Share Chg % Chg Min Max 2016 2015 Chg % Chg
Total Generation 372.57 377.47 375.08 365.62 376.35 85% 10.73 3.0% 336.29 411.32 364.79 421.34 -56.55 -13.0%
Gas 166.89 171.9 160.55 172.67 189.1 43% 16.43 10.0% 112.31 212.52 163.33 200.05 -36.72 -18.0%
Coal 7.38 8.13 7.87 6.92 7.87 2% 0.95 14.0% 3.7 12.39 7.88 11.68 -3.8 -33.0%
Nuclear 104.12 105.99 107.55 104.93 104.93 24% 0 0.0% 96.08 107.55 103.62 133.84 -30.22 -23.0%
Other 175.85 181.3 180.89 146.14 141.83 32% -4.31 -3.0% 115.26 195.9 162.36 145.38 16.98 12.0%
ISONE SUPPLY MIX (GWh/d)Daily change Season Season average
Category 15-Jun 16-Jun 17-Jun 18-Jun 19-Jun % Share Chg % Chg Min Max 2016 2015 Chg % Chg
Total Generation 300.77 312.27 303.14 278.21 278.85 87% 0.64 0.0% 248.76 344.57 287.32 327.2 -39.88 -12.0%
Gas 121.17 118.28 115.24 121.05 131.76 41% 10.71 9.0% 62.07 178.11 107.03 172.35 -65.32 -38.0%
Nuclear 67.73 67.73 67.73 76.32 72.74 23% -3.58 -5.0% 67.73 96.42 85.5 95.5 -10 -10.0%
Coal 23.25 24.43 21.59 14.66 13.14 4% -1.52 -10.0% 13.14 28.67 20.07 17.68 2.39 14.0%
Wind 7.25 2.44 2.18 1.6 7.12 2% 5.52 345.0% 1.15 17.03 7.34 3.56 3.78 106.0%
Other 126 147.72 143.32 105.2 94.39 30% -10.81 -10.0% 83.88 147.72 110.57 89.79 20.78 23.0%
ISONE-NYISO INTERTIE TRANSMISSION E-W
ISONE & NYISO LOAD PER DEGREE
NYISO TEMPERATURE
ISONE & NYISO NUCLEAR GENERATION OUTAGES
ISONE TEMPERATURE
Source: Platts (Average daily temp 0F)
Source: Platts
NYISO POWER BURN VS. GAS BASIS
Seasons are defined as: Summer (June - August), Fall (September - November), Winter (December - February), and Spring (March - May). Source: Platts
Source: NRC
Source: ISONE
Source: Custom WeatherSource: Custom Weather
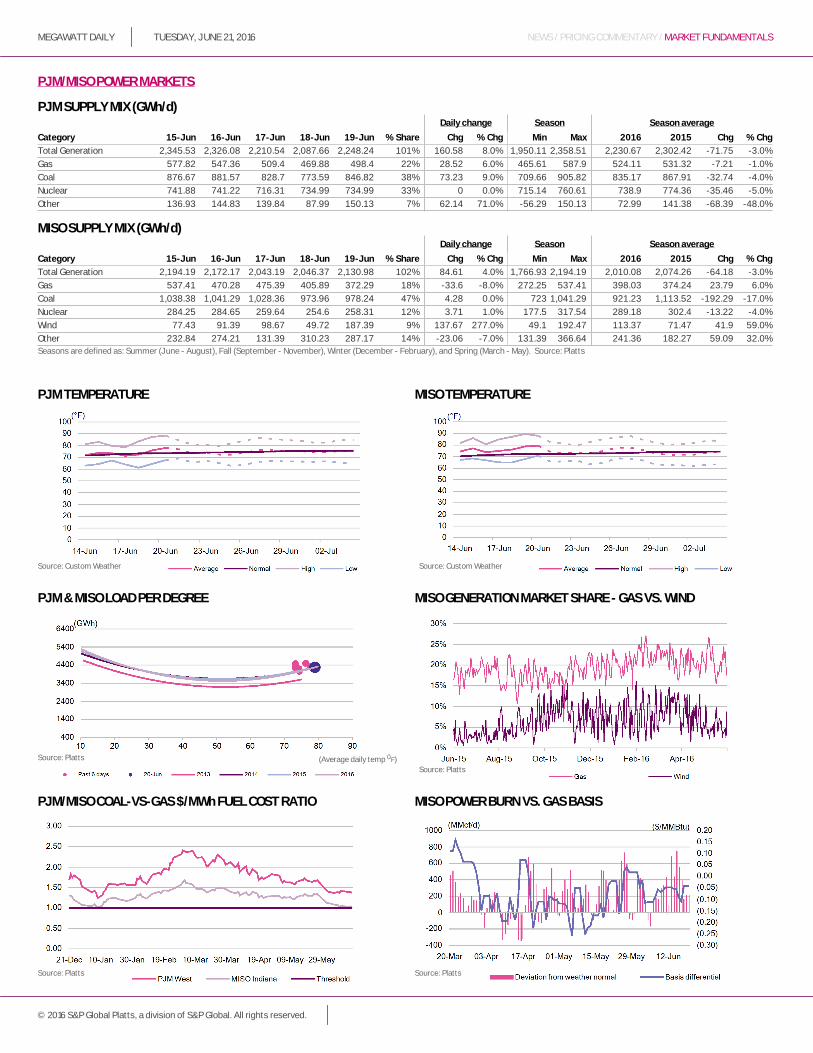
MEGAWATT DAILY NEWS / PRICING COMMENTARY / MARKET FUNDAMENTALSTUESDAY, JUNE 21, 2016
© 2016 S&P Global Platts, a division of S&P Global. All rights reserved.
PJM/MISO POWER MARKETS
PJM SUPPLY MIX (GWh/d)Daily change Season Season average
Category 15-Jun 16-Jun 17-Jun 18-Jun 19-Jun % Share Chg % Chg Min Max 2016 2015 Chg % Chg
Total Generation 2,345.53 2,326.08 2,210.54 2,087.66 2,248.24 101% 160.58 8.0% 1,950.11 2,358.51 2,230.67 2,302.42 -71.75 -3.0%
Gas 577.82 547.36 509.4 469.88 498.4 22% 28.52 6.0% 465.61 587.9 524.11 531.32 -7.21 -1.0%
Coal 876.67 881.57 828.7 773.59 846.82 38% 73.23 9.0% 709.66 905.82 835.17 867.91 -32.74 -4.0%
Nuclear 741.88 741.22 716.31 734.99 734.99 33% 0 0.0% 715.14 760.61 738.9 774.36 -35.46 -5.0%
Other 136.93 144.83 139.84 87.99 150.13 7% 62.14 71.0% -56.29 150.13 72.99 141.38 -68.39 -48.0%
MISO SUPPLY MIX (GWh/d)Daily change Season Season average
Category 15-Jun 16-Jun 17-Jun 18-Jun 19-Jun % Share Chg % Chg Min Max 2016 2015 Chg % Chg
Total Generation 2,194.19 2,172.17 2,043.19 2,046.37 2,130.98 102% 84.61 4.0% 1,766.93 2,194.19 2,010.08 2,074.26 -64.18 -3.0%
Gas 537.41 470.28 475.39 405.89 372.29 18% -33.6 -8.0% 272.25 537.41 398.03 374.24 23.79 6.0%
Coal 1,038.38 1,041.29 1,028.36 973.96 978.24 47% 4.28 0.0% 723 1,041.29 921.23 1,113.52 -192.29 -17.0%
Nuclear 284.25 284.65 259.64 254.6 258.31 12% 3.71 1.0% 177.5 317.54 289.18 302.4 -13.22 -4.0%
Wind 77.43 91.39 98.67 49.72 187.39 9% 137.67 277.0% 49.1 192.47 113.37 71.47 41.9 59.0%
Other 232.84 274.21 131.39 310.23 287.17 14% -23.06 -7.0% 131.39 366.64 241.36 182.27 59.09 32.0%
PJM/MISO COAL-VS-GAS $/MWh FUEL COST RATIO
PJM & MISO LOAD PER DEGREE
PJM TEMPERATURE
MISO POWER BURN VS. GAS BASIS
MISO GENERATION MARKET SHARE - GAS VS. WIND
MISO TEMPERATURE
Source: Platts
Source: Platts Source: Platts
(Average daily temp 0F)
Seasons are defined as: Summer (June - August), Fall (September - November), Winter (December - February), and Spring (March - May). Source: Platts
Source: Platts
Source: Custom WeatherSource: Custom Weather
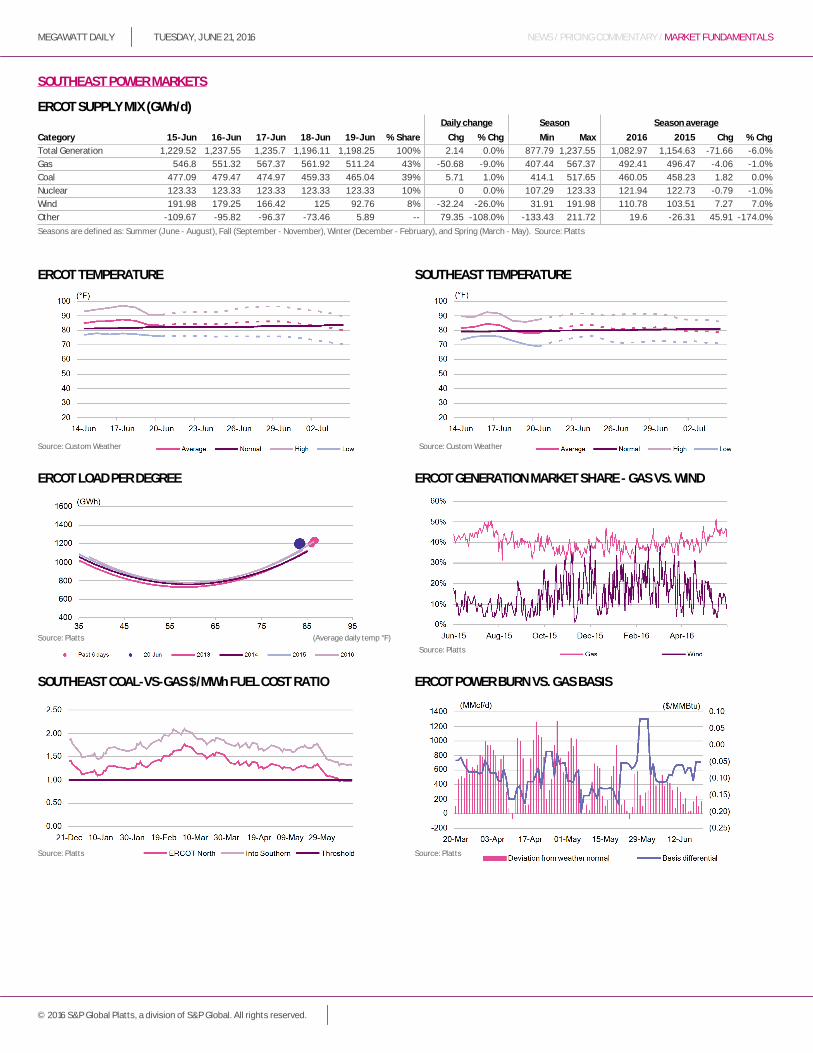
MEGAWATT DAILY NEWS / PRICING COMMENTARY / MARKET FUNDAMENTALSTUESDAY, JUNE 21, 2016
© 2016 S&P Global Platts, a division of S&P Global. All rights reserved.
SOUTHEAST POWER MARKETS
ERCOT SUPPLY MIX (GWh/d)Daily change Season Season average
Category 15-Jun 16-Jun 17-Jun 18-Jun 19-Jun % Share Chg % Chg Min Max 2016 2015 Chg % Chg
Total Generation 1,229.52 1,237.55 1,235.7 1,196.11 1,198.25 100% 2.14 0.0% 877.79 1,237.55 1,082.97 1,154.63 -71.66 -6.0%
Gas 546.8 551.32 567.37 561.92 511.24 43% -50.68 -9.0% 407.44 567.37 492.41 496.47 -4.06 -1.0%
Coal 477.09 479.47 474.97 459.33 465.04 39% 5.71 1.0% 414.1 517.65 460.05 458.23 1.82 0.0%
Nuclear 123.33 123.33 123.33 123.33 123.33 10% 0 0.0% 107.29 123.33 121.94 122.73 -0.79 -1.0%
Wind 191.98 179.25 166.42 125 92.76 8% -32.24 -26.0% 31.91 191.98 110.78 103.51 7.27 7.0%
Other -109.67 -95.82 -96.37 -73.46 5.89 -- 79.35 -108.0% -133.43 211.72 19.6 -26.31 45.91 -174.0%
SOUTHEAST COAL-VS-GAS $/MWh FUEL COST RATIO
ERCOT LOAD PER DEGREE
ERCOT TEMPERATURE
ERCOT POWER BURN VS. GAS BASIS
ERCOT GENERATION MARKET SHARE - GAS VS. WIND
SOUTHEAST TEMPERATURE
Source: Platts
Source: PlattsSource: Platts
(Average daily temp °F)
Seasons are defined as: Summer (June - August), Fall (September - November), Winter (December - February), and Spring (March - May). Source: Platts
Source: Platts
Source: Custom Weather Source: Custom Weather
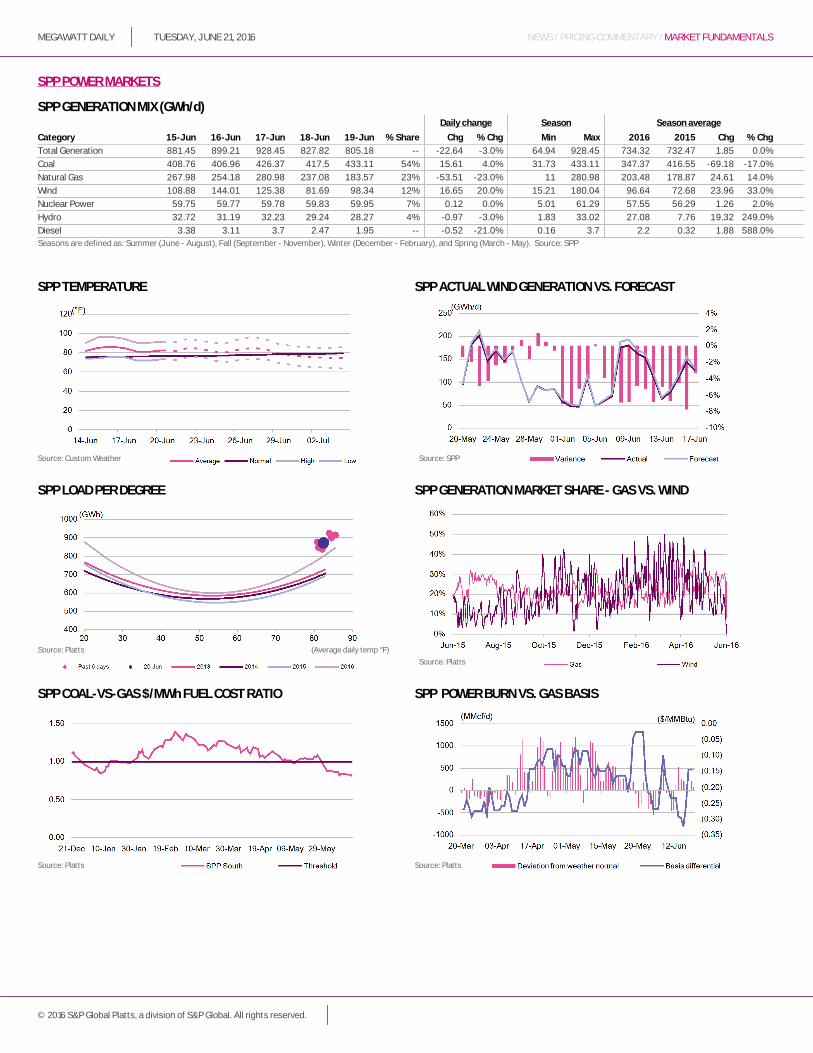
MEGAWATT DAILY NEWS / PRICING COMMENTARY / MARKET FUNDAMENTALSTUESDAY, JUNE 21, 2016
© 2016 S&P Global Platts, a division of S&P Global. All rights reserved.
SPP POWER MARKETS
SPP GENERATION MIX (GWh/d)Daily change Season Season average
Category 15-Jun 16-Jun 17-Jun 18-Jun 19-Jun % Share Chg % Chg Min Max 2016 2015 Chg % Chg
Total Generation 881.45 899.21 928.45 827.82 805.18 -- -22.64 -3.0% 64.94 928.45 734.32 732.47 1.85 0.0%
Coal 408.76 406.96 426.37 417.5 433.11 54% 15.61 4.0% 31.73 433.11 347.37 416.55 -69.18 -17.0%
Natural Gas 267.98 254.18 280.98 237.08 183.57 23% -53.51 -23.0% 11 280.98 203.48 178.87 24.61 14.0%
Wind 108.88 144.01 125.38 81.69 98.34 12% 16.65 20.0% 15.21 180.04 96.64 72.68 23.96 33.0%
Nuclear Power 59.75 59.77 59.78 59.83 59.95 7% 0.12 0.0% 5.01 61.29 57.55 56.29 1.26 2.0%
Hydro 32.72 31.19 32.23 29.24 28.27 4% -0.97 -3.0% 1.83 33.02 27.08 7.76 19.32 249.0%
Diesel 3.38 3.11 3.7 2.47 1.95 -- -0.52 -21.0% 0.16 3.7 2.2 0.32 1.88 588.0%
SPP COAL-VS-GAS $/MWh FUEL COST RATIO
SPP TEMPERATURE
SPP POWER BURN VS. GAS BASIS
SPP GENERATION MARKET SHARE - GAS VS. WINDSPP LOAD PER DEGREE
Source: Platts
Source: Platts Source: Platts
SPP ACTUAL WIND GENERATION VS. FORECAST
(Average daily temp °F)
Seasons are defined as: Summer (June - August), Fall (September - November), Winter (December - February), and Spring (March - May). Source: SPP
Source: Platts
Source: SPPSource: Custom Weather
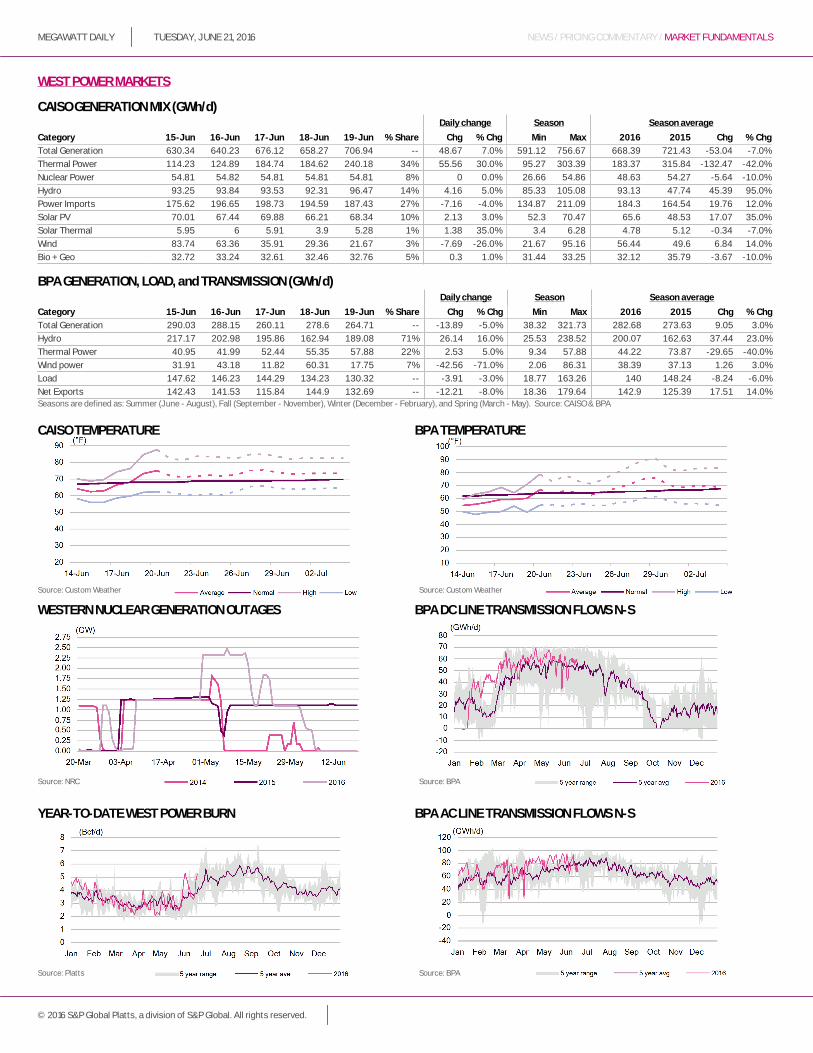
MEGAWATT DAILY NEWS / PRICING COMMENTARY / MARKET FUNDAMENTALSTUESDAY, JUNE 21, 2016
© 2016 S&P Global Platts, a division of S&P Global. All rights reserved.
WEST POWER MARKETS
CAISO GENERATION MIX (GWh/d)Daily change Season Season average
Category 15-Jun 16-Jun 17-Jun 18-Jun 19-Jun % Share Chg % Chg Min Max 2016 2015 Chg % Chg
Total Generation 630.34 640.23 676.12 658.27 706.94 -- 48.67 7.0% 591.12 756.67 668.39 721.43 -53.04 -7.0%
Thermal Power 114.23 124.89 184.74 184.62 240.18 34% 55.56 30.0% 95.27 303.39 183.37 315.84 -132.47 -42.0%
Nuclear Power 54.81 54.82 54.81 54.81 54.81 8% 0 0.0% 26.66 54.86 48.63 54.27 -5.64 -10.0%
Hydro 93.25 93.84 93.53 92.31 96.47 14% 4.16 5.0% 85.33 105.08 93.13 47.74 45.39 95.0%
Power Imports 175.62 196.65 198.73 194.59 187.43 27% -7.16 -4.0% 134.87 211.09 184.3 164.54 19.76 12.0%
Solar PV 70.01 67.44 69.88 66.21 68.34 10% 2.13 3.0% 52.3 70.47 65.6 48.53 17.07 35.0%
Solar Thermal 5.95 6 5.91 3.9 5.28 1% 1.38 35.0% 3.4 6.28 4.78 5.12 -0.34 -7.0%
Wind 83.74 63.36 35.91 29.36 21.67 3% -7.69 -26.0% 21.67 95.16 56.44 49.6 6.84 14.0%
Bio + Geo 32.72 33.24 32.61 32.46 32.76 5% 0.3 1.0% 31.44 33.25 32.12 35.79 -3.67 -10.0%
BPA GENERATION, LOAD, and TRANSMISSION (GWh/d)Daily change Season Season average
Category 15-Jun 16-Jun 17-Jun 18-Jun 19-Jun % Share Chg % Chg Min Max 2016 2015 Chg % Chg
Total Generation 290.03 288.15 260.11 278.6 264.71 -- -13.89 -5.0% 38.32 321.73 282.68 273.63 9.05 3.0%
Hydro 217.17 202.98 195.86 162.94 189.08 71% 26.14 16.0% 25.53 238.52 200.07 162.63 37.44 23.0%
Thermal Power 40.95 41.99 52.44 55.35 57.88 22% 2.53 5.0% 9.34 57.88 44.22 73.87 -29.65 -40.0%
Wind power 31.91 43.18 11.82 60.31 17.75 7% -42.56 -71.0% 2.06 86.31 38.39 37.13 1.26 3.0%
Load 147.62 146.23 144.29 134.23 130.32 -- -3.91 -3.0% 18.77 163.26 140 148.24 -8.24 -6.0%
Net Exports 142.43 141.53 115.84 144.9 132.69 -- -12.21 -8.0% 18.36 179.64 142.9 125.39 17.51 14.0%
YEAR-TO-DATE WEST POWER BURN
WESTERN NUCLEAR GENERATION OUTAGES
CAISO TEMPERATURE
BPA AC LINE TRANSMISSION FLOWS N-S
BPA DC LINE TRANSMISSION FLOWS N-S
BPA TEMPERATURE
Seasons are defined as: Summer (June - August), Fall (September - November), Winter (December - February), and Spring (March - May). Source: CAISO & BPA
Source: NRC
Source: Platts
Source: BPA
Source: BPA
Source: Custom WeatherSource: Custom Weather
ANALYTICS
DYNAMIC MARKET, THOUGHTFUL APPROACHEvery day in every sector, opportunities arise in Mexico’s transitioning energy markets.
The new Platts Mexico Energy Monthly brings together our full range of research, reporting and analytical capabilities to help you confidently assess those opportunities.
From policies and projects to pipelines and prices, see what a difference it makes when Platts covers reform. Stop by the booth in the exhibits area to find out more.
Email: [email protected]: www.platts.com