electrification beyond light duty: class 2b-3 commercial
TRANSCRIPT

ORNL/TM-2017/744
Electrification Beyond Light Duty: Class 2b-3 Commercial Vehicles
Alicia K. Birky Michael Laughlin Katie Tartaglia Rebecca Price Brandon Lim Zhenhong Lin
December 2017
Approved for public release. Distribution is unlimited.

DOCUMENT AVAILABILITY
Reports produced after January 1, 1996, are generally available free via US Department of Energy (DOE) SciTech Connect. Website http://www.osti.gov/scitech/ Reports produced before January 1, 1996, may be purchased by members of the public from the following source: National Technical Information Service 5285 Port Royal Road Springfield, VA 22161 Telephone 703-605-6000 (1-800-553-6847) TDD 703-487-4639 Fax 703-605-6900 E-mail [email protected] Website http://classic.ntis.gov/
Reports are available to DOE employees, DOE contractors, Energy Technology Data Exchange representatives, and International Nuclear Information System representatives from the following source: Office of Scientific and Technical Information PO Box 62 Oak Ridge, TN 37831 Telephone 865-576-8401 Fax 865-576-5728 E-mail [email protected] Website http://www.osti.gov/contact.html
This report was prepared as an account of work sponsored by an agency of the United States Government. Neither the United States Government nor any agency thereof, nor any of their employees, makes any warranty, express or implied, or assumes any legal liability or responsibility for the accuracy, completeness, or usefulness of any information, apparatus, product, or process disclosed, or represents that its use would not infringe privately owned rights. Reference herein to any specific commercial product, process, or service by trade name, trademark, manufacturer, or otherwise, does not necessarily constitute or imply its endorsement, recommendation, or favoring by the United States Government or any agency thereof. The views and opinions of authors expressed herein do not necessarily state or reflect those of the United States Government or any agency thereof.

ORNL/TM-2017/744
Energy and Transportation Science Division
Electrification Beyond Light Duty: Class 2b-3 Commercial Vehicles
Alicia K. Birky, PhD
Michael Laughlin, PMP
Katie Tartaglia
Rebecca Price
Brandon Lim
Zhenhong Lin, PhD
Date Published: December 2017
Prepared by
OAK RIDGE NATIONAL LABORATORY
Oak Ridge, TN 37831-6283
managed by
UT-BATTELLE, LLC
for the
US DEPARTMENT OF ENERGY
under contract DE-AC05-00OR22725


iii
TABLE OF CONTENTS
LIST OF FIGURES ...................................................................................................................................... v LIST OF TABLES ........................................................................................................................................ v List of Acronyms ........................................................................................................................................ vii ABSTRACT ................................................................................................................................................. ix 1. Introduction ........................................................................................................................................... 1
1.1 Background ................................................................................................................................. 1 1.2 Scope and Objectives .................................................................................................................. 1 1.3 Approach ..................................................................................................................................... 2
2. Market Overview .................................................................................................................................. 5 2.1 Class 2b-3 Models and Sales ...................................................................................................... 5 2.2 Vehicle Usage ............................................................................................................................. 8
2.2.1 Fleet Size ........................................................................................................................ 8 2.2.2 Use ................................................................................................................................. 9
2.3 Research Status ......................................................................................................................... 10 2.4 Commercial Status of Electrification ........................................................................................ 11
3. Market Environment ........................................................................................................................... 13 3.1 Fuel Consumption Standards .................................................................................................... 13 3.2 Advanced Clean Cars Program ................................................................................................. 14
4. Market Viability .................................................................................................................................. 17 4.1 Consumer Demand .................................................................................................................... 17 4.2 Production Volume ................................................................................................................... 18 4.3 Manufacturer Activity ............................................................................................................... 19 4.4 Technology Readiness and Customer Needs ............................................................................ 20 4.5 Promising Applications ............................................................................................................. 21 4.6 Purchase Decisions ................................................................................................................... 22 4.7 Willingness to Adopt New Technologies ................................................................................. 23 4.8 Benefits ..................................................................................................................................... 24
5. Findings .............................................................................................................................................. 27 5.1 Barriers ...................................................................................................................................... 27
5.1.1 Technical Barriers ........................................................................................................ 27 5.1.2 Economic Barriers ....................................................................................................... 28 5.1.3 Operational Issues ........................................................................................................ 29
5.2 Opportunities ............................................................................................................................. 29 5.3 Strategies ................................................................................................................................... 30
5.3.1 Consumer Demand ....................................................................................................... 30 5.3.2 Performance and Design .............................................................................................. 30 5.3.3 Production Volume and Cost ....................................................................................... 31
5.4 Key Insights .............................................................................................................................. 31 References ................................................................................................................................................... 35

iv

v
LIST OF FIGURES
Figure 1. Historical class 2-3 truck sales. .................................................................................................... 6 Figure 2. Class 2b-8 vehicle registrations. ................................................................................................... 7 Figure 3. Class 2b-3 pickups and vans by fuel type. .................................................................................... 8 Figure 4. Fuel consumptions standards as a function of work factor. ........................................................ 14 Figure 5. Illustration of fuel consumption standard for class 2b-3 pickup trucks. ..................................... 14 Figure 6. Increase in mandated ZEV/TZEV sales through 2018. .............................................................. 14
LIST OF TABLES
Table 1. Example class 2b vehicle models (8,500 - 10,000 lbs GVWR) ..................................................... 5 Table 2. Example class 3 vehicle models (10,001-14,000 lbs GVWR) ....................................................... 6 Table 3. Class 2-3 plug-in electric pickup and van models ....................................................................... 12

vi

vii
LIST OF ACRONYMS
ACC Advanced Clean Cars
ARRA American Recovery and Reinvestment Act of 2009
BEV battery electric vehicle
CAFE Corporate Average Fuel Economy
CARB California Air Resources Board
EPA Environmental Protection Agency
EPRI Electric Power Research Institute
GVWR gross vehicle weight rating
ICE internal combustion engine
kWh kilowatt hour
NHTSA National Highway Traffic Safety Administration
OEM original equipment manufacturer
ORNL Oak Ridge National Laboratory
PEV plug-in electric vehicle
PHEV plug-in hybrid electric vehicle
PTO power take-off
R&D research and development
TCO total cost of ownership
TZEV transitional zero emission vehicle
VIUS Vehicle Inventory and Use Survey
VTO Vehicle Technologies Office
ZEV zero emission vehicle

viii

ix
ABSTRACT
The class 2b-3 truck market covers a wide range of commercial truck applications across a half-million
vehicle sales annually. This report collected public information and stakeholder input to assess the
opportunity for electrification in this market. Although class 2b-3 pickup truck and van bodies are very
similar to personal light vehicles, their functional requirements are quite different due to the demands of
the commercial market. These demands vary by application and often vary from day to day for a single
application.
Fleet customers purchase these vehicles to perform a particular job for their business and are concerned
about the overall cost of doing that job. Therefore, the vehicles must meet the job requirements cost
effectively. Customers also are sensitive to initial cost.
Electrification offers the potential to reduce vehicle operating costs and possibly improve vehicle
functionality. However, the current market for class 2b-3 electrified trucks is very small, and the trucks
are costly. Increased production volumes are key to cost reductions and may be assisted by sharing
components with larger or smaller truck classes. Expanding demand is also crucial and stakeholders
identified several niche markets with duty cycles that are likely well-suited to electrified class 2b-3 trucks.
To expand beyond these niches, class 2b-3 electric solutions must be robust, flexible, and adaptable in
order to cover a wide range of vocations, applications, and duty cycles.

x

1
1. INTRODUCTION
1.1 BACKGROUND
Despite significant improvements in light vehicle fuel economy and criteria emissions, the U.S.
transportation sector is still responsible for 70% of the nation’s petroleum consumption. As a result, the
sector is vulnerable to price fluctuations and supply disruptions and remains a significant contributor to
local air pollution. Electrification presents one possible solution for petroleum consumption and emission
reductions. While many electric technologies are commercially available in the light vehicle sector, there
are fewer options in the medium and heavy duty commercial vehicle sectors.
Stakeholders at the April 2016 Electrification Beyond Light Duty Workshop identified commercial
pickup trucks as an important market with little electrification activity. There are approximately 16
million class 2b-3 (8,501-14,000 lb GVW) pickups, vans, and vocational trucks currently registered
nationally, with 13 million in class 2b alone.1 These vehicles are widely used in large and small
commercial fleets. Because class 2b and 3 pickups and vans fall between light duty passenger vehicles
and what typically are considered medium or heavy duty commercial vehicles (class 4-8), these trucks
often receive little attention in government programs and policies, including data programs. Very little is
published regarding the composition of this fleet, how they are used, how much fuel they consume, or
how much they impact the environment. However, the U.S. Environmental Protection Agency (EPA)
estimates that heavy-duty pickups and vans account for 23% of class 2b-8 vehicle fuel use (EPA &
NHTSA, 2016).
Electric drive options are very limited in the class 2b and 3 market. Stakeholders at the workshop
indicated that the heavy duty pickup truck market is risky for smaller companies since they would not be
able to compete with potential future solutions from major original equipment manufacturers (OEMs).
Therefore, they expect little movement in this segment unless the OEMs decide to act.
This study was sponsored by the U.S. Department of Energy’s Vehicle Technologies Office (VTO) and
Oak Ridge National Laboratory (ORNL). VTO and the national labs support research and development
activities across a broad range of vehicles to improve the overall efficiency of the U.S. highway fleet.
Electrification represents one technology opportunity for improving vehicle efficiency and reducing the
cost of transportation petroleum dependence. The goal of this study is to add to the collective
understanding of the electrification opportunity in the class 2b-3 market and to investigate barriers to
electrification in this market. This study provides a qualitative assessment of the class 2b and 3 market by
combining information from public data sources, interviews with manufacturers and industry
associations, and input from transportation experts.
1.2 SCOPE AND OBJECTIVES
This study investigates the feasibility and possible level of electrification for class 2b-3 commercial
pickup trucks and vans. The scope of this research was limited to plug-in electric vehicles (PEVs),
including battery electric (BEV) and plug-in hybrid electric (PHEV) vehicles. The scope limitations were
not intended to imply preference for these technologies over others, such as hybridization without plug-in
capability or fuel cells, and the authors acknowledge that alternatives can provide significant and possibly
greater benefits in some applications. Much of the market and industry information presented here is
relevant to other fuel saving and alternative vehicle technologies. This study seeks to identify applications
and duty cycles most suitable for plug-in vehicle technologies and explore research gaps that could be
1 Estimated number of trucks based on EIA analysis of 2014 Polk registration data for NEMS model inputs.

2
addressed with future research and development investments. Stakeholder input was vital to identifying
and understanding industry gaps, barriers, and opportunities.
1.3 APPROACH
This study consisted of two main tasks: a market assessment and collection of stakeholder input. The
market assessment utilized publicly available information and data to characterize the market, the current
state of electrification in that market, and the regulatory environment. Recent projects funded by DOE
were reviewed to understand recent federal research and development activity. The study team identified
and contacted stakeholders from manufacturers of class 2-3 heavy duty conventional and plug-in electric
pickups and vans as well as industry associations. Stakeholders that expressed interest in providing their
insights were engaged individually by phone and participated in free form discussions. In order to
encourage candor, stakeholders were informed that their responses would be aggregated and that their
comments would not be individually attributed. Input was received from a total of six stakeholders.
Additional insights were obtained from public sources, including conference presentations, and the
sources of these perspectives are attributed in this report.
While the participants were encouraged to lead the discussions toward whatever subjects they felt most
relevant, the following list of questions was provided in advance to provide context and stimulate thought.
1. What are the most prevalent applications and duty cycles for these vehicles? Are Class 2b vehicles
used in different ways by customers than Class 3 vehicles? Is there any information you can provide
on average fuel use per vehicle, operating weights, daily range, and average annual vehicle miles
traveled?
2. Comparing use environment and duty cycle to light vehicles, what are the significant differences that
would impact electric vehicle technology specification and design?
3. What typical payback periods do Class 2b and 3 customers expect for new technologies in their
vehicles? What other metrics, if any, do these customers use to decide whether or not to purchase new
technologies? What main values drive purchase decisions?
4. Can you offer any insight on general rules of thumb for what production/sales volumes would be
necessary in this market to achieve economies of scale / market sustainability in this market?
5. What is your view on electrification as a viable option in the Class 2b and 3 market? (In this context,
we are viewing “electrification” as a vehicle with plug-in capability and some all-electric range.)
6. Are there particular applications or niches within the 2b and 3 market that would be good
opportunities for electrification, and why? Any niches that would not be well-suited to electrification?
7. What has your experience been to date with electrification in the Class 2b and 3 market? Have the
vehicles been well-received by fleets and drivers?
8. What would you see as the major benefits of electrification for this market? (Efficiency, exportable
power, idling reduction, etc.)
9. What would be the major barriers to success of electrification in this market? Technical,
market/economic, customer acceptance, etc.?

3
10. Are there technical or cost gaps that federal research can address to make electrification more viable
in this market?

4
5
2. MARKET OVERVIEW
2.1 CLASS 2B-3 MODELS AND SALES
The Federal Highway Administration (FHWA) separates highway vehicles into eight size classes based
on gross vehicle weight rating (GVWR). Class 2 is split into 2a (6,001-8,500 lbs GVWR) vehicles, which
are generally considered light duty and regulated for fuel economy as light duty vehicles, and 2b (8,500-
10,000 lbs GVWR). Class 2b vehicles include heavy duty pickup trucks, sport utility vehicles (SUVs),
and full-size vans, as well as some chassis cab trucks and cutaway vans at the upper limit of the weight
class. Table 1 lists several examples of class 2b trucks. In many cases, manufacturers of class 2 pickups
and vans offer these vehicles in both 2a and 2b versions. As a result, model names are not always
sufficient to determine if a vehicle is classified as 2a or 2b.
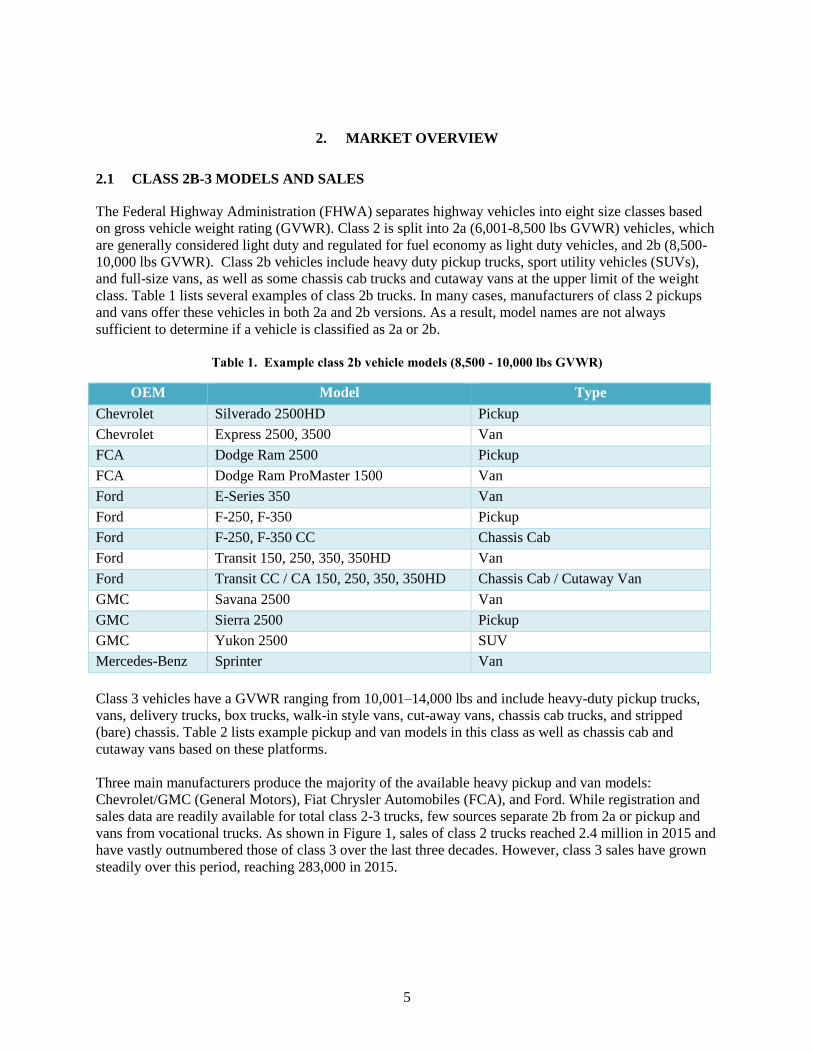
Table 1. Example class 2b vehicle models (8,500 - 10,000 lbs GVWR)
OEM Model Type
Chevrolet Silverado 2500HD Pickup
Chevrolet Express 2500, 3500 Van
FCA Dodge Ram 2500 Pickup
FCA Dodge Ram ProMaster 1500 Van
Ford E-Series 350 Van
Ford F-250, F-350 Pickup
Ford F-250, F-350 CC Chassis Cab
Ford Transit 150, 250, 350, 350HD Van
Ford Transit CC / CA 150, 250, 350, 350HD Chassis Cab / Cutaway Van
GMC Savana 2500 Van
GMC Sierra 2500 Pickup
GMC Yukon 2500 SUV
Mercedes-Benz Sprinter Van
Class 3 vehicles have a GVWR ranging from 10,001–14,000 lbs and include heavy-duty pickup trucks,
vans, delivery trucks, box trucks, walk-in style vans, cut-away vans, chassis cab trucks, and stripped
(bare) chassis. Table 2 lists example pickup and van models in this class as well as chassis cab and
cutaway vans based on these platforms.
Three main manufacturers produce the majority of the available heavy pickup and van models:
Chevrolet/GMC (General Motors), Fiat Chrysler Automobiles (FCA), and Ford. While registration and
sales data are readily available for total class 2-3 trucks, few sources separate 2b from 2a or pickup and
vans from vocational trucks. As shown in Figure 1, sales of class 2 trucks reached 2.4 million in 2015 and
have vastly outnumbered those of class 3 over the last three decades. However, class 3 sales have grown
steadily over this period, reaching 283,000 in 2015.

6
Table 2. Example class 3 vehicle models (10,001-14,000 lbs GVWR)
OEM Model Type
Chevrolet Silverado 3500HD Pickup
Chevrolet Silverado 3500HD Chassis Cab Chassis Cab
Chevrolet Low Cab Forward 3500 Chassis Cab
Chevrolet Express Cutaway 3500 Cutaway Van
FCA Dodge Ram 3500 Pickup
FCA Dodge Chassis Cab 3500 SLT Chassis Cab
Ford E-350 Stripped Chassis Stripped Chassis
Ford F-350, F-450 Pickup
Ford F-350, F-450 Pickup
Ford Transit 350HD Van
Ford Transit CA / CC 350HD Chassis Cab / Cutaway Van
GMC Sierra 3500 PU Regular Pickup
Figure 1. Historical class 2-3 truck sales.
Source: Davis, Williams, & Boundy (2016) Transportation Energy Data Book, Ed. 35. Original source: Ward’s
Communication’s, Motor Vehicle Facts and Figures, annual.
A number of factors have reportedly driven an increase the market for these smaller commercial trucks,
particularly those powered by gasoline engines. Rising fuel costs over the past two decades have driven
fleets to decrease fuel use and operating costs in general. The cost of diesel engines and diesel engine
maintenance rose with the implementation of more stringent diesel engine emission standards in 2007 and
2010. Meanwhile, the fuel economy of gasoline engines has improved, closing the gap between gasoline
and diesel engines. As a result of these pressures, fleets have moved from diesel to gasoline and
downsized both engines and vehicles wherever possible. Meanwhile, OEMs have sought to improve the
performance of smaller commercial vehicles and increase the models and options available. One notable
recent development in this market is the introduction and increasing popularity of “Euro-style vans” such
as the Ford Transit, Ram ProMaster, and Mercedes-Benz Sprinter. These front-wheel drive vans are
available with both diesel and gasoline engines, are customizable, and offer increased fuel economy,
lower floor height for easier loading, a tighter turning radius, and generally easier drivability. High-roof
Euro-style vans are gaining popularity as mobile work centers because they allow the user to stand
upright inside the van to perform necessary tasks.

7
The majority of class 2 sales are 2a trucks. Based on analysis of IHS Polk registration data by the U.S.
Energy Information Administration, about 400,000 class 2b and 140,000 to 170,000 class 3 trucks were
sold annually between 2012 and 2014.2 Roughly 90-95% of class 2b sales and 80-85% of class 3 sales are
pickups and vans. This indicates total annual sales of class 2b-3 pickups and vans at about 475,000-
500,000.3 While these numbers seem small in comparison to the 17.5 million light duty vehicles sold in
2015, they account for 55-60% of all class 2b-8 vehicle sales as illustrated in Figure 2. Consistent with
the registration data, the manufacturers who participated in this study reported that pickup trucks account
for the majority of 2b sales. The second largest sales volume in Class 2b are “box removed” chassis cabs
and cutaway vans that can be fitted with custom bodies.
Figure 2. Class 2b-8 vehicle registrations.
Source: Energy Information Administration, NEMS input file for AEO 2016; analysis by Energetics Incorporated.
Note: New vehicle registrations are vintage 1 in the NEMS input file as determined from model year.
Figure 3 shows the distribution of registered class 2b-3 pickups and vans by fuel type. Class 2b accounts
for 84% of heavy pickups and vans in use and 70-77% of sales. The fact that class 3 accounts for a higher
fraction of sales than total registrations may indicate growth in class 3 relative to 2b. About two thirds of
registered class 2b pickups and vans are powered by gasoline or gasoline flex-fuel engines, one third by
diesel, and a very small number (<1%) by compressed natural gas (CNG) and propane. Similarly, 62% of
class 2b sales are gasoline powered. The distribution for class 3 pickups and vans is reversed, with 72% of
vehicles in use fueled by diesel and 28% by gasoline. Sales of class 3 pickups and vans are less heavily
skewed toward diesel at 62%, possibly indicating a shift toward or growth in gasoline vehicles.
2 Annual sales by model year based on registrations. When compared to
Figure 1, these values imply that 2b trucks represent about 20% of class 2; however, the data are not directly comparable since
Figure 1 represents calendar year rather than model year sales. 3 These estimates are similar to sales of ¾ and one-ton pickups (422,236 in 2012 and 535,205 in 2013) reported by
PickupTrucks.com at http://news.pickuptrucks.com/2013/03/update-total-retail-fleet-2012-sales.html and
http://news.pickuptrucks.com/2014/04/who-sold-the-most-pickups-in-2013.html.

8
Figure 3. Class 2b-3 pickups and vans by fuel type.
2.2 VEHICLE USAGE
Class 2b-3 vehicles are used by both individuals for personal use and by businesses for commercial use.
One stakeholder referred to this market class as “fleet-tail,” indicating the combination of commercial
fleet and retail sales in terms of ownership and usage. Unfortunately, there is no publicly available recent
information on how these vehicles are used.4 Even registration ownership information can be misleading
since small businesses and self-employed individuals may use privately registered vehicles for company
business with reimbursement for mileage.
As discussed above, class 2b vehicles include pickup trucks, some sport utility vehicles (SUVs), full-size
vans, and chassis cab trucks, with pickup trucks accounting for the majority of sales. Vans and bare
chassis trucks account for the second largest sales volume. Body up-fitters customize bare chassis trucks
to provide work trucks, including dump, utility and service body, and tow and wrecker trucks, etc. Class
2b vehicles are used for both personal (recreational, family, etc.) and commercial purposes. Stakeholders
indicated that about half of class 2b truck usage is for commercial purposes and half for personal
purposes.
Class 3 vehicles include pickup trucks, vans, light dump trucks, flatbed trucks, dry bulk/tank trucks, and
tow trucks. Class 3 vehicles also includes a few smaller light cranes and bucket trucks and other special
purpose vehicles. As illustrated in Figures 2 and 3, there are fewer class 3 vehicles on the road than class
2b vehicles. According to stakeholders, they also are more utilitarian and are more likely owned by
businesses than individuals. Stakeholders indicated about 90% of these vehicles are used for commercial
purposes.
2.2.1 Fleet Size
Industry analysts claim that larger fleets are more likely to take risks and adopt new technologies.
Possible reasons are that these companies have better cash flow and more resources to invest; can test out
a few vehicles in their fleet without impacting a significant portion of their operations; have employees
dedicated to searching for potential cost savings; may have existing access to or the ability to construct
their own fueling or charging infrastructure; and may have environmental sustainability initiatives and
professionals on staff. Meanwhile, smaller fleets often buy the same type of vehicle over time and wait
for larger fleets to test new technology and prove the benefits. This may be due to general risk aversion; a
lack of resources to research new options and train personnel on the use, maintenance, and repair of new
4 The Vehicle Inventory and Use Survey (VIUS), last performed in 2002, remains the most recent source of nationally
comprehensive, public data on truck usage (annual miles of travel, trip distances, operating weight, etc.) (U.S. DOC, 2004). The
sample size for pickups and vans in 2002 was extremely small and most industry experts feel this market has changed
dramatically over the last 15 years.

9
vehicles and technologies; and tight cash flow which results in the inability to survive disruption. For
small fleets in smaller towns, technology choice may be constrained by what is available in the local
market.
Class 2b-3 pickups and vans are found in a range of fleets across a wide variety of industry sectors.
Stakeholders indicated that they are used as delivery and work vehicles for organizations of varying sizes
from small family owned companies to large corporations. There were differing opinions among
stakeholders on the proportion of vehicles used in small fleets compared to large fleets and some of these
differences may represent differences in each manufacturer’s market. One manufacturer reported that
most 2b-3 customers were large delivery fleets. Another reported that the class 2b customer base is
roughly half large and half small fleets while the class 3 market is probably 60% large fleets. Another
reported that as much as 75% of sales were used in small fleets of 2-10 vehicles.
Utilities and the telecommunications industry have a strong market presence in these classes and many of
these entities purchase vehicles in relatively large quantities. However, one stakeholder reported that
these purchases together account for less than 25% of class 2b-3 sales. Another pointed out that although
one customer may buy a large number of one make and model, they will require multiple configurations,
such as 2-wheel and 4-wheel drive, dual axle, extended and standard cab, power take-off (PTO) and
powered equipment, export power, and other options. This makes the development, optimization, and
production of electrified powertrains much more complex as multiple drivetrains may be required and
sales volumes for each may be quite small. Delivery fleets represent another large market segment and
companies use anywhere from a few to 500 cargo vans depending on whether the company is in an urban
or rural setting. Municipal fleets are also significant customers.
2.2.2 Use
Stakeholders across the board stressed that the usage of class 2b-3 trucks is substantially different from
light duty vehicles and covers a wide range of applications and usage profiles, with variation from
company to company and day to day for any one company. The versatility of these vehicles is a major
asset since many do not follow a set schedule, route, or duty cycle, and needs change from day to day.
Another highly valued feature in this market is the ability to customize the truck with a body tailored to a
customer’s needs. One stakeholder called all of class 2-5 the “Swiss army knives” of trucks.
There is no single comprehensive data base of user applications, body upfits, or duty cycles, though some
manufacturers may have data on how their vehicles are used. Several stakeholders acknowledged that
their perspectives were based on a subjective understanding of anecdotal information. However,
stakeholders agreed that most of class 2b-3 vehicles are used primarily for local driving. The vehicles are
often kept at a central location, driven only a few miles away, and then returned. Many are used to
transport work crews and equipment to job sites and the vehicles often are used as “tool lockers,” carrying
all the equipment or parts that may be needed on any given day. Average usage is about 15,000 miles per
year, but this varies considerably, and larger fleets may see much higher mileage.
Idling is often a significant portion of the vehicle duty cycle, representing 30-50% of in-use time for
urban fleets while rural fleets see less idle and more mixed use. These trucks may be sold with only
30,000-40,000 miles on the odometer but as much as 15,000 hours on the engine.
Stakeholders mentioned several specific applications for class 2b-3 pickups and vans, listed below, that
demonstrate the wide range of uses. All of these applications have challenging characteristics that may
make these less-desirable candidates for electrification.

10
Traffic duty, emergency, and road and other construction vehicles with short daily travel of 20-30
miles but high idle times. Many have a primary function that includes running safety lighting and
flashers that require power while stationary for extended periods. These vehicles may also need to
be capable of towing equipment to the work location.
Emergency vehicles such as ambulances that are idled while waiting to be dispatched, often in the
field, and require cab comfort (heat and air conditioning).
Limos, shuttles, and taxis with continuous driving.
Utility vehicles with short daily driving range, high idle time, and high demand for on-site power
for cab comfort, mobile office equipment, and powered heavy equipment.
Recreational vehicles with low annual mileage but high trip range.
Short range, non-rural, hub-and-spoke delivery with consistent customers and routes, such as
postal and parcel delivery.
Short range service and delivery without consistent customers and routes, such as florists,
catering, plumbing, etc.
Class 3 trucks used for light commercial hauling and expedited shipping with daily round trips of
200 miles.
2.3 RESEARCH STATUS
PEVs can offer fuel cost savings compared to conventional vehicles but are more expensive to purchase at
present due to the cost of the batteries and electric drive systems. The essential components of hybrid and
PEV propulsion systems include electric motors, inverters, DC/DC converters, and on-board chargers.5
Increasing the adoption of electric drive technologies depends on improving the economics, particularly
for commercial fleets who are sensitive to cost-benefit tradeoffs. National laboratories and industry
partners have collaboratively pursued research and development (R&D) to reduce the cost and improve
the performance of innovative electric drive devices, components, and systems. This research addressed
the cost, volume, and weight of batteries with R&D at the cell and module level through the investigation
of new electrochemistries and materials. This research also targeted electric traction drive system cost,
weight, volume, performance, and efficiency. This section provides a brief overview of recent R&D
related to commercial vehicle electrification. Because little work has directly focused on the needs of the
class 2-3 market, this summary also includes light duty projects involving vans and SUVs.6
Plug-In Hybrid Medium-Duty Truck Demonstration and Evaluation Program: Sponsored by DOE
using American Recovery and Reinvestment Act of 2009 (ARRA) funding, this program developed a
path to migrate PHEV technology to medium-duty vehicles through the demonstration and evaluation of
vehicles in diverse service applications. DOE partners included: the California Energy Commission, the
South Coast Air Quality Management District, the Electric Power Research Institute (EPRI), Odyne
Systems, Inc, VIA Motors, Inc., Southern California Edison, utility participants, and municipal industry
5 The Alternative Fuels Data Center's pages on hybrid and plug-in electric vehicles provide a general overview of electric drive
vehicles: http://www.afdc.energy.gov/vehicles/electric.html. 6 Additional information on DOE R&D can be found on the EERE website: http://energy.gov/eere/vehicles/vehicle-
technologies-office-plug-electric-vehicles-and-batteries.

11
participants.7 The program partners designed, developed, validated, produced, and tested a total of 296
PHEVs as well as a smart charging system. Production-ready PHEV systems include 119 Odyne Class 6
to 8 trucks, 125 VIA half ton pickup trucks, and 52 VIA three-quarter-ton vans (class 2a). Team
participants gathered evaluation data during drive, charge, and stationary events in order to investigate
performance improvement and cost reduction opportunities. The program was completed in July, 2015.
Odyne and VIA are now producing vehicles developed under this program; the VIA vehicles are
summarized in Section 2.4.
Advancing Transportation through Vehicle Electrification – PHEV: This ARRA cost-shared
program supported FCA US LLC’s light-duty electric drive vehicle and charging infrastructure-testing
activities. Although the program did not involve medium duty vehicles, it supported development of
related technologies for use in vans. The project team evaluated and demonstrated advanced PHEV
technologies across a range of geographic, climatic, and operating environments in order to gain a better
understanding of usage and operational needs. This allowed FCA to refine vehicle specifications that
ultimately contributed to development of the Chrysler Pacifica PHEV, the first plug-in minivan available
in the U.S beginning in MY2017. The project was completed in December 2014.8
Ford Plug-In Project: Bringing PHEVs to Market: This cooperative project was led by the Ford Motor
Company in collaboration with the Electric Power Research Institute (EPRI), multiple utilities, the New
York State Energy Research and Development Authority, and others. Company, demonstrated the
feasibility of PHEV technology and improved the interface of the technology with the grid. Using MY
2008-2009 Escape SUVs, Ford developed 21 demonstration prototype PHEVs that were tested in project
partner fleets. The project successfully demonstrated the feasibility of bi-directional Smart Meter
communication with the electrical grid and supported EPRI’s development of a fleet charging aggregator
simulation tool to assess the potential for vehicle impact on the grid. Completed in 2014, the project
results contributed to the introduction of two mass production PHEVs in North America, the Ford C-
MAX Energi and Ford Fusion Energi.9
Medium-Duty Urban Range Extended Connected Powertrain: This project is a collaboration between
Robert Bosch LLC, Morgan Olson, NREL, the University of Michigan, and several other partners. The
project goal is to achieve a 50% reduction in fuel consumption for a class 4 delivery truck with a payback
period of less than three years and an all-electric range of more than 35 miles. The team developed its
plug-in hybrid vehicle powertrain design on electric drive components based on those for higher-volume
light-duty vehicles. This project is still ongoing as of this writing, with completion in late 2019.
2.4 COMMERCIAL STATUS OF ELECTRIFICATION
As of the completion of this study, there are no class 2b-3 plug-in pickup truck models available for
purchase in the U.S. However, Phoenix Motorcars and Zenith Motors offer BEV passenger (shuttle) and
cargo vans and bare chassis trucks in this class. As shown in Table 3, both manufacturers install electric
drivetrains on chassis purchased from major OEMs (Ford E350 and E450 and Ram ProMaster). VIA
Motors produces class 2a PHEV pickups and vans based on GM platforms and is reportedly working
toward a class 2b offering. Two additional manufacturers have announced that they will be producing
PHEV pickup trucks. Workhorse expects their class 2a pickup to be available in 2018 and will be the first
7 Additional information is available at http://www.osti.gov/scitech/biblio/1234437-plug-hybrid-medium-duty-truck-
demonstration-evaluation, https://avt.inl.gov/sites/default/files/pdf/phev/VTRUXPickupTruck.pdf, and
https://avt.inl.gov/sites/default/files/pdf/phev/VTRUXVan.pdf. 8 Additional information is available at http://www.osti.gov/scitech/biblio/1182581-advancing-transportation-through-vehicle-
electrification-phev. 9 Additional information is available at http://www.osti.gov/scitech/biblio/1133132-ford-plug-project-bringing-phevs-market-
demonstration-validation-project.
12
electric vehicle manufacturer to produce their own pickup chassis. XL Hybrids is a major manufacturer of
drivetrain systems as a Ford Qualified Vehicle Modifier for commercial hybrid vehicles (not plug-ins)
and announced that they would be selling a PHEV pickup in the third quarter of 2017. Full specifications
were not available for the XL Hybrids pickup which is based on a Ford F150 chassis, so it is unclear
whether this will be a class 1 or 2a vehicle. In September 2017, Lightning Systems announced that it
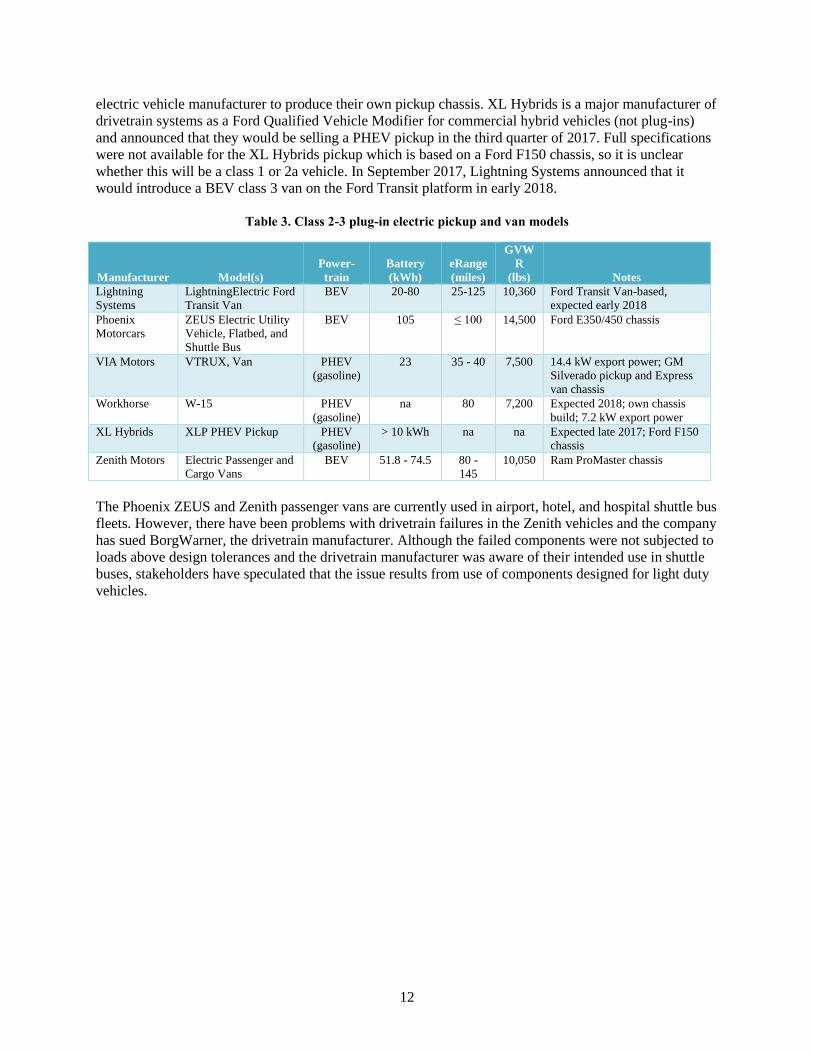
would introduce a BEV class 3 van on the Ford Transit platform in early 2018.
Table 3. Class 2-3 plug-in electric pickup and van models
Manufacturer Model(s)
Power-
train
Battery
(kWh)
eRange
(miles)
GVW
R
(lbs) Notes
Lightning
Systems
LightningElectric Ford
Transit Van
BEV 20-80 25-125 10,360 Ford Transit Van-based,
expected early 2018
Phoenix
Motorcars
ZEUS Electric Utility
Vehicle, Flatbed, and
Shuttle Bus
BEV 105 ≤ 100 14,500 Ford E350/450 chassis
VIA Motors VTRUX, Van PHEV
(gasoline)
23 35 - 40 7,500 14.4 kW export power; GM
Silverado pickup and Express
van chassis
Workhorse W-15 PHEV
(gasoline)
na 80 7,200 Expected 2018; own chassis
build; 7.2 kW export power
XL Hybrids XLP PHEV Pickup PHEV
(gasoline)
> 10 kWh na na Expected late 2017; Ford F150
chassis
Zenith Motors Electric Passenger and
Cargo Vans
BEV 51.8 - 74.5 80 -
145
10,050 Ram ProMaster chassis
The Phoenix ZEUS and Zenith passenger vans are currently used in airport, hotel, and hospital shuttle bus
fleets. However, there have been problems with drivetrain failures in the Zenith vehicles and the company
has sued BorgWarner, the drivetrain manufacturer. Although the failed components were not subjected to
loads above design tolerances and the drivetrain manufacturer was aware of their intended use in shuttle
buses, stakeholders have speculated that the issue results from use of components designed for light duty
vehicles.

13
3. MARKET ENVIRONMENT
This section provides an overview of the manufacturing and sales environment for the class 2b-3 vehicle
market in order to understand the challenges and potential opportunities presented. This environment has
changed fairly rapidly over the past two decades and has affected how OEMs design, produce, market,
and sell vehicles.
Despite their physical similarities to light duty vehicles, class 2b-3 vans and pickup trucks are considered
commercial vehicles and are exempt from the light duty Corporate Average Fuel Economy (CAFE)
standards authorized by Congress in 1975.10
The U.S. did not establish fuel consumption standards for
medium- and heavy-duty vehicles, including commercial pickups and vans, until 2011. However, the
OEMs that produce class 2b-3 pickups and vans also produce class 1-2a vehicles and the majority of the
vehicles these OEMs produce are subject to the light duty CAFE standards. In addition, these OEMs are
required to meet the requirements of the Advanced Clean Cars (ACC) Program established by the State of
California in 1990 and more recently adopted by nine other states. Meeting these requirements has a
direct impact on R&D and product planning, which presents both barriers to and opportunities for the
development of PEV options in class 2b-3.
This section provides an overview of the fuel consumption standards that apply to class 2-3 (8,500-14,000
lb GVWR) pickups and vans, as well as the ACC Program for light vehicles. This discussion serves as
background for the stakeholder perspectives included in Sections 0 and 0.
3.1 FUEL CONSUMPTION STANDARDS
In 2011, the EPA and the National Highway Traffic Safety Administration (NHTSA) established the first
fuel consumption standards for vehicles with GVWR above 8,500 lb.10
This Phase 1 Rule covered model
years 2014-2018 (EPA & NHTSA, 2011). In 2016 the EPA and NHTSA adopted a more stringent Phase
2 Rule that will be fully implemented by model year 2027 (EPA & NHTSA, 2016). The fuel consumption
standard for class 2b-3 pickup trucks and vans depends on fuel type (gasoline or diesel) and “work
factor.” The work factor is a linear function of payload and towing capacities and whether the vehicle is
four- or two-wheel drive, with higher capacity vehicles having less stringent standards. The relationship
between work factor and the fuel consumption standards, expressed in miles per gallon, is shown in
Figure 4 for the beginning and ending dates of the Phase 1 (2014 and 2018) and Phase 2 (2020 and 2027)
rules.11
10 Beginning in 2012, the light-duty CAFE standards cover medium-duty passenger vehicles with GVWR between 8,500-10,000
lbs, specifically sport-utility vehicles and passenger vans with less than a 13-person seating capacity. 11 The fuel consumptions standards in gallons per 100 miles are an increasing linear function of work factor. Fuel economy
(miles per gallon) is the inverse of fuel consumption, resulting in an asymptotically decreasing function as shown.

14
Figure 6. Increase in mandated ZEV/TZEV sales through 2018.
4a) Diesel Standards 4b) Gasoline Standards
Figure 4. Fuel consumptions standards as a function of work factor.
The standard for gasoline vehicles represents a 9.3-9.4% increase in fuel economy from 2014 to 2018
(Phase 1) and an additional 16.4-16.5% from 2021-2027 (Phase 2), for a total increase of 30.5%. The
required improvement for diesel vehicles is higher at 14.9% in Phase 1, 16.4-16.5% in Phase 2, and about
37% overall. The impact of these standards on class 2b-3 pickup trucks is illustrated in Figure 5, based on
typical 2016 vehicle specifications. It should be noted that graph presented is for illustration only since it
assumes constant vehicle payload and towing capacities which may actually change over time.
4a) Diesel Pickup Models 4b) Gasoline Pickup Models
Figure 5. Illustration of fuel consumption standard for class 2b-3 pickup trucks.
3.2 ADVANCED CLEAN CARS PROGRAM
The California Advanced Clean Cars (ACC) Program requires that a percentage of light vehicle sales in
California are zero emission vehicles
(ZEVs) that emit no tailpipe emissions
from the onboard source of power (such
as BEVs and fuel cell vehicles), or
Transitional Zero Emission Vehicles
(TZEVs), which have no tailpipe
emissions for some portion of their
driving (such as PHEVs). As of 2017,
nine states other states have also chosen
to adopt the ACC Program:
Connecticut, Maine, Maryland,
Massachusetts, New Jersey, New York,
Oregon, Rhode Island, and Vermont.

15
Large vehicle manufacturers are required to meet a certain ZEV sales percentage depending on their
average annual sales. ZEV sales are tabulated using a credit system (CARB, 2016), where between 1 and
4 credits are generated per ZEV sold based on the vehicle’s all-electric range on the EPA city driving
cycle. The sum of total credits earned through ZEV sales is required to be a certain percentage of the
manufacturers’ actual annual sales volume (CARB, 2016). Figure 6 shows the required credits as a
percentage of sales for model years 2018 through 2025.
In addition to sales of ZEVs, credits can be earned by selling TZEVs or neighborhood electric vehicles,
demonstrating advanced technology, and other measures. Since a single credit is not equivalent to a single
ZEV sale it is difficult to exactly predict future ZEV market share, but about 15.4% of new vehicles sold
in participating states will be required to be ZEVs by 2025 (CARB). Although the ACC Program
currently only applies to sales of light vehicles, these requirements apply to the majority of the vehicles
manufactured by the OEMs that also produce class 2b-3 pickups and vans.

16

17
4. MARKET VIABILITY
The class 2b-3 market represents significant annual sales of almost half a million vehicles per year as
noted above. The market is quite complex with multiple duty cycles, vehicle applications, and fleet
customers, and at least some applications and customers would benefit from electrification if it were
offered. This section explores the stakeholder feedback concerning the aspects of consumer demand,
production volumes and economies of scale, manufacturer reluctance/willingness to develop electrified
2b-3 products, technology readiness and alignment with customer needs, the most promising applications
for electrification, purchase decision drivers and processes, consumer willingness to adopt new
technology, and potential benefits to the consumer.
At a high level, the stakeholders noted that consumers may not be willing to pay the additional cost for
electrification and may not understand the utility of the technology. Production volume will be critical for
reducing cost and increasing sales. This volume could come by exploring crossovers of electrification
technology between the 2b-3 market and larger or smaller truck classes. Consumers are not interested in
electrified 2b-3 trucks because of a lack of product, and small manufacturers are reluctant to enter the
space because of potential competition from larger OEMs. There are several potential applications for
both PHEV and BEV technology in this space. The customer is most interested in getting a vehicle that
can perform the intended tasks and less interested in fuel economy. Finally, larger fleets are the ones more
likely to adopt new technologies such as electrification.
4.1 CONSUMER DEMAND
Stakeholder feedback on the market demand
for class 2b-3 PEVs was somewhat mixed. At
least one OEM indicated that they had not seen
any U.S. customer demand for hybrids or
PEVs. They felt that, while a few
environmentally focused customers might be
interested, there would not be widespread
adoption. Even if they could demonstrate an
attractive financial payback, customers would
reject the technology due to a reduction in
cargo capacity resulting from reduced payload
volume or increased vehicle weight. Other
stakeholders reported that fleets, especially
larger companies, have expressed a
considerable amount of interest in electrification and in incorporating environmental sustainability into
business practices. These stakeholders conveyed a general industry perspective that transportation
electrification is not a passing trend but rather an inevitability and only a question of when and in which
markets it will first occur. Manufacturers with international sales indicated that this was particularly true
in Europe, noting that nearly all commercial vehicle manufacturers at the 2016 International Motor Show
in Hannover, Germany, displayed commercially-available or concept PEVs.12
Stakeholders felt this
activity was driven in part by proposals in several cities that would ban use of internal combustion
engines (ICEs) within city limits as well as announcements by other countries of goals to eliminate use of
ICE nationally.
12 Known in German as the Internationale Automobil-Ausstellung (IAA, or International Automobile Exhibition), this show
features passenger vehicles in odd numbered years and commercial vehicles in even numbered years.
Key Findings – Demand
▫ Consumers may not see the utility in the technology and may not choose it even if financials make sense.
▫ Market forces may result in unintended consequences with electrification (added weight, etc.) that may be counter-productive relative to overall goals such as reducing petroleum use.
▫ Consumers are often sensitive to initial capital cost and are not willing to pay for new technology.

18
One stakeholder commented that electrification is the assumed solution for reducing emissions but may
not be the best approach for all applications. Other technologies could reduce emissions, have less impact
on the customer, and offer broader applicability. Examples of alternative solutions include improved
combustion engines, idle reduction technologies, natural gas engines, hybrid electric powertrains, and
other technologies. In addition, this stakeholder indicated that a push toward electrification in the 2b-3
class could potentially result in unintended consequences. For example, the added weight could shift
vehicles up in weight class. If vehicle capabilities are reduced or only electrified options are available,
there could potentially be a market shift toward larger class vehicles which would reduce emission
benefits. This stakeholder stressed that the market is too complex for a “one-size-fits-all” solution and that
the industry needs a technology that is non-intrusive, that equally benefits all players, and does not overly
burden any one party.
While some fleet customers have expressed interest in PEVs, their willingness to pay appears to be quite
low. One stakeholder indicated that utility fleets have expressed interest in PEV pickups since pickups
constitute a large portion of their vehicle fleet. However, these fleets believed that a major OEM would be
capable of producing the PEV at a much lower cost than an upfitter and they were only interested in
purchasing PEVs if the cost was the same as or slightly higher than a conventional vehicle.
4.2 PRODUCTION VOLUME
Stakeholders identified achieving higher
production volumes as a critical issue in
market viability. VIA’s final project report
estimated component cost reductions of about
40% by increasing production to 3,000 units
(Miyasato & Kosowski, 2015). Stakeholders
indicated that production for upfitters could be
sustainable at 5,000 to 10,000 units per year.
Sales around 10,000 units per year for 5 years
would allow economies of scale and enable
process improvements that reduce production
costs, taking out as much as 45% of the small
volume cost. The economics would be further
improved if OEMs provided the chassis without the content (engine and transmission) that the upfitters
remove. With this combination of factors and gasoline prices around $2.50, PEV economics could be
favorable.
Higher production volumes would be necessary for the market to be attractive to major OEMs. Success in
the light vehicle market is measured at 100,000 to 200,000 units sold per year. A new introduction might
be profitable if the first year sales are between 20,000 and 50,000 and the second year sees sustained
growth. For major manufacturers that sell both light vehicles and heavy commercial pickups, it is difficult
to justify sustained losses over 5 years without an indication of growing demand.
Stakeholders indicated that low production volume creates significant component supply issues. In the
case where components or suppliers are common to light vehicles where production is relatively high, the
suppliers charge higher prices to the low volume (commercial vehicle) purchasers and / or assign them
low priority, resulting in delivery delays. When components are unique to commercial vehicles,
manufacturers have even less market leverage with suppliers due to new and challenging design
specifications. However, increasing production volume can be a double-edged sword in the early
production phase when supply contracts may fix component costs based on first year volume. If
Key Findings – Production Volume
▫ Manufacturers need increased production volumes in order to reduce production costs and sales prices.
▫ Low production volume results in component supply issues.
▫ Manufacturers need to identify synergies and opportunities to share technologies with classes above and below 2b-3.

19
manufacturers lose money on each vehicle sold in this phase, higher production volumes simply equate to
higher losses.
Because of the relatively small commercial vehicle sales volumes in comparison to light vehicles, the
ability to share components across classes is key to realizing cost reductions and technological learning,
even for conventional vehicle technology. Electrification efforts for commercial vehicles have focused on
heavier weight classes. Therefore, identifying any possible synergies with class 4-5 vehicles or those
with a GVWR just over 14,000 lbs. would enhance the viability of class 2b-3 electrification. This could
simultaneously take advantage of lessons learned and provide economies of scale in component
technologies. The ability to spread costs over global product lines would also be beneficial. However,
product preferences differ internationally. For example, while full size pickups dominate the U.S. market,
midsize pickups are more prevalent globally. Differences in safety and emissions requirements further
complicate designing for the global market.
4.3 MANUFACTURER ACTIVITY
As of the date of this publication, no major
truck manufacturers are actively pursuing
electrification of class 2b-3 vehicles. Smaller
startup companies are manufacturing class 2b-
3 PEVs as upfits to volume OEM chassis, such
as the class 3 shuttle and cargo vans and bare
chassis trucks produced by Phoenix Motorcars
and Zenith Motors and the class 3 van from
Lightning. No manufacturers currently produce
class 2b-3 PEV pickup trucks, though VIA
Motors sells a class 2a PHEV pick-up and is
reportedly working on a class 2b. XL Hybrids
recently announced development of a PHEV based on the F-150 platform which may be class 2a.
Workhorse is the only small manufacturer to announce development of a PHEV pickup (in class 2a)
based on their own chassis specifically designed to be lightweight to accommodate the added battery
weight of PEV applications. There has been much more activity with both manufacturers and fleets in
integrating hybrid drivetrains rather than plug-in solutions, particularly in class 3.
Stakeholders indicated that manufacturers may be reluctant to enter this market due to possible future
competition from major OEMs should they decide to build their own PEV solutions. Stakeholders also
commented that, although PHEVs provide efficiency benefits relative to vehicles powered solely by
gasoline engines, they compete with very efficient diesel engines and a diesel-electric PHEV would be a
very expensive system. Therefore, for both efficiency and cost considerations, PHEVs typically
incorporate a downsized gasoline engine. One stakeholder cited the lack of a smaller gasoline engine in
their product lineup as a significant barrier to PHEV development.
Major OEMs may also face resource constraints posed by competing priorities. Fuel consumption
standards for commercial vehicles became effective in 2014 and are increasing in stringency. Between
2014 and 2027, the fuel economy requirements for class 2b-3 pickups increase 30% for gasoline and 37%
for diesel trucks (EPA & NHTSA, 2011; EPA & NHTSA, 2016). Implementing PEV technologies may
be one strategy to meet these standards, but this would require significant investment in product
development. Meanwhile, these OEMs are also required to meet ACC Program requirements to develop
and sell ZEV light vehicles in California and nine other states. They already have billions of dollars
invested in development of light duty PEVs and, despite great technological achievements and cost
reductions, sales remain low and the vehicles remain unprofitable. This makes it difficult to justify
Key Findings – Manufacturer Activity
▫ Consumer choice of electrification limited by lack of available products.
▫ Small manufacturers reluctant to enter 2b-3 market because of potential future competition from major OEMs.
▫ Manufacturer resources constrained by competing priorities.

20
investment of several billion dollars to design a PEV pickup or van for an unproven market. Even if
private or public funding were available, stakeholders indicated that they would not have the manpower
necessary. Consumer expectations increase with each vehicle generation, requiring engineers to focus on
performance. These major OEMs feel intense pressure to perfect the design of their light duty PEVs first.
When the focus for light duty shifts to cost reduction, then the engineering effort could be turned toward
new platforms.
4.4 TECHNOLOGY READINESS AND CUSTOMER NEEDS
While stakeholders generally believe there is a
viable market for class 2b-3 PEVs, they
indicate that current technology does not meet
fleet needs. In order to make investments in
PEVs, fleets need “ready-to-go” packages
rather than vehicles that are still in the
development phase. These perspectives echoed
stakeholders’ observations at the April 2016
Electrification Beyond Light Duty Workshop.
Manufacturers indicated that commercial
customers expected the purchase and use
experience to be the same for PEVs as for
conventional vehicles and that they became
frustrated by supply delays and
implementation issues.
Nearly all stakeholders stressed the need for a flexible solution that could be tailored to the needs of
various applications and duty cycles. Operators view their trucks as tools; the ability to perform their
required function is the primary factor in purchase decisions and class 2b-3 vehicles are valued for their
flexibility to meet highly variable job demands. Current PEVs are upfits on conventional chassis, which
can impact functionality. The added battery weight results in heavier vehicles and lower payload capacity,
while the added components sometimes interfere with custom body and equipment attachment points. An
ideal solution would involve a lightweight chassis, designed from the ground up for PEV needs, with
modular battery packs, and attachment access points. Examples cited by stakeholders included a delivery
vehicle with scalable battery packs and an extended range electric vehicle, ¾ or 1-ton pickup.
At the same time, owner feedback to OEMs regarding PEV technology is almost always positive, as the
technology has come a long way in the past 10 years. The VIA project sponsored by DOE, which
concluded in July 2015, included a survey of vehicle operators to gain feedback on vehicle performance
and driver satisfaction. Operating data for 151 vehicles show operation for a total of 16,220 hours and
82,520 miles over a period of 8 months. According to the final project report, fifteen operators responded
to the survey and rated their overall satisfaction at 6.9 out of 10 (Miyasato & Kosowski, 2015). They
rated the vehicles highest on ease of driving (all modes) and charging at 8.3 to 8.5. The vehicles scored
better on performance and “enjoyable to drive” in all-electric mode (7.1 and 7.8) compared to hybrid
mode (6.9 and 6.8). Just over half (57%) of the VIA van drivers stated that they would prefer the PHEV
as their main work vehicle.13
The vehicle features that drivers most preferred included the all-electric
mode, drive quality, and power / acceleration. When asked what features they would like to see improved,
the drivers’ largest concern was power when starting the vehicle on an incline. The respondents also
13 Preference was not available from the pickup drivers.
Key Findings – Technology Readiness
▫ Consumers expect electrified vehicle purchase and use experience to be similar to conventional vehicles.
▫ Consumers expect 2b-3 trucks to be flexible and adaptable to fleet needs and electrification solution must also be flexible.
▫ Current owners / operators generally are very happy with their electrified trucks.

21
indicated the need to improve noise, throttle response and consistency, electric range, and ride quality.14
When asked why employers would consider using of PHEV trucks, the drivers most frequently cited
improved fuel economy (100%), reduced emissions (83%), and reduced job site noise (50%).
These observations are consistent with recent industry announcements. Based on customer feedback, VIA
is reportedly working on a heavier PHEV pickup. Meanwhile, Workhorse is developing a PHEV pickup
with a purpose-built chassis rather than an upfit on an OEM chassis.
4.5 PROMISING APPLICATIONS
Several stakeholders felt that class 2b-3
vehicles are a good fit for electrification,
though not in all applications. Even in
applications where electrification can work
well, drivers may need to adjust their practices
to accommodate range limitations and
charging time. The following section
summarizes stakeholder thoughts on where
electrification likely would be viable and what
technology would be best suited. However,
stakeholders indicated that these impressions
were based on anecdotal information and that
actual usage data were necessary to determine
the feasibility of implementing PEVs in any
specific applications and how large that market
might be.
As discussed in Section 2.2, stakeholders consistently emphasized the great variation in duty cycles for
class 2b-3 pickups and vans among applications, among companies within industries or uses, from season
to season, and from day to day for any one company or operator. As a result, these vehicles are valued for
their versatility and flexibility for customization. Stakeholders felt that the most successful PEV for class
2b-3 would be a lightweight vehicle purpose-designed for electrification that could maintain cargo
(volume or weight) capacity and retain custom body attachment points. Modular and scalable battery
packs would allow fleets to customize the vehicles to their range and duty cycle requirements.
Many of the vehicles in this class are used in service industries and are driven short distances from the
place of business or fleet yard to the job site, often in traffic. The job site often requires power for truck-
mounted or mobile power equipment, laptops, warning lights, and cab comfort that typically is provided
by idling the vehicle’s engine. This short range, stop and go, duty cycle can be ideal for PEVs, while
exportable power can provide for jobsite needs. However, unpredictable job site demands can make
battery sizing difficult, while inconsistent and remote destinations can make recharging difficult.
Therefore, PHEVs may be an ideal solution for these applications. One stakeholder commented that the
stop/start, engine-off at idle, and regenerative braking technology of hybrid vehicles has a proven value,
delivering 20-30% reduction in fuel consumption in urban environments, even without plug-in or all-
electric driving capabilities. Applications for PHEVs identified by stakeholders include:
Utilities and telecommunications
Service providers such as landscapers, plumbers, electricians, and construction contractors
14 It was not clear from the report whether the need for improvements in noise level were related to engine noise in hybrid mode
or road noise in general.
Key Findings – Promising Applications
▫ Consumers and manufacturers see electrification working well in some applications.
▫ The class 2b-3 market is complex, with trucks used for many duty cycles, and therefore requires flexibility.
▫ PHEV applications: duty cycle with short driving distance and need for job site power (e.g., utilities).
▫ BEV applications: duty cycle with regular routes including frequent stops and potential for opportunity charging.

22
Emergency response such as ambulances, police, traffic control flaggers
Catering.
Stakeholders did identify some applications within the 2b-3 pickup and van market where BEVs would be
technically feasible. These applications have duty cycles with frequent stops that take advantage of both
regenerative braking and engine off at idle and regular routes with scheduled drop-off and pickup
locations that might allow for recharging during the work shift. Ideally, these vehicles would also be
lightly loaded or have decreasing load through the route, which reduces power demands when
accelerating from a stop. BEVs could also be ideal for applications with a constrained service area where
vehicles could take advantage of the short daily range, opportunities for recharging, and opportunities to
install charging infrastructure. Stakeholders indicated that the ideal route would be around 36 miles. For
urban routes, this would require a dependable, reliable BEV with a 50-60 mile range. Regular, scheduled
routes could allow for two or three daily shifts with breaks for recharging. These short haul applications
include:
Local / regional parcel delivery
Local / regional grocery delivery (baked goods, snacks, etc.)
Ridesharing, where vehicles drive about 30-50 miles one way
Passenger shuttles such as for churches, hotels, airports, and hospitals
Military, government, or educational campus fleets.
4.6 PURCHASE DECISIONS
Stakeholders agreed that fuel economy
generally is not the primary consideration of
class 2b-3 customers in selecting a vehicle.
Customers need a vehicle that is “the right tool
for the job,” so functionality and capability
(e.g. cargo weight or volume capacity) are the
primary considerations, along with safety.
Meeting these needs is complicated by the high
variability in duty cycle requirements across
and within applications. Because job
requirements vary from day to day and often
involve varying job site power demands, fuel consumption is unpredictable. However, stakeholders
indicated that all fleets worry about fuel consumption and that removing this worry is a major benefit of
electrification.
Assuming that the vehicle under consideration is capable of meeting the job requirements, owners use a
variety of approaches to make purchasing decisions. The approach used varies with fleet size, industry,
length of ownership, and individual preference. Stakeholders identified the following considerations used
by commercial vehicle buyers: upfront cost, payback period, return on investment, total cost of ownership
(TCO), and unique vehicle features.
Service providers, such as plumbers and landscapers, constitute a large portion of class 2b-3 vehicle
customers. These purchasers are mainly concerned with functionality and the financial bottom line. They
typically are motivated by either price point or by fuel savings and payback. Customers with fixed
budgets primarily consider upfront cost; adding safety and convenience at additional cost is not an option.
Upfront cost may also be the primary consideration for applications where daily usage is highly variable
and annual mileage or hours of usage are difficult to predict.
Key Findings – Purchase Decisions
▫ Consumers and manufacturers noted that the primary factor for vehicle selection is the ability to do the job rather than fuel economy.
▫ Beyond vehicle capability, many approaches are used to make purchasing decisions and approach varies with fleet size, industry, etc.

23
Fleets with consistent duty cycles, such as delivery or passenger shuttles with fixed routes, can manage
their fuel costs. These fleets may be more likely to use payback or return on investment for decision
making. Customers that use payback for purchase decisions must justify the additional technology cost
within their ownership period, even though the vehicles often have a “second life.” Therefore, customers
look for payback within 3-7 years. Stakeholders agreed that the ideal payback period was on the lower
end of this range but disagreed on the upper bound, with one indicating 3 to 4 years and another 3 to 5
years. Companies with highly visible trucks, such as telecommunications companies, may replace their
fleet relatively quickly (closer to 3 years) since the vehicle’s visual appearance impacts the company’s
public image. Government fleets usually keep their trucks for 7 to 10 years, and other fleets as much as 12
to 15 years. In general, fleets that turn over their vehicles more quickly are more concerned about residual
value than fleets that keep the vehicles longer. One stakeholder indicated that fleets that manage fuel costs
and calculate payback or lifecycle costs estimate typical mileage at 15,000 per year, though the number
can be drastically different for larger fleets and some specific commercial customers.
Purchasers that keep the vehicles longer are more likely to make decisions based on TCO and will
consider fuel used per day, miles driven, idle time, maintenance, and insurance. Some of these owners
will aim to keep the vehicle for the entire useful life of the chassis and replace parts and even the engine
as needed. This is particularly true if the duty cycle includes more stationary idling, with little wear and
tear on the chassis, versus driving long distances daily. These customers are concerned about battery
replacement costs and the unknown complication and cost of maintenance for PEVs.
4.7 WILLINGNESS TO ADOPT NEW
TECHNOLOGIES
Commercial vehicle customers generally are
risk averse; their companies’ profitability is
directly impacted by the vehicles’ ability to
perform their intended function reliably and
economically. Even if repairs are covered
under warranty, owners incur opportunity cost
from vehicle down time. Therefore, customers
must have confidence in both the vehicle and
the company from which they purchase it. This
requires sufficient reliability and warranty
coverage, but also a guarantee that
maintenance and repair service will be
available over the life of the vehicle, wherever the vehicle is employed. This may be one reason that fleets
often exhibit brand and model loyalty, purchasing the same vehicles over time.
One stakeholder pointed out that there is no lemon law for commercial vehicles, so customers bear the
burden if the vehicle is unfit for its intended use or does not prove to be reliable and durable.15
In
addition, federal law specifies required warranty terms for emission control equipment on vehicles with
internal combustion engines and requires on-board diagnostics to ensure that the systems are working
properly.16
BEVs are exempt from these requirements. As a result, environmental program managers and
15 The Magnuson-Moss Warranty Act, or Federal Lemon Law, covers only vehicles used for personal or household purposes.
State lemon law coverage varies and some states do cover commercial vehicles. The stakeholder that raised this issue manages a
fleet in a state whose lemon law applies only to personal or household vehicles. 16 For example, the EPA-established useful life for diesel engines used in class 2b-5 vehicles is 10 years or 110,000 miles. The
mandated warranty on emission control equipment on these vehicles is 5 years or 50,000 miles, whichever comes first, but not
less than the manufacturer’s mechanical warranty for the engine.
Key Findings – Adoption of Technology
▫ Commercial vehicle customers are risk averse and need confidence in the vehicle and in the company that makes it.
▫ Consumers need assurance that manufacturers will be in business to support vehicles over their lifetime.
▫ Larger fleets are more likely to be willing to adopt new technologies.

24
adopting fleets have no guarantee that BEVs will provide the lifetime benefits used to justify their
additional costs.
Several stakeholders stressed the need to ensure that purchasers will be supported by a full service
company and that they will be able to find parts to fix their vehicles after 5 or 10 years. Unfortunately, the
history of commercial PEVs has been marked by the very visible failure of several manufacturers within a
few years of product launch. Several of these companies used federal funds to successfully develop
vehicles that were well received by customers. However, these manufacturers were unable to secure
sufficient private funding to increase production levels and reduce costs to the point of profitability.
Owners were left without service support. When a third party service provider offered to step in, they
were denied access to proprietary information that would allow them to interpret on-board telemetry. This
history increases the perceived risk of investing in PEVs.
Finally, stakeholders observed that larger fleets are more likely to adopt new technologies, while smaller
fleets prefer to wait until the benefits and reliability of new technologies are proven by the larger fleets.
Smaller fleets are also more sensitive to acquisition cost relative to larger fleets. Stakeholders indicated
that larger fleets have the resources to be more innovative, while smaller fleets’ resources are consumed
by managing day to day business. As fleets grow, they are more likely to seek out opportunities presented
by new technologies. Therefore, stakeholders expect slower adoption rates for PEVs in smaller fleets
compared to larger fleets.
4.8 BENEFITS
Stakeholders provided their thoughts on the
benefits to electrification from the perspective
of manufacturers, fleet owners, and society.
Some of these benefits are priced and are
easily included in purchase decisions. Other
benefits are not monetary or are difficult to
quantify and therefore less easily incorporated
in payback or cost benefit analyses.
Fuel cost savings arising from favorable electricity prices and idle reduction were the most frequently
discussed benefit of PEVs. Maintenance costs of BEVs theoretically are also lower than ICE vehicles
since there are fewer moving parts in an electric motor than in a combustion engine, but there is too little
information to confirm this assertion. However, no stakeholders cited this as a benefit and one indicated
that the uncertainty of maintenance, repair, and battery replacement costs was a concern for buyers.
Although fuel economy often does not figure prominently in purchasing decisions, most fleets do worry
about fuel costs and put considerable effort into managing them. Minimizing or eliminating this worry is
a major benefit to electrification. Driver behavior has a significant impact on fuel consumption and driver
training programs can reduce fuel costs. However, the driver often is not the vehicle owner and does not
necessarily benefit directly from reduced fuel costs. Efficient driving incentives can be implemented, but
lowering costs per mile with PEV technology gives fleet managers a bit more control. However, driver
behavior is also an important factor in the efficiency and thus range of electric vehicles.
Many commercial vehicle operators need to meet job site power demands for truck-mounted and mobile
equipment and cab comfort. These demands are either met by idling the truck engine or by using an
auxiliary generator towed or hauled to the work site. Idling is particularly undesirable since it entails
operating at a very inefficient part of the engine map where the specific fuel consumption and emission
rates (grams per hp-hr) are high. PEVs with job site and export power can eliminate the need for an
Key Findings - Benefits
▫ Fuel cost reductions due to lower fuel price and idle reduction.
▫ Export power.
▫ Driveability and driver satisfaction.
▫ Societal benefits (petroleum dependence).

25
auxiliary generator and reduce or eliminate truck engine idling. Idle reduction reduces fuel costs, wear
and tear on the vehicle engine, emissions of criteria pollutants, and job site noise. Reducing job site
pollution and noise may improve the company’s public image and may provide the opportunity for
extended operating hours in the evening or overnight. Trucks with these features can also be used for
emergency response in power outages, such as from major storms. Export power is a major selling feature
for customers in utility, construction, and other service applications, and aftermarket systems designed
specifically for job site power are commercially available and highly successful. Stakeholders commented
that once customers have experience with the added features of job site and export power, the do not want
to do without it.
PEVs offer a different driving experience compared to other vehicles and improve drive comfort and job
satisfaction. Many hybrid vehicles save fuel by shutting the engine-off at idle during the drive cycle, but
operators have complained about the rough transition at engine restart. PHEVs that use an all-electric
launch mode eliminate this problem and provide a smooth transition from off-at-stop to start on motor.
BEVs accelerate smoothly, operate quietly without vibration, and have no exhaust fumes. Stakeholders
report that drivers much prefer the PEVs and report that they are not as physically tired at the end of a
shift. One stakeholder stressed now nice it is to drive a “no fuss” ZEV. Quiet operation can enhance the
vehicle functionality in many applications, such as providing utility, trash collection, and other services in
residential neighborhoods, particularly at night, and border patrol or other law enforcement activities that
benefit from stealth.
PEVs provide both public and private benefits by reducing dependence on petroleum. Historically,
consumers have been subject to oil price fluctuations arising from market speculation, supply restrictions,
supply disruptions from natural disasters, and other sources of price shocks. Fleets bear the cost of the
difference between price at the pump and the actual cost to extract, refine, distribute, and market the fuel.
For imported oil, the nation loses hundreds of billions of dollars annually in wealth transfer and lost or
dislocated GDP. Stakeholders also stated that manufacturers suffer when vehicle sales by class or model
shift in response to fuel price changes. By reducing petroleum dependence, a transition to PEVs would
ultimately help OEMs with product portfolio planning.

26

27
5. FINDINGS
This section focuses on the specific barriers identified by the stakeholders to more widespread use of
electrification in the class 2b-3 market from a technical, economic, and operational standpoint. The
stakeholders also offered some opportunities and strategies for overcoming these barriers that focused on
reducing the cost of electrified drivetrains, increasing the confidence of purchasers around the technology,
and increasing the production/sales volume of these drivetrains. The sections below outline these barriers
and strategies and discuss potential opportunities for additional work.
5.1 BARRIERS
Stakeholders provided thoughts on barriers to greater production or adoption of class 2b-3 pickup and van
PEVs. Their comments covered technical, operational, and economic issues from the perspectives of
manufacturers and purchasers.
5.1.1 Technical Barriers
Technical barriers focus mainly on performance limitations, real or perceived, and design issues. The
prominent technical issues arise from the high variability in duty cycles and routes in this class. This
results in major concerns for operators regarding vehicle range. This variability, combined with the lack
of complete and reliable usage and duty cycle data, also makes it difficult for manufacturers to determine
design specifications. Accommodating the most demanding applications and alleviating range anxiety
requires much larger batteries compared to light vehicles, adding both weight and cost. Additional loads
at the job site, such as the need to run the air conditioner for cab comfort, further add to power and battery
demand.
Current pickup and van PEVs options are upfits, resulting in expensive and heavy batteries incorporated
on a platform that is already relatively expensive and heavy. Meanwhile, the manufacturer needs to keep
the vehicle GVWR within the specified weight class, so the end result is a decrease in payload capacity
and thus market viability. The added weight also causes design difficulties maintaining the proper
distribution of weight on the axles and staying within the gross axle ratings. For these reasons,
stakeholders indicated that a vehicle designed specifically as a PEV would have significant technical
advantages over an upfit.
Stakeholders identified other perceived limitations that affect functionality and discourage adoption,
including speed limiters, lack of torque, durability, reliability, and performance in extreme
temperatures. While many of these concerns are real design and manufacturing issues, others are
misconceptions. For example, reliability has proven to be a real issue in some class 3 BEV shuttle vans.
Many fleets cannot tolerate vehicle or battery failures during peak seasons when they earn much of their
revenue and utilize their full capacity, such as package delivery fleets during November and December.
On the other hand, lack of torque is not an inherent problem for electric vehicle technology. Electric drive
provides full torque at zero motor speed while combustion engines have very low torque at low engine
speed. This is the main reason that modern diesel locomotives use electric traction motors and many
PEVs provide improved torque performance relative to conventional vehicles.
PEV drivetrains, installed as upfits to conventional chassis, also result in challenges for installation of
custom bodies and equipment. OEM’s have designed the vehicle and mounted all conventional
components to the frame in a way that maximizes the opportunity to attach customized bodies. For some
vehicle models, these attachment points have not changed in decades. Meanwhile, body upfitters have
designed custom solutions for available attachment points so that no vehicle modifications are required.
PEV components require considerable space and often interfere with these usual body attachment points,

28
and new attachment points would require body builders to redesign their products and retool their
facilities. Although it seems there should be plenty of space to add PEV components to a commercial
vehicle, actual packaging is difficult.
While manufacturers have developed technically successful light duty PEVs and are approaching cost
parity on a TCO basis, there are design challenges in translating this success to the class 2b-3 market by
“scaling up” the components. First, commercial customers demand features not found on most of these
light duty vehicles, such as all-wheel drive and export power. These features increase vehicle weight,
power demands, and cost. The vehicles also see much higher mileage and hours of operation over their
lifetime, sometimes accruing 200,000 to 300,000 miles then having the engines rebuilt and the vehicle
returned to service. Many applications have significantly higher energy or power demands, such as
heating and cooling for shuttle buses or powering aerial devices, PTOs, or other tools. While peak
demand may be similar between light duty and class 2b-3, continuous demands may be much higher for
commercial vehicles. In addition, integration of existing PEV components onto existing conventional
trucks and using original drivetrain components (axles, transmission, etc.) does not provide an efficient or
optimized design. System level engineering is required to take advantage of positive synergies and
minimize negatives ones. Further, re-engineering specific components to be purpose designed would be
preferred. Finally, because of the combination of higher energy storage demand, limited charging
opportunities, and variable but potentially long daily range, commercial vehicles require faster, higher
power charging.
5.1.2 Economic Barriers
Vehicle cost remains a significant barrier for class 2b-3 PEV market success, particularly as the efficiency
of diesel engines improves. Many fleets that have expressed interest in PEVs and other advanced
technologies, but are not willing to pay much extra for them. Many customers are sensitive to up-front
costs and may not calculate the value of fuel savings, may heavily discount future cash flows, or may
consider operating costs only in a qualitative sense. When customers do calculate payback, the added up-
front cost may mean that they will need to purchase fewer trucks in a given year, which could mean
operating older, less reliable trucks longer. Fleet managers may have difficulty justifying this down side
when presenting options to upper management. For less investment, these customers may be able to
realize some savings relative to a gasoline truck, and essentially no additional risk, by purchasing a diesel
truck. The costs and benefits relative to diesel trucks most significantly affects PHEVs, which typically
use a downsized gasoline engine since the cost of a diesel-electric PHEV would include the additional
cost, relative to a gasoline truck, of the diesel engine and electric drive systems.
Battery cost is the most significant contributor to the incremental cost of PEVs, and stakeholders
indicated customers are concerned about the unknown cost and frequency of battery replacement. Fleets
that keep their trucks the longest, say for 12-15 years, may be concerned that there could be many battery
replacements during their ownership period.
Some customers do use TCO, payback analysis, and return on investment, and might be likely to invest in
PEVs once the business case is favorable. However, reducing production cost presents a major
challenge for manufacturers, especially since they are still working to determine duty cycle requirements
and improve the technology. One stakeholder noted that between generations of vehicles, customers’
expectations regarding performance tend to increase, making it even more difficult to shift focus from
performance improvements to cost reduction. Further, the major cost reductions required can only happen
with an increase in production volume, which requires sufficient demand and adequate component
supply.

29
5.1.3 Operational Issues
Although PEVs are easy to drive, drivers must learn how to operate the vehicles to maximize the fuel
savings. For BEVs, operators and fleet managers may need to make adjustments to driving habits and
schedules to accommodate range limitations and take advantage of charging opportunities. The added
burden of these issues or negative experiences with early implementation may discourage many fleet
owners from purchasing the vehicles.
One stakeholder with experience employing BEVs called attention to additional challenges presented by
charging commercial class 2b-3 vehicles. In many cases, the range of class 1 PEVs exceeds typical trip
distances and level 1 or 2 charging is sufficient. Class 2b-3 PEVs currently use class 1, level 2 charging
architecture, but energy demands are higher and charging opportunities are often shorter, resulting in
longer time to restore a full charge. In addition, commercial fleets that need to recharge during the day
face demand charges17
when charging time exceeds a threshold. For fleets with significant daytime
charging needs, the added expense of demand charges can result in per mile operating costs that exceed
conventional vehicles. Higher power charging would allow shorter charge times, simultaneously
increasing operational time and decreasing demand charges. However, high power chargers require three
phase, 480 volt electrical infrastructure, which may not be available and is expensive to install.
Many fleets perform vehicle maintenance services in-house. These owners are not familiar with PEV
service needs and have concerns about the frequency and complexity of battery replacement and other
maintenance. If these buyer’s reluctance can be overcome, they still face the added cost of retraining
their maintenance crews or the need to outsource these services. Buyers also have reservations about the
reliability of the manufacturers and need assurances that the company will be around to provide these
maintenance services for as long as they keep the vehicles.
5.2 OPPORTUNITIES
Current trends present some opportunities for early implementation of commercial PEVs that could lead
to wider adoption. These opportunities represent applications where PEVs are well-suited and, in some
cases, meet unique functional requirements that define a niche. In some cases, these niches provide a
guaranteed market, such as fleet mandates. In other cases, because of unique market needs, consumers are
willing to accept higher initial cost or lower performance on other functionalities not essential in that
application. Although small, these niches provide protected market spaces that manufacturers may use to
determine consumer needs, improve PEV performance, and decrease costs. Drivers and riders can
simultaneously learn about PEVs’ benefits and capabilities. Stakeholders identified the following
potential niche markets for class 2b-3 PEVs.
The increasing popularity of ridesharing could provide an opportunity for PEVs since most trips are 30-
50 miles one way. Several ridesharing services recently announced the intent to implement shuttle type
services with preset stops or suggested pickup locations, which could open this niche to class 2b-3 PEVs.
Many facilities, companies, colleges, and even cities have established net zero strategies that include
goals to consume only as much energy as produced onsite. College, government, airport, and business
campuses that require on-site powered transport for employees, students, or customers are ideal
application spaces for BEV shuttles.
Several European cities have proposed banning ICE vehicles within city limits. California has developed
a plan requiring that all trucks and equipment serving the ports of Los Angeles and Long Beach ports be
17 Electricity bills for industrial and commercial customers often include demand charges that are based on the customer’s peak
demand over a specified interval (typically 15 minutes) during the billing period.

30
replaced with zero emission technologies. Zero emission zones may create a market for BEVs which
operate over short range within the zone and for PHEVs which operate over longer distances but need the
ability for ZEV operation within the zone.
Stakeholders also thought there might be an agricultural application for PEVs transporting farm workers
and equipment to and within large farms.
5.3 STRATEGIES
Stakeholders offered suggestions on a number of potential strategies that would overcome barriers of
demand, economics, and performance. Their comments included specific potential actions on the part of
the major actors in this business space (manufacturers, upfitters, government agencies, and consumers).
5.3.1 Consumer Demand
Stakeholders conveyed a general industry perspective that electrification was inevitable and indicated that
many larger fleet customers had expressed interest in the technology. However, they also identified
several barriers to realizing sufficient consumer demand to create a sustainable market, including risk
aversion, low willingness to pay, and concerns or misconceptions about vehicle capabilities and
performance. Stakeholders mentioned a few possible strategies to overcome these barriers and several
other strategies are suggested by their comments.
Taking advantage of opportunities to create market niches such as those described in Section 5.2 can be
an important strategy for two reasons. First, several of the opportunities create a guaranteed demand
(ZEV mandates, ZEV zones, and zero-carbon footprint programs) that would give manufacturers the
confidence needed to continue investing in technology development and expansion of production.
Manufacturers could partner with companies, municipalities, or institutions to gather usage and
performance data as well as user feedback in order to improve vehicle design. Further, through positive
exposure, these niche markets begin a process of consumer education that can overcome risk aversion and
lead to increased customer acceptance.
Stakeholders indicated that is critical that class 2b-3 PEVs meet the customers’ needs and be as reliable
and durable as a diesel vehicle for the same useful life. Reliability concerns are amplified by a history
marked by corporate failures and, in the case of BEVs, a lack of warranty requirements. Since diesel
emission reduction programs constitute a primary early market for commercial PEVs, regulators could
require the same warranty period for electric drivetrains as they do for diesel engines. Stakeholders at the
Beyond Light Duty Workshop also suggested that manufacturers should have a plan to provide vehicle
service in the event that the manufacturer fails.
5.3.2 Performance and Design
The high variability of applications and duty cycles presents several challenges for vehicle design,
including the need to provide for maximum possible range requirements, allow for many features and
configurations (AWD, extended cab, PTO, export power, etc.), maintain payload capacity (volume or
weight), and accommodate custom body attachment. Stakeholders suggested several strategies to
overcome these barriers while still achieving production volumes that allow manufacturers to reduce
costs.
One possible approach would be to develop a single PEV configuration that meets the most common or
most important features demanded by large fleets such utility companies. However, this might result in
overdesigned vehicles for many uses. Therefore, several stakeholders indicated the need for a flexible

31
platform that could be tailored to a variety of applications and duty cycles. An optimal approach would be
a lightweight vehicle designed from the ground up for electrification rather than an upfit, thereby avoiding
excess weight and interference with body attachment points.
Several stakeholders felt that PEV batteries need further development and one commented that it was
difficult to obtain batteries that were packaged in a reliable way. Systems found on commercial vehicles,
such as PTOs, have evolved over time to the point where they have similar capabilities and packaging
across platforms. Applying this concept to the raw battery concept could have significant impact on
battery performance, weight, and cost by improving power density and simplicity of fabrication. The
stakeholder indicated that an ideal battery pack would be cell agnostic, allowing different and optimal
chemistries for various applications. It would also be modular to allow both a range of capacities and
different packaging of a single capacity in order to fit in a variety of vehicles while maintaining cargo
volume and weight capabilities. A modular concept would also allow application across platforms to
increase production volume and decrease cost. However, if this approach is technically feasible,
significant investment would be required to develop the technology and put it into production.
In general, an optimal design would have a minimum number of components and attachments, whether
the PEV is an upfit or designed from the ground up.
For upfits, stakeholders observed that it would be helpful if OEMs provided chassis without the drivetrain
elements they needed to remove (engine and transmission). They also observed that it would be easier to
install custom bodies if the electric drive system were “shrink wrapped,” more modular, or could be
located entirely under the hood. Otherwise, it is important for PEV upfitters to work with the body
upfitters to ensure that integration is possible.
A few stakeholders remarked that product R&D continues beyond initial demonstration of new and novel
technologies. As much as 90% of the investment required to bring a technology to commercial production
occurs after initial demonstration and includes design iterations required for durability and reliability.
5.3.3 Production Volume and Cost
Stakeholders discussed several strategies for increasing production volume in order to reduce costs and
develop a sustainable market.
For upfits, strategies include arrangements with OEMs to provide chassis without components that the
PEV upfitter would need to remove when purchasing a complete conventional vehicle. Other strategies
include development of modular batteries and self-contained (“shrink-wrapped”) electric drive systems.
For a ground-up PEV design, stakeholders indicated the need for a flexible platform that could
accommodate multiple configurations, features, and energy capacities.
The most consistently discussed strategy involves finding ways to share components across platforms
within the weight class through development of a flexible and scalable system, or across weight classes
by finding commonalities with class 4-6 PEVs.
5.4 KEY INSIGHTS
The table below summarizes the barriers and strategies from the previous sections and aligns them to
illustrate opportunities and gaps for further study. As the table illustrates, the stakeholder strategies align
well with the identified barriers. There appear to be strategy gaps for addressing the barriers of driver
habits and actions, reduced fleet turnover, and collecting duty cycle data, however. This set of strategies is

32
not intended to be exhaustive but rather a compendium of stakeholder inputs that will begin a discussion
of how to encourage class 2b-3 electrification to meet consumer, manufacturer, and societal goals.
BARRIERS STRATEGIES
Technical
Duty cycle variability and duty cycle data to understand variability Develop modular and cell-agnostic battery
pack designs to apply flexibly across platforms
Share components across platforms by finding commonalities with larger platforms
Continue government investment in PEV development to focus on continuous improvement
Create single PEV configuration to meet common fleet needs on a flexible platform, optimally designed from the ground up for electrification
Vehicle range - increased range requires more batteries with more weight and cost and decreased payload
Scaleup of LD components - different mileage requirements, different features such as export power, etc.
Performance issues especially at high ambient temperatures
Durability and reliability
Interference of PEV drivetrains with body and equipment installations
Economic
Willingness to pay extra for electrified technologies Create market niches to guarantee demand,
build production volume, and increase customer acceptance (e.g. ridesharing)
ZEV mandates Have OEMs provide upfitters with glider
chassis without drivetrains to reduce costs Develop modular and cell-agnostic battery
pack designs to apply flexibly across platforms
Sensitivity to up-front costs and undervaluing of future cost savings
Increased cost of electric trucks may mean fleets purchase fewer trucks and keep older trucks longer
Battery cost (initial and replacement)
Reducing production costs by increasing production volume
Operational
Adjustments to driver habits and routes to accommodate PEVs
Utility work to address demand charges for PEV charging
Utility responsibility for engineering and construction of power for infrastructure
Charging practices - frequency of charging, demand charges for daytime, cost of higher power fast charging
Maintenance and repair - training for in-house mechanics

33
ACKKNOWLEDGEMENT
“The authors thank the U.S. Department of Energy Vehicle Technologies Office for funding support and
project manager Dr. Rachael Nealer for technical support and guidance. The authors also thank the
participating stakeholders for their invaluable insights and Dr. Zhiming Gao for his technical review and
comments. The authors are solely responsible for the contents and views expressed.”

34

35
REFERENCES
CARB. (2016). California's ZEV Regulation for 2018 and Subsequent Model Year Vehicles. ZEV
Tutorial Presentation. Retrieved from
https://www.arb.ca.gov/msprog/zevprog/zevtutorial/zev_tutorial_webcast.pdf
CARB. (n.d.). Advanced Clean Cars Summary. Retrieved from California Air Resources Board:
https://www.arb.ca.gov/msprog/clean_cars/acc%20summary-final.pdf
Davis, S., Williams, S., & Boundy, R. (2016). Transportation Energy Data Book: Edition 35. Oak Ridge:
Oak Ridge National Laboratory. Retrieved from http://cta.ornl.gov/data/index.shtml
EPA & NHTSA. (2011). Final Rulemaking to Establish Greenhouse Gas Emissions Standards and Fuel
Efficiency Standards for Medium- and Heavy-Duty Engines and Vehicles, Regulatory Impact
Analysis. US Environmental Protection Agency and National Highway Traffic Safety
Administration, Office of Transportation and Air Quality.
EPA & NHTSA. (2016). Greenhouse Gas Emissions and Fuel Efficiency Standards for Medium- and
Heavy-Duty Engines and Vehicles - Phase 2. Federal Register, 81, 73478.
Miyasato, M., & Kosowski, M. (2015, October 1). Plug-In Medium-Duty Truck Demonstration and
Evaluation. Retrieved from U.S. Department of Energy Office of Science and Technical
Information: http://www.osti.gov/scitech/servlets/purl/1234437
U.S. DOC. (2004). Vehicle Inventory and Use Survey 2002. US Department of Commerce, Economics
and Statistics Administration, U.S. Bureau of the Census. Washington, DC: US Department of
Commerce.