fleet electrification
TRANSCRIPT

Fleet Electrification
Sustainability/Energy Committee
February 26, 2019

• Fleet operation
• Light duty vehicles
•Medium and heavy duty vehicles
•Greenhouse gas reduction
• Emergency preparedness
•Next steps
Overview

Fleet Operation
District Fleet (1,311 vehicles)*
Light Duty Vehicles
Medium and Heavy Duty Vehicles

Light-Duty Vehicles
• 415 light-duty vehicles
• New sedans, pickups, and SUVs are more fuel efficient
• Hybrids are the standard sedan (69 Toyota Priuses, 6 Chevrolet Volts)
• Mid-march delivery of four fully-electric Nissan Leafs
• Replacements have improved fuel efficiency in class by 23 percent

Medium & Heavy-Duty Vehicles
• 803 medium and heavy-duty vehicles
• Examples: Service trucks, backhoes, skid steers, vacuum excavators
• Renewable diesel use increased from 54,944 gallons in 2016 to 127,726 gallons in 2017
• In 2017, renewable diesel offset 1,304 MT of GHG emissions.
*Includes 93 trailers

Medium & Heavy-Duty Vehicle Electrification
• Slow progress in this class
• Available for transportation and mining industries
• Hybrid construction equipment not available in the size and capacity used by the District (except John Deere 644k loader)
• John Deere 644k loader
– Diesel electric uses 25% less fuel, costs 10-15% more
– District has two conventional loaders of this type

Greenhouse Gas Reduction
• Fleet has grown by 14.20% in last 6 years
• GHG emissions reduced by 12% in last 5 years
• In 2017, fleet generated
– 5,887 MT of GHG emissions
– 28% of overall GHG inventory
– 66% of overall direct emissions 5000
5500
6000
6500
7000
20
13
20
14
20
15
20
16
20
17
Fleet Emissions
1050
1100
1150
1200
1250
1300
1350
20
13
20
14
20
15
20
16
20
17
20
18
Fleet Size

Emergency Preparedness
• Fuel is critical commodity in emergency
•Need to ensure our equipment can operate after an emergency
• Support for mutual assistance
– Assistance to EBMUD
– EBMUD providing assistance

Next Steps
• Continue to investigate new technology to improve fuel efficiency and reduce GHG emissions
• Evaluate hybrid and electric powered vehicles for future fleet purchases
• Expand the use of renewable diesel

Questions
Draft Climate Action Policy
Sustainability/Energy Committee
February 26, 2019

Agenda
• Climate change assessments
•District activities
• Proposed Climate Action Policy
•Next steps
2

IPCC Assessment Report
• Sixth Assessment Report will be completed in 2021
• Special Report released October 2018
• Warming on track to exceed 1.5oC in the next decade
• Limiting warming to 1.5oC will require – Rapid, far-reaching, and
unprecedented changes
– Decrease in human-caused GHG emissions by 45% by 2030
3

California Fourth Assessment
• Released August 2018
• 44 technical reports and 9 regional reports
• Findings
– Temperature increased 0.95oC from 1950 to 2005
– Coastal fog less frequent
– Sea level has risen 8 inches in last 100 years
– Winter storms and droughts are more severe
4
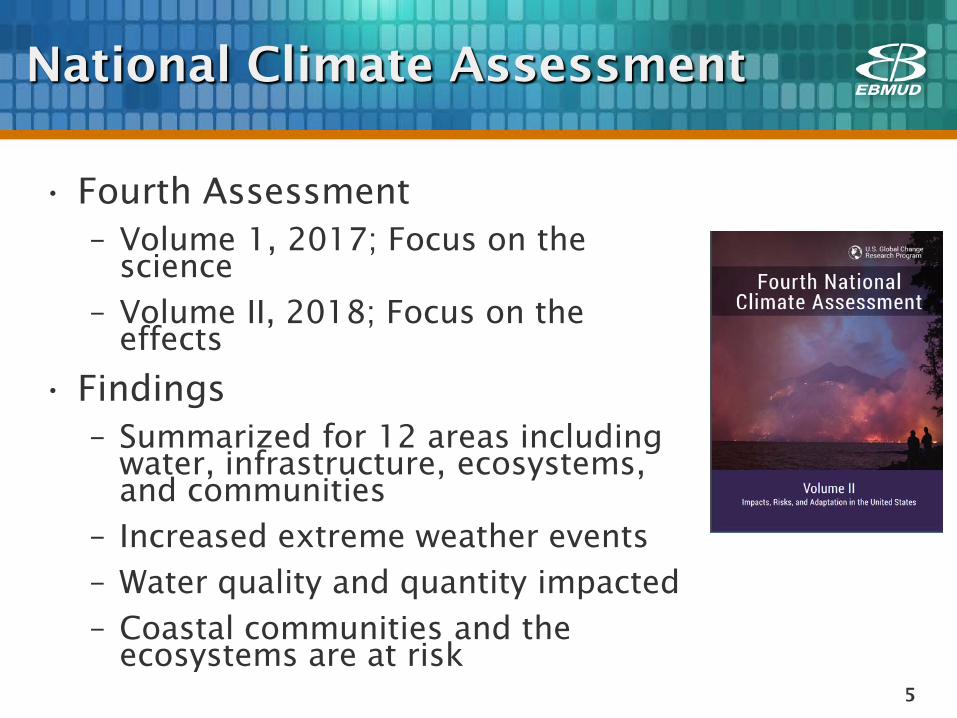
National Climate Assessment
• Fourth Assessment – Volume 1, 2017; Focus on the
science
– Volume II, 2018; Focus on the effects
• Findings – Summarized for 12 areas including
water, infrastructure, ecosystems, and communities
– Increased extreme weather events
– Water quality and quantity impacted
– Coastal communities and the ecosystems are at risk
5

District Activities
• Climate change added to the Strategic Plan
• Climate change impact evaluated in the Water Supply Management Program
• Adopted aggressive GHG reduction goals
• Participated in EPA’s Climate Ready Water Utilities and other research
• Green building certification for many facilities
• Consider climate change in planning efforts
6

Recent District Activities
• Joined the Bay Area Climate Action Network (BayCAN)
• Joined The Climate Registry (TCR)
• Signed on to “We Are Still In”
• Participating in Project Hyperion
• Developed a Draft Climate Action Policy
7

Proposed Climate Action Policy
•Other utilities and cities have climate adaptation plans or plans to address impacts of climate change (e.g., sea level rise)
• Policy will affirm the District’s belief
– Climate change will have a significant impact to water and wastewater operations
– Climate change will result in rising sea levels, increasing temperature and greater climate variability
8

Proposed Climate Action Policy
• District commitment to – Plan for climate change
– Complete and annual GHG emissions inventory and significantly reduce GHG emissions
– Support legislation to mitigate climate change
– Support strong state and federal action to respond to impacts of climate change
– Collaborate with others to develop solutions
– Take a leadership role with respect to climate change
9

Next Steps
• Continue participation in BayCAN and The Climate Registry
• Finalize Climate Adaptation plan
• Incorporate Board feedback on the proposed Climate Action Policy for Board adoption on March 26, 2019
10

Questions
11

Wastewater Biogas Upgrade Evaluation
Sustainability/Energy Committee
February 26, 2019

Agenda
• Background
• Project Evaluation
• Next Steps
2

Background
RNG Biogas Upgrading Project
3
Renewable Natural Gas
(RNG)
Renewable Electricity
Gas Flares (~11% of volume)
Biogas from Municipal Sludge and Trucked Wastes
Biogas Conditioning and Compression System
Turbine (4.5 MW) Three Engines (6.6 MW)
Municipal Sludge
High-strength Trucked Wastes

Background Biogas Production and Use
• Biogas production at the MWWTP currently exceeds capacity of turbine and engines – Average biogas production = 2,300 standard cubic feet per
minute (scfm) – Excess biogas is flared approximately
50% of the time (~11% of total volume)
• Benefits of adding a compressed RNG system – Adds 500 scfm of biogas use capacity – Reduces biogas flaring – Significant environmental attribute
revenue for transportation fuels
4

Financial Analysis
RNG Process Model
5
Interconnection to PG&E Pipeline for Transportation
Fuel Use
PGS
2,300 scfm 500 scfm
1,700 scfm
RNG Gas Upgrading and Compression System
Capital Cost = $12.4M Capital Cost = $4.0M*
O&M Cost = $500,000/year
RNG Sales Revenue = $0.7M/year Environmental Attribute Revenue = $0.8M/year (State LCFS)
= $1.0M/year (Federal RINs)
Gas Flares
100 scfm
LCFS = Low Carbon Fuel Standard RINs = Renewable Identification Numbers * Eligible for 50% reimbursement from the CA Interconnection Monetary Incentive Program
Projected 10-year NPV with no additional funding roughly break even

Background Project Benefits
6
• Market value for biogas converted to RNG is significantly higher value than for electricity – Current market for RNG is over 4x the value
– PPA with the Port expires in 2022 and the next contract may be less than the current $58/MWh
• Project would significantly reduce flaring
• Project could increase options for growing the R2 program
• Project would expand market for biogas utilization with long term options to explore: – Carbon capture
– Selling to low carbon liquid fuel producers

Project Evaluation RNG Market Overview
7
• Highest value market is for transportation – If sold for transportation use, the project would generate LCFS
and RIN credits – These credits are dependent on selling RNG to a vehicle fuel
user – The value of the credits is variable based on market conditions – LCFS is only in CA and RNG must be used for vehicle fuel in CA
to qualify – RINs is federal and RNG must be used for vehicle fuel in the US
to qualify
• There is also a developing green gas market where RNG is purchased for other uses at a premium over CNG (heating, manufacturing, etc)

~ 144M DGE 2,000
1,500
1,000
500
0
2010 2011 2012 2013 2014 2015 2016 2017 2018
Milli
on c
ubic
feet
Project Evaluation CA CNG Market Overview
8
• Unless there is a regulatory change, CA CNG vehicle demand may have already peaked: – Roughly half of current demand is from transit and half from
heavy duty vehicles – CARB has set a statewide goal for all public transit agencies to
fully transition to electric by 2040
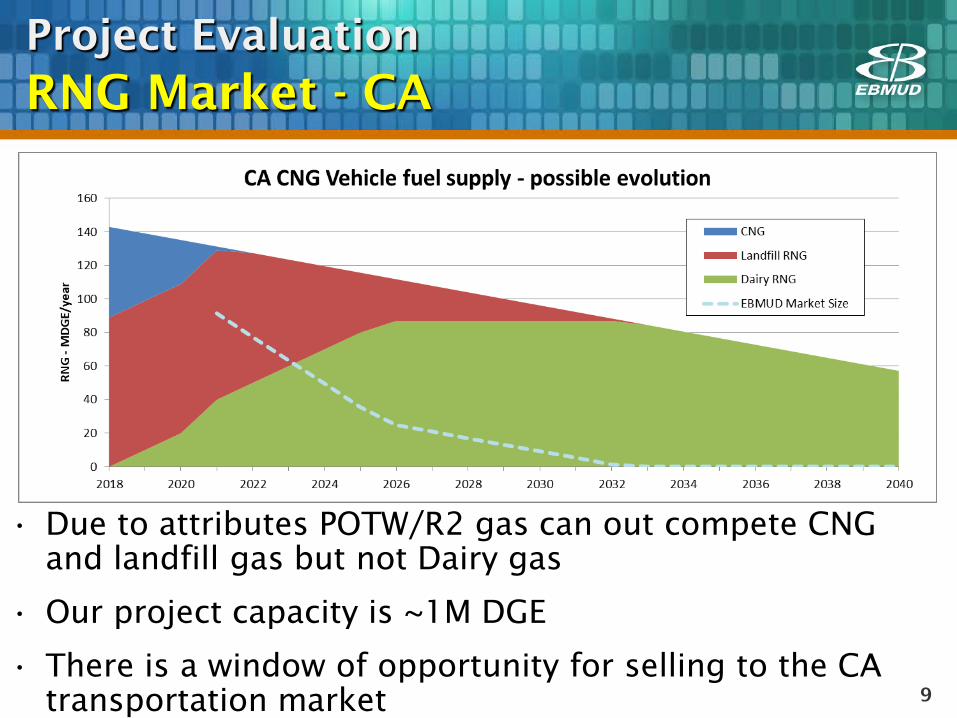
Project Evaluation RNG Market - CA
9
• Due to attributes POTW/R2 gas can out compete CNG and landfill gas but not Dairy gas
• Our project capacity is ~1M DGE
• There is a window of opportunity for selling to the CA transportation market

Project Evaluation RNG Market - LCFS
10
High End
Low End
Projected
$0$20$40$60$80
$100$120$140$160$180$200
Carb
on P
rice
($/M
T CO
2e)
Average Monthly LCFS Price
2014 2015 2016 2017 2018

2015 2016 2017 2018
$3.00
$2.00
$1.00
$0.00
Project Evaluation RNG Market - RINs
11
Low End
Projected
D3 RIN
D5 RIN
High End: 40% D3
High End: 60% D5
Weekly D3 and D5 RINs Prices

Project Evaluation
Risk Mitigation
12
Several ways to reduce risk were identified: • Be conservative in assessing credit values
• Apply for grant funding
• Increase size of the project (significant portion of the costs are fixed regardless of project size)
• Explore lower value fixed price contracts for longer time periods

Project Evaluation
Outside Funding
13
CEC Grant GFO-18-601
• Results released 1/18/2019
• EBMUD awarded $3M for the project
• EBMUD highest ranking commercial scale project and highest ranking overall project
CA Interconnection Monetary Incentive
• Half the cost of interconnection eligible for reimbursement (estimated value is nearly $2M)

Project Evaluation
PG&E Bankruptcy
14
Background: • RNG project would
interconnect with the adjacent PG&E gas main
• Initial Feasibility Study with PG&E completed
• Detailed System Study next step
Update: • PG&E filed for Chapter 11 bankruptcy on January 29,
2019 • Evaluating potential impacts to interconnection
completion, timing, and incentive funding

Project Evaluation CalARP/PSM
15
• OSHA Process Safety Management (PSM) and California Accidental Release Program (CalARP) regulations have significant requirements for facilities with >10,000 lbs methane on-site
• MWWTP exceeds this threshold
• MWWTP currently considered exempt as biogas is used as a fuel on-site
• The RNG project may make the MWWTP ineligible for this exemption – The likelihood of maintaining the exemption
is currently being evaluated

Project Evaluation CalARP/PSM Staffing
16
Current estimate is $500k consultant services during startup, plus:
• Beyond the subject matter experts, department doesn’t have the staff available to re-prioritize for this effort.
• Would require LT or TC positions
0
1
2
3
4
5
6
Initial 2 years Years 3&4 Long Term
FTEs
Mechanical Integrity Program Risk Management Plan
Subject matter experts
Program Support
Expert team Implementation Support
Drafting and documentation

Next Steps
• Complete the evaluation of potential impacts of: – PG&E Bankruptcy – PSM/CalARP exemption status
•Likelihood of maintaining the exemption
• Impact if the exemption is lost
• Assess any economic implications of this evaluation
• If decision is made to recommend the project, will bring the agreement to the Board for authorization
17

Integrated Pest Management Program Update
Sustainability/Energy Committee
February 26, 2019

Agenda
• IPM program review
• 2018 progress update
• Public engagement
•Next steps
2
What is IPM?
• Comprehensive, systems-based process
• Select appropriate control method – Biological controls
– Physical actions
– Cultural practices
– Chemical application
• Based on pest and site conditions
•Minimize impacts to humans, environment, non-target organisms
3

Types of District Property
• Facilities (East Bay and Upcountry)
• Aqueduct rights-of-way
•Watersheds
4

Facility Example

Facility Example

Aqueduct Right-of-Way Example

Watershed Reservoirs

Watershed Open Space Example

Pest Management Objectives
• Employee and public safety/security
• Regulatory drivers – Division of Safety of Dams
– Fuel management/fire access
• Flood control/drainage
• Infrastructure management/protection
•Habitat management
• Aesthetics 10

Third Party Review Results & Recommendations
• Blankinship & Associates review
• Knowledgeable staff and good foundation in IPM
• Recommendations for improvement – Enhanced training
– Enhanced communication
– Consistent records management
– Standardize qualifications, decisions, and activities
11

Enhanced Training
• Standardize pest management training
– 1st Annual Training April 2018
– 2nd Annual Training March 2019
• Create a forum for sharing challenges and successes
– Monthly Workgroup meeting
– Annual Check-In Meeting 12

Enhanced Communication
• Require Pest Control Advisors to make site visits and interview staff
– Leverage existing PCAs
– New third-party independent PCA contract
• Involve District biologists in the pest management process
– Biologist sessions at IPM training
– Staff level consultations
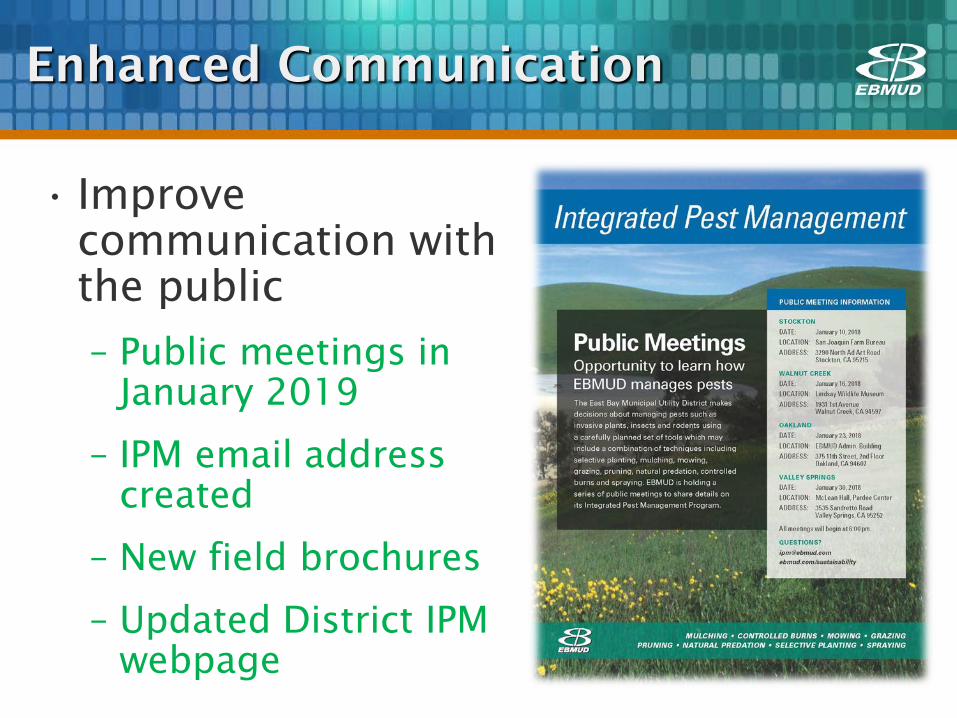
Enhanced Communication
• Improve communication with the public
– Public meetings in January 2019
– IPM email address created
– New field brochures
– Updated District IPM webpage

Consistent Records Management
• Create decision process document
– Describes goals, pests, monitoring, control methods, etc.
– Approximately 400 sites completed
• Electronic data collection
– Developed database and field forms
– Documented pest management activity
– Improved regulatory reporting and data analysis
15
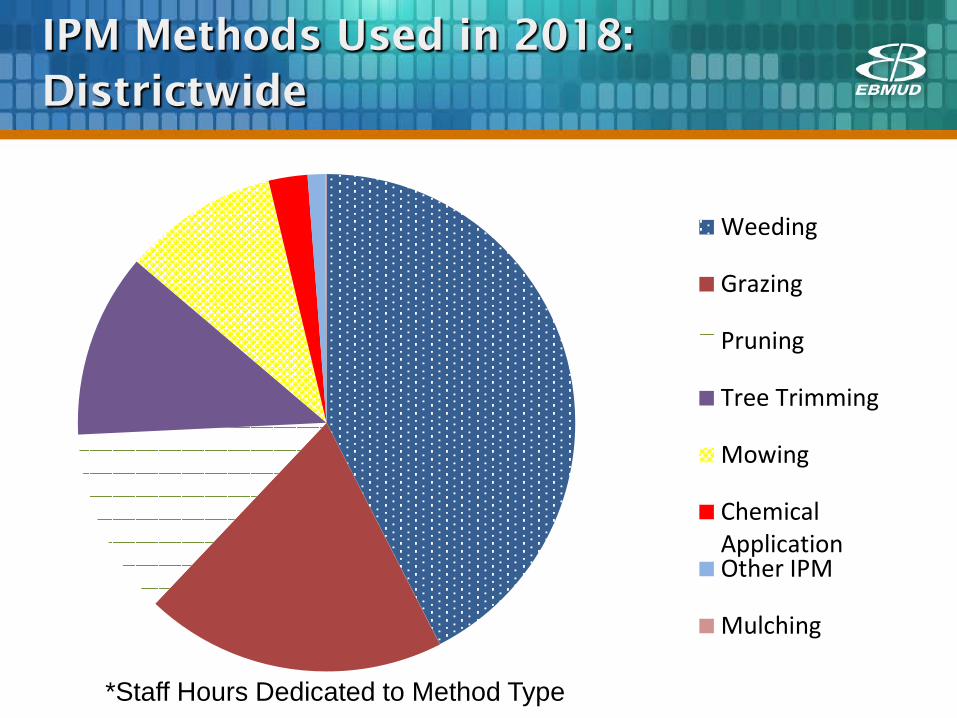
IPM Methods Used in 2018: Districtwide
Weeding
Grazing
Pruning
Tree Trimming
Mowing
ChemicalApplicationOther IPM
Mulching
*Staff Hours Dedicated to Method Type
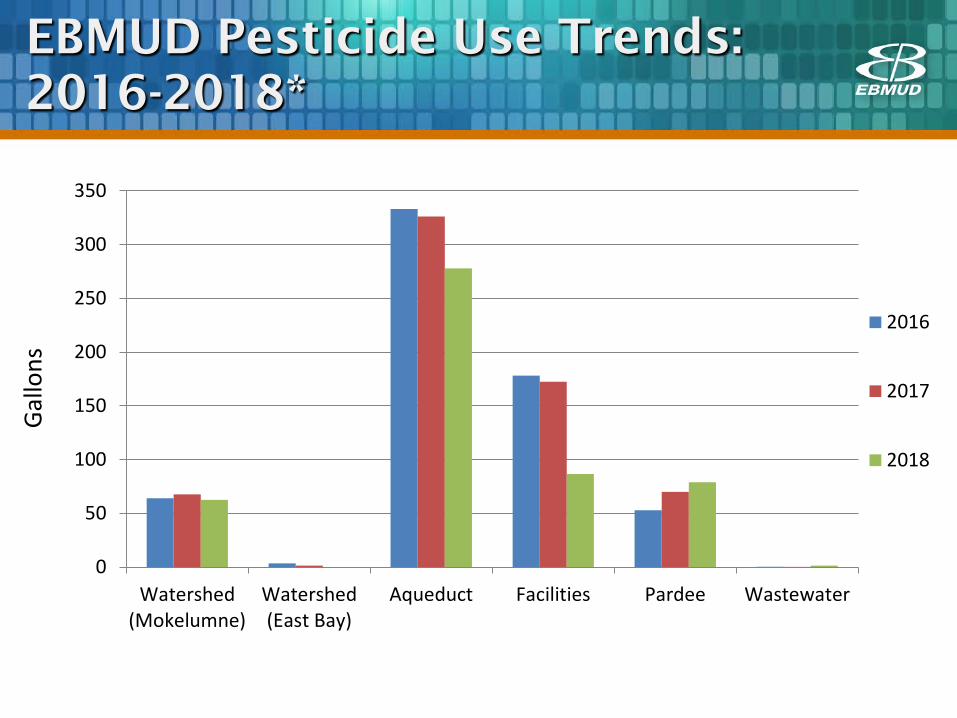
EBMUD Pesticide Use Trends: 2016-2018*
0
50
100
150
200
250
300
350
Watershed(Mokelumne)
Watershed(East Bay)
Aqueduct Facilities Pardee Wastewater
2016
2017
2018
Gallo
ns

Next Steps
• Continue incorporating recommendations from third-party review
• Continue capturing data for trends analysis
• Hold annual training in March 2019
• Independent PCA reviews on priority sites
• Continue public outreach
• Evaluate IPM guidelines update
• Equipment procurement to support alternative IPM methods
18

Questions
19