eleven-year summary - shin-etsu chemical...28 | shin-etsu chemical co., ltd. eleven-year summary...
TRANSCRIPT

28 | Shin-Etsu Chemical Co., Ltd.
Eleven-Year SummarySHIN-ETSU CHEMICAL CO., LTD. AND SUBSIDIARIESFor the years ended March 31, 2003 through 2013
Millions of yen
2003 2004 2005 2006 2007
For the year:
Net sales ¥ 797,523 ¥ 832,804 ¥ 967,486 ¥1,127,915 ¥1,304,695
Cost of sales 585,220 619,085 715,143 831,333 933,199
Selling, general and administrative expenses 90,152 88,094 100,608 111,262 130,467
Operating income 122,149 125,625 151,734 185,320 241,028
Ordinary income 122,119 125,612 151,503 185,040 247,018
Net income 73,015 74,805 93,160 115,045 154,010
Capital expenditures 75,211 113,591 110,277 145,329 210,613
R&D costs 27,279 26,329 27,924 32,003 41,737
Depreciation and amortization 66,566 73,581 90,874 111,637 138,462
At year-end:
Total assets ¥1,310,874 ¥1,386,216 ¥1,476,248 ¥1,671,280 ¥1,859,995
Working capital 409,262 401,878 444,935 572,205 628,986
Common stock 110,271 110,493 117,513 119,419 119,419
Net assets — — — — 1,360,315
Stockholders’ equity 846,961 900,724 996,307 1,173,679 —
Interest-bearing debt 167,362 163,167 120,422 83,838 45,143
Per share (Yen and U.S. dollars):
Net income—primary ¥ 173.13 ¥ 177.25 ¥ 219.10 ¥ 266.63 ¥ 357.78
Net income—fully diluted2 169.36 173.52 216.11 266.07 357.32
Cash dividends 14.00 16.00 20.00 35.00 70.00
Payout ratio (%) 8.1 9.0 9.1 13.1 19.6
Net assets 2,014.11 2,140.23 2,329.47 2,730.94 3,065.80
General:
Operating income to net sales ratio (%) 15.3 15.1 15.7 16.4 18.5
Net income to net sales ratio (%) 9.2 9.0 9.6 10.2 11.8
ROE (%)3 8.8 8.6 9.8 10.6 12.4
ROA (%) 9.4 9.3 10.6 11.8 14.0
Equity ratio (%) 64.6 65.0 67.5 70.2 71.0
Number of employees 16,573 17,384 18,151 18,888 19,177
Number of shares issued (Thousands) 422,567 422,798 430,118 432,106 432,106
Notes: 1. The U.S. dollar amounts represent conversion of yen, for convenience only, at the rate of ¥94 = US$1, the approximate rate of exchange on March 31, 2013. 2. Diluted net income per share for the fiscal year ended March 31, 2012 is not presented as there were no securities with dilutive effect.
3. Stockholders’ equity used for calculation of indices from the fiscal year ended March 31, 2007 consists of “stockholders’ equity” and “accumulated other comprehensive income.”

29ANNUAL REPORT 2013 |
Millions of yenThousands ofU.S. dollars
2008 2009 2010 2011 2012 2013 2013
¥1,376,364 ¥1,200,813 ¥ 916,837 ¥1,058,257 ¥1,047,731 ¥1,025,409 $10,908,610
946,940 853,433 700,902 803,574 798,592 769,427 8,185,402
142,278 114,453 98,718 105,460 99,505 98,9381,052,534
287,145 232,927 117,215 149,221 149,632 157,043 1,670,672
300,040 250,533 127,019 160,338 165,237 170,207 1,810,715
183,580 154,731 83,852 100,119 100,643 105,714 1,124,623
268,479 159,406 123,793 119,884 87,165 86,841 923,843
47,944 37,469 33,574 37,321 35,725 37,671 400,765
141,269 119,457 87,722 93,732 82,868 80,961 861,294
¥1,918,544 ¥1,684,944 ¥1,769,139 ¥1,784,166 ¥1,809,841 ¥1,920,903 $20,435,140
638,806 606,632 612,447 638,493 694,803 832,878 8,860,407
119,419 119,419 119,419 119,419 119,419 119,419 1,270,422
1,483,669 1,407,353 1,474,212 1,469,429 1,494,573 1,623,176 17,267,831
— — — — — — —
34,045 23,827 20,052 14,574 15,732 13,929 148,181
¥ 426.63 ¥ 362.39 ¥ 197.53 ¥ 235.80 ¥ 237.03 ¥ 248.94 $ 2,648
426.35 362.35 197.50 235.80 — 248.92 2,648
90.00 100.00 100.00 100.00 100.00 100.00 1.064
21.1 27.6 50.6 42.4 42.2 40.2 40.2
3,344.17 3,218.28 3,370.56 3,360.39 3,422.93 3,709.19 39.459
20.9 19.4 12.8 14.1 14.3 15.3 15.3
13.3 12.9 9.1 9.5 9.6 10.3 10.3
13.3 11.0 6.0 7.0 7.0 7.0 7.0
15.9 13.9 7.4 9.0 9.2 9.1 9.1
75.0 81.1 80.9 80.0 80.3 82.0 82.0
20,241 19,170 16,955 16,302 16,167 17,712 17,712
432,106 432,106 432,106 432,106 432,106 432,106 432,106

30 | Shin-Etsu Chemical Co., Ltd.
Management’s Discussion and AnalysisSHIN-ETSU CHEMICAL CO., LTD. AND SUBSIDIARIES
Overview of the Shin-Etsu GroupThe Shin-Etsu Group (the “Group”) was composed of Shin-Etsu Chemical Co., Ltd. (the “Company”), 119 subsidiaries and 16 affiliates as of March 31, 2013. There are six business segments: PVC/Chlor-Alkali Business, Silicones Business, Specialty Chemicals Business, Semiconductor Silicon Business, Electronics & Functional Materials Business and Diversified Business. The Group conducts business activities by dividing manufacturing and sales activities among Group companies and using mutual cooperation among all of these companies.
Consolidated Operating PerformanceWith regard to the world economy, during fiscal 2013 (April 1, 2012 to March 31, 2013), although a gradual recovery continued in the U.S., there was sluggishness in the European economy due to Europe’s financial problems as well as a slowdown in economic growth in emerging markets such as China. As a whole, a deceleration trend continued in the world economy. On the other hand, with regard to the Japanese economy, although some encouraging signs have been seen since the start of the New Year, due in part to such affects as the slowdown of the world economy, overall, the severe situation of the Japanese economy continued. Under these circumstances, the Shin-Etsu Group worked to carry out sales activities to its wide range of customers around the world, and at the same time, we assiduously worked on the development of new products in addition to enhancing our technologies and product quality. Furthermore, we endeavored to build a strong business foundation by such means as turning our new global plants into an advantageous strategic asset at an early stage and by focusing on stably securing raw materials.
Net SalesNet sales decreased 2.1% (¥22.3 billion) to ¥1,025.4 billion compared with the previous fiscal year.
Cost of Sales and Selling, General and Administrative ExpensesCost of sales decreased 3.7% (¥29.2 billion) to ¥769.4 billion and the ratio of cost of sales to net sales decreased 1.2 percentage points to 75.0%. Selling, general and administrative (SG&A) expenses decreased 0.6% (¥0.6 billion) to ¥98.9 billion, but the ratio of these expenses to sales increased 0.1 of a percentage point to 9.6%. Research and development costs, which are included in manufacturing costs and SG&A expenses, increased 5.4% (¥1.9 billion) to ¥37.7 billion and the ratio of these costs to net sales was 3.7%.

31ANNUAL REPORT 2013 |
Operating IncomeOperating income increased 5.0% (¥7.4 billion) to ¥157.0 billion and the operating margin increased 1.0 percentage point to 15.3%.
Business Segment OverviewPVC/Chlor-Alkali BusinessWith regard to the PVC business, although the recovery in demand in the U.S. remained at a low level, Shintech in the U.S. maintained a high level of shipments by expanding sales to its customers worldwide, starting with its customers in Central and South America, and its business performance increased greatly. Shin-Etsu PVC in the Netherlands also maintained its good shipments. On the other hand, the tough business situation in Japan continued due in part to sluggish demand and the effect of raw material price increases. As a result, compared with the previous fiscal year, net sales for this business segment increased by 6.1% (¥19,667 million) to ¥343,697 million and operating income increased by 92.6% (¥21,901 million) to ¥45,552 million.
Silicones BusinessWith regard to the silicones business, sales in Japan were firm for product applications in the cosmetics field. However, sales of product applications for the automobile field were sluggish from the latter half of fiscal 2013. In addition, sales of product applications for electronics equipment generally continued to be slow. On the other hand, in our silicones business outside of Japan, the business was strongly affected by a slump in market prices in the Asian region, such as in China. As a result, compared with the previous fiscal year, net sales for this business segment decreased by 4.7% (¥6,432 million) to ¥129,029 million and operating income decreased by 15.0% (¥5,044 million) to ¥28,643 million.
Specialty Chemicals BusinessWith regard to cellulose derivatives, in Japan, this business continued to do well mainly in products for building and construction applications and for pharmaceutical-use, and in addition, the business of SE Tylose in Germany also continued to be firm, mainly in coating applications. The silicon metal business of Simcoa Operations in Australia was affected by a sluggish market. As a result, compared with the previous fiscal year, net sales for this business segment decreased by 4.1% (¥3,601 million) to ¥83,526 million and operating income decreased by 1.6% (¥231 million) to ¥14,467 million.
Semiconductor Silicon BusinessWith regard to semiconductor silicon, although the demand for some cutting-edge semiconductor devices, such as
smartphones and tablet PCs, remained strong, demand for consumer electronics products such as PCs and flat-panel TVs continued to be slow, and a severe business situation continued. As a result, compared with the previous fiscal year, net sales for this business segment decreased by 11.8% (¥27,190 million) to ¥202,466 million and operating income decreased by 36.1% (¥12,396 million) to ¥21,937 million.
Electronics & Functional Materials BusinessWith regard to the rare earth magnets business, although shipments of products for such applications as in hard disk drives and air-conditioners continued to be slow, shipments of products for applications in automobiles were strong, starting with hybrid vehicles. The photoresist products business continued to be good, aided by the progress in semiconductor device miniaturization. The business of materials for LED packaging continued to be firm. Shipments of optical fiber preform continued to be robust, contributed to by the operations of our new plant in China as well as continued strong demand. As a result, compared with the previous fiscal year, net sales for this business segment increased by 2.8% (¥4,989 million) to ¥182,781 million and operating income increased by 7.1% (¥2,692 million) to ¥40,863 million.
Diversified BusinessShin-Etsu Polymer Co., Ltd.’s business of keypads for automobile applications remained steady; however, the company’s business of semiconductor wafer-related containers continued to be slow due to sluggish demand for semiconductor devices. As a result, compared with the previous fiscal year, net sales for this business segment decreased by 10.4% (¥9,756 million) to ¥83,907 million and operating income increased by 11.3% (¥569 million) to ¥5,601 million.
Other Income and Extraordinary LossNet non-operating income was ¥13.2 billion, which included equity in earnings of affiliates of ¥6.4 billion and a foreign exchange gain of ¥4.6 billion. There was a net extraordinary loss of ¥6.1 billion because of a ¥6.1 billion loss on sales of investments in securities. After these items, income before income taxes increased 6.1% (¥9.4 billion) to ¥164.1 billion.
Net IncomeIncome taxes totaled ¥56.8 billion. As a result, net income increased 5.0% (¥5.1 billion) to ¥105.7 billion and net income per share increased ¥11.91 to ¥248.94.
Analysis of Financial PositionInformation on Assets, Liabilities and Net AssetsAs the end of fiscal 2013, total assets were ¥1,920,903

32 | Shin-Etsu Chemical Co., Ltd.
million, ¥111,062 million higher than at the end of the previous fiscal year. This was primarily attributable to an increase in yen conversions of assets of overseas consolidated subsidiaries because of the weaker yen. Total liabilities decreased by ¥17,541 million from the end of the previous fiscal year to ¥297,727 million. Total net assets increased by ¥128,603 million to ¥1,623,176 million from the end of the previous fiscal year. Retained earnings increased because of net income of ¥105,714 million in fiscal 2013 and the foreign translation adjustments increased because of the yen’s decline. The stockholders’ equity ratio was 82.0%, up 1.7 percentage points from 80.3% at the end of the previous fiscal year.
Status of Cash FlowsThe balance of cash and cash equivalents at the end of fiscal 2013 totaled ¥363,028 million, an increase of 34.3% (¥92,707 million) compared with the end of the previous fiscal year.
Cash Flows from Operating ActivitiesNet cash provided by operating activities amounted to ¥235,622 million, an increase of ¥139,055 million from the previous fiscal year. Major sources of cash were income before income taxes of ¥164,070 million, depreciation and amortization of ¥80,961 million, decrease in notes and accounts receivable of ¥32,803 million, and a ¥17,708 million decrease in inventories. A major use of cash was payment of income taxes of ¥64,004 million.
Cash Flows from Investing ActivitiesNet cash used for investing activities was ¥119,254 million, an increase of ¥30,064 million from the previous fiscal year. The primary use of cash was purchases of property, plant and equipment of ¥80,775 million.
Cash Flows from Financing ActivitiesNet cash used for financing activities was ¥44,011 million, an increase of ¥1,837 million from the previous fiscal year. Cash was used mainly for cash dividends paid of ¥42,459 million.
Capital ExpendituresCapital expenditures totaled ¥86.8 billion. The Electronics & Functional Materials Business segment accounted for the largest share of these expenditures at ¥22.0 billion. The main reasons are the construction of an LED packaging materials plant and a plant for separating and refining rare earths, which are used to make rare-earth magnets, both in Vietnam. Capital expenditures were ¥18.5 billion in the PVC/Chlor-Alkali Business, ¥15.4 billion in the Silicones Business, ¥14.8 billion in the Semiconductor Silicon
Business, ¥12.2 billion in the Specialty Chemicals Business and ¥4.2 billion in the Diversified Business.
Basic Policy Concerning Profit-sharingTaking a long-term perspective, Shin-Etsu will focus on expanding company earnings and strengthening the make-up of the Group’s structure as well as on sharing the results of such successful management efforts. It is our basic policy to distribute dividends so as to appropriately reward all of our shareholders. With regard to our financial reserves, we are making efforts to heighten the value of the Company by reinvesting them in such business activities as facility investment, and research and development, and we will proactively utilize them for strengthening Shin-Etsu’s global competitive power and future business development.In line with our basic profit-sharing policy, the year-end dividend is ¥50 per share, the same amount as the interim dividend of ¥50 per share. Accordingly, the total annual dividend per share for fiscal 2013 is ¥100, the same amount as in the previous fiscal year.
Outlook for Fiscal 2013 (ending March 2013)With regard to business prospects going forward, although the world economy is expected to move in the direction of gradual recovery, the situation of the world economy remains uncertain because of such issues as concerns about the effects of Europe’s financial problems. In Japan as well, although a recovery in the economy is expected, the situation is such that it does not allow for optimism because of concerns about the future employment situation and the effects of the world economy’s downward movement. Facing such a situation, the Shin-Etsu Group will utilize the Group’s overall strengths to expand its aggressive sales activities to a wide range of customers worldwide. Moreover, we will focus on enhancing productivity and product quality, and at the same time, we will cultivate new demand through the development of products that have special characteristics. Furthermore, we will aim to build a strong business foundation by accelerating global business development, by constructing manufacturing bases at the optimal locations, and, at the same time, by striving to assure the stable securing of raw materials.
Business RiskThis section discusses risk factors that could potentially influence such key business matters as the results of the Shin-Etsu Group’s business operations, financial condition and cash flows. The Group reduces its vulnerability to business risks by taking measures to prevent, disperse or hedge these risks. However, if an unforeseeable situation should occur, it could have a significant impact on the Group’s business results.

33ANNUAL REPORT 2013 |
This section contains a list of significant items that the Group considers are current risk factors, but it is not intended to be a comprehensive list of all risks that could seriously impact the Group’s business performance.
1) Influence of Economic Trends and Product MarketsChanges in the economic situation of countries or regions where the Group’s key products are marketed can have a great impact on the results of the Group’s business operations. In addition, among the Group’s key products, some products could be affected by large price fluctuations due to the global supply and demand environment. The Group is hedging its risks by taking such strategies as diversifying and globalizing its businesses. However, a downturn in demand for certain of its products or escalating price competition could have a significant effect on the Group’s business operations results.
2) Influence of Fluctuations in Foreign Exchange Rates Overseas sales accounted for 67.4% of the consolidated net sales of the Group in fiscal 2013, and it is expected that this ratio will remain at a high level. The Japanese yen equivalent amounts of items in the financial statement items of overseas consolidated subsidiaries, which are included in the Group’s consolidated financial statements, are influenced by fluctuations in foreign exchange rates. A large movement in these rates could have a great impact on the business results of the entire Group. In addition, although we use forward-exchange contracts and other measures to reduce risk exposure associated with transactions in foreign currencies, a large movement in foreign exchange rates could have a similar serious effect on the Group’s business operations results.
3) Influence of Natural Disasters and Disastrous AccidentsTo minimize the damage that could result from an interruption of production activities, the Group performs regular disaster-prevention inspections, carries out a constant program of facility maintenance activities at its production facilities and makes facility investments to enhance safety and establish multiple manufacturing bases. However, if a natural disaster or disastrous accident or other unforeseen event damages production facilities or other areas, such circumstances could have a major impact on the Group’s business operations results.
4) Influence of Public Regulations and LawsIn countries and regions where the Group is carrying out its business activities, we are bound by the approval processes and licensing requirements involving investment and import/export regulations as well as by various related laws concerning commercial transactions, labor, patents, taxes, foreign exchange and other items. Any changes in
these regulations and laws could have a significant effect on the Group’s business operations results.
5) Influence of Supply Factors on Procurement of Materials
The Group uses various raw materials in its production activities, and we strive to assure a stable supply of these materials by diversifying our supply sources. However, if supplies become tight or there are delays in procuring these materials, or if prices increase because of these events, there could be a great effect on the Group’s business operations results.
6) Influence of the Development of New Products and Technologies
The pace of technological progress is rapid in the electronics industry, which is an important market for some of the Group’s products. The Company is constantly working on developing the most advanced cutting-edge materials to meet needs associated with this technological innovation. However, if the Group is unable to take appropriate measures in response to changes in industries and/or markets despite its constant efforts, there could be a significant effect on the Group’s business operations results.
7) Influence of Environmental IssuesThe Group handles various types of chemical substances and complies strictly with various laws and regulations concerning the environment. In addition, the Group has been making efforts for energy-saving in order to help combat global warming and for eliminating or significantly reducing emissions of substances that are harmful to the environment. However, if regulations concerning the environment become more strict than presently anticipated and require large-scale capital expenditures and other investments as a result, there could be a significant effect on the Group’s business operations results.
8) Influence of Product LiabilityThe Group uses a large number of measures to maintain the optimum quality of its products in accordance with the characteristics of each product. However, a problem involving product quality that occurs due to unforeseen circumstances could have a significant effect on the Group’s business operations results.

34 | Shin-Etsu Chemical Co., Ltd.
Consolidated Balance SheetsSHIN-ETSU CHEMICAL CO., LTD. AND SUBSIDIARIESAs of March 31, 2013 and 2012
Millions of yenThousands of
U.S. dollars (Note 3)
2013 2012 2013ASSETSCurrent Assets: Cash and time deposits (Note 24) ................................................................. ¥ 252,881 ¥ 241,390 $ 2,690,227 Notes and accounts receivable—trade (Note 4) ........................................... 243,785 264,283 2,593,466 Securities (Notes 6 and 24) ........................................................................... 214,380 89,301 2,280,645 Merchandise and finished goods .................................................................. 123,442 121,471 1,313,216 Work in process ............................................................................................. 11,012 9,386 117,155 Raw materials and supplies .......................................................................... 134,922 129,450 1,435,341 Deferred taxes, current (Note 22) ................................................................. 27,462 34,599 292,152 Other .............................................................................................................. 31,290 59,344 332,879 Less: Allowance for doubtful accounts (Note 2 (5)) ..................................... (6,664) (6,982) (70,898) Total current assets .................................................................................. 1,032,513 942,244 10,984,187
Fixed Assets:Property, Plant and Equipment (Notes 2 (8) and 9): Buildings and structures, net ....................................................................... 164,885 156,403 1,754,097 Machinery and equipment, net ..................................................................... 356,970 330,707 3,797,554 Land ............................................................................................................... 70,110 65,400 745,857 Construction in progress .............................................................................. 50,862 40,240 541,085 Other, net ....................................................................................................... 6,822 5,807 72,584 Total property, plant and equipment ........................................................ 649,650 598,558 6,911,179
Intangible Fixed Assets: Goodwill ......................................................................................................... 9,363 9,020 99,608 Other ............................................................................................................. 5,274 4,566 56,110 Total intangible fixed assets ...................................................................... 14,637 13,587 155,719
Investments and Other Assets: Investments in securities (Notes 6 and 8) .................................................... 129,551 154,161 1,378,209 Long-term loans ............................................................................................ 6,405 3,583 68,144 Deferred taxes, non-current (Note 22) ......................................................... 14,590 19,937 155,220 Other (Note 8) ................................................................................................ 73,900 77,786 786,176 Less: Allowance for doubtful accounts (Note 2 (5)) ..................................... (347) (17) (3,695) Total investments and other assets .......................................................... 224,101 255,451 2,384,054 Total fixed assets ....................................................................................... 888,389 867,596 9,450,953 Total Assets ............................................................................................... ¥1,920,903 ¥1,809,841 $20,435,140 The accompanying notes are an integral part of the statements.

35ANNUAL REPORT 2013 |
Millions of yenThousands of
U.S. dollars (Note 3)
2013 2012 2013LIABILITIES AND NET ASSETSCurrent Liabilities: Notes and accounts payable—trade (Note 4) ............................................... ¥ 100,197 ¥ 109,378 $ 1,065,932 Short-term borrowings (Note 10) ................................................................. 5,507 13,862 58,589 Accounts payable-other ................................................................................ 28,882 32,011 307,265 Accrued expenses ......................................................................................... 45,537 45,375 484,437 Accrued income taxes ................................................................................... 6,220 34,758 66,177 Accrued bonuses for employees ................................................................... 1,995 1,887 21,226 Accrued bonuses for directors ..................................................................... 372 360 3,965 Other (Notes 4 and 22)................................................................................... 10,921 9,807 116,185 Total current liabilities .............................................................................. 199,635 247,441 2,123,779
Long-Term Liabilities: Long-term debt (Note 10) ............................................................................. 7,709 1,454 82,018 Deferred taxes, non-current (Note 22) ......................................................... 65,033 44,295 691,847 Accrued retirement benefits (Note 11) ......................................................... 20,185 16,687 214,734 Accrued retirement bonuses for directors ................................................... 276 421 2,938 Other .............................................................................................................. 4,887 4,967 51,990 Total long-term liabilities .......................................................................... 98,091 67,827 1,043,529
Total Liabilities ................................................................................................. 297,727 315,268 3,167,309 Commitment and Contingent Liabilities (Note 12)
Net AssetsStockholders’ Equity: Common stock:.............................................................................................. 119,419 119,419 1,270,422 Authorized: 1,720,000,000 shares
Issued: 432,106,693 shares as of March 31, 2013 and 2012, respectively
Additional paid-in capital .............................................................................. 128,234 128,177 1,364,192 Retained earnings (Note 13) ......................................................................... 1,470,015 1,435,693 15,638,466 Less: Treasury stock, at cost ........................................................................ (39,167) (40,925) (416,673) 7,190,226 shares and 7,512,807 shares as of March 31, 2013
and 2012, respectively Total stockholders’ equity ......................................................................... 1,678,502 1,642,365 17,856,408
Accumulated Other Comprehensive Income: Unrealized gains (losses) on available-for-sale securities (Note 2 (7)) ...... 11,591 1,212 123,311 Deferred gains (losses) on hedges ............................................................... 174 25 1,858 Foreign currency translation adjustments ................................................... (114,172) (190,249) (1,214,601) Total accumulated other comprehensive income .................................... (102,406) (189,011) (1,089,431)Share Subscription Rights ............................................................................... 2,149 3,491 22,864 Minority Interests in Consolidated Subsidiaries ........................................... 44,931 37,727 477,989 Total net assets .......................................................................................... 1,623,176 1,494,573 17,267,831 Total Liabilities and Net Assets ............................................................... ¥1,920,903 ¥1,809,841 $20,435,140

36 | Shin-Etsu Chemical Co., Ltd.
Consolidated Statements of IncomeSHIN-ETSU CHEMICAL CO., LTD. AND SUBSIDIARIESFor the years ended March 31, 2013, 2012 and 2011
Millions of yenThousands of
U.S. dollars (Note 3)
2013 2012 2011 2013Net Sales (Note 25) ................................................................................... ¥1,025,409 ¥1,047,731 ¥1,058,257 $10,908,610
Cost of Sales (Notes 11 and 17) ................................................................ 769,427 798,592 803,574 8,185,402
Gross profit ............................................................................................ 255,981 249,138 254,682 2,723,207
Selling, General and Administrative Expenses (Notes 11, 16 and 17) .... 98,938 99,505 105,460 1,052,534
Operating income (Note 25) .................................................................. 157,043 149,632 149,221 1,670,672
Other Income (Expenses):
Interest income ...................................................................................... 2,417 2,978 2,800 25,720
Dividend income .................................................................................... 1,560 1,530 1,350 16,596
Equity in earnings of affiliates ............................................................... 6,430 15,656 12,627 68,412
Interest expenses .................................................................................. (465) (517) (529) (4,948)
Loss on disposal of property, plant and equipment ............................. (690) (938) (897) (7,350)
Foreign exchange gain (loss) ................................................................ 4,565 (416) (9,122) 48,568
Other, net ............................................................................................... (653) (2,688) 4,888 (6,957)
Ordinary income .................................................................................... 170,207 165,237 160,338 1,810,715
Extraordinary Income (Losses):
Reversal of restoration costs for earthquake (Note 19) ...................... — 5,491 — —
Loss on sales of investment securities ................................................ (6,137) — — (65,287)
Loss on impairment of fixed assets (Note 20) ...................................... — (6,191) — —
Loss on disaster (Note 21) .................................................................... — (5,312) (21,032) —
Provision of allowance for doubtful accounts ...................................... — (4,553) — —
Income before income taxes and minority interests ........................... 164,070 154,671 139,305 1,745,427
Income Taxes (Note 22):
Current ................................................................................................... 37,059 56,417 35,998 394,249
Prior years ............................................................................................. — — (10,654) —
Deferred ................................................................................................. 19,696 (2,259) 12,643 209,535
56,755 54,157 37,987 603,785
Income before minority interests ......................................................... 107,314 100,513 101,318 1,141,642
Minority Interests in Earnings of Consolidated Subsidiaries .............. (1,599) 129 (1,199) (17,019)
Net Income ............................................................................................ ¥ 105,714 ¥ 100,643 ¥ 100,119 $ 1,124,623
Yen
U.S. dollars (Note 3)
Per Share (Note 2 (14)):
Net income—primary ............................................................................ ¥248.94 ¥237.03 ¥235.80 $2.648
Net income—fully diluted ...................................................................... 248.92 — 235.80 2.648
Cash dividends ....................................................................................... 100.00 100.00 100.00 1.064
Weighted-Average Number of Shares Outstanding (Thousands) ........ 424,651 424,594 424,598 424,651
The accompanying notes are an integral part of the statements.Diluted net income per share for the fiscal year ended March 31, 2012 is not presented as there were no securities with dilutive effect.

37ANNUAL REPORT 2013 |
Consolidated Statements of Comprehensive IncomeSHIN-ETSU CHEMICAL CO., LTD. AND SUBSIDIARIESFor the years ended March 31, 2013, 2012 and 2011
Millions of yenThousands of
U.S. dollars (Note 3)
2013 2012 2011 2013Income before Minority Interests .................................................. ¥107,314 ¥100,513 ¥101,318 $1,141,642
Other Comprehensive Income (Note 23):
Unrealized gains (losses) on available-for-sale securities ........ 10,314 (2,410) (3,466) 109,724
Deferred gains (losses) on hedges .............................................. 238 (211) 136 2,541
Foreign currency translation adjustments .................................. 66,415 (28,452) (56,951) 706,547
Share of other comprehensive income of associates accounted for by using equity method ..................................... 6,499 (2,988) (3,117) 69,140
Total other comprehensive income ......................................... 83,467 (34,063) (63,400) 887,954
Comprehensive Income .................................................................. ¥190,782 ¥ 66,450 ¥ 37,918 $2,029,597
(Breakdown)
Comprehensive income attributable to owners of the parent .... ¥186,861 ¥67,547 ¥38,175 $1,987,887
Comprehensive income attributable to minority interests ........ 3,920 (1,097) (256) 41,710
The accompanying notes are an integral part of the statements.

38 | Shin-Etsu Chemical Co., Ltd.
Consolidated Statements of Changes in Net AssetsSHIN-ETSU CHEMICAL CO., LTD. AND SUBSIDIARIES
Thousands Millions of yen
Stockholders’ Equity Accumulated Other Comprehensive Income
Numberof shares
of common stock
Commonstock
Additionalpaid-incapital
Retainedearnings
Treasurystock, at
costTotal
Unrealizedgains (losses)
on available-for-sale securities
Deferred gains (losses)
on hedges
Foreign currency
translation adjustments
TotalShare
subscription rights
Minorityinterests in
consolidatedsubsidiaries
Total net assets
Balance at March 31, 2010 ........ 432,106 ¥119,419 ¥128,177 ¥1,318,413 ¥(40,892) ¥1,525,118 ¥ 6,717 ¥ 517 ¥(101,207) ¥ (93,972) ¥ 3,648 ¥39,417 ¥1,474,212
Cash dividends (Note 13) ........ (42,460) (42,460) (42,460)
Net income .............................. 100,119 100,119 100,119
Changes in scope of consolidation and equity method ...................... (28) (28) (28)
Purchase of treasury stock .... (25) (25) (25)
Disposal of treasury stock...... (0) 0 0 0
Net changes of items other than stockholders’ equity ..... (3,442) 377 (58,879) (61,943)
174 (619) (62,388)
Balance at March 31, 2011 ........ 432,106 119,419 128,177 1,376,043 (40,917) 1,582,724 3,275 895 (160,087) (155,916) 3,822 38,798 1,469,429
Cash dividends (Note 13) ........ (42,459) (42,459) (42,459)
Net income .............................. 100,643 100,643 100,643
Changes in scope of consolidation and equity method ...................... 1,466 1,466 1,466
Purchase of treasury stock .... (9) (9) (9)
Disposal of treasury stock...... (0) 1 1 1
Net changes of items other than stockholders’ equity ..... (2,063) (869) (30,162) (33,095) (330) (1,070) (34,496)
Balance at March 31, 2012 ........ 432,106 119,419 128,177 1,435,693 (40,925) 1,642,365 1,212 25 (190,249) (189,011) 3,491 37,727 1,494,573
Cash dividends (Note 13) ........ (42,459) (42,459) (42,459)
Net income .............................. 105,714 105,714 105,714
Changes in scope of consolidation and equity method ...................... (28,932) (28,932) (28,932)
Purchase of treasury stock .... (11) (11) (11)
Disposal of treasury stock...... 56 1,769 1,825 1,825
Net changes of items other than stockholders’ equity ..... 10,378 148 76,077 86,605 (1,342) 7,203 92,465
Balance at March 31, 2013 ........ 432,106 ¥119,419 ¥128,234 ¥1,470,015 ¥(39,167) ¥1,678,502 ¥11,591 ¥ 174 ¥(114,172) ¥(102,406) ¥ 2,149 ¥44,931 ¥1,623,176
Thousands Thousands of U.S. dollars (Note 3)
Stockholders’ Equity Accumulated Other Comprehensive Income
Numberof shares
of common stock
Commonstock
Additionalpaid-incapital
Retainedearnings
Treasurystock, at
costTotal
Unrealizedgains (losses)
on available-for-sale securities
Deferred gains (losses)
on hedges
Foreign currency
translation adjustments
TotalShare
subscription rights
Minorityinterests in
consolidatedsubsidiaries
Total net assets
Balance at March 31, 2012 ........ 432,106 $1,270,422 $1,363,592 $15,273,330 $(435,374) $17,471,970 $ 12,897 $ 275 $(2,023,934) $(2,010,761) $ 37,147 $401,357 $15,899,714
Cash dividends (Note 13) ........ (451,696) (451,696) (451,696)
Net income .............................. 1,124,623 1,124,623 1,124,623
Changes in scope of consolidation and equity method ......................
(307,790) (307,790) (307,790)
Purchase of treasury stock .... (118) (118) (118)
Disposal of treasury stock...... 600 18,819 19,419 19,419
Net changes of items other than stockholders’ equity .....
110,413 1,582 809,333 921,330 (14,283) 76,631 983,679
Balance at March 31, 2013 ........ 432,106 $1,270,422 $1,364,192 $15,638,466 $(416,673) $17,856,408 $123,311 $1,858 $(1,214,601) $(1,089,431) $ 22,864 $477,989 $17,267,831
The accompanying notes are an integral part of the statements.

39ANNUAL REPORT 2013 |
Consolidated Statements of Cash FlowsSHIN-ETSU CHEMICAL CO., LTD. AND SUBSIDIARIESFor the years ended March 31, 2013, 2012 and 2011
Millions of yenThousands of
U.S. dollars (Note 3)
2013 2012 2011 2013Cash Flows from Operating Activities: Income before income taxes ............................................................. ¥ 164,070 ¥154,671 ¥ 139,305 $1,745,427 Adjustments to reconcile income before income
taxes to net cash provided by operating activities:
Depreciation and amortization ...................................................... 80,961 82,868 93,732 861,294 Loss on impairment of fixed assets .............................................. — 6,191 — — Increase in accrued retirement benefits ...................................... 2,486 2,663 1,727 26,446 (Gain) loss on sales of investment securities ............................... 6,039 (23) (1,202) 64,250 Loss on write-down of investment securities .............................. 485 677 52 5,164 Increase (decrease) in allowance for doubtful accounts ............. (210) 4,496 (166) (2,240) Interest and dividend income ........................................................ (3,977) (4,509) (4,150) (42,316) Interest expenses .......................................................................... 465 517 529 4,948 Exchange (gain) loss ...................................................................... 323 (395) 3,918 3,436 Equity in earnings of affiliates ....................................................... (6,430) (15,656) (12,627) (68,412) Changes in assets and liabilities: (Increase) decrease in notes and accounts receivable ................ 32,803 2,110 (7,274) 348,971 (Increase) decrease in inventories ................................................ 17,708 (77,517) (11,292) 188,391 Increase in long-term advance payment ...................................... 7,521 (2,354) (5,285) 80,015 Increase (decrease) in notes and accounts payable .................... (1,189) (1,585) 20,822 (12,649) Increase (decrease) in provision for loss on disaster .................. — (4,725) 24,401 — Other, net ....................................................................................... (5,700) (6,472) (15,156) (60,646) Subtotal ...................................................................................... 295,355 140,960 227,333 3,142,080 Proceeds from interest and dividends .......................................... 4,754 8,553 14,335 50,575 Payment of interest ....................................................................... (482) (513) (538) (5,132) Payment of income taxes .............................................................. (64,004) (41,124) (33,277) (680,899) Income taxes refund ...................................................................... — — 9,637 — Payment for disaster losses .......................................................... — (21,041) — — Insurance income on disaster ....................................................... — 9,733 — — Net cash provided by operating activities............................... 235,622 96,567 217,490 2,506,623Cash Flows from Investing Activities: Purchases of securities ..................................................................... (66,030) (24,988) (26,044) (702,451) Proceeds from redemption of securities.......................................... 18,810 21,400 16,900 200,106 Proceeds from sales of securities .................................................... 5,189 6,031 5,576 55,206 Purchases of property, plant and equipment ................................... (80,775) (80,320) (117,517) (859,314) Proceeds from sales of property, plant and equipment .................. 285 513 410 3,037 Purchases of intangible fixed assets ................................................ (884) (904) (1,539) (9,405) Purchases of investments in securities ........................................... (7,581) (691) (3,104) (80,658) Proceeds from sales of investments in securities ........................... 898 195 2,203 9,561 Proceeds from redemption of investments in securities ................ 22,978 — 3,181 244,450 Payments of loans ............................................................................. (5,368) (7,595) (207) (57,109) Proceeds from collection of loans .................................................... 327 464 34 3,482 Other, net ........................................................................................... (7,103) (3,296) (11,898) (75,564) Net cash used for investing activities ..................................... (119,254) (89,190) (132,005) 1,268,659Cash Flows from Financing Activities: Net increase (decrease) in short-term borrowings ......................... (3,407) 2,058 (211) (36,255) Proceeds from long-term debt ......................................................... 6,517 1,188 13 69,339 Repayment of long-term debt ........................................................... (5,482) (2,093) (5,387) (58,327) Purchase of treasury stock ............................................................... (11) (9) (25) (118) Proceeds from sales of treasury stock ............................................ 1,490 1 0 15,861 Cash dividends paid ........................................................................... (42,459) (42,459) (42,460) (451,696) Cash dividends paid to minority interests ........................................ (574) (879) (466) (6,112) Other, net ........................................................................................... (84) 20 (84) (894) Net cash used for financing activities ..................................... (44,011) (42,174) (48,621) (468,202)Effect of Exchange Rate Changes on Cash and Cash Equivalents ... 16,899 (7,026) (5,511) 179,786Net Increase (Decrease) in Cash and Cash Equivalents ................... 89,257 (41,824) 31,352 949,547Cash and Cash Equivalents at Beginning of Year .............................. 270,321 302,285 270,443 2,875,755Increase (Decrease) in Cash and Cash Equivalents Resulting from Changes in Scope of Consolidation .......................................... 3,450 9,859 489 36,705Cash and Cash Equivalents at End of Year (Note 24) ........................ ¥ 363,028 ¥270,321 ¥ 302,285 $3,862,009The accompanying notes are an integral part of the statements.
40 | Shin-Etsu Chemical Co., Ltd.
Notes to Consolidated Financial StatementsSHIN-ETSU CHEMICAL CO., LTD. AND SUBSIDIARIESFor the years ended March 31, 2013, 2012 and 2011
1. BASIS OF PRESENTING FINANCIAL STATEMENTS
The accompanying consolidated financial statements have been prepared from accounts and records maintained by Shin-Etsu Chemical Co., Ltd. (the “Company”) and its subsidiaries. The Company and its domestic consolidated subsidiaries have maintained their accounts and records in accordance with the provisions set forth in the Corporation Law of Japan and the Financial Instruments and Exchange Law and in conformity with generally accepted accounting principles prevailing in Japan. The accounts of overseas consolidated subsidiaries are based on their accounting records maintained in conformity with generally accepted accounting principles prevailing in the respective countries. Before the fiscal year ended March 31, 2008, in general, no adjustments to the accounts of overseas consolidated subsidiaries were reflected in the accompanying consolidated financial statements to present them in compliance with Japanese accounting principles followed by the Company. Effective from the fiscal year ended March 31, 2009, the “Practical Solution on Unification of Accounting Policies Applied to Foreign Subsidiaries for Consolidated Financial Statements” (Accounting Standards Board of Japan (“ASBJ”) Practical Issues Task Force No. 18, issued on May 17, 2006) has been applied, and accordingly some revisions have been made to the consolidated accounts as necessary. The accompanying consolidated financial statements of the Company and its subsidiaries are prepared on the basis of accounting principles generally accepted in Japan, which are different in certain respects as to application and disclosure requirements from Interna-tional Financial Reporting Standards, and are compiled from the consolidated financial statements prepared by the Company, as required by the Financial Instruments and Exchange Law of Japan. The presentation of the accompanying consolidated financial statements is made in conformity with the Consolidated Financial State-ments Regulation (ordinance promulgated by the Ministry of Finance) and meets the requirements for disclosure of financial information of the Company on a consolidated basis. However, certain account balances, as disclosed in the basic consolidated financial statements in Japan, have been reclassified to the extent deemed necessary to enable presentation in a form which is more familiar to readers outside Japan. The amounts in the accompanying consolidated financial statements are stated in millions of yen. Amounts less than ¥1 million are omitted, except where otherwise indicated.
2. SUMMARY OF SIGNIFICANT ACCOUNTING POLICIES
(1) Principles of consolidationThe Company had 119 majority-owned subsidiaries as of March 31, 2013 (110 and 102 as of March 31, 2012 and 2011, respectively). The consolidated financial statements include the accounts of the Company and 87 (77 and 72 for 2012 and 2011, respectively) majority-owned subsidiaries (the “Companies”), of which the principal firms are listed on page 65 with their respective fiscal year-ends. The remaining 32 (33 and 30 for 2012 and 2011, respectively) unconsolidated subsidiaries, including Shin-Etsu Electronics (Malaysia) Sdn. Bhd., whose total assets, net sales, net income and retained earnings in the aggregate are not significant compared with those of the consolidated financial statements of the Companies, therefore, have not been consolidated with the Company. For consolidation of subsidiaries whose fiscal year-ends are not in agreement with that of the Company, necessary adjustments are made on significant inter-company transactions which took place during the periods between the fiscal year-end of respective consolidated subsidiaries and that of the Company. Unrealized intercompany profits and losses among the Companies are entirely eliminated, and the portion thereof attributable to minor-ity interests is charged to the minority interests. Valuation of assets and liabilities of consolidated subsidiaries is based on full fair value accounting method. Goodwill is amortized within 20 years on a straight-line basis. Kashima Vinyl Chloride Monomer Co., Ltd., which had previously been an affiliate under the equity method, and Kashima Chlorine & Alkali Co., Ltd., which had previously been a non-equity-method affiliate, were newly included in the scope of consolidation due to the acquisition of additional shares and increased importance respectively. Shin-Etsu Magnetics Philippines, Inc., which had previously been an unconsolidated subsidiary, was newly included in the scope of consolidation due to increased importance. Shin-Etsu Unit Co., Ltd., which had previously been a consolidated subsidiary, was excluded from the scope of consolidation due to an absorption-type merger with Shin-Etsu Finetech Co., Ltd., which is a consolidated subsidiary.
(2) Accounting for investments in unconsolidated subsidiaries and affiliatesThe Company had 32 (33 and 30 for 2012 and 2011, respectively) unconsolidated subsidiaries (majority-owned) and 16 (17 and 17 for 2012 and 2011, respectively) affiliates (meaning 20% to 50% ownership of a company’s equity interest). The equity method is applied to the investments in 4 (7 and 7 for 2012 and 2011, respectively) major affiliates and the cost method is applied to investments in the remain-ing unconsolidated subsidiaries, including Shin-Etsu Electronics (Malaysia) Sdn. Bhd., and affiliates, including TATSUNO CHEMICAL INDUSTRIES INC., since they are not material for the consolidated financial statements. Hemlock Semiconductor Corp. and Hemlock Semiconductor L.L.C., which had previously been affiliates under the equity method, were excluded from the scope of equity method application due to a decrease in equity interests in these affiliates. The major unconsolidated subsidiaries and affiliates accounted for by the equity method are listed below: Mimasu Semiconductor Industry Co., Ltd. Shin-Etsu Quartz Products Co., Ltd.
(3) Translation of foreign currency transactionsRevenue and expense items arising from transactions denominated in foreign currencies are generally translated into yen at the rates effective at the respective transaction dates. Foreign currency deposits, receivables and payables denominated in foreign currencies are translated into yen at the exchange rate prevailing at the respective balance sheet dates and the resulting translation gain or loss is included in the determination of net income for the year.

41ANNUAL REPORT 2013 |
However, all of the overseas consolidated subsidiaries apply the current rate method to translate transactions and account balances in foreign currencies into their respective home currencies.
(4) Translation of foreign currency financial statements (accounts of overseas subsidiaries)The translation of foreign currency financial statements of overseas subsidiaries into yen for consolidation purposes is made by themethod of translation prescribed by the statements issued by the Business Accounting Council (BAC) of Japan. Under the BAC method, all assets and liabilities are translated into yen at current exchange rates while capital accounts and retained earnings are translated at historical rates, and revenue and expense items are translated at the average exchange rates during the year. The resulting translation adjustments are, as before, shown as “Foreign currency translation adjustments” in the accompanying balance sheets as of March 31, 2013 and 2012.
(5) Allowance for doubtful accountsThe Company and consolidated subsidiaries provide an allowance for doubtful accounts using the historic percentage of bad debt loss against the balance of general receivables plus the amount deemed necessary to cover individual accounts estimated to be uncollectible.
(6) InventoriesThe Company mainly applies the cost method based on the weighted-average method, which determines the amount of the inventories shown on the balance sheet by writing them down based on the decrease in their profitability.
(7) Financial instrumentsSecurities:Bonds held to maturity are stated at amortized cost using the straight-line method. Available-for-sale securities for which market quotations are available are stated at fair value. Net unrealized gains or losses on these securities are reported as a separate item in the stockholders’ equity at net-of-tax amounts. Other securities for which market quotations are unavailable are stated at cost, which is determined by the moving-average cost method.
Derivatives:Derivatives are stated at fair value, with changes in fair value included in net profit or loss for the period in which they arise, except for derivatives that are designated as “hedging instruments.” The Company and consolidated subsidiaries engage in foreign exchange contracts, currency swaps, interest rate swaps andearthquake derivatives.
Hedge accounting:Gains or losses arising from changes in fair value of the derivatives designated as “hedging instruments” are deferred as an asset or liability and included in net profit or loss in the same period during which the gains and losses on the hedged items or transactions are recognized. The derivatives designated as hedging instruments by the Company are interest swaps, foreign exchange contracts and currency swaps. The related hedged items are interest rate transactions tied to funding activities, marketable securities and forecasted foreign currency transactions. The Company has a policy to utilize the above hedging instruments in order to reduce the Company’s exposure to the risk of interest rate fluctuation and foreign currency fluctuation. Thus, the Company’s purchases of the hedging instruments are limited to, at maximum, the amounts of the hedged items and not for speculation or dealing purposes. The Company evaluates the effectiveness of its hedging activities by reference to the accumulated gains or losses on the hedging instruments and the related hedged items from the commencement of the hedges.
(8) Property, plant and equipmentDepreciation of the Company and its domestic subsidiaries is principally computed by the declining-balance method, based on the estimated useful lives of assets. Depreciation of foreign subsidiaries is principally computed by the straight-line method over the estimated useful lives of the assets. The cost of property, plant and equipment retired or otherwise disposed of and accumulated depreciation are eliminated from the related accounts, and the resulting profit or loss is reflected in income. Effective from the fiscal year ended March 31, 2013, due to a revision of the corporate tax law in Japan, the Company and some of its domestic consolidated subsidiaries have applied a depreciation method based on the revised law for tangible assets purchased on or after April 1, 2012. The impact of this change on operating income, ordinary income and income before income taxes for the fiscal year ended March 31, 2013 is immaterial.
(9) Repairs and maintenanceNormal repairs and maintenance, including minor renewals and improvements, are charged to income as incurred.
(10) Accrued bonuses for employeesCertain consolidated subsidiaries accrued the current fiscal year portion of the estimated amount of employees’ bonuses to be paid in the subsequent period.
(11) Accrued bonuses for directorsThe Company and its domestic consolidated subsidiaries accrued the current fiscal year portion of the estimated amount of directors’ bonuses to be paid in the subsequent period.
(12) Accrued retirement benefitsPension and severance costs for employees are accrued based on the estimates of the pension obligations and the plan assets at the end of the fiscal year. The actuarial difference is amortized primarily over a five-year period, which is within the average remaining service period, using the straight-line method from the fiscal year when the difference was generated. The prior service cost is amortized primarily over a ten-year period, which is within the average remaining service period, using the straight-line method from the time when the difference was generated (see Note 11).

42 | Shin-Etsu Chemical Co., Ltd.
Effective from the fiscal year ended March 31, 2010, “Partial Amendments to Accounting Standard for Retirement Benefits (Part 3)” (ASBJ Statement No. 19 issued on July 31, 2008) has been applied. This change has no impact on operating income, ordinary income and income before income taxes for the fiscal year ended March 31, 2010.
(13) Research and development costsResearch and development costs are charged to income as incurred.
(14) Income and dividends per shareNet income per share is based upon the weighted-average number of shares of common stock outstanding during each fiscal year. Net income per share adjusted for dilution represents net income per share assuming full conversion of all convertible debentures of the Company outstanding with related reduction in interest expenses.
(15) DividendsDividends are proposed by the Board of Directors and approved by the stockholders at meetings held subsequent to the fiscal year to which the dividends are applicable, and registered stockholders as of the end of such fiscal year are entitled to the subsequently declared dividends. Interim cash dividends are also paid (see Note 13). Dividends charged to retained earnings in the accompanying consolidated statements of stockholders’ equity represent dividends approved and paid during the year.
(16) Accrued retirement bonuses for directorsCertain domestic subsidiaries recognize the required amount of directors’ retirement bonuses in accordance with an internal standard.
(17) Application of the “Accounting Standard for Accounting Changes and Error Corrections”Effective from April 1, 2011, the “Accounting Standard for Accounting Changes and Error Corrections” (ASBJ Statement No.24, issued on December 4, 2009) and the “Guidance on Accounting Standard for Accounting Changes and Error Corrections” (ASBJ Guidance No.24, issued on December 4, 2009) have been applied for accounting changes and corrections of prior period errors.
(18) Consumption taxConsumption tax withheld by the Company and certain subsidiaries on sales of products and services is not included in the amount of net sales in the consolidated statements of income. Consumption tax borne by the Company and certain subsidiaries on purchases of goods and services and on expenses is also not included in the related amounts in the consolidated statements of income.
(19) ReclassificationsCertain reclassifications have been made in the 2012 and 2011 financial statements to conform to the presentation for 2013.
3. UNITED STATES DOLLAR AMOUNTS
The Company prepares its consolidated financial statements in yen. The dollar amounts included in the consolidated financial statements and notes thereto represent the arithmetical results of translating yen to dollars on a basis of ¥94 to US$1, the approximate effective rate of exchange on March 31, 2013. The inclusion of such dollar amounts is solely for convenience and is not intended to imply that yen amounts have been or could be readily converted, realized or settled in dollars at ¥94 to US$1 or at any other rate.
4. NOTES AND ACCOUNTS RECEIVABLE AND PAYABLE
The Companies recognize settlements of trade notes receivable and trade notes payable when the bank clearance of the notes is actually made. As March 31, 2013 was a holiday for financial institutions, the following accounts include the unsettled balances of trade notes receivable and trade notes payable due on that date in the accompanying consolidated balance sheet as of March 31, 2013.
Millions of yenThousands ofU.S. dollars
2013 2012 2013
Notes and accounts receivable—trade Trade notes receivable ................................................................................................ ¥2,462 ¥2,509 $26,199Notes and accounts payable—trade Trade notes payable .................................................................................................... 1,340 975 14,261 Other ............................................................................................................................ 20 8 216

43ANNUAL REPORT 2013 |
5. FINANCIAL INSTRUMENTS
(1) Overview of financial instrumentsManagement policyIn principle, our fund management methods are limited to deposits with financial institutions with high credit ratings and risk-free bonds, and our financing is implemented primarily through borrowings from banks.
Financial instruments, risks and risk managementNotes and accounts receivable-trade are exposed to credit risk of customers. With regard to credit risk generated by notes and accounts receivable-trade, each of our business departments not only controls and manages account due dates and balances, but also confirms credit standing of major customers periodically, making efforts to identify doubtful accounts as soon as possible. Securities and investment securities are stocks in companies with business relationships, bonds held to maturity and also a certificate of deposit. Regarding securities and investment securities, we update regularly their fair value and the financial situation of the issuing companies. For stocks, we are also continually reviewing our stock holding status, considering the relationship with the issuing companies. In order to hedge the foreign currency exchange risk associated with assets and liabilities denominated in foreign currencies and interest rate risk associated with financial assets and liabilities, derivative transactions such as interest rate swap transactions, currency swap transactions and foreign exchange forward contracts are utilized. All of our derivative transactions are implemented for the purpose of hedging risks generated in the ordinary course of business, and there are no derivative transactions entered into for trading or speculative purposes.
Supplementary explanation on the estimated fair value of financial instrumentsThe fair value of financial instruments is based on their quoted market price, if available. When there is no quoted market priceavailable, fair value is reasonably estimated. Since various assumptions and factors are reflected in estimating the fair value, differentassumptions and factors could result in different fair values.
(2) Fair value of financial instrumentsAs of March 31, 2013 and 2012, book value, fair value and the difference between the two are as follows:
Millions of yen Thousands of U.S. dollars
2013 2013
Book value Fair value Difference Book value Fair value Difference
Assets:(1) Cash and time deposits ..................................... ¥252,881 ¥252,881 ¥ — $2,690,227 $2,690,227 $ —(2) Notes and accounts receivable—trade ............ 243,785 243,785 — 2,593,466 2,593,466 —(3) Securities and investments in securities i) Bonds held to maturity .................................. 11,890 11,933 42 126,497 126,953 456
ii) Investments in and advances to unconsolidated subsidiaries and affiliates .. 21,932 13,008 (8,924) 233,327 138,383 (94,943)
iii) Available-for-sale securities ......................... 265,575 265,575 — 2,825,273 2,825,273 —(4) Long-term loans ............................................... 6,405 6,644 238 68,144 70,686 2,541 Total .................................................................... ¥802,471 ¥793,829 ¥(8,642) $8,536,936 $8,444,990 $(91,945)
Liabilities:(1) Notes and accounts payable—trade ................. ¥100,197 ¥100,197 ¥ — $1,065,932 $1,065,932 $ —(2) Short-term borrowings ..................................... 5,507 5,507 — 58,589 58,589 —(3) Accounts payable—other .................................. 28,882 28,882 — 307,265 307,265 —(4) Accrued expenses ............................................. 45,537 45,537 — 484,437 484,437 —(5) Accrued income taxes ....................................... 6,220 6,220 — 66,177 66,177 —(6) Long-term debt ................................................. 7,709 7,665 (44) 82,018 81,546 (472) Total .................................................................... ¥194,055 ¥194,011 ¥ (44) $2,064,421 $2,063,949 $ (472)
Derivative transactions: Hedge accounting not applied ........................... ¥ (1,376) ¥ (1,376) ¥ — $ (14,647) $ (14,647) $ — Hedge accounting applied .................................. 416 416 — 4,435 4,435 — Total .................................................................... ¥ (959) ¥ (959) ¥ — $ (10,211) $ (10,211) $ —

44 | Shin-Etsu Chemical Co., Ltd.
Millions of yen
2012Book value Fair value Difference
Assets:(1) Cash and time deposits .................................................................................................................... ¥241,390 ¥241,390 ¥ —(2) Notes and accounts receivable—trade ........................................................................................... 264,283 264,283 —(3) Securities and investments in securities i) Bonds held to maturity ................................................................................................................. 15,043 15,119 75
ii) Investments in and advances to unconsolidated subsidiaries and affiliates ................................................................................. 21,822 11,105 (10,716)
iii) Available-for-sale securities ........................................................................................................ 119,581 119,581 —(4) Long-term loans .............................................................................................................................. 3,583 3,811 228
Total ................................................................................................................................................... ¥665,704 ¥655,291 ¥(10,412)
Liabilities:(1) Notes and accounts payable—trade ................................................................................................ ¥109,378 ¥109,378 ¥ —(2) Short-term borrowings .................................................................................................................... 13,862 13,862 —(3) Accounts payable—other ................................................................................................................. 32,011 32,011 —(4) Accrued expenses ............................................................................................................................ 45,375 45,375 —(5) Accrued income taxes ...................................................................................................................... 34,758 34,758 —(6) Long-term debt ................................................................................................................................ 1,454 1,449 (4)
Total ................................................................................................................................................... ¥236,840 ¥236,835 ¥ (4)
Derivative transactions: Hedge accounting not applied .......................................................................................................... ¥ 1,124 ¥ 1,124 ¥ — Hedge accounting applied ................................................................................................................. (100) (100) — Total ................................................................................................................................................... ¥ 1,024 ¥ 1,024 ¥ —
Notes: 1. Method for calculating fair value of financial instruments, and notes regarding securities and derivative transactionsAssets(1) Cash and time deposits and (2) Notes and accounts receivable—trade
All of these are settled within a short time, and their fair value and book value are nearly equal. Thus, the book value is listed as fair value in the table above.(3) Securities and investments in securities
These mainly consist of stocks and bonds. Fair value for stocks is based on a price settled on stock exchanges, while fair value for bonds is based on either a price settled on the exchanges or one offered from financial institutions that we have transactions with. Negotiable certificates of deposit are settled within a short time, and the fair value and book value are nearly equal. Thus, the book value is listed as fair value in the table above.
(4) Long-term loansFair value for long-term loans is calculated based on a future cash flow discounted at an appropriate rate such as mid-term and long-term interest rates with credit spreads, for all loans grouped by a certain period of time and credit rating under the credit exposure management.
Liabilities(1) Notes and accounts payable—trade, (2) Short-term borrowings, (3) Accounts payable—other, (4) Accrued expenses and (5) Accrued income taxes. All of these
are settled within a short time, and their fair value and book value are nearly equal. Thus, the book value is listed as fair value in the table above.(6) Long-term debt
Fair value for long-term debt is calculated based on a present value of principal with interest added, discounted at an expected rate for new borrowings with the same terms.
Derivative transactionsNet receivables (payables) derived from derivative transactions are displayed in the table above. Total net payables are showed in parenthesis.
2. The following table summarizes financial instruments whose fair value is extremely difficult to estimate.
Millions of yen Thousands of U.S. dollars
Description 2013 2012 2013Non-listed equity securities ...................................................... ¥39,106 ¥81,531 $416,029
Investment securities, etc. ....................................................... 5,426 5,484 57,727
Total ....................................................................................... ¥44,533 ¥87,015 $473,757
These securities do not carry quoted market prices. Since it is extremely difficult to estimate the fair value of these securities, their fair value is not disclosed.

45ANNUAL REPORT 2013 |
3. Repayment schedule of monetary claims, available-for-sale securities with maturities and bonds held to maturity.
Millions of yen Thousands of U.S. dollars
2013 2013
DescriptionWithin
one yearOver one year
within five yearsOver five years
within ten years Over ten yearsWithin
one yearOver one year
within five yearsOver five years
within ten years Over ten years
Time deposits ............................................... ¥252,845 ¥ — ¥ — ¥ — $2,689,842 $ — $ — $ —
Notes and accounts receivable.................... 243,785 — — — 2,593,466 — — —
Securities and investments in securities .... 214,380 2,141 5,000 — 2,280,645 22,784 53,191 —
Long-term loans........................................... — 2,053 4,052 299 — 21,850 43,106 3,187
Total .......................................................... ¥711,011 ¥4,195 ¥9,052 ¥299 $7.563.954 $44,635 $96,298 $3,187
Millions of yen
2012
DescriptionWithin
one yearOver one year
within five yearsOver five years
within ten years Over ten years
Time deposits ..................................................................................................................................................... ¥241,346 ¥ — ¥ — ¥ —
Notes and accounts receivable.......................................................................................................................... 264,283 — — —
Securities and investments in securities .......................................................................................................... 89,325 6,182 164 —
Long-term loans................................................................................................................................................. — 1,814 1,502 266
Total ................................................................................................................................................................ ¥594,955 ¥7,996 ¥1,666 ¥266
4. Repayment schedule of short-term borrowings, long-term debt and lease obligations.
Millions of yen
2013
DescriptionWithin one year
Over one yearwithin two years
Over two yearswithin three years
Over three yearswithin four years
Over four yearswithin five years Over five years
Short-term borrowings ....................................................................... ¥5,238 ¥ — ¥ — ¥ — ¥ — ¥—
Long-term debt ................................................................................... 268 365 396 1,537 5,360 49
Lease obligations ................................................................................ 219 202 179 72 34 3
Total ................................................................................................. ¥5,727 ¥567 ¥575 ¥1,610 ¥5,395 ¥53
Thousands of U.S. dollars
2013
DescriptionWithin one year
Over one yearwithin two years
Over two yearswithin three years
Over three yearswithin four years
Over four yearswithin five years Over five years
Short-term borrowings ....................................................................... $55,731 $ — $ — $ — $ — $ —
Long-term debt ................................................................................... 2,857 3,892 4,214 16,356 57,025 530
Lease obligations ................................................................................ 2,339 2,150 1,905 773 369 34
Total ................................................................................................. $60,928 $6,042 $6,120 $17,130 $57,395 $564
Millions of yen
2012
DescriptionWithin one year
Over one yearwithin two years
Over two yearswithin three years
Over three yearswithin four years
Over four yearswithin five years Over five years
Short-term borrowings ....................................................................... ¥ 8,410 ¥ — ¥ — ¥ — ¥ — ¥ —
Long-term debt ................................................................................... 5,451 15 61 63 1,213 99
Lease obligations ................................................................................ 119 103 85 61 33 12
Total ................................................................................................. ¥13,981 ¥119 ¥147 ¥124 ¥1,247 ¥112

46 | Shin-Etsu Chemical Co., Ltd.
6. SECURITIES
Securities as of March 31, 2013 and 2012 consisted of the following:
(1) Market value of bonds held to maturity
Millions of yen Thousands of U.S. dollars
2013 2012 2013
DescriptionBook value
Fair value Difference
Book value
Fair value Difference
Book value
Fair value Difference
Securities with fair value that exceeds book value............................... ¥10,920 ¥10,970 ¥49 ¥ 7,043 ¥ 7,129 ¥ 85 $116,175 $116,704 $528
Securities with fair value that does not exceed book value .......................... 970 963 (6) 7,999 7,989 (10) 10,321 10,249 (71)
Total ...................................................... ¥11,890 ¥11,933 ¥42 ¥15,043 ¥15,119 ¥ 75 $126,497 $126,953 $456
(2) Available-for-sale securities with defined fair valuesMillions of yen Thousands of U.S. dollars
2013 2012 2013
DescriptionBook value
Acquisitioncost Difference
Book value
Acquisition cost Difference
Book value
Acquisition cost Difference
Securities with book value that exceeds acquisition cost ..................................... ¥ 41,121 ¥ 20,483 ¥20,638 ¥ 27,119 ¥ 19,623 ¥ 7,495 $ 437,464 $ 217,905 $219,558
Securities with book value that does not exceed acquisition cost .................. 224,454 226,955 (2,501) 92,462 97,799 (5,337) 2,387,808 2,414,424 (26,615)
Total ...................................................... ¥265,575 ¥247,438 ¥18,136 ¥119,581 ¥117,423 ¥ 2,158 $2,825,273 $2,632,329 $192,943
Note: Non-listed equity securities and other investment securities whose fair value is extremely difficult to estimate are excluded from the above. See Note 5 (2) note 2 for details.
7. DERIVATIVE TRANSACTIONS
(1) Derivative transactions to which hedge accounting is not applied:1) Currency related:As of March 31, 2013
Millions of yen Thousands of U.S. dollars
DescriptionContractamounts
Fairvalue
Unrealizedgain (loss)
Contractamounts
Fairvalue
Unrealizedgain (loss)
Forward foreign exchange contracts Sales Contracts: US$ ................................................................. ¥41,135 ¥(1,447) ¥(1,447) $437,609 $(15,395) $(15,395) EUR ................................................................. 2,946 (289) (289) 31,350 (3,077) (3,077) Other ............................................................... 1,298 99 99 13,812 1,060 1,060 Purchase Contracts: US$ ................................................................. 346 (3) (3) 3,691 (42) (42) EUR ................................................................. 10 0 0 109 9 9 Other ............................................................... 4,311 (344) (344) 45,868 (3,662) (3,662)Foreign currency swap contracts Receive Japanese Yen, pay British Pounds ... 3,099 610 610 32,970 6,492 6,492 Total ............................................................... ¥53,148 ¥(1,373) ¥(1,373) $565,412 $(14,615) $(14,615)

47ANNUAL REPORT 2013 |
As of March 31, 2012Millions of yen
DescriptionContractamounts
Fairvalue
Unrealizedgain (loss)
Forward foreign exchange contracts Sales Contracts: US$ ........................................................................................................................................... ¥39,180 ¥ 93 ¥ 93 EUR ........................................................................................................................................... 2,805 (101) (101) Other ......................................................................................................................................... 1,501 23 23 Purchase Contracts: US$ ........................................................................................................................................... 184 1 1 EUR ........................................................................................................................................... 0 0 0 Other ......................................................................................................................................... 1,417 (7) (7)Foreign currency swap contracts Receive Japanese Yen, pay British Pounds ............................................................................. 4,161 1,117 1,117 Total ......................................................................................................................................... ¥49,251 ¥1,127 ¥1,127
Note: The fair value is provided by financial institutions with which the Company made the above contracts.
2) Interest related:As of March 31, 2013
Millions of yen Thousands of U.S. dollars
DescriptionContractamounts
Fairvalue
Unrealizedgain (loss)
Contractamounts
Fairvalue
Unrealizedgain (loss)
Interest rate swap contracts Receive floating, pay fixed .............................. ¥195 ¥(2) ¥(2) $2,074 $(31) $(31) Total ............................................................... ¥195 ¥(2) ¥(2) $2,074 $(31) $(31)
As of March 31, 2012Millions of yen
DescriptionContractamounts
Fairvalue
Unrealizedgain (loss)
Interest rate swap contracts Receive floating, pay fixed ........................................................................................................ ¥199 ¥(2) ¥(2) Total ......................................................................................................................................... ¥199 ¥(2) ¥(2)
Note: The fair value is provided by financial institutions with which the Company made the above contracts.
(2) Derivative transactions to which hedge accounting is applied:1) Currency related:As of March 31, 2013
Millions of yen Thousands of U.S. dollars
Hedge accountingmethod
Nature oftransaction Hedged items
Contractamounts
Contract amountsover one year
Fairvalue
Contractamounts
Contract amountsover one year
Fairvalue
Deferral hedge Forward foreignaccounting exchange contracts:
Purchase contracts EUR Accounts payable-trade ¥2,715 ¥— ¥416 $28,890 $— $4,435
Total ......................................................................................................... ¥2,715 ¥— ¥416 $28,890 $— $4,435

48 | Shin-Etsu Chemical Co., Ltd.
As of March 31, 2012Millions of yen
Hedge accountingmethod
Nature oftransaction Hedged items
Contractamounts
Contract amountsover one year
Fairvalue
Deferral hedge accounting Forward foreign exchange contracts:Sales contracts US$ Accounts receivable-trade ¥1,612 ¥ — ¥ (78) EUR Accounts receivable-trade 13 — (0)Purchase contracts EUR Accounts payable-trade 5,650 2,715 115 US$ Accounts payable-trade 93 — 5
Deferral hedge accounting Foreign currency swap contracts: Receive US$ pay Thai Baht Long-term debt ¥ 802 ¥ — ¥(142)
Total .................................................................................................................................................................................... ¥8,171 ¥2,715 ¥(100)
Note: The fair value is provided by financial institutions with which the Company made the above contracts.
2) Interest related:As of March 31, 2013
Millions of yen Thousands of U.S. dollars
Hedge accountingmethod
Nature oftransaction Hedged items
Contractamounts
Contract amountsover one year
Fairvalue
Contractamounts
Contract amountsover one year
Fairvalue
Special hedge accountingtreatment ofinterest rate swaps underJGAAP
Interest rateswap contracts:Receive floating, pay fixed
Interest of investments in securities
¥5,000 ¥— ¥(39) $53,191 $— $(416)
Total ......................................................................................................... ¥5,000 ¥— ¥(39) $53,191 $— $(416)
As of March 31, 2012Millions of yen
Hedge accountingmethod
Nature oftransaction Hedged items
Contractamounts
Contract amountsover one year
Fairvalue
Special hedge accounting treatment of interest rate swaps under JGAAP
Interest rate swap contracts:Receive floating, pay fixed
Interest of investments in securities ¥ 5,000 ¥5,000 ¥(110)
Special hedge accounting treatment of interest rate swaps under JGAAP
Interest rate swap contracts:Receive fixed, pay floating
Interest of investments in securities ¥ 5,000 ¥ — ¥ 25
Total .................................................................................................................................................................................... ¥10,000 ¥5,000 ¥ (85)
Note: The fair value is provided by financial institutions with which the Company made the above contracts.
8. INVESTMENTS IN UNCONSOLIDATED SUBSIDIARIES AND AFFILIATES
Investments in unconsolidated subsidiaries and affiliates as of March 31, 2013 and 2012 consisted of the following:
Millions of yenThousands ofU.S. dollars
2013 2012 2013
Investments in securities (Stocks) .................................................................................. ¥55,927 ¥83,128 $594,968Other (Investments in capital) ......................................................................................... 5,211 3,873 55,442
9. ACCUMULATED DEPRECIATION
Accumulated depreciation of property, plant and equipment as of March 31, 2013 and 2012 are ¥1,550,390 million ($16,493,516 thousand) and ¥1,393,976 million, respectively.

49ANNUAL REPORT 2013 |
10. SHORT-TERM BORROWINGS, LONG-TERM DEBT AND LEASE OBLIGATIONS
Short-term borrowings, long-term debt and lease obligations as of March 31, 2013 and 2012 consisted of the following:
Average interest rate Due date
Millions of yenThousands ofU.S. dollars
2013 2012 2013
Short-term borrowings ................................................... 0.8% — ¥ 5,238 ¥ 8,410 $ 55,731Current portion of long-term debt ................................. 0.9% — 268 5,451 2,857Current portion of lease obligations ............................... — — 219 119 2,339
Long-term debt, excluding current portion ................... 0.8% February 2014 –February 2022
7,709 1,454 82,018
Lease obligations, excluding current portion ................ — January 2014 –January 2019
492 296 5,234
Total ................................................................................. — — ¥13,929 ¥15,732 $148,181
Notes: 1. Average interest rate is the weighted average rate based on the balance as of March 31, 2013. 2. Average interest rate of lease obligations is not shown as the balance includes the interest portion. 3. Repayment schedule 5 years subsequent to March 31, 2013 for long-term debt and lease obligations, excluding the current portion, is as follows:
Millions of yen Thousands of U.S. dollars
Long-term debt Lease obligations Long-term debt Lease obligations
Years ending March 31,2015 ................................................................................. ¥ 365 ¥202 $ 3,892 $2,1502016 ................................................................................ 396 179 4,214 1,9052017 ................................................................................ 1,537 72 16,356 7732018 ................................................................................ 5,360 34 57,025 369
11. RETIREMENT AND PENSION PLANS
The Company and its domestic consolidated subsidiaries have defined contribution pension plans (DC pension plans), defined benefit pension plans (transition from tax-qualified pension plans) and lump-sum severance payment plans as their defined benefit pension plans. Certain overseas consolidated subsidiaries have defined benefit pension plans while others have defined contribution pension plans. Additionally, the Company has a “Retirement Benefit Trust.”
The reserves for retirement benefits as of March 31, 2013 and 2012 are analyzed as follows:
Benefit Obligations
Millions of yenThousands ofU.S. dollars
2013 2012 2013
(a) Benefit obligations ..................................................................................................... ¥(40,595) ¥(33,191) $(431,871)(b) Pension assets ........................................................................................................... 17,670 14,291 187,983(c) Unfunded benefit obligations [(a)+(b)] ....................................................................... (22,925) (18,899) (243,887)(d) Unrecognized actuarial differences .......................................................................... 4,430 3,822 47,137(e) Unrecognized prior service cost (negative) (Note 1) ................................................. (37) 14 (403)(f) Net retirement benefit obligations [(c)+(d)+(e)] ......................................................... (18,532) (15,063) (197,153)(g) Prepaid pension expenses ......................................................................................... 1,652 1,624 17,580(h) Accrued retirement benefits [(f)-(g)] ......................................................................... ¥(20,185) ¥(16,687) $(214,734)
Notes: 1. The Company and certain consolidated subsidiaries changed system from tax-qualified pension plans to defined contribution pension plans before prior fiscal year, so that prior service cost is generated.
2. Some subsidiaries adopt a simplified method for the calculation of benefit obligations.
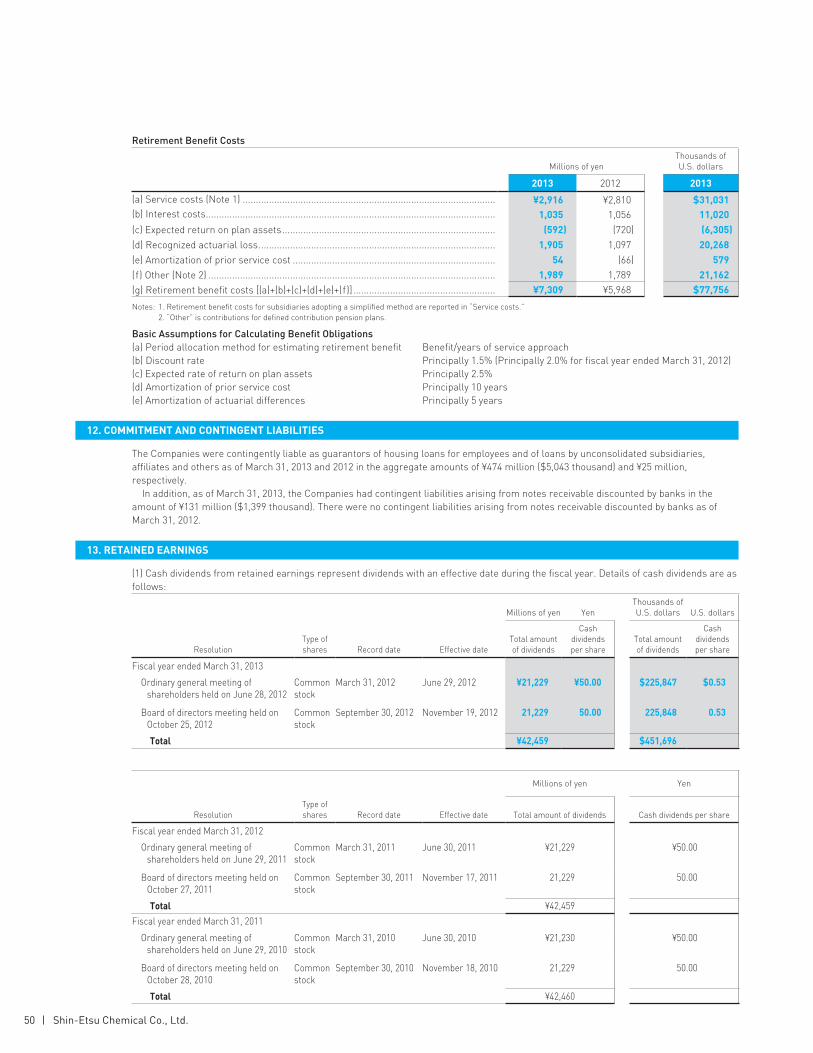
50 | Shin-Etsu Chemical Co., Ltd.
Retirement Benefit Costs
Millions of yenThousands ofU.S. dollars
2013 2012 2013
(a) Service costs (Note 1) ................................................................................................ ¥2,916 ¥2,810 $31,031(b) Interest costs .............................................................................................................. 1,035 1,056 11,020(c) Expected return on plan assets ................................................................................. (592) (720) (6,305)(d) Recognized actuarial loss .......................................................................................... 1,905 1,097 20,268(e) Amortization of prior service cost ............................................................................. 54 (66) 579(f) Other (Note 2) ............................................................................................................. 1,989 1,789 21,162(g) Retirement benefit costs [(a)+(b)+(c)+(d)+(e)+(f)] ...................................................... ¥7,309 ¥5,968 $77,756
Notes: 1. Retirement benefit costs for subsidiaries adopting a simplified method are reported in “Service costs.” 2. “Other” is contributions for defined contribution pension plans.
Basic Assumptions for Calculating Benefit Obligations(a) Period allocation method for estimating retirement benefit Benefit/years of service approach(b) Discount rate Principally 1.5% (Principally 2.0% for fiscal year ended March 31, 2012)(c) Expected rate of return on plan assets Principally 2.5%(d) Amortization of prior service cost Principally 10 years(e) Amortization of actuarial differences Principally 5 years
12. COMMITMENT AND CONTINGENT LIABILITIES
The Companies were contingently liable as guarantors of housing loans for employees and of loans by unconsolidated subsidiaries, affiliates and others as of March 31, 2013 and 2012 in the aggregate amounts of ¥474 million ($5,043 thousand) and ¥25 million, respectively. In addition, as of March 31, 2013, the Companies had contingent liabilities arising from notes receivable discounted by banks in the amount of ¥131 million ($1,399 thousand). There were no contingent liabilities arising from notes receivable discounted by banks as of March 31, 2012.
13. RETAINED EARNINGS
(1) Cash dividends from retained earnings represent dividends with an effective date during the fiscal year. Details of cash dividends are as follows:
Millions of yen YenThousands of U.S. dollars U.S. dollars
ResolutionType of shares Record date Effective date
Total amountof dividends
Cash dividendsper share
Total amountof dividends
Cash dividendsper share
Fiscal year ended March 31, 2013
Ordinary general meeting of shareholders held on June 28, 2012
Common stock
March 31, 2012 June 29, 2012 ¥21,229 ¥50.00 $225,847 $0.53
Board of directors meeting held on October 25, 2012
Common stock
September 30, 2012 November 19, 2012 21,229 50.00 225,848 0.53
Total ¥42,459 $451,696
Millions of yen Yen
ResolutionType of shares Record date Effective date Total amount of dividends Cash dividends per share
Fiscal year ended March 31, 2012
Ordinary general meeting of shareholders held on June 29, 2011
Common stock
March 31, 2011 June 30, 2011 ¥21,229 ¥50.00
Board of directors meeting held on October 27, 2011
Common stock
September 30, 2011 November 17, 2011 21,229 50.00
Total ¥42,459
Fiscal year ended March 31, 2011
Ordinary general meeting of shareholders held on June 29, 2010
Common stock
March 31, 2010 June 30, 2010 ¥21,230 ¥50.00
Board of directors meeting held on October 28, 2010
Common stock
September 30, 2010 November 18, 2010 21,229 50.00
Total ¥42,460
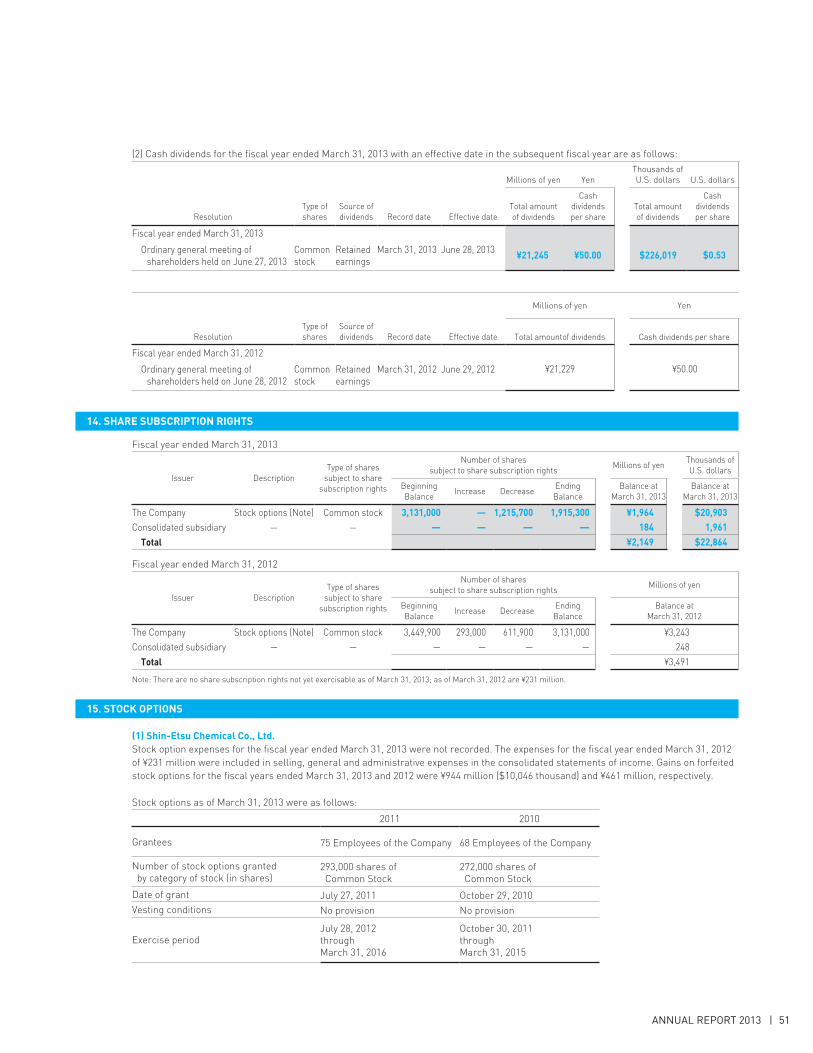
51ANNUAL REPORT 2013 |
(2) Cash dividends for the fiscal year ended March 31, 2013 with an effective date in the subsequent fiscal year are as follows:
Millions of yen YenThousands of U.S. dollars U.S. dollars
ResolutionType of shares
Source ofdividends Record date Effective date
Total amountof dividends
Cash dividendsper share
Total amountof dividends
Cash dividendsper share
Fiscal year ended March 31, 2013
Ordinary general meeting of shareholders held on June 27, 2013
Common stock
Retainedearnings
March 31, 2013 June 28, 2013 ¥21,245 ¥50.00 $226,019 $0.53
Millions of yen Yen
ResolutionType of shares
Source ofdividends Record date Effective date Total amountof dividends Cash dividends per share
Fiscal year ended March 31, 2012
Ordinary general meeting of shareholders held on June 28, 2012
Common stock
Retainedearnings
March 31, 2012 June 29, 2012 ¥21,229 ¥50.00
14. SHARE SUBSCRIPTION RIGHTS
Fiscal year ended March 31, 2013
Issuer DescriptionType of shares
subject to share subscription rights
Number of shares subject to share subscription rights
Millions of yenThousands of U.S. dollars
Beginning Balance
Increase DecreaseEnding
BalanceBalance at
March 31, 2013Balance at
March 31, 2013
The Company Stock options (Note) Common stock 3,131,000 — 1,215,700 1,915,300 ¥1,964 $20,903Consolidated subsidiary — — — — — — 184 1,961 Total ¥2,149 $22,864
Fiscal year ended March 31, 2012
Issuer DescriptionType of shares
subject to share subscription rights
Number of shares subject to share subscription rights
Millions of yen
Beginning Balance
Increase DecreaseEnding
BalanceBalance at
March 31, 2012
The Company Stock options (Note) Common stock 3,449,900 293,000 611,900 3,131,000 ¥3,243Consolidated subsidiary — — — — — — 248 Total ¥3,491
Note: There are no share subscription rights not yet exercisable as of March 31, 2013; as of March 31, 2012 are ¥231 million.
15. STOCK OPTIONS
(1) Shin-Etsu Chemical Co., Ltd.Stock option expenses for the fiscal year ended March 31, 2013 were not recorded. The expenses for the fiscal year ended March 31, 2012 of ¥231 million were included in selling, general and administrative expenses in the consolidated statements of income. Gains on forfeited stock options for the fiscal years ended March 31, 2013 and 2012 were ¥944 million ($10,046 thousand) and ¥461 million, respectively.
Stock options as of March 31, 2013 were as follows:
2011 2010
Grantees 75 Employees of the Company 68 Employees of the Company
Number of stock options granted by category of stock (in shares)
293,000 shares of Common Stock
272,000 shares of Common Stock
Date of grant July 27, 2011 October 29, 2010Vesting conditions No provision No provision
Exercise periodJuly 28, 2012 through March 31, 2016
October 30, 2011 through March 31, 2015

52 | Shin-Etsu Chemical Co., Ltd.
2009 2008
Grantees 18 Directors of the Company 64 Employees of the Company
16 Directors of the Company 61 Employees of the Company
Number of stock options granted by category of stock (in shares)
937,000 shares of Common Stock
826,000 shares of Common Stock
Date of grant August 6, 2009 July 14, 2008Vesting conditions No provision No provision
Exercise periodAugust 7, 2010 through March 31, 2014
July 15, 2009 through March 31, 2013
Movement in stock options was as follows:
Number of shares
2011 2010 2009 2008 2007
Beginning balance .................................................................................................. 293,000 272,000 937,000 792,000 837,000 Granted ............................................................................................................... — — — — — Exercised............................................................................................................. 36,000 122,500 166,200 — — Forfeited .............................................................................................................. — — 30,000 24,000 837,000Unexercised balance .............................................................................................. 257,000 149,500 740,800 768,000 —
Yen
Exercise price ......................................................................................................... ¥4,423 ¥4,352 ¥4,804 ¥6,755 ¥—Weighted average market value per share at the exercise date.......................... 5,681.94 5,564.57 5,760.26 — —Fair value per share at the grant date................................................................... 789 823 1,235 943 —
U.S. dollars
Exercise price ......................................................................................................... $47.05 $46.30 $51.11 $71.86 $—Weighted average market value per share at the exercise date.......................... 60.446 59.198 61.279 — —Fair value per share at the grant date................................................................... 8.39 8.76 13.14 10.03 —
(2) Shin-Etsu Polymer Co., Ltd.Stock option expenses for the fiscal years ended March 31, 2013 and 2012 of ¥16 million ($171 thousand) and ¥20 million, respectively, were included in selling, general and administrative expenses in the consolidated statements of income. Gains on forfeited stock options for the fiscal years ended March 31, 2013 and 2012 were ¥79 million ($850 thousand) and ¥120 million, respectively.
Stock options as of March 31, 2013 were as follows:
2012 2011 2010
Grantees10 Directors 15 Employees 11 Directors of its subsidiaries
9 Directors 13 Employees 8 Directors of its subsidiaries
9 Directors14 Employees10 Directors of its subsidiaries
Number of stock options granted by category of stock (in shares)
475,000 shares of Common Stock
440,000 shares of Common Stock
455,000 shares of Common Stock
Date of grant September 5, 2012 October 5, 2011 September 2, 2010Vesting conditions No provision No provision No provision
Exercise periodDecember 1, 2012throughNovember 30, 2017
December 1, 2011throughNovember 30, 2016
December 1, 2010throughNovember 30, 2015

53ANNUAL REPORT 2013 |
2009 2008 2007
Grantees9 Directors12 Employees13 Directors of its subsidiaries
10 Directors 12 Employees14 Directors of its subsidiaries
10 Directors 12 Employees13 Directors of its subsidiaries
Number of stock options granted by category of stock (in shares)
445,000 shares of Common Stock
470,000 shares of Common Stock
465,000 shares of Common Stock
Date of grant September 2, 2009 August 7, 2008 August 8, 2007Vesting conditions No provision No provision No provision
Exercise periodDecember 1, 2009throughNovember 30, 2014
December 1, 2008throughNovember 30, 2013
December 1, 2007throughNovember 30, 2012
Movement in stock options was as follows:
Number of shares
2012 2011 2010 2009 2008 2007
Beginning balance ............................................................................ — 440,000 455,000 445,000 440,000 425,000 Granted ......................................................................................... 475,000 — — — — — Exercised....................................................................................... — — — — — — Forfeited ........................................................................................ — — — — — 425,000Unexercised balance ........................................................................ 475,000 440,000 455,000 445,000 440,000 —
Yen
Exercise price ................................................................................... ¥342 ¥414 ¥505 ¥653 ¥632 ¥1,643
Weighted average market value per share at the exercise date ........................................................................ — — — — — —
Fair value per share at the grant date............................................. 34 47 80 139 112 188U.S. dollars
Exercise price ................................................................................... $3.64 $4.40 $5.37 $6.95 $6.72 $17.48
Weighted average market value per share at the exercise date ........................................................................ — — — — — —
Fair value per share at the grant date............................................. 0.36 0.50 0.85 1.48 1.19 2.00
The fair value of options granted was estimated using the Black-Scholes option pricing model with the following assumptions:
Stock options granted on September 5, 2012Expected volatility ............................................................................................................................................................ 29.421%Expected remaining life .................................................................................................................................................. 2.74 yearsExpected dividend ............................................................................................................................................................ 9 yenRisk-free interest rate .................................................................................................................................................... 0.095%
16. SELLING, GENERAL AND ADMINISTRATIVE EXPENSES
Selling, general and administrative expenses for the fiscal years ended March 31, 2013, 2012 and 2011 mainly consisted of the following:
Millions of yenThousands ofU.S. dollars
2013 2012 2011 2013
Shipment expenses ............................................................................... ¥24,983 ¥24,797 ¥27,019 $265,780Salaries and allowances ........................................................................ 18,843 18,488 18,407 200,460Provision for bonuses for employees .................................................... 1,235 1,228 1,344 13,142Provision for bonuses for directors ....................................................... 373 360 400 3,968Provision for retirement benefits .......................................................... 582 565 586 6,194Provision for retirement bonuses for directors .................................... 52 48 63 559Depreciation and amortization .............................................................. 1,523 1,485 1,546 16,210Technical research expenses ................................................................ 11,740 11,497 13,223 124,893 <Including provision for retirement benefits> .................................. <115> <118> <196> <1,228>Provision of allowance for doubtful accounts ....................................... 150 21 311 1,602

54 | Shin-Etsu Chemical Co., Ltd.
17. RESEARCH AND DEVELOPMENT COSTS
Research and development costs incurred and charged to income for the years ended March 31, 2013, 2012 and 2011 were ¥37,671 million ($400,765 thousand), ¥35,725 million and ¥37,321 million, respectively.
18. LEASE TRANSACTIONS
Lease expenses on finance lease contracts without ownership-transfer charged to income for the years ended March 31, 2013 and 2012 amounted to ¥21 million ($225 thousand) and ¥95 million, respectively. Lease expenses corresponding to depreciation expenses, not charged to income, for the years ended March 31, 2013 and 2012 which were computed by the straight-line method over a period up to the maturity of the relevant lease contracts with no residual value, amounted to ¥21 million ($225 thousand) and ¥95 million, respectively. Pro forma information regarding leased property such as acquisition cost and accumulated depreciation is as follows:
Millions of yenThousands ofU.S. dollars
2013 2012 2013
Acquisition cost ............................................................................................................... ¥76 ¥588 $812Accumulated depreciation .............................................................................................. 66 557 708Net book value ................................................................................................................ ¥ 9 ¥ 31 $103
The portion of interest thereon, is summarized as follows:
Millions of yenThousands ofU.S. dollars
2013 2012 2013
Future Lease Payments:
Within one year ................................................................................................................ ¥6 ¥21 $ 70Over one year ................................................................................................................... 3 9 32
¥9 ¥31 $103
The amounts of outstanding future lease payments due in respect of operating lease contracts at March 31, 2013 and 2012 are summarized as follows:
Millions of yenThousands ofU.S. dollars
2013 2012 2013
Future Lease Payments:
Within one year ................................................................................................................ ¥1,599 ¥1,858 $17,016Over one year ................................................................................................................... 2,130 2,430 22,666
¥3,730 ¥4,289 $39,682
19. REVERSAL OF RESTORATION COSTS FOR EARTHQUAKE
Reversal of restoration costs for the earthquake for the fiscal year ended March 31, 2012 relates to a gain on reversal of expenses estimated for restoration work on assets damaged due to the Great East Japan Earthquake in the fiscal year ended March 31, 2011.
20. LOSS ON IMPAIRMENT OF FIXED ASSETS
During the fiscal year ended March 31, 2012, the Company and its consolidated subsidiaries recognized impairment losses for the following asset category, recording a total of ¥6,191 million as Extraordinary losses. The fixed assets are grouped according to managerial accounting categories, which are regarded as the smallest units independently generating cash flows. However, idle assets not directly used to manufacture goods are accounted for individually.
Consolidated Subsidiary (Shin-Etsu Handotai Co., Ltd.)
Millions of yen
Location Use Asset category 2012
Shirakawa Plant (Nishishirakawa-gun, Fukushima Prefecture) Idle assets Construction in progress ¥6,191
The Company and its consolidated subsidiaries do not have any specific business plan for using the idle assets above because of the change in climate of the semiconductor silicon business. As a result, the book value of the asset has been marked down to its recoverable amount, which is calculated as the net sale amount.

55ANNUAL REPORT 2013 |
21. LOSS ON DISASTER
Loss on disaster for the fiscal year ended March 31, 2012 relates to losses from the stoppage of operations and other costs incurred during the first half of the fiscal year due to the Great East Japan Earthquake. Loss on disaster for the fiscal year ended March 31, 2011 relates to losses due to the Great East Japan Earthquake, consisting largely of expenses for restoration work in the amount of ¥16,654 million after deducting the estimated amount of insurance compensation.
22. INCOME TAXES
The Company and its domestic subsidiaries are subject to a number of Japanese income taxes, which, in the aggregate, resulted in astatutory tax rate of approximately 37.8% for the year ended March 31, 2013, 40.4% for the year ended March 31, 2012. Tax effects of material temporary differences and loss carry forwards which resulted in deferred tax assets or liabilities at March 31,2013 and 2012 were as follows:
Millions of yenThousands ofU.S. dollars
2013 2012 2013
Deferred Tax Assets: Depreciation ................................................................................................................. ¥ 13,090 ¥14,861 $ 139,260 Accrued retirement benefits ....................................................................................... 5,030 4,293 53,511 Accrued bonus allowance ........................................................................................... 3,531 3,397 37,567 Unrealized profit .......................................................................................................... 3,488 3,192 37,113 Maintenance cost ........................................................................................................ 3,287 3,681 34,975 Unsettled accounts receivable and payable ............................................................... 3,018 5,057 32,109 Allowance for doubtful accounts ................................................................................ 1,927 1,639 20,508 Tax loss carry forwards ............................................................................................... 1,199 1,562 12,762 Accrued enterprise taxes ............................................................................................ 687 2,492 7,319 Unrealized gains/losses on available-for-sale securities ......................................... 58 51 627 Other ............................................................................................................................ 16,629 19,434 176,904 Valuation allowance..................................................................................................... (3,777) (3,188) (40,184) Total ............................................................................................................................. ¥ 48,172 ¥56,474 $ 512,474Deferred Tax Liabilities: Depreciation ................................................................................................................. ¥ 60,329 ¥42,532 $ 641,799 Unrealized gains/losses on available-for-sale securities ......................................... 6,488 770 69,027 Reserve for special depreciation ................................................................................ 153 204 1,634 Other ............................................................................................................................ 4,924 3,658 52,391 Total ............................................................................................................................. ¥ 71,896 ¥47,165 $ 764,852Net deferred tax assets ................................................................................................. ¥(23,723) ¥ 9,309 $(252,378)
Net Deferred Tax Assets are included in the following accounts:
Millions of yenThousands ofU.S. dollars
2013 2012 2013
Current assets: Deferred taxes, current ........................................................................ ¥ 27,462 ¥ 34,599 $292,152Non-current assets: Deferred taxes, non-current ........................................................ 14,590 19,937 155,220Current liabilities: Other ................................................................................................. (742) (931) (7,903)Non-current liabilities: Deferred taxes, non-current .................................................... (65,033) (44,295) (691,847)

56 | Shin-Etsu Chemical Co., Ltd.
Reconciliation of the difference between the statutory tax rate and effective rate on taxable income is as follows:
2013 2012
Statutory tax rate ................................................................................................................................................. 37.8% 40.4% Rate difference from foreign subsidiaries ......................................................................................................... (2.3) (2.9)Equity in earnings of affiliates ............................................................................................................................ (1.5) (4.1)Dividend income and other not taxable .............................................................................................................. (1.4) (2.7)Elimination of intercompany dividend income ................................................................................................... 1.3 2.7 Tax deduction for research expenses ................................................................................................................ (1.0) (1.5)Entertainment and other non-deductible expenses .......................................................................................... 0.2 0.3 Adjustment on deferred tax assets due to change in income tax rate ............................................................. — 2.1 Other, net ............................................................................................................................................................. 1.5 0.7 Effective tax rate ................................................................................................................................................ 34.6 35.0
xes - Prior years consist of the refunded amount of corporation taxes paid in past fiscal years, after the Japanese and U.S. tax
23. OTHER COMPREHENSIVE INCOME
Reclassification adjustments and tax effects of each component of other comprehensive income for the fiscal years ended March 31, 2013 and 2012 are as follows:
Millions of yenThousands ofU.S. dollars
2013 2012 2013Unrealized gains (losses) on available-for-sale securities Amount arising during the year .................................................................................. ¥15,512 ¥ (4,837) $165,025 Reclassification adjustment for gains and losses included in net income ............... 459 678 4,887 Unrealized gains (losses) on available-for-sale securities before tax ...................... 15,971 (4,159) 169,913 Tax effect ...................................................................................................................... (5,657) 1,748 (60,188) Unrealized gains (losses) on available-for-sale securities ....................................... 10,314 (2,410) 109,724
Deferred gains (losses) on hedges Amount arising during the year .................................................................................. 324 (179) 3,452 Reclassification adjustment for gains and losses included in net income ............... 55 (172) 594 Deferred gains (losses) on hedges before tax ............................................................ 380 (351) 4,046 Tax effect ...................................................................................................................... (141) 139 (1,504) Deferred gains (losses) on hedges ............................................................................. 238 (211) 2,541
Foreign currency translation adjustments Amount arising during the year .................................................................................. 66,415 (28,452) 706,547
Share of other comprehensive income of associates accounted for by using the equity method
Amount arising during the year .................................................................................. 5,070 (2,501) 53,941 Reclassification adjustment for gains and losses included in net income ............... 1,428 (486) 15,199
Share of other comprehensive income of associates accounted for by using the equity method ............................................................................................ 6,499 (2,988) 69,140
Total other comprehensive income ................................................................................ ¥83,467 ¥(34,063) $887,954

57ANNUAL REPORT 2013 |
24. SUPPLEMENTAL CASH FLOW INFORMATION
Cash and cash equivalents on the consolidated statements of cash flows consist of cash in hand, deposits that can be withdrawn without limitation and liquid investments which are easily convertible into cash, and that mature within approximately three months from the acquisition date and have insignificant risk exposure in terms of fluctuation on value of the investments. Reconciliations between cash and cash equivalents and the related accounts shown in the consolidated balance sheets as of March 31,2013, 2012 and 2011 are presented below:
Millions of yenThousands ofU.S. dollars
2013 2012 2011 2013
Cash and time deposits .......................................................................... ¥252,881 ¥241,390 ¥244,002 $2,690,227Securities ................................................................................................ 214,380 89,301 116,714 2,280,645Time deposits for which maturities are approximately over three months .............................................................................. (47,438) (43,131) (46,881) (504,669)
Securities (maturities approximately over three months) .............................................................................
(56,794) (17,238) (11,550) (604,194)
Cash and cash equivalents .................................................................... ¥363,028 ¥270,321 ¥302,285 $3,862,009
25. SEGMENT AND RELATED INFORMATION
1. Segment information(1) Overview of reportable segmentThe reportable segments in the Shin-Etsu Group are defined as individual units, where independent financial information is available and which are subject to regular review to evaluate their results and decide the allocation of management resources by the highest decision making body of the Company, such as the Managing Directors’ Meeting. The Shin-Etsu Group conducts business through each business division and affiliated companies according to each kind of product and service, consisting of the following six segments: “PVC/Chlor-Alkali Business,” “Silicones Business,” “Specialty Chemicals Business,” “Semiconductor Silicon Business,” “Electronics & Functional Materials Business” and “Diversified Business.” Consequently, these six businesses are specified as reportable segments.
Main products and services of each segment are as follows:
Segment Main products and servicesPVC/Chlor-Alkali Business Polyvinyl chloride, Caustic soda, Methanol, ChloromethaneSilicones Business SiliconesSpecialty Chemicals Business Cellulose derivatives, Silicon metal, Polyvinyl alcohol, Synthetic pheromonesSemiconductor Silicon Business Semiconductor silicon
Electronics & Functional Materials Business
Rare-earth magnets for electronics industry and general applications, Semiconductor encapsulating materials, Packaging materials for LEDs, Photoresists, Photomask blanks, Synthetic quartz products, Liquid fluoroelastomers, Pellicles
Diversified Business Processed plastics, Export of plant equipment, Technology licensing, International trading, Engineering
(2) Measurement of income, assets and liabilities of reportable segmentsIncome for each reportable segment denotes operating income, and the accounting methods applied are identical with those stated in “Basis of presenting consolidated financial statements.” Internal revenues and transfers arising from transactions among the segments are based on market prices in general. The Shin-Etsu Group does not allocate assets and liabilities to business segments.

58 | Shin-Etsu Chemical Co., Ltd.
(3) Information regarding income (loss) and others of reportable segmentsMillions of yen
2013
PVC/Chlor-Alkali
SiliconesSpecialty
ChemicalsSemiconductor
Silicon
Electronics &FunctionalMaterials
Diversified Total Adjustment(1)
Figures in consolidated
financial statements
Sales to outside customers ......... ¥343,697 ¥129,029 ¥83,526 ¥202,466 ¥182,781 ¥ 83,907 ¥1,025,409 ¥ — ¥1,025,409
Intersegment sales ........... 3,385 4,608 8,122 3 3,234 60,900 80,254 (80,254) — Total ............................... ¥347,082 ¥133,638 ¥91,649 ¥202,470 ¥186,015 ¥144,808 ¥1,105,663 ¥(80,254) ¥1,025,409
Segment income (Operating income) ........ ¥ 45,552 ¥ 28,643 ¥14,467 ¥ 21,937 ¥ 40,863 ¥ 5,601 ¥ 157,065 ¥ (22) ¥ 157,043
Depreciation and amortization ............ ¥ 20,416 ¥ 8,245 ¥ 8,105 ¥ 26,193 ¥ 13,754 ¥ 3,708 ¥ 80,424 ¥ (284) ¥ 80,139
Amortization of goodwill ... ¥ — ¥ — ¥ 815 ¥ — ¥ — ¥ 6 ¥ 822 ¥ 0 ¥ 822
Increase in property, plant and equipment and intangible fixed assets(2) ¥ 18,478 ¥ 15,374 ¥12,193 ¥ 14,828 ¥ 18,209 ¥ 4,161 ¥ 83,245 ¥ (226) ¥ 83,018
Millions of yen
2012
PVC/Chlor-Alkali
SiliconesSpecialty
ChemicalsSemiconductor
Silicon
Electronics &
FunctionalMaterials
Diversified Total Adjustment(1)
Figures in consolidated
financial statements
Sales to outside customers ......... ¥324,030 ¥135,461 ¥87,127 ¥229,656 ¥177,792 ¥ 93,663 ¥1,047,731 ¥ — ¥1,047,731
Intersegment sales ........... 3,824 4,483 7,846 1 2,954 68,471 87,581 (87,581) —
Total ............................... ¥327,854 ¥139,944 ¥94,974 ¥229,657 ¥180,746 ¥162,134 ¥1,135,312 ¥(87,581) ¥1,047,731
Segment income (Operating income) ........ ¥ 23,651 ¥ 33,687 ¥14,698 ¥ 34,333 ¥ 38,171 ¥ 5,032 ¥ 149,575 ¥ 57 ¥ 149,632
Depreciation and amortization ............ ¥ 17,145 ¥ 7,994 ¥ 7,912 ¥ 31,014 ¥ 14,286 ¥ 3,897 ¥ 82,251 ¥ (265) ¥ 81,985
Amortization of goodwill ... ¥ — ¥ — ¥ 882 ¥ — ¥ — ¥ 0 ¥ 882 ¥ 0 ¥ 882
Increase in property, plant and equipment and intangible fixed assets ... ¥ 18,333 ¥ 14,421 ¥13,002 ¥ 23,639 ¥ 14,579 ¥ 3,356 ¥ 87,333 ¥ (168) ¥ 87,165
Millions of yen
2011
PVC/Chlor-Alkali
SiliconesSpecialty
ChemicalsSemiconductor
Silicon
Electronics &
FunctionalMaterials
Diversified Total Adjustment(1)
Figures in consolidated
financial statements
Sales to outside customers ......... ¥283,525 ¥143,064 ¥83,512 ¥283,789 ¥141,383 ¥122,981 ¥1,058,257 ¥ — ¥1,058,257
Intersegment sales ........... 26,827 4,056 6,649 5 3,464 65,380 106,384 (106,384) —
Total ............................... ¥310,352 ¥147,121 ¥90,162 ¥283,795 ¥144,848 ¥188,362 ¥1,164,641 ¥(106,384) ¥1,058,257
Segment income (Operating income) ........ ¥ 19,674 ¥ 34,057 ¥12,914 ¥ 38,864 ¥ 36,118 ¥ 7,340 ¥ 148,970 ¥ 251 ¥ 149,221
Depreciation and amortization ............ ¥ 12,806 ¥ 7,992 ¥ 7,253 ¥ 45,963 ¥ 14,705 ¥ 4,366 ¥ 93,088 ¥ (280) ¥ 92,807
Amortization of goodwill ... ¥ — ¥ — ¥ 924 ¥ — ¥ — ¥ 0 ¥ 925 ¥ — ¥ 925
Increase in property, plant and equipment and intangible fixed assets(3) ¥ 55,730 ¥ 6,641 ¥14,661 ¥ 24,406 ¥ 9,501 ¥ 3,320 ¥ 114,261 ¥ (370) ¥ 113,890

59ANNUAL REPORT 2013 |
Thousands of U.S. dollars
2013
PVC/Chlor-Alkali
SiliconesSpecialty
ChemicalsSemiconductor
Silicon
Electronics &
FunctionalMaterials
Diversified Total Adjustment(1)
Figures in consolidated
financial statements
Sales to outside customers ......... $3,656,357 $1,372,655 $888,580 $2,153,902 $1,944,479 $ 892,635 $10,908,610 $ — $10,908,610
Intersegment sales ........... 36,012 49,025 86,412 36 34,405 647,876 853,768 (853,768) — Total ............................... $3,692,369 $1,421,680 $974,993 $2,153,939 $1,978,885 $1,540,511 $11,762,378 $(853,768) $10,908,610
Segment income (Operating income) ........ $ 484,597 $ 304,718 $153,910 $ 233,375 $ 434,721 $ 59,590 $ 1,670,913 $ (241) $ 1,670,672
Depreciation and amortization ............ $ 217,201 $ 87,719 $ 86,226 $ 278,650 $ 146,324 $ 39,455 $ 855,578 $ (3,031) $ 852,547
Amortization of goodwill ... $ — $ — $ 8,673 $ — $ — $ 72 $ 8,745 $ 1 $ 8,746
Increase in property, plant and equipment and intangible fixed assets(2) $ 196,575 $ 163,557 $129,716 $ 157,753 $ 193,713 $ 44,272 $ 885,590 $ (2,414) $ 883,175
Notes: [1] Elimination of intersegment transactions. (2] During the fiscal year ended March 31, 2013, the Company made investments of ¥3,822 million in unconsolidated subsidiaries established: Shin-Etsu (Changting)
Technology Co., Ltd., Shin-Etsu Electronics Materials Vietnam Co., Ltd. and Shin-Etsu Magnetic Materials Vietnam Co., Ltd. The expenditures related to the investments are not included in the table above. The total capital expenditures for the fiscal year ended March 31, 2013, including these investments, amounted to ¥86,841 million. (Capital expenditures for Electronics & Functional Materials Business amounted to ¥22,031 million.)
(3] During the fiscal year ended March 31, 2011, the Company made investments of ¥2,993 million and ¥3,000 million respectively in new unconsolidated subsidiar-ies established in China: Shin-Etsu Silicone (Nantong) Co., Ltd. (Silicones Business) and Shin-Etsu (Jiangsu) Optical Preform Co., Ltd. (Electronics & Functional Materials Business). The expenditures related to the investments are not included in the table above. The total capital expenditures for the fiscal year ended March 31, 2011, including these investments, amounted to ¥119,884 million. (Capital expenditures for Silicones Business and Electronics & Functional Materials Business amounted to ¥9,634 million and ¥12,501 million respectively.
2. Related information Geographic information(1) Net Sales
Millions of yenThousands of U.S. dollars
2013 2012 2011 2013
Net Sales Japan .......................................................................................................... ¥ 334,288 ¥ 366,342 ¥ 386,128 $ 3,556,264 U.S. ............................................................................................................ 190,433 159,617 153,059 2,025,883 China .......................................................................................................... 100,109 107,581 113,709 1,064,994 Asia / Oceania excluding China ................................................................. 194,891 180,523 191,743 2,073,318 Europe ........................................................................................................ 114,538 130,920 122,802 1,218,492 Other .......................................................................................................... 91,147 102,744 90,813 969,656 Total ........................................................................................................... ¥1,025,409 ¥1,047,731 ¥1,058,257 $10,908,610
(2) Property, plant and equipment
Millions of yenThousands of U.S. dollars
2013 2012 2011 2013
Property, plant and equipment Japan .......................................................................................................... ¥252,894 ¥247,440 ¥260,693 $2,690,365 U.S. ............................................................................................................ 284,774 261,857 276,339 3,029,516 Other .......................................................................................................... 111,981 89,260 83,301 1,191,297 Total ........................................................................................................... ¥649,650 ¥598,558 ¥620,334 $6,911,179

60 | Shin-Etsu Chemical Co., Ltd.
3. Loss on impairment of fixed assetsMillions of yen
2012
PVC/Chlor-Alkali
SiliconesSpecialty
ChemicalsSemiconductor
Silicon
Electronics & Functional
MaterialsDiversified
Eliminationor
common assetTotal
Loss on impairment of fixed assets..... ¥— ¥— ¥— ¥6,191 ¥— ¥— ¥— ¥6,191
Note: Loss on impairment of fixed assets for the fiscal year ended March 31, 2013 is not presented as the amount is immaterial.
4. Amortization of goodwill and unamortized balanceMillions of yen
2013
PVC/Chlor-Alkali
SiliconesSpecialty
ChemicalsSemiconductor
Silicon
Electronics &FunctionalMaterials
DiversifiedElimination
orcommon asset
Figures in consolidated
financial statements
Amortization of goodwill ...................... ¥— ¥— ¥ 815 ¥— ¥— ¥ 6 ¥ 0 ¥ 822
Unamortized balance ........................... ¥— ¥— ¥9,363 ¥— ¥— ¥— ¥— ¥9,363
Millions of yen
2012
PVC/Chlor-Alkali
SiliconesSpecialty
ChemicalsSemiconductor
Silicon
Electronics &FunctionalMaterials
DiversifiedElimination
orcommon asset
Figures in consolidated
financial statements
Amortization of goodwill ...................... ¥— ¥— ¥ 882 ¥— ¥— ¥ 0 ¥— ¥ 882
Unamortized balance ........................... ¥— ¥— ¥9,020 ¥— ¥— ¥— ¥— ¥9,020
Millions of yen
2011
PVC/Chlor-Alkali
SiliconesSpecialty
ChemicalsSemiconductor
Silicon
Electronics &FunctionalMaterials
DiversifiedElimination
orcommon asset
Figures in consolidated
financial statements
Amortization of goodwill ...................... ¥— ¥— ¥ 924 ¥— ¥— ¥ 0 ¥— ¥ 925
Unamortized balance ........................... ¥— ¥— ¥10,521 ¥— ¥— ¥— ¥— ¥10,521
Thousands of U.S. dollars
2013
PVC/Chlor-Alkali
SiliconesSpecialty
ChemicalsSemiconductor
Silicon
Electronics &FunctionalMaterials
DiversifiedElimination
orcommon asset
Figures in consolidated
financial statements
Amortization of goodwill ...................... $— $— $ 8,673 $— $— $72 $ 1 $ 8,746
Unamortized balance ........................... $— $— $99,608 $— $— $— $— $99,608

61ANNUAL REPORT 2013 |
26. RELATED PARTY TRANSACTIONS
Transactions between the Company and related parties during the fiscal year ended March 31, 2013 are as follows:
Millions of yenThousands ofU.S. dollars
Type Name Percentage of voting rights Relationship Transaction
Transaction amount
(Thousands ofshares)
Account Balance
Transaction amount
(Thousands ofshares)
Director Shunzo Mori DirectOwnership 0.01%
RepresentativeDirector, President
Exercise ofstock options
(Note)
¥360(75) — —
$3,832(75)
Director Fumio Akiya DirectOwnership 0.00%
Representative Director, Executive
Vice President
Exercise ofstock options
(Note)
¥48(10) — —
$511(10)
Director Yasuhiko Saitoh DirectOwnership 0.00%
Representative Director, Executive
Vice President
Exercise ofstock options
(Note)
¥36(7.7) — —
$393(7.7)
Director Kiichi Habata DirectOwnership 0.00% Managing Director
Exercise ofstock options
(Note)
¥72(15) — —
$766(15)
Director Masahiko Todoroki DirectOwnership 0.00% Managing Director
Exercise ofstock options
(Note)
¥38(8) — —
$408(8)
Director Toshiyuki Kasahara DirectOwnership 0.00% Director
Exercise ofstock options
(Note)
¥28(6) — —
$306(6)
Director Hidenori Onezawa DirectOwnership 0.00% Director
Exercise ofstock options
(Note)
¥14(3) — —
$153(3)
Director Ken Nakamura DirectOwnership 0.00% Director
Exercise ofstock options
(Note)
¥28(6) — —
$306(6)
Director Yukihiro Matsui DirectOwnership 0.00% Director
Exercise ofstock options
(Note)
¥24(5) — —
$255(5)
Note: Share subscription rights granted based on resolution by the board of directors meeting held on July 22, 2009 was exercised.
Transaction between the consolidated subsidiaries and a related party during the fiscal year ended March 31, 2012 is as follows:
Type .......................................................................................................... AffiliatesName ....................................................................................................... Hemlock Semiconductor L.L.C.Location ................................................................................................... U.S.Capital ...................................................................................................... $10 thousandBusiness .................................................................................................. Semiconductor Silicon BusinessPercentage of Voting Rights ................................................................... 24.5% (indirect)Relationship ............................................................................................. Purchase of raw materials, Interlocking DirectorsTransaction .............................................................................................. Long-term advance paymentTransaction amount ................................................................................ ¥7,395 millionAccount .................................................................................................... Investments and Other Assets “Other”Balance .................................................................................................... ¥28,077 million
Note: Purchase prices are based on market value. Long-term advance payment has been made based on a contract.
62 | Shin-Etsu Chemical Co., Ltd.
27. CHANGES IN THE METHOD OF PRESENTATION
Consolidated Statements of Changes in Net AssetsThe item “Changes in scope of consolidation” for the previous fiscal years ended March 31, 2012 and 2011 is renamed as “Changes in scope of consolidation and equity method” effective from the fiscal year ended March 31, 2013.
28. STANDARDS ISSUED BUT NOT YET EFFECTIVE
On May 17, 2012, the ASBJ issued “Accounting Standard for Retirement Benefits” (ASBJ Statement No. 26) and “Guidance on Accounting Standard for Retirement Benefits” (ASBJ Guidance No. 25), which replaced the Accounting Standard for Retirement Benefits that had been issued by the Business Accounting Council in 1998 with an effective date of April 1, 2000 and the other related practical guidance, being followed by partial amendments from time to time through 2009. The major changes are as follows: (1) Treatment in the balance sheet – Actuarial gains and losses and prior service cost that have yet to be recognized in profit or loss
shall be recognized within net assets (accumulated other comprehensive income), after adjusting for tax effects, and the deficit or surplus shall be recognized as a liability (liability for retirement benefits) or asset (asset for retirement benefits).
(2) Treatment in the statement of income and the statement of comprehensive income – Actuarial gains and losses and prior service cost that arose in the current period and have yet to be recognized in profit or loss shall be included in other comprehensive income and actuarial gains and losses and prior service cost that were recognized in other comprehensive income in prior periods and then recognized in profit or loss in the current period shall be treated as reclassification adjustments.
This standard and related guidance are effective as of the end of fiscal years beginning on or after April 1, 2013. The Company is currently evaluating the effect these modifications will have on its consolidated results of operations and financial position.
The amounts in the consolidated financial statements presented in the Annual Report issued for fiscal years ended March 31, 2011 and earlier were stated in millions of yen by rounding amounts less than ¥1 million. The amounts in the accompanying consolidated financial statements and the notes thereto, including the amounts for prior fiscal years, are stated in millions of yen with amounts less than ¥1 million omitted.
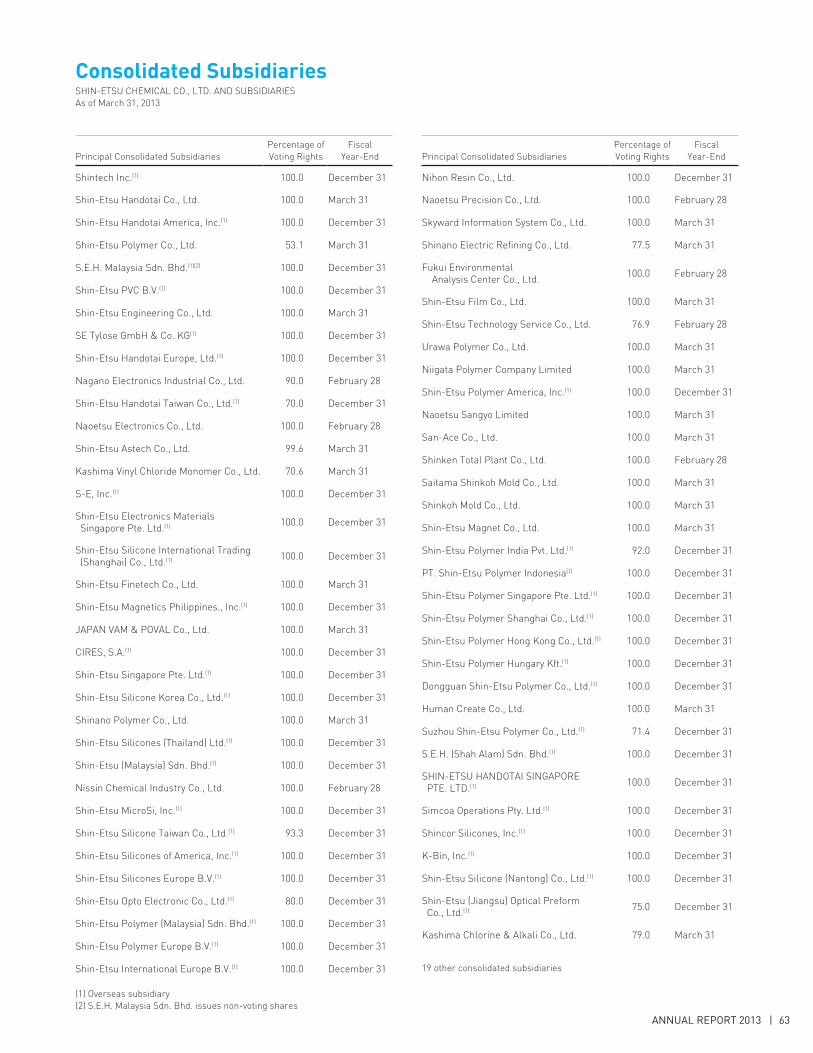
63ANNUAL REPORT 2013 |
Consolidated SubsidiariesSHIN-ETSU CHEMICAL CO., LTD. AND SUBSIDIARIESAs of March 31, 2013
Principal Consolidated SubsidiariesPercentage ofVoting Rights
FiscalYear-End
Shintech Inc.(1) 100.0 December 31
Shin-Etsu Handotai Co., Ltd. 100.0 March 31
Shin-Etsu Handotai America, Inc.(1) 100.0 December 31
Shin-Etsu Polymer Co., Ltd. 53.1 March 31
S.E.H. Malaysia Sdn. Bhd.(1)(2) 100.0 December 31
Shin-Etsu PVC B.V.(1) 100.0 December 31
Shin-Etsu Engineering Co., Ltd. 100.0 March 31
SE Tylose GmbH & Co. KG(1) 100.0 December 31
Shin-Etsu Handotai Europe, Ltd.(1) 100.0 December 31
Nagano Electronics Industrial Co., Ltd. 90.0 February 28
Shin-Etsu Handotai Taiwan Co., Ltd.(1) 70.0 December 31
Naoetsu Electronics Co., Ltd. 100.0 February 28
Shin-Etsu Astech Co., Ltd. 99.6 March 31
Kashima Vinyl Chloride Monomer Co., Ltd. 70.6 March 31
S-E, Inc.(1) 100.0 December 31
Shin-Etsu Electronics Materials Singapore Pte. Ltd.(1) 100.0 December 31
Shin-Etsu Silicone International Trading (Shanghai) Co., Ltd.(1) 100.0 December 31
Shin-Etsu Finetech Co., Ltd. 100.0 March 31
Shin-Etsu Magnetics Philippines., Inc.(1) 100.0 December 31
JAPAN VAM & POVAL Co., Ltd. 100.0 March 31
CIRES, S.A.(1) 100.0 December 31
Shin-Etsu Singapore Pte. Ltd.(1) 100.0 December 31
Shin-Etsu Silicone Korea Co., Ltd.(1) 100.0 December 31
Shinano Polymer Co., Ltd. 100.0 March 31
Shin-Etsu Silicones (Thailand) Ltd.(1) 100.0 December 31
Shin-Etsu (Malaysia) Sdn. Bhd.(1) 100.0 December 31
Nissin Chemical Industry Co., Ltd. 100.0 February 28
Shin-Etsu MicroSi, Inc.(1) 100.0 December 31
Shin-Etsu Silicone Taiwan Co., Ltd.(1) 93.3 December 31
Shin-Etsu Silicones of America, Inc.(1) 100.0 December 31
Shin-Etsu Silicones Europe B.V.(1) 100.0 December 31
Shin-Etsu Opto Electronic Co., Ltd.(1) 80.0 December 31
Shin-Etsu Polymer (Malaysia) Sdn. Bhd.(1) 100.0 December 31
Shin-Etsu Polymer Europe B.V.(1) 100.0 December 31
Shin-Etsu International Europe B.V.(1) 100.0 December 31
(1) Overseas subsidiary(2) S.E.H. Malaysia Sdn. Bhd. issues non-voting shares
Principal Consolidated SubsidiariesPercentage ofVoting Rights
FiscalYear-End
Nihon Resin Co., Ltd. 100.0 December 31
Naoetsu Precision Co., Ltd. 100.0 February 28
Skyward Information System Co., Ltd. 100.0 March 31
Shinano Electric Refining Co., Ltd. 77.5 March 31
Fukui Environmental Analysis Center Co., Ltd. 100.0 February 28
Shin-Etsu Film Co., Ltd. 100.0 March 31
Shin-Etsu Technology Service Co., Ltd. 76.9 February 28
Urawa Polymer Co., Ltd. 100.0 March 31
Niigata Polymer Company Limited 100.0 March 31
Shin-Etsu Polymer America, Inc.(1) 100.0 December 31
Naoetsu Sangyo Limited 100.0 March 31
San-Ace Co., Ltd. 100.0 March 31
Shinken Total Plant Co., Ltd. 100.0 February 28
Saitama Shinkoh Mold Co., Ltd. 100.0 March 31
Shinkoh Mold Co., Ltd. 100.0 March 31
Shin-Etsu Magnet Co., Ltd. 100.0 March 31
Shin-Etsu Polymer India Pvt. Ltd.(1) 92.0 December 31
PT. Shin-Etsu Polymer Indonesia(1) 100.0 December 31
Shin-Etsu Polymer Singapore Pte. Ltd.(1) 100.0 December 31
Shin-Etsu Polymer Shanghai Co., Ltd.(1) 100.0 December 31
Shin-Etsu Polymer Hong Kong Co., Ltd.(1) 100.0 December 31
Shin-Etsu Polymer Hungary Kft.(1) 100.0 December 31
Dongguan Shin-Etsu Polymer Co., Ltd.(1) 100.0 December 31
Human Create Co., Ltd. 100.0 March 31
Suzhou Shin-Etsu Polymer Co., Ltd.(1) 71.4 December 31
S.E.H. (Shah Alam) Sdn. Bhd.(1) 100.0 December 31
SHIN-ETSU HANDOTAI SINGAPORE PTE. LTD.(1) 100.0 December 31
Simcoa Operations Pty. Ltd.(1) 100.0 December 31
Shincor Silicones, Inc.(1) 100.0 December 31
K-Bin, Inc.(1) 100.0 December 31
Shin-Etsu Silicone (Nantong) Co., Ltd.(1) 100.0 December 31
Shin-Etsu (Jiangsu) Optical Preform Co., Ltd.(1) 75.0 December 31
Kashima Chlorine & Alkali Co., Ltd. 79.0 March 31
19 other consolidated subsidiaries

64 | Shin-Etsu Chemical Co., Ltd.
Report of Independent Auditors
64 | Shin-Etsu Chemical Co., Ltd.
Report of Independent Auditors

65ANNUAL REPORT 2013 |
Shin-Etsu Chemical Co., Ltd.Head Office: 6-1, Ohtemachi 2-chome,Chiyoda-ku, Tokyo 100-0004, Japan
Date of Establishment:September 16, 1926
Capital:¥119,419 million
Number of Employees:17,712 (including 87 consolidated subsidiaries)
Number of Shares Authorized:1,720,000,000
Number of Shares Issued:432,106,693
Number of Stockholders:58,910
Fiscal Year-End:March 31
Stockholders’ Meeting:June
Stock Listings:Tokyo, Osaka, Nagoya (Ticker Code: 4063)
Transfer Agent:Mitsubishi UFJ Trust and Banking Corporation
Auditor:Ernst & Young ShinNihon
Information:Public Relations DepartmentPhone: +81-3-3246-5091Fax: +81-3-3246-5096e-mail: [email protected]
Common Stock Price
Trading Volume
Major Stockholders:Name
Number of Shares
(Thousands)
Percentage ofTotal Equity
(%)
The Master Trust Bank of Japan, Ltd. (Trust Account) 37,667 8.9Japan Trustee Services Bank, Ltd. (Trust Account) 29,538 7.0Nippon Life Insurance Company 24,370 5.7The Hachijuni Bank, Ltd. 11,790 2.8Japan Trustee Services Bank, Ltd. (Trust Account 4) 11,330 2.7Meiji Yasuda Life Insurance Company 10,687 2.5SSBT OD05 OMNIBUS ACCOUNT-TREATY CLIENTS 8,975 2.1STATE STREET BANK AND TRUST COMPANY 505225 6,773 1.6THE CHASE MANHATTAN BANK, N.A. LONDON SECS LENDING OMNIBUS ACCOUNT 5,889 1.4
MELLON BANK, N.A. AS AGENT FOR ITS CLIENT MELLON OMNIBUS US PENSION 5,474 1.3
Note: Shin-Etsu holds 7,190,226 shares of treasury stock, but is excluded from the above list of major stockholders. Stockholding percentages are calculated excluding treasury stock.
Please visit our website:
http://www.shinetsu.co.jp(English, Japanese and Chinese)
Investor Information As of March 31, 2013