emergy synthesis 5 - center for environmental policy · the assessment uses exergy and emergy...
TRANSCRIPT

ii
EMERGY SYNTHESIS 5: Theory and Applications of the Emergy Methodology
Proceedings from the Fifth Biennial Emergy Conference,
Gainesville, Florida
Edited by Mark T. Brown
University of Florida Gainesville, Florida
Managing Editor
Sharlynn Sweeney University of Florida Gainesville, Florida
Associate Editors
Daniel E. Campbell US EPA
Narragansett, Rhode Island
Shu-Li Huang National Taipei University
Taipei, Taiwan
Enrique Ortega State University of Campinas
Campinas, Brazil
Torbjorn Rydberg Centre for Sustainable Agriculture
Uppsala, Sweden
David Tilley University of Maryland College Park, Maryland
Sergio Ulgiati Parthenope University of Napoli
Napoli, Italy
December 2009
The Center for Environmental Policy Department of Environmental Engineering Sciences
University of Florida Gainesville, FL

101
10
The Energetics of Mud Volcanoes in East Java, Indonesia John McLachlan-Karr, Indrasurya B. Mochtar and Amien Widodo
ABSTRACT
A preliminary assessment of the energetics of the ‘Lusi’ mud volcano in East Java, Indonesia was done to investigate the mechanisms of the flow with a view to assisting mitigation efforts by the Government of Indonesia. The assessment uses exergy and emergy synthesis approaches. An energy systems model was developed to simulate observed flow rates using H.T. Odum’s energy systems language. The model indicates the mud volcano is an externally triggered, autocatalytic process maintained by subsidence of the surrounding area and causing significant economic impact. Empower from solar-hydrological cycle contributes 5.2 E+11 sej/m2/yr, earth cycle 4.32 E+10 sej/m2/yr and tidal 1.8 E+11 sej/m2/yr to the mud volcano sedimentary storage. The transformity is 1.86 E+12 sej/J.
The result of the mud volcano landform evaluation indicates higher exergy values using a double cofferdam containment strategy (2.97 E+10 J/m2) compared to no containment approach 1.19 E+5 J/m2. The empower increases from 1.98 E+14 Sej/m2/yr to 5.38 E+20 Sej/m2/yr using the containment strategy. The high values resulting from underground mobilization of mud suggests that technical solutions to stop the mud flow are unlikely. The transformity of the mud volcano of 1.81 E+10 sej/J suggests the landform can be incorporated back into a depressional area such as a deltaic wetland area if it is technically and economically feasible.
INTRODUCTION
The eruptions of mud volcanoes are geologically important manifestations of vertical fluid flow that contain high proportions of fine suspended mud and silt with associated hydrocarbon gases. They are found on-shore and offshore in sedimentary basins and abyssal plains worldwide. Approximately 1,100 mud volcanoes are documented onshore and on continental shelves (Milkov and. Etiope, 2005). Most of these known mud volcanoes are found in Eastern Azerbaijan and the Caspian Sea, along the west coast of North America, Andaman Islands, South East Asia and the Caribbean basin mainly in the Gulf of Mexico, Eastern Venezuela and Trinidad.
The Sidoarjo mud volcano (abbreviated ‘Lusi’) is located at 7°32’3”S and 112°42’39”E, East Java, Indonesia. It first erupted on 29 May 2006 and by early November 2006, its torrential mudflow peaked at around 180,000 m3/day. In that time, the mud inundated about 350 hectares of surrounding rice paddies and villages and displaced around 11,000 people near the town of Porong in the Regency of Sidoarjo.
There are two other active mud volcanoes near Sidoarjo and at least five more in East Java (Figure 1). Kalanganyar is an active mud volcano located about 15 km North of Lusi1. Another small volcano is found at Gununganyar in about 5 km farther North. Both these nearby mud volcanoes have variable mudflows of the order of 0-2 m3/day.

102
Figure 1. Geology and locations of mud volcanoes in East Java.
Geo-Morphology of Study Area
The Lusi mud volcano is located in an area of active magmatic activity located at the nexus of four active tectonic boundaries: the Indo-Australian plate to the South, the Philippine and Pacific plates to the East, and the Eurasian plate to the Northwest. The interaction of these plates produces geologic deformations, seismic activity, volcanoes and rapid orogeny in a back-arc sedimentary basin and deep alluvial plain resulting in compression since the Oligo-Miocene (van Bemmelen, 1949). Under the Island of Java is an East-West oriented half-graben with an inverted sedimentary basin. The folded and faulted geologic features produce depositional lows that trap hydrocarbons and fluvial-deltaic clastics within a poorly lithified sedimentary matrix since the Palaeogene epoch (Figure 2).
The high orogeny is associated with the massive, mostly andesitic volcanism along the nearby volcanic arc (Kadar et al, 2007). The Centre of the Arjuna-Welirang-Argopuro Volcanic Complex (the Wunut Field) is about 50 km west of the Lusi mud volcano. This association results in a high background temperature gradient that triggers mineralogical transformations and geochemical reactions at shallow depths (Mazzini et al, 2007).
The formation of mud volcanoes such as Sidoarjo’s Lusi is ascribed to release of overpressure from aqueous clay ‘diapers’ such as the Kujung formation in organic-rich sedimentary basins (Mazzini et al, 2007). The identification of extinct forams and calcareous nano-fossils in mud samples from the Lusi deposit ages it as from the Pleistocene (Kadar et al, 2007). The majority of the Pleistocene deposits in the East Java basin are composed of volcanic, epi-clastic sediments extensively reworked by marine and fluvial processes (Kadar et al, 2007).
Based on the classification of volcaniclastic facies, these deposits can be differentiated into distal, non-marine and distal deltaic-marine facies (Vessel and Davies 1988; after Mathisen and McPherson, 1991). Sorting increases as the particles are transported farther away from the source; therefore, generally the distal volcaniclastic facies have far greater reservoir potential than the more poorly sorted, proximal facies. This indicates that uplift from the Pleistocene to Recent Epochs transformed the study area from a neritic environment to the present-day Brantas River floodplain.2

103
Figure 2. the study area's major geologic and geographic features. Mt. Arjuno and Mt. Penanggungan are the two active volcanoes adjacent to the Lusi Mud volcano.
Landform Energy of Mud Volcano Diapirs
It appears that the Earth functions as a kind of huge heat engine and since all products in the geobiosphere can be traced back to their energy inputs (Odum, 2000), the evaluation starts with an assessment of the Earth’s energy processes that contributed to the Kujung formation mud diaper in the East Java basin.
Part of the Earth’s deep heat that drives the convection of the seafloor and accumulates at island arcs is from the independent heat sources in the Earth and part is from energy transformations driven by the sun and hydrological cycle (Odum, 2000). These sources, plus the gravitational attraction force making tides, drive the atmosphere, ocean, hydrological, and sedimentary cycles and contribute heat downward to the shallow crust by burying oxidized and reduced organic substances, by friction, and by compressing sedimentary deposits on lower flood plains, deltas and shallow marine basins.
A continuous energy flow is required to drive tectonic movement of the Earth’s plates and material cycling within this system, or it would quickly clog up and stop. As part of efficient cycling, the distribution of energy over the Earth is not uniform, and appears to organize all components on all

104
scales in complex hierarchies (Odum, 1996)3. Because of the spatial organization of the Earth’s processes, there are large differences in rates of earth cycle, energy flux, and empower density between the high-energy mountain centres and the broad low-level areas in between (Odum et al, 2000). The larger scale features have longer turnover times, mass storages and unit emergy values.
Like other centres of the Earth’s energy hierarchy, mud volcano landforms involve two areas; the smaller area of their structure after it forms on the surface and the larger territory of support (watershed and marine basin) that concentrates its’ energy over time to the point of release. This is the ‘concentration area’ of the mud volcano landform.
The largest energy input is stream geopotential from the solar-hydrological cycle (3.72 E+9 J/m2/yr) (Table 1). This is the energy that transports and deposits the volcanic and eroded materials from the catchment to the basin (total area is estimated at 1.32 E+10 m2). The deposited mud stores chemical potential energy including organic inputs (1.28 E+6 J/m2/yr) as well as heat and other materials from the earth cycle (3.6 E+6 J/ m2/yr). The basin area also receives inputs from tidal processes (2.54 E+6 J/m2/yr).
The work used up in each continuous series of energy transformations is measured by its transformity. Transformity is the energy used up in the work process that converts one or more kinds of available energy into a different form of available energy. The exergy values in Table 1 multiplied by its transformity gives the emergy of the product. The emergy use over time is the Empower. Since Sun, wind and rain are generated as co-products by the Earth weather system at the same time, only the larger of the solar hydrological components is included in the emergy values to avoid double counting.
Using the current yearly average flow rate of the Brantas River, stream geopotential contributes an estimated 1.75 E+14 sej/m2/yr into the mud diapir concentration area. This high value is comparable to
Table 1. Concentration area energy inputs into the mud volcano storage Item Exergy, J/m2/yr Empower, sej/m2/yr Earth cycle 3.60E+06 4.32E+10Tidal 2.54E+06 1.88E+11 Solar hydrol. (chemical potential) 1.28E+06 5.20E+11 Solar hydrol. (geological potential) 3.72E+09 1.75E+14
1.00E+001.00E+021.00E+041.00E+061.00E+081.00E+101.00E+121.00E+141.00E+16
Earth Cycle= Tidal=
Solar hydrol. (chem. pot.)=
Solar hydrol. (geo pot.)=
Energy Sources
Ener
gy F
low
(Jou
les
per y
ear
ExergyEmergy
Figure 3. Energy inputs Joules (exergy value) and emergy in solar emjoules*. Footnotes to calculations in Table 2 (below).

105
Table 2. Energy inputs into East Java Kujung formation mud storage. Item Value Unit Notes/reference
EARTH CYCLE = This the Earth Cycle calculated as formation area*ave.heat flow Porong Catchment + basin = 1.32E+10 m2 Catchment area (Brantas River) plus est. for marine basin.
heat flow to study area= 3.60E+06 J/ m2/yr from USGS maps on-line 2009Energy (J) = 4.75E+16 J/yr
TRANSFORMITY = 1.20E+04 sej/J Odum, et al, 2000Emergy= 5.70E+20 sej/yr Energy= 4.32E+10 sej/m2/yr
TIDAL ENERGY = Tidal energy absorbed is estimated as geopotential energy by tide and dissipated by friction. Energy = (area)(density seawater)(water elevated centre of gravity)(gravity)(0.5) Odum, 1996
Basin Area = 1.32E+09 m2 est.size of marine basin ITS GIS Ave. Tide Range = 1.40E+00 m Surabaya Hydrological Office 2007
Density = 1.03E+03 kg/ m3 seawater Tides/year = 7.20E+02 (est. # of tides in 365 days)
Energy (J) = (area)(tides/yr)(density)(mean tidal range)^2(gravity constant)(energy absorbed) = (____m^2)*(0.5)*(____/yr)*(____m)^2*(_____kg/m^3)*(9.8m/s^2)(% absorbed)
Energy absorbed= 3.36E+15 J/yr est. energy absorb. 50%. Energy= 2.54E+06 J/ m2/yr
TRANSFORMITY = 7.39E+04 sej/J Odum, et al, 2000 Emergy= 2.48E+20 sej/yr Emergy= 1.88E+11 sej/m2/yr
STREAM CHEMICAL POTENTIAL=Flow volume times density of water times Gibbs free energy for secs. per yr.Stream flow= 1.27E+02 m3/sec Brantas River Water Man. for Porong River
Yr. Ave. Temperature= 2.97E+02 K Juanda Airport Met. Office 2007Density of Water = 1.00E+06 g/ m3 Total Dissolved solids (s) = est. 5 ppmGibbs free energy= 4.23E+00 J/g
Energy= 1.69E+16 J/yr Energy area= 1.28E+06 J/ m2/yr
TRANSFORMITY= 8.10E+04 sej/J Odum, et al, 2000Emergy= 1.37E+21 sej/yr Emergy= 5.20E+11 sej/
2STREAM GEOPOTENTIAL= (Flow vol.)*(density of water)*(ave. change in elevation)*(gravity) Stream flow= 1.27E+02 m3/sec Min. Public Works, 2000
Density of Water = 1.00E+06 g/m3 Average Change in 2.50E+02 m est. from ITS GIS
Gravity= 9.80E+00 m/secEnergy= 9.82E+18 J/yr
Energy Area= 3.72E+09 J/ m2/yr TRANSFORMITY= 4.70E+04 Odum, et al, 2000
Emergy= 4.61E+23 sej/yr Emergy= 1.75E+14 sej/ m2/yr
dynamic and productive environments such an oyster or coral reefs but less than an Arroyo (5.8 E+14 sej/ m2/yr) (Kangas, 2002).
Using the energy of the landform 8.33 E+7 J/m2 and the estimated formation time of 40,300 years based on sedimentation rates from Kadar (2007), the transformity of the Lusi underground mud storage is estimated at 1.86 E+12 sej/J. This is lower than calculations for landforms such as a North American floodplain (1.6 E+13 sej/J) (Kangas, 2002)4. The lower value of the underground storage reflects its

106
longer development time but is still much higher than the general products of the Earth’s sedimentary cycle at 2.13 E+9 sej/g (Odum, 2001). Chemical-Physical Model of Mud Volcano Formation
Figure 4 is an overview energy systems model of the main components (inputs and processes) that contributed to the pattern of mud volcanoes over the geophysical landscape of East Java. Work is expended in the process according to the 2nd Law of thermodynamics shown as heat sink at the bottom of Figure 4. All energy storages must secure and amplify their own energy inputs or they will degrade away (2nd Law). The transformity of each process increases from left to right.
In Figure 4, the faster solar-hydrological cycle and tidal processes in a neritic basin (basin box middle) is coupled to the much slower deep earth cycling shown on the bottom left. The products are storages of carbonate sedimentary layers from marine processes and volcaniclastics as part of the sedimentary cycle. The processes related to carbonate deposition in the basin is associated with high-energy systems in neritic environments such as coral reefs or estuaries with high numbers of calcareous plankton (middle left). The mud diaper lays over mainly sedimentary deposits of marine origin shown as an adjacent storage to the right.
The mud ‘diapir’ is an unconsolidated mainly volcaniclastic deposition made up of SiO2 ~48%, Al2O3, ~19.2 %, other lesser mineral and carbonate fractions and stores of heat, hydrocarbons, gases and saltwater (Perry, 2007). The mud diapir incorporates products of the slowly cooling, viscous, mafic material from deep lava sources and associated with nearby volcanism, gradually releasing, heat, low pH, saline water and gases mainly Hydrogen, Helium, Nitrogen and Hydrogen Sulphide (Mazinni, 2007)5. These gases and fluids rise towards the surface and the low pH of the rising fluids reacts with the deeper carbonate sedimentary layers (mainly CaCO3) releasing CO2 and HCO3. The production of HCO3 raises the average pH of the mud to around 7.5 (Rumbudi et al, 2007), in contrast to many other mud volcanoes that are acidic (Planke et al, 2003). Some gases, heat and water escapes to the atmosphere completing the atmospheric cycle. A percentage is trapped within the mud along with some products of organic decomposition forming a pressurized mud diapir.
The initial rapid release of gas and vapour is considered the result of formation of a piercement structure which breaches the Earth's surface. This is shown as an energy pulse trigger (top of Figure 4). The initial flow included large volumes of CO2, gases and hot water vapour. Mud volcanoes in East Java located at convergent plate boundaries emit quantities of water vapour and NaCl because of the addition of seawater into magmas formed at subduction zones beyond the continental shelf. This accounts for the salinity (16,000 mg/l) of the mud emissions (Rumbudi et al, 2007) and dilution with ground water during sedimentary deposition.
There are two theories to account for the trigger, a 6,5 Richter earthquake on 27th May 2006 near Jogjakarta about 380 km south-west of Lusi or drilling by PT Lapindo, a gas exploration company operating the exploratory, Banjar Panji-1 well that blew out, inflating shallow reservoirs, subsequently fracturing overlying rocks and allowing mud to flow to the surface. Although the trigger is still a matter of scientific debate, the distance to the earthquake epicentre, timing and location of blow-out relative to the drilling operation suggests that the drilling operation is the more likely cause6. Impacts
Two months after the blow-out, the mudflow had inundated 350 ha of surrounding rice paddies
and villages. By May 2007, there were thirteen recorded fatalities related to the disaster and over 75,000 persons impacted from 17,000 households (UNEP draft report, 2008). The total number of dwellings lost or damaged by the mudflow is about 14,000. The latest damage and loss estimate of Sidoarjo Regency assets is around 28.3 trillion Rupiah (2.83 E+13 I Rupiah) (UNEP, draft report, 2008).

107
HHeNNOx
CO2
VapourH2O
BioMass
AGroundWater
OrganicsWater
CoastalProduction Zooplank
Forams
Organics
H2O CN
CaCO3
Heat
SO4HeatH2ONaClgasesH+
xx x
xx
x x
x xx
H2S
Heat
H2ONaCLCaCO3
Hyd.carbons H2S CO2
HCO3Heat
Benz
CH4
NaClH2O
x
xx
x
x
Gravitationalatraction
G
DeepEarthHeat
E
SolarRadiation
S
xx
x
Plants
Nutrien
ts
Animals
SoilSiO2
AlO2
Microbes
xxx
Weathered material
Soil run-off basin
Arjuna/kelatMountain
Nitrogen fixing
SEG
S E G
GS
NaCl
SiO2, ALO2
Nutrients
S E G
x
x x-
x
Crust
R
Mantle
Maffic Material
E
Uplift (slow)Mud Volcano (fast)
Atmosphere
H2
Atmosphericprocesses
Nutrients
Mudstorage
Mud Volcano Energy System
x
Basin
TRIGGER
x
x
xx
x
x
Figure 4. Physio-chemical energy systems model of mud volcano formation in East Java.

108
Figure 5. Buildings buried under mud with dam wall and town of Porong in background.
Figure 6. Area under high risk from land subsidence, flooding and gas contamination deceasing with distance from the centre of mud volcano.
Perhaps 10,000 persons living in villages around the disaster site in the Porong Sub-district continue to live under constant threat of localized flooding from the now partly filled Porong River. The main human health issues from the disaster relate to increased salinity, H2S and hydrocarbon contamination of surficial ground water used for drinking. The detection of Hydrogen Sulphide (H2S) (~17 mg/l) (Rumbudi et al, 2007) and low concentrations of hydrocarbons such as CH4 (Methane) and aromatic hydrocarbons (Benzene, Toluene) (UNEP/OCHA, 2006) is likely due to entrainment in the mud outflow as well as from the compression of shallow gas bearing strata due to subsidence around the mud volcano. This rapid compression of the overburden gives rise to numerous hydrocarbon gas leaks over the entire impact area.
Landform Energy in Mud Volcanoes
Next, we shifted our attention to the smaller scale landform of the evolving mud volcano. An important part of this is to try to shed some light on the mechanics of the mudflow to the surface and how it is maintained as the Government disaster response focuses on containment of the mud within a net work of encircling of cofferdams. The integrity of the containment structures is related to ground stability and geo-potential energy in the rapidly forming mud volcano. An earlier study on the

109
engineering limitations of containment structures included an analysis of the maximum safe height of the containment dams as they are related to the increase in the area impacted (Indrasurya B. Mochtar, 2007). The current containment approach also reflects complex issues surrounding responsibility for the mudflow and relief efforts, land tenure and technical feasibility of alternative proposals.
Geo-potential energy storage
A landform’s exergy content is estimated as its' potential energy stored against gravity. Exergy and emergy calculations are done to compare two scenarios; the landform energy of the mud storage using the current containment strategy and one with no containment structure (Table 3 with notes in Appendix). Emergy in a landform is the energy used up to develop the form, even though most of the actual energy used is no longer stored in the structure (Kangas, 2002). Emergy stored in landforms is calculated as the product of energy use rate, its transformity, and the development time.
As all energy transformations are arranged in series (hierarchy) and its position relative to other components is marked by its transformity, this is also a measure of its potential for impact on other systems (economic, ecosystems, etc.).
Table 3 shows the geo-potential energy stored in the mud volcano with containment dam is 2.97 E+10 J/m2/yr or over 5 orders of magnitude greater than a mud volcano without retention using an estimate for (1.19 E+5 J/m2/yr). The empower for the Lusi mud volcano with retention dams is 5.4 E+20 sej/m2/yr and for a natural mud volcano is 2 E+14 sej/m2/yr. The transformity also increases from about 1.62 E+9 sej/J to 1.81 E+10 sej/J.
The flow of mud material from below increases geo-potential energy at the surface resulting in subsidence of the surrounding area (Istadi and Pramono, 2007). The estimated impacted area was over 2.2 E+7 m2 in December 2007 with a subsidence rate of between 1-4 cm/day (Teguh, 2007). Modelling using the current rate of subsidence of 0.02 m/day suggests the formation of a significant caldera after three more years (Istadi and Pramono, 2007).
The geo-potential energy from subsidence of the elastic clay/alluvial overburden is 1.475 E5 J/m2/day. The much higher geo-potential energy from the mud volcano with retaining dams may be a factor in the rate of ground subsidence over the study area and contributes to self-maintaining the flow.
Mud Flow Modelling
The more complex pathways in Figure 3 were simplified into the three main coupled energy inputs for two storages and pathways for mud flow (Figure 7). In Figure 7, after a trigger pulse, the over-pressured mud, fluid and gas escapes to the surface at an exponential rate with a maximum flow of about 180 E+3 m3/day after about 4 months. The increasing density of the mud starts to build a surface storage (Q), a mud volcano. This flow k1*E*Q is then proportional to E and Q. The flow declined progressively to around 50 E+3 m3/day by March 2008.
Any storage that pumps ‘upstream’ i.e. (mudflow to the surface against gravity) is maintained by autocatalytic process (Odum and Odum, 2000). This feedback is given as k2*Q (Q has a feedback to E). The flow from the diaper is maintained by the geo-potential energy of mud in the surface landform and associated subsidence of the over burden given as the combined expression k3*E*Q. k4*Q is a linear drain that represents some of surface landform flowing back into the hydro-sedimentary cycle with mechanical pumping to the Porong River and ultimately to the coastal area. The dam containment
Table 3. Results of energy calculations of mud volcano landforms.
Total Geopotential
Energy (J)Energy (J/m2)
Empower (sej/m2/yr)
Transformity(sej/J)
Mud Volcano and Retention Dam 5.22E+12 2.97E+10 5.38E+20 1.81E+10Natural Mud Volcano 2.88E+12 1.19E+05 1.94E+14 1.63E+09

110
Trigger
Pulse
EVolume
undergroundstorage
QMud
Volcanox x
k2* Q
k3*E*QFlow production
k1*E*Qko * E
Figure 7. Autocatalytic process of mud volcano formation.
0.0
50.0
100.0
150.0
200.0Thousands
2 9 Mei06
1 5 J uni0 6
1 7 Jul i0 6
3 0-Sep-06
Nop. 0 6
Dec. 06Mar.0
?
Figure 8. Estimated flow rate of mud in m3 per day based on field measurements over the first year since the trigger. structure uses economic inputs to reduce k4*Q (spreading and wasting by erosion) reducing the impact area but at the same time may increase k2*Q (the feedback to maintain flow). DISCUSSION
The emergy inputs of sun, tides and deep heat sources from the Earth interact as a single coupled system with a network of processes in the production and maintenance of storages. These processes are organized in coupled cycles over geologic time scales (Odum, 2000). On this scale, mud volcanoes are relatively small-scale recurring forms shaped by similar emergy inputs. Although the higher proportion of the emergy in its formation is from the solar-hydrological cycle, the relatively high background

111
Theoretical autocatalytic mud flow
0102030405060708090
100110120130140150160170180190200
1 204 407 610 813 1016 1219 1422 1625 1828
Days
Vol
ume
of F
low
(m3/
day
Figure 9. Theoretic energy flow (k3*E*Q) based on Systems Model above. temperatures in East Java is consistent with its higher temperature outflows compared with the relatively ‘cool’ surface flows (low heat gradient) in mud volcano fields around the Caspian Sea (Abdulvahab, 2003).
This concentration of emergy flows, however, is a double-edged sword for people in Java. The large renewable emergy inputs have permitted a large population base to be maintained over millennia with sufficient surplus emergy to support highly developed hierarchical/cultural centres such as the 15th century Majapahit Empire of East Java. At the same time, the transformity of geologic events (based on long turnover time and large territory) poses high risks to poorly adapted populations and badly located assets from flooding, rapid silting up of dams and other flood control structures, earthquakes, mudslides, and rarely, mud volcanoes. As geologic events have higher transformity than economic systems, enormous inputs must be diverted from the economy to contain them.
The Lusi mud volcano is exceptional in its high flow rates and severity of impacts caused. This may be accounted for by: (1) its location within a large basin with rapid sedimentation rates resulting in poor lithification of overburden and a large mud diaper; (2) proximity to an area of volcanic activity with on-going inputs of water and gases from cooling mafic magma (3) high internal pressure from compression and uplift and (4) rapid decompression after the triggering event near urban areas and infrastructure.
Modelling of the mudflow suggests that it is autocatalytic with the mud flow sustained by geopotential energy from the surface mud and containment structure and associated subsidence and compression of the surrounding overburden. The model suggest the flow rate can be expected to continue, though at a decreasing rate, over the next five to ten years and continue to pose a high risk to the local population and their assets, as well as increasing the costs of maintaining the current containment structures. Engineering assessments suggest that in about 2010 (at the higher rates of mudflow), the containment structure may fail >15 m average height .
The landform emergy signature suggests that the mud volcano material can be incorporated back into a productive system such as a coastal wetland, since the landform scale may match the scale of colonizing vegetation (Kangas, 1983). As a result of this insight, alternatives to the current containment strategy should determine how much of the material can be incorporated into a depressional storage area, and if it is economically feasible (UNEP/AUSAID Draft Report, 2008).

112
If the mud material can be diverted to an ‘energy matching’ location such as the mangrove delta, in time, renewable energy flows such as sun, wind, rain, and uplift can produce a new landform. The surface mud storage may be combined into the landscape by exchange with the surrounding systems, mainly through flows of water, sediments, wind, and seeds7. These flows integrate and organize the larger surface, generating properties of hierarchy in spatial dimensions and feedback mechanisms that support self-maintaining stability that may complement or provide an alternative to current management strategies.
REFERENCES Abdulvahab, M. 2003 Geothermal Energy Discharge from Mud Volcano Channel in AAPG Annual
Convention Energy - Our Monumental Task. UNEP/OCHA Environmental Unit Environmental Assessment Hot Mud Flow East Java Indonesia
Joint UN Report. 2006. Guliev, I. 2003. The south-Caspian basin – excitement and movement of sedimentary masses:
mechanism and geologic consequences in AAPG Annual Meeting 2003 Energy - Our Monumental Task.
Indrasurya B. Mochtar. 2007. Methode Pembuangan Lumpur ke Daerah Wetland di Timur Porong ITS Press Pub. Surabaya.
Istadi, B. and G. Pramono. 2007. Simulation on Future of Sidoarjo Mud Extent and Impact Geodesy Lapindo Unpub.
Kadar, A D. Kadar and F. Aziz. 2007. Pleistocene Stratigraphy of Banjarpanjil Well and Surrounding Area International Geological Workshop on Sidoarjo Mud Volcano, Surabaya.
Kangas, P. C. 1983. Energy Analysis of Landforms, Succession, and Reclamation. Ph.D. Dissertation, University of Florida, Gainesville, Fl.
Kangas, P. C. 2002 Folio #5 Emergy of Landforms Handbook of Emergy Evaluation A Compendium of Data for Emergy Computation Issued in a Series of Folios Center for Environmental Policy, Environmental Engineering Sciences, Univ. of Florida, Gainesville, 57 pp.
Laporan Tahunan Bidang Perikanan dan Kelautan Tahun 2006; Dinas Perikanan dan Kelautan Kabupaten Sidoarjo Tahun Anggaran ITS Press Unpub.
Made Arya Joni, Ali Altway and Djaja Laksana. 2007. Study Experimental Pengaliran Lumpur Sidoarjo, Unpub. ITS, Surabaya.
Mazzini A. H. Svensen, G Akhmanoc G Aloisi S. Planke A Malthe Sorenssen, B Istake. 2007. Triggering and Dynamic Evolution of the Lusi Mud Volcano Indonesia Earth and Planetary Sciences Letters 261/3-4, p. 375-388.
Milkov, A.V. and G. Etiope 2005 Global methane emission through mud volcanoes and its past and present impact on the Earth's climate. Comment. International Journal of Earth Science, v. 94 (3), pp. 490-492.
Ministry of Public Works, Indonesia Brantas Flood Control and Water Resources Management Project, Indonesia Government Publication 2000.
Odum, H. T., M. T. Brown, Sherry Brandt-Williams 2000 Folio #1 Introduction and Global Budget Center for Environmental Policy, Environmental Engineering Sciences, Univ. of Florida, Gainesville, 16 pp. Downloadable at www.emergysystems.org.
Odum, H.T. 1996. Environmental Accounting: Emergy and Decision Making. John Wiley, New York, 370 pp.
Odum, H.T., 2000. Handbook of Emergy Evaluation: A Compendium of Data for Emergy Computation Issued in a Series of Folios. Folio No.2 – Emergy of Global Processes. Center for Environmental Policy, Environmental Engineering Sciences, Univ. of Florida, Gainesville, 16 pp.
Odum, H.T., Odum, E.C., 2000. Modelling for All Scales: An Introduction to Systems and Simulation. Academic Press, San Diego.

113
Odum, H.T., F.C. Wang, J. Alexander and M. Gilliland, eds. 1978. Energy analysis of environmental values: A manual for estimating environmental and societal values according to embodied energies. Tech. Prof. Rept. To Nuclear Regulatory Commission. Center for Wetlands, University of Florida, Gainesville, FL.
Perry Burhan, R. Y. 2007. Chemical Analysis of Lumpur Lapindo, ITS Department of Chemistry Lab. Unpublished Report.
Planke, S. H. Svensen, M. Hovland, D. A. Banks, B. Jamtveit 2003 Mud and fluid migration in active mud volcanoes in Azerbaijan Geo-Marine Letters 23 (3-4): 258-268
Rumbudi S, M., Djunaidi, H., Wawan, H Penyelidikan. 2007. Tataan Air Tanah Kabupaten Sidoarjo dan Sekitarnya Terkait Terjadinya Semburan Lumpur. Badan Geologi Pusat Lingkungan Geologi, Department Energi dan Sumber Daya Mineral.
Teguh 2007 Pemantauan Lumpur Sidoarjo menggunakan citra satellit pendinderaan jauh bserta alternatif pengalirannya ITS Unpub.
UNEP/AUSAID Alternatives for the Lusi Mud Volcano Disaster Response Draft Report, 2008. UNDP Sidoarjo Mud Emergency Response Consultant Report Ministry of Environment, Government
of Indonesia, Chapter 3 Ecological Engineering Approach. Van Bemmelen R.W. 1949. The Geology of Indonesia Published The Hague Govt. Printing Office. Vessel, R.K. and Davies, D.K. 1981. Non-marine sedimentation in an active fore arc basin. Soc. Econ.
Paleont. Mineral. Pub. 31, 31-45. APPENDIX 1: Landform Energy Calculations for the Mud Volcano and Containment Structure.
Item Value Unit Reference Landform Energy of Mud in Retaining Structure= ((volume)*(density)*(centre of mass)*(gravity)/area
Height at Mud Volcano Centre= 1.80E+01 m est. Indrasurya, 2007 Containment area= 4.40E+06 m2 ITS GIS
Area directly impacted= 1.83E+07 m2 ITS GIS 2008Density of mud attime of extrusion = 1.70E+00 g/cm3 ITS 2007
Density of mud after settling = 2.00E+00 g/cm3 This studyVolume= 3.46E+15 cm3 est. from flow rates
Mass displaced = 5.88E+15 g aveave height retention dam wall= 1.20E+01 m est. Jan. 2008
mud flow variable rate= 3.46E+08 m3/yr avg. flow rate - export River pumping/run-off= 3.00E+03 m3/day est.from BPLS in 2007 Days pumping to River= 5.00E+02 days
deposition rate= 1.34E+09 g/ m2/day into containment structures Total Geopotential Energy in Mud Volcano = 5.19E+12 J
Geopotential Energy Mud Volcano= 2.83E+05 J/m^2Landform Energy of Dam Retaining Structure= ((volume)*(density)*(centre of mass)*(gravity)/area
density= 2.50E+00 g/cm3 est. fillgravity = 9.80E+02 cm/s2
Perimeter= 2.00E+04 m ITS GISWidth= 3.00E+01 m ave
Ave. Height= 1.10E+01 m Jan. 2008Volume by GIS est= 4.40E+06 m3 ITS GIS 2007
Mass displaced by fill= 5.50E+13 gGeopotential Energy in Fill= 2.97E+10 Joules
Energy in Fill= 4.94E+04 Joules/ m2
Emergy in fill= 4.40E+15 sejInputs to Build a Mud Volcano Retention System
Disaster containment budget= 5.00E+11 Irp/year BPLS,2007Budget= 5.38E+07 US$ US$ equivalent
Convert these to solar energy equivalents and summing=Solar emergy= ($/year)(1 E13 sej/$)(Global avg.,Odum,1996)
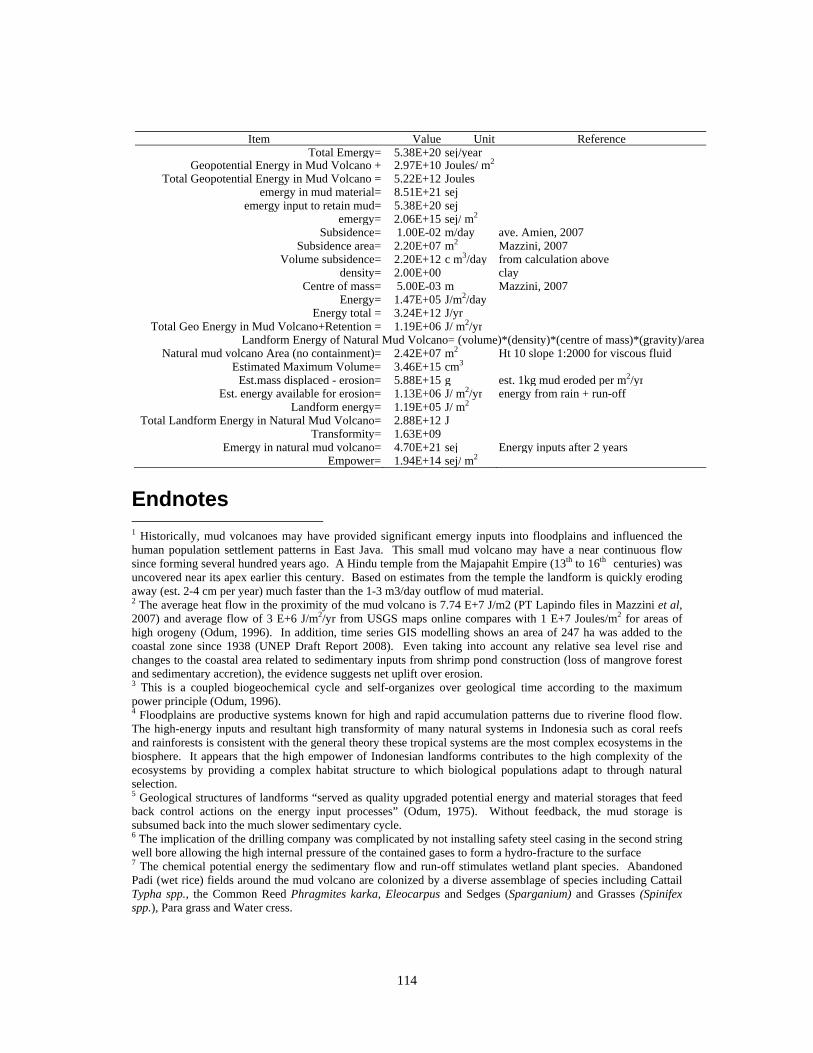
114
Item Value Unit Reference Total Emergy= 5.38E+20 sej/year
Geopotential Energy in Mud Volcano + 2.97E+10 Joules/ m2
Total Geopotential Energy in Mud Volcano = 5.22E+12 Joulesemergy in mud material= 8.51E+21 sej
emergy input to retain mud= 5.38E+20 sejemergy= 2.06E+15 sej/ m2
Subsidence= 1.00E-02 m/day ave. Amien, 2007 Subsidence area= 2.20E+07 m2 Mazzini, 2007
Volume subsidence= 2.20E+12 c m3/day from calculation above density= 2.00E+00 clay
Centre of mass= 5.00E-03 m Mazzini, 2007Energy= 1.47E+05 J/m2/day
Energy total = 3.24E+12 J/yrTotal Geo Energy in Mud Volcano+Retention = 1.19E+06 J/ m2/yr
Landform Energy of Natural Mud Volcano= (volume)*(density)*(centre of mass)*(gravity)/areaNatural mud volcano Area (no containment)= 2.42E+07 m2 Ht 10 slope 1:2000 for viscous fluid
Estimated Maximum Volume= 3.46E+15 cm3
Est.mass displaced - erosion= 5.88E+15 g est. 1kg mud eroded per m2/yr Est. energy available for erosion= 1.13E+06 J/ m2/yr energy from rain + run-off
Landform energy= 1.19E+05 J/ m2
Total Landform Energy in Natural Mud Volcano= 2.88E+12 JTransformity= 1.63E+09
Emergy in natural mud volcano= 4.70E+21 sej Energy inputs after 2 years Empower= 1.94E+14 sej/ m2
Endnotes 1 Historically, mud volcanoes may have provided significant emergy inputs into floodplains and influenced the human population settlement patterns in East Java. This small mud volcano may have a near continuous flow since forming several hundred years ago. A Hindu temple from the Majapahit Empire (13th to 16th centuries) was uncovered near its apex earlier this century. Based on estimates from the temple the landform is quickly eroding away (est. 2-4 cm per year) much faster than the 1-3 m3/day outflow of mud material. 2 The average heat flow in the proximity of the mud volcano is 7.74 E+7 J/m2 (PT Lapindo files in Mazzini et al, 2007) and average flow of 3 E+6 J/m2/yr from USGS maps online compares with 1 E+7 Joules/m2 for areas of high orogeny (Odum, 1996). In addition, time series GIS modelling shows an area of 247 ha was added to the coastal zone since 1938 (UNEP Draft Report 2008). Even taking into account any relative sea level rise and changes to the coastal area related to sedimentary inputs from shrimp pond construction (loss of mangrove forest and sedimentary accretion), the evidence suggests net uplift over erosion. 3 This is a coupled biogeochemical cycle and self-organizes over geological time according to the maximum power principle (Odum, 1996). 4 Floodplains are productive systems known for high and rapid accumulation patterns due to riverine flood flow. The high-energy inputs and resultant high transformity of many natural systems in Indonesia such as coral reefs and rainforests is consistent with the general theory these tropical systems are the most complex ecosystems in the biosphere. It appears that the high empower of Indonesian landforms contributes to the high complexity of the ecosystems by providing a complex habitat structure to which biological populations adapt to through natural selection. 5 Geological structures of landforms “served as quality upgraded potential energy and material storages that feed back control actions on the energy input processes” (Odum, 1975). Without feedback, the mud storage is subsumed back into the much slower sedimentary cycle. 6 The implication of the drilling company was complicated by not installing safety steel casing in the second string well bore allowing the high internal pressure of the contained gases to form a hydro-fracture to the surface 7 The chemical potential energy the sedimentary flow and run-off stimulates wetland plant species. Abandoned Padi (wet rice) fields around the mud volcano are colonized by a diverse assemblage of species including Cattail Typha spp., the Common Reed Phragmites karka, Eleocarpus and Sedges (Sparganium) and Grasses (Spinifex spp.), Para grass and Water cress.