emergy synthesis - university of florida · emergy synthesis: theory and ... .m silvia romitelli an...
TRANSCRIPT
EMERGY SYNTHESIS: Theory and Applications of the Emergy Methodology
Proceedings from the First Biennial Emergy Analysis Research Conference, Gainesville, Florida, September, 1999.
Edited by
Mark T. Brown
University of Florida Gainesville, Florida
Associate Editors Sherry Brandt-Williams
Rookery Bay National Estuarine Research Reserve Naples, Florida
David Tilley
Texas A&M University Kingsville, Teias
Sergio U1giati
University of Siena Siena, Italy
December, 2000
The Center for Environmental Policy Department of Environmental Engineering Sciences
University of Florida Gainesville, FL
iii
ABSTRACT
5
Emergy Analysis of the New Bolivia-Brazil Gas Pipeline (Gasbol)
.M Silvia Romitelli
An emergy analysis of the northern portion (1970 Ian) of the new 3065 Ian pipe/ine constructed to bring natural gas from Bolivia to southern Brazilian states was performed Major emergy inputs to the project were the services for the heavily equipped compression plants and the services and electricity for the pipe production. The Emergy Yield Ratio (EYR) was evaluated to compare the emergy that is delivered by the project against the emergy that it takes to construct and operate it. Results indicated a favorable EYR of 5.8, meaning that the project will be able to support development in the receiving areas. The impact of the gas or electricity from gas on five administrative regions of Slio Paulo State was examined It was proposed that an hierarchical pattern of development less extreme than exists today among the regions, should be established after Gasbol. These results reveal the importance of the emergy analysis for the strategic environmental planning by the state.
INTRODUCTION
The goal of this paper is to evaluate the net emergy of the transported gas from Bolivia. The emergy that will be delivered by the Bolivia- Brazil gas pipeline will be compared to the amount of emergy that is being used to construct and operate the project. The evaluation will include the natural and the economic resources that are being allocated to the project.
A 3065km pipeline is being constructed to bring natural gas from Bolivia to southern Brazilian states. The aim of the project is to provide Brazil with a new and cleaner source of energy, that will be used to generate electricity in future thermo power plants and to replace more polluting fuels (oil, diesel, LPG, etc) used today in industry.
It is expected that the anival of this new source of primary energy will generate new developments in southern Brazilian states. In fact, emergy theory indicates that the growth and prosperity in urban civilization depends on the supply of fuels and electricity with high net emergy yield. This means that economies depend on sources of fuels and electricity that deliver substantially much more emergy than is required to obtain them.
The net emergy of Texas natural gas (on shore) was estimated as 10.3, one of the highest ratios among the all the heat sources evaluated (oil, coal, rainforest logs, lignite, wood, peat, etc) (Odum, 1996). However, a lot of natural and economic resources are required to transport gas from Bolivia to Brazil. The project, with a total estimated cost of2 billion dollars, has already employed 10,000 workers, and buried 442,000 ton of pipes to complete its first stage (1970 km section).
The other point to be discussed by the paper is the potential impacts of the anival of this new primary source of energy in the economic development pattern of the Sao Paulo State. Based on the proposed volume of gas to be delivered in different regions of the State and on the demand for domestic and industrial electrical energy exhibited in recent years in these areas, some tentative scenarios for future economic growth of these areas will be proposed.
-53-
The pro.iect
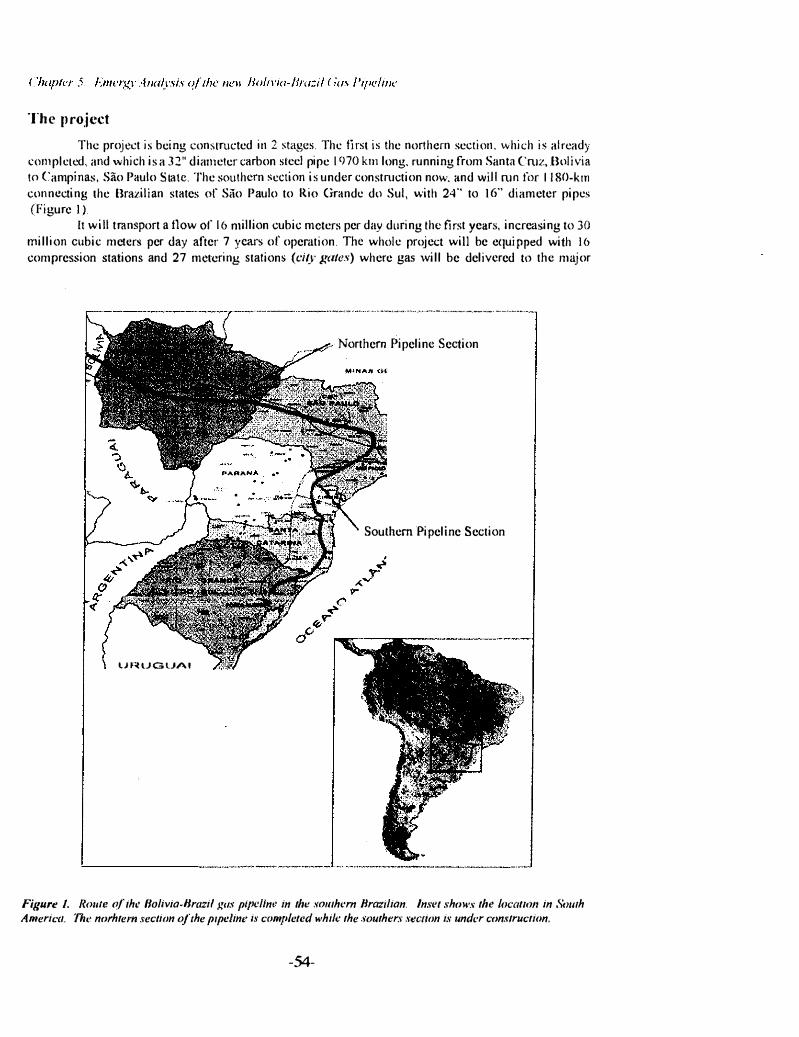
The projct.:t is being constructed in 2 stages. The first is the northern section, which is already completed, and which is a 32" diameter carbon steel pipe 1970 kill long. funning from Santa Cmz. Bolivia to ('ampinas, Sao Paulo State. The southern section is under construction now, and wiJl mIl for IISO-km connecting the Brazilian states of Sao Paulo to Rio Grande do Sui, with 24" to 16" diameter pipes (Figure I)
It will transport a flow of 16 million cubic meters per day dllring the first years, increasing to 30
million clIbic meters per day after 7 years of operation The whole project will be equipped with 16 compression stations and 27 metering stations (city gale .... ') where gas will be delivered to the major
r------------r-------------.. ------ .. - --.. --·----- .... ---.. ------------.... --,
Northern Pipeline Section
Southern Pipeline Section
lJHlJGlJAI
Figure I. Route (?/Ihc flolivia�Br(lzil j!tlS pljJt!lInt' in the! ,"OIl1ht:rn BrazIlian. Inset shows the location in Sowh Americ(1. The norhtern section of the pIpeline is completed while the southers welton is undl'r con.vtruction,
-54-
Chapter 5. Emergy Analysis oj the new Bolivia-Brazil Gas Pipeline
consumers. It will be remotely monitored by a Supervisory Control and Data Acquisition System (Scada), interlinked and operated with the help of a satellite (petrobrasl Segen IGasbol, 1996)
The pipeline route intersects distinct ecological zones, including large wetlands areas (Bolivian Chaco and Brazilian Pantanal), savanna ("cerrado"), semi-deciduous forests, Atlantic rainforest, and grasslands ("campo limpo"). In the northern section, anthropogenic influences are prevalent, and pasture is the dominant use of these lands. Other uses include eucalyptus plantations, sugar cane plantations and smaller areas with a variety of crops (com and beans) (Petrobrasl Segen/ Gasbol, 1996).
The project crosses approximately 80 municipalities, and some environmentally protected areas and Indian reservations. Socioeconomic compensations were provided for the neighboring small communities, for the Indian reservations and forthe environmental protected areas (petrobrasiBiodinamica! Prime Engenharia, 1997).
It took about 15 months to complete the first stage of project (the northern section), starting in October 1997 and ending in December 1998. It required the collaboration of about 10,000 workers and 1,900 heavy machines. The construction followed an environmental management plan and was monitored by independent consultant companies.
About sixty percent of the pipes were made in Brazil, and 40% were imported from Japan and US. The heavy machines were largely imported from Europe and the US. From the factory and harbor in Sao Paulo State, the pipes were transported largely by trucks to large storage areas located at some strategic points along the pipeline route.
METHODS
To calculate all natural and economic resources that went into the implementation of the project, an emergy analysis of the project was carried out. This methodology allows one to estimate all needed resources for the construction and operation of the pipeline, using solar energy as a common currency. Emergy indices and ratios of renewable to non-renewable, purchased to free or yielded resources, regularly applied for similar projects, are helpful tools to evaluate the intensity and the economic-environmental impacts of a new development.
Emergy a nalysis of the project implementation
The emergy evaluation was done for the I 970-km northern section of the gas pipeline, using the methodology indicated on Oduin ( 1996) and according to the following steps: • A check list of major resources and activities involved in the project implementation was prepared. It
included natural and agricultural production destroyed by the project; resources needed for pipe production and transportation, for the pipeline construction and operation, and the resources for the environmental and social compensations.
• An aggregate diagram of the pipeline construction and operation was prepared, as shown in Figure 2. • Data on natural and agricultural resources was collected from environmental reports on impact
evaluation, mitigation and monitoring prepared by Petrobras for State and Federal Agencies. Data on resources and funds required for the construction and compensations were obtained from Petrobras personnel, especially data on machinery and labor. Energetic requirements for the pipe and machinery production and for their transport were based on the net energy analysis of the whole project performed by Montes & Shaeffer, 1997.
• Energetic calculations were done according to methodology indicated in Odum (1996) and transformities taken from Odum ( 1996) and other publications on emergy.
• A table containing the items evaluated, the energy used peri tern, transformities and their solar emergy was prepared. (Table 1) using spreadsheet. Footnotes on the table indicated the data sources and the energetic calculations.
• Results of the Emergy analysis were also presented on bar graphs (Figures 3 and 4).
-55-
Chapter 5. Emergy Analysis of the new Bolivia-Brazil Gas Pipeline
Pipeline Construction
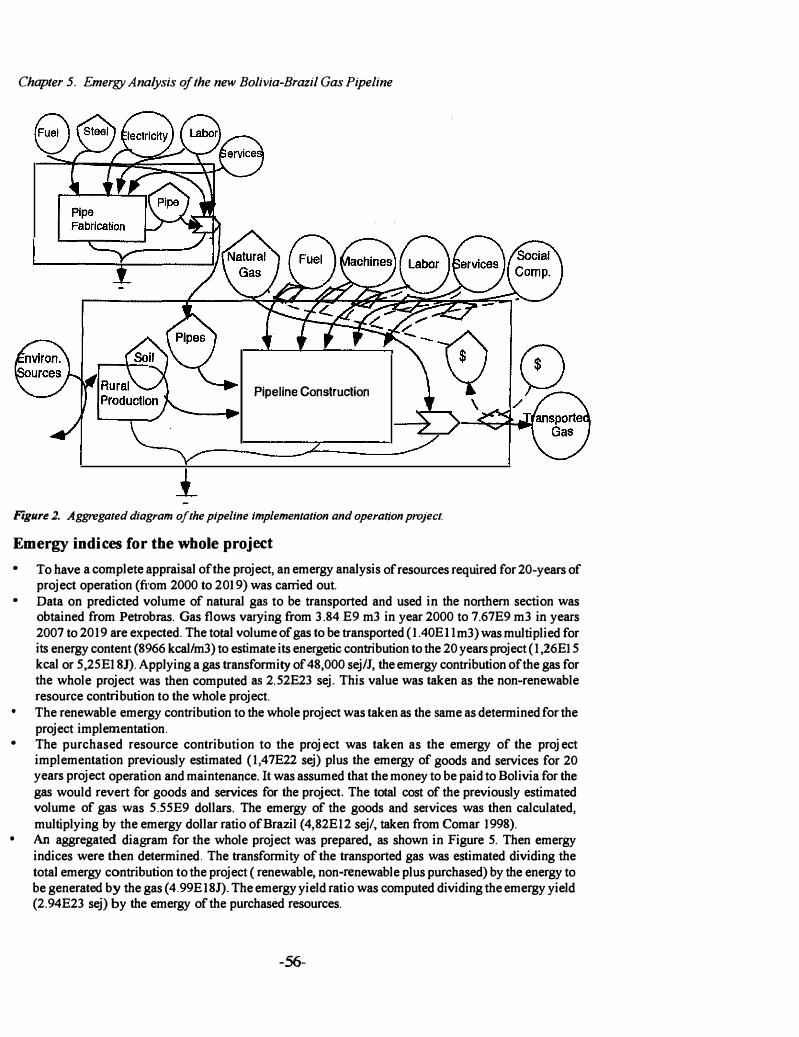
Figure 2. Aggregated diagram o/the pipeline implementation and operation project.
Emergy i ndices for the whole project
•
•
•
•
•
To have a complete appraisal of the project, an emergy analysis of resources required for 20-years of project operation (from 2000 to 2019) was carried out. Data on predicted volume of natural gas to be transported and used in the northern section was obtained from Petrobras. Gas flows varying from 3.84 E9 m3 in year 2000 to 7.67E9 m3 in years 2007 to 20 19 are expected. The total volume of gas to be transported ( 1. 40E II m3) was multiplied for its energy content (8966 kcal/m3) to estimate its energetic contribution to the 20 years project ( I ,26E15 kcal or 5,25EI 8J). Applying a gas transformity of 48,000 sej/J, the emergy contribution of the gas for the whole project was then computed as 2.52E23 sej. This value was taken as the non-renewable resource contribution to the whole project. The renewable emergy contribution to the whole project was taken as the same as determined for the project implementation. The purchased resource contribution to the proj ect was taken as the emergy of the proj ect implementation previously estimated ( 1,47E22 sej) plus the emergy of goods and services for 20 years project operation and maintenance. It was assumed that the money to be paid to Bolivia for the gas would revert for goods and services for the project. The total cost of the previously estimated volume of gas was 5.55E9 dollars. The emergy of the goods and services was then calculated, multiplying by the emergy dollar ratio of Brazil (4,82EI2 sejl, taken from Comar 1998). An aggregated diagram for the whole project was prepared, as shown in Figure 5. Then emergy indices were then determined. The transformity of the transported gas was estimated dividing the total emergy contribution to the project ( renewable, non-renewable plus purchased) by the energy to be generated by the gas (4.99EI8J). The emergy yield ratio was computed dividing the emergy yield (2.94E23 sej) by the emergy of the purchased resources.
-56-
Chapter 5. Emergy Analysis of the new Bolivia-Brazil Gas Pipeline
Impact Evaluation
The impacts in Sao Paulo State due to the arrival of this new primary energy source were evaluated according to the following procedures: • Five administrative regions of the Sao Paulo State - Aracatuba, Central, Campinas, Metropolitan Sao
Paulo Region (RMSP) and Sao Jose dos Campos - were selected. • Data on industrial and total electrical energy use per region for the years 1990, 1994 and 1997 were
obtained from Fundacao Seade. •
•
•
Emergy of electrical energy use in the administrative regions for the 3 subsequent years were estimated. Transformity for electricity was taken as 160,000 sejlI. A graph of the empower density (emergy per area per year) calculated for the current (1997) and future condition of the 5 regions was prepared. Based on Petrobras data for the city gates and project data of the future thermo power plants, the amount of gas to be delivered and used as fuel or electricity in each region was estimated. The emergy use in future conditions was then evaluated, using transformity of 48,000 sej/J for the natural gas and the transformity of 160,000 sej/J for the electricity generated by the gas. A scenario of potential future development of each region was proposed.
RESULTS
Table 1 displays the results of a detailed energy analysis of the pipeline. The evaluation incorporated all necessary resources for the 20 years operation of the gas pipeline, and was broken into three major components: the natural resources losses, the pipe production and transportation and the actual pipeline construction.
The natural resources losses
Impacts on natural resources due to clearing, earth works and the establishment of a 20 meters right of way were evaluated, calculating biomass and gross primary production (GPP) losses of affected forests, wet prairie and pastures. Losses on forests GPP shall last for the 20 years project operation, but it was assumed that wet prairie and pasture ecosystems will recover in 5years and 1 year respectively (following the 2 years project when production was also impeded).
Losses on the agricultural production of sugarcane and eucalyptus were calculated for the 20 years project considering those plantations are incompatible with the operation of the gas pipeline. For the other agricultural production, losses were limited to the 2 yeas of the project implementation. Relatively low rates of erosion were used in the emergy analysis of soil losses, considering that control measures were employed during construction.
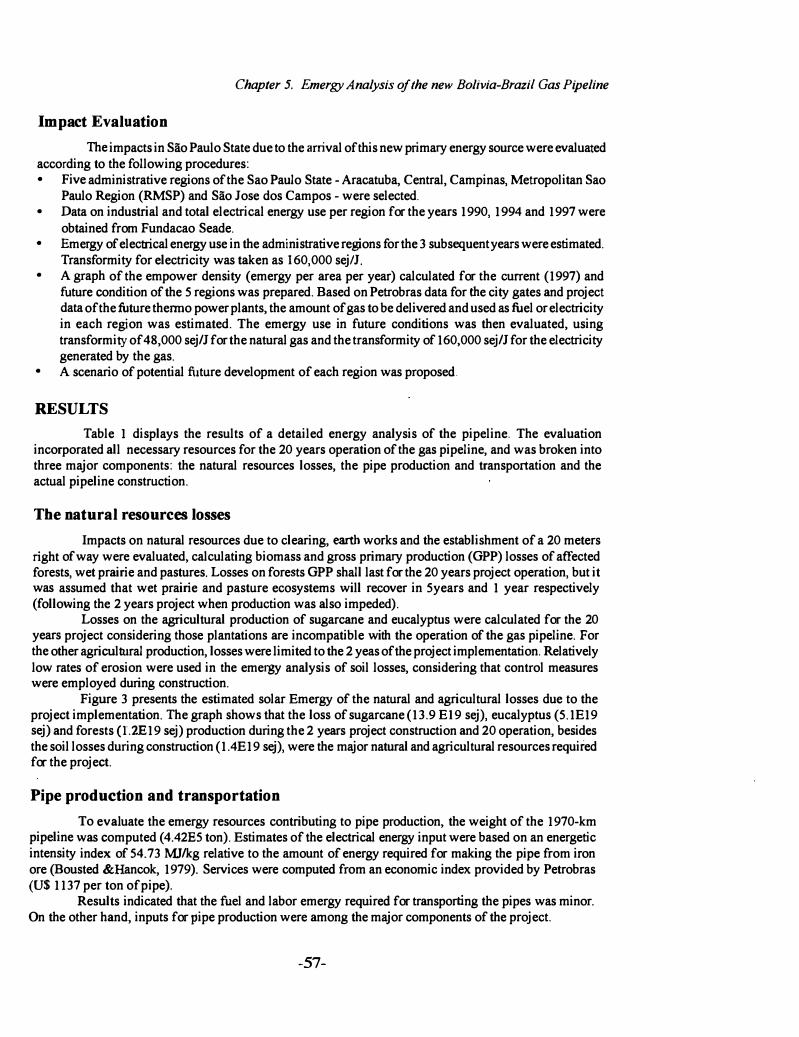
Figure 3 presents the estimated solar Emergy of the natural and agricultural losses due to the project implementation. The graph shows that the loss of sugarcane (13.9 EI9 sej), eucalyptus (5.1E19 sej) and forests (L2E 19 sej) production during the 2 years project construction and 20 operation, besides the soil losses during construction (1.4E19 sej), were the major natural and agricultural resources required for the project.
Pipe production and transportation
To evaluate the emergy resources contributing to pipe production, the weight of the 1970-km pipeline was computed (4.42E5 ton). Estimates of the electrical energy input were based on an energetic intensity index of 54.73 MJ/kg relative to the amount of energy required for making the pipe from iron ore (Bousted &Hancok, 1979). Services were computed from an economic index provided by Petrobras (U$ 1137 per ton ofpipe).
Results indicated that the fuel and labor emergy required for transporting the pipes was minor. On the other hand, inputs for pipe production were among the major components of the project.
-57-
Chapter 5. Emergy Analysis of the new Bolivia-Brazil Gas Pipeline
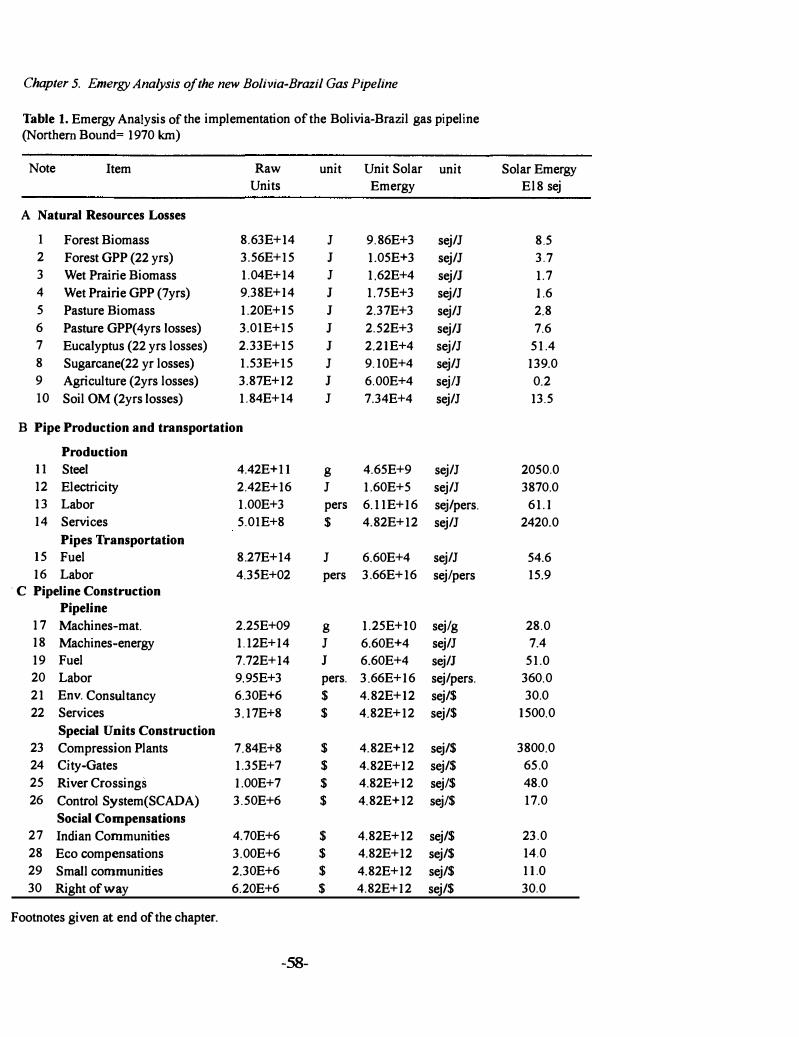
Table 1. Emergy Analysis of the implementation of the Bolivia-Brazil gas pipeline (Northern Bound= 1970 Ian)
Note Item Raw unit Unit Solar unit Solar Emergy Units Emergy El8 sej
A Natural Resources Losses
I Forest Biomass 8.63E+14 J 9. 86E+3 sej/J 8.S 2 Forest GPP (22 yrs) 3.S6E+IS J 1.0SE+3 sej/J 3.7 3 Wet Prairie Biomass 1.04E+14 J 1.62E+4 sej/J 1.7 4 Wet Prairie GPP (7yrs) 9.38E+14 J 1.7SE+3 sej/J 1.6 S Pasture Biomass 1.20E+IS J 2.37E+3 sej/J 2.8
6 Pasture GPP(4yrs losses) 3.0IE+IS J 2.S2E+3 sej/J 7.6 7 Eucalyptus (22 yrs losses) 2.33E+IS J 2.2IE+4 sej/J SI.4 8 Sugarcane(22 yr losses) I.S3E+IS J 9.IOE+4 sej/J 139.0 9 Agriculture (2yrs losses) 3.87E+12 J 6.00E+4 sejlI 0.2
JO Soil OM (2yrs losses) 1.84E+14 J 7.34E+4 sej/J 13.S
B Pipe Production and transportation
Production
II Steel 4.42E+II g 4.6SE+9 sej/J 20S0.0 12 Electricity 2.42E+16 J 1.60E+S sej/J 3870.0 13 Labor 1.00E+3 pers 6.IIE+16 sej/pers. 61.1 14 Services S.0IE+8 $ 4.82E+12 sej/J 2420.0
Pipes Transportation
IS Fuel 8.27E+14 J 6.60E+4 sej/J S4.6 16 Labor 4.35E+02 pers 3.66E+16 sejlpers IS.9
. C Pipeline Construction
Pipeline
17 Machines-mat. 2.2SE+09 g 1.2SE+JO sejlg 28.0 18 Machines-energy 1.12E+14 J 6.60E+4 sej/J 7.4
19 Fuel 7.72E+14 J 6.60E+4 sej/J SI.O 20 Labor 9.9SE+3 pers. 3.66E+16 sej/pers. 360.0
21 Env. Consultancy 6.30E+6 $ 4.82E+I2 sej/$ 30.0
22 Services 3. 17E+8 $ 4.82E+12 sej/$ IS00.0
Special Units Construction
23 Compression Plants 7. 84E+8 $ 4.82E+12 sej/$ 3800.0
24 City-Gates 1.3SE+7 $ 4.82E+12 sej/$ 6S.0
2S River Crossings 1.00E+7 $ 4.82E+12 sejl$ 48.0
26 Control System(SCADA) 3.S0E+6 $ 4.82E+12 sejl$ 17.0
Social Compensations
27 Indian Communities 4.70E+6 $ 4.82E+12 sej/$ 23.0
28 Eco compensations 3.00E+6 $ 4.82E+12 sej/$ 14.0
29 Small communities 2.30E+6 $ 4.82E+12 sej/$ II.O
30 Right of way 6.20E+6 $ 4.82E+12 sej/$ 30.0
Footnotes given at end of the chapter.
-58-
Chapter 5. Emergy Analysis of the new Bolivia-Brazil Gas Pipeline
16
14
12 � .'i? �
10 0. .... Isl .... 8 �
I 6
4
2
0 tl
J � .! i :a I
! 0 'l'I
» ." 'lII 0
� � '"
<Ii
Figure 3. Emergy of natural and agricultural resource losses due to project implementation
Pipeline Construction
The evaluation of the emergy that went on the pipeline construction included the depreciation of the heavy machines, the fuel and labor used. Also the engineering services for the construction, the design and environmental control were incorporated. Emergy of goods and services for the compression plants and city-gates, and for the compensation projects for the affected communities, Indians reserves and environmentally protected areas were computed based on the Brazilian emeIgy/dollar ratio (Comar, 1998).
Table 1 presents the emergy inputs to the pipeline construction, where the compression stations with heavily equipped units represented the highest emergy input. Results indicated that the construction of the pipeline required intense laborpower, and labor was among major input to the pipeline implementation.
Emergy for project implementation
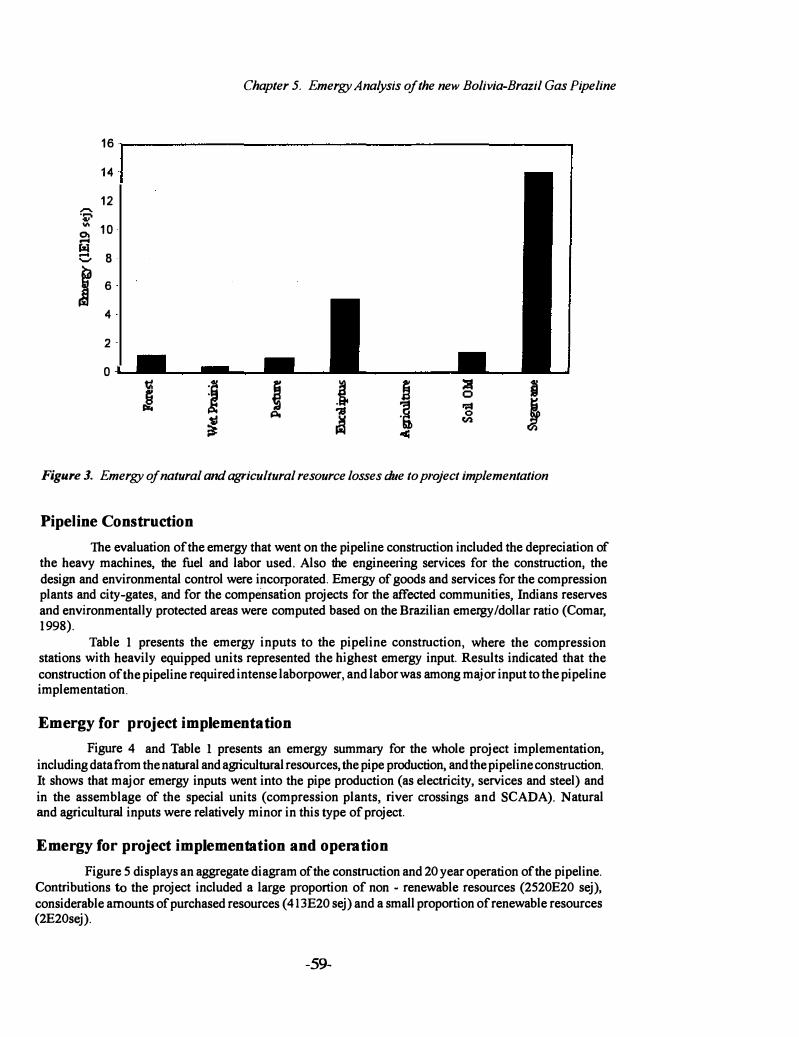
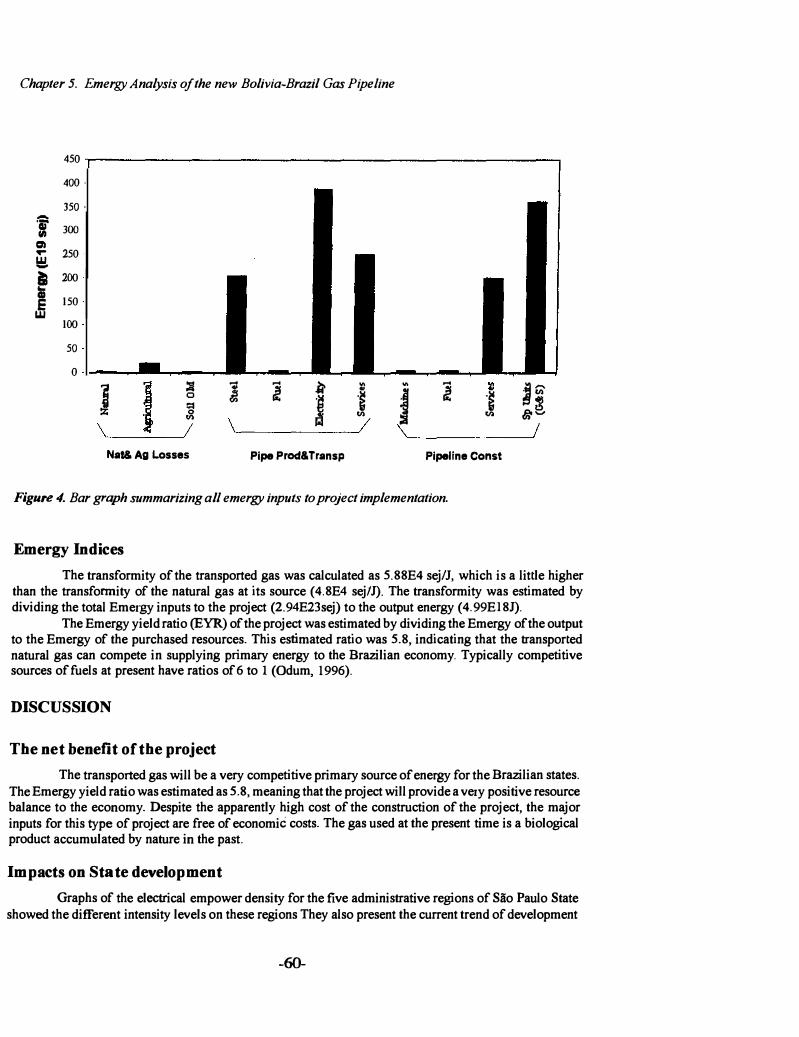
Figure 4 and Table 1 presents an emergy summary for the whole project implementation, including data from the natural and agriCUltural resources, the pipe production, and the pipeline construction. It shows that major emergy inputs went into the pipe production (as electricity, services and steel) and in the assemblage of the special units (compression plants, river crossings and SCADA). Natural and agricultural inputs were relatively minor in this type of project.
Emergy for project implementati on and operation
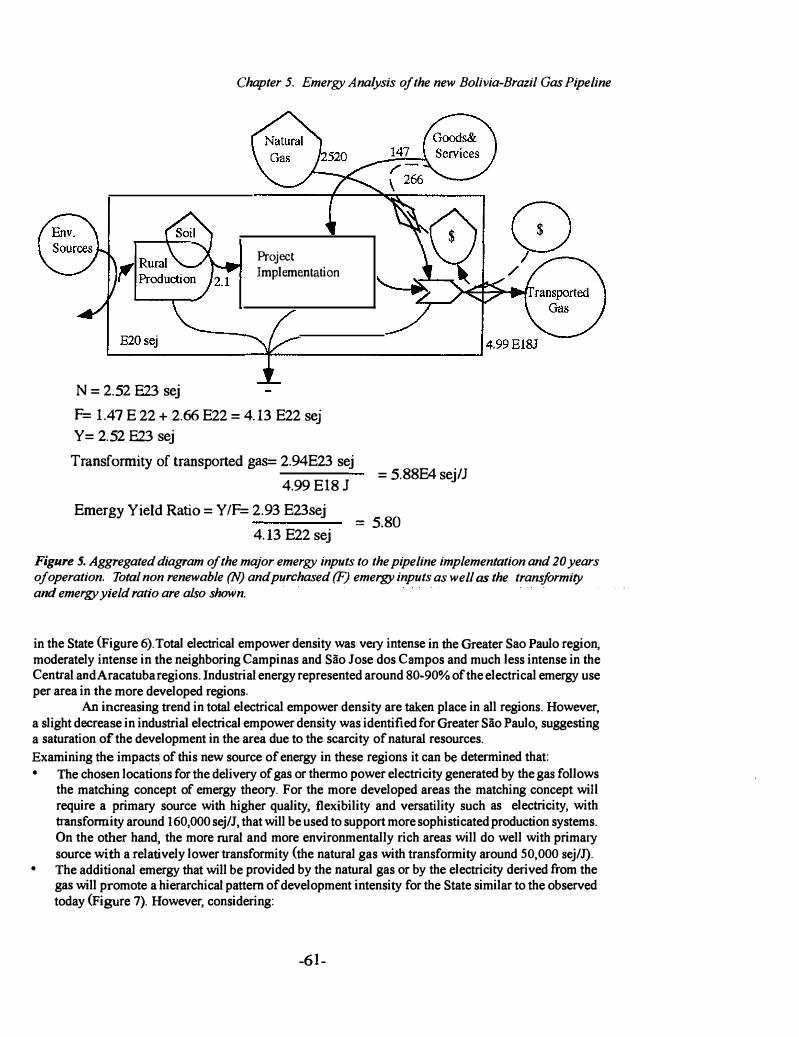
Figure 5 displays an aggregate diagram of the construction and 20 year operation of the pipeline. Contributions to the project included a large proportion of non - renewable resources (2520E20 sej), considerable amounts of purchased resources (413E20 sej) and a small proportion of renewable resources (2E20sej).
-59-
Chapter 5. Emergy Analysis of the new Bolivia-Brazil Gas Pipeline
450
400
350
� 300 "" Q ... 250 W -
� 200 "-CD
150 E W
100
50
0
J J :II .: 0 � .. 0 '"
\ \ /
- g � � - � i� J! •
j J! .� .� .� .ll'i! � '" '"
I \ ! Nal& Ag Losses Pipe Prod& Transp Pipeline Const
Figure 4. Bar graph summarizing all emergy inputs to project implementation.
Emergy Indi c es
The transformity of the transported gas was calculated as 5.88E4 sej/J, which is a little higher than the transformity of the natural gas at its source (4.8E4 sejl1). The transformity was estimated by dividing the total Emergy inputs to the project (2.94E23sej) to the output energy (4.99EI81).
The Emergy yield ratio (EYR) of the project was estimated by dividing the Emergy of the output to the Emergy of the purchased resources. This estimated ratio was 5.8, indicating that the transported natural gas can compete in supplying primary energy to the Brazilian economy. Typically competitive sources of fuels at present have ratios of 6 to 1 (Odum, 1996).
DISCUSSION
The net benefit of the project
The transported gas will be a very competitive primary source of energy for the Brazilian states. The Emergy yield ratio was estimated as 5.8, meaning that the project will provide a very positive resource balance to the economy. Despite the apparently high cost of the construction of the project, the major inputs for this type of project are free of economic costs. The gas used at the present time is a biological product accumulated by nature in the past.
Impacts on State development
Graphs of the electrical empower density for the five administrative regions of Sao Paulo State showed the different intensity levels on these regions They also present the current trend of development
-60-
Chapter 5. Emergy Analysis of the new Bolivia-Brazil Gas Pipeline
Project Implementation
o /
L.....E_2_0
_Se
_j _____ -1F-__________ -I4.99 El83
N = 2.52 E23 sej
F= 1.47 E 22 + 2.66 E22 = 4.13 E22 sej
Y = 2.52 E23 sej
Transformity of transported gas= 2.94E23 sej
4.99 E18J
Emergy Yield Ratio = Y IF= 2.93 E23sej
4.13 E22 sej
= 5.88E4 sejl]
= 5.80
Figure 5. Aggregated diagram of the major emergy inputs to the pipeline implementation and 20 years of operation. Total non renewable (N) and purchased (F) emergy inputs as well as the transformity and emergy yield ratio are also shawn.
in the State (Figure 6). Total electrical empower density was very intense in the Greater Sao Paulo region, moderately intense in the neighboring Campinas and Sao Jose dos Campos and much less intense in the Central and Aracatuba regions. Industrial energy represented around 80-90% of the electrical emergy use per area in the more developed regions.
An increasing trend in total electrical empower density are taken place in all regions. However, a slight decrease in industrial electrical empower density was identified for Greater Sao Paulo, suggesting a saturation of the development in the area due to the scarcity of natural resources. Examining the impacts. of this new source of energy in these regions it can be determined that: • The chosen locations for the delivery of gas or thermo power electricity generated by the gas follows
the matching concept of emergy theory. For the more developed areas the matching concept will require a primary source with higher quality, flexibility and versatility such as electricity, with transformity around 160,000 sej/J, that will be used to support more sophisticated production systems. On the other hand, the more rural and more environmentally rich areas will do well with primary source with a relatively lower transformity (the natural gas with transformity around 50,000 sej/J).
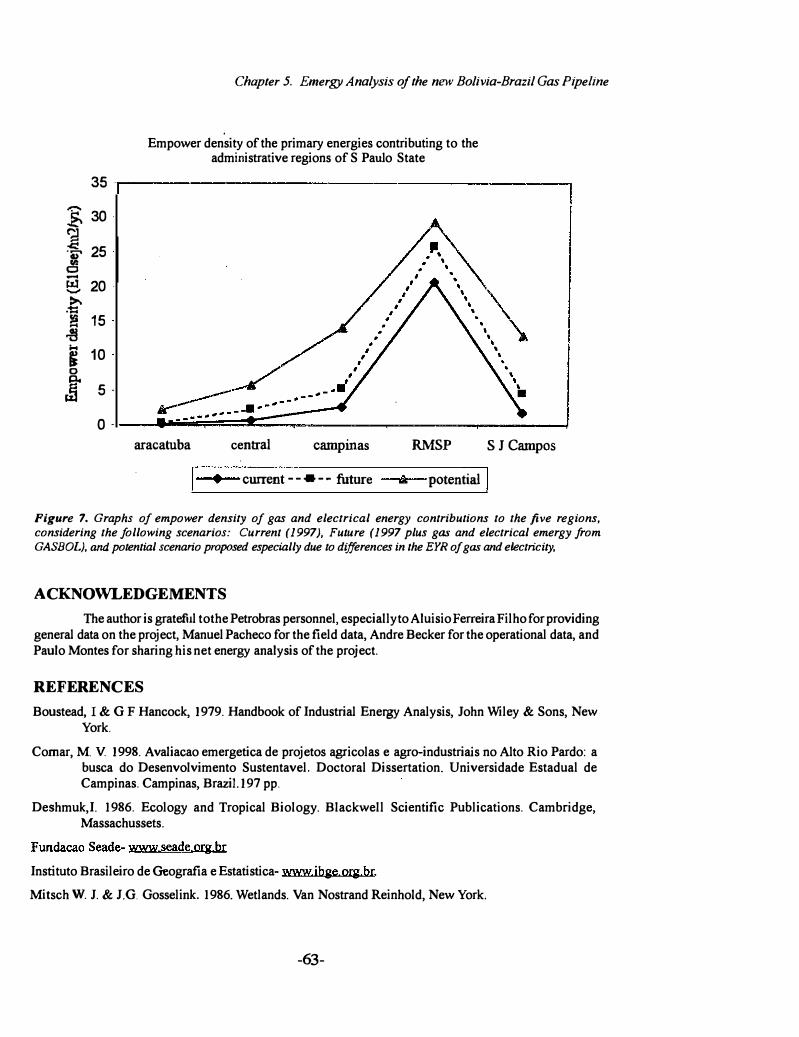
• The additional emergy that will be provided by the natural gas or by the electricity derived from the gas will promote a hierarchical pattern of development intensity for the State similar to the observed today (Figure 7). However, considering:
-61-
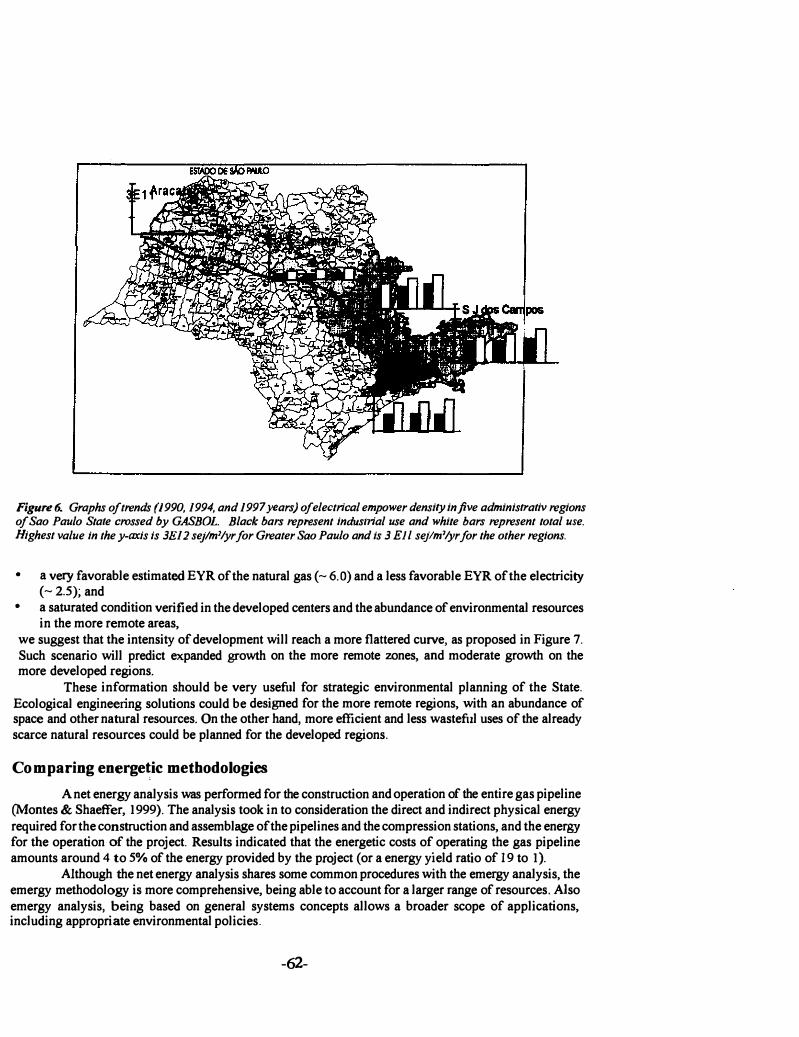
Figure 6. Graphs of trends (1990, 1994, and 1997 years) of electrical empower density in five administrativ regions of Sao Paulo State crossed by GASBOL. Black bars represent industrial use and while bars represent total use. Highest value in the y-axis is 3E12 sejlm'lyr for Greater Sao Paulo and is 3 Ell sejlm'lyr for the other regions.
• a very favorable estimated EYR of the natural gas (- 6.0) and a less favorable EYR of the electricity (- 2.5); and
• a saturated condition verified in the developed centers and the abundance of environmental resources in the more remote areas,
we suggest that the intensity of development will reach a more flattered curve, as proposed in Figure 7. Such scenario will predict expanded growth on the more remote zones, and moderate growth on the more developed regions.
These information should be very useful for strategic environmental planning of the State. Ecological engineering solutions could be designed for the more remote regions, with an abundance of space and other natural resources. On the other hand, more efficient and less wasteful uses of the already scarce natural resources could be planned for the developed regions.
Comparing energeti c methodologies
A net energy analysis was performed for the construction and operation of the entire gas pipeline (Montes & Shaeffer, 1999). The analysis took in to consideration the direct and indirect physical energy required for the construction and assemblage of the pipelines and the compression stations, and the energy for the operation of the project. Results indicated that the energetic costs of operating the gas pipeline amounts around 4 to 5% of the energy provided by the project (or a energy yield ratio of 19 to I).
Although the net energy analysis shares some common procedures with the emergy analysis, the emergy methodology is more comprehensive, being able to account for a larger range of resources. Also emergy analysis, being based on general systems concepts allows a broader scope of applications, including appropriate environmental policies.
-62-
Chapter 5. Emergy Analysis of the new Bolivia-Brazil Gas Pipeline
]: � j;! . iii'
.. <::> -� ..., >.
.-= !!!
� ....
rJ 0
I
35
30
25
20
15
10
5
0
Empower density of the primary energies contributing to the administrative regions of S Paulo State
aracatuba central campinas RMSP S J Campos
• current --.. -- future oil; potential I Figure 7. Graphs of empower density of gas and electrical energy contributions to the five regions, considering the following scenarios: Current (1997), Future (1997 plus gas and electrical emergy from GASBOL). and potential scenario proposed especially due to differences in the EYR of gas and electricity.
ACKNOWLEDGEMENTS
The autbor is grateful totbe Petrobras personnel. especially toAluisio Ferreira Filho for providing general data on the project. Manuel Pacheco for the field data, Andre Becker for the operational data. and Paulo Montes for sharing his net energy analysis of the project.
REFERENCES
Boustead. 1& G F Hancock, 1979. Handbook of Industrial Energy Analysis, John Wiley & Sons, New York.
Comar, M. V 1998. Avaliacao emergetica de projetos agricolas e agro-industriais no Alto Rio Pardo: a busca do Desenvolvimento Sustentavel. Doctoral Dissertation. Universidade Estadual de Campinas. Campinas, Brazil. 197 pp.
Deshmuk,I. 1986. Ecology and Tropical Biology. Blackwell Scientific Publications. Cambridge, Massachussets.
Fundacao Seade- www .eade m:g br
Instituto Brasileiro de Geografia e Estatistica- wwwibge Oll! br
Mitsch W. 1. & 1.G. Gosselink. 1986. Wetlands. Van Nostrand Reinhold, New York.
-63-
Chapter 5. Emergy Analysis of the new Bolivia-Brazil Gas Pipeline
Montes, P.M.F. & R. Shaeffer. 1999. Analise Energetica de Sistema de Transporte de Gas. Presented at the 2,d Brazilian Seminar on Pipes. 13 pp.
Odum, H. T. 1996. Environmental Accounting. John Wiley and Sons, Inc. New York ..
Odum H. T. & J. A. Arding. 1991. Emergy Analysis of Shrimp Mariculture in Equador. Report to Coastal Studies Institute. Univ. of Rhode Island, Narragansett. Center for Wetlands, Gainesville, 87 pp.
Padro, M. A. & M.T. Brown. 1997. Interface ecosystems with an oil spill in a Venezuelan tropical savannah. Ecological Engineering, vol. 8, 49-78 pp.
Petrobrasl Biodinamical Prime Engenharia, 1997- Documentos para LI- Detalhamento dos Programas de Controle Ambiental da Parte Brasileira do gasoduto- Volumes I and II.
Petrobrasl Segen/Gasbol, 1996. Gasoduto Bolivia- Brasil - Estudo de Impacto Ambiental- Relatorio Consoli dado.
Schlesinger w.H. 1991. Biogeochemistry: analysis of the global change. Academic Press, San Diego, California.
Sinisgalli, P. A. A. 1997. Analise do Fluxo energetico-aplicacao ao caso da cadeia produtiva da celulose. Master Thesis. Universidade de Sao Paulo, Silo Paulo, Brazil, JJSpp.
-64-
Chapter 5. Emergy Analysis of the new Bolivia-Brazil Gas Pipeline
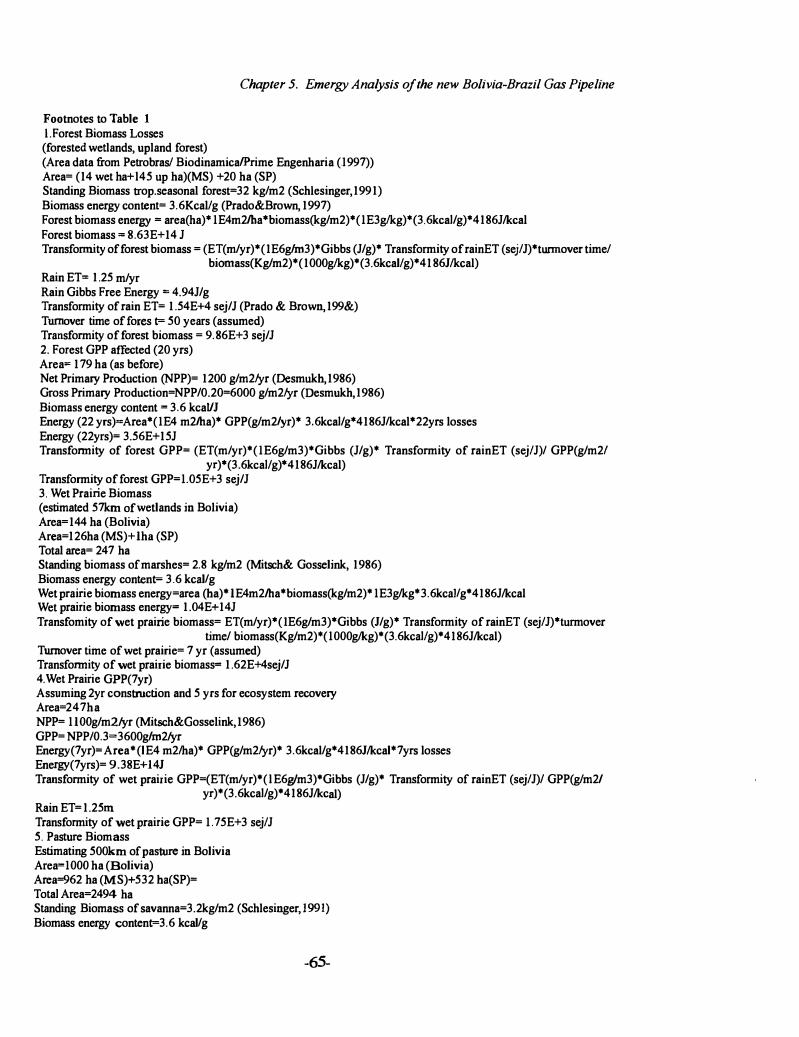
Footnotes to Table 1 i.Forest Biomass Losses
(forested wetlands, upland forest) (Area data from Petrobrasl BiodinamicalPrime Engenharia (1997)) Area= (14 wet ha+ l45 up ha)(MS) +20 ha (SP) Standing Biomass trop.seasonal forest=32 kg/m2 (Schiesinger,1991) Biomass energy content= 3.6Kcallg (Prado&Brown, 1997) Forest biomass energy = area(ha)*IE4m2lha*biomass(kg/m2)*(IE3glkg)*(3.6kcal/g)*4186Jlkcal Forest biomass = 8.63E+14 J Transformity of forest biomass = (ET(m/yr)*(1E6g!m3)*Gibbs (J/g)* Transformity of rainET (sejlJ)*turmover timel
biomass(Kg/m2)*( 1000glkg)*(3.6kcallg)*4186Jlkcal) Rain ET= 1.25 m/yr Rain Gibbs Free Energy = 4.94J/g Transformity of rain ET= 1.54E+4 sej/J (Prado & Brown, 199&) Turnover time of fores t= 50 years (assumed) Transformity of forest biomass = 9. 86E+3 sej/J 2. Forest GPP affected (20 yrs) Area= 179 ha (as before) Net Primary Production (NPP)= 1200 g/m2lyr (Desmukh,1986) Gross Primary Production=NPP/0.20=6000 g/m2lyr (Desmukh,1986) Biomass energy content = 3.6 kcaUJ Energy (22 yrs)=Area*(IE4 m2lha)* GPP(g!m2/yr)* 3.6kcal/g*4186Jlkcal*22yrs losses Energy (22yrs)= 3.56E+15J Transformity of forest GPP= (ET(mIyr)*(IE6g/m3)*Gibbs (J/g)* Transformity of rainET (sejlJ)1 GPP(g/m21
yr )*(3. 6kcallg) * 4186Jlkcal) Transformity of forest GPP=I.05E+3 sej/J 3. Wet Prairie Biomass (estimated 57km of wetlands in Bolivia) Area= 144 ha (Bolivia) Area= 126ha (MS)+ Iha (SP) Total area= 247 ha Standing biomass of marshes= 2.8 kg/m2 (Mitsch& Gosselink, 1986) Biomass energy content= 3.6 kcallg Wet prairie biomass energy=area (ha)*IE4m2Iha*biomass(kg/m2)*IE3g1kg*3.6kcallg*4186Jlkcal Wet prairie biomass energy= 1.04E+14J Transfomity of wet prairie biomass= ET(m/yr)*(1E6g/m3)*Gibbs (J/g)* Transformity of rainET (sejlJ)*turmover
time! biomass(Kg/m2)*(IOOOglkg)*(3.6kcallg)*4186Jlkcal) Turnover time of wet prairie= 7 yr (assumed) Transformity of wet prairie biomass= 1.62E+4sej/J 4.Wet Prairie GPP(7yr) Assuming 2yr construction and 5 yes for ecosystem recovery Area=247ha NPP= IIOOg/m2Iyr (Mitsch&Gosselink,1986) GPP= NPPIO.3=3600g!m2Iyr Energy(7yr)= Area*(lE4 m2Iha)* GPP(g/m2lyr)* 3.6kcal/g*4186Jlkcal*7yrs losses Energy(7yrs)= 9.38E+l4J Traosformity of wet prairie GPP=(ET(m/yr)*( lE6g/m3)*Gibbs (J/g)* Transformity of rainET (sejlJ)! GPP(g!m2i
yr)*(3.6kcal/g)*4186Jlkcal) Rain ET= 1.25m Transformity of wet prairie GPP= I. 75E+3 sejlJ 5. Pasture Biomass Estimating 500km of pasture in Bolivia Area=IOOO ha (Bolivia) Area=962 ha (MS)+532 ha(SP)= Total Area=2494 ha Standing Biomass of savanna=3.2kg/m2 (Schlesinger, 1991) Biomass energy content=3.6 kcallg
-65-
Chapter 5. Emergy Analysis oj the new Bolivia-Brazil Gas Pipeline
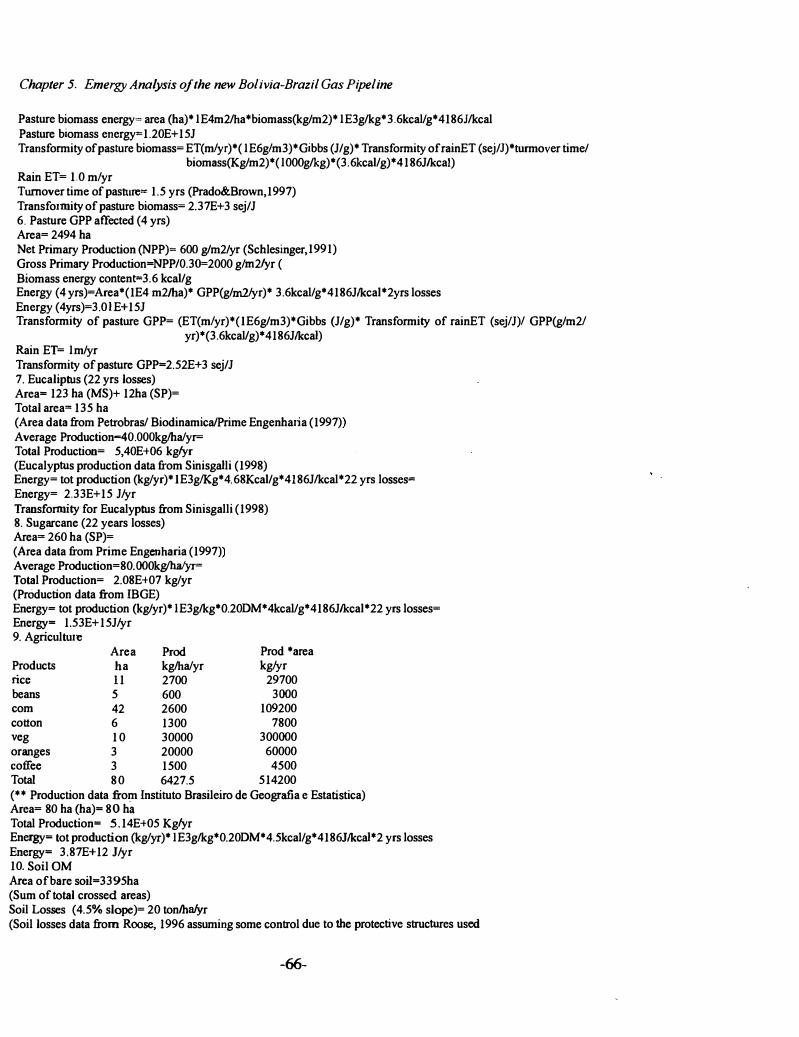
Pasture biomass energy� area (ha)*IE4m2/ha*biomass(kglm2)*IE3g/kg*3.6kcallg*4186J/kcal Pasture biomass energy�1.20E+15J Transformity of pasture biomass� ET(m1yr)*( IE6g1m3)*Gibbs (J/g)* Transformity of rainET (sejlJ)*turmover timel
biomass(Kglm2)*( I 000g/kg)*(3. 6kcai/g)*4186J/kcal) Rain ET� 1. 0 m1yr Turnover time of pasture� 1.5 yrs (Prado&Brown,1997) Transformity of pasture biomass� 2.37E+3 sej/J 6. Pasture GPP affected (4 yrs) Area� 2494 ha Net Primary Production (NPP)= 600 g/m2/yr (Schlesinger, 1991) Gross Primary Production=NPP/O.3�2000 g1m2/yr ( Biomass energy contenr-3.6 kcai/g Energy (4 yrs)=Area*(1E4 m2tha)* GPP(glrn2lyr)* 3.6kcallg*4186Jlkcai*2yrs losses Energy (4yrs)=3.0 i E+15J Transformity of pasture GPP= (ET(m1yr)*(IE6g/m3)*Gibbs (J/g)* Transformity of rainET (sejlJ)1 GPP(glm21
yr)*(3.6kcal/g)*4186Jlkcai) Rain ET= Imlyr Transformity of pasture GPP=2.52E+3 sej/J 7. Eucaliptus (22 yrs losses) Area= 123 ha (MS)+ 12ha (SP)= Total area= 135 ha (Area data from Petrobrasl BiodinamicalPrime Engenharia (1997» Average Production-lO.OOOkglhalyr= Total Production� 5,40E+06 kg/yr (Eucalyptus production data from Sinisgaili (1998) Energy� tot production (kglyr)*IE3g1Kg*4.68Kcai/g*4186J/kcal*22 yrs losserEnergy= 2.33E+15 Jlyr Transformity for Eucalyptus from Sinisgalli (1998) 8. Sugarcane (22 years losses) Area� 260 ha (SP)= (Area data from Prime Engenharia (1997» Average Production�80.000kglha/yr= Total Production� 2.08E+07 kglyr (Production data from IBGE) Energy� tot production (kglyr)*IE3g/kg*0.20DM*4kcal/g*4186J/kcai*22 yrs losses� Energy= 1.53E+ 15Jlyr 9. Agriculture
Area Prod Prod *area Products ha kglhalyr kglyr rice !1 2700 29700 beans 5 600 3000 com 42 2600 109200 cotton 6 1300 7800 veg 1 0 30000 300000 oranges 3 20000 60000 coffee 3 1500 4500 Total 80 6427.5 514200 (** Production data from Instituto Brasileiro de Geografia e Estatistica) Area� 80 ha (ha)= 80 ha Total Production= 5.14E+05 Kg/yr Energy= tot production (kglyr)*IE3g/kg*0.20DM*4.5kcallg*4186Jlkcai*2 yrs losses Energy= 3.87E+ 12 Jlyr 10. Soil OM Area of bare soil=3395ha (Sum of total crossed areas) Soil Losses (4.5% slope)= 20 tonlhalyr (Soil losses data from Roose, 1996 assuming some control due to the protective structures used
-66-
Chapter 5. Emergy Analysis of the new Bolivia-Brazil Gas Pipeline
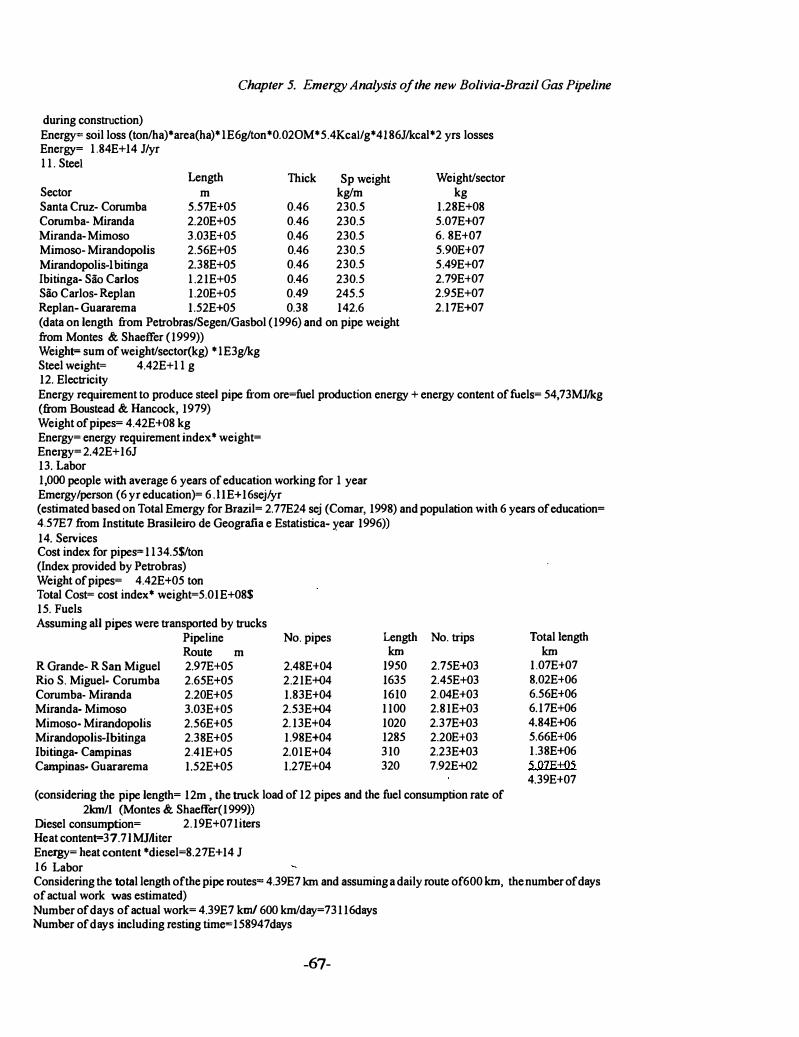
during construction) Energy= soil loss (tonlha)*area(ha)*IE6g/ton*0.020M*5.4Kcal/g*4186Jlkcal*2 yrs losses Energy= I. 84E+ 14 J/yr II. Steel
Length Thick Sp weight Sector m kglm Santa Cruz- Corumba 5.57E+05 0.46 230.5 Corumba- Miranda 2.20E+05 0.46 230.5 Miranda- Mimoso 3.03E+05 0.46 230.5 Mimosa- Mirandopolis 2.56E+05 0.46 230.5 Mirandopolis-Ibitinga 2.38E+05 0.46 230.5 Ibitinga- SOO Carlos I.21E+05 0.46 230.5 Sao Carlos- Replan 1.20E+05 0.49 245.5 Replan- Guararema 1.52E+05 0.38 142.6 (data on length from Petrobras/SegeniGasbol (1996) and on pipe weight from Montes & Shaeffer (1999)) Weight= sum ofweightlsector(kg) *IE3g1kg Steel weight= 4.42E+ II g 12. Electricity
Weightlsector kg
1.28E+08 5.07E+07 6. 8E+07 5.90E+07 5.49E+07 2.79E+07 2.95E+07 2.17E+07
Energy requirement to praduce steel pipe from ore=fuel production energy + energy content offuels= 54,73MJlkg (from Boustead & Hancock, 1979) Weight of pipes= 4.42E+08 kg Energy= energy requirement index· weight= Energy= 2.42E+16J 13. Labor 1,000 people with average 6 years of education working for I year Emergy/person (6 yr education)= 6 . lIE+16sejlyr (estimated based on Total Emergy for Brazil= 2.77E24 sej (Comar, 1998) and population with 6 years of education= 4.57E7 from Institute Brasileira de Geografia e Estatistica- year 1996» 14. Services
.
Cost index for piper-1I34.5$1ton (Index provided by Petrobras) Weight of pipes= 4.42E+05 ton Total Cost= cost index* weight=5.0IE+08$ 15. Fuels Assuming all pipes were transported by trucks
Pipeline Route m
R Grande- R San Miguel 2.97E+05 Rio S. Miguel- Corumba 2.65E+05 Corumba- Miranda 2.20E+05 Miranda- Mimoso 3.03E+05 Mimosa- Mirandopolis 2.56E+05 Mirandopolis-Ibitinga 2.38E+05 Ibitinga- Caropinas 2.41E+05 Carnpinas- Guararema 1.52E+05
No. pipes
2.48E+04 2.21E+04 1.83E+04 2.53E+04 2. 13E+04 1.98E+04 2.0IE+04 1.27E+04
Length No. trips km
1950 2.75E+03 1635 2.45E+03 1610 2.04E+03 1100 2.81E+03 1020 2.37E+03 1285 2.20E+03 310 2.23E+03 320 7.92E+02
(considering the pipe length= 12m , the truck load of 12 pipes and the fuel consumption rate of 2kmII (Montes & Shaeffer(I999»
Diesel consumption= 2.19E+071iters Heat content=37. 7 l MJIliter Energy= heat content *diesel=8.27E+ 14 J 16 Labor
Total length km
1.07E+07 8.02E+06 6.56E+06 6.17E+06 4.84E+06 5.66E+06 1.38E+06 � QZE+O� 4.39E+07
Considering the total length of the pipe routes= 4.39E7 km and assuming a daily route of600 km, the number of days of actual work was estimated) Number of days of actual work= 4.39E7 kml600 kmlday=73116days Number of days including resting time=158947days
-67-
Chapter 5. Emergy Analysis of the new Bolivia-Brazil Gas Pipeline
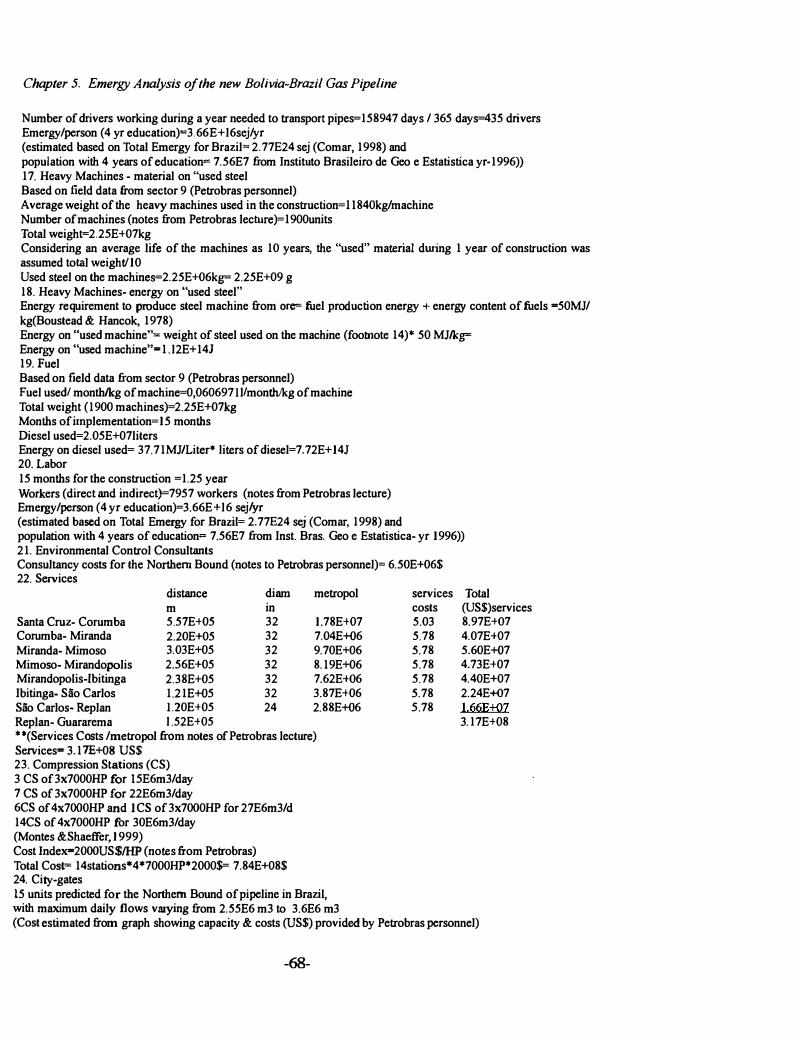
Number of drivers working during a year needed to transport pipes�158947 days / 365 days�435 drivers Emergy/person (4 yr education)�3.66E+l6sej/yr (estimated based on Total Emergy for Brazil� 2.77E24 sej (Comar, 1998) and population with 4 years of education� 7.56E7 from Instituto Brasileiro de Geo e Estatistica yr-1996)) 17. Heavy Machines - material on "used steel Based on field data from sector 9 (Petrobras personnel) Average weight of the heavy machines used in the construction� I I 840kg/machine Number of machines (notes from Petrobras lecture)� 1900units Total weighF2.2SE+07kg Considering an average life of the machines as 10 years, the "used" material dwing 1 year of construction was assumed total weight! 10 Used steel on the machine�2.25E+06k� 2.25E+09 g 18. Heavy Machines- energy on "used steel" Energy requirement to produce steel machine from 0_ fuel production energy + energy content of fuels =50MJ/ kg(Boustead & Hancok, 1978) Energy on "used machine"= weight of steel used on the machine (footnote 14)* 50 MJ/k� Energy on "used machine"=1.l2E+14J 19. Fuel Based on field data from sector 9 (Petrobras personnel) Fuel used! month/kg of machine�0,060697Jl1month/kg of machine Total weight (1900 machines)�2.25E+07kg Months of iroplementation�15 months Diesel used�2.05E+07liters Energy on diesel used� 37.71MJlLiter' liters of diesel�7.72E+14J 20. Labor 15 months for the construction � 1.25 year Workers (direct and indirectF7957 workers (notes from Petrobras lecture) Emergy/person (4 yr education)�3.66E+l6 sejlyr (estimated based on Total Emergy for Brazil� 2.77E24 sej (Comar, 1998) and population with 4 years of education= 7.56E7 from Inst. Bras. Geo e Estatistica- yr 1996)) 21. Environmental Control Consultants Consultancy costs for the Northern Bound (notes to Petrobras personnel)= 6.50E+06$ 22. Services
distance m
Santa Cruz- Corumba 5.57E+05 Corumba- Miranda 2.20E+05 Miranda- Mimoso 3.03E+05 Mimoso- Mirandopolis 2.56E+05 Mirandopolis-Ibitinga 2.38E+05 Ibitinga- Sao Carlos 1.21E+05 Sao Carlos- Replan L20E+05 Replan- Guararema l.52E+05
diarn in 32 32 32 32 32 32 24
metropol
1.78E+07 7.04E+06 9.70E+06 8.19E+06 7.62E+06 3.87E+06 2.88E+06
"(Services Costs / metropol from notes of Petrobras lecture) Services= 3.1 7E+08 US$ 23. Compression Stations (CS) 3 CS of 3x7000HP for ISE6m3/day 7 CS of 3x7000HP for 22E6m3/day 6CS of 4x7000HP and ICS of 3x7000HP for 27E6m3/d 14CS of 4x7000HP for 30E6m3/day (Montes &Shaeffer, 1999) Cost Index=2000US$1HP (notes from Petrobras) Total COSF 14stations*4'7000HP'2000� 7.84E+08$ 24. City-gates 15 units predicted for the Northern Bound of pipeline in Brazil, with maximum daily flows varying from 2.55E6 m3 to 3.6E6 m3
services costs 5.03 5.78 5.78 5.78 5.78 5.78 S.78
Total (US$)services 8.97E+07 4.07E+07 5.60E+07 4.73E+07 4.40E+07 2.24E+07 I 66E-H)7 3. 17E+08
(Cost estimated from graph showing capacity & costs (US$) provided by Petrobras personnel)
-68-
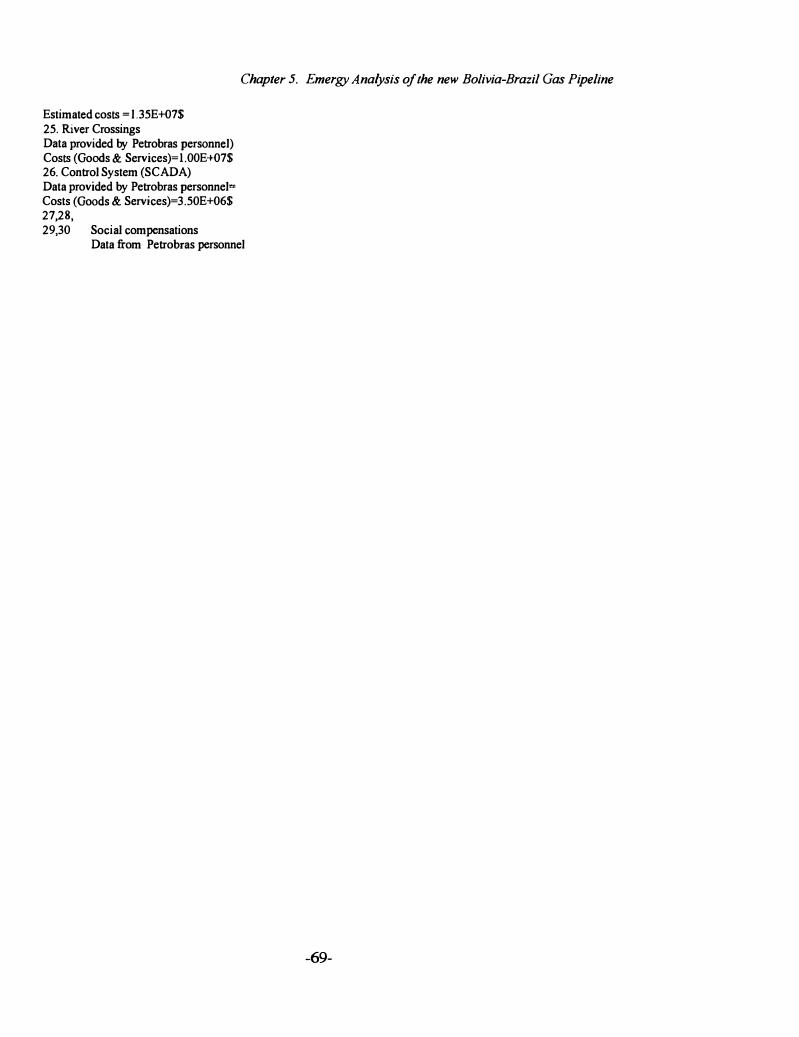
Estimated costs � l.35E+07$ 25. River Crossings Data provided by Petrobras personnel) Costs (Goods & Services)�1.00E+07$ 26. Control System (SCADA) Data provided by Petrobras personnel� Costs (Goods & Services)�3.50E+06$ 27,28, 29,30 Social compensations
Chapter 5. Emergy Analysis of the new Bolivia-Brazil Gas Pipeline
Data from Petrobras personnel
-69-