emission estimation technique manual for...
TRANSCRIPT
National Pollutant Inventory
Emission estimation technique manual
for
Municipal Solid Waste (MSW) LandfillsVersion 2.0
February 2010
First published in November 1999Version 2.0 published February 2010
ISBN: 0 6425 4705X
Commonwealth of Australia 2008
This manual may be reproduced in whole or part for study or training purposes subject to the inclusion of an acknowledgment of the source. It may be reproduced in whole or part by those involved in estimating the emissions of substances for the purpose of National Pollutant Inventory (NPI) reporting. The manual may be updated at any time. Reproduction for other purposes requires the written permission of the Department of the Environment, Water, Heritage and the Arts, GPO Box 787, Canberra, ACT 2601, e-mail: [email protected], web: www.npi.gov.au, phone: 1800 657 945.
Disclaimer
The manual was prepared in conjunction with Australian states and territories according to the National Environment Protection (National Pollutant Inventory) Measure.
While reasonable efforts have been made to ensure the contents of this manual are factually correct, the Australian Government does not accept responsibility for the accuracy or completeness of the contents and shall not be liable for any loss or damage that may be occasioned directly or indirectly through the use of, or reliance on, the contents of this manual.
MSW LandfillVersion 2.0 February 2010
i

EMISSION ESTIMATION TECHNIQUES FOR
MUNICIPAL SOLID WASTE (MSW) LANDFILLSTABLE OF CONTENTS
1 INTRODUCTION 1
1.1 The NPI reporting process........................................................................11.2 Structured approach to reporting..............................................................21.3 Additional reporting materials..................................................................3
2 PROCESS DESCRIPTION 4
2.1 Waste management...................................................................................42.2 Landfill processes.....................................................................................5
3 EMISSION SOURCES 9
3.1 Emissions to air.........................................................................................93.2 Emissions to water....................................................................................93.3 Emissions to land....................................................................................10
4 THRESHOLD CALCULATIONS 11
4.1 Usage/storage thresholds........................................................................114.2 Fuel and electricity thresholds................................................................154.3 Nitrogen and phosphorus thresholds.......................................................16
5 EMISSION ESTIMATION TECHNIQUES 18
5.1 Direct measurement................................................................................185.2 Mass balance...........................................................................................185.3 Engineering calculations.........................................................................205.4 Emission factors......................................................................................205.5 Approved alternative...............................................................................21
6 TRANSFERS OF NPI SUBSTANCES 22
7 ADDITIONAL REPORTING INFORMATION 23
8 REFERENCES 24
APPENDIX A: ABBREVIATIONS AND DEFINITIONS 27
APPENDIX B: LEACHATE AND WASTE CHARACTERISATION DATA 28
APPENDIX C: EMISSIONS ESTIMATION MODELS – QUICK GUIDES FOR NPI REPORTING 37
Appendix D: Modifications to the MSW landfill emission estimation technique (EET) manual (Version 2.0, June 2008) to be finalised after review 41
MSW LandfillVersion 2.0 February 2010
ii

MSW LANDFILL
List of Figures
Figure 1 NPI reporting process...................................................................................................1Figure 2. Typical landfill design (Tasmanian Department of Primary Industries, 2004)...........5
List of Tables
TABLE 1. COMPOSITION (%) OF AUSTRALIAN SOLID URBAN WASTE 2002-2003..................4Table 2. Composition of biogas produced by anaerobic decomposition (EC, 2005).................9Table 3. Estimated threshold quantities of stored MSW for inorganic elements and Total
VOC...................................................................................................................................13Table B1 Composition of landfill leachate from Europe and North America (Kjeldsen et al., 2002).........................................................................................................................................28Table B2 Xenobiotic organic compounds in landfill leachate (Kjeldsen et al., 2002; IPPC, 2007).........................................................................................................................................29Table B3 Chemical composition of biodegradable MSW (concentration mg/kg dry weight
basis, unless stated otherwise)...........................................................................................30Table B4 Chemical composition of non-biodegradable MSW (potentially combustible).
Concentration mg/kg (dry weight basis)...........................................................................31Table B5 Chemical composition of non-biodegradable (and non-combustible) MSW.
Concentration in mg/kg dry weight basis..........................................................................32Table B6 Chemical composition of various types of waste......................................................33Table B7 Weighted average concentrations of inorganic elements in representative MSW
deposited in Australian landfills........................................................................................34Table B8 Dry/wet weight ratios for various types of biodegradable MSW (USEPA, 2006).. .35
MSW LandfillVersion 2.0 February 2010
iii

1 Introduction
1.1 The NPI reporting process
The purpose of all emission estimation technique (EET) manuals is to assist Australian manufacturing, industrial and service facilities to report emissions of listed substances to the National Pollutant Inventory (NPI). This manual describes the procedures and recommended approaches for estimating emissions from facilities engaged in municipal solid waste landfill activities.
EET MANUAL Municipal Solid Waste LandfillsANZSIC CODE 2006 2921 Waste treatment and disposal services
This manual has been developed through a process of national consultation involving state and territory environmental authorities and key industry stakeholders.
NPI substances are those that when emitted at certain levels have potential to be harmful. Australian, State and Territory governments have agreed, in response to international requirements, that industries will report these emissions on an annual basis. NPI substances are set out in the NPI Guide. Figure 1 provides an overview of the reporting process.
Figure 1 NPI reporting process
MSW LandfillVersion 2.0 February 2010
Step 1: Prepare a process flow chart for your facility(Identify waste management activities and ancillary processes
such as landfill gas flaring)
Step 2: Determine the emission and transfer sources (Characterise outflows such as leachate and landfill gas)
Step 3: Determine whether any thresholds have been exceeded(Quantify cumulative volumes of waste types deposited to landfill
and mass of substances based on monitoring)
Step 4: Estimate the emissions and transfers for your facility(Generally use modelling or direct measurements to determine
emissions)
Step 5: Report emissions to the NPI(Compile emissions and transfers data)
Refer to Section 4 Threshold
calculations
Refer to Section 2 Process description
Refer to Sections 5 and 6 Emissions estimation
and transfers
Refer to Section 3Emission sources
Refer to Section 7Next steps for reporting
1

1.2 Structured approach to reporting
The main tasks are consolidated below to provide a suggested approach to reporting. Box 1. Suggested approach for NPI reporting
Define the process flow Construct a system diagram for your landfill identifying:
a. the system boundary (this need not be the property boundary),b. inflow and handling of waste,c. landfill gas collection/management/combustion,d. leachate collection/management, ande. outflows (of landfill gas, leachate and products of burning or
treatment).
Characterise the landfill Dimensions of landfill: surface area (length, width, depth). Design capacity (tonnes MSW). Year landfill opened (and year closed if applicable). Gas collection system efficiency: if present. Leachate collection system efficiency: if present. Annual rainfall.
Characterise the wastes Estimate of the composition of deposited waste, especially the quantity of
biodegradable waste. Estimate of the quantity of waste deposited. Compile estimates for waste characteristics in past years.
Characterise landfill gas and leachate Compile any available monitoring data. Is landfill gas combusted by landfill operator or a separate company?
o If combusted by the landfill operator, then identify the characteristics of the flare or burner and pollutant control technology employed.
Estimate volume and fate of generated leachate (from hydrogeology models if available) and include treatment, recirculation or evaporation.
Reporting and quality assurance Determine which substances need to be included in the report. Estimate emissions for the relevant substances. Estimate transfers for the relevant substances and record the destination. Record the estimation techniques used and the reasons for any ‘significant
differences to the previous report’. Prepare and submit reports to NPI. Keep the above records, calculations and copies of reports.
In addition to the above tasks, regularly check the NPI website for the latest reporting information, access to other EETs, and other sources of advice. For site-specific issues, contact your State’s or Territory’s NPI Team for advice.
Australian NPI reporting is streamlined by international standards. Nonetheless, terms such as categories, substances and transfers have specific NPI definitions and the
MSW LandfillVersion 2.0 February 2010
2

reporting process may appear daunting. The suggested approach is intended to maximise the use of existing operational monitoring. Recording quantities of waste and monitoring environmental emissions are standard operations; the specific NPI aspect of these operations involves substances with potential risk to health or environment.
The NPI Guide provides the definitive description of the reporting process and this EET manual is intended to be used in conjunction with the NPI Guide.
1.3 Additional reporting materials
This manual is written to reflect the common processes employed by landfill facilities. In some cases it will be necessary to refer to other EET manuals to ensure a complete report of the emissions for the facility can be made. Other applicable EET manuals may include, but are not limited to:
Combustion in Boilers, Fuel and Organic Liquid Storage, Combustion Engines, and Fugitive Emissions.
MSW LandfillVersion 2.0 February 2010
3

2 Process description
2.1 Waste management
Landfill has been the most common method of managing solid waste in Australia. 32.4 million tonnes of solid waste were generated in 2002-2003 of which approximately 17.4 million tonnes was deposited in landfills (DEH, 2006, Productivity Commission, 2006, ABS, 2006 and 2007).
There are hundreds of operational landfills in Australia with hundreds more that have been closed, abandoned or converted to green space and recreational (sports) areas. The majority of landfills (closed and operational) are small, receiving less than 5,000 tonnes of waste per year.
With respect to NPI, landfills are atypical reporting facilities representing a permanent storage of unwanted materials in which input is dictated by the facility’s local catchments. Solid waste disposed of at a typical landfill may be categorised as having arisen from the following three main sources (Australian Waste Database, 1990 - 1998, DEH and CSIRO):
Municipal Waste arising from domestic premises: food, paper, and garden waste and from Council activities associated with servicing residential areas: street sweepings, tree lopping, parks and gardens, and litter bins.
Commercial and IndustrialWaste arising from institutional, commercial, industrial activities: generally containing higher proportions of metals and plastics than domestic waste.
Construction and DemolitionWaste arising from demolition and building activities: generally containing high proportions of inert material (concrete, bricks) and low proportions of other materials.
In 2003, 27% of urban waste in Australia was generated from municipal sources; 29% from commercial and industrial sources; and 42% from construction and demolition sources.
Table 1. Composition (%) of Australian solid urban waste 2002-2003. Composition Municipal Commercial
and IndustrialConstruction
and DemolitionOrganics (food and garden) 47 13 1Paper (and cardboard) 23 22 0Plastics 4 6 0Glass 7 2 0Metals 5 22 7Concrete (ceramics, stone) 3 3 82Timber 1 9 4Other 12 23 6
MSW LandfillVersion 2.0 February 2010
4

In the past three decades the focus of waste management has shifted and now reduction in waste generation and diversion of waste from deposition are major objectives for solid waste management (DEH 2006).
Recycling is a more resource intensive method of avoiding material disposal to landfill. Councils often operate kerbside collections for recyclables and organise special collections for bulky items. Individuals are also encouraged to transport recyclables to central facilities or collection stations. Further sorting takes place at both material recovery facilities and transfer stations. This form of waste management results in waste being recycled; converted to compost; used as a source of energy or deposited in landfill as the last option.
2.2 Landfill processes
In the past waste was deposited in ‘suitable locations’ such as natural hollows, old quarries and mine sites. Community attitudes have changed and simple deposition has developed into a more controlled and better engineered process.
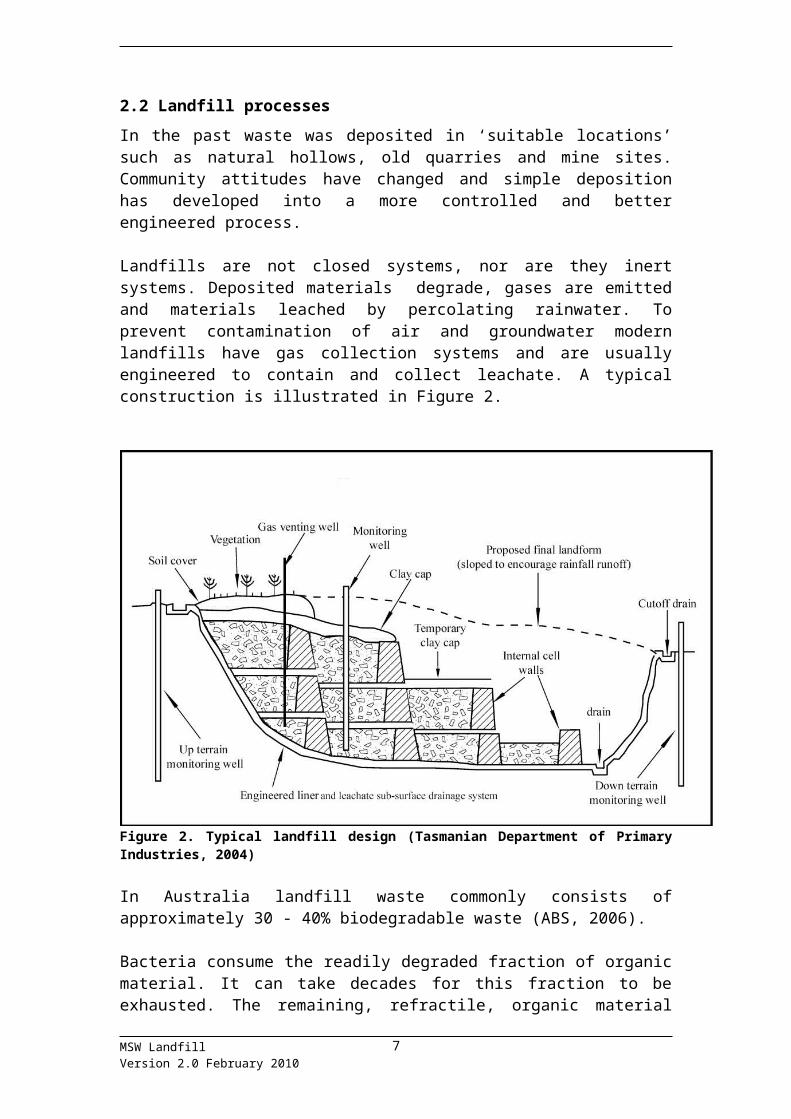
Landfills are not closed systems, nor are they inert systems. Deposited materials degrade, gases are emitted and materials leached by percolating rainwater. To prevent contamination of air and groundwater modern landfills have gas collection systems and are usually engineered to contain and collect leachate. A typical construction is illustrated in Figure 2.
Figure 2. Typical landfill design (Tasmanian Department of Primary Industries, 2004)
In Australia landfill waste commonly consists of approximately 30 - 40% biodegradable waste (ABS, 2006).
MSW LandfillVersion 2.0 February 2010
5
Bacteria consume the readily degraded fraction of organic material. It can take decades for this fraction to be exhausted. The remaining, refractile, organic material may remain essentially unchanged for centuries. Decomposition is a seamless process but for convenience four phases are recognised (Kjeldsen et al. 2002):
Phase IInitially, the fresh waste compacted and sealed in the landfill contains oxygen and moisture. Aerobic bacteria begin to digest the organic matter, temperature might increase, carbon dioxide production increases and the proportion of nitrogen in the waste atmosphere decreases.
Phase IIThe supply of oxygen generally runs out within a few days and the atmosphere becomes anoxic. Anaerobic bacteria continue the decomposition of organic matter. Hydrolytic and fermentative species exude enzymes which break down complex molecules to their basic components: proteins to amino acids; complex carbohydrates to simple sugars; fats and oils to glycerol and fatty acids. The environment becomes more acidic and acetogenic bacteria feed on these products producing hydrogen and carbon dioxide.
Phase IIIThe environment moves towards neutral pH and populations of methanogenic bacteria start to consume the accumulated products from biochemical activity of the hydrolytic, fermentative and acetogenic bacteria. Methanogenic bacteria produce methane and carbon dioxide.
Phase IVMethane production reaches a maximum and pH stabilizes (carboxylic acids are used as quickly as they are formed). Methane and carbon dioxide are generated in virtually equal quantities but a fraction of the carbon dioxide becomes dissolved in water and the gas outflow is usually richer in methane. The general composition of landfill gas produced is shown in Table 2 (refer to Section 3). This is the ‘methanogenic phase’ and can last for decades. Gradually, as the food supply is exhausted, bacterial activity declines.
After phase IV, only the refractile organic matter (and inert waste) remains. At this stage the waste is ‘stable’: gas production drops, and the waste may become aerobic.
At large landfills, gas may be used for power generation. Methane produced in landfills is an extractable energy resource, and methane capture is becoming more commonplace at larger metropolitan landfills. Capture efficiency is variable with claims ranging from about 20% to 70% of production: capture of 60% could be expected at landfills implementing best practice (Dever, 2006). Some landfill gas might be flared to reduce methane to carbon dioxide, and thus reduce greenhouse gas emissions.
MSW LandfillVersion 2.0 February 2010
6

Water percolating through landfills will pick up and transport chemicals creating leachate: a complex mixture of suspended and soluble substances. The quantity of leachate generated depends principally on rainfall and the state of the landfill. At new, unsealed landfill sites, the total rainfall collects as leachate. With progressive sealing leachate quantity reduces to 10 – 20 % of total rainfall.
The wide range of pollutants in leachate presents difficulties in successfully removing them and producing good quality water. Leachate is typically directed to settling ponds; the supernatant treated onsite, discharged to a sewer, allowed to evaporate or recirculated through the landfill (Tasmanian Department of Primary Industries, 2004).
Specialised onsite or offsite treatments include (IPPC, 2007): Biological treatment (activated sludge, biofilms). Removal of suspended low density solids by flotation followed by
precipitation, flocculation and sedimentation (using conventional agents: aluminium and ferric salts). These processes can remove up to 40% of the pollutants from leachate.
Pollutant removal using activated carbon and oxidation (usually involves the addition of ozone or hydrogen peroxide, followed by UV irradiation).
Reverse osmosis or membrane filtration. Pollutant stripping, concentration and combustion. Passage through artificial wetlands.
Residual waste from some treatment processes can be more concentrated and may be returned to landfill.
MSW LandfillVersion 2.0 February 2010
LANDFILL
MSW
Landfill Gas Mainly methane and carbon dioxide, but also non-methane volatile organic compounds, hydrogen sulfide and ammonia.
Leachate
Leachate treatment onsite
Leachate Percolating rainfall leaches a variety of organic and inorganic materials.
Figure 3 Typical major flows
Rain
System boundary
7
Many old, closed landfills were not constructed to contain leachate or to capture landfill gases. For these facilities, risk of environmental harm can be reduced by appropriate aftercare involving a number of containment strategies including:
Extraction and treatment of contaminated groundwater. Construction of impermeable subsurface barriers to prevent groundwater
contamination. Sealing the surface (impermeable membrane) to prevent entry of water and
formation of leachate. Increasing the layer of soil cover to minimise risk of exposure. Passive extraction and capture of landfill gases.
Such aftercare might need to be maintained for many years and the associated costs could be substantial.
MSW LandfillVersion 2.0 February 2010
8

3 Emission sources
Biodegradation processes within waste may transform or generate NPI substances that are subsequently released as gases (landfill gas) or liquid (leachate). Degradation of non-biological material within waste occurs by chemical and physical processes also resulting in generation of NPI substances. Emissions from landfills are discussed below in terms of emissions to air, water and land.
3.1 Emissions to air
Air emissions may be categorised as point source or fugitive emissions. Point source emissions are released into the atmosphere through a single point source such as a vent, stack or flare. If landfill gas is combusted, there will be point source emissions.
Fugitive emissions are not released through a vent or stack. Where landfill gas is not captured for power generation or flaring, the gas mixture will be released to air as a fugitive emission. Where landfill gas is collected, there will be a proportion that will evade collection and escape as a fugitive emission.
A vast assortment of chemicals enters landfills and it is virtually impossible to track the fate of individual substances. A total of 181 volatile organic compounds (VOC) have been found in gases emitted from biodegradable municipal waste (aerobic and anaerobic decomposition). However, the quantities of VOC are several hundred times smaller than those of methane and carbon dioxide (USEPA, 2006). Landfill gas is a mixture of primarily methane and carbon dioxide with small proportions of other compounds, as shown in Table 2.
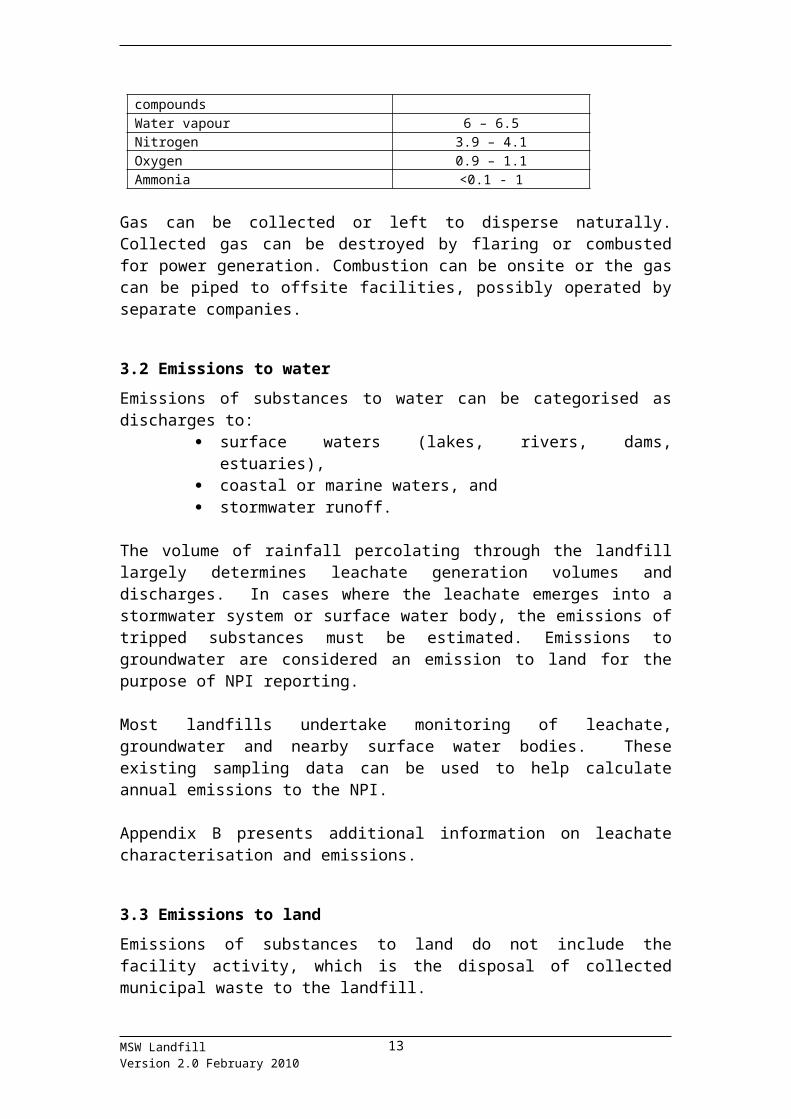
Table 2. Composition of biogas produced by anaerobic decomposition (EC, 2005).Component Landfill gas (% by volume)
Methane 50 – 75Carbon dioxide 25 – 50Non-methane volatile organic compounds 0.01 – 0.60Water vapour 6 – 6.5Nitrogen 3.9 – 4.1Oxygen 0.9 – 1.1Ammonia <0.1 - 1
Gas can be collected or left to disperse naturally. Collected gas can be destroyed by flaring or combusted for power generation. Combustion can be onsite or the gas can be piped to offsite facilities, possibly operated by separate companies.
3.2 Emissions to water
Emissions of substances to water can be categorised as discharges to: surface waters (lakes, rivers, dams, estuaries), coastal or marine waters, and stormwater runoff.
The volume of rainfall percolating through the landfill largely determines leachate generation volumes and discharges. In cases where the leachate emerges into a
MSW LandfillVersion 2.0 February 2010
9

stormwater system or surface water body, the emissions of tripped substances must be estimated. Emissions to groundwater are considered an emission to land for the purpose of NPI reporting.
Most landfills undertake monitoring of leachate, groundwater and nearby surface water bodies. These existing sampling data can be used to help calculate annual emissions to the NPI.
Appendix B presents additional information on leachate characterisation and emissions.
3.3 Emissions to land
Emissions of substances to land do not include the facility activity, which is the disposal of collected municipal waste to the landfill.
Emissions may occur due to overland flow or spray application of leachate to land (other than directly on the landfill). If leachate is collected and recirculated (added to the landfill) then substances have not been emitted or transferred. They have been retained within the landfill system’s boundary and do not have to be reported.
The discharge of substances in leachate to a sewer or evaporation pond (other than directly on the landfill) represents a transfer and it is reportable.
MSW LandfillVersion 2.0 February 2010
10

4 Threshold calculations
Thresholds are employed to decide whether the emissions and transfers of substances need to be reported. The application of NPI thresholds to landfills is not as straightforward as it is for some other industries. For landfills, the thresholds are much more concerned with storage while in other industries, the amount of the ‘stored’ substances is usually low in comparison with the amount of used substances. As discussed in Section 2, landfill processes may continue for decades and thus the threshold calculations must address waste received over the landfill’s entire operational life.
4.1 Usage/storage thresholds
Some of the substances of importance to MSW landfills (e.g., ammonia, total nitrogen, total phosphorus, hydrogen sulphide) do not arise from simple direct input; these are generated and transformed depending on the degradation processes, landfill conditions and age of the waste.
Other substances (e.g., metals such as zinc and compounds), are a function of the direct waste input. While landfills may contain a significant amount of metallic waste material, it may be in a form that will not readily leach. For example, a car engine block will leach metals from the exposed surface, but the majority of the mass is encapsulated and does not represent an emission source. These considerations should be taken into account in the threshold calculations.
‘Use’ and ‘usage’ is defined as the receipt, storage, handling, manufacture, import, processing, coincidental production or other uses of NPI substances. The NPI Guide provides detailed information on thresholds for all categories. If the ‘use’ of any NPI substance exceeds the thresholds for Category 1, 1a or 1b, then all of the emissions of that substance from the facility must be reported. This also applies to mandatory transfers.
The Category 1, 1a or 1b thresholds relate to the quantity of substance stored in the landfill. A threshold would be tripped when the cumulative quantity of substance stored equals or exceeds the threshold quantity. Once a substance has tripped a threshold then its fate (emissions and transfers) needs to be tracked and reports prepared for that, and all subsequent years, for the landfill.
Volatile organic compounds (VOC) are most commonly found in fuels, solvents, paints, adhesives, and plastics and a wide variety of other consumer products. MSW will contain VOC as residues or incorporated into the structure of plastic foams, packaging, floor and wall coverings, furniture and similar materials. The non-methane volatile organic compounds (NMVOC) in landfill gas are equivalent to the NPI ‘substance’ total volatile organic compounds.
Direct measurements have shown that NMVOC form a small proportion of landfill gas. From landfills where no significant hazardous waste has been deposited the quantity of NMVOC in landfill gas varies between 105 and 1481ppm (by volume), with a mean value 595ppm (USEPA 1997).
MSW LandfillVersion 2.0 February 2010
11
The Category 1a threshold for VOC is 25 tonnes and the quantity of mixed, wet, MSW that could release this quantity of VOC is about 107,000 tonnes (refer to Box 2). Pragmatically a threshold quantity of 110,000 tonnes of stored MSW could be used as the threshold for reporting VOC emissions ( refer to Table 3).
Box 2. Quantity of stored MSW that could yield 25 tonnes of VOC and trip the Category 1a threshold.
Quantity of biodegradable carbon in 1 tonne of wet MSW: One tonne of Australian MSW contains about 0.35 tonnes of biodegradable
material (ABS 2006). Approximately 74% of this (i.e. 0.259 tonnes) is dry biodegradable material. About 42 - 44% of dry (plant derived) MSW is carbon (USEPA 2006;
Bidwell 1979) and about 57% of this can be degraded to carbon dioxide and methane (USEPA 2006).
Accepting that the proportion of completely degradable carbon is 0.24 (0.57*0.42) then 0.259 tonne of dry waste contains 0.06216 tonne of completely degradable carbon.
= 0.35 x 0.74 x 0.42 x 0.57 = 0.06216
Yield of VOC from 1 tonne of wet MSW: 0.06216 tonne carbon would produce 0.00518 tonne of methane + carbon
dioxide (in equal proportions). At standard temperature and pressure this would occupy about 116 m3. The concentration of VOC in landfill gas is 520ppm (by volume). 116 m3 of landfill gas would contain 0.06032 m3 of VOC. This weighs 0.233kg of VOC (as hexane equivalents).
= 116 x 0.000520 = 0.06032 m3 of VOC.= 0.233 kg of VOC
Cumulative weight of wet MSW that could yield 25 tonnes of VOC is therefore approximately 107,000 tonnes (i.e. 25,000/0.233).
Pragmatically, 110,000 tonnes could be used as the threshold quantity of stored MSW that would trip the Category 1a threshold.
The quantities of stored MSW that could contain threshold quantities of Category 1 and 1b substances can be estimated from their average concentrations in various types of waste. Such estimates, derived from the data in tables in Appendix B (assuming that Australian MSW has a moisture content of 26%). Pragmatic threshold quantities are presented for Category 1, 1a and 1b substances in Table 3.
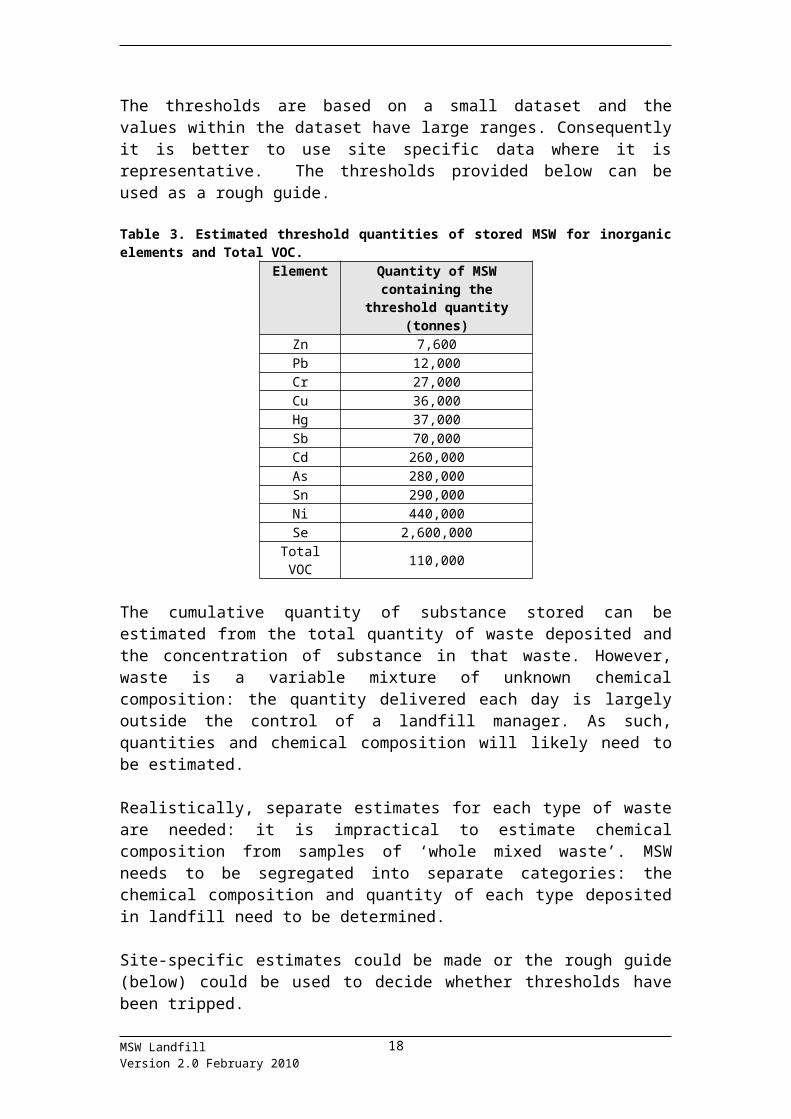
The thresholds are based on a small dataset and the values within the dataset have large ranges. Consequently it is better to use site specific data where it is representative. The thresholds provided below can be used as a rough guide.
MSW LandfillVersion 2.0 February 2010
12

Table 3. Estimated threshold quantities of stored MSW for inorganic elements and Total VOC.Element Quantity of MSW containing
the threshold quantity(tonnes)
Zn 7,600Pb 12,000Cr 27,000Cu 36,000Hg 37,000Sb 70,000Cd 260,000As 280,000Sn 290,000Ni 440,000Se 2,600,000
Total VOC 110,000
The cumulative quantity of substance stored can be estimated from the total quantity of waste deposited and the concentration of substance in that waste. However, waste is a variable mixture of unknown chemical composition: the quantity delivered each day is largely outside the control of a landfill manager. As such, quantities and chemical composition will likely need to be estimated.
Realistically, separate estimates for each type of waste are needed: it is impractical to estimate chemical composition from samples of ‘whole mixed waste’. MSW needs to be segregated into separate categories: the chemical composition and quantity of each type deposited in landfill need to be determined.
Site-specific estimates could be made or the rough guide (below) could be used to decide whether thresholds have been tripped.
Estimating site-specific quantities of MSW deposited
The total quantity of each type of waste deposited in a reporting year may be estimated using methods based on average daily deliveries of waste, or the average weight of waste per class of load.
1. Average daily deliveries ( ) of certain type of waste can be estimated by sampling. The total annual delivery for this type of waste would then be calculated for the reporting year (Equation 1):
Equation 1
Where:m is the total annual delivery
is the average quantity of each type of waste delivered per dayL is the number of daily deliveries
2. Alternatively, waste loads could be separated into classes based, for example, on size and gross composition. Sampling could be used to estimate the average
MSW LandfillVersion 2.0 February 2010
13
quantity of each type of waste delivered in each class of waste load. The total quantity of this type of waste delivered (for a class) would then be the average for each class multiplied by the number of loads of that class that were delivered. The total quantity of each type of waste delivered in the reporting year would be the sum of quantities delivered in all classes of waste load (refer to Equation 2).
Equation 2
Where:m is the dry weight of this waste type deposited in the reporting yeari is the number of load classes (1 to n)
is the average weight of this type of waste in loads of class ‘i’li is the number of class ‘i’ loads delivered in the reporting year
Quantity of inorganic substances in storage
To estimate the quantity of inorganic substances in storage, values for two parameters are required (1) the dry weight of waste type deposited and (2) the concentration of substance in that type of waste.
As moisture content differs between types of waste, the weight of each type of waste needs to be converted to dry weight and appropriate conversion factors need to be determined. In the absence of these factors, the values presented in Appendix B could be used as ‘defaults’ for biodegradable waste. It can also be assumed that other waste (ceramics, stone, concrete, plastics etc) contain zero moisture.
Quantity of substance deposited in a reporting year
For each substance the quantity deposited in a reporting year can be calculated using Equation 3:
Equation 3
Where:Q is the quantity of substance deposited in the reporting yeari is the type of waste (types 1 to n)mi is the dry weight of waste of type ‘i’ deposited in the reporting yearci is the concentration of substance in waste of type ‘i’
Additional information
Chemical composition of each waste type cannot practically be determined by site specific analysis. Chemical composition should be obtained from publicly available data, such as that compiled in Appendix B.
The volume of waste in storage can be estimated from the dimensions of the landfill. The volume (m3) needs to be converted to a mass (tonnes) by applying a density factor and subtracting out the volume of daily cover and capping material.
MSW LandfillVersion 2.0 February 2010
14

Unless information is available, the quantity of substances stored should be estimated by assuming that past depositions had a similar chemical composition as current depositions of MSW.
The NPI Guide provides specific advice about what should be measured/analysed for other substances. The advice for ammonia (total) is as follows:
The threshold for ‘Ammonia (total)’ refers to the total amount of both ammonia (NH3 CAS number 7664-41-7) and the ammonium ion (NH4 +) in solution. There is no need to convert the quantity of ammonium ion into an ammonia equivalent.
4.2 Fuel and electricity thresholds
Large facilities employing energy recovery processes may trigger the Category 2a or 2b thresholds for fuel burning waste. A facility that has no combustion processes or fuel / waste burning need not consider the Category 2a or 2b thresholds.
The NPI reporting thresholds for Category 2a are: burning of 400 tonnes or more fuel or waste in a year; or burning 1 tonne or more of fuel or waste in an hour at any time during the
reporting year.
The NPI threshold for Category 2b substances for landfill facilities is: burning 2,000 tonnes or more of fuel or waste in a year.
It has become more common at larger landfills for methane to be extracted by specialist companies. Methane is used to generate electricity or perhaps to gain carbon credits by burning the gas. These specialist companies become responsible for reporting emissions. The gas is a resource transferred for the beneficial use of energy recovery. Substances in the transferred gas could be voluntarily reported by the landfill facility as a transfer.
If landfill gas is burned by the landfill operator, they are responsible for reporting to the NPI the relevant set of Category 2a and 2b substances emitted.
The threshold quantities for burning landfill gas, as outlined in the NPI Guide, are: Category 2a: 367,000 m3 in the reporting year Category 2b: 1,830,000 m3 in the reporting year
Operation of heavy construction vehicles consumes about 1 liter of diesel (0.836kg) per tonne of waste (Bateman, 2006). On this basis, only landfills receiving 479,000 tonnes or more of waste, per year would trip the Category 2a threshold (consumption of 400 tonnes or more of fuel).
If a facility exceeds the fuel burning threshold, refer to the appropriate EET manual, such as Combustion in Boilers or Combustion Engines.
MSW LandfillVersion 2.0 February 2010
15

4.3 Nitrogen and phosphorus thresholds
If your facility emitted to water (excluding groundwater), and/or transferred to a mandatory reporting transfer destination:
15 tonnes or more of total nitrogen, or 3 tonnes or more of total phosphorus,
then the facility must report the quantities of both substances flowing out of the facility.
Exceeding the threshold for Category 3 at a MSW landfill facility would require a significant volume of discharge to surface water (emission) or to sewer (transfer). For this case, calculating the mass of total nitrogen and total phosphorus is best done using direct measurement techniques.
Total nitrogen (TN) is considered to be the sum of nitrate, nitrite, ammonia, and organic nitrogen all expressed as nitrogen. Total phosphorus (TP) is the sum of all inorganic and organic forms in water, expressed as phosphorus.
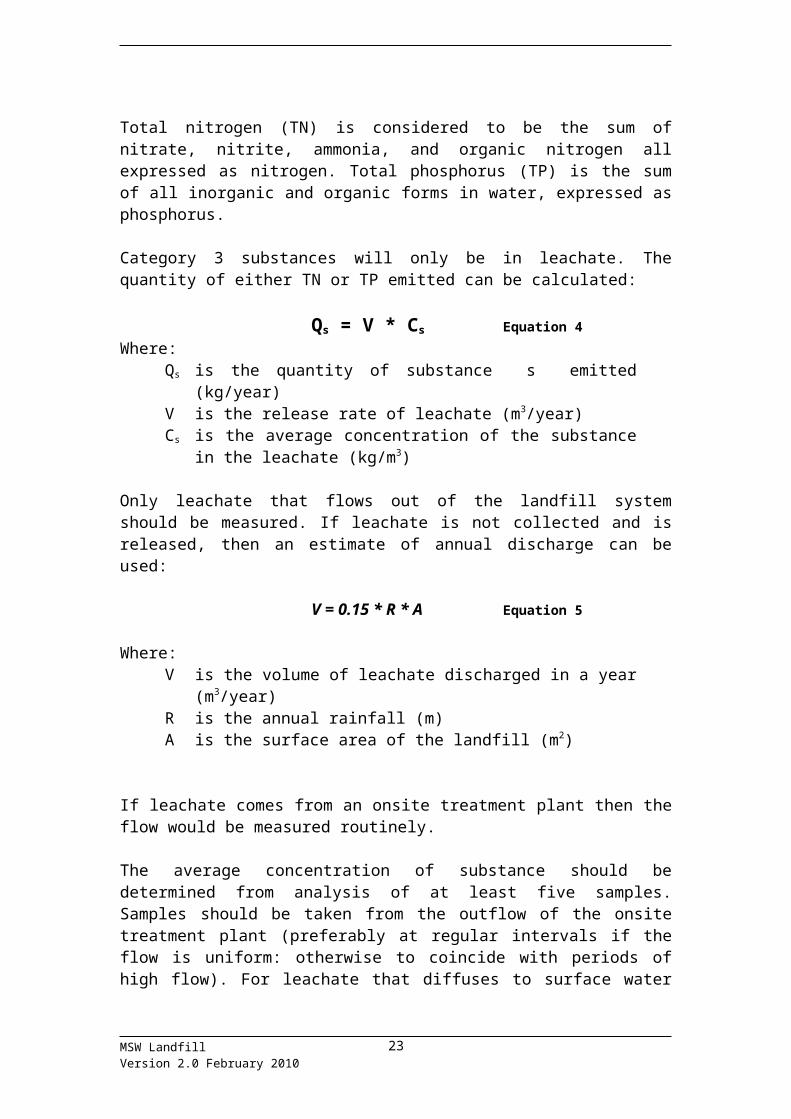
Category 3 substances will only be in leachate. The quantity of either TN or TP emitted can be calculated:
Qs = V * Cs Equation 4Where:
Qs is the quantity of substance s emitted (kg/year)V is the release rate of leachate (m3/year)Cs is the average concentration of the substance in the leachate (kg/m3)
Only leachate that flows out of the landfill system should be measured. If leachate is not collected and is released, then an estimate of annual discharge can be used:
V = 0.15 * R * A Equation 5
Where:V is the volume of leachate discharged in a year (m3/year) R is the annual rainfall (m) A is the surface area of the landfill (m2)
If leachate comes from an onsite treatment plant then the flow would be measured routinely.
The average concentration of substance should be determined from analysis of at least five samples. Samples should be taken from the outflow of the onsite treatment plant (preferably at regular intervals if the flow is uniform: otherwise to coincide with periods of high flow). For leachate that diffuses to surface water via groundwater, samples of groundwater should be obtained close to the landfill.
MSW LandfillVersion 2.0 February 2010
16
5 Emission estimation techniques
There are five types of emission estimation techniques (EETs) that may be used to calculate emissions from your facility. These are:
sampling data or direct measurement, mass balance, fuel analysis or engineering calculations, emission factors, and an approved alternative.
Select the EET (or mix of EETs) that is most appropriate for your purposes.
This manual seeks to provide the most effective EETs for the NPI substances relevant to MSW landfills. However, the absence of an EET for a substance in the manual does not imply that an emission should not be reported to the NPI. The obligation to report on all relevant emissions remains if reporting thresholds have been exceeded.
5.1 Direct measurement
Direct measurement is a good option for reporting to the NPI, particularly if you already undertake sampling and analysis to meet other regulatory requirements. Direct measurement may be employed for leachate emissions to water. The quantity of substances emitted in leachate can be estimated using the method outlined for estimation of Category 3 thresholds (refer to Section 4.3).
The emission estimation must determine the volume of the leachate entering the surface water body or stormwater system. For a small stream or channel on a landfill’s boundary, a surrogate analyte such as electrical conductivity, could be used to estimate the volume of leachate entering the surface water body or stormwater system. Results from upstream of the landfill can be compared with downstream results and leachate results. This can provide an indication of the landfill’s contribution to the stream. Apportioning the contribution to NPI substances provides a conservative estimate as the attenuating influence of the soil (e.g., slowing the movement of dissolved metals) is not considered.
5.2 Mass balance
Emissions to air Computer models must be used for estimation of landfill gas emissions Models estimate methane generation and employ emission factors to estimate releases of other pollutants including NPI substances.
Controlled release of pollutants from burning landfill gas can be estimated using computer models or using methods described in the NPI EET Manual Combustion in Boilers. These also employ emission factors.
Emissions to air of pollutants associated with landfill gas should be estimated using either of one of three freely available computer models: LEA (Landfill Emissions
MSW LandfillVersion 2.0 February 2010
17

Assistant, available from DEWHA), LandGEM (available from the US EPA) or GasSimLite (UK Environmental Agency) available from Golders and Associates.
Précis of LEA
The Landfill Emissions Assistant (LEA) tool is a deterministic (Excel) spreadsheet model. It was developed based on updates to the emissions profiles as specified in the USEPA AP42 for Landfills constructed after 1992.
The model uses ambient condition data (average yearly temperature and rainfall) sourced from the Australian Bureau of Meterology. The tool also exports a CSV file which can be uploaded into the NPI online reporting system.
The model treats ‘Waste’ (inputs for design capacity and acceptance rate) as completely biodegradable. The majority of MSW is not biodegradable waste, it is important to ensure that the annual acceptance rate is for biodegradable waste only. MSW has a dry weight/wet weight ratio of about 0.84 (USEPA, 2006) and about 35% of Australian MSW is biodegradable (ABS, 2006). Therefore the correction factor is 0.84 x 0.35 = 0.294.
Précis of LandGEM 3.02
LandGEM (USEPA) is a deterministic (Excel) spreadsheet model. It has built-in default values which can be used to generate NPI reports with minimal background research.
LandGEM (USEPA) treats waste in a similar manner as LEA, therefore the waste value used also needs to be corrected to ensure that it is for the mass of biodegradable waste only. Précis of GasSimLite V1.54
GasSimLite is a simulation model. It can handle uncertainty in input data (it accepts ranges, different types of distributions of values within the ranges, as well as single values). It yields output as medians and ranges. It estimates emissions from flaring and burning gas for power generation: LandGEM does not.
GasSimLite Version 1.54 uses biodegradable waste in its calculations and its results do not require correction.
The model handles mixtures of waste each with a different degradation rate. It handles differences in moisture content, recirculation of leachate and differences in landfill construction.
It has built-in sets of default values which can be used to generate NPI reports with minimal background research. However, greater knowledge of landfill characteristics is required than for use of LandGEM.
MSW LandfillVersion 2.0 February 2010
18
5.3 Engineering calculations
Engineering calculations may be used to estimate emissions and transfers where other methods are insufficient. For example, you may not be able to directly measure data related to non-routine events. The data gaps should be filled with the best available engineering estimates.
Spills, overflows and discharges need to be estimated and their contribution added to the reported process emissions and/or transfers. The emission resulting from a spill is the net emission that is the quantity of the substance spilled, less the quantity recovered or consumed during cleanup operations.
5.4 Emission factors
An emission factor is a tool that is used to estimate emissions to the environment. In this manual, it relates to the quantity of substances emitted from a source though some common activity associated with those emissions. Emission factors are usually expressed as the weight of a substance emitted multiplied by the unit weight, volume, distance or duration of the activity emitting the substance (e.g., kilograms of substance per tonne of product).
When using emission factors, you should be aware of the associated emission factor rating (EFR) code and what the rating implies. An A or B rating indicates a greater degree of certainty than a D or E rating. The main criterion affecting the uncertainty of an emission factor remains the degree of similarity between the equipment/process selected in applying the factor and the target equipment/process from which the factor was derived. The EFR system is:
A ExcellentB Above averageC AverageD Below averageE PoorU Unrated
Emission factors are used to estimate a facility’s fugitive emissions to air when other methods such as development of unit-specific correlation equations or existing correlations are not available. Generally, the application of an emission factor takes the following form:
E = A x T x EF x [1-(CE/100)] Equation 6
Where:E is the emission (kg)A is the ‘activity’ rate (t/hr)T is the number of operating hours for the reporting year (hr)EF is the uncontrolled emission factor (kg/t)CE is the control efficiency (%) for the substance
MSW LandfillVersion 2.0 February 2010
19

5.5 Approved alternative
You are able to use emission estimation techniques that are not outlined in this document. You must, however, seek the consent of your State or Territory environmental agency. For example, if your facility has developed site-specific emission factors, you may use these if they have been approved by your environmental agency.
MSW LandfillVersion 2.0 February 2010
20

6 Transfers of NPI substances
The NPI requires the mandatory reporting of NPI substances that are transferred as waste to a final destination. Transfers are required to be reported if a Category 1, Category 1b or Category 3 reporting threshold is exceeded. Both emissions and transfers are reportable in kilograms.
The transfer of NPI substances to a destination for reuse, recycling, reprocessing, purification, partial purification, immobilisation, remediation or energy recovery can be reported voluntarily. This is an opportune way for facilities to provide appropriate context about transfers to their local community.
Substances in transferred gas for energy recovery (e.g., to an electricity generator) could be voluntarily reported by the landfill facility as a transfer.
Landfills are mandatory reporting transfer destinations for off-site reporters as they represent the final destination for NPI substances. However, placing materials in the landfill by the landfill operator and moving materials within the landfill’s boundary does not constitute a transfer.
If leachate is treated onsite and directed onto the landfill, this is not a transfer as substances have been retained within the landfill system’s boundary.
Transfers do not involve soil used in daily cover or capping of landfills.
Leachate that is collected and discharged via the sewerage system for treatment represents a transfer to a mandatory reporting destination. The transfer would need to be reported if a Category 1 threshold had been tripped.
Further information regarding transfers of waste, including how to estimate and report, can be found in The NPI Guide.
MSW LandfillVersion 2.0 February 2010
21
7 Additional reporting information
This manual has been written to reflect the common processes employed in MSW landfills. To ensure a complete report of the emissions for your facility, it may be necessary to refer to other EET manuals. These include:
Fossil Fuel Electric Power Generation, Fuel and Organic Liquid Storage, and Fugitive Emissions.
When you have a complete account of substance emissions from your facility, report these emissions according to the instructions in The NPI Guide.
The following advice is compiled from relevant references and is presented below to aid in reporting.
Quantities should be reported to two significant figures. The rounding method used should be in accordance with Australian Standard AS 2706. Rounding should be made in ‘one step’. Examples are:
Original Value Rounds to8.2501 8.38.3499 8.3
If figures to be discarded fall midway between two numbers (i.e. end in a 5) then the value should be rounded to the nearest even number. Examples are:
Original value Rounds to nearest even value8.45 8.4
8.5500 8.6
Caution should be taken when reporting an emission of a tripped substance as zero. Emissions should only be reported as zero in circumstances where there is certainty that the NPI substance is not emitted or emissions are negligible.
The reported emission for a substance should be left blank if no emission estimation factors or techniques are available and if there is uncertainty about whether that emission is in fact zero. If a blank emission is included in a report for an NPI substance where usage has tripped the reporting thresholds, written documentation with the appropriate reason must be provided, for example “No emission estimation technique available”.
If a result is below the detection limit: and you are sure that the substance was not present, then report a zero value, otherwise, report a value that is half the detection limit.
MSW LandfillVersion 2.0 February 2010
22
8 References
Australian Standard AS 2706 (2003). Numerical values – Rounding and interpretation of limiting values. Standards Australia International Ltd., Sydney, Australia.
Australian Bureau of Statistics. Australia’s Environment: Issues and Trends, 2006 and 2007
Australian Waste Database (Department of Environment and Heritage and CSIRO)
Bateman, S., 2006. Responses to the discussion paper on possible design for a National Greenhouse Gas Emissions Trading Scheme. National Landfill Division, Waste Management Association of Australia.
Bidwell, R.G.S., 1979. Plant Physiology (2nd Edition). MacMillan Publishing Co., Inc., New York.
Burnley, S.J., 2007. The use of chemical composition data in waste management planning – a case study. Waste Management 27, 327-336.
Chandler, A.J., Eighmy, T.T., Hartlen, J., Hjelmar, O., Kosseon, D.S., Sawell, S.E., vander Sloot, H.A., and Vehlow, J., 1997. Municipal solid waste incinerator residues. The International Ash Working Group (IAWG). (Cited in Jung et al. 2006).
Crowe M., Nolan, K., Collins, C., Cart, G., Donlon, B., Kristoffersen, M., 2002. Biodegradable municipal waste management in Europe. Part 1: Strategies and instruments. European Environment Agency.
Dever, S., 2006. Passive drainage and biofiltration of landfill gas. Waste Management Association of Australia, NSW Landfill working group.
DEH (Department of the Environment and Heritage), 2006. Submission to the productivity commission inquiry into waste generation and resource efficiency. Australian Government, Canberra, Australia.
Dimambro, M.E., Lillywhite, R.D., and Rahn, C.R., 2006. Biodegradable municipal waste composts: analysis and application to agriculture. Warwick HRI, University of Warwick, UK.
EC (European Commission), 2005. Integrated Pollution Prevention and Control: Reference Document on Best Available Techniques for the Waste Treatments Industries.
EC (European Commssion), 2006. Guidance document for the implementation of the European PRTR. Supporting document for the determination of diffuse methane emissions from landfill sites.
MSW LandfillVersion 2.0 February 2010
23
Garcia, A.J., Esteban, M.B., Marquez, M.C., and Ramos, P., 2005. Biodegradable municipal solid waste: characterization and potential use as animal feedstuffs. Waste management 25: 780-787.
GasSimLite User Manual, 2003. Version 1.54, Environmental Agency, UK. http://www.gassim.co.uk/download.htm
Herring, B., Herring, M., Gruneklee, E., 1999. Schwermetallenfrachtung durch das trockenstabilatverfahren. Wasser und Abfall 4, 20-23. (Cited in Burnley, 2007)
ICER (Industrial Council for Electronic Equipment Recycling), 2004. Materials recovery from waste cathode ray tubes (CRTs). The Waste and Resources Action Programme. Oxford, UK.
IPPC (International Pollution Prevention and Control), 2007. Guidance for the treatment of landfill leachate. European Union.
Jones, A., Nesaratnam, S., and Porteous, A., 2008. The Open University Household Waste Study: Key findings from 2007. Report for The Department for Environment, Food and Rural Affairs. UK.
Jung, C.H., Matsuto, T., and Tanaka, N. 2006. Flow analysis of metals in a municipal solid waste management system. Waste Management 26, 1337-1348.
Kjeldsen, P.I., Barlaz M. A., . Rooker A. P., Baun A., Ledin A., and Christensen T. H., 2002. Present and Long-Term Composition of MSW Landfill Leachate: A Review. Critical Reviews in Environmental Science and Technology, 32(4):297-336.
Morf, L.S., Tremp, J., Gloor, R., Schuppisser, F., Stengele, M., and Taverna, R., 2007. Metals, non-metals and PCB in electrical and electronic waste – Actual levels in Switzerland. Waste Management 27, 1306 – 1316.
National Pollutant Inventory Guide V4.0, 2007
National Environment Protection (National Pollutant Inventory) Measure 1998 as varied up to Variation 2007
National Environment Protection Council, 1999. National Pollutant Inventory Technical Advisory Panel: Final report.
NEWMOA, 2006. Summary of Research on Mercury Emissions from Municipal Landfills. Northeast Waste Management Officials’ Association, Boston, Maryland, USA.
Otte, P., 1995. Analysis of metals and calorific value in components from household waste 1988-1992. National Institute of Public Health and Environmental Protection, report 776201024, Bilthoven, Netherlands. (Cited in Burnley, 2007)
Øygard, J. K., Måge, A., and Gjengedal, E., 2004. Estimation of the mass-balance of selected metals in four sanitary landfills in Western Norway, with emphasis on the
MSW LandfillVersion 2.0 February 2010
24

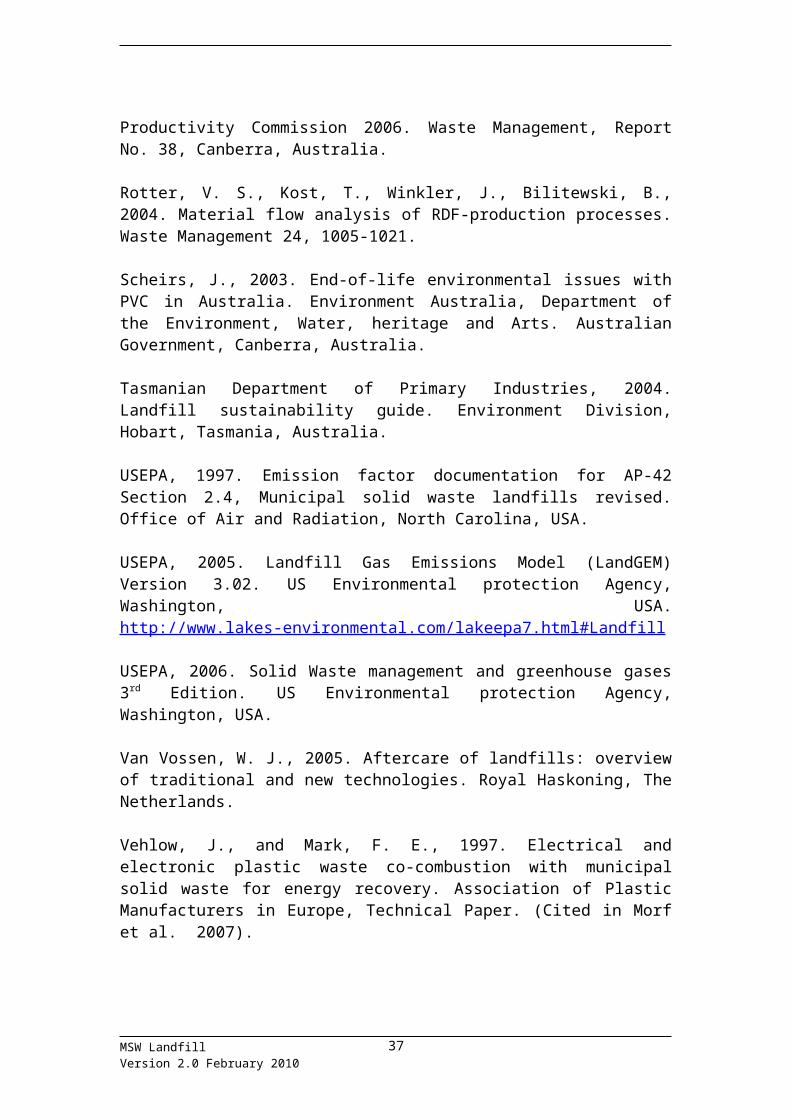
heavy metal content of the deposited waste and the leachate. Water Research, 38: 2851-2858. Productivity Commission 2006. Waste Management, Report No. 38, Canberra, Australia.
Rotter, V. S., Kost, T., Winkler, J., Bilitewski, B., 2004. Material flow analysis of RDF-production processes. Waste Management 24, 1005-1021.
Scheirs, J., 2003. End-of-life environmental issues with PVC in Australia. Environment Australia, Department of the Environment, Water, heritage and Arts. Australian Government, Canberra, Australia.
Tasmanian Department of Primary Industries, 2004. Landfill sustainability guide. Environment Division, Hobart, Tasmania, Australia.
USEPA, 1997. Emission factor documentation for AP-42 Section 2.4, Municipal solid waste landfills revised. Office of Air and Radiation, North Carolina, USA.
USEPA, 2005. Landfill Gas Emissions Model (LandGEM) Version 3.02. US Environmental protection Agency, Washington, USA. http://www.lakes-environmental.com/lakeepa7.html#Landfill
USEPA, 2006. Solid Waste management and greenhouse gases 3rd Edition. US Environmental protection Agency, Washington, USA.
Van Vossen, W. J., 2005. Aftercare of landfills: overview of traditional and new technologies. Royal Haskoning, The Netherlands.
Vehlow, J., and Mark, F. E., 1997. Electrical and electronic plastic waste co-combustion with municipal solid waste for energy recovery. Association of Plastic Manufacturers in Europe, Technical Paper. (Cited in Morf et al. 2007).
White, P.R., Franke, M., and Hindle, P., 1999. Integrated solid waste management, a lifecycle inventory. Aspen Publication. (Cited in Jung et al. 2006)
MSW LandfillVersion 2.0 February 2010
25

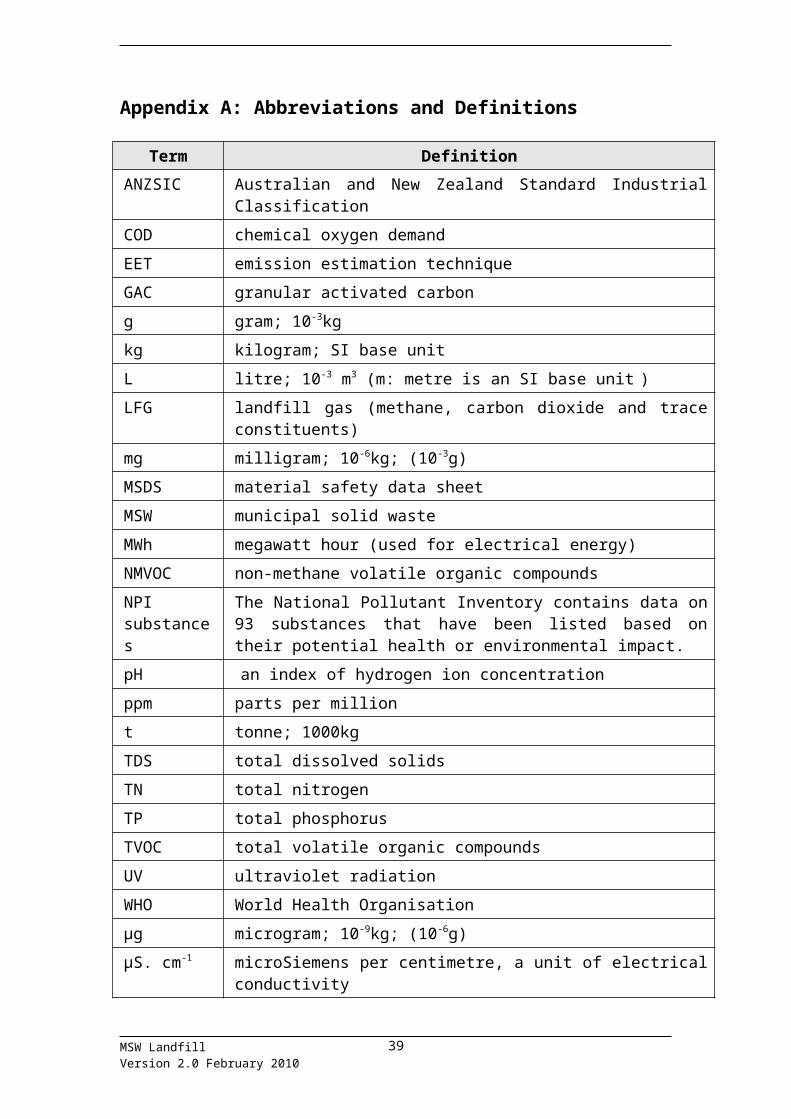
Appendix A: Abbreviations and Definitions
Term DefinitionANZSIC Australian and New Zealand Standard Industrial ClassificationCOD chemical oxygen demandEET emission estimation techniqueGAC granular activated carbong gram; 10-3kgkg kilogram; SI base unitL litre; 10-3 m3 (m: metre is an SI base unit )LFG landfill gas (methane, carbon dioxide and trace constituents)mg milligram; 10-6kg; (10-3g)MSDS material safety data sheetMSW municipal solid wasteMWh megawatt hour (used for electrical energy)NMVOC non-methane volatile organic compoundsNPI substances
The National Pollutant Inventory contains data on 93 substances that have been listed based on their potential health or environmental impact.
pH an index of hydrogen ion concentrationppm parts per milliont tonne; 1000kgTDS total dissolved solidsTN total nitrogenTP total phosphorusTVOC total volatile organic compoundsUV ultraviolet radiationWHO World Health Organisationµg microgram; 10-9kg; (10-6g)µS. cm-1 microSiemens per centimetre, a unit of electrical conductivity
MSW LandfillVersion 2.0 February 2010
26

Appendix B: Leachate and waste characterisation data
The type of material deposited in the landfill determines the composition of the leachate. Composition is also influenced by the rate of biochemical processes in the body of the landfill and varies with the age of the landfill.
A substantial proportion of MSW consists of stable materials: glass; stone; bricks, concrete; ceramics; and a variety of plastics and polymers. These effectively encapsulate any NPI substances present in their matrix (Øygard et al. , 2004). For example rigid PVC has been estimated to have a life in excess of 1000 years in landfill; vinyl monomer is not released and loss of heavy metals is at extremely low rates (Scheir, 2003). Only very small quantities of heavy metals are leached (in standard leaching tests) from bricks and foam glass containing recycled cathode ray tubes (ICER, 2004). Release rates could be greater if such inert materials were physically broken into small fragments: release rates are also greater for non-rigid plastics, such as wrapping films (Scheir, 2003).
It is convenient to separate substances present in leachate into four groups (Kjeldsen et al. , 2002):
Dissolved Organic MatterMainly volatile fatty acids (acetic, propionic and butyric) and fulvic-like and humic-like refractory compounds. Dissolved organic matter is usually measured as a composite: chemical oxygen demand (COD) or total organic carbon (TOC).
Inorganic ComponentsThese are the major inorganic ions: calcium; magnesium; sodium; potassium; ammonium (NH4
+), iron; manganese; chloride; sulphate and bicarbonate. Most inorganics remain relatively constant in leachate irrespective of landfill age. One such substance is ammonium ion: derived from digestion of proteins. This is stable under anaerobic conditions and generally occurs in high concentrations in leachate (Table 5). Ammonium concentration might remain high even 30 or more years after a landfill has closed. Phosphorus concentrations are generally low (Table 5) and might even be limiting to bacterial growth and biochemical activity.
Heavy MetalsThe main heavy metals present are: cadmium; chromium; copper; lead; nickel and zinc. Their concentrations are highly variable but they are normally present in very low concentrations (Table 5). Only a small fraction (<0.02%) of heavy metals deposited in landfill is leached out (Kjeldsen et al. , 2002; Øygard et al. , 2004). The metals become immobilized by forming complexes with colloids (mainly humic material) and other organic material, and forming insoluble sulphides and carbonates.
Xenobiotic Organic CompoundsThese arise from household and industrial chemicals. Some should not be present in MSW but regulations to prevent their deposition in MSW are not completely effective. They are usually present in very low concentrations (<1mg/L) and consist of such substances as: aromatic hydrocarbons; phenols; chlorinated aliphatics; pesticides and plasticizers. Constituents of oil derived fuels: e.g. benzene, toluene, and xylenes can occur in low concentrations. Nicotine, caffeine, and dozens of other
MSW LandfillVersion 2.0 February 2010
27

organic compounds can occur in detectable but very low concentrations. Kjeldsen et al. (2002) listed 105 xenobiotic organic compounds present in leachate from landfills in Europe and North America (Table B2).
Trace concentrations of many other substances can be found: organotin (IPPC, 2007) boron; sulphides; arsenic; selenium; barium; lithium; mercury; and cobalt. Mercury when released from products (fluorescent bulbs, batteries, thermometers etc) can evaporate and be emitted to air as part of the gas flow from landfills (NEWMOA, 2006).
Table B1. Composition of landfill leachate from Europe and North America (Kjeldsen et al. ., 2002).
Parameter Units RangepH - 4.5-9Conductivity µS.cm-1 2500-35000Total solids mg. L-1 2000-60000Dissolved Organic MatterTotal Organic Carbon mg. L-1 30-29000BOD5 mg O2 . L-1 20-57000COD mg O2 . L-1 140-152000BOD/COD - 0.02-0.8Organic nitrogen mg. L-1 14-2500InorganicsTotal Phosphorus mg. L-1 0.01-10Ammonium mg. L-1 50-2200Chloride mg. L-1 150-45000Sulphate mg. L-1 8-7750Bicarbonate mg. L-1 610-7320Sodium mg. L-1 70-7700
Potassium mg. L-1 50-3700Calcium mg. L-1 10-7200Magnesium mg. L-1 30-15000Iron mg. L-1 3-5500Manganese mg. L-1 0.03-1400Silica mg. L-1 4-70Heavy metalsArsenic mg. L-1 0.01-1Cadmium mg. L-1 0.0001-0.4Chromium mg. L-1 0.02-1.5Cobalt mg. L-1 0.005-1.5Copper mg. L-1 0.005-10Lead mg. L-1 0.001-5Mercury mg. L-1 0.00005-0.16Nickel mg. L-1 0.015-13Zinc mg. L-1 0.03-1000
MSW LandfillVersion 2.0 February 2010
28

Table B2. Xenobiotic organic compounds in landfill leachate (Kjeldsen et al. ., 2002; IPPC, 2007).Compound Range
conc(µg/L)
Compound Range conc
(µg/L)
Compound Range conc(µg/L)
Compound Range conc(µg/L)
Compound Range conc(µg/L)
Aromatic hydrocarbons Halogenated hydrocarbons Phenols Pesticides PhthalatesBenzene 0.2-1630 Chlorobenzene 0.1-110 Phenol 0.6-1200 Amytrin 0.12 Monomethyl phthalate traceToluene 1-12300 1,2-Dichlorobenzene 0.1-32 Ethylphenols <300 AMPA 3.8-4.3 Dimethyl phthalate 0.1-7.7Xylene 0.8-3500 1,3-Dichlorobenzene 5.4-19 Cresols 1.0-2100 Atrazin 0.16 Diethyl phthalate 0.1-660Ethylbenzene 0.2-2329 1,4-Dichlorobenzene 0.1-16 Bisphenol A 200-240 Bentazon 0.3-4.0 Methyl-ethyl-phthalate 2.0-340Trimethylbenzenes 0.3-250 1,2,3-Trichlorobenzene trace 3,5-Dimethylphenol 0.7-27.3 Chloridazon 1.6 Mono-(2-ethylhexyl) phthalate 4-14n-Propylbenzene 0.3-16 1,2,4-Trichlorobenzene 4.3 2,5-Dimethylphenol 0.4-4.5 Chloropropham 26 Di-(2-ethylhexyl) phthalate 0.6-236t-Butylbenzene 2.1-21 Hexchlorobenzene 0.025-10 2,4-Dimethylphenol 0.1-12.5 Dichlorobenil 0.1-0.3 Mono-butylphthalate 4-16o-Ethyltoluene 0.5-46 1,1-Dichloroethane 0.6-46 3,4-Dimethylphenol 0.03-10.4 Fenpropimorf 0.1 Di-n-butylphthalate 0.1-70m-Ethyltoluene 0.3-21 1,2-Dichloroethane <6 2,6-Dimethylphenol 0.3-1.9 Glyphosate 1.7-27 Di-isobutylphthalate 3.6p-Ethyltoluene 0.2-10 1,1,1-Trichloroethane 0.01-3810 2-Methoxyphenol trace Hexazinon 1.3 Mono-benzylphthalate 6-16Napthalene 0.1-260 1,1,2-Trichloroethane 2.5-16 2/3-Chlorophenol 0.03-1.6 Hydroxyatrazin 0.7-1.7 Butylbenzyl phthalate 0.2-8Alkyl phenols 1,1,2,2-Tetrachloroethane trace 4-Chlorophenol 0.2-1.3 Hydroxysimazin 0.6-1.7 Dioctylphthalate 1-6Nonylphenol 6.3-7.0 trans-1,2-Dichloroethylene 1.6-6582 4-Chloro-m-cresol 1.2-10.2 Isoproturon 1.2 Phthalic acid 2-14000Nonylphenolmonocarboxylate 0.5-3.0 cis-1,2-Dichloroethylene 1.4-470 3,5-Dichlorophenol 0.08-0.63 Lindane 0.025-0.95 Aromatic sulphonatesPhosphonates Trichloroethylene 0.05-750 2,3,4,6-Tetrachlorophenol 0.079-3.0 Mecoprop 0.38-150 Napthalene-1-sulphonate 506-616Tri-n-butylphosphate 1.2-360 Tetrachloroethylene 0.01-250 Miscellaneous MCPA 0.2-9.1 Napthalene-2-sulphonate 1143-1188Triethylphosphate 15 Dichloromethane 1.0-827 Acetone 6-4400 Propoxuron 2.6 Napthalene-1,5-disulphonate <2.5-51
Trichloromethane 1.0-70 2(3H)-benzothiazolone 10-50 Simazine 2.3 Napthalene-1,6-disulphonate 366-397Carbon tetrachloride 4.0-9.0 Camphor 21-255 Tridimefon 2.1 Napthalene-2,7-disulphonate 129-145
Cumene 0.3-7.4 4-CPP 15.0-19.0 2-Aminonapthalene-4,8-disulphonate 73-109Fenchone 7.3-83 2,4-D 1.0-5.0 p-Toluenesulphonate 704-1084Tertrahydrofuran 9-430 2,4,5-T traceIndane 0.2-20 2,4-DP 0.3-5.2Methylethylketone 110-6600 2,6-DCPP 0.7-1.3Methyl-iso-butylketone 1.1-176Dimethoxymethane 1.1MTBE 0.8-35Styrene 0.5-1.6Organotin 0.2
MSW LandfillVersion 2.0 February 2010
29
Table B3. Chemical composition of biodegradable MSW (concentration mg/kg dry weight basis, unless stated otherwise).Category As Cd Cr Sb Hg Mn Pb P Zn Cu Ni 1Dioxin
/furan2PCB Source
Paper/cardboard 2 1 20 0.1 42 aPaper/cardboard 2 11 67 <0.1 127 bPaper/cardboard <5 1 10 0.2 23 cPaper/cardboard (range)
0.03-0.3
20-30 72-228 80-180 d
Paper/cardboard 5.26 10.9 44.3 393 ePaper/cardboard 0.4 23 424 fWood 6 12 231 1 277 bWood <5 <1 5 <0.1 21 cFood waste 7 8 17 g*Meat waste 8200±2
40032±21 i
*Fish waste 6±7 20400±6400
62±12 1±1 i
*Fish and vegetable waste
8±2 1700±400
11±3 4±1 i
*Restaurant waste 11±16 14400±6300
17±19 1±1 1.44±0.13
5.8±0.51
i
*Household waste 2±5 30±23 55±71 206±360
2000±800
160±223
289±764
1.15±0.11
4.0±0.80
i
Organic waste 5 1 25 0.1 76 aOrganic waste 37 5 310 <0.1 188 bOrganic waste 30 1 55 0.5 90 cOrganic waste 1 607 407 1010 eOrganic waste 0.4 37 241 fOrganic waste (range)
0.06-0.45
10-15 20-156 50-100 d
Compost: (mean) 0.69 21 0.2 105 186 53 15 hCompost: (range) 0.47-
1.1211-33 0.08-
0.3448-219 100-
26832-92 11-21 h
Sources: a) Burnley (2007); b) Otte (1995); c) Herring et al. (1999); d) White et al. (1999); e) Chandler et al. (1997); f) Rotter et al. (2004); g) Jung et al. (2006); h) Dimambro et al. (2006); i) Garcia et al. (2005): * mean±SD; 1 ngTEQ/kg; 2 ng/g.
MSW LandfillVersion 2.0 February 2010
30

Table B4. Chemical composition of non-biodegradable MSW (potentially combustible). Concentration mg/kg (dry weight basis).Category As Cd Cr Sb Se Hg Pb Zn Cu Ni Sn P PCB SourceTotal plastics 3 388 853 <0.1 302 aTotal plastics (range) 0.39-
2.120-22.5 32-108 30-80 b
Total plastics 40.4 106 602 284 cElectrical/electronic 160 900 3500 0.31 1900 2300 18000 1300 2300 1200 5 dPolymer market 40 50 2600 1900 300 100 30 20 1200 eDense plastics 2 32 181 0.1 879 fFilm plastics 4 4 195 0.1 1595 fFilm plastics 1.3 219 730 gPVC <0.5 66 29 0.2 50 hPlastics 67.4 500 4380 gPackaging plastics 0.9 109 768 gPackaging plastics 420 26 0.4 11 50 iElectrical goods 71 361 1304 17 11000 hElectrical goods (av)(±95% conf.limits)
180±50
9900±1700
1700±200
0.68±0.22
2900±500
5100±800
41000±3000
10300±1600
2400±100
360±220
13±4
d
Textiles 2 1 25 0.1 35 fTextiles 2 16 934 <0.1 30 aTextiles <5 1 17 <0.1 35 hTextiles (range) 0.06-
0.37.5-10 4-12 10-20 b
Textiles 32.6 3160 773 4000 cTextiles 1 35 520 gPaper/textiles/plastic 1.2 0.4 820 880 32 740 6000 iSources: a) Otte (1995); b) White et al. (1999); c) Chandler et al. (1997); d) Morf et al. (2007); e) Vehlow and Mark (1997); f) Burnley (2007); g) Rotter et al. (2004); h) Herring et al. (1999); i) Jung et al. (2006)
MSW LandfillVersion 2.0 February 2010
31

Table B5. Chemical composition of non-biodegradable (and non-combustible) MSW. Concentration in mg/kg dry weight basis.Category As Cd Cr Sb Se Hg Pb Zn SourceBatteries 12 53 18 127 10800 aglass/cans/plastic 80 0.8 1.2 0.4 3.6 bGlass 6 1 454 0.1 168 cGlass 287 <1 253 <0.1 381 dGlass 1 329 aGlass (range) 22.5-30 8-28 10-20 eGlass 1.83 275 628 75 fGlass 1 2 50 gMiscellaneous 11 3 118 <0.1 999 cMiscellaneous 5.6 17.4 860 78 6.8 720 2600 bStone/ceramics 91 341 822 <0.1 1967 dStone/ceramics 10 1 80 50 aTotal metals 20 21 156 582 aFerrous metal 32 15 1571 1300 cFerrous metal 539 <1 1730 520 dNon-ferrous 4 16 221 4000 cNon-ferrous 48 19 331 11635 dSources: a) Herring et al. (1999); b) Jung et al. (2006); c) Burnley (2007); d) Otte (1995); e) White et al. (1999); f Chandler et al. (1997); g) Rotter et al. (2004)
MSW LandfillVersion 2.0 February 2010
32

Table B6. Chemical composition of various types of waste.Category As Cd Cr Sb Se Hg Pb Zn Cu Ni SnOrganics mean 34 1.3 148 8 0.22 142 6 53 15
min 5 0.4 7 0.10 37max 67 5.0 607 0.50 407
Paper mean 3 3.1 27 0.10 68 332min 2 0.4 10 0.10 23 180max 5 11.0 67 0.20 150 424
Plastics mean 2 73.0 306 2042 0.4 0.16 678 1108 9050 665 1160min 1 0.9 21 26 0.10 11 50 100 30 20max 4 160.0 900 3500 0.00 1900 4380 18000 1300 2300
Glass mean 147 1.2 222 0.10 305 45min 6 1.0 1 0.10 18 15max 287 1.8 454 0.10 628 75
Metals mean 129 14.4 802 3607min 4 1.0 156 520max 539 21.0 1730 11635
Concrete/stone/ceramics mean 29 90.6 470 78 6.8 0.10 934 2600min 6 1.0 80 0.10 50max 91 341.0 860 0.10 1967
Timber mean 6 6.5 118 0.55 149min 5 1.0 5 0.10 21max 6 12.0 231 1.00 277
Other mean 6 6.2 576 434 11.3 0.13 282 1970min 1 0.2 8 1 1 1.00 0.4 4max 16 33.0 3160 880 32 0.20 773 6000
MSW LandfillVersion 2.0 February 2010
33
Table B7. Weighted average concentrations of inorganic elements in representative MSW deposited in Australian landfillsCategory Propn. As Cd Cr Sb Se Hg Pb Zn Cu Ni SnOrganics 0.178 6.05 0.23 26.3 1.42 0 0.0392 25.28 54.47 9.43 2.67 0Paper, cardboard 0.13 0.39 0.41 3.5 0 0 0.0130 8.84 43.16 0 0 0Plastics 0.03 0.07 2.19 9.2 61.26 0.012 0.0048 20.34 33.24 272 19.95 34.8Glass 0.026 3.82 0.03 5.8 0 0 0.0026 7.93 1.17 0 0 0Metals 0.108 13.93 1.56 86.6 0 0 0 390 0 0 0 0Concrete, ceramics, stone 0.362 10.64 32.80 170.1 28.24 2.4616 0.0362 338 941 0 0 0Timber 0.046 0.25 0.30 5.4 0 0 0.0253 6.85 0 0 0 0Other (Miscellaneous) 0.12 0.76 0.75 69.1 52.08 1.356 0.0156 33.84 236 0 0 0weighted average conc. (kg/t) 0.036 0.038 0.376 0.143 0.004 0.00014 0.831 1.31 0.281 0.0226 0.0348
MSW LandfillVersion 2.0 February 2010
34
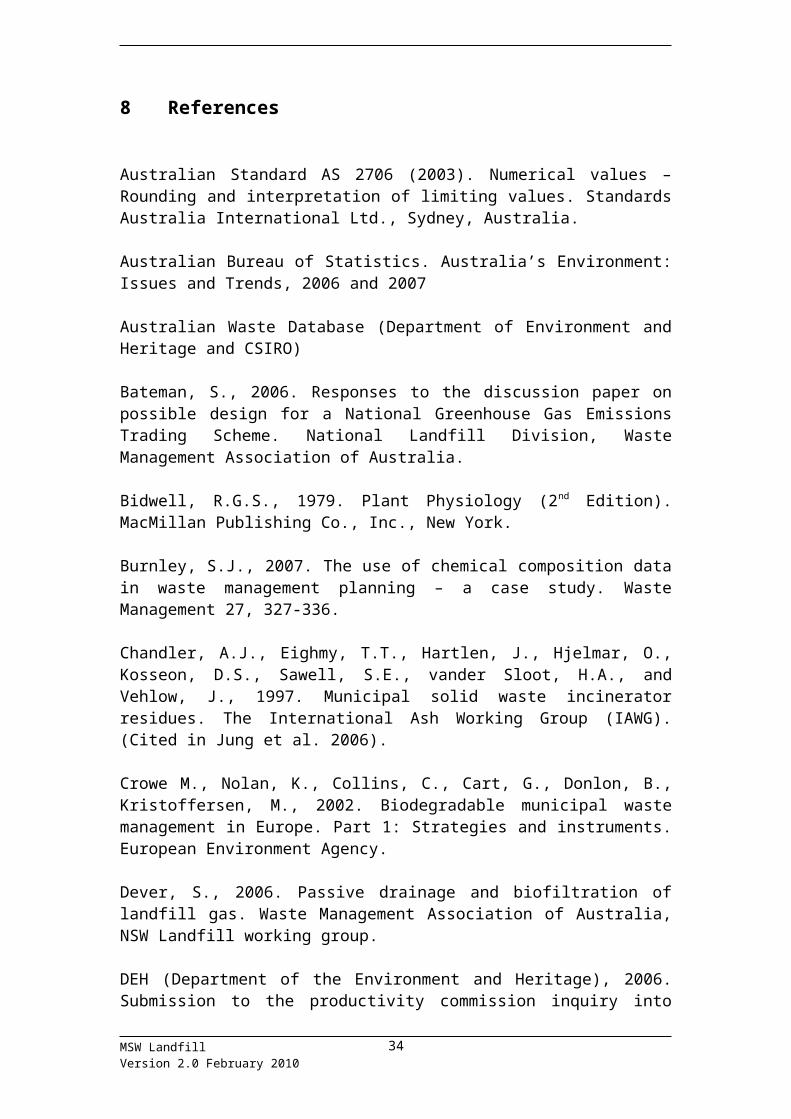
Table B8. Dry/wet weight ratios for various types of biodegradable MSW (USEPA, 2006).Material Dry/wet weight ratio
Cardboard 0.95Magazines 0.95Newspaper 0.95Office paper 0.95Food waste 0.30Garden waste: grass 0.30Garden waste: leaves 0.70Garden waste: branches 0.90Mixed biodegradable waste 0.84
MSW LandfillVersion 2.0 February 2010
35

Appendix C: Emissions estimation model – quick Guide for NPI Reporting
Quick Guide: Using LEA
1
Landfill / Facility Name
Facility ID
Address
Postcode
Latitude and Longitude or AMG Coordinates (km)
Please refer to online reporting system for co-ordinates for your facility
Landfill road, landfill
4053
7071.5N 497.75E
Facility Information
An example
12345
Please complete location details for the facility, including facility ID and Latitude & Longitude which are available from the npi reporting system.
2Capacity (tonnes)
or2B
Depth (m) 20
Area (m2) 1000
Landfill type compact
Density of Waste (kg/m3) 742 14840
if unknown, you must complete section 2B
Landfill Capacity
Calculate Landfill Capacity
Calc. Capacity (tonnes)
If the capacity (currently utilised) of the landfill is known, please enter in section 2. If is unknown, please complete the white cells in section 2B.
3Approx. opening year 1995
Approx. closure year 2020
Current year 2009
0
14
Year(s) since landfill closure
Year(s) since refuse placed
Years of Operation
you must indicate
Please enter the year the landfill was opened, approximate closure year and current reporting year.
MSW LandfillVersion 2.0 February 2010
36

4Climatic Conditions Australia 0.058
CH4 conc. (%) 55 100
CO2 + other constituents conc. (%)
45
Methane generation rate constant "k" (yr-1)
Methane generation potential "Lo" (m3/ t)
Methane Generation
Unless there is site specific information available for your facility, the default values in these cells should not be altered.
5Average Annual Acceptance Rate during Active Life (t/yr)
500
Accepted Hazardous Waste? No
Operating Conditions Australia
Site Specific VOC conc (ppmv)
If known, otherwise leave blank
Temperature of Landfill (oC) 25 Refer to Average Temp Chart
520
Operating Conditions & VOC Concentration
VOC conc. (ppmv)
Putrescible / municipal solid waste only
Please enter the average acceptance rate in t/yr for the facility. The model treats ‘Waste’ (inputs for design capacity and acceptance rate) as
completely biodegradable. The majority of MSW is not biodegradable waste, it is important to ensure that the annual acceptance rate is for biodegradable waste only. MSW has a dry weight/wet weight ratio of about 0.84 (USEPA, 2006) and about 35% of Australian MSW is biodegradable (ABS, 2006). Therefore the correction factor is 0.84*0.35 = 0.294.
MSW LandfillVersion 2.0 February 2010
37
The average temperature of the landfill gas should be higher than the ambient temperature indicated in the manual for your facility's location.
6Is the landfill lined? X
Site-specific collection efficiency? (%)
Site-specific leachate generation rate (L/yr)
or6B
Annual rainfall (mm) 1000 Refer to Average Rainfall
Efficiency of leachate collection (%)
70
8.76
Calculate Leachate Generation
Indicate with X if yes, otherwise leave blank
Leachate Generation
Leave blank unless site-specific data is known
Leachate generation (L/t)
Please enter X in Section 6 if your facility is lined, and the annual rainfall data for your facility's location
MSW LandfillVersion 2.0 February 2010
38

7Gas collection and control
system?X
Site-specific reduction efficiency? (%)
Leave blank unless site-specific data is known
Gas Collection System Flare
Efficiency of reduction system (%)
60
Flow rate before control (m3/min)
0.10Boiler / Steam turbine
Flare Gas Turbine IC Engine
CH4 flow rate (m3/min) 0.05 X
SUBSTANCE Calculated Values
NMOC 99.2 % if known
Halogenated species 97.7 % if known
Non-halogenated species 99.7 % if known
Mercury 0 % if known
Sulphur conc. in gas (ppmv)
Choride conc. in gas (ppmv)
Gas Collection System
Site Specific
if known
if known
put x in one of the cells below
Complete only if the landfill has a gas collection system
Indicate if yes only, otherwise leave blank
If you answered yes to having a gas collection and control system, you will need to import the CSV file "gas_collection" otherwise you will need to import worksheet "no_gas_collection" These worksheets will be generated once you export the report using the “Export to CSV” button in section 8.
If there is a gas collection system, please indicate if the gas is flared, used for steam generation, in a gas turbine or in an internal combustion engine.
If there is an ERROR displayed in the cells relating to the calculate values of NMOC, Halogenated species, and Non-halogenated species and you have answered yes to having a gas collection and control system, you will either need to enter a site specific values or select one option out of control options (Turbine, Flare, Gas Turbine or IC Engine). If you do not have a gas collection system in place, please ignore error message.
8 Push button to export E x p o r t t o C S V
Both of the following models produce more information than is required for NPI reporting: the ‘quick guides’ below indicate which results should be used for NPI reporting. The guides are not substitutes for the User Manuals: it is essential that these are read and understood before operating the software. They should be the primary reference.
Appendix D: Modifications to the MSW landfill emission estimation technique (EET) manual (Version 2.0, February 2010May 2023)
MSW LandfillVersion 2.0 February 2010
39
Page Outline of alteration2 added Section 1.2 Structured approach to NPI reporting4 revised Figure 2 Processes5, 8 added Figures 3 6, 7 added Table 1 12-19 added Chapter 4 Threshold calculations25 added Chapter 6 Transfer of NPI substances26 added Chapter 7 Additional reporting information28, 29 augmented Chapter 8 References30 added Appendix A Abbreviations and definitions 31 - 38 added Appendix B Leachate and waste characterisation data39 added Appendix C Emissions modelling
MSW LandfillVersion 2.0 February 2010
40