emission reduction efforts in jambi · atiek widayati and suyanto ... emission reduction efforts in...
TRANSCRIPT
Emission Reduction Efforts in Jambi: Towards Nesting
Approach
Substantive Report of REALU II- Indonesia
Atiek Widayati and Suyanto (editors)
World Agroforestry Centre – ICRAF Southeast Asia Regional Program Indonesia
Bogor – October 2013


Emission Reduction Efforts in Jambi:
Towards Nesting Approach
Substantive Report of REALU II- Indonesia
Atiek Widayati and Suyanto (editors) World Agroforestry Centre ICRAF Southeast Asia Regional Program Indonesia Bogor – October 2013

Citation
Widayati A and Suyanto S (eds). 2013. Emission Reduction Efforts in Jambi: Towards Nesting
Approach - Substantive Report of REALU II Indonesia. Bogor, Indonesia. World Agroforestry
Centre - ICRAF Southeast Asia Regional Program.
Acknowledgements
This document is developed based on the execution of activities, data analyses, discussions and
papers prepared for REALU II - Indonesia (Year-2 and Year-3), with the contributions of (in
alphabetical order): Arif Rahmanulloh, Aulia Perdana, Caecilia Yulita Novia , Dinna Tazkiana, Elok
Mulyoutami, Feri Johana, Gamma Galudra, Janudianto, Jasnari, Muhammad Sofiyuddin, Muhammad
Thoha Zulkarnain, Ni’matul Khasanah, Noviana Khususiyah, Putra Agung, Ratna Akiefnawati, Retno
Maryani, Subekti Rahayu
Supports from and collaboration with offices in Tanjung Jabung Barat, namely District Government,
District Forestry Office, Regional Planning Agency and HLG Farmer Groups are highly appreciated.
Cover photos
Atiek Widayati (left), Muhammad Sofiyuddin (right)

i
Table of Contents
1 REALU IN INDONESIA: TOWARDS NESTED EMISSION REDUCTIONS ............................................................... 1
1.1 INTRODUCTION .......................................................................................................................................... 1
1.1.1 REDD and land-based Nationally Appropriate Mitigation Action (NAMA) ....................................... 1
1.1.2 Nested emission reduction ................................................................................................................ 2
1.1.3 National and sub-national engagements towards nested emission reduction................................. 3
1.2 DEMONSTRATION LANDSCAPE ...................................................................................................................... 4
1.2.1 Tanjung Jabung Barat District as REALU demonstration landscape ................................................. 4
1.2.2 Summary of REALU feasibility and project design ............................................................................ 5
1.2.3 Demonstration landscapes as part of the nesting approach ............................................................ 6
1.3 REPORT OUTLINE ....................................................................................................................................... 7
2 EMISSION REDUCTION EFFORTS IN INDONESIA: PROCESSES AND READINESS AT NATIONAL LEVEL ............ 12
2.1 BACKGROUND ......................................................................................................................................... 12
2.2 INDONESIA’S ENGAGEMENT IN AND READINESS FOR REDD/REDD+ .................................................................. 12
2.2.1 REDD/REDD+ in Indonesia: historical perspectives ......................................................................... 12
2.2.2 REDD readiness and good forest governance ................................................................................. 14
2.2.3 Indonesia's National Action Plan to Reduce Greenhouse Gas Emissions (RAN-GRK) ...................... 16
2.3 WHAT`S NEXT? ........................................................................................................................................ 16
3 PROVINCIAL COMMITMENT FOR CLIMATE-NESTED GOVERNANCE: GOVERNING FOREST AND CARBON
THROUGH REDD+ AND NAMA IN JAMBI .............................................................................................................. 18
3.1 INTRODUCTION ........................................................................................................................................ 18
3.2 NESTED CLIMATE GOVERNANCE: STRENGTHS AND LIMITATIONS ......................................................................... 19
3.3 WHAT LIES BENEATH: THE POLITICAL PROCESS BEHIND NAMA AND REDD+ IN INDONESIA .................................... 19
3.4 ABOUT JAMBI: DEFORESTATION, EMISSION AND OPPORTUNITIES FOR EMISSION REDUCTIONS .................................. 20
3.5 REDD+ AND NAMA IN JAMBI ................................................................................................................... 21
3.6 WHAT LIES AHEAD: BRIDGING THE GAP TOWARD NESTED CLIMATE GOVERNANCE .................................................. 26
4 LOW EMISSION DEVELOPMENT INITIATIVES IN TANJUNG JABUNG BARAT DISTRICT................................... 27
4.1 INTRODUCTION ........................................................................................................................................ 27
4.2 OVERALL METHODS .................................................................................................................................. 27
4.3 INTEGRATING THE LAND-BASED DEVELOPMENT PLAN AND SPATIAL PLAN.............................................................. 28
4.4 ESTIMATING HISTORICAL AND FUTURE GHG EMISSIONS ................................................................................... 29
4.5 SETTING UP REFERENCE EMISSION LEVELS (RELS) .......................................................................................... 31
4.6 DEVELOPING APPROPRIATE LOCAL MITIGATION ACTION .................................................................................... 32
4.7 DISCUSSION AND CONCLUSION .................................................................................................................... 34
5 REVIEW OF TRANSACTION AND IMPLEMENTATION COSTS FOR EMISSION REDUCTION EFFORTS IN
INDONESIA .......................................................................................................................................................... 36
5.1 INTRODUCTION ........................................................................................................................................ 36
5.2 SCOPE OF TRANSACTION COSTS ................................................................................................................... 37
5.3 SCOPE OF IMPLEMENTATION COST ............................................................................................................... 38
5.4 ESTIMATING TRANSACTION AND IMPLEMENTATION COSTS OF REDD+ IN INDONESIA ............................................. 39
5.4.1 Transaction costs of land and forestry projects in Indonesia .......................................................... 39
5.4.2 Estimating REDD+ implementation cost components .................................................................... 40
5.4.3 Strategies to reduce transaction and implementation costs .......................................................... 42
ii
5.5 CONCLUDING REMARKS ............................................................................................................................. 42
6 INCENTIVE MECHANISMS FOR PEAT FOREST PROTECTION: FORMALIZATION OF COMMUNITY FORESTRY
MECHANISM ........................................................................................................................................................ 43
6.1 INTRODUCTION ........................................................................................................................................ 43
6.2 METHODS .............................................................................................................................................. 44
6.2.1 Towards community forests in peat protection areas .................................................................... 44
6.3 FINDINGS................................................................................................................................................ 45
6.3.1 Community perceptions of the KPHLG area .................................................................................... 45
6.3.2 Local community institutions .......................................................................................................... 46
6.3.3 Land tenure ..................................................................................................................................... 46
6.3.4 Community-managed forest formalization .................................................................................... 47
6.3.5 Facilitating the establishment of HKm ............................................................................................ 49
6.4 DISCUSSIONS ........................................................................................................................................... 49
6.5 THE WAY FORWARD .................................................................................................................................. 49
7 PERCEPTIONS ON AGROFORESTRY SYSTEMS AND JELUTONG (DYERA POLYPHYLLA) FOR PEATLAND
FARMING ............................................................................................................................................................. 51
7.1 INTRODUCTION ........................................................................................................................................ 51
7.2 METHODS .............................................................................................................................................. 52
7.2.1 Rapid Appraisal of Agroforestry Practices, Systems and Technology (RAFT) .................................. 52
7.2.2 Literature review and key informant interviews on jelutong .......................................................... 52
7.2.3 Household surveys on local perceptions ......................................................................................... 52
7.3 RESULTS AND DISCUSSION .......................................................................................................................... 53
7.3.1 Local perceptions on peatland and farming systems in Tanjabar .................................................. 53
7.3.2 Overview of jelutong in Indonesia and Jambi ................................................................................. 54
7.3.3 Jelutong cultivation typologies ....................................................................................................... 56
7.3.4 Jelutong agroforestation, magnitude and distribution in Tanjabar................................................ 57
7.3.5 Perceptions on jelutong .................................................................................................................. 58
7.3.6 Land tenure and policy affecting jelutong ...................................................................................... 60
7.3.7 Strengths, weaknesses, opportunities and threats (SWOT) assessments on jelutong in Tanjabar. 60
7.4 RECOMMENDATIONS: PROMOTION AND ADOPTION PROCESS ............................................................................ 61
8 MARKET ACCESS AND VALUE CHAIN OF JELUTONG LATEX .......................................................................... 62
8.1 INTRODUCTION ........................................................................................................................................ 62
8.2 METHODS .............................................................................................................................................. 62
8.3 JELUTONG LATEX OVERVIEW ....................................................................................................................... 63
8.4 JELUTONG LATEX VALUE CHAIN .................................................................................................................... 64
8.5 VALUE CHAIN ACTORS ............................................................................................................................... 65
8.6 GOVERNANCE AND INSTITUTIONS INVOLVED .................................................................................................. 66
8.7 CONCLUSIONS AND RECOMMENDATIONS ...................................................................................................... 68
9 PEAT CARBON EMISSIONS RESULTING FROM FOREST CONVERSIONS ......................................................... 69
9.1 INTRODUCTION ........................................................................................................................................ 69
9.2 METHODS .............................................................................................................................................. 70
9.2.1 Carbon stock difference approach .................................................................................................. 70
9.2.2 Rate of subsidence and microrelief approaches ............................................................................. 71
9.3 DATA COLLECTION AND ANALYSES................................................................................................................ 71
9.3.1 Carbon stock difference approach .................................................................................................. 71
9.3.2 Rate of subsidence and microrelief approaches ............................................................................. 72

iii
9.4 RESULTS AND DISCUSSIONS ........................................................................................................................ 75
9.4.1 Measured plots ............................................................................................................................... 75
9.4.2 Relationship between total belowground carbon stock and peat depth ........................................ 77
9.4.3 Carbon loss after land conversion ................................................................................................... 77
9.5 INITIAL CONCLUSIONS AND WAY FORWARD .................................................................................................... 78
10 LESSONS LEARNED AND MOVING FORWARD .............................................................................................. 80
10.1 SUMMARY OF APPROACHES ........................................................................................................................ 80
10.2 LESSONS LEARNED .................................................................................................................................... 80
10.2.1 Dynamics of REDD+ and NAMA in relation to the nesting approach ......................................... 80
10.2.2 Incentives and enabling conditions ............................................................................................ 81
10.3 PARTNERSHIPS AND CAPACITY STRENGTHENING .............................................................................................. 81
10.4 MOVING FORWARD TO ‘SECURING EMISSION REDUCTION WITH A LANDSCAPE APPROACH’ ...................................... 82
11 ANNEXES ..................................................................................................................................................... 83
11.1 ANNEX 1 – REDD COST TABLES .................................................................................................................. 83
11.2 ANNEX 2 - LIST OF PUBLICATIONS ................................................................................................................ 84
12 LIST OF REFERENCES .................................................................................................................................... 86

1
1 REALU in Indonesia: towards nested emission
reductions
Atiek Widayati
1.1 Introduction
1.1.1 REDD and land-based Nationally Appropriate Mitigation Action (NAMA)
Initiatives on climate change mitigation efforts have been developed over time through RED,
REDD and REDD+. They have been discussed widely especially for the past six years since COP-13
in Bali in 2007. Debate hinged on challenges in developing incentive mechanisms due to the
contentious definition of forest. Inclusion of other land uses and the identification of potential
carbon sinks or CO2 removal mechanisms were then reviewed. For accounting purposes, the
Intergovernmental Panel on Climate Change (IPCC) guidelines (IPCC 2006) decided that
accounting methods should include all sources of carbon pools (Agriculture, Forestry and Other
Land Uses [AFOLU]) and emissions should be proportioned to the land-use sources from where
they originated.
The Alternatives to Slash-and-Burn (ASB) Partnership for the Tropical Forest Margins seriously
considered the inclusion of all sources of land-use based carbon pools and proposed the
Reducing Emissions from All Land Uses (REALU) framework in this context. This framework
consists of four pillars that reflect (1) the inclusion of emission reductions from deforestation and
degradation (as in REDD), (2) emission reductions from peatlands, (3) enhancement of carbon
sequestration and (4) emission reductions from agricultural activities (van Noordwijk et al 2009).
The importance of recognizing indigenous people rights through ‘free, prior and informed
consent’ (FPIC) was underscored as well as ensuring respect for national sovereignty within
differentiated global responsibilities for assuring sustainable livelihoods and addressing climate
resilience.
NAMA refers to a set of policies and actions that countries undertake as part of a commitment to
reduce greenhouse gas emissions (GHGs). It is expected to be the main vehicle for mitigation
actions for developing and combining attempts to facilitate activities such as low-emission
enhancement. It was formally promulgated in Indonesia in 2010 in which emission reduction was
targeted of as much as 26 percent below projections for 2020, with an additional 15 percent
reduction subject to multilateral support. As part of the commitment, the land-based sector
under Indonesia’s NAMA includes REDD, emission reduction from peatlands and carbon
sequestration in forestry and agriculture. Action plans to respond to the enactment are part of
Presidential Regulation 61/2011 which established Indonesia's National Action Plan to Reduce
Greenhouse Gas Emissions (RAN-GRK) under the coordination of the National Planning Board for
Development (Bappenas).

2
1.1.2 Nested emission reduction
Nested emission reduction was introduced as a hybrid approach within the REDD scheme for
accounting and for incentive mechanisms combining national- and sub-national-level projects
(Angelsen et al 2008; Pedroni et al 2009). The arguments behind nesting lie in the search for the
‘right scale’ for the REDD mechanism (Angelsen et al 2008), where multiple projects might be
involved at various sub-national scales as well as registration for credits through bilateral and
multilateral channels at the national level. The scale is also reflected in capacities and governance
systems that presumably vary across national and sub-national levels. If implementation is more
promising at the sub-national level, there is potential for project implementation at sub-national
and local levels which can be scaled up to the national level. This can then lead to extrapolating
the successes for generating overall designs for national programs and to serve as guides for
improving governance across all levels. For the REDD credit system, nesting will allow efforts to
start as sub-national activities or projects and move up to the national accounting system while in
some other instances it allows simultaneous credit mechanisms at the two levels (Angelsen
2008). As argued by Pedroni et al (2009), the nested approach will likely encourage developing
countries to take national action faster than a top-down approach that risks losing time with a
year-long readiness-building process.
A range of concepts under nesting within REDD+ have been widely discussed. However, the
nesting approaches for all-land-uses through the NAMA mechanism and its sub-national
derivatives have not been widely debated. For Indonesia, nesting approach under NAMA should
take place in line with national and subnational governments’ hierarchies. The approach has been
exercised through ICRAF’s involvement in the dynamics at national and sub-national levels. Both
top-down and bottom-up approaches are implied in the processes and interactions. Conceptually,
nested approach for Indonesia’s context is proposed in which each level has specific roles with
regard to negotiations and aggregation of plans and targets implying iterative processes (Figure
1.1.). REALU work in Indonesia contributes to the three levels through different roles and forms
of engagement, which will be elaborated further in the following sections and chapters of this
report.
Figure 1.1 Nesting concept for all-land-use approaches proposed for Indonesia (Dewi, pers. comm.)
3
1.1.3 National and sub-national engagements towards nested emission reduction
In Indonesia, REDD discussions and processes have become a strong domain in the forestry
sector, while the emerging NAMA with RAN-GRK was channeled through the national
development planning sector. ICRAF Indonesia is involved in and contributes strongly to the
various processes under RAN-GRK, mostly via capacity strengthening towards developing
mitigation action plans. REALU Indonesia, together with other ICRAF projects and programs in
Indonesia, has been actively supporting the various country-wide activities involving various
government and non-government agencies. The Land Use Planning for Low Emission
Development Strategies (LUWES) framework (Dewi et al 2011) and the software ABACUS SP
(Harja et al 2012) were developed by the ICRAF Indonesia team and these tools have been
adopted for calculating baselines and reference emission levels (RELs) and for simulating ex-ante
mitigation scenarios.
At the provincial level, action plans are formulated under Sub-national Action Plans to Reduce
Greenhouse Gas Emissions (RAD-GRK). The progress of RAD-GRK throughout provinces is at
various stages, but overall is still embryonic. One of the priority provinces in the national debate,
Jambi, is an area where ICRAF has long been engaged. In Jambi, the REDD+ mechanism has been
making progress in the past few years while RAD-GRK only started recently. ICRAF is currently
engaged with provincial stakeholders in Jambi in the design and development of ‘Provincial
Strategy and Action Plan on Emissions Reduction’ (SRAP) under the REDD+ mechanism. In light
of moving forward under the land-based NAMA at the sub-national level, ICRAF also aims at
linking emission reduction strategies developed by both forces, by assisting them in developing
RELs in their respective documentations. The REALU project has played a major role in
implementing these initiatives and engagements have started through contributions to technical
meetings and discussions towards developing formal provincial documentation.
Demonstration activities towards reducing emissions from all land uses and all sectors are mostly
conducted in the more local context, where engagements with stakeholders and actors are
realistically addressed. For Indonesia, district (kabupaten) is the level below province where
regional autonomy takes place and where programs and development activities are operational.
REALU Indonesia selected one district in Jambi Province as its demonstration landscape where
emission reduction efforts are to take place. To serve ‘demonstration’ purposes, the selection of
a demonstration landscape for REALU is key, because it should consider potentials for emission
reduction targets yet pose sufficient challenges to represent a degree of complexities of
emission reduction efforts at the Indonesian sub-national level. The designed activities should
also take into account the adoption of ongoing efforts/programs, the local biophysical and
sociocultural settings while introducing innovative ideas that overall are expected to improve the
processes for better landscape management as well as governance.
Tanjung Jabung Barat (Tanjabar) District is a REALU demonstration landscape where ICRAF
through the REALU project has been engaged since 2010 in project implementation. Through the
diagnostic approaches in various assessments at the district level, understanding on feasibility
towards low emission development (LED) and emission reduction strategies was successful and
further initiatives towards intervention in different sectors with multiple stakeholders have been
implemented.
4
1.2 Demonstration landscape
1.2.1 Tanjung Jabung Barat District as REALU demonstration landscape
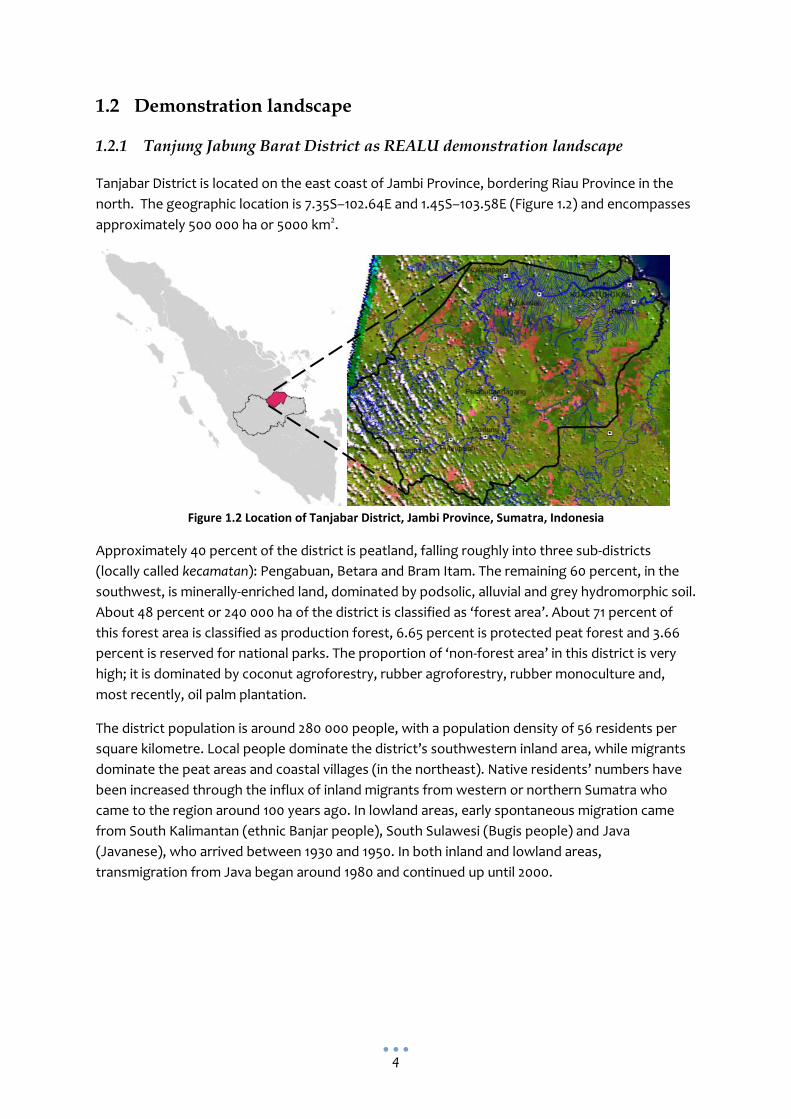
Tanjabar District is located on the east coast of Jambi Province, bordering Riau Province in the
north. The geographic location is 7.35S–102.64E and 1.45S–103.58E (Figure 1.2) and encompasses
approximately 500 000 ha or 5000 km2.
Figure 1.2 Location of Tanjabar District, Jambi Province, Sumatra, Indonesia
Approximately 40 percent of the district is peatland, falling roughly into three sub-districts
(locally called kecamatan): Pengabuan, Betara and Bram Itam. The remaining 60 percent, in the
southwest, is minerally-enriched land, dominated by podsolic, alluvial and grey hydromorphic soil.
About 48 percent or 240 000 ha of the district is classified as ‘forest area’. About 71 percent of
this forest area is classified as production forest, 6.65 percent is protected peat forest and 3.66
percent is reserved for national parks. The proportion of ‘non-forest area’ in this district is very
high; it is dominated by coconut agroforestry, rubber agroforestry, rubber monoculture and,
most recently, oil palm plantation.
The district population is around 280 000 people, with a population density of 56 residents per
square kilometre. Local people dominate the district’s southwestern inland area, while migrants
dominate the peat areas and coastal villages (in the northeast). Native residents’ numbers have
been increased through the influx of inland migrants from western or northern Sumatra who
came to the region around 100 years ago. In lowland areas, early spontaneous migration came
from South Kalimantan (ethnic Banjar people), South Sulawesi (Bugis people) and Java
(Javanese), who arrived between 1930 and 1950. In both inland and lowland areas,
transmigration from Java began around 1980 and continued up until 2000.

5
1.2.2 Summary of REALU feasibility and project design1
Diagnostic steps are needed prior to building scenarios, designing implementation activities and
developing further engagements with the relevant actors on emission reduction action plans. For
the REALU demonstration landscape in Indonesia, feasibility studies and design towards emission
reduction efforts were completed in the first year of project implementation (Widayati et al 2011).
The objectives of the work were:
To understand livelihoods and responses to landscape dynamics related to CO2
emissions, land rights and forestry policies.
To develop scenarios for LED based on consultation with local stakeholders.
To assess the trade-off with, and impacts on, livelihoods implied through land-use
changes both from historical changes as well as from the simulated changes as part
of an LED scenario.
To identify areas and find evidence that supports project intervention that is based on
major drivers of land-use changes and emissions, which reflect REALU principles and
are in line with or additional to ongoing local efforts.
Diagnostic steps to achieve the understanding on the backgrounds of emissions applied the
REDD/REALU Site Feasibility Appraisal (RESFA) framework. The sampling scheme was designed
to ensure representativeness of the district typology by taking into account the two important
properties for land-use development in Tanjabar: major soil types (peatland and mineral soils)
and types of community (local and migrants). Beyond the diagnostic appraisal, attempts were
made to simulate future land-use dynamics including trade-off assessment under different
scenarios conducted in the FALLOW modeling tool (van Noordwijk 2002). Based on the
simulation results, RELs and emission reduction strategies were established. The policy
instruments and institutional settings for REDD/REALU were reviewed in order to obtain
comprehensive vision of the enabling conditions.
The discussions towards the intervention designs for REALU in Tanjabar were initiated with the
establishment of RELs resulting from FALLOW simulation. The emission reduction strategy that
reflects approaches and values proposed by REALU employs the simulated results of the REALU
scenario, which reflects both reasonable emission reduction as well as low amounts of foregone
economic opportunities relative to ‘business as usual’ (BAU) by 2020 (Mulia et al 2013). By
considering the contribution of reduced emissions through avoided emissions and carbon
enhancement, enabling institutional and policy baselines as well as local efforts, two potential
intervention sites were proposed, each with strengths and challenges to be addressed: KPHLG
(Peat Protection Forest) in the vicinity of peat forest remnants and KPHP (Production Forest
Management Unit) Open Access areas in the western part of the district (Widayati et al 2011).
At the district level, emission reduction strategies should be part of development planning and
participation of district multistakeholders should be ensured in developing the strategies. The
LUWES framework established by ICRAF Indonesia is a framework that integrates the processes
1 Conducted in 2010-2011 and has been reported in: Widayati A, Suyanto, van Noordwijk M(eds). 2011
Towards Reduced Emissions in a High-stake District- RELAU Project Design for Tanjung Jabung Barat (Tanjabar), Jambi, Indonesia, REALU Report

6
of identifying emission sources, calculating historical emissions, predicting future emissions by
considering historical emissions and local development plans, setting up RELs and mitigation
action plans, and determining an implementation strategy (Dewi et al 2011). LUWES was applied
for Tanjabar to develop RELs, scenarios and mitigation action plans that involve
multistakeholders in the district (Ekadinata and Agung 2011). One of the scenarios for emission
reduction based on LUWES application in Tanjabar focused on the mitigation action plan in the
KPHLG area. It spelled out cumulative aboveground CO2 emission reduced to be 1.48 Mg
CO2/ha/year, or 27 percent reduction relative to BAU (Ekadinata and Agung 2011). This scenario
provides high emission reduction target by still considering the realistic design of action plans.
Local stakeholders involved indicated relevant activities under this action plan, which include
three key activities: promote the concept of conservation/protected areas and their purpose to
communities around the KPHLG, establish relevant local institutions to support the KPHLG,
promote the value of Dyera species among local communities and explore its access to national
and international markets (see Chapter 6 of this report).
Hutan Lindung Gambut (HLG) or peat protection forest is based on the Jambi Governor Decree
(on ‘peta padu serasi TGHK and RTRW’ No. 108/1997) and the Decree of the Jambi Forest Agency
No. 425.3/2350/Dinhutbun/2004 on 11 May 2004. The total peat protection area is approximately
16 065 ha. Some parts of HLG have been used by the local community as log transportation
paths. Data from the district forest agency show that around 4624 ha have been occupied by
local farmers for farming. Ditches and canals are built manually and semi-mechanically to regulate
water flow and for transportation.
1.2.3 Demonstration landscapes as part of the nesting approach
As part of engagements in climate change mitigation efforts nationally, REALU Indonesia,
together with other relevant programs and projects conducted by ICRAF Indonesia, participates
in various discussions and processes in the development of national REDD strategies as well as
capacity strengthening for emission accounting methods. At the same time, engagements at the
sub-national level are implemented through demonstration activities to provide a foundation for
emission reduction purposes in the demonstration landscape of Tanjabar District. At the sub-
national demonstration landscape level, mini-nesting approaches are also applied, with
engagements and activities taking place both at the district level as well as for ‘focused
intervention areas’. The conceptual framework of the entire set of engagements and activities in
the demonstration landscape is presented in Figure 1.3.

7
Figure 1.3 The conceptual framework for different work components in Tanjabar demonstration landscape
(Note: Letters in brackets refer to components listed in the framework in Table 1.1)
Implementation at the district level is carried out through dialogue with the District Spatial
Planning Office (Badan Perencanaan Daerah- BAPEDA) for LED planning while the sub-district
focused intervention area refers to the remaining remnants of peat swamp forest in which
engagements with local actors have been initiated towards establishment of community-based
peat protection forest. Juxtaposing these two processes, other pertinent activities are also
designed to support emission reduction efforts. Smallholder mixed farming and agroforestry
systems of various cash crops occupy a substantial area of the district both in the peatland area
and the mineral soils area - approximately 120 000 ha in 2010. Industrial crop plantations have
intensified with oil palm and acacia flourishing in the most recent decades. Perceptions of local
farmers towards the current agroforestry systems have been assessed to observe the likelihood
of maintaining these local commodities in the future as opposed to converting their lands to
monoculture plantations. This has included assessment of endemic species of jelutong, the latex
of which has good commercial value. Jelutong was once harvested widely by local farmers as a
non-timber forest product (NTFP) from the peat swamp forest now referred to as Hutan Lindung
Gambut (HLG) and recently has been promoted as part of the peat swamp forest rehabilitation
thrust. Jelutong’s market potential was also analysed as well as other enabling conditions for the
jelutong replanting program. The other relevant assessments for Tanjabar’s peatland area
addressed understanding of belowground peat emissions due to conversions to agricultural
crops. Elaboration on these subjects discussed in this report is provided in Table 1.1.
1.3 Report Outline
The report is structured to correspond with each of the sub-topics in Figure 1.3 and Table 1.1 and
their interlinkages. Discussions at the national level, including REDD readiness for Indonesia are

8
elaborated in Chapter 2, followed by observations on provincial-level dynamics, in this case Jambi
Province in Chapter 3. Engagements at the district level towards LED planning are described in
Chapter 4. Analyses on transaction costs for REDD mechanisms are found in Chapter 5. Efforts
towards community forestry scheme in HLG area are also reported (Chapter 6) followed by
perceptions on the potentials of jelutong and other smallholder agroforestry commodities
(Chapter 7) and market potentials for jelutong (Dyera polyphylla) (Chapter 8). Initial findings and
ongoing work on the estimation of peat emissions are reported in Chapter 9. Chapter 10
synthesizes REALU II activities and how they can link to the next phase of REALU work .

9
Table 1.1 Objectives of various components of REALU project in Indonesia
Central hypotheses Leading questions Specific Objectives
(a) Within REDD/REDD+/REALU arena at
the national level, how is the
dynamics? What is the state of
readiness ? what are the costs
implied in the emission reduction
efforts?
(a) Climate change mitigation processes addressing
emission reduction in Indonesia have been
progressing at the national level. The REALU project
contributes to backstopping them through dialogue.
Recently, initiatives at the sub-national level are
starting (provincial level) through both the REDD+
pathway (SRAP) and the land-based sector of GHG
reduction action plan (RAD-GRK).
Backstopping activities at the provincial level is
relevant and was emphasized in REALU II year 3 and it
is important to eventually link-up with interventions
for emission reduction taking place at the district
level (demonstration landscape).
To proceed with the ‘nested’
approach in emission reduction
strategies, what is the platform at
the provincial level to govern
emission reductions in Jambi
Province as well as to link the
national-level discussions and the
mitigation actions at the district
level?
Specific objectives:
1. To engage with the provincial REDD task force through participation
in its agenda and in the write-up process of the provincial REDD+
strategy and action plan (SRAP)
2. To backstop and assist in establishing the nesting approach
between national and sub-national land-based mitigation actions
(NAMA & LAMA) through legitimate institutions and frameworks, i.e.
RAD-GRK by:
a. strengthening the provincial baseline and REL based on
available maps and other relevant information
b. connecting provincial- and district-level discussions in
establishing baselines and REL, e.g. through support to provincial
RAD in disseminating the discussions to districts.
3. To backstop dialogues between provincial RAD-GRK and the
provincial REDD task force towards achieving synergies for the
development of mitigation action plans by:
a. reviewing the documents on RAD-GRK and SRAP
b. discussions and consultations with both parties (RAD and SRAP)
on linking their mutual baselines, REL and strategies
(b) For LED at the district level, after a series of
capacity-strengthening exercises, iterations of
In moving forward with LED at the
district level, what are the entry
points/channels for negotiation?
1. To facilitate the revision of emission reduction scenarios for
Tanjabar and Merangin districts based on the results of public
consultations and to proceed with expressing the scenarios into their

10
technical assistance and joint efforts with local
district offices in developing mitigation action plans,
strategic approaches are needed to ensure that LED
will be taken into account as a technical reference for
district documentation.
What can be the minimum/ realistic
targets to ensure the inclusion of
LED in district spatial planning?
mitigation action plans
2. To align the technical documentation of district LED scenarios into
formal district development planning frameworks by closely engaging
with district administration/authorities in the LED formulation
(c) Land-use dynamics in Tanjabar peatland are
dominated by both large-scale operators and
smallholder farmers. Land management on peatland
for farming inevitably includes construction of
drainage canals which affect the peat and trigger
belowground CO2 emissions. Drainage canals in large-
scale plantations are normally wide and deep with
large spacing between major canals, while canals in
smallholder farming are shallow and small, with
smaller spacing in between.
Can management practices be
associated with different rates of
belowground CO2 emissions? Do CO2
emissions differ between
conversions to smallholder farms
and those to large-scale plantations?
With limited data and resources
what proxies that can be applied for
such estimates? And eventually what
are the estimated amounts of CO2
emissions at the landscape level, vis-
à-vis different land uses and scales?
1. To estimate emission rates per year for several major land cover types based on the peat subsidence approach 2.To improve peat emission rates obtained from stock differences by applying more accurate canal distances mapped by VHR imaging 3. To compare emission rates obtained from the subsidence method to those obtained from the stock difference approach 4. To explore the scaling-up approaches for the entire peatland area of Tanjabar:
a. by finding relationships between information from VHR images and those from medium resolution images (Landsat) b. by distinguishing the spatial characteristics of canal drainage systems from each land cover type and applying the emission rate value to the particular land cover type to be scaled-up at the landscape level through the recent land cover map
(d) & (e) Existing farming systems in Tanjabar
peatland include various smallholder agroforestry
systems of, among others, coconut, coffee, betelnut.
Rehabilitation of encroached areas in the remaining
HLG also bears potential to be developed into
agroforestry/mixed systems. Jelutong was one
important NTFP tree in the past; it may hold potential
to be part of a peat agroforest system in local
farmlands. Perceptions on both existing mixed
systems and the potential of jelutong as part of local
What are the perceptions of local
farmers on the existing agroforestry
systems? What is the potential for
jelutong planting as part of the peat
agroforestry system to be emission
friendly? What types of mixed
farming system are perceived to
have potential for jelutong?
Specific objectives:
1. Related to HLG and jelutong planting
a. to collect information on permitted tree and crop species in
HLG referring to each zone, on NTFP policies for protection
forest and on the future of the rehabilitation programme
b. To obtain farmers’ perceptions on the performance of current
jelutong planting and their expectations in the future
2. Agroforestry potential in peatland areas
a. To obtain farmers’ perceptions on current mixed
11
farming systems are important for assessing future
smallholder farming systems on peatland as opposed
to the development of monoculture plantations of oil
palm and acacia
farming/agroforestry systems and their preferences in this
context in peatland areas (tree+cash crops+food crops, etc)
b. To obtain farmers’ preferences on tree species as part of
mixed/agroforestry systems on their lands
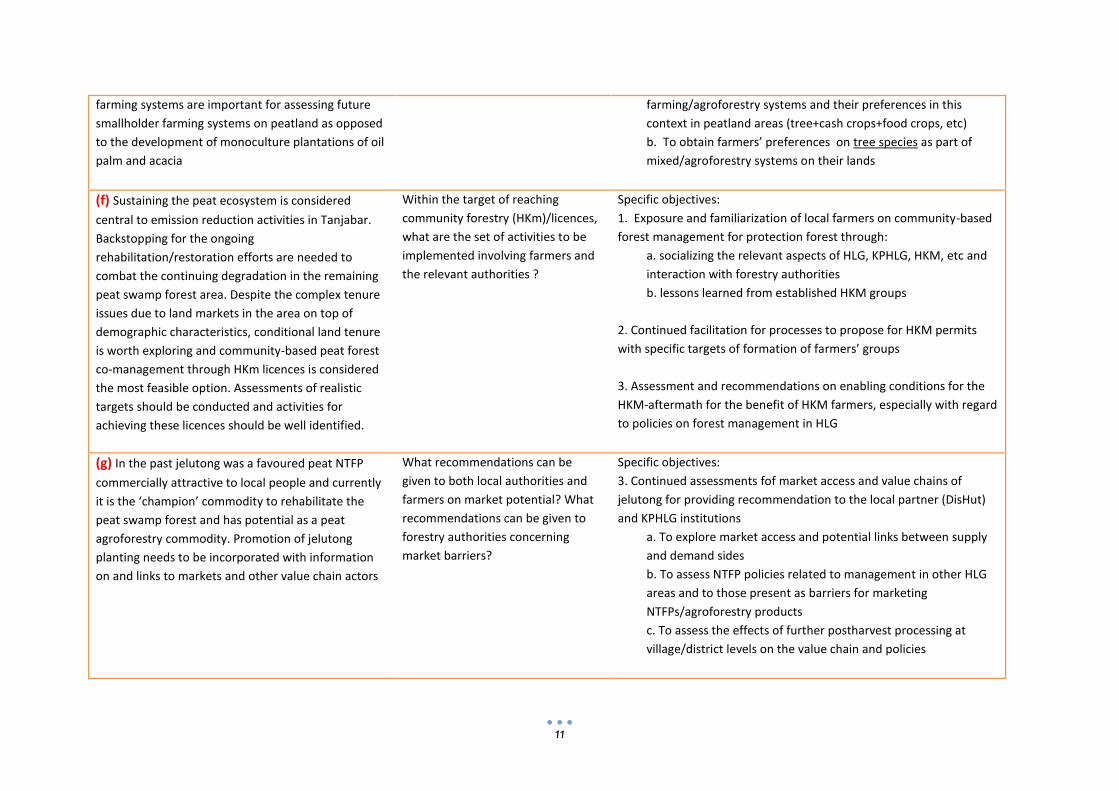
(f) Sustaining the peat ecosystem is considered
central to emission reduction activities in Tanjabar.
Backstopping for the ongoing
rehabilitation/restoration efforts are needed to
combat the continuing degradation in the remaining
peat swamp forest area. Despite the complex tenure
issues due to land markets in the area on top of
demographic characteristics, conditional land tenure
is worth exploring and community-based peat forest
co-management through HKm licences is considered
the most feasible option. Assessments of realistic
targets should be conducted and activities for
achieving these licences should be well identified.
Within the target of reaching
community forestry (HKm)/licences,
what are the set of activities to be
implemented involving farmers and
the relevant authorities ?
Specific objectives:
1. Exposure and familiarization of local farmers on community-based
forest management for protection forest through:
a. socializing the relevant aspects of HLG, KPHLG, HKM, etc and
interaction with forestry authorities
b. lessons learned from established HKM groups
2. Continued facilitation for processes to propose for HKM permits
with specific targets of formation of farmers’ groups
3. Assessment and recommendations on enabling conditions for the
HKM-aftermath for the benefit of HKM farmers, especially with regard
to policies on forest management in HLG
(g) In the past jelutong was a favoured peat NTFP
commercially attractive to local people and currently
it is the ‘champion’ commodity to rehabilitate the
peat swamp forest and has potential as a peat
agroforestry commodity. Promotion of jelutong
planting needs to be incorporated with information
on and links to markets and other value chain actors
What recommendations can be
given to both local authorities and
farmers on market potential? What
recommendations can be given to
forestry authorities concerning
market barriers?
Specific objectives:
3. Continued assessments fof market access and value chains of
jelutong for providing recommendation to the local partner (DisHut)
and KPHLG institutions
a. To explore market access and potential links between supply
and demand sides
b. To assess NTFP policies related to management in other HLG
areas and to those present as barriers for marketing
NTFPs/agroforestry products
c. To assess the effects of further postharvest processing at
village/district levels on the value chain and policies

12
2 Emission reduction efforts in Indonesia:
processes and readiness at national level
Suyanto, Putra Agung, Feri Johana
2.1 Background
Indonesia has made an international commitment to unilaterally reduce greenhouse gas (GHG)
emissions by as much as 26 percent below projections for 2020 independently with an additional
15 percent reduction planned via multilateral support. The independent commitment of 26
percent is at the core of Presidential Regulation 61/2011 on Indonesia's National Action Plan to
Reduce Greenhouse Gas Emissions (RAN-GRK). The National Planning Board for Development
(Bappenas) is to coordinate with all provincial governments in developing their Subnational
Action Plans to Reduce Greenhouse Gas Emissions (RAD-GRK). More than 80 percent of the
emission reduction target comes from the land-based sector (agriculture and forestry). Another
15 percent is implemented through multilateral mechanisms such REDD/REDD+.
2.2 Indonesia’s engagement in and readiness for REDD/REDD+
2.2.1 REDD/REDD+ in Indonesia: historical perspectives2
Indonesia addresses policies on REDD+ through several negotiations at international forums;
adoption is carried out after discussions both in-country and at the regional (Asia−Pacific) level.
Policies are developed and promulgated following analysis of regulations, working group results
and the terms of new agreements, in addition to demonstration activities supported through
bilateral cooperation or multilateral collaboration.
The plan to allow all countries to participate in the reduction of GHG emissions emerged at the
Montreal Summit on Climate Change in 2005. At the 11th session of the United Nations Framework
Convention on Climate Change (UNFCCC), deforestation was raised as an issue to be addressed
under the agenda of ‘Reducing Emissions from Deforestation in Developing Countries’. Most
parties have responded positively and this has raised the significant issue of how national
circumstances can be accommodated in a fair and equitable manner in the context of addressing
forestry issues under the climate change convention.
Following up on the Montreal decision, Indonesia hosted communication, coordination and
consultation events on REDD-related issues. The Indonesia Forest Climate Alliance (IFCA) was
formed to complement preparations for COP-13 in Bali in 2007. IFCA conducted a study that
resulted in a framework for reducing emissions from deforestation and forest degradation. The
framework serves as the basis to formulate forest policies, establish pilot projects and develop
appropriate methodologies through research-related initiatives. The published version—
2 Primarily based on Maryani R, Agung P and Suyanto S. 2012. REDD+ in Indonesia: a historical
perspective. Working paper 154. 20 p, ICRAF

13
Consolidation report: reducing emissions from deforestation and forest degradation in Indonesia—
was issued by the Ministry of Forestry in 2008.
COP-13 adopted two decisions, namely the ‘Bali Action Plan’ as Decision 1/CP13 Para 1 (b) (iii) and
‘Reducing Emissions from Deforestation in Developing Countries: Approaches to Stimulate
Action’ as Decision 2/CP13.
In Decision 1 the concept of REDD+ was identified in the following statement as: “Policy
approaches and positive incentives on issues relating to reducing emissions from deforestation
and forest degradation in developing countries; and the role of conservation, sustainable
management of forests and enhancement of forest carbon stocks in developing countries”.
Together with Decision 2, COP-13 raised five issues which were contentious for many countries: (i)
scope—what should be included in the definition of REDD; (ii) measurement, reporting and
verification (MRV); (iii) rights of indigenous people (IP); (iv) financing options; and (v)
institutional arrangements—whether REDD activities were to be considered at national or
project levels.
Regarding scope, parties debated whether this pertained to conservation and sustainable
management of forests, enhancement of carbon stocks in developing countries and whether it
applied to forestry per se or all land use and land-use change and forestry (LULUCF). Biodiversity
and social benefits were two other key scope issues. For IP rights there was a suggestion to
include indigenous people and local communities as stakeholders, and the extent of their rights
would include participation, land tenure and distribution of funds. In terms of financing, dialogue
revolved around whether REDD should be financed through governments via capacity building
support, via a fund established under the COP umbrella or via market funding such as allowance
auctions, carbon credit markets and so forth. In the context of institutional arrangements, there
was concern about whether REDD should fall under Nationally Appropriate Mitigation Action
(NAMA), but with the limitation of not being eligible to receive funding from market
mechanisms. Vis-à-vis MRV delegates pondered how to address issues related to setting baselines
for emission reference levels, addressing leakage and permanence, as well as additionality.
To follow up on the COP-13 decision, Indonesia introduced a phase-based approach and
developed the REDD Readiness Strategy. Three phases were set for the period extending from
2007 to 2012. In Phase 1 (2007–2008) the current status of the national scientific base and REDD
policy were analysed. The President formed a National Council on Climate Change or Dewan
Nasional Perubahan Iklim (DNPI). Among its tasks, the Council was expected to create consensus
around opportunities and challenges related to climate change. It had a mandate to assist the
country in building a cohesive national position in the international negotiations under the Bali
Action Plan.
Phase 2 (2009–2012) has been the testing period for strengthening the scientific base and policy
support for REDD implementation. In this phase, the government issued regulations in
connection with REDD, signed agreements with several parties and established various pilot
projects. In addition, the government also established working groups and task forces to
facilitate the phase of REDD implementation after 2012, subject to the outcomes of the COP
meeting in Durban, South Africa in 2011.

14
2.2.2 REDD readiness and good forest governance3
Land use and the forestry sector are the main targets for the REDD approach, with the latter
taking the leading position. Efforts to reduce emissions thus primarily relate to readiness levels,
the levels of institutional commitment and infrastructure status in the forestry sector.
Arcidiacono-Bársony et al (2011) reported that emission reduction efforts under REDD stemmed
from addressing the driving forces of deforestation and degradation and three key issues were
identified : tenure arrangements, the structure of forest governance and the effective
participation of stakeholders, particularly IPs and local communities; the latter, as stakeholders
directly affected by REDD, was presumably identified owing to the closeness and locality of their
livelihoods and other strategies and rights affected by the presence of forest. As a result, most of
the work carried out by researchers focuses on REDD+ impact at the local level, especially effects
on communities’ rights (Galudra et al 2011). Nonetheless, forestry policies in Indonesia are
primarily formulated at the national level and are channelled to sub-national (provincial and
district) levels via various pathways and arrangements. Consequently it is crucial to assess REDD
readiness from the broader perspectives of forest governance in unison with widely discussed
local issues.
The six domains of REDD readiness consist of planning and coordination, policy and legal
institutional frameworks, demonstration/pilot projects, MRV and auditing, financing and benefit-
sharing mechanisms (Minang and van Noordwijk 2013). These domains are linked to the four
principles of good forest governance and how REDD+ readiness can help to reform current forest
governance, especially in the context of two major issues: forest tenure and land-use planning
(Figure 2.1).
Figure 2.1 REDD+ readiness domains (Source: Agung et al, under review)
As concluded by Agung et al (under review), the government has been engaged in a wide range
of efforts aimed at readiness to implement REDD schemes and progress has advanced relatively
well, despite the variations across the six domains. Two domains are considered to have made
better progress than the other four, namely demonstration and pilot projects and policies, and
3 Primarily based on Agung P, Galudra G, Suyanto S. (under review) Reform or reversal: The Impact of
REDD+ readiness to forest governance in Indonesia. Submitted to Climate Policy.
Issues: 1. Forest Tenure 2. Land Use Planning
3. Forest Management
15
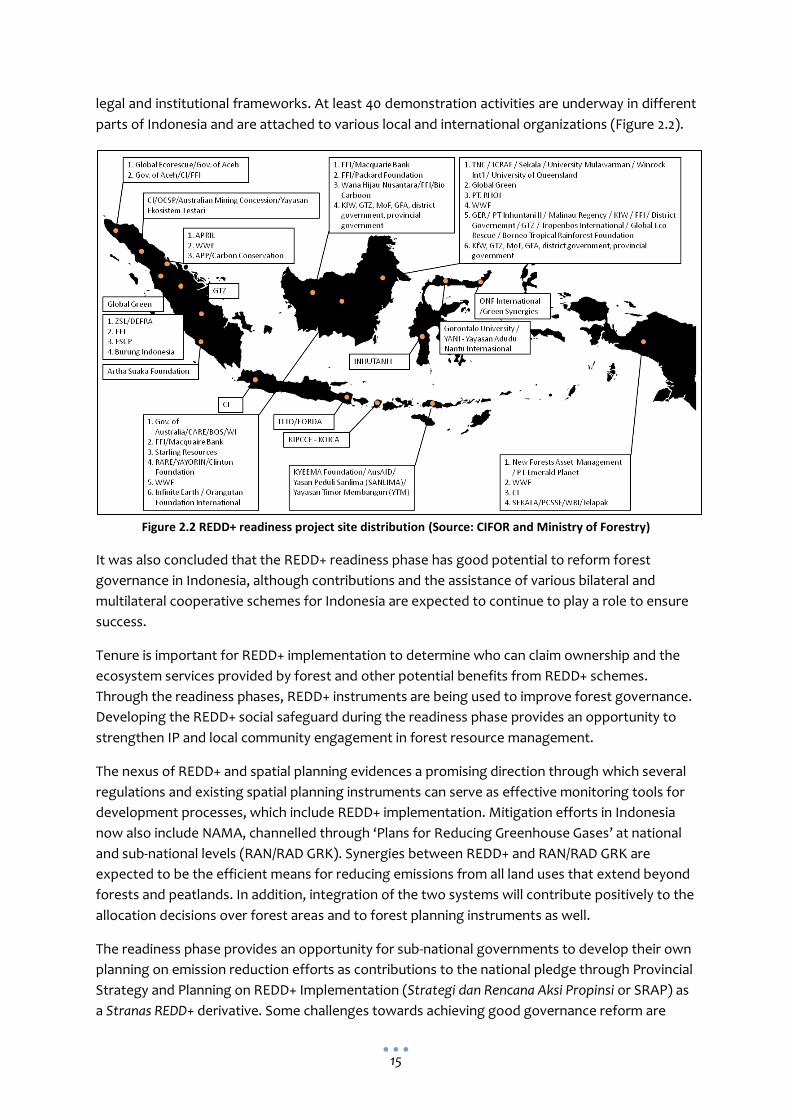
legal and institutional frameworks. At least 40 demonstration activities are underway in different
parts of Indonesia and are attached to various local and international organizations (Figure 2.2).
Figure 2.2 REDD+ readiness project site distribution (Source: CIFOR and Ministry of Forestry)
It was also concluded that the REDD+ readiness phase has good potential to reform forest
governance in Indonesia, although contributions and the assistance of various bilateral and
multilateral cooperative schemes for Indonesia are expected to continue to play a role to ensure
success.
Tenure is important for REDD+ implementation to determine who can claim ownership and the
ecosystem services provided by forest and other potential benefits from REDD+ schemes.
Through the readiness phases, REDD+ instruments are being used to improve forest governance.
Developing the REDD+ social safeguard during the readiness phase provides an opportunity to
strengthen IP and local community engagement in forest resource management.
The nexus of REDD+ and spatial planning evidences a promising direction through which several
regulations and existing spatial planning instruments can serve as effective monitoring tools for
development processes, which include REDD+ implementation. Mitigation efforts in Indonesia
now also include NAMA, channelled through ‘Plans for Reducing Greenhouse Gases’ at national
and sub-national levels (RAN/RAD GRK). Synergies between REDD+ and RAN/RAD GRK are
expected to be the efficient means for reducing emissions from all land uses that extend beyond
forests and peatlands. In addition, integration of the two systems will contribute positively to the
allocation decisions over forest areas and to forest planning instruments as well.
The readiness phase provides an opportunity for sub-national governments to develop their own
planning on emission reduction efforts as contributions to the national pledge through Provincial
Strategy and Planning on REDD+ Implementation (Strategi dan Rencana Aksi Propinsi or SRAP) as
a Stranas REDD+ derivative. Some challenges towards achieving good governance reform are

16
recognized and these relate to the processes and structure of forest governance and how
policies are implemented as instruments of governance according to state, private and civil
society organization stakeholders.
2.2.3 Indonesia's National Action Plan to Reduce Greenhouse Gas Emissions
(RAN-GRK)
The National Action Plan for Greenhouse Gas Emission Reduction (RAN-GRK) is a concrete step
taken by the government to reduce GHG emissions. It materialized after the president’s speech
at the G-20 meeting in Pittsburgh, USA on 25 September 2009. RAN-GRK was legalized through
the issuance of Presidential Regulation No. 61/2011 on the National Action Plan for Greenhouse
Gas Emission Reduction (RAN-GRK), which is a working document that contains measures to
reduce greenhouse gas emissions in Indonesia. The President's Regulation was followed by the
issuance of Presidential Regulation No. 71 of 2011 on the Implementation of Inventory of National
Greenhouse Gas (GHG).
RAN-GRK was developed to achieve national and sectoral targets, guidelines and priority actions
for climate change mitigation. RAN-GRK consists of core activities and supportive activities to
reduce GHG emissions and clear targets on reduction efforts for each sector. Key sectors in RAN-
GRK are forestry and peatland, agriculture, energy and transport, industry and waste
management.
The development and establishment of reference emission levels (RELs) is vital for emission
reduction efforts. Determination of RELs results from discussion with stakeholders and is
supported by in-depth analysis that takes into account the history of past emissions and future
considerations in an equitable manner. Stakeholders must agree to a specific REL that describes
the conditions that will ensue and transparently indicate how emission reduction targets will be
implemented nationally.
RAN-GRK has mandated sub-national governments (provincial level) to develop a Province Action
Plan for Reducing Greenhouse Gas Emissions (RAD-GRK). The substance of RAN-GRK is the basis
for every province in developing RAD-GRK and the document itself is determined by the
Governor Regulation. RAD-GRK preparation is expected to be a bottom-up process that describes
how steps will be taken for every province to reduce GHGs, in the context of provincial capacities,
resources and development plans. In addition, each provincial government needs to calculate the
GHGs, emissions reduction targets, and how to reduce emissions from different sectors.
However, the provincial government still has to ensure that the reduction of GHGs in the region
still contributes to reduction targets at the national level.
2.3 What`s next?
The next step in emission reduction efforts is to design a performance-based monitoring,
evaluation and reporting (MER) system at the national level. This is very important in evaluating
the impact of the action plan, and performance, in terms of estimating the volume of emission
reductions compared to the reference emission level. The system needs to be transparent,
internationally accepted and standardized for independent bodies to conduct verification. An
MRV system has yet to be designed for Indonesia. Guidelines for monitoring are indicated in COP

17
decisions (2/CP13 and 4/CP15) that require the use of a combination of remote sensing and
ground-based forest carbon inventory approaches for estimating forest-related GHG emissions
by sources and removal by sinks, forest carbon stocks and forest area changes. Guidelines and
modalities for reporting and verification are still to be developed and agreed on by the UNFCCC’s
Conference of Parties. However, as RAN-GRK is a national program, there is a strong argument
that the standard for MRV could be national instead of international. There is a significant
challenge in developing a simple MER system for RAN-GRK (a national standard) that still
complies internationally.
At this juncture, the RAN-GRK secretariat is preparing to develop an MER system for the
RAN/RAD-GRK land-based sector. ICRAF through different projects, including the Reducing
Emissions from All Land Uses (REALU) project, is actively helping the RAN-GRK secretariat in
designing and testing an MER system. Human capacity for implementing MER both at national
and local levels is still weak, so an intensive series of training courses is required to address this
deficiency.

18
3 Provincial commitment for climate-nested
governance: governing forest and carbon
through REDD+ and NAMA in Jambi
Gamma Galudra, Ratna Akiefnawati, Putra Agung
3.1 Introduction
There are opportunities for reducing greenhouse gas (GHG) emissions across all sectors of the
economy and over a wide geographic area, but emissions from forest and peatland conversion
predominate, incurring considerable public debate. With the advent of REDD+, the introduction
of an Indonesian action plan for emissions’ reduction under the remit of the Nationally
Appropriate Mitigation Action (NAMA), and the potential for increased financial flows into
carbon-rich landscapes, the question of how to relate national commitment to local context and
effective implementation is more important than ever.
For effective implementation, nested governance becomes important with regard to relating
national commitment to sub-national context. Nested governance occurs through decision-
making processes at national, provincial and district levels. Nevertheless, such decision-making
processes at multiple levels will also need to relate to each other across scales, such as between
NAMA and REDD+. Through Presidential Regulation No. 61 and 71, 2012, the Government of
Indonesia (GoI) has pushed local governments, either at provincial or district levels, to plan
emissions’ reduction as part of national commitment under NAMA. The presidential decrees
provide guidelines for local governments to develop such plans, which are known as RAD-GRK.
Conversely, the GoI has also published the National Strategy for REDD+ (Stranas REDD+). Like
RAD-GRK, it needs to translate its implementation to the local level. Such commitment to
reducing emissions through REDD+ has been incorporated in a Letter of Intent between Indonesia
and Norway. Around 11 provinces have agreed to participate in REDD+ implementation and Jambi
is one of them. This initiative at the provincial level is referred to as SRAP.
This chapter aims to explain the process of planning emissions’ reduction via the REDD+ and
NAMA thrusts. Both intend to reduce emissions for climate change mitigation and many
scientists and activists are hoping that they could change existing forest governance in Indonesia;
however if they are not integrated properly, confusion in implementation and conflicts will result.
Two analyses are presented: 1) the implementation strategies of the programs and 2) gaps
between them as well as their methods of implementation.
The assessment targets the sub-national level in Jambi Province and enables better
understanding of various actors’ strategies involved in shaping and negotiating REDD+ and
NAMA; further, it identifies what they are seeking to achieve. Comparison is made by discussing
(1) the objectives and action plans to reduce emissions, based on analysis of deforestation

19
drivers; (2) agreed mechanisms, including provincial accounting of emissions and incentives; and
(3) transparent regulations, such as regular monitoring and sanctions of failure.
3.2 Nested climate governance: strengths and limitations
Nested governance implies achieving multilevel, multi-actor governance. It is based on the extent
to which actors participate in shaping rules about forest use, and to what extent each form of
governance reflects different interests. The first approach involves nested institutions (Ostrom
1990, 1995). The concept of nested institutions is sometimes visualized as a Russian ‘matryoshka’
doll, where each local set of rules and incentives fits within rules and objectives set at larger
scales (regional, national and international) (Angelsen et al 2008). Ideally, the nested approach
will be established so that the same rules apply to everyone. However, this approach will depend
on how clearly rules are defined—for example, clear objectives (to reduce deforestation and
forest degradation), agreed mechanisms (to provide incentives via carbon credits) and
transparent regulations (such as regular monitoring, and sanctions for failure).
A risk of using the nested approach is that this system is used for managing resources at different
scales under one general set of rules. It does not always acknowledge local perceptions of
forests or local political processes or reflect the complexity of local rule-making (Forsyth 2009).
There is a perception that nested governance will only lead to a top-down approach, setting a
certain rule at the national to lower level. Climate change mitigation requires not only new
technologies and financial incentives but also the critical prerequisite of appropriate governance.
This means it requires nested governance including decision-making processes at multiple scales
and across scales, including the coexistence of various forms of governance such as community-
based natural resource management (CBNRM). Therefore, the recognition of forest people’s
rights could lead to this appropriate form of governance (Sikor et al 2010). To ensure that nested
governance is a bottom-up approach involving multiple actors, Pedroni et al (2009) propose that
an emission reduction system should also be built on sub-national accounting of emissions. This
includes project-level accounting as well as conservation by private companies or communities.
3.3 What lies beneath: the political process behind NAMA and
REDD+ in Indonesia
The GoI has issued a policy regarding global climate change agreement through a commitment to
reduce emissions by 26 percent in the context of the construction ‘business as usual’ scenario
(BAU) by 2020 via independent funding sources, without sacrificing other development sectors,
or by 41 percent if international funding is obtained.
Achieving the long-term goals of the REDD+ Strategy involves building a platform for sustaining
the five main pillars of the national program strategy, namely: (1) institutions and processes, (2)
legal and regulatory frameworks, (4) strategic programs, (5) modifying paradigms and work
culture, and (5) synergy among all parties.
At the sub-national level in Jambi Province, the fifth pillar of the program in the REDD National
Strategy involves elaborating more detailed reference and operational guidelines in the Provincial
Strategy and Action for the implementation of REDD+ according to the region’s characteristics

20
and problems related to deforestation and degradation forest in Jambi Province. Based on
Presidential Regulation No. 61/2011, the province is required to prepare RAD-GRK but it is
important to ensure consistency between RAD-GRK and SRAP for REDD+ implementation.
Implementation of the REDD+ National Strategy is being executed in accordance with the
developmental stages of readiness and guided by the National Action Plan Document for REDD+
and Business Plan Document for the National REDD + Strategy Document. The third document
refers to the preparation of a Strategy Document and Action Plan for Jambi Province (SRAP
REDD+). SRAP REDD+ Jambi will be the main foundation and strengthen the implementation of
RAD-GRK in Jambi Province, conceived and established by Jambi Governor Regulation No. 36 of
2012 as well as REDD+ SRAP Jambi Province Governor Decree No. 352/KEP.GUB/SETDA.EKBANG &
SDA-4.2/2013.
3.4 About Jambi: deforestation, emission and opportunities for
emission reductions
Jambi's land area covers 53 435 km2 and it is home to 3 092 million people. Economic growth in
2010 reached 7.31 percent. The province has nine districts and two cities. Jambi is committed to
the development of low CO2 emissions and thus contributes to higher national-level initiatives in
this respect. Jambi is one of the 11 provinces in the SRAP REDD+ pilot study in Indonesia. Support
and commitment by the provincial government related to climate change mitigation efforts
involve preparation and adoption of RAD-GRK, the creation of a regional commissioner for
REDD+, preparation of development strategies regarding low carbon emissions as well as
backstopping international research institutions, government and non-governmental
organizations and local governments in preparation for SRAP REDD+.
Forested area in Jambi encompasses ± 2 179 440.00 hectares or 42.73 percent of the total land
area. In 2010, forest area with forest cover amounted to 29 percent or 1.401 million hectares, the
remainder being forest land without forest cover (Ministry of Forestry 2011). Primary and
secondary forest total 285 000 hectares and 1.0063 million hectares respectively and
approximately 540 100 hectares are located in natural reserve areas and conservation areas
(Ministry of Forestry 2011). Forest conservation in Jambi Province has strategic significance for
both Indonesia and the world, owing to extensive natural forest in the four national parks: the
National Park of Kerinci Seblat (TNKS), which has been designated as a World Heritage Site; the
National Park of Berbak, which is a Ramsar Convention wetland site with peat−swamp forest
landscapes that are relatively intact and the largest in Southeast Asia; the National Park of Bukit
Duabelas; and the National Park of Bukit Tigapuluh. Thus Jambi Province has a very important
role in addressing the carbon cycle and serving as a global biodiversity reservoir.
Similar to other provinces in Indonesia, Jambi Province faces pressure from land use, land-use
change and forest (LULUCF) issues that contribute to global warming. The rate of deforestation
and degradation in Jambi Province within and outside the forest area reached 76 522 hectares
and 9431 hectares per year respectively in the period 2006−2009 (Ministry of Forestry 2011).
Drivers of deforestation and forest degradation are usually defined as overexploitation and
conversion of natural forests and peatlands into production forests (industrial timber, oil palm
21
plantations), infrastructure development and mineral and coal mining; other significant factors
are illegal logging, forest fires and encroachment of protected forest area.
Economic development in Jambi still depends on the abundance of its natural resources, both
renewable and non-renewable that are sourced through farming, forestry, agriculture, and
mining. In 2010 the Gross Regional Domestic Product (GRDP) at constant prices based on oil and
gas supplies amounted to more than IDR16 272 trillion, or if non-fossil fuel-based, around IDR14
662 trillion with a growth rate of 6.56 percent (BPS 2010). Forestry, agriculture and plantations
have a major role in shaping the structure of Jambi’s economy and are expected to expand.
Economic growth in 2009−2011 was driven by these sectors.
The REDD+ SRAP for Jambi (2012) indicated that the province could reduce its GHG emissions by
more than 55 mega tonnes of CO2e, including 47.3 mega tonnes of CO2e or 86 percent of
peatland conservation and LULUCF to 2030, or an average of 1.58 mega tonnes of CO2e per year.
In this context, reduction of 48 percent or 26.4 mega tonnes of CO2e can be pursued through the
conservation of peatland and 38 percent or 20.9 mega tonnes of CO2e via LULUCF. There are five
major carbon reduction opportunities that represent more than 85 percent of the total emission
reduction potential in Jambi:
Preventing the burning of forests and peatlands (15.3 mega tonnes of CO2e annual
emissions by 2030);
Reducing deforestation by introducing policies for land allocation and generating more
effective and sustainable increases in agricultural productivity (14.5 mega tonnes of CO2e
annual emissions by 2030);
Rehabilitating peatlands that are not used or degraded (10 mega tonnes of CO2e);
Managing forests sustainably (four mega tonnes of CO2e annual emissions by 2030), and
Reforestation (two mega tonnes of CO2e annual emissions by 2030).
3.5 REDD+ and NAMA in Jambi
With regards to REDD+ strategies at the provincial level, the Jambi Provincial Government (JPG)
has passed a new decree, Jambi Province Governor Decree No 386/Kep-Gub/Ekbang & SDA/2011
on the Local Commission of REDD+ in Jambi Province. This commission will develop a Strategy
and Action Plan for REDD+ as a policy guideline for emissions’ reduction from deforestation and
degradation, carbon conservation, forest carbon enhancement and sustainable forest
management. Unlike RAD-GRK, actors for developing REDD+ in the province are dominated by
several members from NGOs and the academe. Moreover, the leading agency for developing this
strategy is the Economic Development and Natural Resource Section of the Provincial Secretary.
Under the NAMA approach, JPG endorsed Governor Regulation No. 36/2012 (a provincial action
plan on emissions’ reduction) as support to national commitment on NAMA. The objective of this
action plan (also termed as Locally Appropriate Mitigation Actions - LAMA) is for all provincial
government offices to identify and adjust their programs to support NAMA. RAD-GRK is a
guideline for provincial government offices with regard to planning, implementation, monitoring
and evaluation vis-à-vis emission reduction action plans. This regulation is also mandated to
district government offices for development of LAMA at the district level. RAD-GRK is
22
spearheaded by the Provincial Environmental Offices (BLHD) and the Indonesian Regional Body
for Planning and Development (BAPPEDA) while members come from the following government
offices: Forestry Office, Crop-Estate Office, Mining Office, Agricultural Office and Land
Administration Office. Besides reducing emissions from forests and peatlands, this document
also targets lowering emissions from the agricultural, energy, transportation and human waste
sectors. In the context of REALU, however, we only focus on forestry and peatlands as those
two represent the land use based emission activities.
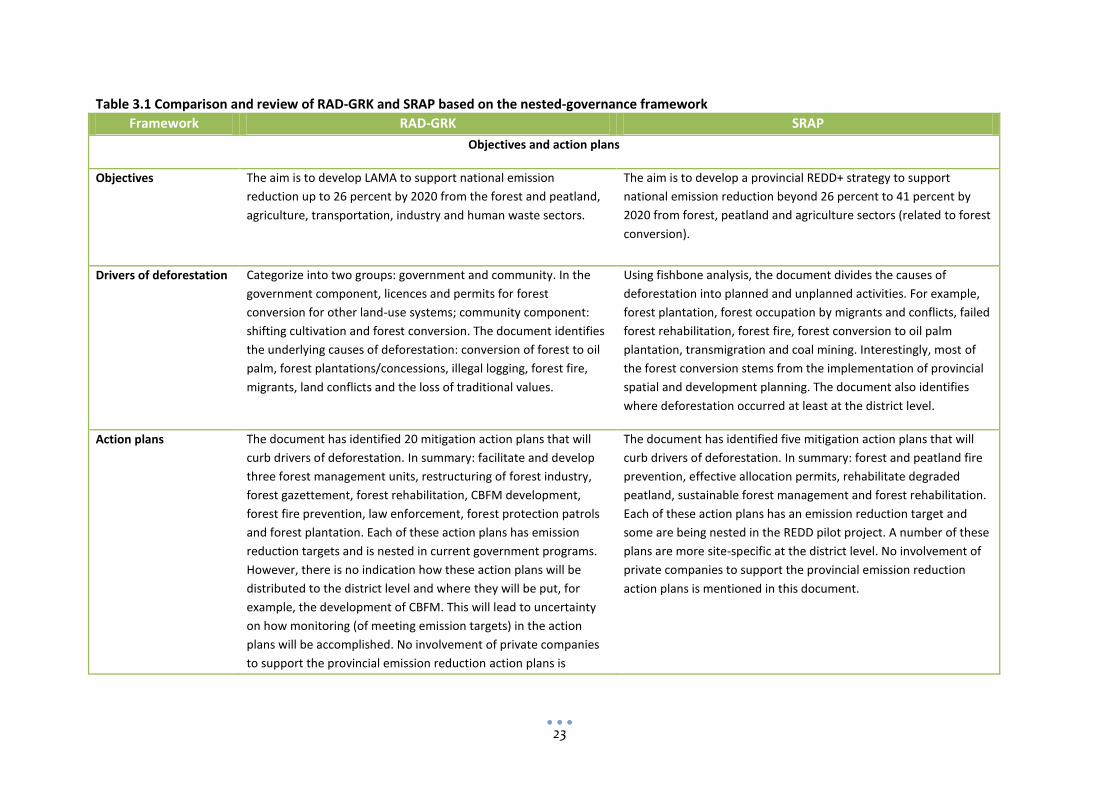
Both of these documents target reducing emissions from deforestation and degradation, but
here we will examine and compare to what extent these two documents are being applied to the
nested-climate governance mechanism. We source Forsyth (2009), Sikor et al (2010) and Pedroni
et al (2009) for the relevant variables and Table 3.1 reviews and compares RAD-GRK and SRAP
based on their frameworks.
23
Table 3.1 Comparison and review of RAD-GRK and SRAP based on the nested-governance framework
Framework RAD-GRK SRAP
Objectives and action plans
Objectives
The aim is to develop LAMA to support national emission
reduction up to 26 percent by 2020 from the forest and peatland,
agriculture, transportation, industry and human waste sectors.
The aim is to develop a provincial REDD+ strategy to support
national emission reduction beyond 26 percent to 41 percent by
2020 from forest, peatland and agriculture sectors (related to forest
conversion).
Drivers of deforestation
Categorize into two groups: government and community. In the
government component, licences and permits for forest
conversion for other land-use systems; community component:
shifting cultivation and forest conversion. The document identifies
the underlying causes of deforestation: conversion of forest to oil
palm, forest plantations/concessions, illegal logging, forest fire,
migrants, land conflicts and the loss of traditional values.
Using fishbone analysis, the document divides the causes of
deforestation into planned and unplanned activities. For example,
forest plantation, forest occupation by migrants and conflicts, failed
forest rehabilitation, forest fire, forest conversion to oil palm
plantation, transmigration and coal mining. Interestingly, most of
the forest conversion stems from the implementation of provincial
spatial and development planning. The document also identifies
where deforestation occurred at least at the district level.
Action plans The document has identified 20 mitigation action plans that will
curb drivers of deforestation. In summary: facilitate and develop
three forest management units, restructuring of forest industry,
forest gazettement, forest rehabilitation, CBFM development,
forest fire prevention, law enforcement, forest protection patrols
and forest plantation. Each of these action plans has emission
reduction targets and is nested in current government programs.
However, there is no indication how these action plans will be
distributed to the district level and where they will be put, for
example, the development of CBFM. This will lead to uncertainty
on how monitoring (of meeting emission targets) in the action
plans will be accomplished. No involvement of private companies
to support the provincial emission reduction action plans is
The document has identified five mitigation action plans that will
curb drivers of deforestation. In summary: forest and peatland fire
prevention, effective allocation permits, rehabilitate degraded
peatland, sustainable forest management and forest rehabilitation.
Each of these action plans has an emission reduction target and
some are being nested in the REDD pilot project. A number of these
plans are more site-specific at the district level. No involvement of
private companies to support the provincial emission reduction
action plans is mentioned in this document.

24
mentioned in this document.
Agreed mechanism
Provincial accounting of
emissions
The data used for calculation come from DNPI (2010) who
calculated historical forest and land-use change from 2000 to 2005
and linear historical projection until 2030. The action plans also
put some figure on how much these actions will actually reduce
emissions. Unfortunately, no provincial emission calculation was
used.
The data used for calculation come from DNPI (2010) who
calculated historical forest and land-use change from 2000 to 2005
and linear historical projection until 2030. The action plans also put
some figure on how much these actions will actually reduce
emissions. Unfortunately, no provincial emission calculation was
used. Several REDD pilot projects have developed emission
baselines but it is uncertain how they will be also nested into the
provincial emission calculation and emission target reduction.
Financial incentives The action plans also place some budget expenditure for
implementation. Nevertheless, there is no clear indication where
the funding will come from, either from the national state budget
or provincial state budget.
There is no clear indication of how these actions will be financed.
Transparent regulations
Rights and governance CBFM is being recognized as part of the programs including how
much they will contribute to emission reduction, but it is still
uncertain how many will be developed. Involvement of
communities is being prioritized but there is no clear guidance on
how their roles will be linked with the program.
CBFM is mentioned but the document does not mention its
contribution to emission reduction targets. The importance of these
actions being integrated into spatial and development planning is
mentioned but it is uncertain how these actions are being nested
into government planning. Several regulations are identified to
support this objective.
Regular monitoring No clear indication of how these action plans will be monitored, a
clear monitoring design, and institutions in charge. No timeframe
when these action plans will start and end.
The document discusses developing monitoring design including
deforestation, land cover change, emission factors, terrestrial and
spatial databases and safeguards. It also develops the timeframe for
emission reduction action plans to 2030.
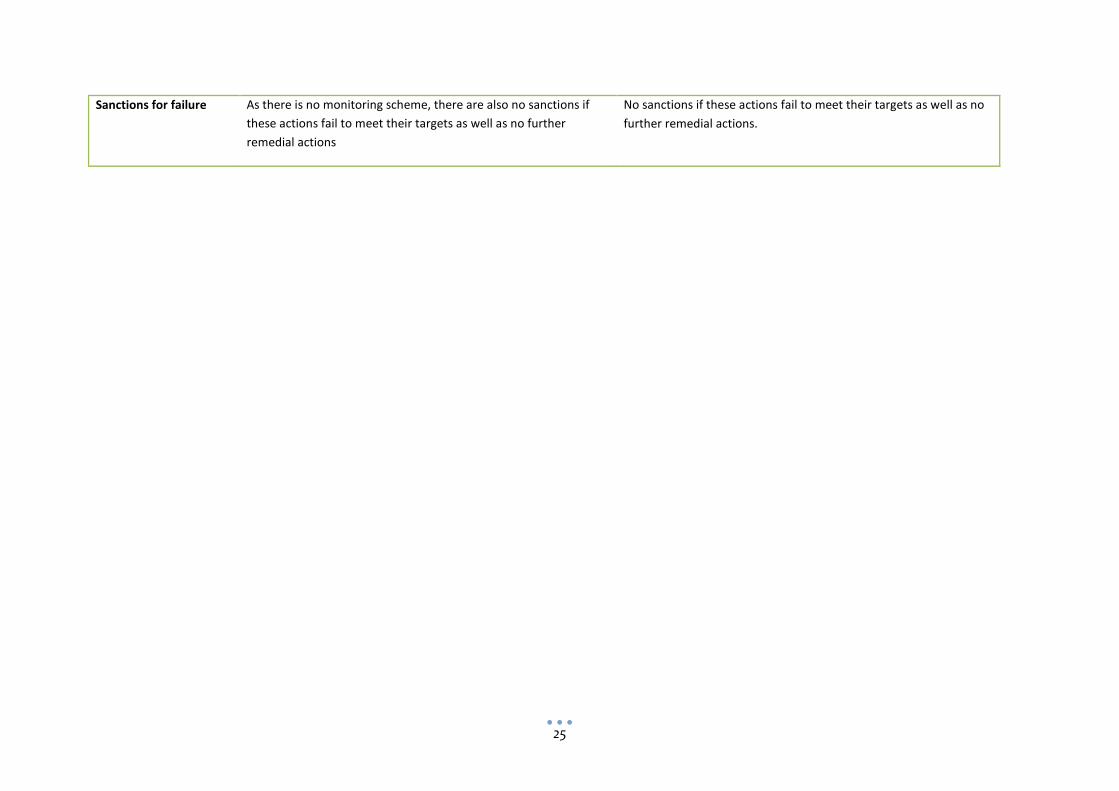
25
Sanctions for failure As there is no monitoring scheme, there are also no sanctions if
these actions fail to meet their targets as well as no further
remedial actions
No sanctions if these actions fail to meet their targets as well as no
further remedial actions.

26
3.6 What lies ahead: bridging the gap toward nested climate
governance
Both RAD-GRK and SRAP have the same purposes and can work complementarily. RAD-GRK aims
to support national emission reduction to 26 percent while SRAP is intended to support national
emission reduction beyond 26 percent to 41 percent. The emission reduction action plans from
RAD-GRK are well nested in government programs, probably through state budgets, while some
REDD+ pilot projects are being nested in SRAP, with likely financing from multilateral/bilateral
relations. The two action plans also acknowledge the importance of provincial spatial and
development planning to support the plans for emissions’ reduction.
Nevertheless, they have some limitations which are summarized as follows:
They have not calculated provincial emission baselines and targets for emissions’ reduction.
Although they discuss the potential of each action plan to contribute to emissions’ reduction,
there is no certain figure on how far Jambi Province will able to reduce emissions by 2020 and
how this province will contribute to national emissions’ reduction, either through NAMA or
REDD+.
Both action plans recognize the importance of provincial spatial and development planning in
emission reduction efforts, but there is no plan on how to integrate these action plans for
provincial spatial and development planning.
There are no sanctions if targets are not met. To ensure that stakeholders follow the targets,
sanctions for failure should be developed. Private companies are being neglected and their
potential roles are not being elaborated. Failure to recognize them may lead to failure of
these programs as the private sector is the biggest contributor to CO2 emissions.
27
4 Low emission development initiatives in
Tanjung Jabung Barat District
Feri Johana, Putra Agung
4.1 Introduction
Initiatives at the national level to commit to greenhouse gas (GHG) emission reduction are
evidenced by the release of Presidential Regulation no. 61/2011 in the National Action Plan for
Greenhouse Gas Emission Reduction (RAN−GRK). RAN−GRK will not be successful if there are no
derivative activities undertaken at the operational level. Such efforts have been channeled
through the development of RAD−GRK in the provincial level in conjunction with RAN−GRK that
aims to disaggregate activities and emission reduction targets to the sub-national level (See
Chapter Three).
As to the implementation at the district level, there is currently no standard guidance on how
RAD−GRK in the provincial level is channeled and disaggregated in the district level. However,
considering the regional autonomy, it has been realized that districts will be more involved in the
process for the next few years for the implementation phase. REALU initiatives in this context,
has encouraged local governments and all stakeholders to be aware and to prepare for the
implementation of RAD−GRK via appropriate methods, policies, institutions and regulations and
integrate them into a ‘low emission development’ (LED) planning.
To address those problems, REALU project facilitated Tanjung Jabung Barat (Tanjabar) District
stakeholders to develop LED planning and action plans and help them prepare to develop RAD
GRK in due time. Tanjung Jabung Barat (Tanjabar) District has one of Jambi’s highest rates of
CO2 emissions that are associated with land-use changes. During 2000–2005, the average annual
aboveground emissions of CO2e in the district reached 18 tonnes per hectare, and 15 tonnes per
hectare during 2005−2010. The main source of emissions was the conversion of previously logged
forest to oil palm plantations (Widayati et al 2012). Forests in Tanjabar cover 48 percent of the
district’s total area. Approximately 71 percent of the forest area is categorized by the
government as Production Forest. The national development policy to establish industrial timber
plantations (locally called HTI), resulting in wide expanses of HTI in the district, has influenced the
level of emissions in the district significantly.
4.2 Overall methods
The design and construction of planning steps for emission reduction strategies in this exercise
used the framework strategy of Land Use Planning for Low Development (LUWES) (Dewi et al
2011), which contains a systematic set of steps to integrate the processes of identifying emission
sources, calculating historical emissions, predicting future emissions by considering historical
emissions and local development plans, setting up a reference emission level (REL) and
mitigation action plans, and determining an implementation strategy.

28
LUWES integrates scientific concepts that can be used in forecasting/calculating emissions’ rates
and making RELs the principal instrument for integrative, inclusive and informed use in the
implementation process. Stakeholders reconcile and discuss the process in developing an
analysis unit (zone), define the zone and draw up mitigation actions; this is a major prerequisite
for the process and should be done properly, accommodating stakeholders’ interest.
4.3 Integrating the land-based development plan and spatial plan
An early stage in the preparation of the initiative is to identify mitigation actions based on land
development plans, spatial planning and the implementation of several development activities.
This analysis is important to understand the conditions of regional development and the extent
to which aspects of the development of low emissions are already included in the existing
development plan.
In facilitating this process, developing zones as planning units is considered the appropriate way
to integrate all existing planning documents into a single template. In each planning unit any
land-use change process is recorded as well as factors affecting the activity and preparation in
developing appropriate mitigation actions. The zone is developed based on spatial-based
integration of various planning documents such as the District Spatial Plan (RTRW), Long-term
Regional Development Plan (RPJP)/Medium-term Regional Development Plan (RPJMD) and maps
of forestry land status, land-use permits and biophysical elements (e.g peat). The zones in
Tanjabar are shown in Figure 4.1.
Steps taken in developing the zones in Tanjabar involve:
Consultation with stakeholders who are involved in land-use development activities.
Integrating the activities of land-based sector development with district spatial planning.
Confirming that the information, data and facts are accurate, up to date, and as much as
possible include the various parties associated with the development, future development
plans and other relevant information such as conflicts over land and natural resources.
Addressing the assumption that represents the actual direction of development that will be
implemented.
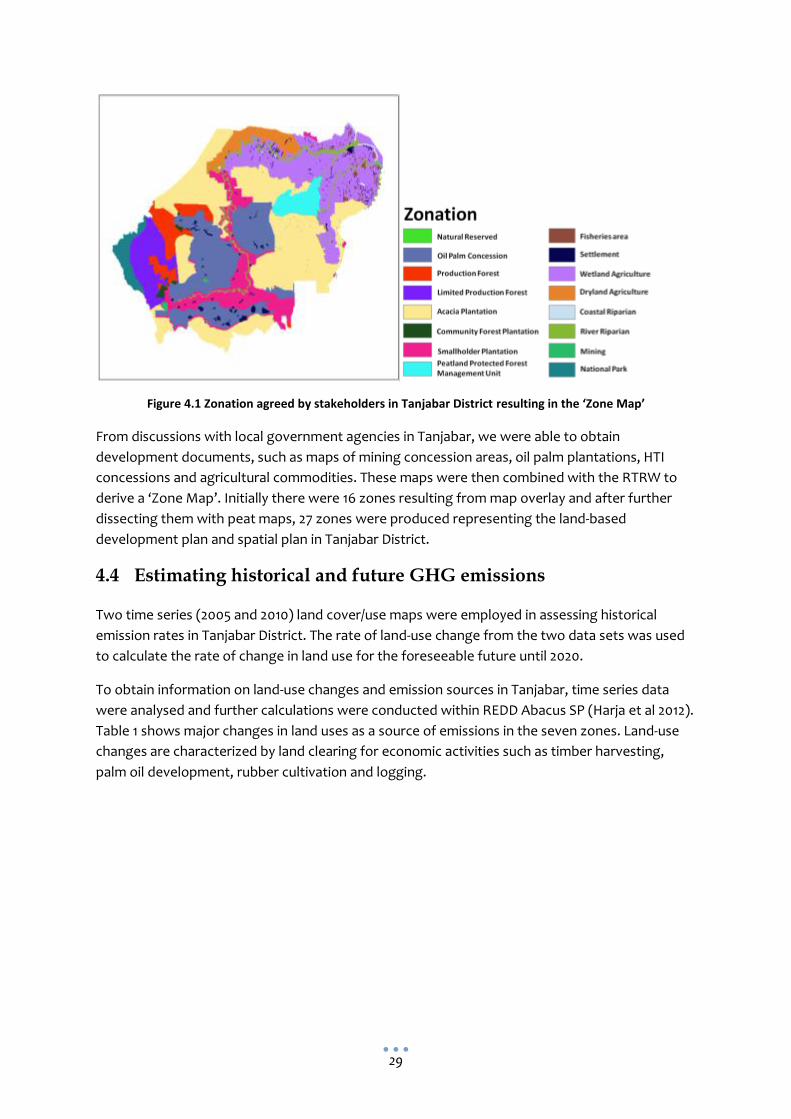
29
Figure 4.1 Zonation agreed by stakeholders in Tanjabar District resulting in the ‘Zone Map’
From discussions with local government agencies in Tanjabar, we were able to obtain
development documents, such as maps of mining concession areas, oil palm plantations, HTI
concessions and agricultural commodities. These maps were then combined with the RTRW to
derive a ‘Zone Map’. Initially there were 16 zones resulting from map overlay and after further
dissecting them with peat maps, 27 zones were produced representing the land-based
development plan and spatial plan in Tanjabar District.
4.4 Estimating historical and future GHG emissions
Two time series (2005 and 2010) land cover/use maps were employed in assessing historical
emission rates in Tanjabar District. The rate of land-use change from the two data sets was used
to calculate the rate of change in land use for the foreseeable future until 2020.
To obtain information on land-use changes and emission sources in Tanjabar, time series data
were analysed and further calculations were conducted within REDD Abacus SP (Harja et al 2012).
Table 1 shows major changes in land uses as a source of emissions in the seven zones. Land-use
changes are characterized by land clearing for economic activities such as timber harvesting,
palm oil development, rubber cultivation and logging.

30
Table 4.1 Type of land-use change as the biggest emission source in Tanjabar
Zone Land use in 2005 Land use in 2010
Wetland agriculture on peat
Coconut/ betelnut agroforestry Coconut/ betelnut agroforestry
Coffee agroforestry Coffee agroforestry
Coconut/betelnut agroforestry
Acacia plantation
Logged-over forest − high density Acacia plantation
Oil palm monoculture
Rubber monoculture
Oil palm monoculture
Acacia plantation
Logged-over swamp forest Acacia plantation
Acacia plantation on peat
Undisturbed swamp forest Shrubland
Logged-over swamp forest Shrubland
Acacia plantation
Coconut/betelnut agroforestry
Shrubland Shrubland
Oil palm concession
Rubber agroforestry Oil palm monoculture
Logged-over forest − high density Oil palm monoculture
Logged-over forest − low density Oil palm monoculture
Peatland Protected Forest Management Unit on peat
Undisturbed swamp forest Logged-over swamp forest
Dryland agriculture on peat Coffee agroforestry Coffee agroforestry
Production forest Logged-over forest − high density Rubber monoculture
Figure 4.2 shows the share of emissions per year respectively based on 27 zones in Tanjabar.
Zones with the five highest emission shares consist of acacia plantation, acacia plantation on
peat, wetland agriculture on peat, oil palm concession and smallholder plantations.
Figure 4.2 Amount of historical emission share in each zone in Tanjabar
-0.20
0.00
0.20
0.40
0.60
0.80
1.00
1.20
1.40
1.60
1.80
Emis
sio
n
(mill
on
to
nn
es
CO
2 e
q/y
ear
)
Zone
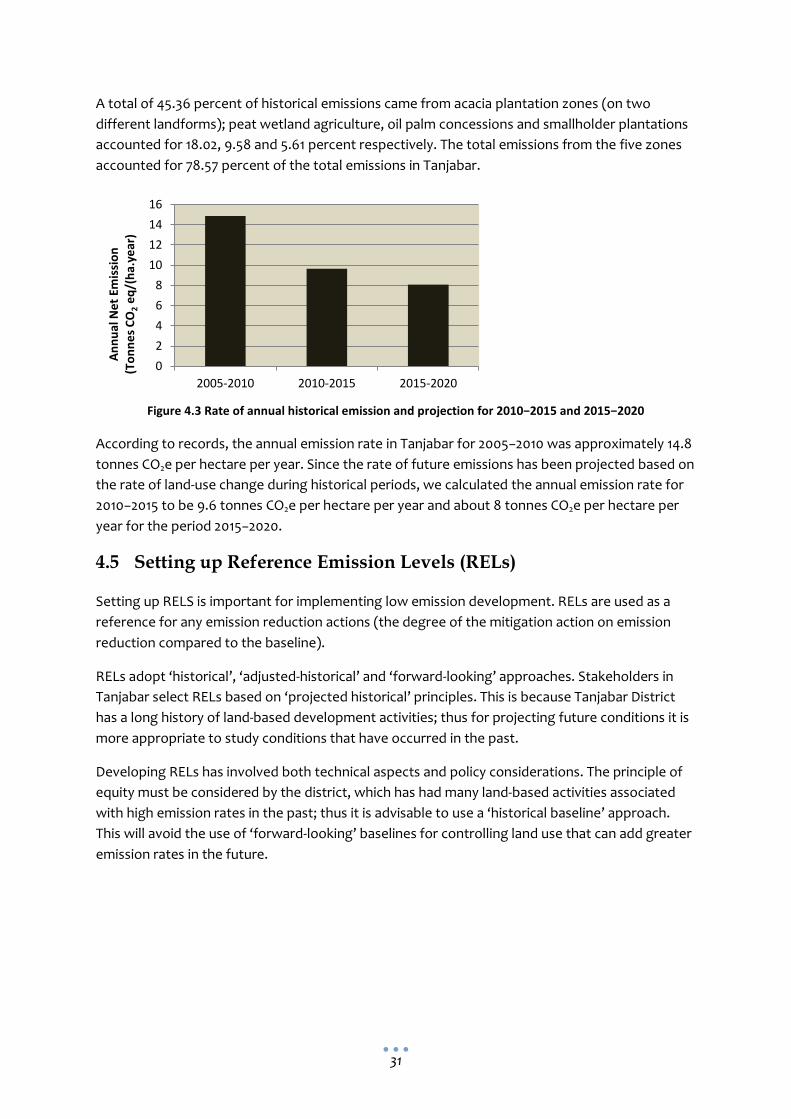
31
A total of 45.36 percent of historical emissions came from acacia plantation zones (on two
different landforms); peat wetland agriculture, oil palm concessions and smallholder plantations
accounted for 18.02, 9.58 and 5.61 percent respectively. The total emissions from the five zones
accounted for 78.57 percent of the total emissions in Tanjabar.
Figure 4.3 Rate of annual historical emission and projection for 2010−2015 and 2015−2020
According to records, the annual emission rate in Tanjabar for 2005−2010 was approximately 14.8
tonnes CO2e per hectare per year. Since the rate of future emissions has been projected based on
the rate of land-use change during historical periods, we calculated the annual emission rate for
2010−2015 to be 9.6 tonnes CO2e per hectare per year and about 8 tonnes CO2e per hectare per
year for the period 2015−2020.
4.5 Setting up Reference Emission Levels (RELs)
Setting up RELS is important for implementing low emission development. RELs are used as a
reference for any emission reduction actions (the degree of the mitigation action on emission
reduction compared to the baseline).
RELs adopt ‘historical’, ‘adjusted-historical’ and ‘forward-looking’ approaches. Stakeholders in
Tanjabar select RELs based on ‘projected historical’ principles. This is because Tanjabar District
has a long history of land-based development activities; thus for projecting future conditions it is
more appropriate to study conditions that have occurred in the past.
Developing RELs has involved both technical aspects and policy considerations. The principle of
equity must be considered by the district, which has had many land-based activities associated
with high emission rates in the past; thus it is advisable to use a ‘historical baseline’ approach.
This will avoid the use of ‘forward-looking’ baselines for controlling land use that can add greater
emission rates in the future.
0
2
4
6
8
10
12
14
16
2005-2010 2010-2015 2015-2020
An
nu
al N
et
Emis
sio
n
(To
nn
es
CO
2 e
q/(
ha.
year
)
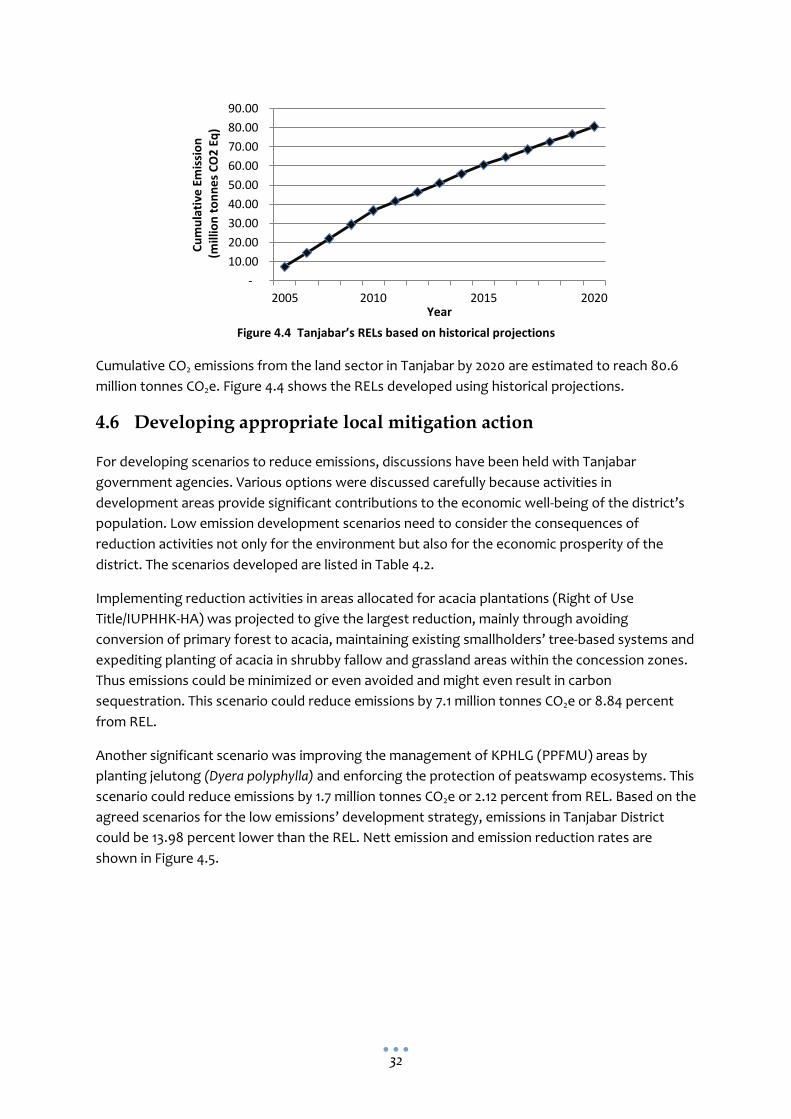
32
Figure 4.4 Tanjabar’s RELs based on historical projections
Cumulative CO2 emissions from the land sector in Tanjabar by 2020 are estimated to reach 80.6
million tonnes CO2e. Figure 4.4 shows the RELs developed using historical projections.
4.6 Developing appropriate local mitigation action
For developing scenarios to reduce emissions, discussions have been held with Tanjabar
government agencies. Various options were discussed carefully because activities in
development areas provide significant contributions to the economic well-being of the district’s
population. Low emission development scenarios need to consider the consequences of
reduction activities not only for the environment but also for the economic prosperity of the
district. The scenarios developed are listed in Table 4.2.
Implementing reduction activities in areas allocated for acacia plantations (Right of Use
Title/IUPHHK-HA) was projected to give the largest reduction, mainly through avoiding
conversion of primary forest to acacia, maintaining existing smallholders’ tree-based systems and
expediting planting of acacia in shrubby fallow and grassland areas within the concession zones.
Thus emissions could be minimized or even avoided and might even result in carbon
sequestration. This scenario could reduce emissions by 7.1 million tonnes CO2e or 8.84 percent
from REL.
Another significant scenario was improving the management of KPHLG (PPFMU) areas by
planting jelutong (Dyera polyphylla) and enforcing the protection of peatswamp ecosystems. This
scenario could reduce emissions by 1.7 million tonnes CO2e or 2.12 percent from REL. Based on the
agreed scenarios for the low emissions’ development strategy, emissions in Tanjabar District
could be 13.98 percent lower than the REL. Nett emission and emission reduction rates are
shown in Figure 4.5.
-
10.00
20.00
30.00
40.00
50.00
60.00
70.00
80.00
90.00
2005 2010 2015 2020
Cu
mu
lati
ve E
mis
sio
n
(m
illio
n t
on
ne
s C
O2
Eq
)
Year

33
Table 4.2 Scenarios and planned activities for mitigation actions Zone Scenarios Planned activities
Acacia Plantations (S1-AP)
(1) Avoid conversion of primary forest to acacia (2) Maintain existing smallholders’ tree-based systems (3) Expedite planting acacia in bush fallow and grassland areas within the concession zone.
Persuade concession holders to maintain primary forest by promoting HTI and High Conservation Value Forest spatial regulation. Implement results of agreement between the Tanjabar government, community and concession holders on forest boundaries. Implement a moratorium on use of wood from natural forests for pulp and paper industries.
Oil Palm Concession (S2-OPC)
Prohibit conversion of forest to oil palm (± 8759 ha) Persuade concession holders not to convert high-density forests and primary forests to oil palm systems.
Peat Protection Forest Management Unit (S3-PPFMU)
1) Maintain existing forest area 2) Establish systems with jelutong (Dyera polyphylla) in rehabilitated oil palm areas.
Promote the concept of conservation/protected areas and their purpose to communities around the KPHLG. Request more forest police from the Ministry of Forestry. Establish relevant local institutions to support KPHLG. Promote the value of jelutong among the local community and explore access to its national and international markets.
Production Forest (S4-PF)
1) Maintain primary forest area 2) Establish rubber systems in non-forested areas
Promote the concept of conservation/protected areas and their purpose among communities around the KPHP (Production Forest – Management Unit). Provide rubber seedlings to establish rubber systems in the area.
Limited Production Forest (S5-LPF)
1) Maintain primary forest area 2) Establish rubber systems in non-forested areas
Promote the concept of conservation/protected areas and their purpose among communities around the KPHP. Provide rubber seedlings to establish rubber systems in the area.
Wetland Agriculture on Peat (S6-WA_OP)
Preserve existing forest Issue recommendations and prioritize agricultural activities in non-forested land.

34
Figure 4.5 Scenarios and their impacts on reducing cumulative emissions, 2005−2020
4.7 Discussion and conclusion
Emission reduction activities in Tanjabar should focus on the three land allocation zones that
contribute to 78.57 percent of total emissions of CO2e mentioned earlier (80.6 million tonnes
CO2e). Low emission development can take place in the district if all stakeholders are committed
to their tasks and undertake their responsibilities. For example, reducing emissions in the oil palm
sector requires commitment from concession holders to optimize the use of abandoned and
degraded land rather than clearing land with high carbon stock (aka forest). Similarly, reducing
emissions in the HTI zone implies the commitment of pulp and paper industries to use raw
materials from their planted trees and reduce (or even forego) the use of wood (mixed tropical
hardwood) from natural forests.
Several challenges have been recognized in implementing low emission development in the field.
For example, there is high potential to make use of abandoned lands (with low carbon stock)
which formally can be accessed by the concession holder through Agrarian Offices. However, in
reality, land claims by local communities create difficulties for concession holders to proceed with
such approach.
Similarly, to reduce emissions from the PPFMU (KPHLG) zone, local government and local
communities must work together to restore and maintain the protection function of HLG.
Conversion of oil palm to jelutong systems could increase carbon stocks. However, commodity
conversion needs careful consideration because it has impacts on farmers’ income. Currently, oil
palm provides a significant contribution to farmers’ incomes. Promotion of jelutong should be
accompanied with relevant guidance and recommendations, for example on farm management,
harvest methods and market potentials.
68
70
72
74
76
78
80
82
S1-AP S2-OPC S3-PPFMU S4-PF S5-LPF S6-WA_OP
Cu
mu
lati
ve E
mis
sio
n
(mill
ion
to
nn
es
CO
2 e
q)
AP = Acacia Plantation, OPC : Oil Palm Concession, PPFMU: Peat Protection Forest Management Unit, PF: Production Forest, LPF : Limited Production Forest,
WA : Wetland Agriculture on Peat
Emission Reduction Nett Emission

35
To provide communities around the PPFMU with clear legal status and tenurial access in order to
effectively manage the land, the local government should consider to support community based
forest management (e.g. Hutan Kemasyarakat/HKm) or other forms of cooperation that could
strengthen the collaboration between local government and local communities.
Furthermore, implementation of low emission development in Tanjabar in the next years will
require detailed identification of necessary conditions in the implementation stage. It would be
beneficial to test the accuracy of the forecasting/calculations done earlier in the context of the
possible implementation of low emission development in other areas.
In the context of REALU, the low emission development concept seems very appropriate but
cannot stand alone because the development planning system in Indonesia is highly conventional
and regulated. The Law of the Republic of Indonesia Act No. 25 of 2004 related to the National
Development Planning System and Act No. 26 of 2007 on Spatial Planning stipulate the need for
methods to integrate low emission development into conventional regional planning.
The initiative to develop an action plan for reducing emissions at the local level is an idea that
needs more analysis since there is no clarity at any level regarding the division of roles and
commitment in emission reduction efforts. In addition, besides the need for standardization
according to the Intergovernmental Panel on Climate Change’s Guideline, the process of
developing mitigation action should also include all stakeholders who are committed to low
emission development.
Climate change and low emission development need understanding and new skills in efforts to
make inventories, develop action plans and implement monitoring, evaluation and verification.
Achievements in Tanjabar are at early stages of the overall long-term process. The regional
characteristics of Tanjabar are also a challenge to low emission development application as the
region's economic development is still dependent on land-based activities; thus there is a need to
synergize implementation of low emission development and economic development activities.
36
5 Review of transaction and implementation
costs for emission reduction efforts in
Indonesia
Arif Rahmanulloh, Caecilia Yulita Novia, Suyanto
5.1 Introduction
Reducing Emissions from Deforestation and Degradation, and beyond (REDD+) is an international
policy and finance mechanism to pay for avoiding deforestation and enhancing tree planting; it
results in emissions’ reduction and offers carbon credits in return. However, payments come at a
cost for seller countries. Experts have identified the cost components as (1) opportunity costs, (2)
implementation costs and (3) transaction costs (IUCN 2009; World Bank Institute 2011; Pagiola
and Bosquet 2009). The mechanism is being tested at demonstration sitesand studies have
revealed that REDD+ costs are rising. Most studies, however, are still focusing on opportunity
costs, feeding more discourse on feasibility and identification of targeted areas (Harris et al
2008). Studies on transaction and implementation costs are rare. Those that have been
conducted aim to provide REDD+ implementation cost units, allowing stakeholders to design
REDD+ projects more effectively. Recent studies have confirmed that transaction costs can
significantly impede implementation of environmental policies. Transaction costs are normally
blamed for the slow growth of land use, land-use change and forestry (LULUCF) projects (Cacho
et al 2013).
This report assesses the nature and size of transaction and implementation costs in forestry-
related projects in Indonesia. The report is expected to provide a cost estimate for the
implementation of REDD+ or similar land-based carbon projects. In Indonesia, there are more
than 70 REDD+ related projects (Mardiastuti 2012).
The report starts with definition of terms used, especially for transaction & implementation (T&I)
costs. Later, we bring the context of Indonesia to REDD+ implementation. Costs for REDD+ are
approached by collecting cost information on land- and forestry-related projects in Indonesia.
Table 5.1 Cost categories of REDD+ Cost categories Definition
Opportunity costs Equal to foregone benefits that occurred owing to avoidance of deforestation/deforestation (for logging, agricultural activities etc).
Transaction costs
Arise from the needs for information before and while making an economic exchange (game rules and refereeing).
Implementation costs
All costs directly linked with the actions to reduce deforestation or degradation, or enhancing carbon stocks.
Source: World Bank Institute (2011)

37
W O R L D A G R O F O R E S T R Y C E N T R E
Figure 5.1 Cost categories for REDD+
Figure 5.1 shows the cost categories of the emission reduction mechanism. It also portrays the
pathway from initial interest to effective emission reduction through the signed contract linking
local stakeholders and external investors and regulations.
5.2 Scope of transaction costs
The ‘transaction cost’ term, found in new institutional economics discussions, has also crossed
into various studies on environmental policy. It encompasses issues ranging from ‘exchanging
ownership titles’ to ‘cost arranging of a contract ex ante and monitoring and enforcing that
contract ex post” (Demsetsz 1968; Matthews 1986). A recent study indicates that transaction
cost is “the cost of a resource used to define, establish, maintain and transfer property rights”
(McCann et al 2005).
In terms of REDD+ projects, most of the transaction costs are incurred in the preparation phase
and borne by buyers, sellers, donor agencies and external institutions such market as regulators
(Pagiola and Bosquet 2009). Activities categorized as transaction costs range from project
searching and information gathering, learning about materials and production, negotiating and
concluding contracts and monitoring and enforcing contracts over time (Bromley 1991; Stavins
1995; Kasper 1998). Some components such as approval costs and insurance are also considered
under transaction cost (Dudek and Wiener 1998). The World Bank Institute (2011) uses the
following terms to identify transaction cost: program development, agreement negotiation,
emission reduction certification (measuring, reporting, verification [MRV]), stabilization and
preventing deforestation from moving to other countries (stopping leakage).
The activities mentioned below are considered as elements of transaction cost:
Searching and negotiation: Costs ranging from identifying and finding interested projects
and project partners to the transaction and consultations to reach an agreement. This
cost covers the services that address providing information, promotion and brokerage
and the delay experienced by stakeholders in finding a right partner. It is raised for both
buyers and sellers.

38
Feasibility study: The development of monitoring techniques and verification protocols;
methods for baseline and project scenario measurements; feasibility studies to ensure
positive social and environmental benefits result from the project.
Approval costs: Cost of checking and certifying carbon sequestration by an accredited
agency (ex post); cost of validating claims by an accredited agency.
Enforcement and insurance: Cost of enforcing compliance if monitoring detects a breach
of agreed terms of contract. Insurance cost relates to project failure due to fire, the seller
fails to provide emission mitigation or the investor fails to pay.
Free, prior and informed consent (FPIC) activities: Socialization of the REDD program and
institutional strengthening.
World Bank Institute (2011) considers Monitoring, Reporting & Verification (MRV) activities to fall
under transaction cost as they do not contribute to emission reduction. These costs are to ensure
that participants are fulfilling their obligations and for measuring actual greenhouse gas (GHG)
abatement achieved by the project in real time.
5.3 Scope of implementation cost
The implementation costs of REDD+ components cover action to reduce deforestation, forest
degradation and improving carbon stocks. Also, promoting alternative sustainable livelihoods,
preventing illegal logging, sustainable forest management, preventing forest fire and replanting
of degraded lands.
Promoting alternative sustainable livelihoods: This aims to enhance people’s livelihoods
in surrounding REDD+ areas through training, providing alternative sources of income as
well as increasing the productivity of their land. Significant training costs are the number
of participants and the type of training. The REDD Secretariat Central Kalimantan
conducted training on rubber cultivation, fisheries, rattan webbing and integrated
farming in 2012 (Satgas REDD+ 2013).
Preventing illegal logging: The prevention of illegal logging can be accomplished through:
enhancement of people’s livelihoods as well as improvement of forest management and
monitoring activities. It also involves patrolling and controlling the area of the REDD+
program. The size of the REDD+ area is a major cost factor. The wider the area, the more
resources are needed.
Forest fire mitigation: This targets public outreach through fire prevention models,
training, hotspot identification, installing warning signs, as well as patrolling and
providing facilities and tools for monitoring and fire prevention.
Replanting of degraded lands: This activity aims to enhance carbon stocks in targeted
areas. Identifying degraded land is required to estimate the resources needed for
planting activities. The planting cost consists of planning and planting materials as well.
Sustainable Forest Management (SFM): To manage forests sustainably, the Food and
Agriculture Organization of the United Nations (FAO) underscores the maintenance of
biological diversity, productivity, regeneration capacity, vitality and the resource’s
potential to fulfill important functions at various levels, without damaging other

39
ecosystems. This type of cost is approached through the cost of timber harvesting under
the reduced impact logging (RIL) system (Holmes et al 2002).
5.4 Estimating transaction and implementation costs of REDD+ in
Indonesia
REDD+ has not been implemented yet. Transaction cost and implementation cost can be
predicted using the cost component of previous or existing programs on avoiding deforestation
and replanting programs as well as carbon projects with different mechanisms such as the Clean
Development Mechanism (CDM) and voluntary carbon market.
5.4.1 Transaction costs of land and forestry projects in Indonesia
Ginoga and Lugina (2007) found that the transaction costs of CDM-type projects in two locations
were different. In West Nusa Tenggara, the transaction cost for 150 ha was USD 95 779 (39.2
percent of total cost) or USD 639 per hectare. In West Java, the cost for 17.5 ha was USD 51 021
(59.7 percent of the total project) or USD 2915 per hectare. Ginoga and Lugina (2007) indicated
that both projects had the same cost of certification at IDR400 million (USD 42 105) regardless of
different project area. The projects were initiated by the Ministry of Forestry in collaboration with
the Japan International Forestry Promotion and Cooperation Center (JIFPRO) and involved farmer
groups as field implementers. The agreement allowed project implementation through the
establishment of a private forest (Subarudi et al 2004).
Arifin (2006) analysed the transaction cost of payments for ecosystem services (PES) in
Sumberjaya Lampung. The transaction cost of this mechanism was relatively high (USD 55 per
household). The total cost comprises the cost of searching for information, organizing the group
and enforcing rules and regulations (Arifin 2006). Approximately 6400 farmers received Hutan
Kamasyarakatan (HKm) or community forestry management permits for a total area of
approximately 13 000 ha (Suyanto et al 2007). Using the average landholding size of HKm farmers
in Sumberjaya of about 2.03 ha per household, we can estimate the transaction cost of the PES
mechanism by assuming that all HKm licensed-lands employed agroforestry (with coffee). Thus
the transaction cost was USD 27 per hectare.
A case of facilitating HKm permits was published by Partnership for Government Reform (PGR)
(2011). The cost included capacity building activities, mapping, work plan development and all
approaches to propose the HKm permit to the Ministry of Forestry. In total this was estimated to
cost USD 53 per hectare.
Another transaction cost figure in Indonesia was estimated by Ginoga et al (2009, cited in Yuniati
et al 2011). The estimation (REDD preparation cost and project developer) was USD 0.014 per
tonne of CO2 and USD 1.3 US$ per tonne of CO2, respectively.
Table 2 summarizes the transaction costs as described above. The costs translated into USD per
tonne of Co2 using the carbon stock data for agroforestry (20 tonnes of C per hectare) in
Lampung (van Noordwijk 2002) and 22.3 tonnes of C per hectare in West Java (Ginoga et al 2004).
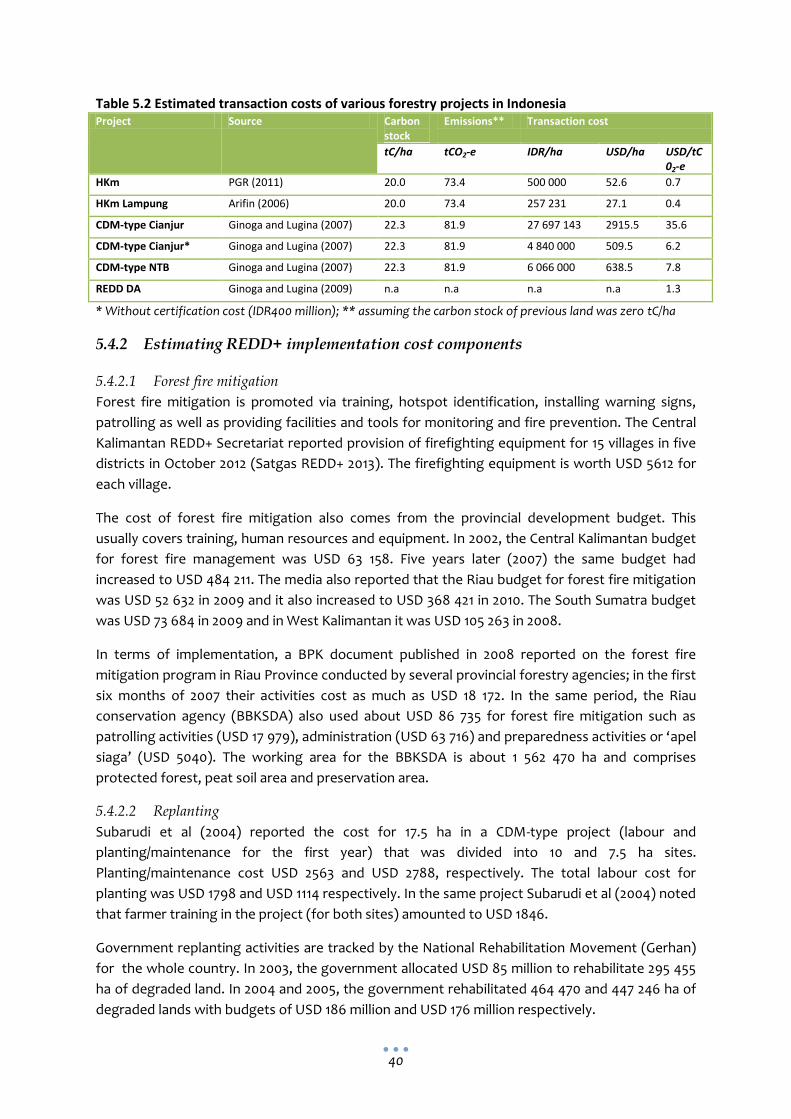
40
Table 5.2 Estimated transaction costs of various forestry projects in Indonesia Project Source Carbon
stock Emissions** Transaction cost
tC/ha tCO2-e IDR/ha USD/ha USD/tC02-e
HKm PGR (2011) 20.0 73.4 500 000 52.6 0.7
HKm Lampung Arifin (2006) 20.0 73.4 257 231 27.1 0.4
CDM-type Cianjur Ginoga and Lugina (2007) 22.3 81.9 27 697 143 2915.5 35.6
CDM-type Cianjur* Ginoga and Lugina (2007) 22.3 81.9 4 840 000 509.5 6.2
CDM-type NTB Ginoga and Lugina (2007) 22.3 81.9 6 066 000 638.5 7.8
REDD DA Ginoga and Lugina (2009) n.a n.a n.a n.a 1.3
* Without certification cost (IDR400 million); ** assuming the carbon stock of previous land was zero tC/ha
5.4.2 Estimating REDD+ implementation cost components
5.4.2.1 Forest fire mitigation
Forest fire mitigation is promoted via training, hotspot identification, installing warning signs,
patrolling as well as providing facilities and tools for monitoring and fire prevention. The Central
Kalimantan REDD+ Secretariat reported provision of firefighting equipment for 15 villages in five
districts in October 2012 (Satgas REDD+ 2013). The firefighting equipment is worth USD 5612 for
each village.
The cost of forest fire mitigation also comes from the provincial development budget. This
usually covers training, human resources and equipment. In 2002, the Central Kalimantan budget
for forest fire management was USD 63 158. Five years later (2007) the same budget had
increased to USD 484 211. The media also reported that the Riau budget for forest fire mitigation
was USD 52 632 in 2009 and it also increased to USD 368 421 in 2010. The South Sumatra budget
was USD 73 684 in 2009 and in West Kalimantan it was USD 105 263 in 2008.
In terms of implementation, a BPK document published in 2008 reported on the forest fire
mitigation program in Riau Province conducted by several provincial forestry agencies; in the first
six months of 2007 their activities cost as much as USD 18 172. In the same period, the Riau
conservation agency (BBKSDA) also used about USD 86 735 for forest fire mitigation such as
patrolling activities (USD 17 979), administration (USD 63 716) and preparedness activities or ‘apel
siaga’ (USD 5040). The working area for the BBKSDA is about 1 562 470 ha and comprises
protected forest, peat soil area and preservation area.
5.4.2.2 Replanting
Subarudi et al (2004) reported the cost for 17.5 ha in a CDM-type project (labour and
planting/maintenance for the first year) that was divided into 10 and 7.5 ha sites.
Planting/maintenance cost USD 2563 and USD 2788, respectively. The total labour cost for
planting was USD 1798 and USD 1114 respectively. In the same project Subarudi et al (2004) noted
that farmer training in the project (for both sites) amounted to USD 1846.
Government replanting activities are tracked by the National Rehabilitation Movement (Gerhan)
for the whole country. In 2003, the government allocated USD 85 million to rehabilitate 295 455
ha of degraded land. In 2004 and 2005, the government rehabilitated 464 470 and 447 246 ha of
degraded lands with budgets of USD 186 million and USD 176 million respectively.
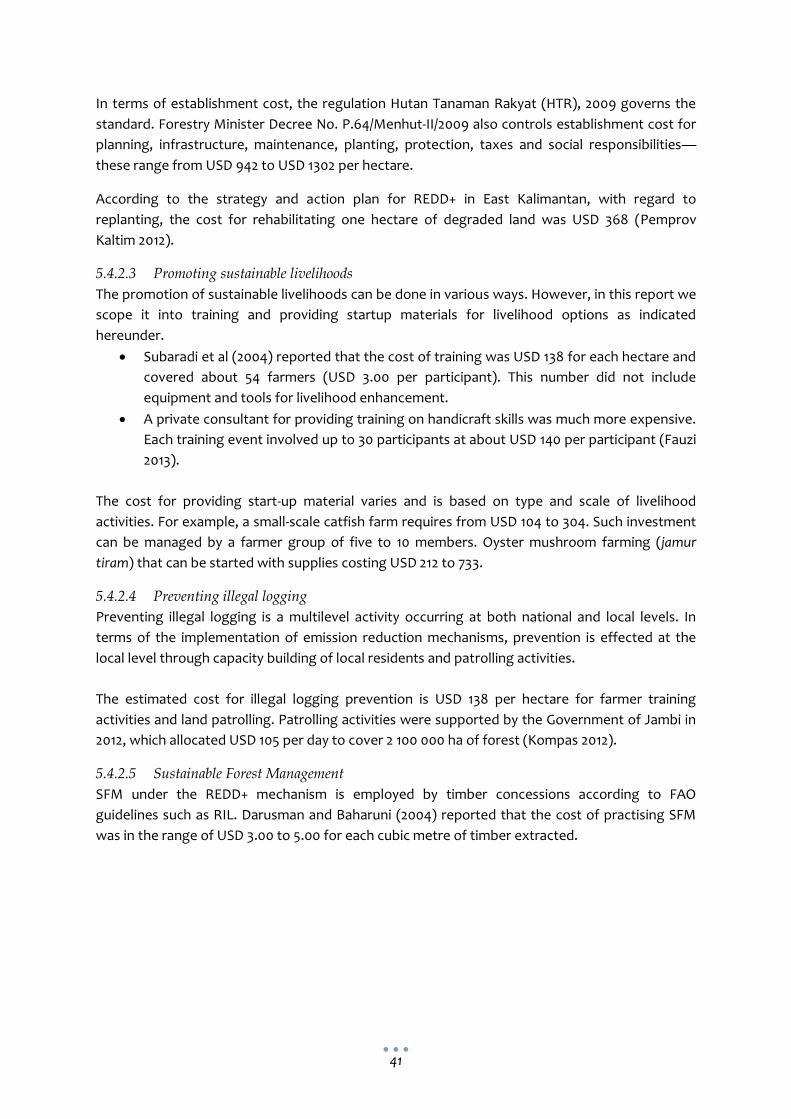
41
In terms of establishment cost, the regulation Hutan Tanaman Rakyat (HTR), 2009 governs the
standard. Forestry Minister Decree No. P.64/Menhut-II/2009 also controls establishment cost for
planning, infrastructure, maintenance, planting, protection, taxes and social responsibilities—
these range from USD 942 to USD 1302 per hectare.
According to the strategy and action plan for REDD+ in East Kalimantan, with regard to
replanting, the cost for rehabilitating one hectare of degraded land was USD 368 (Pemprov
Kaltim 2012).
5.4.2.3 Promoting sustainable livelihoods
The promotion of sustainable livelihoods can be done in various ways. However, in this report we
scope it into training and providing startup materials for livelihood options as indicated
hereunder.
Subaradi et al (2004) reported that the cost of training was USD 138 for each hectare and
covered about 54 farmers (USD 3.00 per participant). This number did not include
equipment and tools for livelihood enhancement.
A private consultant for providing training on handicraft skills was much more expensive.
Each training event involved up to 30 participants at about USD 140 per participant (Fauzi
2013).
The cost for providing start-up material varies and is based on type and scale of livelihood
activities. For example, a small-scale catfish farm requires from USD 104 to 304. Such investment
can be managed by a farmer group of five to 10 members. Oyster mushroom farming (jamur
tiram) that can be started with supplies costing USD 212 to 733.
5.4.2.4 Preventing illegal logging
Preventing illegal logging is a multilevel activity occurring at both national and local levels. In
terms of the implementation of emission reduction mechanisms, prevention is effected at the
local level through capacity building of local residents and patrolling activities.
The estimated cost for illegal logging prevention is USD 138 per hectare for farmer training
activities and land patrolling. Patrolling activities were supported by the Government of Jambi in
2012, which allocated USD 105 per day to cover 2 100 000 ha of forest (Kompas 2012).
5.4.2.5 Sustainable Forest Management
SFM under the REDD+ mechanism is employed by timber concessions according to FAO
guidelines such as RIL. Darusman and Baharuni (2004) reported that the cost of practising SFM
was in the range of USD 3.00 to 5.00 for each cubic metre of timber extracted.
42
Table 5.3 Indicative cost for implementation of emission reduction mechanisms Component Activities Indicative cost
Forest fire mitigation Training USD 3−140 per participant
Patrolling USD 17 979 (six-month period)
Equipment USD 5612 for each village
Replanting Planting USD 256−1302 per ha
Promoting sustainable livelihood Training USD 3−140 per participant
Start-up material USD 104−733 per small start-up package
Preventing illegal logging Training USD 138 per ha
Patrolling USD 105 per day
SFM Timber concession USD 3−5 cubic metre
5.4.3 Strategies to reduce transaction and implementation costs
To reduce T&i costs influencing factors must be identified. Each country and site has unique
biophysical, institutional and socio-economic characteristics that determine the scope of
activities.
IUCN (2009) noted two factors that influence REDD costs: (1) Type of driver of deforestation and
(2) carbon content.
The search and negotiation process is expensive in Indonesia. Cacho et al (2013) found that
seeking verification and approval for projects in remote areas was costly as expert consultants
needed to be recruited in this context.
Cacho et al (2013) provide strategies to reduce transaction costs that involve increasing project
size by fostering collective action among suppliers, reducing contracting costs by utilizing
existing management structure and reducing information costs through public provision of data,
templates and guidelines. The role of intermediaries during the negotiation process and a
multistakeholder strategy can reduce the cost as well (Arifin 2006).
5.5 Concluding remarks
More information on the T&I costs of REDD+ is needed to backstop the program’s economic
feasibility. This study is an initial step for analysing them based on a literature review. The analysis
need to be extended by analysing more case studies and collecting more primary information.

43
6 Incentive mechanisms for peat forest
protection: formalization of community
forestry mechanism
Putra Agung, Jasnari
6.1 Introduction
Sustaining peat ecosystem is central for emission reduction activities in Tanjabar, owing to large
peatland area including the remaining peatswamp forest. Efforts have been made through the
enforcement of Peat Protection Forest status (Hutan Lindung Gambut - HLG) which covers
approximately 16 000 ha. HLG area was formerly with the status of limited production forest
and was awarded timber concessions until the early of 1990s. In 1999, the area status was
changed to Peat Protection Forest through the issuance of the Forestry Minister Decree No.
421/Kpts-II/1999. This decree intended to restore the functions of peat swamp forest, which had
been exploited for timber extraction. At the end of the concession era an encroachment boom
began and communities started to claim the forest area and converted it for different agricultural
commodities before the land was finally planted with oil palm, which currently covers around
4000 ha (Agung et al 2011).
Responding to the perception of state forest as an open access area, the central government
launched the Forest Management Unit or FMU (Kesatuan Pengelolaan Hutan-KPH) concept. KPH
allocates state forest area into management areas in accordance with the basic functions and
purposes of the forests and is expected to address the fundamental problems of forest
governance experienced over the years and conduct forest management at the site level. The
Peat Protection Forest Management Unit (PPFMU), or locally called KPHLG, was established in
the remaining peat swamp forest of Tanjabar (See Figure 6.1.). Encroachment by communities
triggered the creation of a forest replanting program by the Forestry Agency which intercropped
‘jelutong’ (Dyera polyphylla) with oil palm, the predominant crop planted by farmers.

44
Figure 6.1 KPHLG area and the distribution of jelutong plantations
During 2005–2009, the average annual emission of CO2e in the district reached 9.66 tonnes per
hectare (Ekadinata and Agung 2011). The main source of emissions was the conversion of
previously logged forest to oil palm plantations and rubber. The national development policy to
establish industrial timber plantations (Hutan Tanaman Industri/HTI) has greatly influenced the
level of emissions in the district. Forest area in Tanjabar covers 240,000 ha or 48 percent of the
district’s total area and approximately 71 percent is classified as Production Forest.
Land Use Planning for Low Development (LUWES) analysis conducted in Tanjabar (Ekadinata and
Agung 2011) found that peat protection forest (HLG) generated about 1.9 tonnes of CO2e per
hectare per year. Emissions from HLG mainly stemmed from conversion of peat swamp forest to
oil palm plantations by communities. Using the spatially explicit model simulation of FALLOW
(van Noordwijk 2002) a plausible scenario representing the Reducing Emissions from All Land
Uses (REALU) approach was also simulated for Tanjabar and the result showed HLG to be the
focus area for emission reduction activities (Widayati et al 2011; Mulia et al 2013). Activities
designed as part of emission reduction efforts need to consider consequences on economic
prosperity of the district and local people. Agroforestry and maintaining current-tree based
systems, including planting of jelutong, are important components in this respect.
6.2 Methods
6.2.1 Towards community forests in peat protection areas
Prior to determination of the appropriate mechanism to accommodate the need for recognition
of their farmlands within the protection forest area, several assessments were conducted to
obtain baseline information. This baseline information is needed before programs are developed
in the target area. Different mechanisms of community forest in Indonesia were also reviewed
followed by feasibility analyses of application in HLG Tanjabar.
45
Data was obtained from several sources using a range of methodologies: informal interviews
with farmers and members of customary landowning groups and elders who were personally
involved in or knowledgeable about village/land history, sale of claimed land and forest to
outsiders; also migration and community history case studies and informal interviews with local
people and migrants who cultivate and lay claim to state forest land. Informal interviews with
local governments were also conducted, involving members of the Forestry Agency and District
Spatial Planning Agency.
Other qualitative methods were used for the assessments such as focus group discussion for an
initial overview as well as in-depth interviews with external stakeholders and key informants.
In order to apply forest management policy in the KPHLG area local communities need to have
holistic comprehension of the KPHLG area that they already occupy. Otherwise different
perceptions among local people will impact on the change of the area status from limited
production forest to peat protection forest and there will be indistinct boundaries for the KPHLG
area. Negotiation and mediation should be carried out by the Forestry Agency to restore the
area’s functionality as peat protection forest and mitigate any community negativity about
planting jelutong.
Different forms of community-based forest management were studied and feasibility for
application in HLG context was conducted. And as part of the initial process towards developing
activities towards proposing community forestry in the target area, we also addressed
socialization of forestry issues with the participation of communities and the Forestry Agency.
In addition to that, to increase community awareness on the need for the establishment of a local
institution to help with legitimization of forest management, we invited local community and
farmer representatives as well as Forestry Agency officers to visit Sumberjaya in Lampung
Province. In Sumberjaya, HKm community forestry licences have been awarded for
approximately ten years using a coffee-based system within protection forest. The process was
facilitated by ICRAF and the Rewarding Upland Poor for Environmental Services (RUPES)
program .
6.3 Findings
6.3.1 Community perceptions of the KPHLG area
The KPHLG area consists of four administrative villages: Bram Itam Kanan, Bram Itam Kiri, Teluk
Nilau and Serdang Jaya. Almost 80 percent of the area is in the territory of Bram Itam Kanan and
Bram Itam Kiri villages where jelutong plantation took place from 2009 to 2011. Community
perceptions of the KPHLG area in Bram Itam Kanan and Bram Itam Kiri are elaborated in Table 6.1.
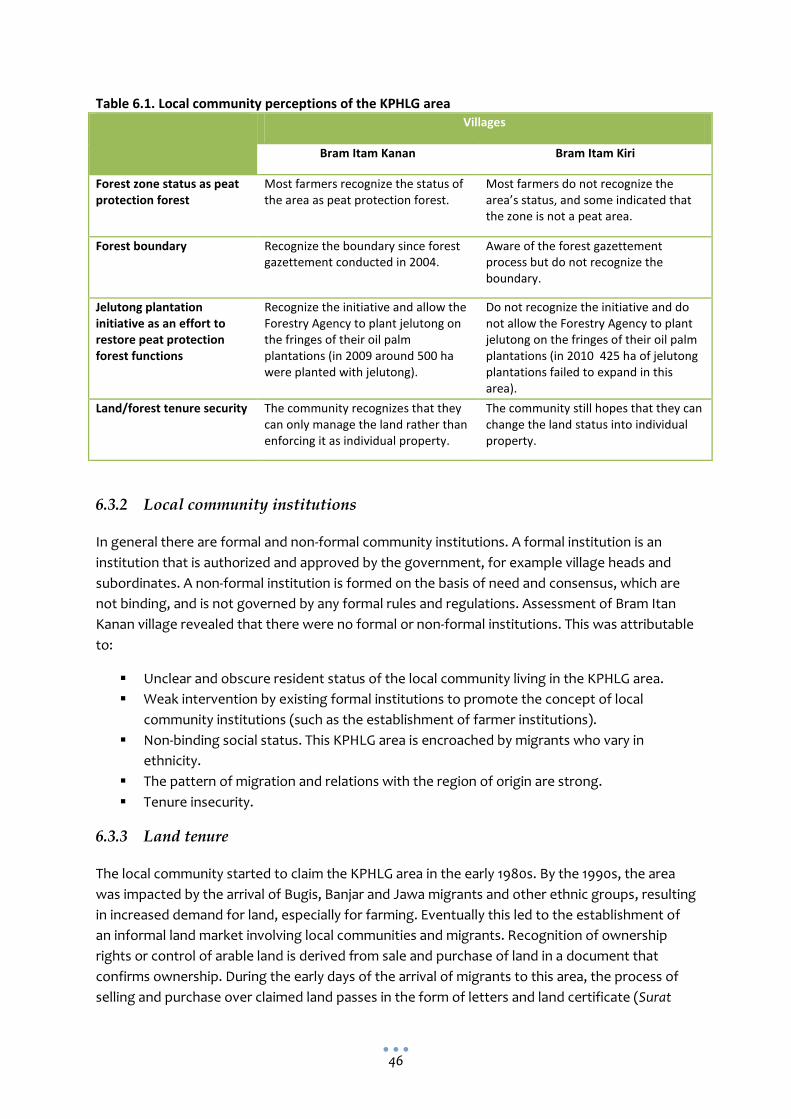
46
Table 6.1. Local community perceptions of the KPHLG area Villages
Bram Itam Kanan Bram Itam Kiri
Forest zone status as peat protection forest
Most farmers recognize the status of the area as peat protection forest.
Most farmers do not recognize the area’s status, and some indicated that the zone is not a peat area.
Forest boundary Recognize the boundary since forest gazettement conducted in 2004.
Aware of the forest gazettement process but do not recognize the boundary.
Jelutong plantation initiative as an effort to restore peat protection forest functions
Recognize the initiative and allow the Forestry Agency to plant jelutong on the fringes of their oil palm plantations (in 2009 around 500 ha were planted with jelutong).
Do not recognize the initiative and do not allow the Forestry Agency to plant jelutong on the fringes of their oil palm plantations (in 2010 425 ha of jelutong plantations failed to expand in this area).
Land/forest tenure security The community recognizes that they can only manage the land rather than enforcing it as individual property.
The community still hopes that they can change the land status into individual property.
6.3.2 Local community institutions
In general there are formal and non-formal community institutions. A formal institution is an
institution that is authorized and approved by the government, for example village heads and
subordinates. A non-formal institution is formed on the basis of need and consensus, which are
not binding, and is not governed by any formal rules and regulations. Assessment of Bram Itan
Kanan village revealed that there were no formal or non-formal institutions. This was attributable
to:
Unclear and obscure resident status of the local community living in the KPHLG area.
Weak intervention by existing formal institutions to promote the concept of local
community institutions (such as the establishment of farmer institutions).
Non-binding social status. This KPHLG area is encroached by migrants who vary in
ethnicity.
The pattern of migration and relations with the region of origin are strong.
Tenure insecurity.
6.3.3 Land tenure
The local community started to claim the KPHLG area in the early 1980s. By the 1990s, the area
was impacted by the arrival of Bugis, Banjar and Jawa migrants and other ethnic groups, resulting
in increased demand for land, especially for farming. Eventually this led to the establishment of
an informal land market involving local communities and migrants. Recognition of ownership
rights or control of arable land is derived from sale and purchase of land in a document that
confirms ownership. During the early days of the arrival of migrants to this area, the process of
selling and purchase over claimed land passes in the form of letters and land certificate (Surat
47
Keterangan tanah-SKT) issued by the village headmaster. Starting from 2007, however, this
issuance has been revoked by District Forestry Office.
The relationship between migration and deforestation in KPHLG area continues to receive
significant attention. The migrants play an important role not only in developing local tenure
arrangements, but also in procuring them on a legal basis to claim state forest land. Migrants are
attracted to forest frontiers if they perceive that they can obtain at least some security of tenure
with an opportunity to make a living.
Lands were encroached by locals and migrants and claims were made by both locals and
migrants as well. Land commoditization in the KPHLG area started in 1970 and boomed from 1990
to the early 2000s. The process was very simple, migrants asked the ‘pesirah’ (chief of territory),
or the village headmen about a parcel of forest for clearing and cultivation. This then extended
into creating new tenure arrangements within the area. Banjar ethnics for example, with their
familiarity and skills in farming peat zones, introduced canalization to drain peat forest as a part
of land preparation. The Bugis and Javanese introduced and practised land share tenancy as a
means to access land resources.
6.3.4 Community-managed forest formalization
6.3.4.1 Possible mechanism under community-managed forest
There are two options of community-managed forest schemes considered for the KPHLG area: 1)
community forestry/HKm and 2) Hutan Desa/village forest.
Community forestry is the utilization of state forest that is primarily intended to empower local
people who are not burdened by land rights. The working area is a tract of forest that can be
managed by a group or coalition of local communities in a sustainable manner. Forest zones that
can be managed under this scheme are protection forest and production forest zones.
Village forest is state forest managed by the village institution and utilized for the welfare of the
village. The village forest working area covers the protected forest and also production forest not
affected by forest management or permits; the proposed location has to be approved by the
village administration.
Community forestry facilitates land tenure/land property rights over claimed forest land. It offers
the communities tenure bundles associated with access, withdrawal, management and exclusion
rights. But like any other community-based forest management mechanism in Indonesia
communities cannot sell, bequeath, transfer or inherit the land.
After dialogue with farmers and Forestry Agency officers, it was proposed that the socialization
and facilitation process would be conducted in Bram Itam Kanan village, which also participates
in the jelutong planting/rehabilitation program.
6.3.4.2 Identification of the target area
Starting in 2009, the Forestry Office of Tanjabar started forest rehabilitation activities in peat
forest areas by introducing a replacement species for oil palm. Jelutong was selected. There have
been three planting programs since 2009: 1) Planting by the Forestry Agency in Bram Itam Kanan

48
village of 500 ha, 2) replanting in Mekar Jaya in 2010 with 425 ha and 3) replanting by BPDAS in
2011 with 415 ha in Bram Itam Kiri.
Despite claims of replanting success (70 percent survival rate of the jelutong trees planted), in
some areas the program was considered a failure due to very low tree survival. Reasons for
failure were attributed to: 1) land conflict in the peat protection area where farmers had already
managed and planted land, 2) poor survival of jelutong when intercropped with oil palm, 3) no
market and value chains established for the latex, 4) lack of clarity on benefit sharing between
farmers and the Forestry Agency and 5) lack of information and extension programs on farm
management for farmers.
The first target area is within the area of rehabilitation program initiated in 2009, located under
the administration of Bram Itan Kanan village. The rehabilitation area comprises 500 ha and
contains 500 households and the canals are Parit (canal) Selebes, Parit Patiro, Parit Bekawan,
Parit Bone and Parit Jawa Bugis (See Figure 6.2).
Figure 6.2 The canal neighborhoods as target area for HKm
Recently many other communities outside the main canal areas have shown interest in joining
the scheme, as a result, several other neighbourhood canals are joining the initiative and as many
as 100 households are involved in this second group covering an area of 300 ha. Most of the lands
are newly cleared areas planted with oil palm or annual crops. The neighbourhood canals are
Parit Haji Melong, Parit Sulawesi, Parit Selamat, Parit Sejahtera and Parit Famili (Figure 6.2).
6.3.4.3 Increased community awareness
Agreement reached during conflict resolution in 2009 became the basis for recognition of
protection forest by the villagers. Intensive socialization conducted through REALU aimed to
provide understanding of the peat protection forest on land managed by them.
More recently, farmers in HLG areas have obtained better perspectives of the importance of
forest rehabilitation to revive forest functions by replanting forest tree species that also provide
economic benefits. Farmers are willing to increase the diversity of their farmland by planting
49
timber and fruit trees in their oil palm gardens. The seeds are provided by the farmers themselves
and the Forestry Agency.
The farmers realize the importance of establishing farmer groups for acquisition of HKm licences.
The groups also allow farmers to discuss and coordinate planning for forest land management.
Since the land belongs to state, they realize that legal ownership is not an option but they could
opt for management rights within the community forestry scheme.
6.3.5 Facilitating the establishment of HKm
6.3.5.1 Formation of farmer groups
After visiting the community forest in Lampung, farmers in Bram Itam made significant progress
towards local institution formation. Based on the location of their dwellings, the following farmer
groups were formed representing their neighbourhoods: Patiro Jaya, Bekawan Raya, Bone
Makkasame, Jawa Bugis and Pada Idi Sido Makmur.
For coordination purposes, one large farmer group was formed as a common platform for all the
farmer groups—the Makmur Jaya Farmer Group.
6.4 Discussions
The formalization of community-managed forest facilitated by the REALU initiative gave positive
impetus especially for community awareness of peat protection forest. It also synergized the
relationship between communities encroaching on KPHLG areas and the Forestry Agency. The
challenge now is if local government, especially the Forestry Agency, will stick to the agenda to
strengthen community-managed forest, among other issues.
Whether the KPHLG can serve as an umbrella to facilitate the HKm process remains unclear in
terms of institutional arrangements. Endorsement to the KPHLG institution from local authority is
still not finalised even though the area itself is already declared as an FMU by the Ministry of
Forestry regulations. Several factors are yet to be resolved, mainly: 1) distribution of human
resources since the KPHLG believes it will acquire some local district government staff; and 2)
identifying the budget to finance KPHLG is still a major issue.
Meanwhile, in practice, the KPHLG also faces another challenge: illegal logging activities.
Community-managed forest (collaborative management) under the facilitation and supervision
of KPHLG institutions will be the potentially optimum solution to restore peat protection forest
and to enhance local community livelihoods and welfare.
6.5 The way forward
After local community institutions are established, the next step is to map community claim areas
within the KPHLG including at least nine canals. Participatory mapping activities will take place to
map all the area claimed by the local community of Sungai Bram Itam Kanan which has been
proposed for an HKm permit. The process itself will involve the local community, local-level
government institutions and the Ministry of Forestry. Once participatory mapping has been
finalized, the next step is developing a target ‘working area’, which is a highly technical process.

50
Another issue that needs to be taken into consideration is how to measure the progress of HKm
once the permit has been issued. In the HKm regulation it is clearly stipulated that the area
permitted as HKm should be monitored and evaluated periodically. Monitoring activities, held at
regular or irregular intervals, should be agreed upon by the parties involved in the
implementation of HKm activities. Evaluation should be an integrated assessment used to obtain
feedback and must not be in repressive mode. Monitoring and evaluation in HKm should be
participatory in nature and should involve all stakeholders involved, so as to understand the
progress, improvement, achievement and constraints in expediting the HKm work plan that has
been developed.
There is a need to develop certain criteria and indicators to address the monitoring and
evaluation of HKm. The three major criteria and indicators are for: (1) institutional arrangement;
(2) conservation, in this case the restoration of peat protection forest functions; (3) the socio-
economic and ecological impact of HKm activities (Cahyaningsih et al 2006)
51
7 Perceptions on agroforestry systems and
jelutong (Dyera polyphylla) for peatland
farming
Janudianto, Muhammad Sofiyuddin, Jasnari , Atiek Widayati
7.1 Introduction
The incentive mechanism for sustaining peat ecosystem in Tanjabar is by giving conditional land
tenure to communities with community forestry scheme (HKM). The conditionality under this
scheme is the revival of forest functions by replanting forest tree species that also provide
economic benefits. One of the endemic peatswamp forest species which has been promoted as
the forest rehabilitation species in Tanjabar HLG is Jelutong (Dyera sp).
Jelutong (Dyera sp.) is a commercial tree species that is highly valued for its latex and wood. It is
indigenous to rainforests throughout Malaysia, Kalimantan and Sumatra. Now it is difficult to find
owing to deforestation, including the peat swamp forests in the islands of Sumatra and
Kalimantan. Many reforestration programs have included jelutong for promotion in Indonesia,
however literature on the species is not widely available.
The changing functions of forests and vast exploitation of timber in the province of Jambi,
particularly within Tanjung Jabung Barat (Tanjabar) peat swamp forest have considerably
diminished jelutong resources in the region. Owing to the demand for jelutong latex and wood in
the last few years, rehabilitation projects have focused on restoring this species for commercial
purposes in peatlands, providing potential income for farmers settling in peat areas.
Jelutong tree planting employs monoculture and agroforestry. Khususiyah et al (2010) studied
the livelihoods of local and migrant communities in Tanjabar and found that the most common
farming systems for local livelihood strategies consist of rubber agroforestry, oil palm, coconut
agroforestry, coffee agroforestry and swidden (slash-and-burn)-paddy.
Implementation of the low emission development project, Reducing Emissions from All Land
Uses (REALU),includes jelutong cultivation as a land-use scenario to study the balance between
emission reduction and livelihood improvement.
This chapter has three objectives: 1) to present a brief overview of the past and current presence
of jelutong as a peat swamp-based trade commodity; 2) to study potential peatland tree-based
agroforestry systems that are suitable for peatland forest restoration in Tanjabar; 3) to identify
the opportunities and potential of jelutong as a native (peat swamp) forest species as part of
peat agroforestry systems.

52
7.2 Methods
7.2.1 Rapid Appraisal of Agroforestry Practices, Systems and Technology (RAFT)
Agroforestry is an umbrella term for a wide range of practices and situations in which trees are
allowed to grow or are grown on farms and in agriculturally-used landscapes. Specific terms for
specific forms of agroforestry are needed before we can understand the strengths and
weaknesses of the use of woody perennials as providers of goods and services, and appreciate
the opportunities for and threats to their further enhancement.
The study adopts the RAFT approach and household surveys on local perceptions on collecting
and verifying data from Tanjabar District. The RAFT framework provides guidelines for the
description and analysis of the ways trees are used and the way that they benefit rural
livelihoods. Supporting data were also collected from Tanjabar as one of jelutong development
areas in Jambi Province.
The RAFT framework assesses agroforestry practices, systems and technology appropriate for
local use that are open to global comparisons—tree management and ‘domestication’; local
ecological knowledge and strength appraisal; weaknesses, opportunities and threats jointly with
the main stakeholders to plan for applied research and development support.
7.2.2 Literature review and key informant interviews on jelutong
Anecdotally, jelutong has been commercially valuable in the past, although currently not many
farmers in the peatland areas of Tanjabar voluntarily plant jelutong. Promotion of jelutong,
however, has taken place in the Hutan Lindung Gambut (HLG) or peat protection forest area,
which is part of a formal peat swamp forest restoration program. Considering its ecological and
economic value, on top of the historical perspectives of this commodity, it is relevant to obtain as
much information as possible on this re-emerging species. Literature review on jelutong was
conducted covering historical perspectives, distribution and trade. In order to obtain the latest
information on jelutong cultivation as well as markets in Indonesia, site visits and key informant
interviews were conducted in two provinces in Central Kalimantan (Kotawaringin Barat and
Kotawaringin Timur districts) and in Jambi (Tanjung Jabung Barat [Tanjabar] and Tanjung Jabung
Timur districts) as they are best known for jelutong production. Interviews were held with
officers from district forestry offices, district plantation offices, jelutong plantation companies
and jelutong nursery farmers. Statistical data were also collected especially from the Central
Statistics Bureau.
7.2.3 Household surveys on local perceptions
This survey was employed to collect the perceptions on and values that people attribute to tree-
based farming systems in the peatland area under study, i.e. how people rate peatland fertility as
well as its suitability for supporting farming systems and potential agroforestry systems in the
area. The latter part of the interview specifically emphasized farmers’ perceptions on jelutong,
both its cultivation potential as part of peatland agroforestry systems as well as its market and
commercial value.

53
Interviews were held in three villages in the peatland areas of Tanjabar: Bram Itam Kanan, Mekar
Jaya and Teluk Nilau. Further categorization was also applied to respondents, mostly to those
from Bram Itam Kanan: HLG farmers and non-HLG farmers.
7.3 Results and discussion
7.3.1 Local perceptions on peatland and farming systems in Tanjabar
Interviews with farmers in the three villages were successfully conducted with 54 farmers, 23 of
them being HLG farmers and 31 being non-HLG farmers.
During the interviews, several tree species were mentioned by respondents that supported their
livelihoods. e.g. areca nut, coffee, coconut, oil palm and jelutong, which mostly conformed with
the findings of Khususiyah et al (2011).
Mulyoutami et al (2011) and Khususiyah et al (2011) indicated that most farmers in Tanjabar
peatland are migrants from different parts of Sumatra and Indonesia. Farming and land
management techniques have been developed over decades and passed on to the next
generation. Overall, their perceptions of land suitability of the peat (or former peat) area were
positive; 60 percent of the farmers responded that farming in peatland area is moderately
beneficial to their livelihoods and 20 percent stated that peatland was very beneficial for their
livelihoods (Figure 1).
Figure 7.1. Suitability and benefits of peatland for farming
When asked about the values or benefits of mixed farming systems and monoculture systems,
farmers considered that both systems provided reasonable benefits for their livelihoods (50−60
percent) (Figure 7.2). Only 21 percent perceive that mixed systems were highly beneficial and only
8 percent had the same opinion about monoculture.
0%
10%
20%
30%
40%
50%
60%
Strongly disadvantage
Somewhat disadvantage
Neither advantage nor
disadvantage
Somewhat advantage
Strongly advantage
Farming suitability in peatland
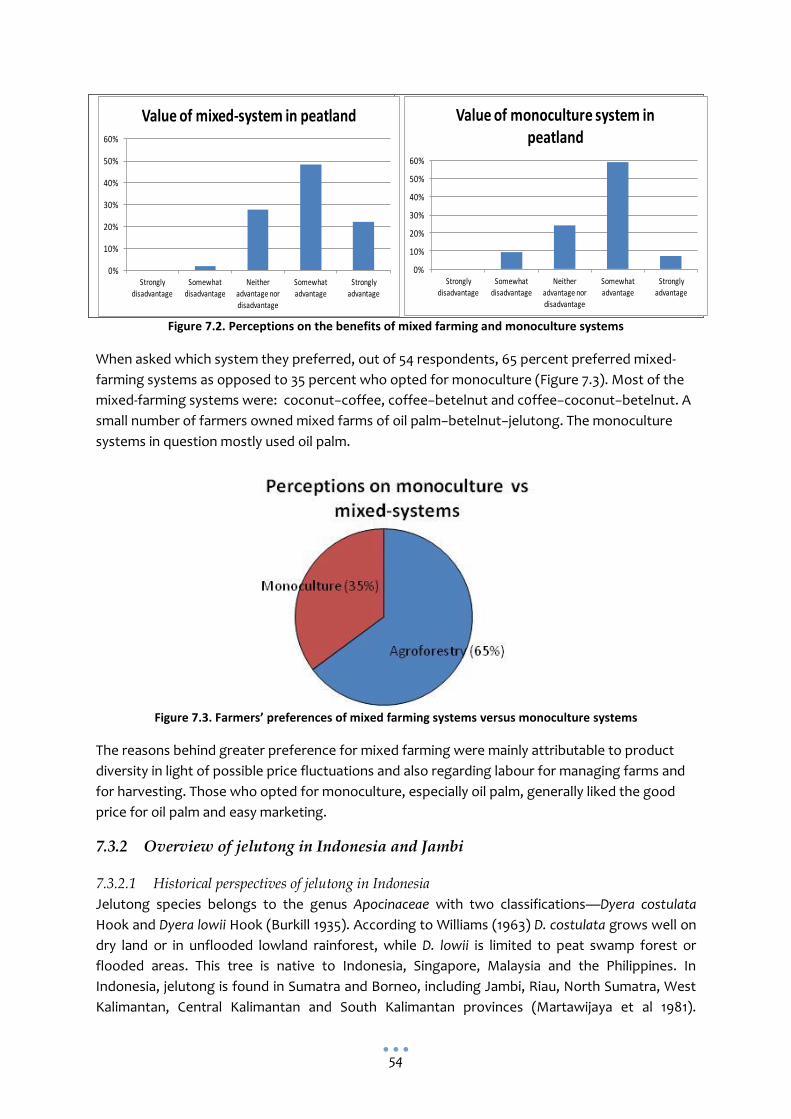
54
Figure 7.2. Perceptions on the benefits of mixed farming and monoculture systems
When asked which system they preferred, out of 54 respondents, 65 percent preferred mixed-
farming systems as opposed to 35 percent who opted for monoculture (Figure 7.3). Most of the
mixed-farming systems were: coconut−coffee, coffee−betelnut and c0ffee−coconut−betelnut. A
small number of farmers owned mixed farms of oil palm−betelnut−jelutong. The monoculture
systems in question mostly used oil palm.
Figure 7.3. Farmers’ preferences of mixed farming systems versus monoculture systems
The reasons behind greater preference for mixed farming were mainly attributable to product
diversity in light of possible price fluctuations and also regarding labour for managing farms and
for harvesting. Those who opted for monoculture, especially oil palm, generally liked the good
price for oil palm and easy marketing.
7.3.2 Overview of jelutong in Indonesia and Jambi
7.3.2.1 Historical perspectives of jelutong in Indonesia
Jelutong species belongs to the genus Apocinaceae with two classifications—Dyera costulata
Hook and Dyera lowii Hook (Burkill 1935). According to Williams (1963) D. costulata grows well on
dry land or in unflooded lowland rainforest, while D. lowii is limited to peat swamp forest or
flooded areas. This tree is native to Indonesia, Singapore, Malaysia and the Philippines. In
Indonesia, jelutong is found in Sumatra and Borneo, including Jambi, Riau, North Sumatra, West
Kalimantan, Central Kalimantan and South Kalimantan provinces (Martawijaya et al 1981).
0%
10%
20%
30%
40%
50%
60%
Strongly
disadvantage
Somewhat
disadvantage
Neither
advantage nor disadvantage
Somewhat
advantage
Strongly
advantage
Value of mixed-system in peatland
0%
10%
20%
30%
40%
50%
60%
Strongly disadvantage
Somewhat disadvantage
Neither advantage nor
disadvantage
Somewhat advantage
Strongly advantage
Value of monoculture system in peatland

55
Jelutong is known by many local names such as ‘melabuai’, ‘nyalutung’ and ‘pidoron’ in Sumatra
and ‘pantung’ and ‘pulut’ in Kalimantan. The main products from jelutong are latex and timber.
Jelutong latex is used by industries for the manufacture of chewing gum, cable coating and
cellophane. Jelutong timber is used for plywood, furniture parts, drawing boards, picture frames
and for making pencils (Lemmens et al 1995).
Prior to the development of rubber (Hevea sp.) plantations in the early 20th century, the world
rubber industry obtained raw materials from wild rubber and jelutong trees (Brown 1919).
According to Burkill (1935), after 1922, the development of the chewing gum industry caused a
highly significant increase in demand for jelutong latex, which peaked between 1910 and the
1930s with decline setting in during the 1960s (Sellato 2002). The decline was attributable to
overexploitation of the resource, in addition to competition with the development of other latex-
producing crops (Williams 1963).
During the 1990s, Indonesia was considered to be the main source of jelutong latex, followed by
Malaysia (Coppen 1995), with the most important importers being the United States, Japan and
Europe. Jelutong timber began to be exploited during the logging concession era in Indonesia.
From 1980 to 1990, Malaysia was the most important supplier of jelutong timber and Japan was
the major importer (Lemmens et al 1995).
7.3.2.2 Jelutong in Jambi
According to Jambi’s indigenous residents there are three types of jelutong which are
distinguished by the colours of their bark and leaves—white, red and black jelutong. More
recently, jelutong production has fluctuated. Based on data from the Central Statistics Bureau,
jelutong latex production in Jambi has only been recorded up to 2007. Currently it is difficult to
find jelutong stands in natural settings. They can only be found in protected forest areas where
exploitation is prohibited, thus there has been no jelutong production in Jambi in the since
around 2009-2010.
Since the late 1970s, exploitation of jelutong timber in Jambi forest has been carried out through
concessions to various logging companies. Between 1980 and 1990 jelutong was one of the
primary sources of livelihood in Jambi. Farmers would harvest jelutong latexfrom naturally-
growing trees in the forest. After the mass logging period was over, jelutong extraction activities
drastically decreased. By the 1990s jelutong trees were hard to find. Jelutong domestication in
Jambi began in 1989 via PT Dyera Hutan Lestari, an industrial forest concession company. The
concessionaire was established to address the needs of pencil manufacturers. Within the last
decade, rubber has developed into the most preferred estate crop in Jambi. However, most
farmers who had profited from jelutong sap began to compare it with rubber and became
interested in cultivating jelutong on their land and gradually jelutong nurseries emerged in
communities. Large-scale jelutong plantation also encouraged jelutong nursery development in
surrounding villages. The limited availability of seeds and seedlings along with their high demand
influenced villages to produce jelutong seedlings. Currently some districts in Jambi are planting
jelutong to rehabilitate peatlands. Jelutong as an indigenous plant species is believed to be
ecologically and economically viable.

56
7.3.3 Jelutong cultivation typologies
In general, jelutong is used as the main crop with other potential plants as intercrops and
currently there are three types of jelutong systems known as described below.
Natural jelutong system
Berbak National Park in Jambi Province is a natural reserve for peat swamp forest conservation
and a natural habitat for jelutong. Based on information gathered from the community, farmers
from villages in the conservation area extract jelutong sap from the forest. Jelutong trees are
unevenly spread and according to farmers in Pematang Raman village in Muaro Jambi, the tree
density for jelutong in the forest was six trees per hectare with an approximate total of around
300 trees in 55 ha of forest .
Mulyoutami et al (2010) showed that the productivity of natural jelutong trees in Lamandau River
Wildlife Reserve (LRWR), Central Kalimantan Province was about 0.99 tonnes per hectare per
year. Productive jelutong trees were about 10 to 15 years-old with approximately 30 cm diameter.
Large diameter trees (about 90 cm) could also be found, with an estimated age of around 60
years.
Large-scale jelutong plantation
PT Dyera Hutan Lestari (PT DHL) operates an 8000 hectare plantation in Muaro Jambi and
Tanjung Jabung Timur districts. The area is dominated by peat swamp to a depth of three metres.
Rosera (2004) indicated that jelutong trees are planted using a row system of two to three
metres with five-metre spacing. The rows extend from east to west with a seven-metre gap in
between rows. Latterly the company has implemented a 100-metre row with five-by-five metre
spacing. The first planting was carried out between 1991 and 1992 over an area of up to 913 ha in
1994 with average growth of more than 90 percent.
The constraints facing jelutong growers are mostly in collecting jelutong fruits as sources of seed,
significant operational cost, lack of information on quality seeds and forest fire—considered to
be the main threat faced by PT DHL. There were two major fires in 1997 and 2003, which caused
great loss to the plantation. Currently, there are only 200 hectares of tree stands in the area
(Bastomi and Lukman 2005). The stands function as sources of seed for Tanjabar District
Smallholders and jelutong
The increased popularity of jelutong in Jambi has encouraged several farmers to independently
develop jelutong cultivation. In Tanjabar, the forestry agency supports communities living in the
protected peat forest, which is government-owned land, to cultivate jelutong as an oil palm
intercrop. In Tanjabar, the forestry agency supports jelutong cultivation on farmers’ land. Both
agencies provide jelutong seedlings for interested farmers and farmer groups at no cost.
From the study conducted in both districts, several villages were found to be jelutong farming
centres, cultivating and producing seedlings for retail (Table 7.1). Farmers have experimented
with a combination of mixed planting using jelutong and other high value crops. The combination
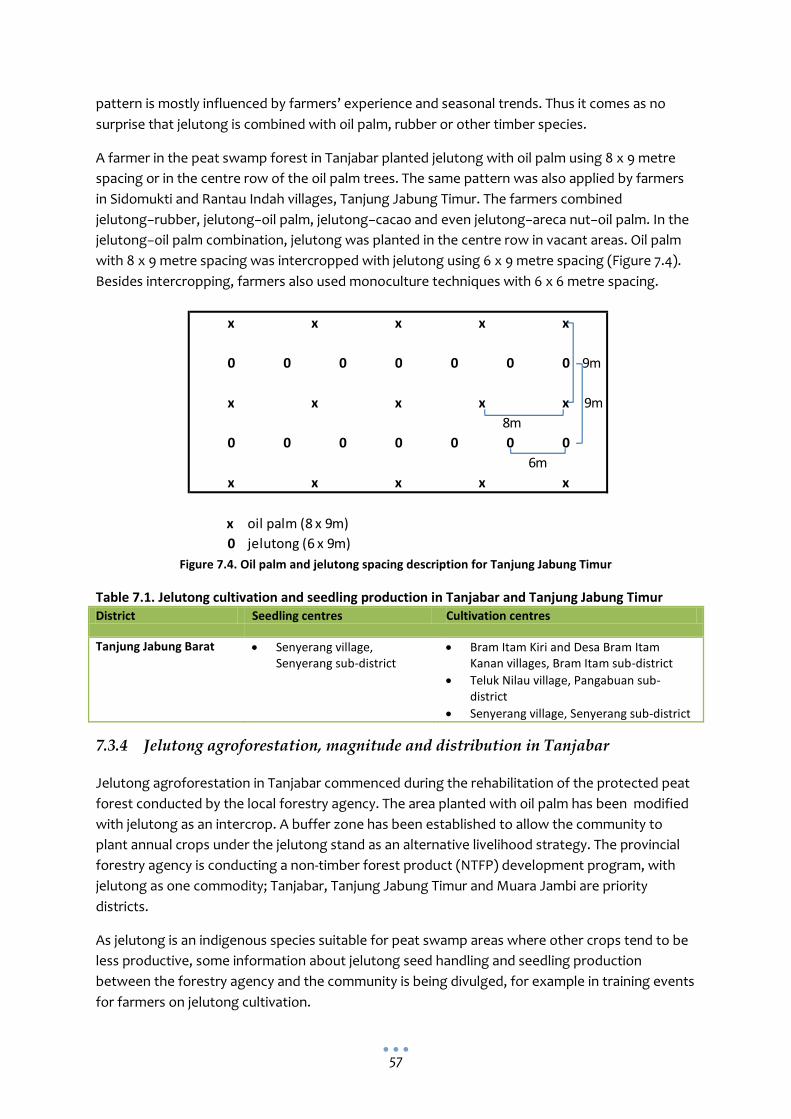
57
pattern is mostly influenced by farmers’ experience and seasonal trends. Thus it comes as no
surprise that jelutong is combined with oil palm, rubber or other timber species.
A farmer in the peat swamp forest in Tanjabar planted jelutong with oil palm using 8 x 9 metre
spacing or in the centre row of the oil palm trees. The same pattern was also applied by farmers
in Sidomukti and Rantau Indah villages, Tanjung Jabung Timur. The farmers combined
jelutong−rubber, jelutong−oil palm, jelutong−cacao and even jelutong−areca nut−oil palm. In the
jelutong−oil palm combination, jelutong was planted in the centre row in vacant areas. Oil palm
with 8 x 9 metre spacing was intercropped with jelutong using 6 x 9 metre spacing (Figure 7.4).
Besides intercropping, farmers also used monoculture techniques with 6 x 6 metre spacing.
Figure 7.4. Oil palm and jelutong spacing description for Tanjung Jabung Timur
Table 7.1. Jelutong cultivation and seedling production in Tanjabar and Tanjung Jabung Timur District Seedling centres Cultivation centres
Tanjung Jabung Barat Senyerang village, Senyerang sub-district
Bram Itam Kiri and Desa Bram Itam Kanan villages, Bram Itam sub-district
Teluk Nilau village, Pangabuan sub-district
Senyerang village, Senyerang sub-district
7.3.4 Jelutong agroforestation, magnitude and distribution in Tanjabar
Jelutong agroforestation in Tanjabar commenced during the rehabilitation of the protected peat
forest conducted by the local forestry agency. The area planted with oil palm has been modified
with jelutong as an intercrop. A buffer zone has been established to allow the community to
plant annual crops under the jelutong stand as an alternative livelihood strategy. The provincial
forestry agency is conducting a non-timber forest product (NTFP) development program, with
jelutong as one commodity; Tanjabar, Tanjung Jabung Timur and Muara Jambi are priority
districts.
As jelutong is an indigenous species suitable for peat swamp areas where other crops tend to be
less productive, some information about jelutong seed handling and seedling production
between the forestry agency and the community is being divulged, for example in training events
for farmers on jelutong cultivation.
x x x x x
0 0 0 0 0 0 0 9m
x x x x x 9m
8m
0 0 0 0 0 0 0
6m
x x x x x
x oil palm (8 x 9m)
0 jelutong (6 x 9m)
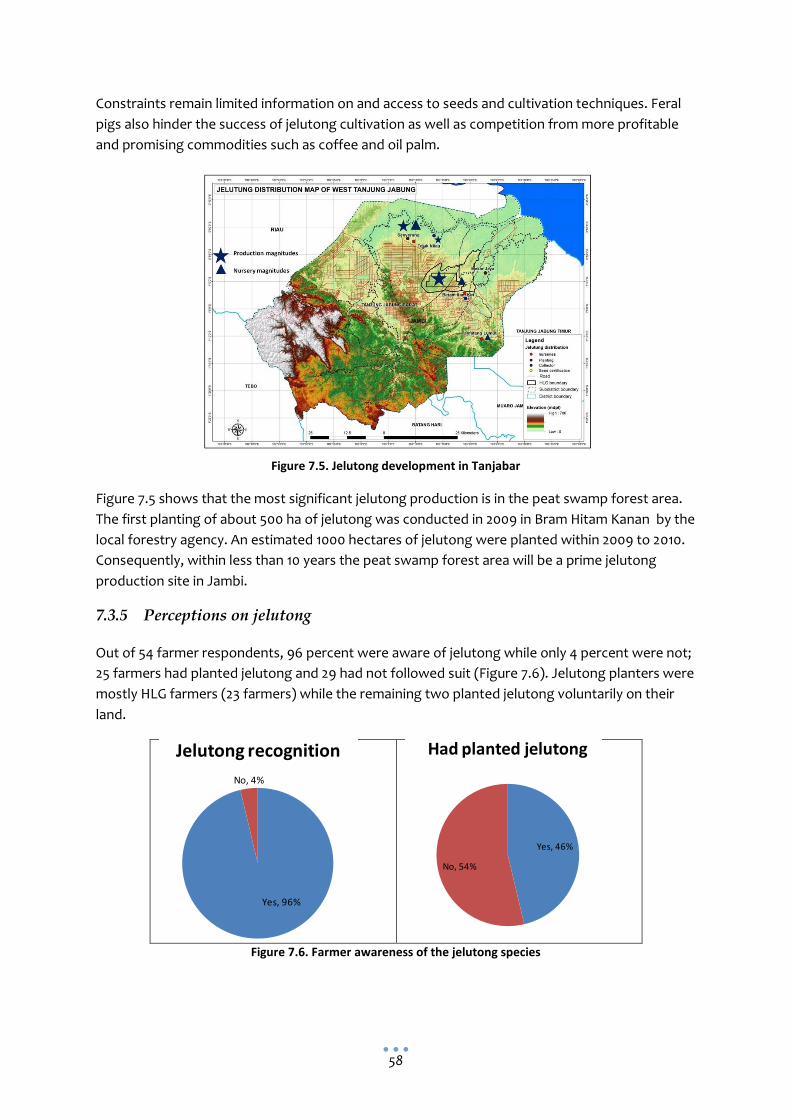
58
Constraints remain limited information on and access to seeds and cultivation techniques. Feral
pigs also hinder the success of jelutong cultivation as well as competition from more profitable
and promising commodities such as coffee and oil palm.
Figure 7.5. Jelutong development in Tanjabar
Figure 7.5 shows that the most significant jelutong production is in the peat swamp forest area.
The first planting of about 500 ha of jelutong was conducted in 2009 in Bram Hitam Kanan by the
local forestry agency. An estimated 1000 hectares of jelutong were planted within 2009 to 2010.
Consequently, within less than 10 years the peat swamp forest area will be a prime jelutong
production site in Jambi.
7.3.5 Perceptions on jelutong
Out of 54 farmer respondents, 96 percent were aware of jelutong while only 4 percent were not;
25 farmers had planted jelutong and 29 had not followed suit (Figure 7.6). Jelutong planters were
mostly HLG farmers (23 farmers) while the remaining two planted jelutong voluntarily on their
land.
Figure 7.6. Farmer awareness of the jelutong species
Yes, 96%
No, 4%
Jelutong recognition
Yes, 46%
No, 54%
Had planted jelutong
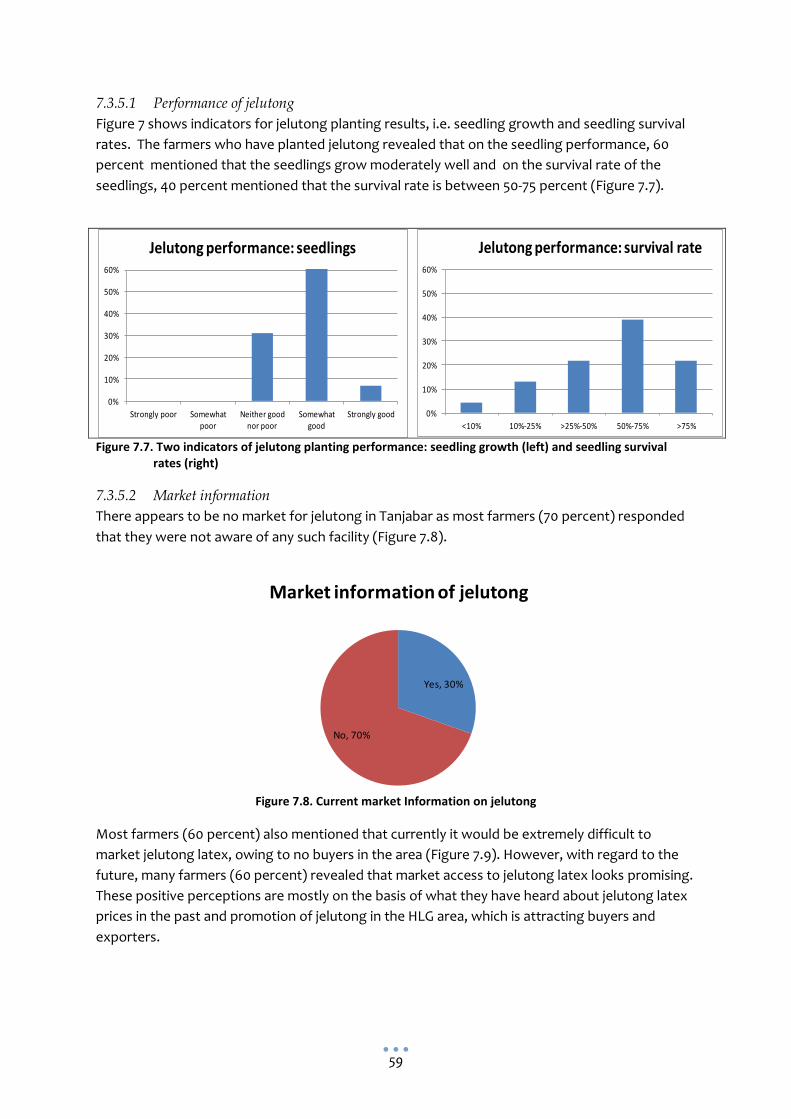
59
7.3.5.1 Performance of jelutong
Figure 7 shows indicators for jelutong planting results, i.e. seedling growth and seedling survival
rates. The farmers who have planted jelutong revealed that on the seedling performance, 60
percent mentioned that the seedlings grow moderately well and on the survival rate of the
seedlings, 40 percent mentioned that the survival rate is between 50-75 percent (Figure 7.7).
Figure 7.7. Two indicators of jelutong planting performance: seedling growth (left) and seedling survival
rates (right)
7.3.5.2 Market information
There appears to be no market for jelutong in Tanjabar as most farmers (70 percent) responded
that they were not aware of any such facility (Figure 7.8).
Figure 7.8. Current market Information on jelutong
Most farmers (60 percent) also mentioned that currently it would be extremely difficult to
market jelutong latex, owing to no buyers in the area (Figure 7.9). However, with regard to the
future, many farmers (60 percent) revealed that market access to jelutong latex looks promising.
These positive perceptions are mostly on the basis of what they have heard about jelutong latex
prices in the past and promotion of jelutong in the HLG area, which is attracting buyers and
exporters.
0%
10%
20%
30%
40%
50%
60%
Strongly poor Somewhat poor
Neither good nor poor
Somewhat good
Strongly good
Jelutong performance: seedlings
0%
10%
20%
30%
40%
50%
60%
<10% 10%-25% >25%-50% 50%-75% >75%
Jelutong performance: survival rate
Yes, 30%
No, 70%
Market information of jelutong

60
Figure 7.9. Perceptions of markets for jelutong at present (left) and in the future (right)
7.3.5.3 Willingness to plant jelutong
Overall, when asked about willingness to plant jelutong, many farmers (60 percent) showed
moderate interest and 28 percent had strong interest in continuing to plant jelutong (Figure
7.10).
Figure 7.10. Farmers’ willingness to plan jelutong
7.3.6 Land tenure and policy affecting jelutong
Obstacles such as access to land still impede agroforestation and adoption of jelutong cultivation
by farmers. Limited landownership means farmers prefer other crops, for example, coffee, areca
nut, rubber and coconut. Moreover, the overlaps between protected peat swamp forest areas
and certified private lands generates unease in cultivation of jelutong. Police arrest of jelutong
tappers and traders also creates apprehension among farmers.
7.3.7 Strengths, weaknesses, opportunities and threats (SWOT) assessments on
jelutong in Tanjabar
Based on the current outputs reported in this chapter, overall analyses on the prospects for jelutong can be summarized using the SWOT approach (Table 7. 2).
0%
10%
20%
30%
40%
50%
60%
Strongly difficult
Somewhat difficult
Neither easy nor difficult
Somewhat easy
Strongly easy
Market information of jelutong: current market
0%
10%
20%
30%
40%
50%
60%
Strongly difficult
Somewhat difficult
Neither easy nor difficult
Somewhat easy
Strongly easy
Market information of jelutong: future market
0%
10%
20%
30%
40%
50%
60%
Strongly not interested
Somewhat not interested
Neither interested nor not interested
Somewhat interested
Strongly interested
Willingness to plant jelutong

61
Table 7.2. SWOT analysis for jelutong in Tanjabar Internal factors
Strength Weakness
1. Jelutong is an indigenous species ideal for planting in peatland that is less productive for agriculture or plantations
2. Jelutong mother trees still exist in forests and community gardens around villages
3. Communities have experience in utilizing jelutong sap
4. Initiative for planting jelutong trees exists in communities, as a coffee and areca nut intercrop.
5. There is a farmer group with certified mother trees.
6. Several farmer groups have attended cultivation training.
1. Limited information and access to seeds and cultivation techniques.
2. Limited landownership 3. Wild pigs attacks 4. No successful production and marketing at
the moment 5. The jelutong sap price is not as competitive
as rubber 6. Coffee and oil palm give promising yields
External factors
Opportunities Threats
1. A development program for NTFPs, including jelutong, is being implemented by provincial forestry agencies prioritizing the districts of Tanjung Jabung Timur, Tanjabar and Muara Jambi
2. A rehabilitation effort is being implemented for protected forest areas by the district forestry agency via jelutong planting
3. Information sharing and exchange between plantation companies and farmers regarding jelutong seed treatment and cultivation
4. Farmers are permitted to plant annual crops under jelutong shade trees within the peat swamp forest area
1. Difficulty in finding jelutong to tap or as mother trees due to production and industrial plantation companies
2. Overlapping between protected peat swamp forest area and certified community-owned land causes concern about planting jelutong on private land
3. No regulations on jelutong trade as an NTFP 4. Arrests of jelutong tappers and traders
7.4 Recommendations: promotion and adoption process
1) Oil palm and areca nut are potentially profitable crops that can be grown together with
jelutong on peatland in Tanjabar.
2) Active support from relevant agencies is required for capacity building among farmers for
seed certification and in jelutong cultivation as well as technical marketing assistance.
3) A policy framework and analysis of implementation practicalities regarding jelutong
management and marketing are required
4) Considering the existence of market actors and the high demand for jelutong products, it is
crucial to develop a jelutong sap-processing industry at the provincial level.
62
8 Market access and value chain of jelutong
latex
Aulia Perdana, Muhammad Sofiyuddin
8.1 Introduction
Jelutong (Dyera sp) is a latex-producing tree with high export value. It is used in the manufacture
of commodities such as edible gum and cable insulators. Jelutong wood is also famous for its soft
texture that is suitable for pencils, interior design and woodcarving. Originally found in natural
forests, the number of jelutong stands has been depleted and only a small number of trees can
be found in protected forests. This has caused a decrease in production of jelutong latex in the
last decade.
In the past few years, jelutong has been the subject of public debate due to promotion by the
Forestry Agency as a forest rehabilitation species as well as for commercial purposes. The rising
demands for jelutong latex and timber reflect more opportunities for smallholder farmers living
in peatland areas to enhance income sustainability, as jelutong productivity can last for 20 years
and the timber can provide good cash returns when rejuvenation takes place. Jelutong planting
was also included and assessed in the Reducing Emissions from All Land Uses (REALU) scenario in
five land-use scenarios that employed the FALLOW model for assessing ecological and economic
impact in Tanjung Jabung Barat.
It was revealed that the rehabilitation program has not yet indicated the marketing aspects of
jelutong cultivation, which will affect adoption by communities and future endeavours. The
success of promoting this tree species lies in the market aspects for that commodity. Therefore,
information on and links to markets and other value chain actors should be incorporated along
with the promotion of peat rehabilitation program. This chapter explores market access and
barriers to marketing non-timber forest products (NTFPs) and agroforestry outputs; it also
assesses NTFP market policies.
8.2 Methods
The study applied primary and secondary market information to identify actors in the market
chain, marketing practices, market access and its issues and opportunities. Data collection was
conducted from village to provincial levels to gain a comprehensive overview of the whole
market system and its methodology. To analyse the jelutong latex market, rapid market appraisal
(RMA) was undertaken; this is an iterative and interactive research process used to better
understand complex market systems in a short period (Perdana et al 2013; ILO 2000; Ostertag et
al 2007). RMA was used to identify and assess the problems and opportunities related to the
jelutong latex market system, how the product flows from production to consumption and to
understand how the commodity system is organized, operates and performs.
63
To identify existing actors involved in the jelutong latex trade, a snowball sampling method was
used; this relies on referrals from initial subjects to generate additional ones. The direction of the
snowballing approach was from tappers to exporters. In-depth interviews with key informants
and focus group discussions were held to validate data collected.
Data collection was conducted in January and November 2012 in Jambi and Central Kalimantan
provinces. In Jambi, the study initially addressed the districts of Tanjung Jabung Barat and
Tanjung Jabung Timur, which contain peat swamps and are a natural habitat for jelutong species.
The REALU project subsequently narrowed the study to Tanjung Jabung Barat as the district has
an interesting focus on peat swamp forest rehabilitation. In comparison, Central Kalimantan was
chosen to provide benchmark information on latex extraction and marketing practices. The
researchers visited the latex marketplace and thus were able to describe the value chain. The
acquired data identify valuable decision-making information for developing recommendations.
8.3 Jelutong latex overview
As having been reviewed in Chapter Seven, jelutong latex is comonly used by industries for
making chewing gum, cable coating and cellophane (Lemmens et al 1995). Initially jelutong latex
was produced and exported for the manufacture of low quality rubber materials. Jelutong latex
started to become important when the manufacture of chewing gum commenced. The
development of this industry generated a highly significant increase in demand for jelutong latex
(Burkill 1935).
Historically Indonesia has been the most important supplier of this product, followed by
Malaysia. During the 1990s, Indonesia was still considered to be the main source of jelutong
(Coppen 1995). Three types of jelutong have been traded for a long time, namely jelutong
Banjarmasin, jelutong Palembang and jelutong Pontianak (formerly known as ‘Dead Borneo’);
trade names are usually based on the exporting port (Vantomme et al 2002). The United States
has traditionally been the major importer of jelutong. In the past, direct shipments of jelutong
from Indonesia were made to the United States; nowadays almost all of them are shipped via
Singapore rather than directly from source (Coppen 1995). Some jelutong is also exported
directly to Japan and Europe (Italy is the main importer). Jelutong production in Indonesia has
experienced fluctuations. The jelutong latex trade peaked between 1910 and the 1930s, and then
began to decline in the 1960s. Decline in latex production is attributable to poor jelutong
productivity caused by overexploitation for many years, in addition to competition with the
development of other sources of latex-producing crops (Williams 1963).
Jelutong latex production in Jambi and Central Kalimantan peaked in the early 1990s and has
declined since then (Figure 8.1). Data obtained from the Central Bureau of Statistics are unlikely
to present the real picture owing to missing information on small-scale production. However they
are sufficient to confirm that jelutong latex is still traded.

64
Figure 8.1 Jelutung latex production from 1985 to 2010 (Central Bureau of Statistics, 1985−2011)
Anecdotal information in Jambi Province demonstrates that up to 2007 people were still looking
for and tapping jelutong trees. In Tanjung Jabung Barat and Tanjung Jabung Timur, tapping is
done in production forest areas owned by companies or in protected forests. Tapping in these
areas is considered illegal and many tappers have been prosecuted by the authorities resulting in
negative impacts on the livelihoods of farmers who depend on this activity. In Central
Kalimantan, on the contrary, to date many people have relied on tapping and trading latex in
these regencies where the trees are abundant.
Jelutong agroforestry in Tanjung Jabung Barat commenced during rehabilitation of the Peat
Protection Forest and was conducted by the Tanjung Jabung Barat Forestry Agency. Land
planted with oil palm was rehabilitated with jelutong as an intercrop. The agency developed a
buffer area and allowed the community to plant annual crops under jelutong stands as an
alternative livelihood strategy. More broadly, the provincial forestry agency conducted an NTFP
development program, with jelutong as one such product in Tanjung Jabung Barat, Tanjung
Jabung Timur and Muara Jambi as priority districts.
8.4 Jelutong latex value chain
Data from key informants revealed that at its peak, jelutong latex development in Jambi Province
followed a relatively simple flow. Tappers sold raw latex directly to large traders or through local
collectors depending on ease of access. Most tappers in Tanjung Jabung Barat sold raw latex
through local collectors owing to remoteness from the nearest town and substantial costs
incurred in travelling. Provincial-level exporters would then receive latex from large traders and
ship it to a processing company for export overseas. Figure 8.2 illustrates product flow in Jambi
and Central Kalimantan.
0
500
1000
1500
2000
2500
3000
3500
4000
1985
1986
1987
1988
1989
1990
1991
1992
1993
1994
1995
1996
1997
1998
1999
2000
2001
2002
2003
2004
2005
2006
2007
2008
2009
2010
Pro
duct
ion
( to
n)
Year
Jambi
Central Kalimantan
Total

65
Figure 8.2 Jelutong latex value chains
A benchmarking study of the jelutong latex value chain in Central Kalimantan discovered that it
followed the same flow. It also found during data collection that the jelutong latex trade was still
thriving and involved a significant number of chain actors.
8.5 Value chain actors
The jelutong trade involves many actors and is influenced by government regulations on NTFP
marketing and trade. Analysis in Central Kalimantan and Jambi showed similarities in market
pathways. Some of the market pathway types are shown in Figure 8.2. Actors involved in jelutong
market pathways include tappers, collectors in villages, intermediaries and export traders.
Tappers
Farmers tap naturally-growing jelutong in state forest land (production forest and protection
forest) and forests surrounding their villages. Tapping is conducted individually or as group,
consisting of two to five tappers. There is a tree tenure system in Jambi and Central Kalimantan.
Each tapper or tapper group has seven to 14 tree lines, with 20 to 40 trees in each line. Based on
observations, there are more jelutong trees in the protected forest area than in the production
forest or in the neighbouring village forest.
At both study sites, tappers act as price takers. No negotiation is evident and collectors declare
the price while receiving barrels filled with raw latex. Larger traders erect a sign with the day’s
price written on it and place it in front of the depot for everyone to see. Tappers are aware of the
quality control procedure employed by the large traders. Colour, water content and cleanliness
are among the indicators of quality set by most traders in the value chain. Lower quality will have
a direct effect on price. In addition, trust is a crucial factor and serves as a primary basis of trade
among all chain actors, especially between tappers and traders. If a tapper tries to cheat by
placing stones or metal in the latex blocks, the whole group may be excluded from the system.
Intermediaries
Intermediaries in the jelutong latex value chain consist of collectors at the village level and
district-level traders. Most village-level collectors are tappers themselves; some have direct
access to traders and own vehicles to transport latex to town; others are just informants or
distributors who resell the latex to traders. Nonetheless, collectors and traders play an important
role along the value chain. First, they search the marketplace. Guided by their information
network, they visit villages or tapper huts and explore upstream for product supply. They have to
Tappers
Collectors/ village buyers
Intermediaries/ local
processing
Exporters
Manufacturing companies/foreign
importers 1 1 1 1
2
2 2
66
repeat this search process frequently due to changes in supply. Second, collectors perform
various sorting functions by grading the quality of the latex of multiple producers for sale to
processors. Third, traders serve to minimize and facilitate the number of contacts in the channel
system.
In practice, collectors visit the tappers, assess the latex blocks or barrels and state the price by
kilogram or for the individual barrel. Sometimes, local- and district-level traders wait for the
tappers to pay them a visit. Traders assess the latex, check for impurities and name the price per
kilogram. Some traders can boil clotted latex in a three-tonne barrel using boiled water. Boiled
latex is then pressed into blocks of 10 x 20 x 15 cm cubes.
Processors and exporters
The next set of jelutong latex chain actors is representatives from the processors and exporters
(private companies) who purchase raw latex from the local- and provincial-level traders and ship
it mostly to Singapore and Japan. Processors and exporters are commonly strategic business
partners; processors process blocks of latex into cubes with only 30 percent water content and
the exporters ship the cubes in containers to other processing companies overseas. In Sumatra,
there are three exporters in Jambi, three in Rengat, one in Pekanbaru and one in Palembang. Due
to lack of supply, an exporter in Jambi moved to Central Kalimantan and started a new venture
where the supply of jelutong latex is sufficient.
In Central Kalimantan during periods when the supply of jelutong latex is abundant,
intermediaries process latex into cubes and processors make latex sheets (SIR20).
8.6 Governance and institutions involved
Exploitation and distribution of jelutong latex as an NTFP is regulated. The Indonesian Ministry of
Forestry and Ministry of Trade are the regulating state agencies. In legislation No. 41/1999
regarding forestry and government regulation No. 6/2007 on forest governance and
management planning, it is explained that the exploitation of NTFPs within state forest requires
permits to use and/or to collect latex (Table 8.1).
Unlike state forests, based on Forestry Minister Decree No. 30/2012 on the management of forest
products produced in private lands, exploitation and collection of NTFPs do not require permits.
However, a transport or personal note is required, authorized by the village chief or village
officials. For NTFP processing, an NTFP Primary Industrial Business Licence is required. The
licences are offered to individuals, firms and cooperatives, and issued by the Ministry of Forestry
based on a recommendation from the district government.

67
Table 8.1. Permits on the utilization of NTFPs Forest status State forest Rights forest
Forest function Conservation Production Protection
Hutan Alam (HA)
Hutan Tanaman (HT)
Utilization * IUPHHBK-HA IUPHHBK-HT - -
Collection * IPHHBK IPHHBK IPHHBK -
Industry IUIPHHBK IUIPHHBK
Distribution/transportation * FA-HHBK FA-HHBK FA-HHBK Transport permit, permit
for own use
Note :
* Regulated under specific law
HHBK= NTFP; IUPHHBK = NTFP utilization permit; IPHHBK = NTFP collection permit; IUIPHHBK = permit for
NTFP primary industry
Within a state forest, procedures for NTFP distribution are regulated in detail in the Forestry
Minister Decree No. 55/2006 on management of forest products derived from state forest. In
NTFP distribution, permit holders require an NTFP freight invoice. In practice, before the invoice
is issued, the company experiences a long official procedure involving district and provincial
forestry agencies.
After harvesting and collecting NTFPs, permit holders are required to assess the weight, volume
and number of harvested NTFPs. The assessment is then recorded and reported in an NTFP
production report. The reporter will need to submit a legalization appeal to the official certifier of
NTFP production at the provincial level with a copy sent to the head of the district agency. The
certified report will act as the basis for calculation of forest resource provision payment. The
provision payment is based on Trade Minister Decree No. 12/2012 for jelutong latex to the amount
of IDR60 000 per kilogram. The certified report must be transcribed into an NTFP list and
attached to the freight invoice during its issuance along with the receipt of the forest resource
provision payment. Export documents are required for processing companies exporting latex as
indicated by the Ministry of Trade.
Figure 8.3 NTFP freight invoice issuance
Based on observations in Tanjung Jabung Barat and Tanjung Jabung Timur, the practice of these
regulations is complicated and cumbersome. Business owners complained that the issuance of
Harvesting Verification Transportation NTFP Distribution
NTFP invoice, NTFP List,
Proof on tax payment NTFP Harvesting Report NTFP Harvesting Report
Document
Companies/cooperatives Office of Production Forest
Monitoring and Utlisation District forestry office
Institution
68
the regulation hampers the jelutong latex trade because the local government has no officials
responsible for NTFP freight invoices or certified production report officers as inspectors and
assessors of jelutong latex. This disparity forced the local government to put all NTFP utilization
on hold. Numerous arrests occurred due to lack of information because of this hold-up as people
still tap in the protected forest areas.
The local government of Central Kalimantan is more flexible in accommodating the issuance of
the regulation. Business owners can directly coordinate with the monitoring and utilization of
production forest agency to assist in developing the production report and freight invoice.
Communities can easily obtain a permit to collect jelutong sap in the village area or a permit from
the protected area managers if the community collects jelutong sap in the protected areas.
8.7 Conclusions and recommendations
Jelutong as a latex-producing tree—formerly a community source of livelihood in peat areas—is
now more difficult to find. Establishment of extensive forestry and plantation companies means
that jelutong trees can only be found in protected forest areas. The production of latex in Jambi
and Central Kalimantan peaked in the 1990s but has been declining to date. However there is still
a small jelutong latex trade.
Peatland rehabilitation programs conducted by the Ministry of Forestry introduced jelutong as an
indigenous species that best fit ecological and economic circumstances in the area. However
there are barriers and challenges that market actors must face to make jelutong an optional
source of livelihood. Indonesia as a producing country can only produce semi-finished products.
In future, with potential and self-initiated cultivation programs by the government or private
entities, an advanced jelutong latex processing industry is a significant proposition to be taken
into account.
The export trade value of jelutong latex is assessed as high, at more than USD 1 million annually.
The local trade value is also considered high at more than IDR1 billion annually. The market itself
has local, national and international scope, with at least three countries outside Indonesia as
major target markets and community-based market chain involvement, such as cooperatives and
farmer groups.
The potential for jelutong latex marketing in Jambi depends heavily on the application of NTFP
regulations within the protected peat forest where farmers now live. Farmer groups are eager to
produce jelutong latex as part of their livelihood portfolio, and value chain actors still exist to
provide their services to customers. This situation can be modified to cater to farmers living
within protected forests. This requires intensive coordination between district and provincial
forestry agencies as well as trade and industrial agencies to disseminate related legislation to all
stakeholders.
Progress can be made if farmers are facilitated to 1) have access to markets and information on
the current status of the jelutong latex market in Indonesia; 2) obtain information on jelutong
cultivation and latex processing; and 3) acquire financial support such as micro credit, which
requires them to form collective groups or cooperatives.

69
9 Peat carbon emissions resulting from forest
conversions
Ni’matul Khasanah, Subekti Rahayu, Dinna Tazkiana, Tonni A smawan, Meine
van Noordwijk, Atiek Widayati
9.1 Introduction
One of the fundamental elements in incentive mechanism for the maintenance or provision of
ecosystem services is the presence of a cause-and-effect link between changes on the landscape
and the services affected, preferably one that is open to observations, monitoring or
measurement. With regards to conditional incentive mechanism to be developed in Tanjabar
peatland area , it is therefore important to obtain reliable estimates on how the landscape
changes affect emissions. This chapter reports the methods and findings on emissions due to
peat oxidation in relation to drainage management of different types of land uses and land
management.
Land conversion in peat areas is potentially a high source of carbon (C) emissions not only due to
vegetation removal during land clearing, but also because of continuous emissions from peat
oxidation when peatland is drained after land conversion. The deeper the groundwater level of a
drainage canal, the higher the oxidation rate becomes. It can be minimized by maintaining the
depth of the groundwater table to a maximum level. Maswar (2011) reported that overall
emission levels for a large-scale oil palm plantation drained to maintain the maximum depth
(shallowest from the surface) of the groundwater table to between 50 and 70 cm were between
34−45 t CO2e per hectare per year. How varied values among land cover types; and if there is any
difference between large-scale operations and smallholder farm management are interesting
questions that need to be answered. How fertilizer affects decomposition and associated CO2
release to the atmosphere is another interesting issue.
The specific objectives of this study were:
To estimate peatland C emissions due to peat oxidation in relation to drainage
management of (1) simple rubber agroforestry, (2) mixed coconut, (3) shaded coffee
cultivation and (4) oil palm plantation by smallholder farms using the C stock difference
approach (1−3) and the rate of subsidence approach (1−4).
To estimate the effect of fertilizer application on the peat decomposition rates of three
land cover types (simple rubber agroforestry, oil palm and logged-over forest) using rate
of subsidence and microrelief approaches.

70
9.2 Methods
9.2.1 Carbon stock difference approach
The primary method for estimation of peat C emissions used in this study was observing the
difference between C stocks of a certain land-use system/farming system and the C stock of
forest when it was cleared and drained, assuming that farming systems were developed from
forest conversion, hence the term ‘stock difference’. The rate of C emitted is affected by the time
lag after clearing, therefore it is important to know the time lag between clearing and the current
age of planted crops. In relation to the maintained water table on the farm, distance from the
main canal also affects the amount of belowground C stock remaining. Belowground C stock will
become lower with closer proximity to the canal; conversely it will be higher with greater
distance from the canal. The ‘broken stick’ relationship is normally used to describe this
relationship as shown in figure 1. In conditions with no emissions, C stock will be on the C stock
maximum line; as drainage builds, the C stock declines following the sloping line (figure 1). The
total loss of C, or C emissions, can be estimated from the triangular area (identified with the
arrow in Figure 9.1).
Figure 9.1 Cumulative peat C losses using the ‘broken stick’ relationship between peat profile C stock and
distance to the drainage canal
Peat C loss is calculated as:
If 0.5d ≥ dt
If 0.5d < dt
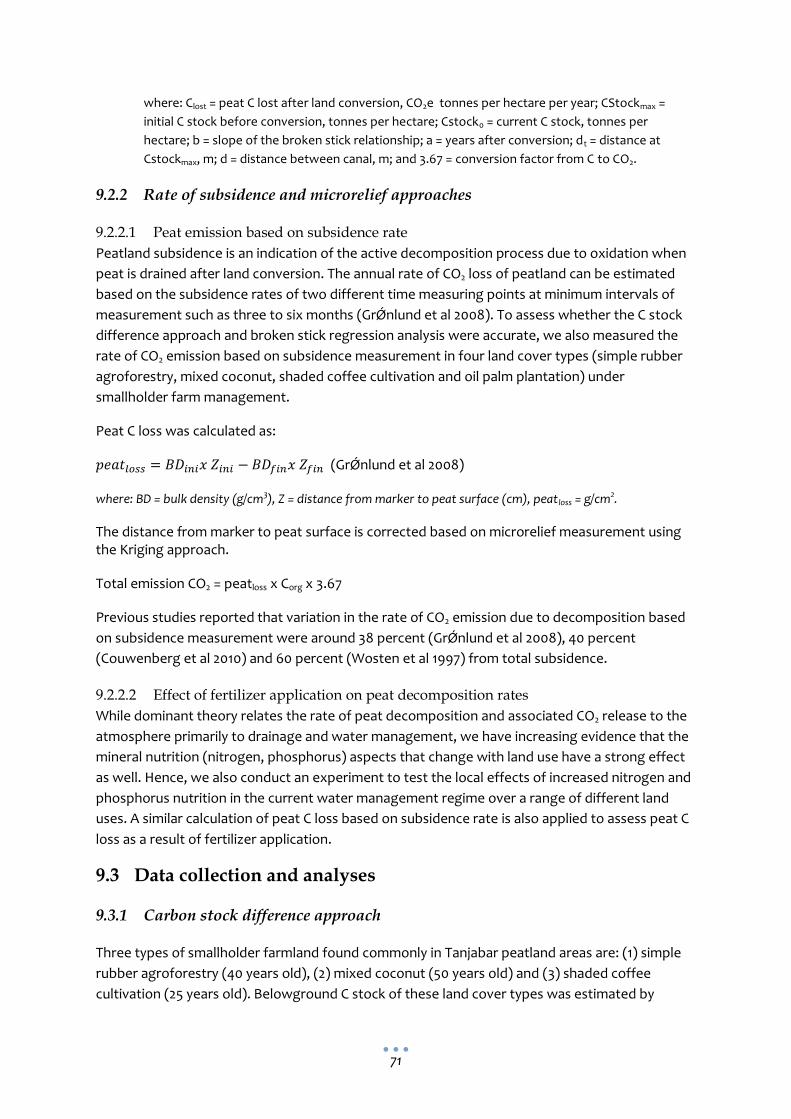
71
where: Clost = peat C lost after land conversion, CO2e tonnes per hectare per year; CStockmax =
initial C stock before conversion, tonnes per hectare; Cstock0 = current C stock, tonnes per
hectare; b = slope of the broken stick relationship; a = years after conversion; dt = distance at
Cstockmax, m; d = distance between canal, m; and 3.67 = conversion factor from C to CO2.
9.2.2 Rate of subsidence and microrelief approaches
9.2.2.1 Peat emission based on subsidence rate
Peatland subsidence is an indication of the active decomposition process due to oxidation when
peat is drained after land conversion. The annual rate of CO2 loss of peatland can be estimated
based on the subsidence rates of two different time measuring points at minimum intervals of
measurement such as three to six months (GrǾnlund et al 2008). To assess whether the C stock
difference approach and broken stick regression analysis were accurate, we also measured the
rate of CO2 emission based on subsidence measurement in four land cover types (simple rubber
agroforestry, mixed coconut, shaded coffee cultivation and oil palm plantation) under
smallholder farm management.
Peat C loss was calculated as:
(GrǾnlund et al 2008)
where: BD = bulk density (g/cm3), Z = distance from marker to peat surface (cm), peatloss = g/cm2.
The distance from marker to peat surface is corrected based on microrelief measurement using the Kriging approach.
Total emission CO2 = peatloss x Corg x 3.67
Previous studies reported that variation in the rate of CO2 emission due to decomposition based
on subsidence measurement were around 38 percent (GrǾnlund et al 2008), 40 percent
(Couwenberg et al 2010) and 60 percent (Wosten et al 1997) from total subsidence.
9.2.2.2 Effect of fertilizer application on peat decomposition rates
While dominant theory relates the rate of peat decomposition and associated CO2 release to the
atmosphere primarily to drainage and water management, we have increasing evidence that the
mineral nutrition (nitrogen, phosphorus) aspects that change with land use have a strong effect
as well. Hence, we also conduct an experiment to test the local effects of increased nitrogen and
phosphorus nutrition in the current water management regime over a range of different land
uses. A similar calculation of peat C loss based on subsidence rate is also applied to assess peat C
loss as a result of fertilizer application.
9.3 Data collection and analyses
9.3.1 Carbon stock difference approach
Three types of smallholder farmland found commonly in Tanjabar peatland areas are: (1) simple
rubber agroforestry (40 years old), (2) mixed coconut (50 years old) and (3) shaded coffee
cultivation (25 years old). Belowground C stock of these land cover types was estimated by
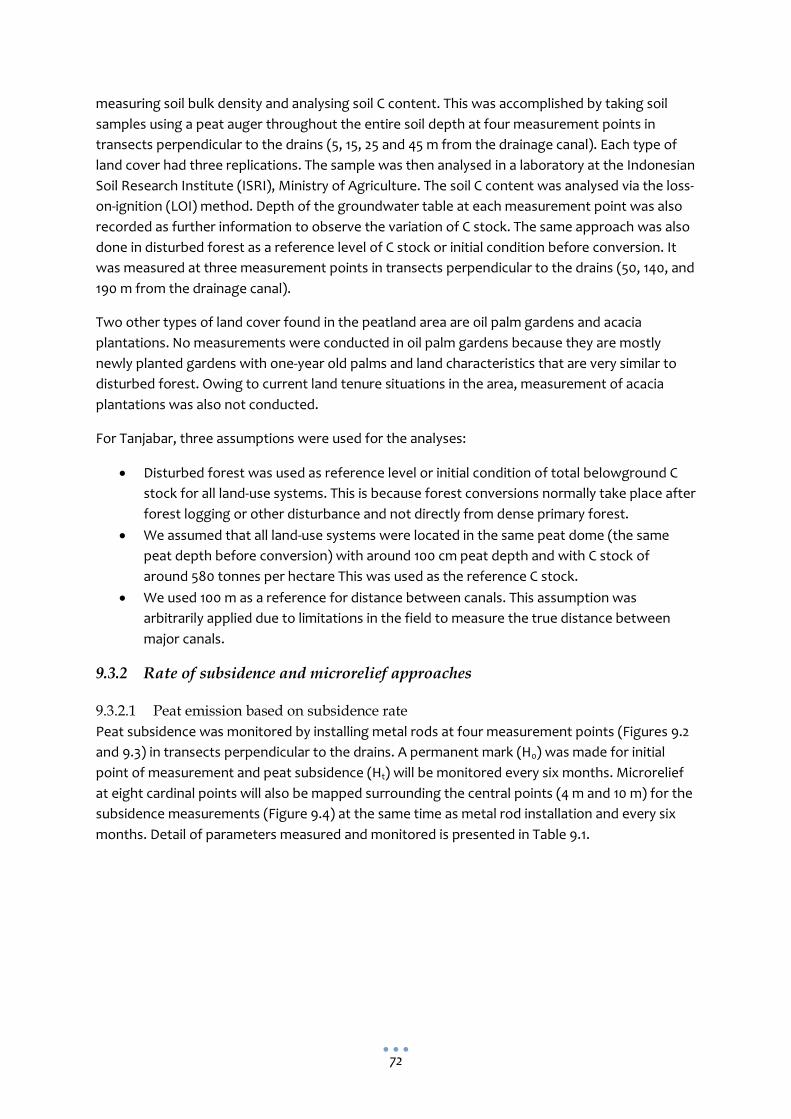
72
measuring soil bulk density and analysing soil C content. This was accomplished by taking soil
samples using a peat auger throughout the entire soil depth at four measurement points in
transects perpendicular to the drains (5, 15, 25 and 45 m from the drainage canal). Each type of
land cover had three replications. The sample was then analysed in a laboratory at the Indonesian
Soil Research Institute (ISRI), Ministry of Agriculture. The soil C content was analysed via the loss-
on-ignition (LOI) method. Depth of the groundwater table at each measurement point was also
recorded as further information to observe the variation of C stock. The same approach was also
done in disturbed forest as a reference level of C stock or initial condition before conversion. It
was measured at three measurement points in transects perpendicular to the drains (50, 140, and
190 m from the drainage canal).
Two other types of land cover found in the peatland area are oil palm gardens and acacia
plantations. No measurements were conducted in oil palm gardens because they are mostly
newly planted gardens with one-year old palms and land characteristics that are very similar to
disturbed forest. Owing to current land tenure situations in the area, measurement of acacia
plantations was also not conducted.
For Tanjabar, three assumptions were used for the analyses:
Disturbed forest was used as reference level or initial condition of total belowground C
stock for all land-use systems. This is because forest conversions normally take place after
forest logging or other disturbance and not directly from dense primary forest.
We assumed that all land-use systems were located in the same peat dome (the same
peat depth before conversion) with around 100 cm peat depth and with C stock of
around 580 tonnes per hectare This was used as the reference C stock.
We used 100 m as a reference for distance between canals. This assumption was
arbitrarily applied due to limitations in the field to measure the true distance between
major canals.
9.3.2 Rate of subsidence and microrelief approaches
9.3.2.1 Peat emission based on subsidence rate
Peat subsidence was monitored by installing metal rods at four measurement points (Figures 9.2
and 9.3) in transects perpendicular to the drains. A permanent mark (H0) was made for initial
point of measurement and peat subsidence (Ht) will be monitored every six months. Microrelief
at eight cardinal points will also be mapped surrounding the central points (4 m and 10 m) for the
subsidence measurements (Figure 9.4) at the same time as metal rod installation and every six
months. Detail of parameters measured and monitored is presented in Table 9.1.

73
Figure 9.2 Points of measurement relative to canals
Figure 9.3 Measurement of peat subsidence
Table 9.1. Monitoring of peat subsidence per measurement point for three years No. Parameters Interval
1 Water table Installed in May 2013, will be monitored every month (manual reading per month)
2 Subsidence Installed in November 2012, will be monitored every 6 months
3 Microrelief at 8 cardinal points at 4 m and 10 m
Every 6 months
4 Bulk density Before metal rod installation and whenever cumulative subsidence exceeds 2 (or 5) cm
main
canal
main
canal
main
canal
main
canal
point 1 at 5 m from main canal
point 4, in the middle of two main canal
point 2 and 3 proportionally in between point 1 and 4
Peat surface
Peat soil
Mineral soil
Border line between mineral and peat soil
1 m
1 m
Peat surface after subsidence
H0
Subsidence (S) = Ht – H0
Ht
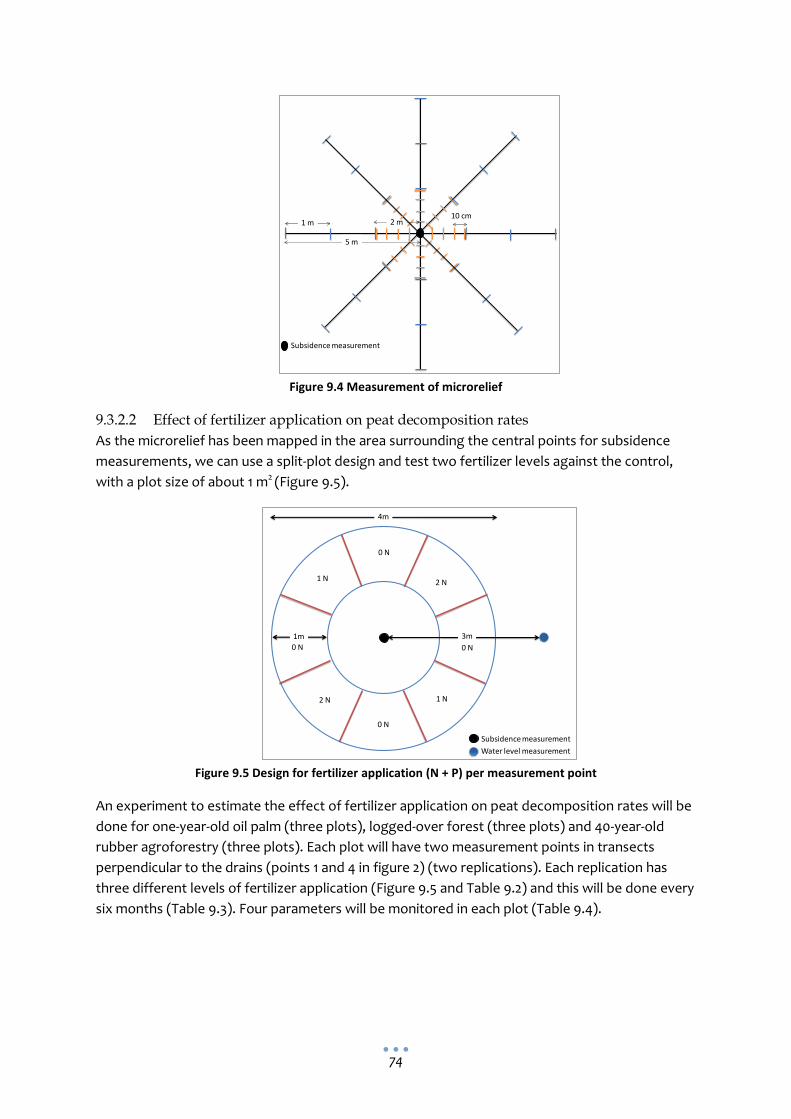
74
Figure 9.4 Measurement of microrelief
9.3.2.2 Effect of fertilizer application on peat decomposition rates
As the microrelief has been mapped in the area surrounding the central points for subsidence
measurements, we can use a split-plot design and test two fertilizer levels against the control,
with a plot size of about 1 m2 (Figure 9.5).
Figure 9.5 Design for fertilizer application (N + P) per measurement point
An experiment to estimate the effect of fertilizer application on peat decomposition rates will be
done for one-year-old oil palm (three plots), logged-over forest (three plots) and 40-year-old
rubber agroforestry (three plots). Each plot will have two measurement points in transects
perpendicular to the drains (points 1 and 4 in figure 2) (two replications). Each replication has
three different levels of fertilizer application (Figure 9.5 and Table 9.2) and this will be done every
six months (Table 9.3). Four parameters will be monitored in each plot (Table 9.4).
5 m
1 m10 cm
Subsidence measurement
2 m
0 N
0 N
0 N0 N
1 N
1 N
2 N
2 N
4m
1m
Subsidence measurement
3m
Water level measurement

75
Table 9.2. Doses of fertilizer application per measurement point Treatment Age of
palm (year)
# of application Urea TSP KCl Urea TSP KCl
(kg/tree/application)1)
(kg/m2/application)
0N - - - - - - - -
1N 1 2 0.625 0.625 0.75 0.28 0.28 0.33
2 2 0.75 0.75 1.75 0.33 0.33 0.77
3 2 0.75 0.75 2.5 0.33 0.33 1.10
2N 1 2 1.25 1.25 1.5 0.55 0.55 0.66
2 2 1.5 1.5 3.5 0.66 0.66 1.54
3 2 1.5 1.5 5 0.66 0.66 2.20 1)
Assuming the rates are applied over 2.27 m2 (1.7 m radius circle around the tree)
Source: Mutert et al (1999)
Table 9.3. Schedule for fertilizer application Year Application Date
1 1st
May 2013
1 2nd
November 2013
2 1st
May 2014
2 2nd
November 2014
3 1st
May 2015
3 2nd
November 2015
Table 9.4. Monitoring per measurement point No. Parameters Interval
1 Water table Installed in May 2013, will be monitored every month (manual reading per month)
2 Subsidence Installed in November 2012, will be monitored every 6 months
3 Micro relief at 8 cardinal points at 4 m and 10 m
Every 6 months
4 Bulk density Before and after treatment, and whenever cumulative subsidence exceeds 2 (or 5) cm
9.4 Results and discussions
9.4.1 Measured plots
The four land cover types where measurements were conducted are illustrated in figure 9.6A−D.
All the measured plots were owned by smallholder farmers with simple canals established. The
distribution of measurement plots is shown in Figure 9.7.

76
A. Simple rubber agroforestry (40 years) B. Mixed coconut
C. Shaded coffee cultivation D. Disturbed forest
Figure 9.6 The measured plots
Figure 9.7 Distribution of plots
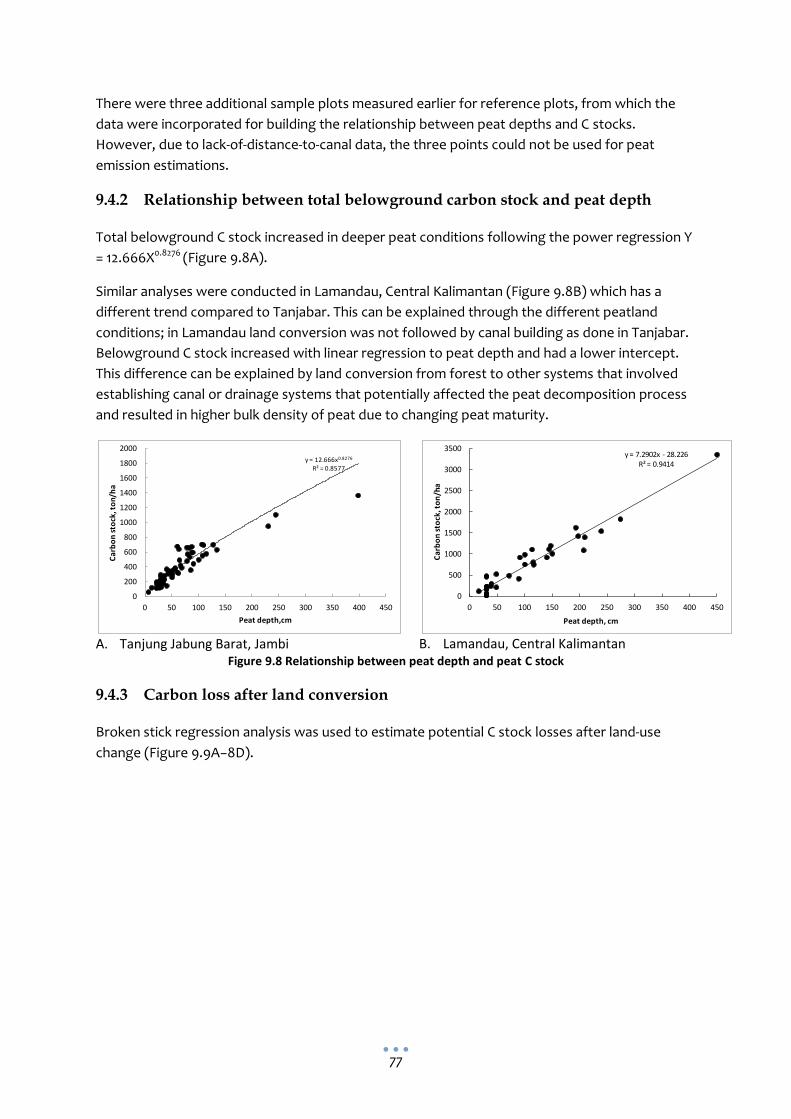
77
There were three additional sample plots measured earlier for reference plots, from which the
data were incorporated for building the relationship between peat depths and C stocks.
However, due to lack-of-distance-to-canal data, the three points could not be used for peat
emission estimations.
9.4.2 Relationship between total belowground carbon stock and peat depth
Total belowground C stock increased in deeper peat conditions following the power regression Y
= 12.666X0.8276 (Figure 9.8A).
Similar analyses were conducted in Lamandau, Central Kalimantan (Figure 9.8B) which has a
different trend compared to Tanjabar. This can be explained through the different peatland
conditions; in Lamandau land conversion was not followed by canal building as done in Tanjabar.
Belowground C stock increased with linear regression to peat depth and had a lower intercept.
This difference can be explained by land conversion from forest to other systems that involved
establishing canal or drainage systems that potentially affected the peat decomposition process
and resulted in higher bulk density of peat due to changing peat maturity.
A. Tanjung Jabung Barat, Jambi
B. Lamandau, Central Kalimantan
Figure 9.8 Relationship between peat depth and peat C stock
9.4.3 Carbon loss after land conversion
Broken stick regression analysis was used to estimate potential C stock losses after land-use
change (Figure 9.9A−8D).
y = 12.666x0.8276
R² = 0.8577
0
200
400
600
800
1000
1200
1400
1600
1800
2000
0 50 100 150 200 250 300 350 400 450
Car
bo
n s
tock
, to
n/h
a
Peat depth,cm
y = 7.2902x - 28.226R² = 0.9414
0
500
1000
1500
2000
2500
3000
3500
0 50 100 150 200 250 300 350 400 450
Car
bo
n s
tock
, to
n/h
a
Peat depth, cm

78
A. Coffee−betel nut
B. Simple rubber agroforestry
C. Coconut + betel nut
D. All data combined
Figure 9.9 Relationship between distance to canal and peat C stock in various land-use systems
Preliminary results of broken stick regression analysis showed that for the first 50 m to the canal,4
CO2 emission from forest conversion was about 28.8 CO2e , 13.6 CO2e and 9.5 CO2e tonnes per
hectare per year for shaded coffee, simple rubber agroforestry and mixed coconut respectively.
However, if land-use systems are not considered, forest conversion in Tanjabar potentially
emitted about 15.8 CO2e tonnes per hectare per year. The variation of emission between land
uses can be linked to the type of land management or maintenance of the canals and age of the
plots. The lowest emission was found in the mixed coconut system, where the farmer maintained
the water level of drainage canals besides the water level controlled by the flow of the river. The
highest emission was found in shaded coffee. Canopy cover that is expressed in aboveground
biomass can also explain the variation of emissions from forest conversion in peatland areas.
Aboveground biomass of shaded coffee is on average 26.0 tonnes per hectare. This value is
lowest compared to simple rubber agroforestry (58.0 tonnes per hectare) and mixed coconut
(48.3 tonnes per hectare). More open area may increase sunlight exposure and decomposition
activity.
9.5 Initial conclusions and way forward
The minimum emission of studied land uses is about 9.5 CO2e tonnes per hectare per year (mixed
coconut) and the maximum is about 28.8 CO2e tonnes per hectare per year (shaded coffee) with 4 There is no C loss beyond 50 m to canal

79
an average of about 15.8 CO2e tonnes per hectare per year. These values can initially be
considered as the C emissions from smallholder plots with simple narrow and shallow canals in
Tanjabar peatland areas that are now 25 and 50 years old.
Maswar (2011) found higher emissions of 34−45 t CO2e tonnes per hectare per year from oil palm
plantations in Aceh. By comparing these values to those found in this study, it seems that
smallholder farms built with simple canals emit less C compared to large-scale (oil palm)
plantations. However, it should be noted that the two studies carry different assumptions and
further research is needed to obtain more reliable outputs for comparison.
Accuracies that may have been introduced in the estimates obtained in this study come from the
various assumptions applied. Each land cover type observed may have had different initial C stock
(reference C stock) based on its peat depth, instead of having one C stock reference of disturbed
forest as applied here. Although it is impossible to obtain the exact reference C stock (hence peat
depth) of each land cover type, to improve the estimation, more sample plots for reference C
stocks should be added.
Peat emission will be estimated based on six-month monitoring cycle on subsidence rates. The
data collected in the first two cycles of monitoring is currently being analysed and is thus not
available to be reported as yet. Another estimate will be on the effect of fertilizer on peat
decomposition rate, of which the monitoring work has just been started recently. Monitoring
work for analyzing these two estimates is ongoing and in order to achieve sound estimate it will
be continued for the next two years.
The assumption of 100 m distance between canals should also be revisited and more accurate
distance measurements should be conducted, for example with GPS measurements and other
mapping approaches. The improved distance may lead to lower or higher emission rates;
emission values will be lower if the distance between canals is more than 100 m and will be higher
if the reference of peat depth is deeper than 100 m.
80
10 Lessons learned and moving forward
10.1 Summary of approaches
Throughout its three-year implementation, REALU II project in Indonesia has contributed to
dialogues on all land-use emission reductions at national, sub-national and site levels. NAMA and
its sub-national derivatives have been the umbrella initiatives for REALU to obtain common
ground with Indonesia’s formal national-to-sub-national efforts, including emerging policies and
regulations.
The chapters in this report address multiple subjects on emission reduction efforts for Indonesia
in the domains of assessments, action-research and engagement/collaboration. Assessments
were needed for better understanding of dynamics, baselines, feasibility and estimates, which
are crucial as the foundation for intervention or action plans. In the meantime, actions and
engagements have been committed by the project with various stakeholders to demonstrate
what it takes to commit to locally feasible and appropriate emission reduction efforts in addition
to achieving the anticipated outcomes.
Another angle of the three-year project was to demonstrate the vertical national to sub-national
interactions formulated in the concept of ‘nesting’. At the Indonesian national level, assessments
were conducted on Indonesia’s dynamics and readiness apropos of REDD+ mechanisms, while
capacity strengthening activities have also become a significant component of REALU
contributions to ICRAF’s role in the national RAN-GRK arena. REALU Indonesia employs the
nesting approach through ‘reverse coning’, in which at the sub-national level it works in Jambi
Province and then zooms in to Tanjung Jabung Barat (Tanjabar) District as the main
demonstration area. At the district level, detailed multiple-sector work was carried out for
emission reduction efforts that are locally appropriate.
10.2 Lessons learned
10.2.1 Dynamics of REDD+ and NAMA in relation to the nesting approach
As discussed in Chapters 2 and 3, in Indonesia we are witnessing the development of two
initiatives for emission reduction: REDD+ and action plans on greenhouse gas (GHG) emission
reduction under NAMA. Each initiative has made progress in developing strategies and action
plans. The major criteria segregating the two, which are sectoral-based, have led to separate
processes involving institutional arrangements, policies and regulations, stakeholder
engagement and technical guidelines. It remains unclear how the two plans will synergize
although this is considered important for responding to the national 26 percent and 41 percent
emission reduction targets. At the provincial level, the action plans are channeled separately
through SRAP and RAD-GRK. As targets for implementation and actual programs are established
under sub-national authorities, it is equally important that synergies also take place at the sub-
national level. SRAP and RAD-GRK in Jambi Province are reviewed in Chapter 3 and it is concluded
that major effort is still needed to find ways and means to synergize the two initiatives. This could
be accomplished by fitting them under the nesting concept, in which convergence and

81
divergence between the two are configured to harmonize planning, targets as well as activities
on the ground; in this case in line with the land-based sectors addressing emission reduction.
REALU Indonesia through its demonstration landscape activities in Tanjabar has initiated
showcase activities at the other end of the nesting spectrum. The main platform is on low
emission development (LED) planning through engagement with the district planning office and
other stakeholders (see Chapter 4). LED recognition will serve to exemplify the bottom-up
approach of nested emission reduction from district to the provincial and the national level.
As part of the proposed action plans for Tanjabar LED, several focused areas are targeted in the
district, each with a certain share of emission reductions (Chapter 4). Further planning should be
conducted in these areas for specific mechanisms to develop into implementable activities. This is
likely to be a long and iterative process, necessitating formal consultations, policies, regulations
and safeguards. For Tanjabar, an exercise, deemed locally appropriate, has been carried out in
the peat protection forest area (HLG). In line with the nesting concept, this translation of a one-
district action plan into a feasible forest protection-based mechanism demonstrates the cross-
sectoral linkage between the sub-national NAMA (or LAAMA) and site-level REDD+.
10.2.2 Incentives and enabling conditions
To promote nature conservation and livelihood sustainability, a range of incentive mechanisms to
achieve both goals has been widely developed, reviewed and to various extents applied in
different settings. Approaches and activities for peat protection forest efforts, which take into
account local people’s livelihoods, have been designed and will eventually lead to a community-
based forest protection approach (Chapter 5). Non-financial incentive mechanism were co-opted
and determined to be appropriate considering the complexities of land tenure issues and the
importance of sustainable forest management in the area. This latter aspect links to the district
forestry program initiated in this area on forest restoration via jelutong planting. As much as it
was considered important to create synergy for successful implementation and for postproject
sustainability, careful assessments of the existing program including species selection, in this
particular case, should take place. Such independent assessment is necessary to ensure local
appropriateness, taking into account ecological, economic and social issues.
Enabling conditions to support emission reduction efforts at the local level were assessed and
recommendations follow, in this case in anticipation of the production stage of jelutong planting;
they include market potential, harvest and trade policies. In addition, perceptions on tree-based
livelihoods in peatland settings were also assessed. This latter assessment also demonstrates
how the current farming systems have survived and can be sustained to be locally-oriented
climate-smart agroforestry systems in peatland areas.
10.3 Partnerships and capacity strengthening
Most of the components and activities of REALU Indonesia take partnerships into account in light
of capacity strengthening and postproject sustainability, to name a few needs.
At the provincial level, engagements with provincial stakeholders have been initiated within
SRAP document development and possible synergies with Jambi RAD-GRK documentation. At

82
the district level, engagements with several district government offices and inclusion of
competent individuals for project implementation have taken place in almost all areas. At the site
level, collaboration with farmers and local communities is essential for proactive community-
based peat forest rehabilitation. The formation of farmer groups for acquiring HKm licences is an
important step, which was achieved after the long process of trust building between the project
and the community. As summed up in Chapter 6, linkages between local institutions and district-
level , in this case KPHLG, will be crucial for the successful implementation of HKm in the area.
Capacity strengthening has been channeled through various means. One of the platforms is a
series of training workshops on methods and tools developed by ICRAF Indonesia to which
REALU contributes. At district and site levels, means for capacity strengthening have been
realized via technical assistance, socialization and facilitation, in addition to training.
10.4 Moving forward to ‘securing emission reduction with a landscape
approach’
Various goals and achievements in REALU II Indonesia have become moving targets and the
dynamics on the ground require flexibility from the project’s perspectives without compromising
the overall goals, objectives and outcomes. Despite progress through the three years of
implementation, several areas need further action and improvement in the years to come. The
list below provides entry points to identify continuing activities, gaps to be addressed and areas
for improvement.
1. National readiness will be evaluated through various other aspects including commitment
to landscape and all land-use approaches and safeguarding aspects. Backstopping
activities should continue in this context.
2. Engagements at the provincial level for linkage with national and district levels should
continue as well as to hook up with the REDD+ scheme and the land-based sector for GHG
emission reduction action plans.
3. As part of LED, documentation of district action plans should be formalized for
recognition as technical background documents within RAD-GRK and to demonstrate the
bottom-up nested emission reduction process.
4. In addition to the ongoing efforts on community-based peat forest protection, locally
appropriate peatland tree-based farming systems should be well identified and incentive
mechanisms should be explored for their sustainability. This should include strengthening
and improvement of enabling conditions.
5. Local capacity strengthening should continue to take place where relevant as part of the
plan to improve enabling conditions to support emission reduction efforts.
6. As part of the linking-knowledge-to-action concept, relevant assessments should
continue to be conducted whenever necessary. Peat emission estimates will be continued
in order to achieve reliable estimates. Other assessments deemed relevant are ex-ante
assessments of emission reduction impacts at the district level, assessments of leakage
and identification of risks and threats vis-à-vis emission reduction at the local level.
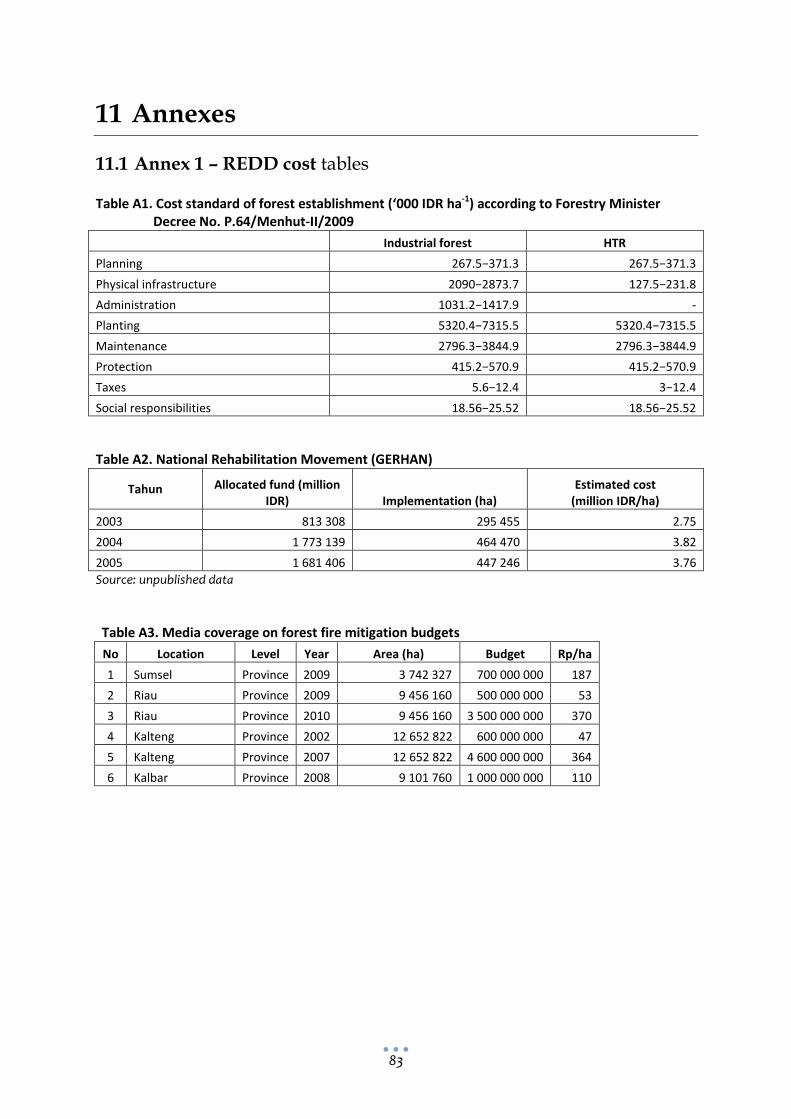
83
11 Annexes
11.1 Annex 1 – REDD cost tables
Table A1. Cost standard of forest establishment (‘000 IDR ha-1) according to Forestry Minister Decree No. P.64/Menhut-II/2009
Industrial forest HTR
Planning 267.5−371.3 267.5−371.3
Physical infrastructure 2090−2873.7 127.5−231.8
Administration 1031.2−1417.9 -
Planting 5320.4−7315.5 5320.4−7315.5
Maintenance 2796.3−3844.9 2796.3−3844.9
Protection 415.2−570.9 415.2−570.9
Taxes 5.6−12.4 3−12.4
Social responsibilities 18.56−25.52 18.56−25.52
Table A2. National Rehabilitation Movement (GERHAN)
Tahun Allocated fund (million IDR) Implementation (ha)
Estimated cost (million IDR/ha)
2003 813 308 295 455 2.75
2004 1 773 139 464 470 3.82
2005 1 681 406 447 246 3.76
Source: unpublished data
Table A3. Media coverage on forest fire mitigation budgets No Location Level Year Area (ha) Budget Rp/ha
1 Sumsel Province 2009 3 742 327 700 000 000 187
2 Riau Province 2009 9 456 160 500 000 000 53
3 Riau Province 2010 9 456 160 3 500 000 000 370
4 Kalteng Province 2002 12 652 822 600 000 000 47
5 Kalteng Province 2007 12 652 822 4 600 000 000 364
6 Kalbar Province 2008 9 101 760 1 000 000 000 110

84
11.2 Annex 2 - List of Publications
List of publications under REALU Indonesia (status as of September 2013)
Published
Journal paper
1. Sofiyuddin M., Rahmanulloh A., and Suyanto S. 2012. Assessment of Profitability of Land Use Systems in Tanjung Jabung Barat District, Jambi Province, Indonesia. Open Journal of Forestry
2. Mulia R., Widayati A., Agung P., Suyanto S. and Zulkarnain MT. 2013. Low carbon emission development strategies for Jambi, Indonesia: simulation and trade-off analysis using the FALLOW model, Mitigation and Adaptation Strategies for Global Change (DOI 10.1007/s11027-013-9485-8)
Conference paper
3. Khususiyah N., Suyanto S. and Janudianto. 2013. Migrants, livelihoods and equity: Understanding for Emissions Reduction in Jambi, Indonesia. IUFRO-2013, Fukuoka, Japan
4. Agung P., Galudra G., Soedomo S. and Nugroho B. 2013. How tenure insecurity formulates land market institutions in the limited production forest area in Tanjung Jabung Barat district, Jambi province, Indonesia. IUFRO-2013, Fukuoka, Japan
5. Zulkarnain MT, Ekadinata A. and Widayati A. 2013. Land Cover Mapping of Tanjung Jabung Barat, Jambi Using Landsat - Alos Palsar Data Fusion and Object Based Hierarchical Classification, Asian Conference of Remote Sensing, Bali, Indonesia
Poster at conferences
6. Suyanto S. and Ekadinata A. 2013. Opportunity costs of emissions caused by land-use changes , ESP Conference, Bali, Indonesia
7. Johana F., Agung P., Widayati A. and Suyanto S. 2013. Low emission development as part of maintaining ecosystem services in Tanjung Jabung Barat, ESP Conference, Bali, Indonesia
8. Janudianto, Sofiyuddin M., Perdana A. and Jasnari. 2013. Jelutong and rubber based-agroforest systems to improve local livelihood and reduce emission in peatland of Sumatra and Central Kalimantan, ESP Conference, Bali, Indonesia
9. Sofiyuddin M., Janudianto and Jasnari. 2013. Coffee-based agroforestry as an alternative to improve local livelihood and reduce emission in peat landscapes of Sumatra, , ESP Conference, Bali, Indonesia
Policy Briefs
10. Widayati A, Johana F, Zulkarnain MT and Mulyoutami E. 2012. Perubahan Penggunaan Lahan, Faktor Pemicu dan Pengaruhnya terhadap Emisi CO2 di Kabupaten Tanjung Jabung Barat (Tanjabar), Propinsi Jambi (Land Use Changes, Driving Factors and the Consequences on CO2 Emissions in Tanjung Jabung Barat, Jambi). Brief No 21. Bogor, Indonesia. World Agroforestry Centre - ICRAF, SEA Regional Office. 4p.
11. Khususiyah N, Sofiyuddin M and Suyanto S. 2012. Strategi Sumber Penghidupan Petani di Tanjung Jabung Barat (Local Livelihood Strategies in Tanjung Jabung Barat). Brief No 22. Bogor, Indonesia. World Agroforestry Centre - ICRAF, SEA Regional Office. 4p.
12. Sofiyuddin M, Janudianto and Perdana A. 2012. Potensi Pengembangan dan Pemasaran Jelutung di Tanjung Jabung Barat (Development and Mareket Potentials of Jelutung in Tanjung Jabung Barat). Brief No 23. Bogor, Indonesia. World Agroforestry Centre -
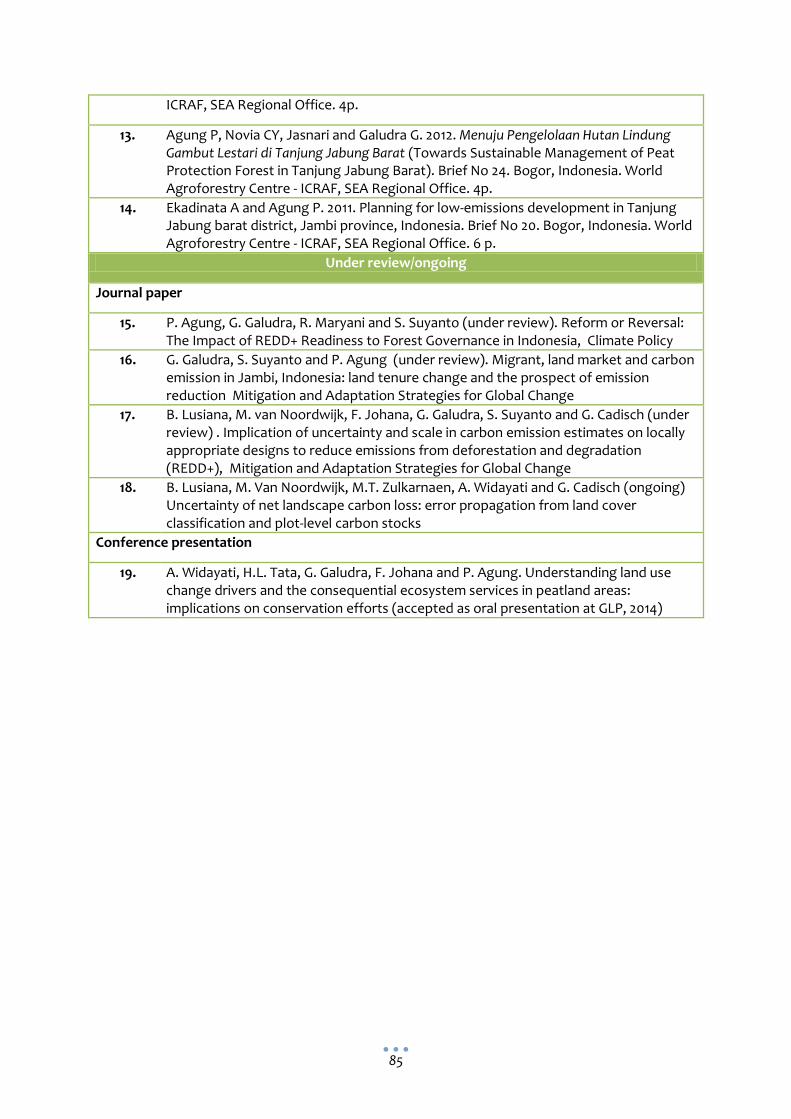
85
ICRAF, SEA Regional Office. 4p.
13. Agung P, Novia CY, Jasnari and Galudra G. 2012. Menuju Pengelolaan Hutan Lindung Gambut Lestari di Tanjung Jabung Barat (Towards Sustainable Management of Peat Protection Forest in Tanjung Jabung Barat). Brief No 24. Bogor, Indonesia. World Agroforestry Centre - ICRAF, SEA Regional Office. 4p.
14. Ekadinata A and Agung P. 2011. Planning for low-emissions development in Tanjung Jabung barat district, Jambi province, Indonesia. Brief No 20. Bogor, Indonesia. World Agroforestry Centre - ICRAF, SEA Regional Office. 6 p.
Under review/ongoing
Journal paper
15. P. Agung, G. Galudra, R. Maryani and S. Suyanto (under review). Reform or Reversal: The Impact of REDD+ Readiness to Forest Governance in Indonesia, Climate Policy
16. G. Galudra, S. Suyanto and P. Agung (under review). Migrant, land market and carbon emission in Jambi, Indonesia: land tenure change and the prospect of emission reduction Mitigation and Adaptation Strategies for Global Change
17. B. Lusiana, M. van Noordwijk, F. Johana, G. Galudra, S. Suyanto and G. Cadisch (under review) . Implication of uncertainty and scale in carbon emission estimates on locally appropriate designs to reduce emissions from deforestation and degradation (REDD+), Mitigation and Adaptation Strategies for Global Change
18. B. Lusiana, M. Van Noordwijk, M.T. Zulkarnaen, A. Widayati and G. Cadisch (ongoing) Uncertainty of net landscape carbon loss: error propagation from land cover classification and plot-level carbon stocks
Conference presentation
19. A. Widayati, H.L. Tata, G. Galudra, F. Johana and P. Agung. Understanding land use change drivers and the consequential ecosystem services in peatland areas: implications on conservation efforts (accepted as oral presentation at GLP, 2014)

86
12 List of References
Agung P, Jasnari, Caecilia N, Galudra G. 2011. Designing incentive mechanism in peat protection
forest management unit through community manage forest scheme. In Widayati, A.
Suyanto, van Noordwijk, M (eds). REALU project report. World Agroforestry Center, SEA.
Bogor, Indonesia.
Angelsen A, Streck C, Peskett L, Brown J, Lutrell C. 2008. What is the right scale for REDD? In
Angelsen (ed) Moving Ahead with REDD pp 31-40. Bogor, Indonesia: CIFOR
Arcidiacono-Bársony C, Ciais P, Viovy N, Vuichard N. 2011. REDD Mitigation. Procedia
Environmental Sciences, Volume 6, Issue null.
Arifin B. 2006. Transaction cost analysis of upstream-downstream relations in watershed services:
lessons from community based forestry management in Sumatra, Indonesia’. Quarterly
Journal of International Agriculture 45 (4): 361-375
Bastomi and Lukman A H. 2005. Prospek Pengembangan Hutan Tanaman Jelutung (Dyera lowii)
Pada Lahan Rawa Sumatera. Prosiding Hasil-Hasil Penelitian Badan LITBANG Kehutanan.
Pusat LITBANG Bioteknologi dan Pemuliaan Tanaman Hutan. Yogyakarta.
Biro Pusat Statistik. Jambi dalam Angka 1985-2010. Biro Pusat Statistik. Jambi. Indonesia
Bromley D. 1989. Economic Interests and Institutions: the Conceptual Foundations of Public
Policy. Gower, Oxford.
Brown N S. 1919. Forests Products; Their Manufacture and Use. John Wiley & Sons, Inc. London
Burkill I H. 1935. A dictionary of the economic products of the Malay Peninsula. 2 vols. Ministry of
Agriculture and Cooperation, Kuala Lumpur.
Cacho O J, Lipper L, Moss J. 2013 Transaction costs of carbon offset projects: A comparative
study, Ecological Economics, volume 88. http://dx.doi.org/10.1016/j.ecolecon.2012.12.008
Cahyaningsih N, Pasya G, Warsito. 2006. Hutan Kemasyarakatan Kabupaten Lampung Barat.
World Agroforestry Center. SEA Regional Office. Bogor. Indonesia.
Coppen J W W. 1995. Gum, Resin, and latexes of Plant Origin. Non Wood Forest Product, no 6.
Forestry Department, FAO. Rome, Italy.
Couwenberg J, Dommain R, Joosten H. 2010. "Greenhouse gas fluxes from tropical peatlands in
south-east Asia." Global Change Biology 16(6): 1715-1732.
Darusman D and Bahruni. 2004. Economic analysis of Sustainable Forest Manajemen at the Level
of management Unit. ITTO Project PD 42/00 REV I (F)-APHI
Demsetz, H. 1968. The cost of transacting. The Quarterly Journal of Economics, 82(1), 33-53.

87
Dewi S, Ekadinata A, Galudra G, Agung P, Johana F. 2011. LUWES; Land Use Planning for Low
Emission Development Strategy, Bogor, Indonesia, World Agroforestry Centre-ICRAF, SEA
Regional Office.
Dudek D J and Wiener J B. 1996. ‘Joint Implementation, Transaction costs, and climate change’,
Organization for Economic Cooperation and Development, OECD/GD (96)173, Paris.
Ekadinata A and Agung P. 2011. Planning for low emissions development in Tanjung Jabung Barat
district, Jambi province, Indonesia. Brief No. 20. Bogor, Indonesia. World Agroforestry
Center (ICRAF), SEA Regional Office. 6 p.
Fauzi M. 2013. Proposal Program Training Usaha Kerajinan. Piramida Pengestu Consulting.
Available: http://www.mmfaozi.com/ (March 14, 2013)
Forsyth T. 2009. How to participate, integrate and coordinate? REDD and multi-level, multi-actor
governance In Angelsen A and Brockhaus M (eds) Realising REDD+: National strategy and
policy options. Bogor, Indonesia: CIFOR
Galudra G, Noordwijk MV, Agung P, Suyanto, Pradhan U (eds). 2011. Migrants, land markets and carbon emissions in Jambi, Indonesia: Land tenure change and the prospect of emission reduction.
Ginoga K, Wulan YC, Djaenudin D. 2004. Potential of smallholder agroforestry for CDM: A case
study in the Citanduy Watershed. Project ASEM 2002/066 Working Paper CC12.
Ginoga K L and Lugina M. 2007. Biaya transaksi dalam perolehan sertifikat penurunan emisi
pembangunan bersih Kehutanan. Jurnal Penelitian Sosial dan Ekonomi Kehutanan Vol. 4,
No. 1, Maret 2007. ISSN 1829-8109
GrǾnlund A, Atle H, Anders H, Daniel PR. 2008. Carbon loss estimates from cultivated peat soils in
Norway: a comparison of three methods. Nutr Cycl Agroecosyst. 81: 157 – 167.
Harja D, Dewi S, van Noordijk M, Ekadinata A, Rahmanulloh A, Johana F. 2012. REDD Abacus SP -
User Manual and Software. Bogor, Indonesia. World Agroforestry Centre - ICRAF, SEA
Regional Office.
Harris N L, Petrova S, Stolle F, Brown S. 2008. Identifying optimal areas for REDD intervention:
East Kalimantan, Indonesia as a case study.Environmental Research Letters, 3(3), 035006.
Holmes T P, Blate GM, Zweede J C, Pereira R, Barreto P, Boltz F, Bauch R.2002. Financial and
ecological indicators of reduced impact logging performance in the eastern Amazon,
Forest Ecology and Management, Volume 163, Issues 1–3, 28 June 2002, Pages 93-110,
ISSN 0378-1127, 10.1016/S0378-1127(01)00530-8.
IPCC. 2006. Guidelines for National Greenhouse Gas Inventories, Prepared by the National
Greenhouse Gas Inventories Programme. Eggleston HS, Buendia L, Miwa K, Ngara T,
Tanabe K (eds). Published: IGES, Japan.
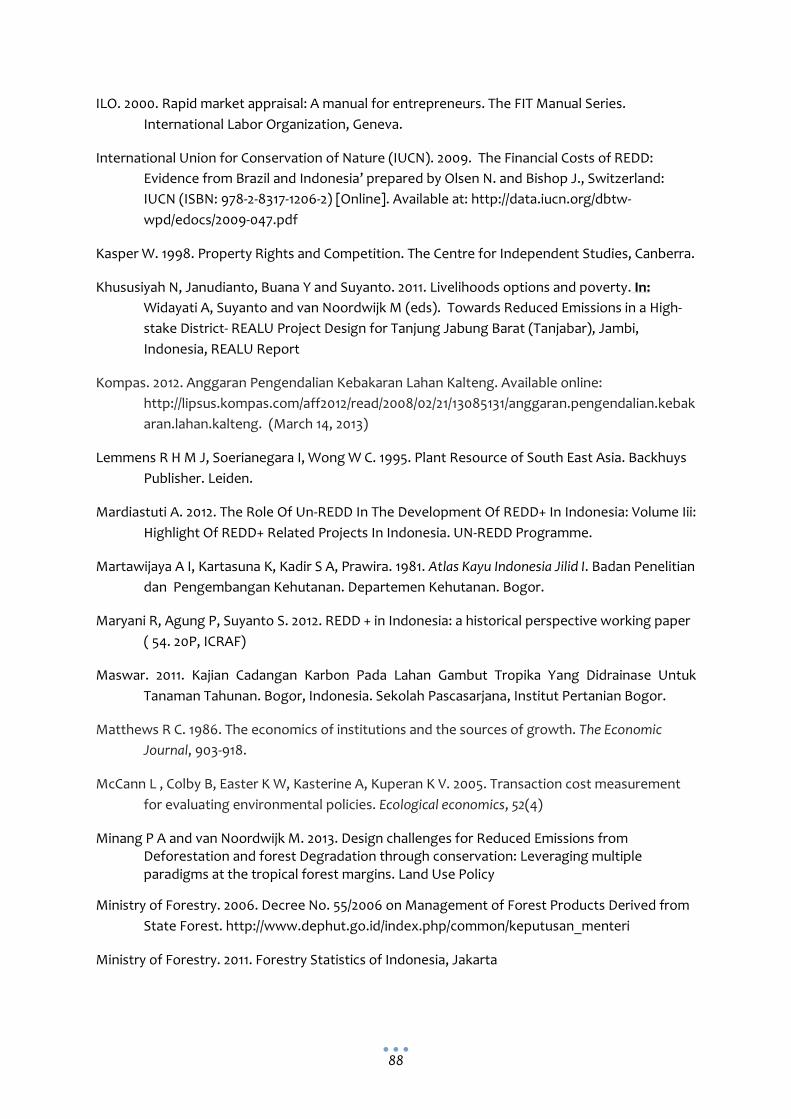
88
ILO. 2000. Rapid market appraisal: A manual for entrepreneurs. The FIT Manual Series.
International Labor Organization, Geneva.
International Union for Conservation of Nature (IUCN). 2009. The Financial Costs of REDD:
Evidence from Brazil and Indonesia’ prepared by Olsen N. and Bishop J., Switzerland:
IUCN (ISBN: 978-2-8317-1206-2) [Online]. Available at: http://data.iucn.org/dbtw-
wpd/edocs/2009-047.pdf
Kasper W. 1998. Property Rights and Competition. The Centre for Independent Studies, Canberra.
Khususiyah N, Janudianto, Buana Y and Suyanto. 2011. Livelihoods options and poverty. In:
Widayati A, Suyanto and van Noordwijk M (eds). Towards Reduced Emissions in a High-
stake District- REALU Project Design for Tanjung Jabung Barat (Tanjabar), Jambi,
Indonesia, REALU Report
Kompas. 2012. Anggaran Pengendalian Kebakaran Lahan Kalteng. Available online:
http://lipsus.kompas.com/aff2012/read/2008/02/21/13085131/anggaran.pengendalian.kebak
aran.lahan.kalteng. (March 14, 2013)
Lemmens R H M J, Soerianegara I, Wong W C. 1995. Plant Resource of South East Asia. Backhuys
Publisher. Leiden.
Mardiastuti A. 2012. The Role Of Un-REDD In The Development Of REDD+ In Indonesia: Volume Iii:
Highlight Of REDD+ Related Projects In Indonesia. UN-REDD Programme.
Martawijaya A I, Kartasuna K, Kadir S A, Prawira. 1981. Atlas Kayu Indonesia Jilid I. Badan Penelitian
dan Pengembangan Kehutanan. Departemen Kehutanan. Bogor.
Maryani R, Agung P, Suyanto S. 2012. REDD + in Indonesia: a historical perspective working paper
( 54. 20P, ICRAF)
Maswar. 2011. Kajian Cadangan Karbon Pada Lahan Gambut Tropika Yang Didrainase Untuk
Tanaman Tahunan. Bogor, Indonesia. Sekolah Pascasarjana, Institut Pertanian Bogor.
Matthews R C. 1986. The economics of institutions and the sources of growth. The Economic
Journal, 903-918.
McCann L , Colby B, Easter K W, Kasterine A, Kuperan K V. 2005. Transaction cost measurement
for evaluating environmental policies. Ecological economics, 52(4)
Minang P A and van Noordwijk M. 2013. Design challenges for Reduced Emissions from Deforestation and forest Degradation through conservation: Leveraging multiple paradigms at the tropical forest margins. Land Use Policy
Ministry of Forestry. 2006. Decree No. 55/2006 on Management of Forest Products Derived from
State Forest. http://www.dephut.go.id/index.php/common/keputusan_menteri
Ministry of Forestry. 2011. Forestry Statistics of Indonesia, Jakarta
89
Ministry of Forestry.2012. Decree No. 30/2012 on The Management of Forest Products Produced
in Private Lands. http://www.dephut.go.id/index.php/common/keputusan_menteri
Mulia R, Widayati A, Suyanto, Agung P, Zulkarnain M T. 2013. Low carbon emission development
strategies for Jambi, Indonesia: simulation and trade-off analysis using the FALLOW
model. Mitig. Adapt. Strategy Glob. Change. DOI 10.1007/s-11027-013-9485-8.
Mulyoutami E, Sofiyuddin M, Budidarsono S, Janudianto. 2010. Component A: Socio-economy of
communities in Joshi L, Janudianto, van Noordwijk M, Pradhan P (eds). Investment in
carbon stocks in the eastern buffer zone of Lamandau River Wildlife Reserve, Central
Kalimantan province, Indonesia: a REDD+ feasibility study. Bogor, Indonesia: World
Agroforestry Centre (ICRAF) Southeast Asia Regional Office.
Mulyoutami E, Khususiyah N, Jasnari, Suyanto. 2011. Migration pattern and the role of women in
Widayati A, Suyanto and van Noordwijk M (eds). Towards Reduced Emissions in a High-
stake District- REALU Project Design for Tanjung Jabung Barat (Tanjabar), Jambi,
Indonesia, REALU Report
Ostrom E. 1990. Governing the commons: the evolution of institutions for collective action. USA:
University of Cambridge.
Ostrom E. 1995. Understanding institutional diversity. USA: Princeton University Press
Ostertag, C, Lundy M, Gottret MV, Best R, Ferris S. 2007. Identifying market opportunities for
rural smallholder producers. Rural Agroenterprise Development Project, Centro
Internacional de Agricultura Tropical, Palmira, Colombia.
Pagiola S and Bosquet B. 2009. Estimating the costs of REDD at the country level
Partnership for Government Reform. 2011. Mendorong Percepatan Program Hutan
Kemasyarakatan dan Hutan Desa. Partnership for Government Reform (PGR). Partnership
Policy Paper No. 4/2011. Jakarta Indonesia.
Pedroni L, Dutscke M, Streck C, Porrua M E. 2009. Creating incentives for avoiding further
deforestation: the nested approach. Climate Policy 9(2): 207-220
Pemerintah Provinsi Kalimantan Timur dan Satuan Tugas REDD+ UKP4. 2012. Strategi dan
Rencana Aksi Provinsi (SRAP) Implementasi REDD+ Kalimantan Timur, Samarinda
Perdana A, Budidarsono S, Kurniawan I and Roshetko JM. 2013. Rapid Market Appraisal (RMA).
In: van Noordwijk M, Lusiana B, Leimona, B, Dewi S, Wulandari D (eds). Negotiation-
support toolkit for learning landscapes. World Agroforesry Centre (ICRAF) Southeast Asia
Regional Program. 285pp.
Republic of Indonesia. 2007. Government Regulation No. 6/2007 on Forest Governance and
Management Planning
http://www.dephut.go.id/index.php/common/peraturan_pemerintah

90
Republic of Indonesia. 1999. Legislation No. 41/1999 Regarding Forestry.
http://www.dephut.go.id/index.php/common/perpu
Rosera H. 2004. Pengalaman PT. Dyera Hutan Lestari (DHL) dalam Pengembangan Hutan
Tanaman Industri di Areal Lahan Gambut. in CCFPI. Wise Use and Sustainable Peatlands
Management Practices. Proceeding of Climate Change, Forests and Peatlands in
Indonesia (CCFPI) Project. Wetlands International – Indonesia Programme dan Wildlife
Habitat Canada. Bogor
Satgas REDD+. 2013. Strategi dan Rencana Aksi Provinsi (SRAP) Implementasi Redd+ Kalimantan
Timur. Pemerintah Prov Kalimantan Timur & Satgas REDD+.
Sellato B. 2002. Non-timber forest products and trade in eastern Borneo. CNRS-IRSEA Université
de Provence. Marseille.France. http://bft.cirad.fr/cd/BFT_271_37-49.pdf
Sikor T, Stahl J, Enters T, Ribot JC, Singh N, Sunderlin WD, Wollenberg L. 2010. REDD-plus, forest
people’s rights and nested climate governance. Global Environmental Change 20(3): 423-
425.
Stavins J. 1995. 'Transaction costs and tradeable permits', Journal of Environmental Economics and
Management, 29, 133-148.
Subarudi, Dwiprabowo H, Ginoga K, Djaenudin D, Lugina M. 2004. Cost Analysis for A CDM-Like
Project Established in Cianjur, West Java Indonesia. Working Paper CC13 Aciar Project
ASEM 2002/066. Download at: http://www.une.edu.au/carbon/CC13.PDF (May 3, 2013)
Suyanto S, Khususiyah N, Purnomoshidi P, Jonson E, Rasna R, Suryadi C, Sakuntaladewi N,
Santoso I, Gadas SR. 2007. Hutan Kemasyarakatan HKm : menuju Bentang Alam yang
sehat dan masyarakat sejahtera. Policy brief. World Agroforestry Center
Van Noordwijk M. 2002. Scaling trade-offs between crop productivity, carbon stocks and
biodiversity in shifting cultivation landscape mosaics: the FALLOW model. Ecological
Modeling 149: 113-126.
Van Noordwijk M, Rahayu S, Hairiah K, Wulan Y C, Farida, Verbist B. 2002. Carbon stock
assessment for a forest-to-coffee conversion landscape in Sumber-Jaya (Lampung,
Indonesia): from allometric equations to land use change analysis. J. Sc. China (special
issue on Impacts of land use change on the terrestrial carbon cycle in the Asia Pacific
region). Vol 45 (C): 75-86.
Van Noordwijk M, Minang PA, Dewi S, Hall J, Rantala S. 2009. Reducing Emissions from All Land
Uses (REALU): The Case for a whole landscape approach. ASB PolicyBrief 13. ASB
Partnership for the Tropical Forest Margins, Nairobi, Kenya.
Vantomme P, Markkula A, Leslie RN. 2002. Non Wood Forest Products in 15 Countries of Tropical
Asia. FAO Regional Office for Asia and the Pacific. Thailand
91
Widayati A, Suyanto, van Noordwijk M (eds). 2011. Towards Reduced Emissions in a High-stake
District- REALU Project Design for Tanjung Jabung Barat (Tanjabar), Jambi, Indonesia,
REALU Report.
Widayati A, Johana F, Zulkarnain MT, Mulyoutami E. 2012. Perubahan Penggunaan Lahan, Faktor
Pemicu dan Pengaruhnya terhadap Emisi CO2 di Kabupaten Tanjung Jabung Barat
(Tanjabar), Provinsi Jambi. Brief No 21. Bogor, Indonesia. World Agroforestry Centre -
ICRAF, SEA Regional Office. 4
Williams L. 1963. Lactiferous Plant of Economic Importance IV Jelutong (Dyera sp). Economic
Botany, Volume 17, No. 2. New York Botanical Garden Press. United State.
World Bank Institute. 2011. Estimating the opportunity costs of REDD+: A training manual.
Washington DC, The World Bank.
Wösten JHM, Ismail AB, van Wijk ALM. 1997. Peat subsidence and its practical implications: a case
study in Malaysia. Geoderma 78(1–2): 25-36.
Yuniati D.2011. Estimasi Kelayakan Finansial Implementasi Pengurangan Emisi dari Degradasi dan
Deforestasi di Kalimantan.Jurnal Peneltitian Sosial dan Ekonomi Kehutanan, Vol. 8(3): 165-
175 [Online]. Available at: http://www.forda-mof.org/files/1.%20Estimasi%20(Dhany).pdf