employer costs for employee compensation - december 2002 · oasdi portion and a medicare portion....
TRANSCRIPT

N e w s U n ite d S ta tesD e p a rtm e n to f L a b o r
B u r e a u o f Labor S ta t i s t i cs W a s h i n g t o n , D . C . 2 0 2 1 2
Technical Contact: USDL: 03-130
(202) 691-6199 [email protected] Media Contact: FOR RELEASE: 10:00 A.M. (EST)
(202) 691-5902 TUESDAY, MARCH 18, 2003 Internet address:
http://www.bls.gov/ncs/ect/home.htm
EMPLOYER COSTS FOR EMPLOYEE COMPENSATION— DECEMBER 2002
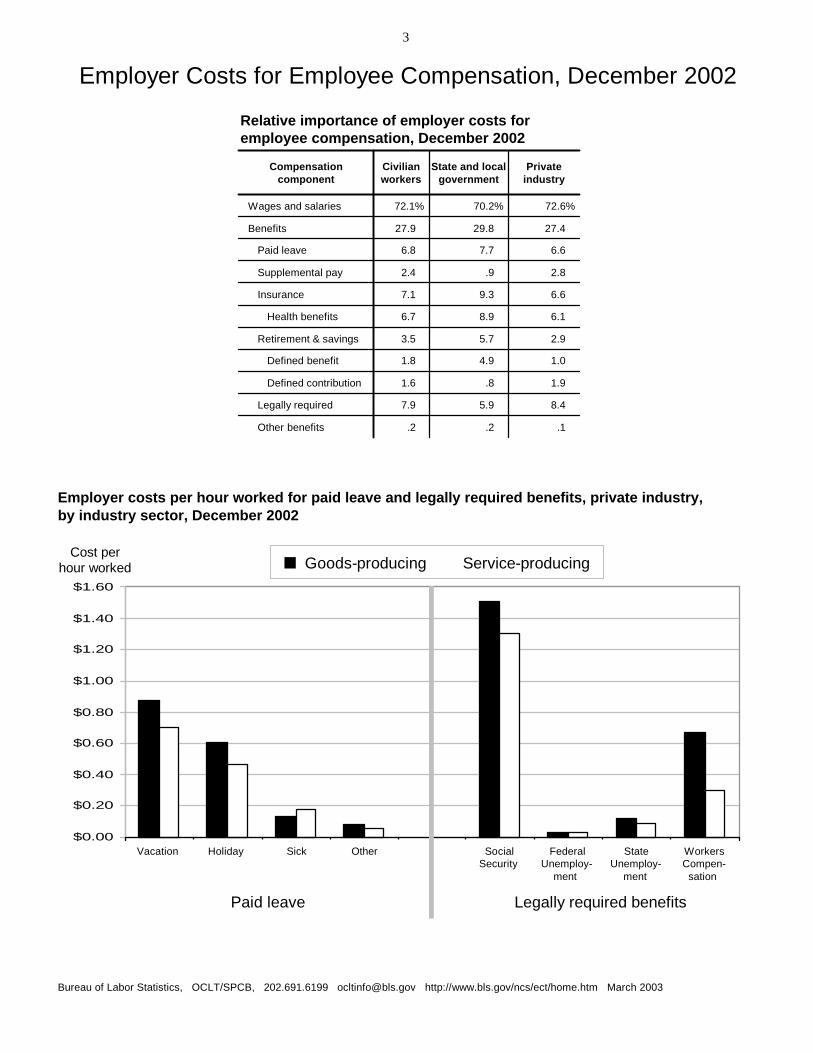
In December 2002, employer costs for employee compensation for civilian workers in private industry and State and local government in the United States averaged $23.66 per hour worked, the U.S. Department of Labor’s Bureau of Labor Statistics reported today. Wages and salaries, which averaged $17.06, accounted for 72.1 percent of these costs, while benefits, which averaged $6.60, accounted for the remaining 27.9 percent. (See table 1.) Legally required benefits averaged $1.86 per hour (7.9 percent of total compensation), representing the largest non-wage employer cost. Employer costs for insurance benefits averaged $1.69 (7.1 percent), paid leave benefits averaged $1.62 (6.8 percent), and retirement and savings benefits averaged 82 cents (3.5 percent) per hour worked. Private Industry In December 2002, private industry employer compensation costs averaged $22.14 per hour worked. Wages and salaries averaged $16.08 per hour (72.6 percent), while benefits averaged $6.07 (27.4 percent.) (See table 5.)
Employer costs for paid leave averaged $1.47 per hour worked (6.6 percent), supplemental pay averaged 61 cents (2.8 percent), insurance benefits averaged $1.46 (6.6 percent), retirement and savings averaged 64 cents (2.9 percent), and legally required benefits averaged $1.85 (8.4 percent) per hour worked.
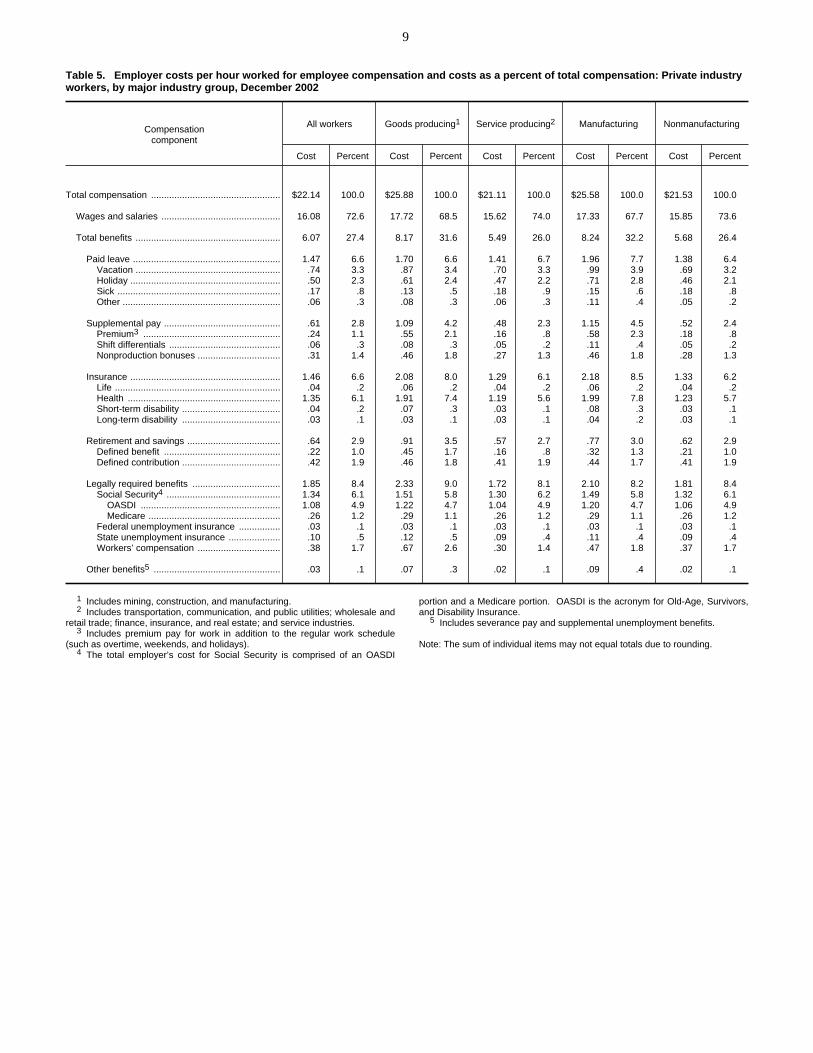
Legally required benefit costs in private industry The average cost for legally required benefits was $1.85 per hour worked in private industry (8.4 percent of total compensation) in December 2002. Included in this amount were employer costs for Social Security, Federal and State unemployment insurance, and workers’ compensation.
NOTE: The schedule for Employer Costs for Employee Compensation has changed from an annual March release to a quarterly. Releases will be issued for March, June, September, and December. See page 21 for details.

2
Employer costs for legally required benefits varied by industry, occupation, bargaining status, region, and establishment size. Costs for legally required benefits were higher in goods-producing industries ($2.33 per hour or 9.0 percent of total compensation) than in service-producing industries ($1.72 or 8.1 percent of total compensation). (See table 5.) The average cost per hour worked for legally required benefits was $1.17 for service occupations, $1.98 for white-collar occupations, and $2.05 for blue-collar occupations. Although the overall costs of legally required benefits for white-collar and blue-collar workers were comparable, the costs for components varied considerably. The cost of workers’ compensation was 68 cents for blue-collar workers, compared with 25 cents for white-collar workers. Conversely, Social Security costs were $1.61 per hour for white-collar workers, versus $1.22 for blue-collar workers. The proportion of total compensation represented by legally required benefits was the highest among service workers, 10.4 percent, compared with 7.4 percent for white-collar occupations and 9.9 percent for blue-collar occupations. (See table 6.) Legally required benefits were higher for union workers, $2.55 per hour, than for nonunion workers, $1.77. As a proportion of total compensation, legally required benefits accounted for 8.4 percent of total compensation for both union and nonunion workers. Costs ranged from $1.65 in the South to $2.05 in the West. The proportion of total compensation represented by legally required costs varied slightly among regions. (See table 7.) Legally required benefit costs increased in average dollar amount per hour with establishment size: $1.70 in establishments with fewer than 100 employees; $1.86 in establishments with 100-499 employees; and $2.25 in establishments with 500 or more employees. Conversely, legally required costs decreased as a proportion of total compensation with establishment size. Legally required costs in establishments with fewer than 100 employees averaged 9.0 percent; in establishments with 100-499 employees, 8.3 percent; and in establishments with 500 workers or more, 7.4 percent of total compensation. (See table 8.) Paid leave benefit costs in private industry Paid leave costs in goods-producing industries were $1.70 per hour (6.6 percent of total compensation), compared with $1.41 (6.7 percent of total compensation) for service-producing industries in December 2002. (See table 5.) Included in this amount were employer costs for vacations, holidays, sick leave, and other leave, such as personal leave, jury duty leave, military leave, and funeral leave. Among major occupational groups, employer costs for paid leave benefits were highest for white-collar occupations, $2.00 per hour or 7.5 percent of total compensation. Costs were lowest among service occupations, 47 cents or 4.2 percent of total compensation. In blue-collar occupations, employer costs for paid leave averaged $1.16 or 5.6 percent of compensation. (See table 6.) Employer costs for paid leave benefits were significantly higher for union workers, averaging $2.16 per hour (7.1 percent), than for nonunion workers, averaging $1.39 (6.6 percent). Among the four regions, costs for paid leave benefits ranged from $1.25 per hour in the South to $1.86 in the Northeast. (See table 7.)
Paid leave benefit costs increased, both in average dollar amount and as a proportion of total compensation, with establishment size. Establishments with fewer than 100 workers averaged $1.08 (5.7 percent); those with 100-499 employees averaged $1.50 (6.7 percent); and those with 500 or more employees averaged $2.45 (8.1 percent). (See table 8.)
3
Relative importance of employer costs for employee compensation, December 2002
.1.2.2Other benefits
8.45.97.9Legally required
1.9.81.6Defined contribution
1.04.91.8Defined benefit
2.95.73.5Retirement & savings
6.18.96.7Health benefits
6.69.37.1Insurance
2.8.92.4Supplemental pay
6.67.76.8Paid leave
27.429.827.9Benefits
72.6%70.2%72.1%Wages and salaries
Private industry
State and local government
Civilian workers
Compensationcomponent
Bureau of Labor Statistics, OCLT/SPCB, 202.691.6199 [email protected] http://www.bls.gov/ncs/ect/home.htm March 2003
Employer Costs for Employee Compensation, December 2002
Employer costs per hour worked for paid leave and legally required benefits, private industry,by industry sector, December 2002
$0.00
$0.20
$0.40
$0.60
$0.80
$1.00
$1.20
$1.40
$1.60
Vac Hol Sick oth . S S Fed UI St UI WCVacation Holiday Sick Other Social Federal State WorkersSecurity Unemploy- Unemploy- Compen-
ment ment sation
Paid leave Legally required benefits
n Goods-producing �� Service-producingCost per
hour worked

4
Table of Contents:
Table 1. Civilian workers, by major occupational group 5 Table 2. Civilian workers, by occupational and industry group 6 Table 3. State and local government, by selected characteristics 7 Table 4. State and local government, by occupational and industry group 8 Table 5. Private industry, by major industry group 9 Table 6. Private industry, by major occupational group 10 Table 7. Private industry, by region and bargaining status 11 Table 8. Private industry, by establishment employment size 12 Table 9. Private industry, by major occupational and industry group and full-time and part-time status 13 Table 10. Private industry, by occupational and industry group 14 Table 11. Private industry, workers in goods-producing and service-producing industries, by occupational group 15 Table 12. Private industry, workers in manufacturing and nonmanufacturing industries, by occupational group 16 Table 13. Private industry, by bargaining status and major industry and occupational group 17 Table 14. Private industry, by establishment employment size and major industry and occupational group 18 Table 15. Private industry, workers in health services, by industry and occupational group 19 Table 16. Private industry, workers in transportation equipment manufacturing and public utilities, by industry and occupational group 20 Explanatory notes 21 Appendix table. Employer costs per hour worked for components of compensation and relative standard errors, by major industry and occupational categories, December 2002 24

5
Table 1. Employer costs per hour worked for employee compensation and costs as a percent of total compensation:Civilian workers, by major occupational group, December 2002
Compensationcomponent
Civilian workers White collar Blue collar Service
Cost Percent Cost Percent Cost Percent Cost Percent
Total compensation .................................................. $23.66 100.0 $28.48 100.0 $20.97 100.0 $13.49 100.0
Wages and salaries .............................................. 17.06 72.1 20.86 73.2 14.44 68.9 9.82 72.8
Total benefits ........................................................ 6.60 27.9 7.62 26.8 6.53 31.1 3.67 27.2
Paid leave ......................................................... 1.62 6.8 2.11 7.4 1.23 5.9 .78 5.8Vacation ........................................................ .75 3.2 .96 3.4 .62 3.0 .35 2.6Holiday .......................................................... .55 2.3 .70 2.5 .44 2.1 .25 1.9Sick ............................................................... .24 1.0 .33 1.2 .13 .6 .13 1.0Other ............................................................. .08 .3 .11 .4 .05 .2 .04 .3
Supplemental pay ............................................. .56 2.4 .58 2.0 .74 3.5 .27 2.0Premium1 ..................................................... .23 1.0 .12 .4 .51 2.4 .13 1.0Shift differentials ........................................... .06 .3 .06 .2 .07 .3 .05 .4Nonproduction bonuses ................................ .28 1.2 .40 1.4 .16 .8 .08 .6
Insurance .......................................................... 1.69 7.1 1.91 6.7 1.75 8.3 .96 7.1Life ................................................................ .04 .2 .05 .2 .04 .2 .02 .1Health ........................................................... 1.58 6.7 1.77 6.2 1.65 7.9 .91 6.7Short-term disability ...................................... .04 .2 .04 .1 .05 .2 .02 .1Long-term disability ...................................... .03 .1 .05 .2 .02 .1 2( ) 3( )
Retirement and savings .................................... .82 3.5 1.00 3.5 .74 3.5 .42 3.1Defined benefit ............................................. .43 1.8 .46 1.6 .44 2.1 .32 2.4Defined contribution ...................................... .39 1.6 .54 1.9 .30 1.4 .10 .7
Legally required benefits .................................. 1.86 7.9 1.99 7.0 2.03 9.7 1.24 9.2Social Security4 ............................................ 1.37 5.8 1.63 5.7 1.22 5.8 .81 6.0
OASDI ...................................................... 1.09 4.6 1.29 4.5 .99 4.7 .65 4.8Medicare ................................................... .28 1.2 .34 1.2 .23 1.1 .16 1.2
Federal unemployment insurance ................ .03 .1 .03 .1 .03 .1 .03 .2State unemployment insurance .................... .09 .4 .08 .3 .11 .5 .08 .6Workers’ compensation ................................ .38 1.6 .25 .9 .67 3.2 .32 2.4
Other benefits5 ................................................. .04 .2 .04 .1 .03 .1 2( ) 3( )
1 Includes premium pay for work in addition to the regular workschedule (such as overtime, weekends, and holidays).
2 Cost per hour worked is $0.01 or less.3 Less than .05 percent.4 The total employer’s cost for Social Security is comprised of an
OASDI portion and a Medicare portion. OASDI is the acronym forOld-Age, Survivors, and Disability Insurance.
5 Includes severance pay and supplemental unemployment benefits.
Note: The sum of individual items may not equal totals due to rounding.

6
Table 2. Employer costs per hour worked for employee compensation and costs as a percent of total compensation: Civilianworkers, by occupational and industry group, December 2002
SeriesTotal
compen-sation
Wagesand
salaries
Benefit costs
Total Paidleave
Supple-mental
pay Insurance
Retirementand
savings
Legallyrequiredbenefits
Otherbenefits1
Cost per hour worked by year
Civilian workers ........................................................ $23.66 $17.06 $6.60 $1.62 $0.56 $1.69 $0.82 $1.86 $0.04
Occupational group
White-collar occupations ...................................... 28.48 20.86 7.62 2.11 .58 1.91 1.00 1.99 .04Professional specialty and technical ................. 38.51 28.38 10.12 2.87 .60 2.48 1.57 2.54 .06
Professional specialty ................................... 41.17 30.51 10.66 3.05 .57 2.60 1.73 2.64 .07Nurses ...................................................... 34.86 25.27 9.59 2.79 1.25 1.85 1.00 2.68 .02Teachers ................................................... 43.32 32.84 10.48 2.27 .11 3.12 2.41 2.48 .09
Technical ...................................................... 29.42 21.13 8.29 2.25 .68 2.09 1.04 2.21 .03Executive, administrative, and managerial ....... 42.56 30.59 11.97 3.71 1.36 2.46 1.57 2.79 .08Administrative support, including clerical .......... 18.74 13.36 5.37 1.35 .33 1.70 .57 1.39 .03
Blue-collar occupations ........................................ 20.97 14.44 6.53 1.23 .74 1.75 .74 2.03 .03
Service occupations ............................................. 13.49 9.82 3.67 .78 .27 .96 .42 1.24 2( )
Industry group
Services ................................................................ 25.46 18.88 6.58 1.80 .34 1.71 .88 1.84 .02Health services ................................................. 25.47 18.45 7.02 2.19 .52 1.65 .74 1.91 2( )
Hospitals ....................................................... 27.98 19.59 8.39 2.44 .79 2.18 .89 2.09 .02Educational services ......................................... 34.57 25.45 9.12 2.20 .13 2.87 1.84 2.02 .06
Elementary and secondary education .......... 33.83 25.04 8.79 1.92 .11 3.11 1.70 1.86 .09Higher education .......................................... 36.67 26.77 9.90 2.74 .15 2.60 2.15 2.26 2( )
Percent of total compensation
Civilian workers ........................................................ 100.0 72.1 27.9 6.8 2.4 7.1 3.5 7.9 0.2
Occupational group
White-collar occupations ...................................... 100.0 73.2 26.8 7.4 2.0 6.7 3.5 7.0 .1Professional specialty and technical ................. 100.0 73.7 26.3 7.5 1.6 6.4 4.1 6.6 .2
Professional specialty ................................... 100.0 74.1 25.9 7.4 1.4 6.3 4.2 6.4 .2Nurses ...................................................... 100.0 72.5 27.5 8.0 3.6 5.3 2.9 7.7 .1Teachers ................................................... 100.0 75.8 24.2 5.2 .3 7.2 5.6 5.7 .2
Technical ...................................................... 100.0 71.8 28.2 7.6 2.3 7.1 3.5 7.5 .1Executive, administrative, and managerial ....... 100.0 71.9 28.1 8.7 3.2 5.8 3.7 6.6 .2Administrative support, including clerical .......... 100.0 71.3 28.7 7.2 1.8 9.1 3.0 7.4 .2
Blue-collar occupations ........................................ 100.0 68.9 31.1 5.9 3.5 8.3 3.5 9.7 .1
Service occupations ............................................. 100.0 72.8 27.2 5.8 2.0 7.1 3.1 9.2 3( )
Industry group
Services ................................................................ 100.0 74.2 25.8 7.1 1.3 6.7 3.5 7.2 .1Health services ................................................. 100.0 72.4 27.6 8.6 2.0 6.5 2.9 7.5 3( )
Hospitals ....................................................... 100.0 70.0 30.0 8.7 2.8 7.8 3.2 7.5 .1Educational services ......................................... 100.0 73.6 26.4 6.4 .4 8.3 5.3 5.8 .2
Elementary and secondary education .......... 100.0 74.0 26.0 5.7 .3 9.2 5.0 5.5 .3Higher education .......................................... 100.0 73.0 27.0 7.5 .4 7.1 5.9 6.2 3( )
1 Includes severance pay and supplemental unemployment benefits.2 Cost per hour worked is $0.01 or less.3 Less than .05 percent.
Note: The sum of individual items may not equal totals due to rounding.

7
Table 3. Employer costs per hour worked for employee compensation and costs as a percent of total compensation: State and loc algovernment, by selected characteristics, 1 December 2002
Compensationcomponent
All workers White collar occupations Service occupations Service industries
Cost Percent Cost Percent Cost Percent Cost Percent
Total compensation .................................................. $32.32 100.0 $35.92 100.0 $24.34 100.0 $33.87 100.0
Wages and salaries .............................................. 22.68 70.2 25.88 72.0 15.65 64.3 24.54 72.5
Total benefits ........................................................ 9.63 29.8 10.04 28.0 8.69 35.7 9.33 27.5
Paid leave ......................................................... 2.49 7.7 2.59 7.2 2.26 9.3 2.28 6.7Vacation ........................................................ .86 2.7 .81 2.3 .97 4.0 .64 1.9Holiday .......................................................... .82 2.5 .86 2.4 .72 3.0 .77 2.3Sick ............................................................... .62 1.9 .71 2.0 .41 1.7 .67 2.0Other ............................................................. .20 .6 .22 .6 .15 .6 .20 .6
Supplemental pay ............................................. .29 .9 .18 .5 .60 2.5 .20 .6Premium2 ..................................................... .13 .4 .05 .1 .30 1.2 .06 .2Shift differentials ........................................... .06 .2 .04 .1 .13 .5 .05 .1Nonproduction bonuses ................................ .10 .3 .09 .3 .17 .7 .09 .3
Insurance .......................................................... 3.02 9.3 3.18 8.9 2.54 10.4 3.03 8.9Life ................................................................ .06 .2 .06 .2 .04 .2 .05 .1Health ........................................................... 2.89 8.9 3.05 8.5 2.39 9.8 2.92 8.6Short-term disability ...................................... .04 .1 .02 .1 .09 .4 .02 .1Long-term disability ...................................... .04 .1 .04 .1 .02 .1 .04 .1
Retirement and savings .................................... 1.84 5.7 1.99 5.5 1.65 6.8 1.82 5.4Defined benefit ............................................. 1.59 4.9 1.71 4.8 1.54 6.3 1.60 4.7Defined contribution ...................................... .25 .8 .28 .8 .11 .5 .23 .7
Legally required benefits .................................. 1.92 5.9 2.04 5.7 1.58 6.5 1.93 5.7Social Security3 ............................................ 1.50 4.6 1.71 4.8 .98 4.0 1.62 4.8
OASDI ...................................................... 1.16 3.6 1.32 3.7 .75 3.1 1.25 3.7Medicare ................................................... .34 1.1 .39 1.1 .23 .9 .36 1.1
Federal unemployment insurance ................ 4( ) 5( ) 4( ) 5( ) 4( ) 5( ) 4( ) 5( )State unemployment insurance .................... .04 .1 .04 .1 .05 .2 .04 .1Workers’ compensation ................................ .37 1.1 .29 .8 .55 2.3 .27 .8
Other benefits6 ................................................. .07 .2 .07 .2 .06 .2 .07 .2
1 This table presents data for the two major occupational groups in Stateand local governments: White-collar occupations, largely professionaloccupations, including teachers; and service occupations, including police andfirefighters; and one major industry group, services. The service industries,which include health and educational services, employ a large part of the Stateand local government workforce.
2 Includes premium pay for work in addition to the regular work schedule(such as overtime, weekends, and holidays).
3 The total employer’s cost for Social Security is comprised of an OASDIportion and a Medicare portion. OASDI is the acronym for Old-Age, Survivors,and Disability Insurance.
4 Cost per hour worked is $0.01 or less.5 Less than .05 percent.6 Includes severance pay and supplemental unemployment benefits.
Note: The sum of individual items may not equal totals due to rounding.

8
Table 4. Employer costs per hour worked for employee compensation and costs as a percent of total compensation: State andlocal government, by occupational and industry group, December 2002
SeriesTotal
compen-sation
Wagesand
salaries
Benefit costs
Total Paidleave
Supple-mental
pay Insurance
Retirementand
savings
Legallyrequiredbenefits
Otherbenefits1
Cost per hour worked by year
State and local government workers ........................ $32.32 $22.68 $9.63 $2.49 $0.29 $3.02 $1.84 $1.92 $0.07
Occupational group
White-collar occupations ...................................... 35.92 25.88 10.04 2.59 .18 3.18 1.99 2.04 .07Professional specialty and technical ................. 41.96 31.07 10.90 2.55 .19 3.35 2.39 2.32 .10
Professional specialty ................................... 43.32 32.21 11.11 2.56 .17 3.44 2.48 2.36 .10Teachers ................................................... 45.83 34.53 11.30 2.40 .10 3.55 2.72 2.42 .12
Technical ...................................................... 27.48 18.81 8.67 2.44 .48 2.44 1.40 1.86 .05Executive, administrative, and managerial ....... 40.55 28.22 12.33 4.09 .20 3.41 2.27 2.31 .04Administrative support, including clerical .......... 20.85 13.80 7.05 1.87 .13 2.70 1.00 1.31 .04
Blue-collar occupations ........................................ 25.50 16.57 8.93 2.36 .43 2.95 1.32 1.79 .08
Service occupations ............................................. 24.34 15.65 8.69 2.26 .60 2.54 1.65 1.58 .06
Industry group
Services ................................................................ 33.87 24.54 9.33 2.28 .20 3.03 1.82 1.93 .07Health services ................................................. 26.94 18.04 8.90 2.68 .73 2.44 1.13 1.88 .04
Hospitals ....................................................... 27.76 18.66 9.10 2.77 .70 2.45 1.18 1.94 .04Educational services ......................................... 35.31 25.91 9.40 2.21 .12 3.10 1.95 1.94 .07
Elementary and secondary education .......... 34.49 25.48 9.01 1.94 .10 3.24 1.78 1.84 .10Higher education .......................................... 37.77 27.48 10.30 2.84 .17 2.81 2.33 2.14 2( )
Public administration ............................................ 29.57 19.44 10.14 2.90 .45 2.95 1.92 1.84 .08
Percent of total compensation
State and local government workers ........................ 100.0 70.2 29.8 7.7 0.9 9.3 5.7 5.9 0.2
Occupational group
White-collar occupations ...................................... 100.0 72.0 28.0 7.2 .5 8.9 5.5 5.7 .2Professional specialty and technical ................. 100.0 74.0 26.0 6.1 .5 8.0 5.7 5.5 .2
Professional specialty ................................... 100.0 74.4 25.6 5.9 .4 7.9 5.7 5.4 .2Teachers ................................................... 100.0 75.3 24.7 5.2 .2 7.7 5.9 5.3 .3
Technical ...................................................... 100.0 68.4 31.6 8.9 1.7 8.9 5.1 6.8 .2Executive, administrative, and managerial ....... 100.0 69.6 30.4 10.1 .5 8.4 5.6 5.7 .1Administrative support, including clerical .......... 100.0 66.2 33.8 9.0 .6 12.9 4.8 6.3 .2
Blue-collar occupations ........................................ 100.0 65.0 35.0 9.3 1.7 11.6 5.2 7.0 .3
Service occupations ............................................. 100.0 64.3 35.7 9.3 2.5 10.4 6.8 6.5 .2
Industry group
Services ................................................................ 100.0 72.5 27.5 6.7 .6 8.9 5.4 5.7 .2Health services ................................................. 100.0 67.0 33.0 9.9 2.7 9.1 4.2 7.0 .1
Hospitals ....................................................... 100.0 67.2 32.8 10.0 2.5 8.8 4.3 7.0 .1Educational services ......................................... 100.0 73.4 26.6 6.3 .3 8.8 5.5 5.5 .2
Elementary and secondary education .......... 100.0 73.9 26.1 5.6 .3 9.4 5.2 5.3 .3Higher education .......................................... 100.0 72.8 27.3 7.5 .5 7.4 6.2 5.7 3( )
Public administration ............................................ 100.0 65.7 34.3 9.8 1.5 10.0 6.5 6.2 .3
1 Includes severance pay and supplemental unemployment benefits.2 Cost per hour worked is $0.01 or less.3 Less than .05 percent.
Note: The sum of individual items may not equal totals due to rounding.
9
Table 5. Employer costs per hour worked for employee compensation and costs as a percent of total compensation: Private indus tryworkers, by major industry group, December 2002
Compensationcomponent
All workers Goods producing1 Service producing2 Manufacturing Nonmanufacturing
Cost Percent Cost Percent Cost Percent Cost Percent Cost Percent
Total compensation .................................................. $22.14 100.0 $25.88 100.0 $21.11 100.0 $25.58 100.0 $21.53 100.0
Wages and salaries .............................................. 16.08 72.6 17.72 68.5 15.62 74.0 17.33 67.7 15.85 73.6
Total benefits ........................................................ 6.07 27.4 8.17 31.6 5.49 26.0 8.24 32.2 5.68 26.4
Paid leave ......................................................... 1.47 6.6 1.70 6.6 1.41 6.7 1.96 7.7 1.38 6.4Vacation ........................................................ .74 3.3 .87 3.4 .70 3.3 .99 3.9 .69 3.2Holiday .......................................................... .50 2.3 .61 2.4 .47 2.2 .71 2.8 .46 2.1Sick ............................................................... .17 .8 .13 .5 .18 .9 .15 .6 .18 .8Other ............................................................. .06 .3 .08 .3 .06 .3 .11 .4 .05 .2
Supplemental pay ............................................. .61 2.8 1.09 4.2 .48 2.3 1.15 4.5 .52 2.4Premium3 ..................................................... .24 1.1 .55 2.1 .16 .8 .58 2.3 .18 .8Shift differentials ........................................... .06 .3 .08 .3 .05 .2 .11 .4 .05 .2Nonproduction bonuses ................................ .31 1.4 .46 1.8 .27 1.3 .46 1.8 .28 1.3
Insurance .......................................................... 1.46 6.6 2.08 8.0 1.29 6.1 2.18 8.5 1.33 6.2Life ................................................................ .04 .2 .06 .2 .04 .2 .06 .2 .04 .2Health ........................................................... 1.35 6.1 1.91 7.4 1.19 5.6 1.99 7.8 1.23 5.7Short-term disability ...................................... .04 .2 .07 .3 .03 .1 .08 .3 .03 .1Long-term disability ...................................... .03 .1 .03 .1 .03 .1 .04 .2 .03 .1
Retirement and savings .................................... .64 2.9 .91 3.5 .57 2.7 .77 3.0 .62 2.9Defined benefit ............................................. .22 1.0 .45 1.7 .16 .8 .32 1.3 .21 1.0Defined contribution ...................................... .42 1.9 .46 1.8 .41 1.9 .44 1.7 .41 1.9
Legally required benefits .................................. 1.85 8.4 2.33 9.0 1.72 8.1 2.10 8.2 1.81 8.4Social Security4 ............................................ 1.34 6.1 1.51 5.8 1.30 6.2 1.49 5.8 1.32 6.1
OASDI ...................................................... 1.08 4.9 1.22 4.7 1.04 4.9 1.20 4.7 1.06 4.9Medicare ................................................... .26 1.2 .29 1.1 .26 1.2 .29 1.1 .26 1.2
Federal unemployment insurance ................ .03 .1 .03 .1 .03 .1 .03 .1 .03 .1State unemployment insurance .................... .10 .5 .12 .5 .09 .4 .11 .4 .09 .4Workers’ compensation ................................ .38 1.7 .67 2.6 .30 1.4 .47 1.8 .37 1.7
Other benefits5 ................................................. .03 .1 .07 .3 .02 .1 .09 .4 .02 .1
1 Includes mining, construction, and manufacturing.2 Includes transportation, communication, and public utilities; wholesale and
retail trade; finance, insurance, and real estate; and service industries.3 Includes premium pay for work in addition to the regular work schedule
(such as overtime, weekends, and holidays).4 The total employer’s cost for Social Security is comprised of an OASDI
portion and a Medicare portion. OASDI is the acronym for Old-Age, Survivors,and Disability Insurance.
5 Includes severance pay and supplemental unemployment benefits.
Note: The sum of individual items may not equal totals due to rounding.

10
Table 6. Employer costs per hour worked for employee compensation and costs as a percent of total compensation:Private industry workers, by major occupational group, December 2002
Compensationcomponent
All workers White collar Blue collar Service
Cost Percent Cost Percent Cost Percent Cost Percent
Total compensation .................................................. $22.14 100.0 $26.77 100.0 $20.68 100.0 $11.25 100.0
Wages and salaries .............................................. 16.08 72.6 19.70 73.6 14.30 69.1 8.62 76.6
Total benefits ........................................................ 6.07 27.4 7.07 26.4 6.38 30.9 2.64 23.5
Paid leave ......................................................... 1.47 6.6 2.00 7.5 1.16 5.6 .47 4.2Vacation ........................................................ .74 3.3 1.00 3.7 .59 2.9 .22 2.0Holiday .......................................................... .50 2.3 .67 2.5 .42 2.0 .15 1.3Sick ............................................................... .17 .8 .25 .9 .10 .5 .07 .6Other ............................................................. .06 .3 .08 .3 .05 .2 .02 .2
Supplemental pay ............................................. .61 2.8 .67 2.5 .76 3.7 .20 1.8Premium1 ..................................................... .24 1.1 .13 .5 .52 2.5 .10 .9Shift differentials ........................................... .06 .3 .06 .2 .07 .3 .04 .4Nonproduction bonuses ................................ .31 1.4 .48 1.8 .17 .8 .06 .5
Insurance .......................................................... 1.46 6.6 1.62 6.1 1.68 8.1 .63 5.6Life ................................................................ .04 .2 .05 .2 .04 .2 2( ) 3( )Health ........................................................... 1.35 6.1 1.47 5.5 1.57 7.6 .60 5.3Short-term disability ...................................... .04 .2 .05 .2 .05 .2 2( ) 3( )Long-term disability ...................................... .03 .1 .05 .2 .02 .1 2( ) 3( )
Retirement and savings .................................... .64 2.9 .77 2.9 .71 3.4 .17 1.5Defined benefit ............................................. .22 1.0 .17 .6 .40 1.9 .07 .6Defined contribution ...................................... .42 1.9 .59 2.2 .30 1.5 .10 .9
Legally required benefits .................................. 1.85 8.4 1.98 7.4 2.05 9.9 1.17 10.4Social Security4 ............................................ 1.34 6.1 1.61 6.0 1.22 5.9 .78 6.9
OASDI ...................................................... 1.08 4.9 1.28 4.8 .99 4.8 .63 5.6Medicare ................................................... .26 1.2 .32 1.2 .23 1.1 .15 1.3
Federal unemployment insurance ................ .03 .1 .03 .1 .03 .1 .04 .4State unemployment insurance .................... .10 .5 .09 .3 .11 .5 .08 .7Workers’ compensation ................................ .38 1.7 .25 .9 .68 3.3 .27 2.4
Other benefits5 ................................................. .03 .1 .04 .1 .03 .1 2( ) 3( )
1 Includes premium pay for work in addition to the regular workschedule (such as overtime, weekends, and holidays).
2 Cost per hour worked is $0.01 or less.3 Less than .05 percent.4 The total employer’s cost for Social Security is comprised of an
OASDI portion and a Medicare portion. OASDI is the acronym forOld-Age, Survivors, and Disability Insurance.
5 Includes severance pay and supplemental unemployment benefits.
Note: The sum of individual items may not equal totals due to rounding.

11
Table 7. Employer costs per hour worked for employee compensation and costs as a percent of total compensation: Private indus try workers, byregion and bargaining status, December 2002
Compensationcomponent
Region1 Bargaining status
Northeast South Midwest West Union Nonunion
Cost Percent Cost Percent Cost Percent Cost Percent Cost Percent Cost Percent
Total compensation ...................................... $25.36 100.0 $19.77 100.0 $21.83 100.0 $23.20 100.0 $30.29 100.0 $21.16 100.0
Wages and salaries .................................. 18.15 71.6 14.54 73.5 15.68 71.8 16.99 73.2 19.86 65.6 15.62 73.8
Total benefits ............................................ 7.22 28.5 5.24 26.5 6.15 28.2 6.21 26.8 10.43 34.4 5.54 26.2
Paid leave ............................................. 1.86 7.3 1.25 6.3 1.40 6.4 1.52 6.6 2.16 7.1 1.39 6.6Vacation ............................................ .93 3.7 .63 3.2 .70 3.2 .76 3.3 1.11 3.7 .69 3.3Holiday .............................................. .62 2.4 .42 2.1 .49 2.2 .52 2.2 .70 2.3 .48 2.3Sick ................................................... .22 .9 .15 .8 .14 .6 .19 .8 .25 .8 .16 .8Other ................................................. .08 .3 .05 .3 .07 .3 .05 .2 .10 .3 .06 .3
Supplemental pay ................................. .75 3.0 .50 2.5 .72 3.3 .54 2.3 1.06 3.5 .56 2.6Premium2 ......................................... .22 .9 .22 1.1 .31 1.4 .24 1.0 .68 2.2 .19 .9Shift differentials ............................... .06 .2 .04 .2 .09 .4 .05 .2 .17 .6 .05 .2Nonproduction bonuses .................... .47 1.9 .24 1.2 .33 1.5 .25 1.1 .22 .7 .32 1.5
Insurance .............................................. 1.70 6.7 1.29 6.5 1.54 7.1 1.41 6.1 2.91 9.6 1.28 6.0Life .................................................... .05 .2 .04 .2 .04 .2 .04 .2 .07 .2 .04 .2Health ............................................... 1.57 6.2 1.18 6.0 1.42 6.5 1.32 5.7 2.71 8.9 1.18 5.6Short-term disability .......................... .05 .2 .04 .2 .05 .2 .03 .1 .08 .3 .03 .1Long-term disability .......................... .03 .1 .03 .2 .04 .2 .03 .1 .05 .2 .03 .1
Retirement and savings ........................ .83 3.3 .51 2.6 .64 2.9 .67 2.9 1.67 5.5 .52 2.5Defined benefit ................................. .28 1.1 .16 .8 .28 1.3 .22 .9 1.18 3.9 .11 .5Defined contribution .......................... .55 2.2 .35 1.8 .37 1.7 .45 1.9 .49 1.6 .41 1.9
Legally required benefits ...................... 2.04 8.0 1.65 8.3 1.80 8.2 2.05 8.8 2.55 8.4 1.77 8.4Social Security3 ................................ 1.50 5.9 1.22 6.2 1.32 6.0 1.42 6.1 1.68 5.5 1.30 6.1
OASDI .......................................... 1.19 4.7 .98 5.0 1.06 4.9 1.14 4.9 1.36 4.5 1.04 4.9Medicare ....................................... .30 1.2 .24 1.2 .26 1.2 .28 1.2 .32 1.1 .26 1.2
Federal unemployment insurance .... .03 .1 .03 .2 .03 .1 .03 .1 .03 .1 .03 .1State unemployment insurance ........ .14 .6 .07 .4 .09 .4 .11 .5 .13 .4 .09 .4Workers’ compensation .................... .37 1.5 .33 1.7 .36 1.6 .49 2.1 .71 2.3 .34 1.6
Other benefits4 ..................................... .04 .2 .03 .2 .04 .2 .02 .1 .08 .3 .02 .1
1 The regional coverage is as follows: Northeast: Connecticut, Maine,Massachusetts, New Hampshire, New Jersey, New York, Pennsylvania, Rhode Island,and Vermont; South: Alabama, Arkansas, Delaware, District of Columbia, Florida,Georgia, Kentucky, Louisiana, Maryland, Mississippi, North Carolina, Oklahoma, SouthCarolina, Tennessee, Texas, Virginia, and West Virginia; Midwest: Illinois, Indiana,Iowa, Kansas, Michigan, Minnesota, Missouri, Nebraska, North Dakota, Ohio, SouthDakota, and Wisconsin; and West: Alaska, Arizona, California, Colorado, Hawaii,Idaho, Montana, Nevada, New Mexico, Oregon, Utah, Washington, and Wyoming.
2 Includes premium pay for work in addition to the regular work schedule (such asovertime, weekends, and holidays).
3 The total employer’s cost for Social Security is comprised of an OASDI portionand a Medicare portion. OASDI is the acronym for Old-Age, Survivors, and DisabilityInsurance.
4 Includes severance pay and supplemental unemployment benefits.
Note: The sum of individual items may not equal totals due to rounding.

12
Table 8. Employer costs per hour worked for employee compensation and costs as a percent of total compensation: Private indus tryworkers, by establishment employment size, December 2002
Compensationcomponent
All workers 1-99 workers 100 workers or more 100-499 workers 500 workers or more
Cost Percent Cost Percent Cost Percent Cost Percent Cost Percent
Total compensation .................................................. $22.14 100.0 $18.87 100.0 $26.00 100.0 $22.40 100.0 $30.29 100.0
Wages and salaries .............................................. 16.08 72.6 14.12 74.8 18.38 70.7 16.07 71.7 21.14 69.8
Total benefits ........................................................ 6.07 27.4 4.75 25.2 7.62 29.3 6.34 28.3 9.15 30.2
Paid leave ......................................................... 1.47 6.6 1.08 5.7 1.93 7.4 1.50 6.7 2.45 8.1Vacation ........................................................ .74 3.3 .54 2.9 .97 3.7 .75 3.3 1.23 4.1Holiday .......................................................... .50 2.3 .37 2.0 .65 2.5 .52 2.3 .81 2.7Sick ............................................................... .17 .8 .13 .7 .22 .8 .17 .8 .29 1.0Other ............................................................. .06 .3 .04 .2 .09 .3 .07 .3 .12 .4
Supplemental pay ............................................. .61 2.8 .46 2.4 .79 3.0 .67 3.0 .93 3.1Premium1 ..................................................... .24 1.1 .19 1.0 .31 1.2 .27 1.2 .35 1.2Shift differentials ........................................... .06 .3 2( ) 3( ) .11 .4 .07 .3 .17 .6Nonproduction bonuses ................................ .31 1.4 .26 1.4 .37 1.4 .33 1.5 .41 1.4
Insurance .......................................................... 1.46 6.6 1.08 5.7 1.91 7.3 1.62 7.2 2.25 7.4Life ................................................................ .04 .2 .03 .2 .06 .2 .04 .2 .07 .2Health ........................................................... 1.35 6.1 1.01 5.4 1.74 6.7 1.49 6.7 2.04 6.7Short-term disability ...................................... .04 .2 .02 .1 .06 .2 .05 .2 .07 .2Long-term disability ...................................... .03 .1 .02 .1 .05 .2 .04 .2 .06 .2
Retirement and savings .................................... .64 2.9 .43 2.3 .90 3.5 .65 2.9 1.19 3.9Defined benefit ............................................. .22 1.0 .12 .6 .35 1.3 .24 1.1 .47 1.6Defined contribution ...................................... .42 1.9 .31 1.6 .55 2.1 .41 1.8 .72 2.4
Legally required benefits .................................. 1.85 8.4 1.70 9.0 2.04 7.8 1.86 8.3 2.25 7.4Social Security4 ............................................ 1.34 6.1 1.17 6.2 1.55 6.0 1.35 6.0 1.78 5.9
OASDI ...................................................... 1.08 4.9 .94 5.0 1.24 4.8 1.09 4.9 1.43 4.7Medicare ................................................... .26 1.2 .23 1.2 .30 1.2 .27 1.2 .35 1.2
Federal unemployment insurance ................ .03 .1 .03 .2 .03 .1 .03 .1 .03 .1State unemployment insurance .................... .10 .5 .09 .5 .10 .4 .11 .5 .09 .3Workers’ compensation ................................ .38 1.7 .40 2.1 .36 1.4 .37 1.7 .35 1.2
Other benefits5 ................................................. .03 .1 2( ) 3( ) .05 .2 .03 .1 .08 .3
1 Includes premium pay for work in addition to the regular work schedule(such as overtime, weekends, and holidays).
2 Cost per hour worked is $0.01 or less.3 Less than .05 percent.4 The total employer’s cost for Social Security is comprised of an OASDI
portion and a Medicare portion. OASDI is the acronym for Old-Age, Survivors,and Disability Insurance.
5 Includes severance pay and supplemental unemployment benefits.
Note: The sum of individual items may not equal totals due to rounding.
13
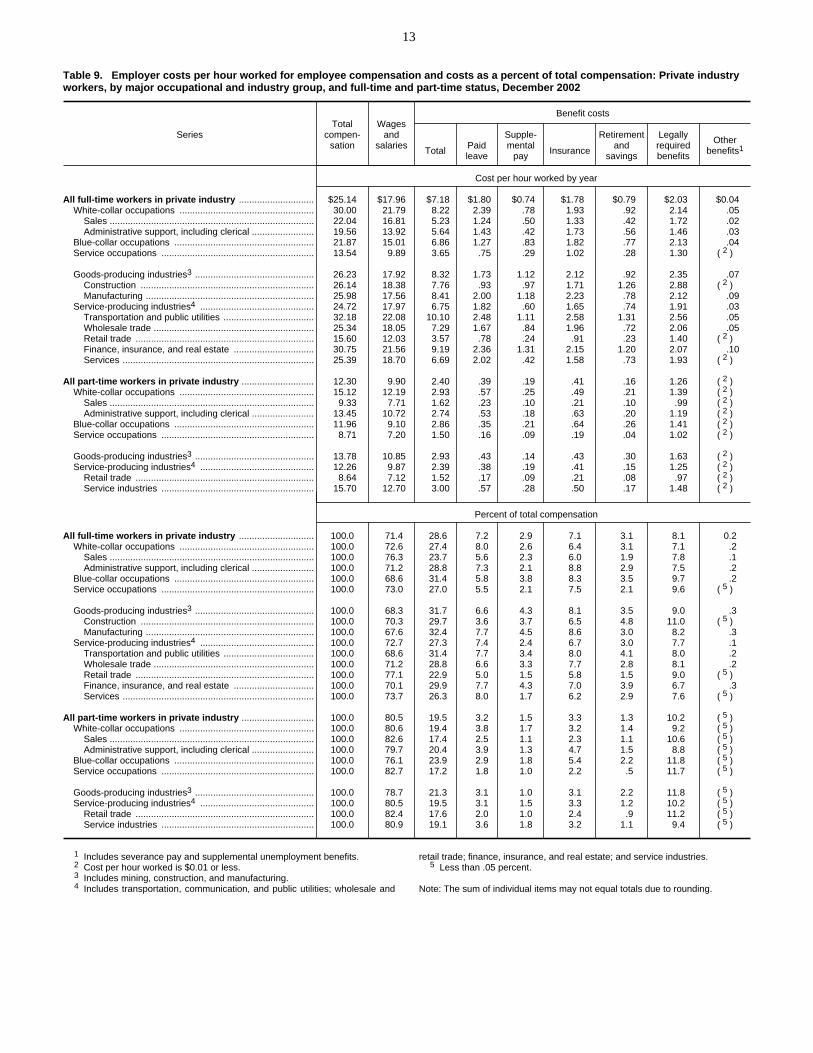
Table 9. Employer costs per hour worked for employee compensation and costs as a percent of total compensation: Private indus tryworkers, by major occupational and industry group, and full-time and part-time status, December 2002
SeriesTotal
compen-sation
Wagesand
salaries
Benefit costs
Total Paidleave
Supple-mental
pay Insurance
Retirementand
savings
Legallyrequiredbenefits
Otherbenefits1
Cost per hour worked by year
All full-time workers in private industry ............................. $25.14 $17.96 $7.18 $1.80 $0.74 $1.78 $0.79 $2.03 $0.04White-collar occupations .................................................... 30.00 21.79 8.22 2.39 .78 1.93 .92 2.14 .05
Sales ............................................................................... 22.04 16.81 5.23 1.24 .50 1.33 .42 1.72 .02Administrative support, including clerical ........................ 19.56 13.92 5.64 1.43 .42 1.73 .56 1.46 .03
Blue-collar occupations ...................................................... 21.87 15.01 6.86 1.27 .83 1.82 .77 2.13 .04Service occupations ........................................................... 13.54 9.89 3.65 .75 .29 1.02 .28 1.30 2( )
Goods-producing industries3 .............................................. 26.23 17.92 8.32 1.73 1.12 2.12 .92 2.35 .07Construction ................................................................... 26.14 18.38 7.76 .93 .97 1.71 1.26 2.88 2( )Manufacturing ................................................................. 25.98 17.56 8.41 2.00 1.18 2.23 .78 2.12 .09
Service-producing industries4 ............................................ 24.72 17.97 6.75 1.82 .60 1.65 .74 1.91 .03Transportation and public utilities ................................... 32.18 22.08 10.10 2.48 1.11 2.58 1.31 2.56 .05Wholesale trade .............................................................. 25.34 18.05 7.29 1.67 .84 1.96 .72 2.06 .05Retail trade ..................................................................... 15.60 12.03 3.57 .78 .24 .91 .23 1.40 2( )Finance, insurance, and real estate ............................... 30.75 21.56 9.19 2.36 1.31 2.15 1.20 2.07 .10Services .......................................................................... 25.39 18.70 6.69 2.02 .42 1.58 .73 1.93 2( )
All part-time workers in private industry ............................ 12.30 9.90 2.40 .39 .19 .41 .16 1.26 2( )White-collar occupations .................................................... 15.12 12.19 2.93 .57 .25 .49 .21 1.39 2( )
Sales ............................................................................... 9.33 7.71 1.62 .23 .10 .21 .10 .99 2( )Administrative support, including clerical ........................ 13.45 10.72 2.74 .53 .18 .63 .20 1.19 2( )
Blue-collar occupations ...................................................... 11.96 9.10 2.86 .35 .21 .64 .26 1.41 2( )Service occupations ........................................................... 8.71 7.20 1.50 .16 .09 .19 .04 1.02 2( )
Goods-producing industries3 .............................................. 13.78 10.85 2.93 .43 .14 .43 .30 1.63 2( )Service-producing industries4 ............................................ 12.26 9.87 2.39 .38 .19 .41 .15 1.25 2( )
Retail trade ..................................................................... 8.64 7.12 1.52 .17 .09 .21 .08 .97 2( )Service industries ........................................................... 15.70 12.70 3.00 .57 .28 .50 .17 1.48 2( )
Percent of total compensation
All full-time workers in private industry ............................. 100.0 71.4 28.6 7.2 2.9 7.1 3.1 8.1 0.2White-collar occupations .................................................... 100.0 72.6 27.4 8.0 2.6 6.4 3.1 7.1 .2
Sales ............................................................................... 100.0 76.3 23.7 5.6 2.3 6.0 1.9 7.8 .1Administrative support, including clerical ........................ 100.0 71.2 28.8 7.3 2.1 8.8 2.9 7.5 .2
Blue-collar occupations ...................................................... 100.0 68.6 31.4 5.8 3.8 8.3 3.5 9.7 .2Service occupations ........................................................... 100.0 73.0 27.0 5.5 2.1 7.5 2.1 9.6 5( )
Goods-producing industries3 .............................................. 100.0 68.3 31.7 6.6 4.3 8.1 3.5 9.0 .3Construction ................................................................... 100.0 70.3 29.7 3.6 3.7 6.5 4.8 11.0 5( )Manufacturing ................................................................. 100.0 67.6 32.4 7.7 4.5 8.6 3.0 8.2 .3
Service-producing industries4 ............................................ 100.0 72.7 27.3 7.4 2.4 6.7 3.0 7.7 .1Transportation and public utilities ................................... 100.0 68.6 31.4 7.7 3.4 8.0 4.1 8.0 .2Wholesale trade .............................................................. 100.0 71.2 28.8 6.6 3.3 7.7 2.8 8.1 .2Retail trade ..................................................................... 100.0 77.1 22.9 5.0 1.5 5.8 1.5 9.0 5( )Finance, insurance, and real estate ............................... 100.0 70.1 29.9 7.7 4.3 7.0 3.9 6.7 .3Services .......................................................................... 100.0 73.7 26.3 8.0 1.7 6.2 2.9 7.6 5( )
All part-time workers in private industry ............................ 100.0 80.5 19.5 3.2 1.5 3.3 1.3 10.2 5( )White-collar occupations .................................................... 100.0 80.6 19.4 3.8 1.7 3.2 1.4 9.2 5( )
Sales ............................................................................... 100.0 82.6 17.4 2.5 1.1 2.3 1.1 10.6 5( )Administrative support, including clerical ........................ 100.0 79.7 20.4 3.9 1.3 4.7 1.5 8.8 5( )
Blue-collar occupations ...................................................... 100.0 76.1 23.9 2.9 1.8 5.4 2.2 11.8 5( )Service occupations ........................................................... 100.0 82.7 17.2 1.8 1.0 2.2 .5 11.7 5( )
Goods-producing industries3 .............................................. 100.0 78.7 21.3 3.1 1.0 3.1 2.2 11.8 5( )Service-producing industries4 ............................................ 100.0 80.5 19.5 3.1 1.5 3.3 1.2 10.2 5( )
Retail trade ..................................................................... 100.0 82.4 17.6 2.0 1.0 2.4 .9 11.2 5( )Service industries ........................................................... 100.0 80.9 19.1 3.6 1.8 3.2 1.1 9.4 5( )
1 Includes severance pay and supplemental unemployment benefits.2 Cost per hour worked is $0.01 or less.3 Includes mining, construction, and manufacturing.4 Includes transportation, communication, and public utilities; wholesale and
retail trade; finance, insurance, and real estate; and service industries.5 Less than .05 percent.
Note: The sum of individual items may not equal totals due to rounding.

14
Table 10. Employer costs per hour worked for employee compensation and costs as a percent of total compensation: Private indu stryworkers, by occupational and industry group, December 2002
SeriesTotal
compen-sation
Wagesand
salaries
Benefit costs
Total Paidleave
Supple-mental
pay Insurance
Retirementand
savings
Legallyrequiredbenefits
Otherbenefits1
Cost per hour worked by year
All workers in private industry ................................................. $22.14 $16.08 $6.07 $1.47 $0.61 $1.46 $0.64 $1.85 $0.03
Occupational group
White-collar occupations .................................................... 26.77 19.70 7.07 2.00 .67 1.62 .77 1.98 .04Professional specialty and technical ............................... 36.80 27.06 9.74 3.03 .79 2.05 1.17 2.65 .05
Professional specialty ................................................. 39.79 29.42 10.38 3.37 .83 2.06 1.24 2.82 .06Technical .................................................................... 29.70 21.46 8.24 2.22 .71 2.04 .98 2.25 .02
Executive, administrative, and managerial ..................... 42.99 31.10 11.89 3.63 1.61 2.25 1.42 2.90 .08Sales ............................................................................... 16.66 12.96 3.70 .81 .33 .86 .29 1.41 2( )Administrative support, including clerical ........................ 18.35 13.28 5.06 1.25 .37 1.51 .49 1.41 .02
Blue-collar occupations ...................................................... 20.68 14.30 6.38 1.16 .76 1.68 .71 2.05 .03Precision production, craft, and repair ............................ 26.65 18.49 8.15 1.58 .90 1.99 1.06 2.58 .04Machine operators, assemblers, and inspectors ............ 18.86 12.62 6.24 1.23 .97 1.77 .51 1.72 .05Transportation and material moving ............................... 20.28 14.01 6.27 1.02 .66 1.67 .74 2.15 .03Handlers, equipment cleaners, helpers, and laborers .... 14.86 10.58 4.29 .66 .44 1.20 .40 1.58 2( )
Service occupations ........................................................... 11.25 8.62 2.64 .47 .20 .63 .17 1.17 2( )
Industry group
Goods-producing industries3 .............................................. 25.88 17.72 8.17 1.70 1.09 2.08 .91 2.33 .07Construction ................................................................... 25.94 18.28 7.66 .91 .95 1.68 1.24 2.86 2( )Manufacturing ................................................................. 25.58 17.33 8.24 1.96 1.15 2.18 .77 2.10 .09
Durables ..................................................................... 26.84 18.10 8.74 2.09 1.24 2.31 .77 2.21 .12Nondurables ............................................................... 23.75 16.23 7.52 1.76 1.03 1.98 .76 1.95 .04
Service-producing industries4 ............................................ 21.11 15.62 5.49 1.41 .48 1.29 .57 1.72 .02Transportation and public utilities ................................... 30.26 20.78 9.48 2.26 1.00 2.45 1.23 2.49 .04Wholesale trade .............................................................. 24.40 17.43 6.97 1.57 .81 1.85 .69 2.02 .04Retail trade ..................................................................... 12.11 9.57 2.54 .47 .17 .56 .15 1.19 2( )Finance, insurance, and real estate ............................... 28.82 20.33 8.49 2.16 1.19 1.98 1.10 1.98 .09Services .......................................................................... 22.86 17.13 5.73 1.65 .39 1.30 .58 1.81 2( )
Percent of total compensation
All workers in private industry ................................................. 100.0 72.6 27.4 6.6 2.8 6.6 2.9 8.4 0.1
Occupational group
White-collar occupations .................................................... 100.0 73.6 26.4 7.5 2.5 6.1 2.9 7.4 .1Professional specialty and technical ............................... 100.0 73.5 26.5 8.2 2.1 5.6 3.2 7.2 .1
Professional specialty ................................................. 100.0 73.9 26.1 8.5 2.1 5.2 3.1 7.1 .2Technical .................................................................... 100.0 72.3 27.7 7.5 2.4 6.9 3.3 7.6 .1
Executive, administrative, and managerial ..................... 100.0 72.3 27.7 8.4 3.7 5.2 3.3 6.7 .2Sales ............................................................................... 100.0 77.8 22.2 4.9 2.0 5.2 1.7 8.5 5( )Administrative support, including clerical ........................ 100.0 72.4 27.6 6.8 2.0 8.2 2.7 7.7 .1
Blue-collar occupations ...................................................... 100.0 69.1 30.9 5.6 3.7 8.1 3.4 9.9 .1Precision production, craft, and repair ............................ 100.0 69.4 30.6 5.9 3.4 7.5 4.0 9.7 .2Machine operators, assemblers, and inspectors ............ 100.0 66.9 33.1 6.5 5.1 9.4 2.7 9.1 .3Transportation and material moving ............................... 100.0 69.1 30.9 5.0 3.3 8.2 3.6 10.6 .1Handlers, equipment cleaners, helpers, and laborers .... 100.0 71.2 28.9 4.4 3.0 8.1 2.7 10.6 5( )
Service occupations ........................................................... 100.0 76.6 23.5 4.2 1.8 5.6 1.5 10.4 5( )
Industry group
Goods-producing industries3 .............................................. 100.0 68.5 31.6 6.6 4.2 8.0 3.5 9.0 .3Construction ................................................................... 100.0 70.5 29.5 3.5 3.7 6.5 4.8 11.0 5( )Manufacturing ................................................................. 100.0 67.7 32.2 7.7 4.5 8.5 3.0 8.2 .4
Durables ..................................................................... 100.0 67.4 32.6 7.8 4.6 8.6 2.9 8.2 .4Nondurables ............................................................... 100.0 68.3 31.7 7.4 4.3 8.3 3.2 8.2 .2
Service-producing industries4 ............................................ 100.0 74.0 26.0 6.7 2.3 6.1 2.7 8.1 .1Transportation and public utilities ................................... 100.0 68.7 31.3 7.5 3.3 8.1 4.1 8.2 .1Wholesale trade .............................................................. 100.0 71.4 28.6 6.4 3.3 7.6 2.8 8.3 .2Retail trade ..................................................................... 100.0 79.0 21.0 3.9 1.4 4.6 1.2 9.8 5( )Finance, insurance, and real estate ............................... 100.0 70.5 29.5 7.5 4.1 6.9 3.8 6.9 .3Services .......................................................................... 100.0 74.9 25.1 7.2 1.7 5.7 2.5 7.9 5( )
1 Includes severance pay and supplemental unemployment benefits.2 Cost per hour worked is $0.01 or less.3 Includes mining, construction, and manufacturing.4 Includes transportation, communication, and public utilities; wholesale and
retail trade; finance, insurance, and real estate; and service industries.5 Less than .05 percent.
Note: The sum of individual items may not equal totals due to rounding.

15
Table 11. Employer costs per hour worked for employee compensation and costs as a percent of total compensation: Private indu strygoods-producing and service-producing workers, by occupational group, December 2002
SeriesTotal
compen-sation
Wagesand
salaries
Benefit costs
Total Paidleave
Supple-mental
pay Insurance
Retirementand
savings
Legallyrequiredbenefits
Otherbenefits1
Cost per hour worked by year
All workers, goods-producing industries 2 ......................... $25.88 $17.72 $8.17 $1.70 $1.09 $2.08 $0.91 $2.33 $0.07White-collar occupations .................................................... 34.75 24.35 10.40 2.87 1.37 2.46 1.07 2.51 .12
Professional specialty and technical ............................... 38.75 27.00 11.75 3.58 1.03 2.89 1.29 2.77 .20Professional specialty ................................................. 44.19 31.03 13.17 4.24 .96 2.99 1.59 3.11 .29Technical .................................................................... 30.12 20.60 9.52 2.52 1.15 2.73 .83 2.23 .06
Executive, administrative, and managerial ..................... 47.66 33.09 14.57 3.94 2.99 2.69 1.45 3.39 .10Administrative support, including clerical ........................ 21.42 14.89 6.54 1.58 .71 2.01 .58 1.63 .03
Blue-collar occupations ...................................................... 22.76 15.39 7.37 1.28 .98 1.94 .86 2.28 .04Precision production, craft, and repair ............................ 27.50 18.83 8.67 1.45 .98 2.14 1.22 2.82 .05Machine operators, assemblers, and inspectors ............ 20.47 13.42 7.05 1.40 1.14 2.02 .59 1.84 .06Transportation and material moving ............................... 24.58 16.23 8.35 1.27 1.14 2.23 1.03 2.62 .05Handlers, equipment cleaners, helpers, and laborers .... 16.44 11.55 4.89 .68 .59 1.28 .51 1.82 3( )
Service occupations ........................................................... 19.88 12.75 7.14 1.18 2.16 1.71 .43 1.61 .06
All workers, service-producing industries 4 ....................... 21.11 15.62 5.49 1.41 .48 1.29 .57 1.72 .02White-collar occupations .................................................... 25.78 19.13 6.65 1.89 .58 1.51 .73 1.91 .03
Professional specialty and technical ............................... 36.49 27.07 9.41 2.94 .76 1.92 1.14 2.63 .02Professional specialty ................................................. 39.18 29.20 9.99 3.25 .81 1.93 1.19 2.78 .03Technical .................................................................... 29.60 21.65 7.95 2.16 .61 1.88 1.02 2.26 3( )
Executive, administrative, and managerial ..................... 41.99 30.67 11.32 3.56 1.31 2.16 1.41 2.79 .08Sales ............................................................................... 16.13 12.54 3.59 .78 .33 .83 .26 1.38 3( )Administrative support, including clerical ........................ 17.95 13.08 4.87 1.21 .33 1.45 .48 1.38 .02
Blue-collar occupations ...................................................... 18.48 13.15 5.33 1.03 .52 1.39 .55 1.81 .02Precision production, craft, and repair ............................ 25.38 18.00 7.38 1.76 .78 1.76 .83 2.23 .02Transportation and material moving ............................... 19.13 13.41 5.72 .95 .53 1.52 .66 2.02 .03Handlers, equipment cleaners, helpers, and laborers .... 13.95 10.01 3.94 .64 .35 1.16 .34 1.44 3( )
Service occupations ........................................................... 11.13 8.56 2.57 .46 .17 .61 .16 1.16 3( )
Percent of total compensation
All workers, goods-producing industries 2 ......................... 100.0 68.5 31.6 6.6 4.2 8.0 3.5 9.0 0.3White-collar occupations .................................................... 100.0 70.1 29.9 8.3 3.9 7.1 3.1 7.2 .3
Professional specialty and technical ............................... 100.0 69.7 30.3 9.2 2.7 7.5 3.3 7.1 .5Professional specialty ................................................. 100.0 70.2 29.8 9.6 2.2 6.8 3.6 7.0 .7Technical .................................................................... 100.0 68.4 31.6 8.4 3.8 9.1 2.8 7.4 .2
Executive, administrative, and managerial ..................... 100.0 69.4 30.6 8.3 6.3 5.6 3.0 7.1 .2Administrative support, including clerical ........................ 100.0 69.5 30.5 7.4 3.3 9.4 2.7 7.6 .1
Blue-collar occupations ...................................................... 100.0 67.6 32.4 5.6 4.3 8.5 3.8 10.0 .2Precision production, craft, and repair ............................ 100.0 68.5 31.5 5.3 3.6 7.8 4.4 10.3 .2Machine operators, assemblers, and inspectors ............ 100.0 65.6 34.4 6.8 5.6 9.9 2.9 9.0 .3Transportation and material moving ............................... 100.0 66.0 34.0 5.2 4.6 9.1 4.2 10.7 .2Handlers, equipment cleaners, helpers, and laborers .... 100.0 70.3 29.7 4.1 3.6 7.8 3.1 11.1 5( )
Service occupations ........................................................... 100.0 64.1 35.9 5.9 10.9 8.6 2.2 8.1 .3
All workers, service-producing industries 4 ....................... 100.0 74.0 26.0 6.7 2.3 6.1 2.7 8.1 .1White-collar occupations .................................................... 100.0 74.2 25.8 7.3 2.2 5.9 2.8 7.4 .1
Professional specialty and technical ............................... 100.0 74.2 25.8 8.1 2.1 5.3 3.1 7.2 .1Professional specialty ................................................. 100.0 74.5 25.5 8.3 2.1 4.9 3.0 7.1 .1Technical .................................................................... 100.0 73.1 26.9 7.3 2.1 6.4 3.4 7.6 5( )
Executive, administrative, and managerial ..................... 100.0 73.0 27.0 8.5 3.1 5.1 3.4 6.6 .2Sales ............................................................................... 100.0 77.7 22.3 4.8 2.0 5.1 1.6 8.6 5( )Administrative support, including clerical ........................ 100.0 72.9 27.1 6.7 1.8 8.1 2.7 7.7 .1
Blue-collar occupations ...................................................... 100.0 71.2 28.8 5.6 2.8 7.5 3.0 9.8 .1Precision production, craft, and repair ............................ 100.0 70.9 29.1 6.9 3.1 6.9 3.3 8.8 .1Transportation and material moving ............................... 100.0 70.1 29.9 5.0 2.8 7.9 3.5 10.6 .2Handlers, equipment cleaners, helpers, and laborers .... 100.0 71.8 28.2 4.6 2.5 8.3 2.4 10.3 5( )
Service occupations ........................................................... 100.0 76.9 23.1 4.1 1.5 5.5 1.4 10.4 5( )
1 Includes severance pay and supplemental unemployment benefits.2 Includes mining, construction, and manufacturing.3 Cost per hour worked is $0.01 or less.4 Includes transportation, communication, and public utilities; wholesale and
retail trade; finance, insurance, and real estate; and service industries.5 Less than .05 percent.
Note: The sum of individual items may not equal totals due to rounding.

16
Table 12. Employer costs per hour worked for employee compensation and costs as a percent of total compensation: Private indu strymanufacturing and nonmanufacturing workers, by occupational group, December 2002
SeriesTotal
compen-sation
Wagesand
salaries
Benefit costs
Total Paidleave
Supple-mental
pay Insurance
Retirementand
savings
Legallyrequiredbenefits
Otherbenefits1
Cost per hour worked by year
All workers, manufacturing industries ............................... $25.58 $17.33 $8.24 $1.96 $1.15 $2.18 $0.77 $2.10 $0.09White-collar occupations .................................................... 35.16 24.62 10.54 3.08 1.23 2.55 1.06 2.47 .15
Professional specialty and technical ............................... 39.20 27.27 11.93 3.71 1.01 2.89 1.31 2.79 .22Professional specialty ................................................. 43.66 30.69 12.97 4.24 .87 2.93 1.52 3.09 .31Technical .................................................................... 31.09 21.06 10.04 2.73 1.25 2.82 .93 2.24 .07
Executive, administrative, and managerial ..................... 49.91 35.00 14.91 4.56 2.67 2.84 1.42 3.27 .15Administrative support, including clerical ........................ 21.70 14.93 6.77 1.68 .74 2.11 .56 1.64 .04
Blue-collar occupations ...................................................... 21.53 14.27 7.26 1.48 1.09 2.02 .65 1.95 .06Precision production, craft, and repair ............................ 26.86 17.91 8.95 2.01 1.28 2.33 .86 2.38 .09Machine operators, assemblers, and inspectors ............ 20.43 13.37 7.05 1.41 1.14 2.03 .60 1.82 .06Transportation and material moving ............................... 22.25 14.88 7.36 1.41 1.03 1.95 .66 2.24 .08Handlers, equipment cleaners, helpers, and laborers .... 16.08 10.97 5.11 .90 .65 1.54 .44 1.56 2( )
Service occupations ........................................................... 20.92 13.15 7.77 1.31 2.41 1.89 .49 1.61 .06
All workers, nonmanufacturing industries ........................ 21.53 15.85 5.68 1.38 .52 1.33 .62 1.81 .02White-collar occupations .................................................... 25.97 19.23 6.73 1.89 .62 1.53 .74 1.93 .03
Professional specialty and technical ............................... 36.47 27.03 9.43 2.93 .77 1.94 1.14 2.63 .02Professional specialty ................................................. 39.30 29.26 10.05 3.26 .82 1.95 1.21 2.78 .03Technical .................................................................... 29.45 21.53 7.93 2.14 .62 1.90 .99 2.26 2( )
Executive, administrative, and managerial ..................... 42.06 30.57 11.48 3.51 1.47 2.17 1.42 2.85 .08Sales ............................................................................... 16.26 12.65 3.61 .78 .33 .83 .27 1.39 2( )Administrative support, including clerical ........................ 18.01 13.12 4.89 1.21 .34 1.46 .48 1.39 .02
Blue-collar occupations ...................................................... 20.23 14.31 5.92 .99 .58 1.50 .74 2.10 .02Precision production, craft, and repair ............................ 26.57 18.71 7.86 1.42 .77 1.87 1.14 2.65 .02Transportation and material moving ............................... 20.00 13.88 6.12 .96 .61 1.63 .75 2.14 .03Handlers, equipment cleaners, helpers, and laborers .... 14.54 10.47 4.07 .59 .38 1.11 .39 1.58 2( )
Service occupations ........................................................... 11.13 8.56 2.57 .46 .17 .61 .16 1.16 2( )
Percent of total compensation
All workers, manufacturing industries ............................... 100.0 67.7 32.2 7.7 4.5 8.5 3.0 8.2 0.4White-collar occupations .................................................... 100.0 70.0 30.0 8.8 3.5 7.3 3.0 7.0 .4
Professional specialty and technical ............................... 100.0 69.6 30.4 9.5 2.6 7.4 3.3 7.1 .6Professional specialty ................................................. 100.0 70.3 29.7 9.7 2.0 6.7 3.5 7.1 .7Technical .................................................................... 100.0 67.7 32.3 8.8 4.0 9.1 3.0 7.2 .2
Executive, administrative, and managerial ..................... 100.0 70.1 29.9 9.1 5.3 5.7 2.8 6.6 .3Administrative support, including clerical ........................ 100.0 68.8 31.2 7.7 3.4 9.7 2.6 7.6 .2
Blue-collar occupations ...................................................... 100.0 66.3 33.7 6.9 5.1 9.4 3.0 9.1 .3Precision production, craft, and repair ............................ 100.0 66.7 33.3 7.5 4.8 8.7 3.2 8.9 .3Machine operators, assemblers, and inspectors ............ 100.0 65.4 34.5 6.9 5.6 9.9 2.9 8.9 .3Transportation and material moving ............................... 100.0 66.9 33.1 6.3 4.6 8.8 3.0 10.1 .4Handlers, equipment cleaners, helpers, and laborers .... 100.0 68.2 31.8 5.6 4.0 9.6 2.7 9.7 3( )
Service occupations ........................................................... 100.0 62.9 37.1 6.3 11.5 9.0 2.3 7.7 .3
All workers, nonmanufacturing industries ........................ 100.0 73.6 26.4 6.4 2.4 6.2 2.9 8.4 .1White-collar occupations .................................................... 100.0 74.0 25.9 7.3 2.4 5.9 2.8 7.4 .1
Professional specialty and technical ............................... 100.0 74.1 25.9 8.0 2.1 5.3 3.1 7.2 .1Professional specialty ................................................. 100.0 74.5 25.6 8.3 2.1 5.0 3.1 7.1 .1Technical .................................................................... 100.0 73.1 26.9 7.3 2.1 6.5 3.4 7.7 3( )
Executive, administrative, and managerial ..................... 100.0 72.7 27.3 8.3 3.5 5.2 3.4 6.8 .2Sales ............................................................................... 100.0 77.8 22.2 4.8 2.0 5.1 1.7 8.5 3( )Administrative support, including clerical ........................ 100.0 72.8 27.2 6.7 1.9 8.1 2.7 7.7 .1
Blue-collar occupations ...................................................... 100.0 70.7 29.3 4.9 2.9 7.4 3.7 10.4 .1Precision production, craft, and repair ............................ 100.0 70.4 29.6 5.3 2.9 7.0 4.3 10.0 .1Transportation and material moving ............................... 100.0 69.4 30.6 4.8 3.1 8.2 3.8 10.7 .2Handlers, equipment cleaners, helpers, and laborers .... 100.0 72.0 28.0 4.1 2.6 7.6 2.7 10.9 3( )
Service occupations ........................................................... 100.0 76.9 23.1 4.1 1.5 5.5 1.4 10.4 3( )
1 Includes severance pay and supplemental unemployment benefits.2 Cost per hour worked is $0.01 or less.3 Less than .05 percent.
Note: The sum of individual items may not equal totals due to rounding.

17
Table 13. Employer costs per hour worked for employee compensation and costs as a percent of total compensation: Private indu stryworkers, by bargaining status, and major industry and occupational group, December 2002
SeriesTotal
compen-sation
Wagesand
salaries
Benefit costs
Total Paidleave
Supple-mental
pay Insurance
Retirementand
savings
Legallyrequiredbenefits
Otherbenefits1
Cost per hour worked by year
All union workers, private industry .................................... $30.29 $19.86 $10.43 $2.16 $1.06 $2.91 $1.67 $2.55 $0.08Blue-collar occupations .................................................. 30.41 19.32 11.10 2.05 1.24 3.08 1.87 2.74 .11
Goods-producing industries2 .............................................. 32.09 20.20 11.90 2.06 1.62 3.22 2.03 2.84 .13Service-producing industries3 ............................................ 29.00 19.62 9.38 2.23 .66 2.69 1.41 2.35 .04
Manufacturing ..................................................................... 28.87 18.37 10.50 2.33 1.69 2.86 1.07 2.38 .17Blue-collar occupations .................................................. 28.35 17.87 10.48 2.30 1.71 2.85 1.06 2.39 .17
Nonmanufacturing .............................................................. 30.89 20.49 10.40 2.08 .80 2.93 1.92 2.63 .04
All nonunion workers, private industry .............................. 21.16 15.62 5.54 1.39 .56 1.28 .52 1.77 .02Blue-collar occupations .................................................. 17.88 12.86 5.02 .90 .62 1.27 .37 1.85 4( )
Goods-producing industries2 .............................................. 24.26 17.07 7.19 1.60 .96 1.78 .61 2.19 .05Service-producing industries3 ............................................ 20.43 15.28 5.15 1.34 .46 1.17 .50 1.67 .02
Manufacturing ..................................................................... 24.70 17.06 7.64 1.86 1.01 2.00 .69 2.03 .07Blue-collar occupations .................................................. 18.96 12.91 6.04 1.18 .86 1.71 .49 1.79 .02
Nonmanufacturing .............................................................. 20.61 15.40 5.21 1.31 .49 1.17 .49 1.73 .02
Percent of total compensation
All union workers, private industry .................................... 100.0 65.6 34.4 7.1 3.5 9.6 5.5 8.4 0.3Blue-collar occupations .................................................. 100.0 63.5 36.5 6.7 4.1 10.1 6.1 9.0 .4
Goods-producing industries2 .............................................. 100.0 62.9 37.1 6.4 5.0 10.0 6.3 8.9 .4Service-producing industries3 ............................................ 100.0 67.7 32.3 7.7 2.3 9.3 4.9 8.1 .1
Manufacturing ..................................................................... 100.0 63.6 36.4 8.1 5.9 9.9 3.7 8.2 .6Blue-collar occupations .................................................. 100.0 63.0 37.0 8.1 6.0 10.1 3.7 8.4 .6
Nonmanufacturing .............................................................. 100.0 66.3 33.7 6.7 2.6 9.5 6.2 8.5 .1
All nonunion workers, private industry .............................. 100.0 73.8 26.2 6.6 2.6 6.0 2.5 8.4 .1Blue-collar occupations .................................................. 100.0 71.9 28.1 5.0 3.5 7.1 2.1 10.3 5( )
Goods-producing industries2 .............................................. 100.0 70.4 29.6 6.6 4.0 7.3 2.5 9.0 .2Service-producing industries3 ............................................ 100.0 74.8 25.2 6.6 2.3 5.7 2.4 8.2 .1
Manufacturing ..................................................................... 100.0 69.1 30.9 7.5 4.1 8.1 2.8 8.2 .3Blue-collar occupations .................................................. 100.0 68.1 31.9 6.2 4.5 9.0 2.6 9.4 .1
Nonmanufacturing .............................................................. 100.0 74.7 25.3 6.4 2.4 5.7 2.4 8.4 .1
1 Includes severance pay and supplemental unemployment benefits.2 Includes mining, construction, and manufacturing.3 Includes transportation, communication, and public utilities; wholesale and
retail trade; finance, insurance, and real estate; and service industries.
4 Cost per hour worked is $0.01 or less.5 Less than .05 percent.
Note: The sum of individual items may not equal totals due to rounding.

18
Table 14. Employer costs per hour worked for employee compensation and costs as a percent of total compensation: Private indu stryworkers, by establishment employment size, and major industry and occupational group, December 2002
Industry and occupational group,and employment size
Totalcompen-
sation
Wagesand
salaries
Benefit costs
Total Paidleave
Supple-mental
pay Insurance
Retirementand
savings
Legallyrequiredbenefits
Otherbenefits1
Cost per hour worked by year
All workers in private industry ............................................ $22.14 $16.08 $6.07 $1.47 $0.61 $1.46 $0.64 $1.85 $0.031-99 workers ....................................................................... 18.87 14.12 4.75 1.08 .46 1.08 .43 1.70 2( )100 or more workers ........................................................... 26.00 18.38 7.62 1.93 .79 1.91 .90 2.04 .05
100-499 workers ............................................................. 22.40 16.07 6.34 1.50 .67 1.62 .65 1.86 .03500 or more workers ....................................................... 30.29 21.14 9.15 2.45 .93 2.25 1.19 2.25 .08
Goods-producing industries 3 ......................................... 25.88 17.72 8.17 1.70 1.09 2.08 .91 2.33 .071-99 workers ................................................................... 22.28 15.76 6.53 1.05 .82 1.60 .69 2.35 2( )100 or more workers ....................................................... 28.72 19.26 9.46 2.20 1.31 2.45 1.07 2.31 .11
100-499 workers ......................................................... 24.54 16.61 7.93 1.59 1.18 2.17 .83 2.11 .05500 or more workers ................................................... 33.64 22.38 11.26 2.93 1.45 2.79 1.36 2.55 .18
Service-producing industries 4 ........................................ 21.11 15.62 5.49 1.41 .48 1.29 .57 1.72 .021-99 workers ................................................................... 18.15 13.77 4.37 1.08 .38 .97 .37 1.56 2( )100 or more workers ....................................................... 25.02 18.07 6.96 1.84 .61 1.71 .83 1.94 .03
100-499 workers ......................................................... 21.65 15.88 5.77 1.47 .49 1.42 .59 1.77 .02500 or more workers ................................................... 29.08 20.70 8.38 2.27 .74 2.06 1.13 2.14 .04
White-collar occupations ................................................. 26.77 19.70 7.07 2.00 .67 1.62 .77 1.98 .041-99 workers ................................................................... 22.70 17.15 5.55 1.53 .53 1.23 .51 1.73 2( )100 or more workers ....................................................... 30.98 22.34 8.64 2.48 .81 2.03 1.03 2.23 .06
100-499 workers ......................................................... 26.76 19.58 7.18 1.99 .68 1.72 .75 2.01 .04500 or more workers ................................................... 35.26 25.14 10.12 2.98 .95 2.33 1.32 2.45 .09
Blue-collar occupations ................................................... 20.68 14.30 6.38 1.16 .76 1.68 .71 2.05 .031-99 workers ................................................................... 18.91 13.54 5.37 .88 .58 1.34 .52 2.05 2( )100 or more workers ....................................................... 22.81 15.21 7.60 1.50 .97 2.09 .93 2.04 .06
100-499 workers ......................................................... 20.29 13.85 6.44 1.16 .81 1.82 .71 1.91 .03500 or more workers ................................................... 26.68 17.31 9.37 2.03 1.23 2.49 1.27 2.24 .11
Percent of total compensation
All workers in private industry ............................................ 100.0 72.6 27.4 6.6 2.8 6.6 2.9 8.4 0.11-99 workers ....................................................................... 100.0 74.8 25.2 5.7 2.4 5.7 2.3 9.0 5( )100 or more workers ........................................................... 100.0 70.7 29.3 7.4 3.0 7.3 3.5 7.8 .2
100-499 workers ............................................................. 100.0 71.7 28.3 6.7 3.0 7.2 2.9 8.3 .1500 or more workers ....................................................... 100.0 69.8 30.2 8.1 3.1 7.4 3.9 7.4 .3
Goods-producing industries 3 ......................................... 100.0 68.5 31.6 6.6 4.2 8.0 3.5 9.0 .31-99 workers ................................................................... 100.0 70.7 29.3 4.7 3.7 7.2 3.1 10.5 5( )100 or more workers ....................................................... 100.0 67.1 32.9 7.7 4.6 8.5 3.7 8.0 .4
100-499 workers ......................................................... 100.0 67.7 32.3 6.5 4.8 8.8 3.4 8.6 .2500 or more workers ................................................... 100.0 66.5 33.5 8.7 4.3 8.3 4.0 7.6 .5
Service-producing industries 4 ........................................ 100.0 74.0 26.0 6.7 2.3 6.1 2.7 8.1 .11-99 workers ................................................................... 100.0 75.9 24.1 6.0 2.1 5.3 2.0 8.6 5( )100 or more workers ....................................................... 100.0 72.2 27.8 7.4 2.4 6.8 3.3 7.8 .1
100-499 workers ......................................................... 100.0 73.3 26.7 6.8 2.3 6.6 2.7 8.2 .1500 or more workers ................................................... 100.0 71.2 28.8 7.8 2.5 7.1 3.9 7.4 .1
White-collar occupations ................................................. 100.0 73.6 26.4 7.5 2.5 6.1 2.9 7.4 .11-99 workers ................................................................... 100.0 75.6 24.4 6.7 2.3 5.4 2.2 7.6 5( )100 or more workers ....................................................... 100.0 72.1 27.9 8.0 2.6 6.6 3.3 7.2 .2
100-499 workers ......................................................... 100.0 73.2 26.8 7.4 2.5 6.4 2.8 7.5 .1500 or more workers ................................................... 100.0 71.3 28.7 8.5 2.7 6.6 3.7 6.9 .3
Blue-collar occupations ................................................... 100.0 69.1 30.9 5.6 3.7 8.1 3.4 9.9 .11-99 workers ................................................................... 100.0 71.6 28.4 4.7 3.1 7.1 2.7 10.8 5( )100 or more workers ....................................................... 100.0 66.7 33.3 6.6 4.3 9.2 4.1 8.9 .3
100-499 workers ......................................................... 100.0 68.3 31.7 5.7 4.0 9.0 3.5 9.4 .1500 or more workers ................................................... 100.0 64.9 35.1 7.6 4.6 9.3 4.8 8.4 .4
1 Includes severance pay and supplemental unemployment benefits.2 Cost per hour worked is $0.01 or less.3 Includes mining, construction, and manufacturing.4 Includes transportation, communication, and public utilities; wholesale and
retail trade; finance, insurance, and real estate; and service industries.5 Less than .05 percent.
Note: The sum of individual items may not equal totals due to rounding.

19
Table 15. Employer costs per hour worked for employee compensation and costs as a percent of total compensation: Private indu stryhealth services workers, by industry and occupational group, December 2002
SeriesTotal
compen-sation
Wagesand
salaries
Benefit costs
Total Paidleave
Supple-mental
pay Insurance
Retirementand
savings
Legallyrequiredbenefits
Otherbenefits1
Cost per hour worked by year
Health services ................................................................... $25.31 $18.49 $6.82 $2.14 $0.50 $1.57 $0.70 $1.91 2( )Professional specialty and technical ............................. 36.60 26.81 9.79 3.48 .81 1.87 1.00 2.61 2( )
Professional specialty ............................................... 43.75 32.02 11.73 4.53 .92 2.01 1.29 2.95 .02Nurses .................................................................. 34.27 24.64 9.63 2.89 1.15 1.90 .99 2.68 2( )
Technical .................................................................. 24.73 18.17 6.56 1.73 .63 1.62 .52 2.05 2( )Administrative support, including clerical ...................... 16.42 11.96 4.46 1.05 .23 1.41 .48 1.29 2( )
Service occupations ......................................................... 13.88 10.10 3.78 .82 .30 1.11 .30 1.25 2( )
Hospitals ......................................................................... 28.04 19.81 8.23 2.36 .81 2.11 .82 2.12 .02Professional specialty and technical ............................. 34.44 24.56 9.88 2.95 1.16 2.18 .99 2.59 2( )
Professional specialty ............................................... 38.08 27.28 10.80 3.33 1.27 2.21 1.14 2.83 2( )Nurses .................................................................. 36.96 26.31 10.65 3.23 1.38 2.15 1.08 2.79 2( )
Technical .................................................................. 25.69 18.00 7.69 2.05 .89 2.10 .63 2.01 .02Administrative support, including clerical ...................... 18.57 12.62 5.95 1.47 .37 2.12 .60 1.38 2( )
Service occupations ......................................................... 16.20 10.93 5.27 1.14 .44 1.93 .41 1.34 2( )
Nursing homes ............................................................... 16.51 12.26 4.25 1.11 .41 .97 .22 1.54 2( )Professional specialty and technical ............................. 24.33 18.32 6.01 1.64 .72 1.06 .36 2.23 2( )
Professional specialty ............................................... 27.65 20.87 6.78 1.99 .74 1.10 .46 2.49 2( )Technical .................................................................. 21.55 16.17 5.37 1.35 .70 1.02 .28 2.01 2( )
Service occupations ......................................................... 12.58 9.20 3.38 .77 .33 .90 .16 1.22 2( )
Percent of total compensation
Health services ................................................................... 100.0 73.1 26.9 8.5 2.0 6.2 2.8 7.5 3( )Professional specialty and technical ............................. 100.0 73.3 26.7 9.5 2.2 5.1 2.7 7.1 3( )
Professional specialty ............................................... 100.0 73.2 26.8 10.4 2.1 4.6 2.9 6.7 3( )Nurses .................................................................. 100.0 71.9 28.1 8.4 3.4 5.5 2.9 7.8 3( )
Technical .................................................................. 100.0 73.5 26.5 7.0 2.5 6.6 2.1 8.3 3( )Administrative support, including clerical ...................... 100.0 72.8 27.2 6.4 1.4 8.6 2.9 7.9 3( )
Service occupations ......................................................... 100.0 72.8 27.2 5.9 2.2 8.0 2.2 9.0 3( )
Hospitals ......................................................................... 100.0 70.6 29.4 8.4 2.9 7.5 2.9 7.6 .1Professional specialty and technical ............................. 100.0 71.3 28.7 8.6 3.4 6.3 2.9 7.5 3( )
Professional specialty ............................................... 100.0 71.6 28.4 8.7 3.3 5.8 3.0 7.4 3( )Nurses .................................................................. 100.0 71.2 28.8 8.7 3.7 5.8 2.9 7.5 3( )
Technical .................................................................. 100.0 70.1 29.9 8.0 3.5 8.2 2.5 7.8 .1Administrative support, including clerical ...................... 100.0 68.0 32.0 7.9 2.0 11.4 3.2 7.4 3( )
Service occupations ......................................................... 100.0 67.5 32.5 7.0 2.7 11.9 2.5 8.3 3( )
Nursing homes ............................................................... 100.0 74.3 25.7 6.7 2.5 5.9 1.3 9.3 3( )Professional specialty and technical ............................. 100.0 75.3 24.7 6.7 3.0 4.4 1.5 9.2 3( )
Professional specialty ............................................... 100.0 75.5 24.5 7.2 2.7 4.0 1.7 9.0 3( )Technical .................................................................. 100.0 75.0 24.9 6.3 3.2 4.7 1.3 9.3 3( )
Service occupations ......................................................... 100.0 73.1 26.9 6.1 2.6 7.2 1.3 9.7 3( )
1 Includes severance pay and supplemental unemployment benefits.2 Cost per hour worked is $0.01 or less.3 Less than .05 percent.
Note: The sum of individual items may not equal totals due to rounding.

20
Table 16. Employer costs per hour worked for employee compensation and costs as a percent of total compensation: Private indu strytransportation equipment manufacturing and public utilities workers, by industry and occupational group, December 2002
SeriesTotal
compen-sation
Wagesand
salaries
Benefit costs
Total Paidleave
Supple-mental
pay Insurance
Retirementand
savings
Legallyrequiredbenefits
Otherbenefits1
Cost per hour worked by year
Transportation equipment manufacturing (SIC 37) ......... $35.57 $23.21 $12.36 $3.08 $2.11 $3.02 $1.02 $2.88 $0.26White-collar occupations .................................................. 46.73 32.49 14.24 4.68 1.37 3.27 1.35 3.36 .22
Professional specialty and technical ............................. 47.80 32.90 14.90 5.11 1.09 3.55 1.34 3.56 .26Executive, administrative, and managerial ................... 60.50 44.07 16.43 5.58 2.22 2.95 1.60 3.86 .22
Blue-collar occupations .................................................... 30.06 18.63 11.43 2.28 2.47 2.89 .86 2.64 .28Service occupations ......................................................... 30.28 18.43 11.85 2.65 2.04 3.36 1.02 2.47 .30
Aircraft manufacturing (SIC 3721) ................................ 43.07 28.16 14.91 3.94 2.41 3.60 1.46 3.27 .23White-collar occupations .............................................. 45.54 30.74 14.81 4.47 1.46 3.70 1.60 3.35 .23Blue-collar occupations ................................................ 39.15 24.05 15.09 3.07 3.99 3.42 1.22 3.17 .22
Public utilities (SIC’s 48, 49) .............................................. 35.26 23.55 11.72 3.33 1.52 2.96 1.27 2.52 .12White-collar occupations .................................................. 35.29 23.92 11.37 3.23 1.54 2.87 1.17 2.43 .14Blue-collar occupations .................................................... 35.45 23.01 12.43 3.55 1.50 3.15 1.46 2.70 .08
Communications (SIC 48) .............................................. 34.12 23.22 10.90 3.23 1.38 2.77 1.04 2.37 .11White-collar occupations .............................................. 33.84 23.31 10.53 3.05 1.36 2.65 1.03 2.32 .11Blue-collar occupations ................................................ 35.02 23.10 11.92 3.72 1.44 3.07 1.06 2.53 .10
Electric, gas, and sanitary services (SIC 49) ............... 37.43 24.16 13.26 3.51 1.79 3.32 1.70 2.81 .13White-collar occupations .............................................. 39.25 25.57 13.67 3.70 2.03 3.44 1.54 2.75 .20Blue-collar occupations ................................................ 35.90 22.92 12.98 3.36 1.56 3.23 1.88 2.89 .05
Percent of total compensation
Transportation equipment manufacturing (SIC 37) ......... 100.0 65.3 34.7 8.7 5.9 8.5 2.9 8.1 0.7White-collar occupations .................................................. 100.0 69.5 30.5 10.0 2.9 7.0 2.9 7.2 .5
Professional specialty and technical ............................. 100.0 68.8 31.2 10.7 2.3 7.4 2.8 7.4 .5Executive, administrative, and managerial ................... 100.0 72.8 27.2 9.2 3.7 4.9 2.6 6.4 .4
Blue-collar occupations .................................................... 100.0 62.0 38.0 7.6 8.2 9.6 2.9 8.8 .9Service occupations ......................................................... 100.0 60.9 39.1 8.8 6.7 11.1 3.4 8.2 1.0
Aircraft manufacturing (SIC 3721) ................................ 100.0 65.4 34.6 9.1 5.6 8.4 3.4 7.6 .5White-collar occupations .............................................. 100.0 67.5 32.5 9.8 3.2 8.1 3.5 7.4 .5Blue-collar occupations ................................................ 100.0 61.4 38.5 7.8 10.2 8.7 3.1 8.1 .6
Public utilities (SIC’s 48, 49) .............................................. 100.0 66.8 33.2 9.4 4.3 8.4 3.6 7.1 .3White-collar occupations .................................................. 100.0 67.8 32.2 9.2 4.4 8.1 3.3 6.9 .4Blue-collar occupations .................................................... 100.0 64.9 35.1 10.0 4.2 8.9 4.1 7.6 .2
Communications (SIC 48) .............................................. 100.0 68.1 31.9 9.5 4.0 8.1 3.0 6.9 .3White-collar occupations .............................................. 100.0 68.9 31.1 9.0 4.0 7.8 3.0 6.9 .3Blue-collar occupations ................................................ 100.0 66.0 34.0 10.6 4.1 8.8 3.0 7.2 .3
Electric, gas, and sanitary services (SIC 49) ............... 100.0 64.5 35.4 9.4 4.8 8.9 4.5 7.5 .3White-collar occupations .............................................. 100.0 65.1 34.8 9.4 5.2 8.8 3.9 7.0 .5Blue-collar occupations ................................................ 100.0 63.8 36.2 9.4 4.3 9.0 5.2 8.1 .1
1 Includes severance pay and supplemental unemployment benefits.
Note: The sum of individual items may not equal totals due to rounding.

21
EXPLANATORY NOTES Employer Costs for Employee Compensation (ECEC) measures the average cost per employee hour worked that employers pay for wages and salaries and benefits. Wages and salaries are defined as the hourly straight-time wage rate or, for workers not paid on an hourly basis, straight-time earnings divided by the corresponding hours. Straight-time wage and salary rates are total earnings before payroll deductions and include production bonuses, incentive earnings, commission payments, and cost-of-living adjustments. Not included in straight-time earnings are nonproduction bonuses such as lump-sum payments provided in lieu of wage increases, shift differentials, and premium pay for overtime and for work on weekends and holidays; these payments are included in the benefits component. Benefits include: Paid leave--vacations, holidays, sick leave, and other leave; supplemental pay--premium pay for work in addition to the regular work schedule (such as overtime, weekends, and holidays), shift differentials, and nonproduction bonuses (such as referral bonuses and lump-sum payments provided in lieu of wage increases); insurance benefits--life, health, short-term disability, and long-term disability; retirement and savings benefits--defined benefit and defined contribution plans; legally required benefits--social security, medicare, Federal and State unemployment insurance, and workers’ compensation; and other benefits--severance pay and supplemental unemployment plans. The Employer Costs for Employee Compensation includes data for the civilian economy, which includes data from both private industry and State and local government. Excluded from private industry are the self-employed and farm and private household workers. Federal government workers are excluded from the public sector. The private industry series and the State and local government series provide data for the two sectors separately.
The publication schedule for the Employer Costs for Employee Compensation has changed. Publications are now issued on a quarterly basis, with data collected for the pay period including the 12th day of the survey months of March, June, September, and December. Publications will be issued approximately three months after the month of reference. The tables included in the quarterly news release are unchanged from the annual format and are now available on the Internet on a quarterly basis beginning with June 2002 data. Information may be obtained by visiting the Internet site (http://www.bls.gov/ncs/ect/home.htm), calling (202) 691-6199, or by e-mail request ([email protected]).
The cost levels in this release are based on a probability sample of about 28,300 occupations within approximately 6,950 sample establishments in private industry and about 3,700 occupations within approximately 800 sample establishments in State and local government. Sample establishments are classified by industry categories based on the 1987 Standard Industrial Classification (SIC) system, as defined by the U.S. Office of Management and Budget. Within a sample establishment, specific job categories are selected to represent broader major occupational groups such as professional specialty and technical occupations. Current employment weights are used to calculate cost levels. The December 2002 cost levels were calculated using the December 2002 employment counts from the Bureau of Labor Statistics Current Employment Statistics (CES) program, benchmarked to the 2001 universe of all private nonfarm establishments. In most instances, private industry employment counts were total employment estimates for 2-digit major industry groups, such as primary metal manufacturing or food stores, as defined by the SIC system. In a few cases, 3- and 4-digit industry employment counts were used. These include the 4-digit aircraft manufacturing industry (3721) and the 3-digit health care and educational industries. For more information on SIC coding, see “BLS Establishment Estimates Revised to Incorporate March 2001 Benchmarks” in the June 2002 issue of

22
Employment and Earnings. For State and local governments, employment counts ranged from those for 3-digit industries, such as education and health care, to those for major industry divisions, such as public administration.
Employment data from these 2-, 3-, and 4-digit industries were distributed to major occupational groups
(such as executives, administrators, and managers or machine operators, assemblers, and inspectors) using the relative importance of the groups in the Employment Cost Index (ECI) sample. Because the ECI establishment sample is completely replaced over a period of several years, major occupational group employment counts from the ECI are affected by the age of the sample. However, a few years’ difference in the age of the occupational data within industries is likely to have a small impact on the estimates. In contrast, the ECI, which measures the change in employer costs for employee compensation, is calculated with fixed 1990 employment counts to prevent employment shifts among occupations and industries from influencing the changes. Therefore, year-to-year changes in Employer Costs for Employee Compensation will differ from those in the ECI. Historical data and related articles on the ECEC are included in the bulletin, Employer Costs for Employee Compensation, 1986-99 (Bulletin 2508). An historical summary from 1986 through 2002 is also available on the Internet site (http://www.bls.gov/ncs/ect/home.htm) or upon request. Information on how costs are calculated appears in “Measuring Trends in the Structure and Levels of Employer Costs for Employee Compensation,” Compensation and Working Conditions, Summer 1997. An article on changes in employer compensation costs, “Tracking Changes in Benefit Costs,” appears in Compensation and Working Conditions, Spring 1999. Relative Standard Errors Because the ECEC is a sample survey, it is subject to sampling errors. Sampling errors are differences that occur between the results computed from a sample of observations and those computed from all observations in the population. The estimates derived from different samples selected using the same sample design may differ from one another. A measure of the variation among these differing estimates is the standard error. It can be used to measure the precision with which an estimate from a particular sample approximates the expected result of all possible samples. The chances are about 68 out of 100 that an estimate from the survey differs from a complete population figure by less than the standard error. The chances are about 90 out of 100 that this difference would be less than 1.6 times the standard error. All the statements of comparisons appearing in this publication are significant at a 1.6 standard error level or better, unless otherwise indicated. This means that for differences cited, the estimated difference is greater than 1.6 times the standard error of the difference. The relative standard error (RSE) is shown with the cost estimates for some series in the appendix table. The RSE for all estimates will be available shortly after the release is issued. This information can be obtained directly from the BLS Internet site (http://www.bls.gov/ncs/ect/home.htm), by e-mail request ([email protected]), or by telephone (202) 691-6199.
For a more detailed explanation of relative standard errors, see “Measuring Trends in the Structure and Levels of Employer Costs for Employee Compensation,” Compensation and Working Conditions, Summer 1997. For a detailed explanation of how to use standard error data to analyze differences in year-to-year changes, see "Analyzing Year-to-Year Changes in Employer Costs for Employee Compensation," Compensation and Working Conditions, Spring 1998. This article supplements an article from the Summer 1997 issue of Compensation and Working Conditions, "Explaining the Differential Growth Rates of the ECI

23
and ECEC," which examined how differences in the construction of these measures contribute to differing trends. Standard errors relate to differences that occur from sampling errors, but not from nonsampling errors.
Nonsampling errors are not measured and include survey nonresponse and data collection and processing errors. Survey nonresponse occurs when sample members are unwilling or unable to participate in the survey. Data collection errors include inaccurate data by respondents and definitional difficulties. Processing errors include errors in recording, coding, and entering data. Although nonsampling errors are not measured, BLS quality assurance programs contain procedures for reducing such errors. These procedures include data collection reinterviews, observed interviews, computer data edits, and systematic review of reports on which data are recorded. Extensive field economist training also is conducted to maintain high data collection standards. Comparing private and public sector data Aggregate compensation cost levels in State and local government should not be directly compared with those in private industry. Differences between these sectors stem from factors such as variation in work activities and occupational structures. Manufacturing and sales, for example, make up a large part of private industry work activities, but are rare in State and local government. White-collar occupations (largely professional occupations including teachers) account for two-thirds of the State and local government workforce, compared with one-half of private industry.
A detailed examination of differences in compensation levels and trends between private industry and
State and local government may be found in “Cost of Employee Compensation in Public and Private Sectors,” Monthly Labor Review, May 1993, and “Compensation Cost Trends in Private Industry and State and Local Governments,” Compensation and Working Conditions, Fall 1999. Obtaining information Articles, bulletins, and other information may be obtained by calling (202) 691-6199, sending an e-mail message to [email protected], or visiting the Internet site (http://www.bls.gov/ncs/ect/home.htm). Information in this release will be made available to sensory impaired individuals upon request. Voice phone: (202) 691-5200; Federal Relay Service Number: 1-800-877-8339.

24
Appendix. Employer costs per hour worked for components of compensation, and relative standard errors, 1 by major industry andoccupation categories, December 2002
Industry or occupation category
Totalcompen-
sation
Wagesand
salaries
Benefit costs
Total Paidleave
Supple-mental
pay Insurance
Retirementand
savings
Legallyrequiredbenefits
Otherbenefits2
Civilian workersCost per hour worked by year .......................................... $23.66 $17.06 $6.60 $1.62 $0.56 $1.69 $0.82 $1.86 $0.04Relative error .................................................................... 1.2 1.3 1.3 2.4 3.7 1.3 2.4 1.1 10.2
State and local government workersCost per hour worked by year ...................................... $32.32 $22.68 $9.63 $2.49 $.29 $3.02 $1.84 $1.92 $.07Relative error ................................................................ 1.3 1.3 1.6 2.0 6.0 1.9 3.4 2.0 24.3
Private industry workersCost per hour worked by year ...................................... $22.14 $16.08 $6.07 $1.47 $.61 $1.46 $.64 $1.85 $.03Relative error ................................................................ 1.5 1.5 1.7 3.2 4.0 1.7 3.1 1.3 10.4
Goods-producing industries3
Cost per hour worked by year .................................. $25.88 $17.72 $8.17 $1.70 $1.09 $2.08 $.91 $2.33 $.07Relative error ............................................................ 1.7 1.5 2.6 3.2 6.2 2.7 5.0 1.7 16.3
Service-producing industries4
Cost per hour worked by year .................................. $21.11 $15.62 $5.49 $1.41 $.48 $1.29 $.57 $1.72 $.02Relative error ............................................................ 1.8 1.8 1.9 3.7 4.9 2.1 3.7 1.4 11.9
ManufacturingCost per hour worked by year .................................. $25.58 $17.33 $8.24 $1.96 $1.15 $2.18 $.77 $2.10 $.09Relative error ............................................................ 2.1 1.9 2.7 3.5 6.9 3.0 5.6 1.7 17.2
NonmanufacturingCost per hour worked by year .................................. $21.53 $15.85 $5.68 $1.38 $.52 $1.33 $.62 $1.81 $.02Relative error ............................................................ 1.7 1.7 1.9 3.6 5.0 2.0 3.6 1.4 12.3
White-collar workersCost per hour worked by year .................................. $26.77 $19.70 $7.07 $2.00 $.67 $1.62 $.77 $1.98 $.04Relative error ............................................................ 1.9 2.0 1.8 3.5 6.5 1.7 3.2 1.6 12.4
Blue-collar workersCost per hour worked by year .................................. $20.68 $14.30 $6.38 $1.16 $.76 $1.68 $.71 $2.05 $.03Relative error ............................................................ 1.5 1.3 2.3 3.0 2.7 2.8 4.8 1.6 17.7
Service workersCost per hour worked by year .................................. $11.25 $8.62 $2.64 $.47 $.20 $.63 $.17 $1.17 5( )Relative error ............................................................ 2.5 2.1 4.1 6.3 11.9 5.5 11.4 1.8 6( )
1 The relative error is the standard error expressed as a percent of the cost. One can be 90-percent confident that the interval around the cost estimatebounded by 1.6 times plus and 1.6 times minus the standard error contains the"true" cost.
2 Includes severance pay and supplemental unemployment benefits.3 Includes mining, construction, and manufacturing.4 Includes transportation, communication, and public utilities; wholesale and
retail trade; finance, insurance, and real estate; and service industries.5 Cost per hour worked is $0.01 or less.6 Relative error is suppressed because cost per hour worked is $0.01 or
less.
Note: The sum of individual items may not equal totals due to rounding.