the distribution of oasdi taxes and benefits by income decile
TRANSCRIPT

The Distribution of OASDI Taxes and Benefits by Income Decile
by David Pattison *
On average, persons receiving Social Security benefits tend to have low- er current incomes than do persons paying Social Security taxes. This article documents OASDI’s income distributional patterns by dividing the 1992 Current Population Survey population into 10 income deciles and tabulating benefits received and taxes paid by each decile. The benefits and taxes, when compared with non-social Security income, are progressive: as income rises from decile to decile, the ratio of benefits to income falls, and, except at the highest deciles, the ratio of taxes to incqme rises.
A large component of the current income distributional pattern is associ- ated with age: the young on average receive more income and pay more taxes; the old on average receive more benefits. However, when benefits and taxes are tabulated for income deciles within specific age groups, a genera1 pro- gressivity is still observable, although it is weaker than that for the population as a whole.
*Division of Economic Research, Office of Research and Statistics, Social Security Administration.
This article presents tabulations of the distribution by income decile of taxes and benefits in 1992 under the Old-Age, Survivors, and Disability Insurance (OASDI) programs. Looking at the pop- ulation as a whole, average taxes and the share of aggregate taxes paid increase at higher income deciles; tax as a percent of income increases with income except at the highest decile. Average benefits and the share of aggregate benefits re- ceived decrease with income except at the highest decile; the benefit as a per- cent of nonbenefit income decreases steadily with income. Even within spe-cific age groups, there is still a tendency for taxes as a percent of income to in- crease at all but the highest income levels and for benefits as a percent of income to decrease.
Under OASDI, workers pay contribu- tions in the form of payroll taxes during the years in which they are active mem-bers of the labor force. The disability insurance contributions and the old-age and survivors insurance contributions are pooled in their respective trust funds and go toward paying disability benefits to disabled workers and their families, old-age benefits to retired workers and their spouses, and benefits to the survivors of deceased workers. Because OASDI con-tributors must have earnings, and because OASDI beneficiaries tend to have no :amings or only low earnings, it is ex- pected that contributors on average will have higher incomes than will benefit recipients. The purpose of this article is to document the extent to which OASDI :axes do in fact tend to come from those with high current incomes and OASDI 3enefits tend to go to those with low current incomes. The distributional pat-;em is examined by dividing the popula- tion into income deciles-10 equally sized groups classified by income-and tabulating OASDI taxes and benefits 3y decile.
The pattern of the distribution of taxes and benefits between deciles is expected to have a strong association with age: taxes are paid almost entirely by nonelderly workers, found dispro- portionately in the upper income deciles, while benefits are received mainly by elderly retirees, a group found
Social Security Bulletin Vol. 58, No. 2 * Summer 1995 l 21

disproportionately in the lower income deciles. The net transfer under OASDI from upper income deciles to lower in-come deciles is thus strongly associated with a transfer from younger persons to older persons in the population. To shed additional light on these distributional patterns, the distribution of OASDI taxes and benefits by income is also tabulated within specific age groups.
The focus of this article is on cur- rent redistributional patterns of Social Security, using data on one year’s taxes and benefits. Social Security also has important lifetime redistributional as-pects; the data used here are of limited relevance for the examination of life- time redistributions.
Method
The estimates used in this article have been developed from a Bureau of the Census survey file, the March Current Population Survey (CPS), which contains information for the preceding year on earnings, Social Security benefits, and other sources of income (like interest and pension income) for each person in the survey population aged 15 or older. I The tabulations in this article are based on the March 1993 CPS survey for income in 1992. The CPS is used, rather than Social Security administrative data, because Social Security administrative data do not contain information on family income for OASDI taxpayers and beneficiaries.
OASDI benefits are one of the types of income surveyed in the CPS. OASDI taxes, on the other hand, are not directly elicited in the survey, but have to be simulated from survey information on wages and self-employment earnings. Using Social Security rules in effect in 1992 for maximum taxable earnings and OASDI tax rates, an OASDI tax is simu- lated for each earner in the CPS. * The OASDI tax includes both the employee and the employer shares. 3
Several income concepts are used in the article. “CPS income” refers to the Census money income concept used on the CPS, but with some adjustments. 4 Some of the tables use a concept of in- come before OASDI taxes and transfers, or “pre-0ASDI income,” equal to CPS
income, minus benefits, plus the employ- er’s share of the OASDI tax. For benefi- ciaries who do not work, pre-OASDI income is CPS income minus the OASDI benefits. For wage and salary workers with no benefits, pre-OASDI income is CPS income plus the employer’s share of the OASDI tax. For self-employed work-ers with no benefits, pre-OASDI income is equal to CPS income. In chart 1, a “post-0ASDI” income concept is also used, equal to CPS income minus, for workers, the employee share (and for self- employed workers, the whole share) of the OASDI tax.
There are two ways in which these concepts of income are tabulated: First, “person income” is calculated from each person’s income on the survey file, ex-cept for members of married couples, whose person income is set equal to half the couple’s combined income. (OASDI taxes, similarly, are shared between cou-ples in the person income tabulations.) Second, “family income” is calculated as the sum of the income of persons in the survey family.
For each income concept, 10 income deciles are determined. The family CPS income deciles are calculated by ranking families according to CPS income (Cen- sus “unrelated individuals” are counted as families) and determining the nine in- come percentiles-the 10th percentile, the 20th percentile, and so on, up to the 90th percentile-that divide the families into 10 groups with equal numbers of fa- milies. All families with income less than the 10th percentile are in the bottom decile, all families with income between the 10th and 20th percentile are in the second decile, and so on. Family pre-OASDI income deciles are determined the same way, reranking the families by pre-OASDI family income and determin- ing the 10th through 90th percentile pre-OASDI income amounts that divide the reranked families into 10 equal groups.
For the person-based CPS income, pre-OASDI income, and post-OASDI in-come deciles, similar procedures are fol- lowed, except that persons, rather than fa- milies, are ranked by person income, and the 10th through 90th percentiles are cal- culated to divide the population into 10 groups with equal numbers of persons. 5
Distribution by Family Income Deciles Across All Ages
The tabulation by decile of CPS family income of OASDI taxes, benefits, and benefits net of taxes is shown in table 1. In this and the following tables the first (poorest) decile is shown on top, and the 10th (richest) decile is shown on the bottom: income goes up reading down the table. The first column shows the incomes that were calculated to define each decile. The second and third col-umns show the estimated aggregate OASDI taxes coming from each decile and OASDI benefits going to each decile; the fourth column shows the benefits net of taxes going to each decile. For the population as a whole, more OASDI taxes were paid than benefits received, but for the bottom 6 deciles more benefits were received than taxes paid. Aggregate taxes paid (column 2) rise with each decile. Aggregate benefits received (col-umn 3) rise through the 5th decile and fall from the 5th through the 10th decile. Benefits net of taxes (column 4) rise through the third decile and fall through the remaining deciles.
Table 1 shows the percent shares by decile of taxes and benefits in columns 5 and 6. The share of taxes rises across the deciles, from 0.5 percent in the bottom decile to 28.0 percent in the top decile. This strong rise is attributable to a strong association between earnings and income combined with the uniform tax rate on earnings for all earnings less than the maximum taxable earnings. 6 The decile distribution of OASDI benefits has no such pattern. Above the bottom decile, which receives 2.6 percent of aggregate OASDI benefits, the percentage share of benefits rises and then falls.
The average taxes and benefits in each decile are shown in table 1, columns 7 through 9. The averages are taken for all families in each decile, including those who do not pay taxes or receive benefits; the average taxes and benefits shown in the table are therefore lower than if the averages were taken only among families with nonzero taxes or benefits. Because the deciles are calculated to have the same number of families in each decile, the
Social Security Bulletin Vol. 58, No. 2 Summer 1995 l l 22

averages in columns 7 through 9 are proportional to the aggregates in columns 2 through 4 and the percent distributions in columns 5 and 6.
Columns 10 through 12 of table 1 give the OASDI taxes, benefits, and bene- fits net of taxes as percents of CPS in- come. These measures can be used as indications of the progressivity of the taxes and benefits in the context of one year’s taxes and benefits. If the ratio of tax to income rises as income rises, the tax is called progressive; if the ratio falls as income rises the tax is called regres- sive, and if the ratio stays the same, the tax is calledproportional. The OASDI tax (column 10) is progressive as income rises from the 1st through the 9th deciles, and is regressive between the 9th and 10th deciles. ’ The overall progressivity of the OASDI tax is attributable to the growing proportion of earnings in income as income rises. Many of the families in the bottom deciles have no earnings and therefore pay no OASDI taxes.
One of the characteristics of a pro- gressive tax system is that after-tax in-come will typically be more equally dis-tributed, by some commonly used measures of income inequality, than before-tax income. A proportional tax would have no effect on the inequality of the income distribution, and a regres- sive tax would leave after-tax income less equally distributed. The concept of
progressivity can be extended to benefits by noting that if the ratio of benefits to income falls (rather than rises) as income rises, after-benefit income will be more equally distributed than before-benefit income. In this article, the term progres- sive will accordingly be applied to bene- fits when the ratio of benefits-to-income falls as income rises. According to table 1, column 11, the percentage ratio of benefits to income does fall from the 2nd through the 10th deciles. Over most of the income distribution, therefore, benefits can be considered progressive, supplementing the progressivity of the OASDI taxes.
The progressivity of combined OASDI benefits and taxes is measured using the ratio of benefits net of taxes to income. To be considered progressive, this ratio should fall as income rises. (It is possible for either the taxes or the benefits, but not both, to be regressive and yet for the combination, that is, the benefits net of taxes, to be progressive.) Column 12 of table 1, showing net bene- fits as a percent of family income, indi-cates that net benefits fall as a percent of income from the second through the ninth deciles, that net benefits as a percent of income are higher in the first decile than in any of the top seven deciles, and that net benefits as a percent of income are lower in the top decile than in any of the bottom eight deciles. On the whole,
therefore, combined OASDI taxes and benefits are progressive, although at the level of detail given by the decile-to- decile picture there is a lack of progres- sivity going from the 1st to the 2nd dec-ile and from the 9th to the 10th decile.
The paucity of OASDI benefits in the bottom decile is attributable to Social Security’s success at keeping OASDI beneficiaries out of extreme poverty. Because entitlement to Social Security tends to lift families out of the bottom decile, the bottom decile is populated largely by families not eligible for Social Security benefits.
A more useful picture, perhaps, is gained by classifying families according to their pre-OASDI income, which is slightly higher than CPS income for workers (because of the inclusion of the employers’ share of payroll taxes) but lower than CPS income for beneficiaries (because of the exclusion of benefits). The results of tabulating OASDI taxes and benefits according to pre-OASDI income deciles are shown in table 2. For the distribution of taxes (column 5), the picture is little different from that of table 1. For the distribution of OASDI benefits, however (column 6), the picture is strikingly different. The bottom decile now receives 24 percent of aggregate benefits, and the percentage declines through the higher deciles except for a slight rise in the top decile. The bottom
Table 1 .-OASDI taxes and benefits, by family income decile
Decile income range
Decile (1)
Total.. .......... Bottom............... $I- $6,i$2 2nd.. ................. $6,263-$10,527 3rd ..................... $10,528$15,199 4th.. ................... $15,200-$20,321 5th.. ................... $20,322-$26,068 6th ..................... $26,069-$32,931 7th ..................... $32,932~$40,898 8th.. ................... $40,899-$51,844 9th .................... $51,845~$70,065 Top.. .................. $70,066 or more
See notes to the tables on page 32.
Aggregate amounts -- Average amounts As percent of family income
Percent distribution by
Billions of dollars decile
Net Net Net Taxes Benefits benefit Taxes Benefits Taxes Benefits benefit Taxes Benefits benefit
(2) (3) (4) (3 (6) (7) (8) (9) (10) (11) (12) $311.1 $286.0 -$25.1 100.0 100.0 $2,823 $2,595 -$228 8.0 7.4 -0.6
1.5 7.4 S.9 3 2.6 137 671 S33 4.3 20.9 16.6 4.7 32.3 27.5 I.5 11.3 427 2,910 2,484 5.1 34.6 29.6 9.2 37.2 28.0 3.0 13.0 844 3,406 2,563 6.6 26.5 19.9
14.6 37.8 23.2 4.7 13.2 1,325 3,434 2,109 7.5 19.4 11.9 20.2 38.1 17.9 6.5 13.3 1,834 3,464 1,630 7.9 14.9 7.0 26.7 3S.4 8.8 8.6 12.4 2,424 3,219 795 8.2 11.0 2.7 35.8 30.8 -5.0 Il.5 10.8 3,257 2,802 115s 8.9 7.6 -1.2 48.2 26.0 -22.2 15.5 9.1 4,379 2,358 -2,021 9.5 5.1 -4.4 62.9 21.1 41.7 20.2 7.4 5,711 1,921 -3,791 9.6 3.2 -6.3 87.2 19.8 -67.4 28.0 6.9 7,928 1,800 -6,128 6.8 1.6 -5.3
l lSocial Security Bulletin Vol. 58, No. 2 Summer 1995 23

five deciles receive more in benefits than they pay in taxes, while the top five pay more in taxes than they receive in bene- fits. Measured as a percent of pre-OASDI income, benefits (column 11) now show a continuous fall through the full range of deciles, and net benefits as a percent of income (column 12) fall through all but the very top decile.
Distribution by Person Pre-OASDI Income Deciles
To extract patterns of OASDI taxes and benefits for different age groups, it is useful to shift the unit of analysis from families to persons. The use of person income, rather than family income, has two effects. First, the income of members of couples is halved, tending to move couples down in the income distribution relative to nonmarried individuals. Sec-ond, the incomes of multiple subunit families are split up, reranking some of the family subunits down in the income distribution relative to individuals or single-unit families. In particular, a substantial fraction of the elderly in the population who live with their adult children will be treated as units on their own, with, typically, much lower incomes than when combined with the rest of the Census family. 8
Nevertheless, although the average pre-OASDI income per unit is lower under the new definition, the percentiles that define the income deciles also shift downward, so that the distribution of OASDI taxes and benefits by decile is similar to that calculated for families. Table 3 for persons ranked by pre-OASDI person income corresponds to table 2 for pre-OASDI family income; the percent distribution of taxes and benefits (col-umns 5 and 6) is similar in the two tables. The person definition of units will be used for the remainder of this article. y
Much of the distribution by income decile of OASDI taxes and benefits can be attributed to patterns of income by age. Table 4 tabulates persons by 5-year age groups (with all persons 80 or older put into one age group), giving the aver- age pre-OASDI income, taxes, and bene- fits for each age group along with the percent in each age group paying OASDI taxes or receiving OASDI benefits. The percent paying taxes (column 6) is high from the 20’s through the early 50’s then falls to very low values in the late retire- ment ages. Average incomes and average taxes paid rise through the late 40’s and then fall. The percent receiving benefits (column 7) is low through the pre-retire- ment ages, then rises in the late 50’s and early 60’s to 90 percent or more for every
Table 2.-OASDI taxes and benefits, by family pre-OASDI income decile
group aged 65 or older; the average bene- fit by age group (column 4) shows a similar pattern.
Much of the observed progressivity in OASDI taxes and benefits with respect to pre-OASDI income can be attributed to the fact that incomes are, on average, higher during the ages in which OASDI taxes are paid and lower during the ages in which benefits are received. Progres- sivity in OASDI taxes would be observed even if the OASDI tax were applied to all earnings at a uniform rate, because the higher income deciles would contain a progressively higher proportion of tax- paying earners and a lower proportion of nontaxpaying beneficiaries. Similar considerations apply to benefits: there are few aged persons in the upper deciles, and many in the lower deciles, so that the average benefit per decile, the share re- ceived by decile, and the average benefit as a percent of income would be higher in the lower deciles even if every benefi- ciary received the same benefit.
But not all of the observed progres- sivity can be attributed to age patterns. At any given age in the pre-retirement years, it is possible that nonworkers rely- ing on sources of income other than earn- ings will be more commonly found in the lower deciles, which would generate progressivity in the OASDI tax below the
As percent of family 7 Aggregate amounts / Average amounts pre-OASDI income
De’:l;Fm Decile
Total. .~. i., Bottom., ;;.__.._ $0~$2,22$ 2nd .,.........,... .“__ $2,227~$6,959 3rd .II_.___‘ $6,960~$12,163 4th .._.._~.<!12,164-$17,882 jth..... . ..__....., .,,. 617,883-$24,512‘ 6th.. .1.. 624,j 13-$3 1,758 7th . . . . . . . . . . ~.~.;~.. !63 1,759-$40,876 8th . .._.._.,.,,..,i..._. ‘ 640,877-$52,842 9th . .._.._....,.,__. ‘ 652,843-$72,097no.. Top . .._.~..._.~.. ~,.. $72,098 or more Seenotesto the ti blt?:s on page 32.
$311.1 $286.0 -$25.1 100.0 100.0 $2,823 $2,595 -$228 8.3 7.6 -0.7 .2 67.2 67.0 .l 23.5 15 6,105 6,090 2.5 1,064.4 1,061.9
1.9 46.5 44.5 .6 16.3 177 4,226 4,049 3.9 93.3 89.4 6.6 40.0 33.3 2.1 14.0 601 3,630 3,029 6.4 38.4 32.1
13.1 32.7 19.6 4.2 11.4 1,189 2,970 1,781 8.0 19.9 11.9 20.2 24.6 4.5 6.5 8.6 1,834 2,240 405 8.7 10.6 1.9 27.4 20.6 -6.8 8.8 7.2 2,491 1,873 -618 8.9 6.7 -2.2 36.6 17.0 -19.6 11.8 5.9 3,331 1,547 -1,784 9.2 4.3 -4.9 49.7 14.6 -35.1 16.0 5.1 4,516 1,325 -3,191 9.7 2.8 -6.9 65.7 9.8 -55.9 21.1 3.4 5,973 893 -5,080 9.8 1.5 -8.3 89.7 12.4 -77.3 28.8 4.4 8,149 1,128 -7,02 1 6.9 1.0 -5.9
Social Security Bulletin Vol. 58, No. 2 Summer 1995 l l 24

taxable maximum. Benefits, which at those ages are paid to disabled workers and their families and to the survivors of deceased workers, are also likely to be more commonly found in the lower deciles, generating progressivity in benefits as a percent of income. In the transitional ages when some persons are retired and some are not, taxes will be associated with nonretirement and the upper deciles, benefits with retirement and the lower deciles. Finally, in the age groups when most persons are retired, although it would not be surpris- ing to find that average benefits increase with nonben-efit income, it seems unlikely that benefits as a percent of income would increase, because the Social Security benefit formula is de- signed to pay higher benefits, but not proportionately higher, to those with higher average earnings histories. Even if there is a positive correlation between average earnings before retirement and non-Social Security income after retire- ment, leading to a positive correlation during retirement between benefits and nonbenefit income,we would expect the relationship between benefits and non- benefit income to be progressive, with the ratio of benefits to nonbenefit in-come falling as nonbenefit income rises.
The final tabulations for this article, accordingly, look at the distributions of OASDI taxes and benefits by age- specific, pre-OASDI income distribu-tions. Income-receiving persons are divided into 5-year age groups and in- come percentiles are calculated for each age group. An overall picture of the effects of OASDI on the income distri-bution by age can be obtained by com- paring the pre-OASDI and post-OASDI percentiles (tables 5 and 6). The lOth, 50th, and 90th percentiles are plotted in chart 1. In charts 1 and 2, the horizontal axis, showing age, is adjusted to reflect the number of persons in each age inter- val, so that each inch on the horizontal axis represents an approximately equal number of persons. At older ages, when much of each age cohort is deceased, the age intervals shrink accordingly.
The impact of OASDI benefits on the income distribution at older ages can
be seen clearly in chart 1. The relative persons at the reranked 10th percentile difference is most dramatic in the bottom is eliminated. deciles. The 10th percentile of pre- Using the age-specific, pre-OASDI OASDI income is zero for the group income percentiles, each age group is aged 70-74 or older, meaning that at least divided into 10 age-specific deciles, and 10 percent of persons aged 70 or older for each age-specific decile in each age have no income other than OASDI bene- group the average taxes, benefits, and net fits. When OASDI benefits are added benefits ( tables 7,8, and 9) and taxes, and taxes subtracted, the strong decline in benefits, and net benefits as a percent of incomes with age is ameliorated, and the pre-OASDI income (tables 10, 11, and decline in incomes with age among 12) are tabulated.
Chart I.--Age-specific income percentiles, 1992-lOth, 50th, and 90th percentiles
Incomes
$5O,OOcl
$30,000
50th percentile
$10,000 10th percentile
$0
15 20 25 30 35 40 45 50 55 60 65 70 75 80
Age
Source: Tables 5 and 6 of this article.
Social Security Bulletin Vol. 58, No. 2 Summer 1995l l 2.5
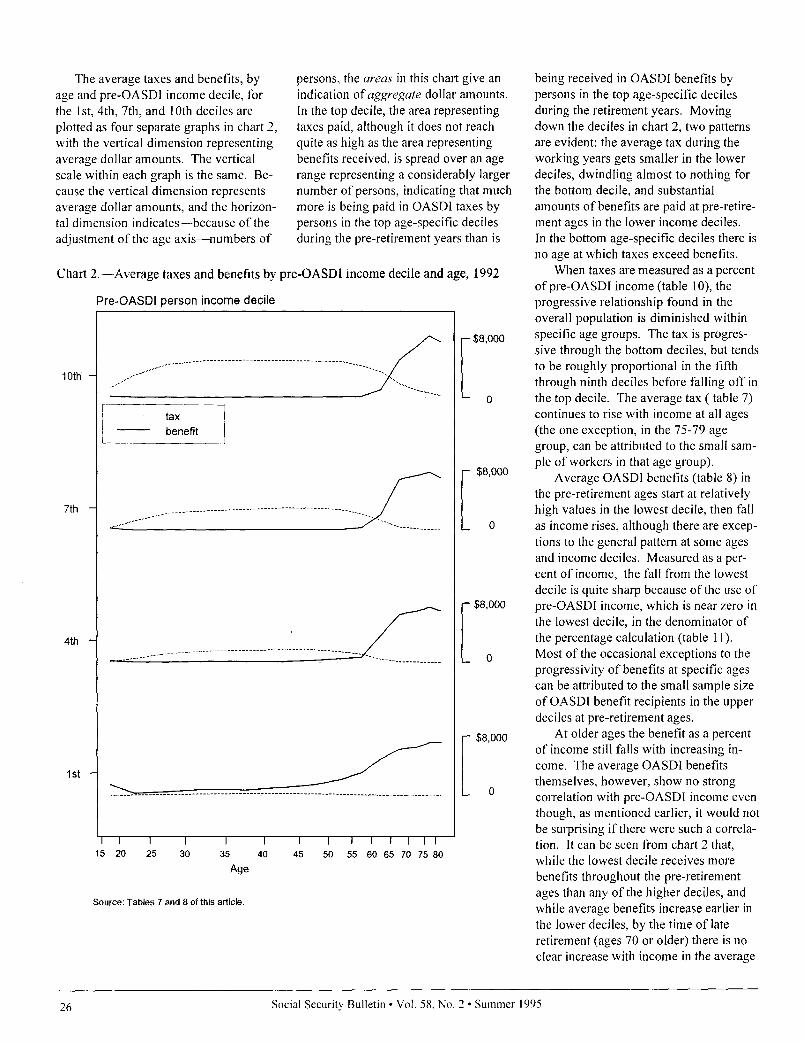
The average taxes and benefits, by persons, the ureas in this chart give an age and pre-OASDI income decile, for indication of aggregate dollar amounts. the lst, 4th, 7th, and 10th deciles are In the top decile, the area representing plotted as four separate graphs in chart 2, taxes paid, although it does not reach with the vertical dimension representing quite as high as the area representing average dollar amounts. The vertical benefits received, is spread over an age scale within each graph is the same. Be- range representing a considerably larger cause the vertical dimension represents number of persons, indicating that much average dollar amounts, and the horizon- more is being paid in OASDI taxes by tal dimension indicates-because of the persons in the top age-specific deciles adjustment of the age axis-numbers of during the pre-retirement years than is
Chart 2.--Average taxes and benefits by pre-OASDI income decile and age, 1992
Pre-OASBI person income decile
$8,000
10th
0
tax
benefit I
$8,000
7th
0
$8,000
4th
0
$8,000
0
I I I I I I I I I IIII 15 20 25 30 35 40 45 50 55 60 65 70 75 80
&le
Source: Tables 7 and 8 of this article.
being received in OASDI benefits by persons in the top age-specific deciles during the retirement years. Moving down the deciles in chart 2, two patterns are evident: the average tax during the working years gets smaller in the lower deciles, dwindling almost to nothing for the bottom decile, and substantial amounts of benefits are paid at pre-retire- ment ages in the lower income deciles. In the bottom age-specific deciles there is no age at which taxes exceed benefits.
When taxes are measured as a percent of pre-OASDI income (table IO), the progressive relationship found in the overall population is diminished within specific age groups. The tax is progres- sive through the bottom deciles, but tends to be roughly proportional in the fifth through ninth deciles before falling off in the top decile. The average tax ( table 7) continues to rise with income at all ages (the one exception, in the 75-79 age group, can be attributed to the small sam- ple of workers in that age group).
Average OASDI benefits (table 8) in the pre-retirement ages start at relatively high values in the lowest decile, then fall as income rises, although there are excep- tions to the general pattern at some ages and income deciles. Measured as a per- cent of income, the fall from the lowest decile is quite sharp because of the use of pre-OASDI income, which is near zero in
the lowest decile, in the denominator of the percentage calculation (table 11). Most of the occasional exceptions to the progressivity of benefits at specific ages can be attributed to the small sample size of OASDI benefit recipients in the upper deciles at pre-retirement ages.
At older ages the benefit as a percent of income still falls with increasing in- come. The average OASDI benefits themselves, however, show no strong correlation with pre-OASDI income even though, as mentioned earlier, it would not be surprising if there were such a correla- tion. It can be seen from chart 2 that, while the lowest decile receives more benefits throughout the pre-retirement ages than any of the higher deciles, and while average benefits increase earlier in the lower deciles, by the time of late retirement (ages 70 or older) there is no clear increase with income in the average
Social Security Bulletin Vol. 58. No. 2 Summer 1995l l 26

benefit. This lack of strong correlation is pre-retirement earnings and postre- or to spend down non-OASDI sources a puzzle that remains to be explained. tirement non-OASDI income might of income. lo There are several possible nonexclusive be subject to considerable individual The age-specific effects on net bene- explanations. The link between pre- variation in savings or pension behavior fits (average net benefits, table 9, and net retirement earnings and postretirement or investment returns, which would benefits as a percent of income, table 12) benefits might have been weakened weaken the correlation. Finally, any are equal to the effects on benefits minus by the relatively low maximum taxable indirect link between OASDI benefits the effects on taxes. At younger ages, the earnings that existed during part of the and non-OASDI income might be partly strong progressivity of the benefits going working career of many of those now counteracted if persons with high Social from the bottom decile to the second and retired. The presumed link between Security benefits are better able to retire third deciles reinforces the weak progres-
Table 4 .-OASDI taxes and benefits, by person pre-OASDI income decile
Decide in~~~~~~~~~~ I I Net
Decile (1) (2; (3) (4) (5; (6) (7; Total ............. $311.1 $286.0 -$25.1 100.0 loo.0 $1,610 8.3 7.6 -0.7
Bottom............... $0~$1,;;; .3 76.3 76.0 .l 26.7 14 3,955 3,941 4.4 1,205.l 1,200.8 2nd.................... $1,224~$4,166 2.6 53.3 50.7 .8 18.6 135 2,765 2,630 5.1 103.2 98.1 3rd..................... !$4,167-$ 7,322 6.8 42.7 35.9 2.2 14.9 353 2,213 1,860 6.2 38.6 32.5 4th.. ................... $7,323-$10,976 13.4 34.9 21.5 4.3 12.2 696 1,812 1,117 7.6 19.9 12.2 5th.. ................... %10,977-$14,958 21.2 23.7 2.5 6.8 8.3 1,098 1,229 130 8.5 9.5 1.0 6th ..................... 314,959-$19,117 29.6 17.0 -12.6 9.5 5.9 1,534 881 -653 9.1 5.2 -3.9 7th ..................... 319,118-$23,821 39.3 11.7 -27.7 12.6 4.1 2,040 606 -1,434 9.6 2.8 -6.7 8th ..................... $23,822-$29,688 49.8 8.0 -41.7 16.0 2.8 2,580 417 -2,163 9.7 1.6 -8.1 9th.. ................... $29,689-$39,638 62.8 7.1 -55.7 20.2 2.5 3,260 369 -2,890 9.6 1.1 -8.5 Top.. .................. $39,639 or more 85.3 10.5 -74.8 27.4 3.7 4,417 544 -3,874 6.8 .8 -6.0
See notes to the tables on page 32.
Table 1.--Pre-OASDI person income, taxes, and benefits, by age group
Average dollar amount over all persons in age group’
Number of persons
(in millions) pre-~~~ A\;? taxi Fi ~~rc~~
Age (1) All per&ns. 193 $19,430 $1,610 $1,480 -$130- 75 22
15-19 . . . . ~...~_~;I1~ 10 3,272 308 323 15 74 7 20-24.. _. . 17 10,705 1,074 40 -1,035 86 1 25-29 . . . . . . . . . . . . . . . . . 20 18,243 1,868 85 -1,783 90 2 30-34... . . . . . . . I~ 23 21,998 2,177 127 -2,049 91 2 35-39 .....“I.... 22 25,373 2,329 189 -2,140 91 3 40-44.. . . . 19 27,074 2,410 217 -2,192 91 4
4549..SO-54 ,._. _.~..,~_.... __........_.... 13 28,150 2,219 288 -1,790 8916 27,365 2,425 429 -2,137 87 i 55-59 11 24,435 1,771 817 -953 79 16 60-64.. ..;.n 11 19,162 1,122 2,730 1,608 62 49 65-69 . . . . . . .i ..” _. 10 13,262 406 6,261 S9855 32 90 70-74 . _“..“n. .“. 9 9,821 190 6,943 6,753 19 94 7579..... (.,..“” 6 8,509 92 7,610 7,517 10 95 80 or older... ,. 7 6,624 42 7,315 7,273 5 95
’ Average is taken over all persons in age group with nonzero CPS income.
See notes to the tables on page 32.
Social Security Bulletin Vol. 58, No. 2 Summer 1995 l l 27

Table 5.---Age-specific pre-OASDI person income percentiles .__-- .__
Percentile -_-20th 30th 40th T50th 70th 80th 90th ~--. ____
$4,167 $7,323 $10,977 $14,959 $19,118 $23,822 $29,689 $39,639 15-19 .........~..I, 413 827 1,296 2,033 2,751 3,761 5,147 7,635 20-24.. I.. _. 25-29 .i... . . . . ’ ’ ’
3,372 5,082 6,768 7,623 10,344 13,399 ’
8,639 10,688 13,315 16,269 19,447 22,811
16,632 27,282
21,651 33,466
30-34... 9,271 12,870 16,174 19,312 22,699 26,426 30,836 39,417 35-39 ..~...._._. 10,462 14,348 18,117 21,507 25,155 29,240 34,663 44,457 40-44.... . . 6,049 11,180 15,323 19,254 22,978 27,029 31,386 37,481 46,518 45-19 . . . . . . . . . . . 5,853 10,846 15,297 19,931 23,709 27,827 32,656 39,157 50,327 SO-54 _.,......_,... 4,646 9,245 13,610 17,786 21,833 26,163 3 1,220 38,086 49,628 55-59 _......_,....I 3,014 7,180 11,292 15,144 18,889 23,018 27,545 33,894 45,933 60-64.. i. 1,011 3,936 6,805 9,714 13,339 16,975 21,763 28,221 39,757 65-69 . . . . . . ._.... 69 1,406 3,214 5,089 7,275 9,928 13,276 18,501 28,650 70-74.. i. 0 727 1,975 3,659 5,440 7,341 10,404 14,821 22,672 75-79 . . . . . . . 0 289 1,132 2,294 3,909 5,799 8,140 12,446 19,897 80 or older...... 0 48 520 1,228 2,388 3,916 6,180 9,610 17,510 -__-.-- ~_... .~ -- -___ See notes to tbe tables on page 32.
Table 6.-Age-specific post-OASDI person income percentiles--.~-.---T- ~-.- .~__ -______--.. -
L--- Percentile
40thl ‘_60th/--- 7otl/jOthi ----dF
80th
$3,568 $6,497 $9,157 $12,036 $15,082 $18,404 $22,444 $27,427 $36,358 15-19 ,.__... .,.... 139 529 898 1,431 2,047 2,738 3,872 5,350 7,796 20-24.. _. _, 1,527 3,155 4,620 6,284 7,931 9,724 11,908 14,957 19,333 25-29 . . . . . . . . . . . . . 4,219 7,142 9,508 12,119 14,542 17,477 20,329 24,303 29,780 30-34 . . . . . . . . . . . . 5,250 8,568 11,670 14,396 17,392 20,309 23,541 27,836 35,247
5,825 9,672 13,136 16,402 19,376 22,509 26,320 31,418 40,147 4044 .“. 6,267 4549 .._...,,_...,, 6,199
10,548 10,386
14,202 14,364
17,516 18,107
20,817 21,546
24,272 25,208
28,302 29,676
33,798 35,543
42,167 45,919
50-54.. ._, ,. ,., 5,386 9,248 12,754 16,384 20,090 23,789 28,278 34,524 44,961 55-59 ...I_,,.__.,._ 5,040 8,169 11,401 14,695 17,954 21,469 25,613 31,421 42,567 60-64.. _. , _. 5,062 7,650 . 10,115 12,653 15,345 18,505 22,586 27,975 38,095
5,823 7,707 9,673 11,866 14,102 16,590 19,582 23,733 32,99 1 70-74.. . 5,679 7,46 1 9,159 10,887 12,671 14,979 17,697 21,751 29,797 75-79 . . . . . . . . . ..__ 5,529 7,163 8,493 10,198 11,990 14,144 16,648 20,659 28,593 80 or older...... 5,268 6,600 7,711 8,950 10,347 12,087 14,412 IS,23 1 25,580
___ See notes to the tables on page 32.
l lSocial Security Bulletin Vol. 58, No. 2 Summer 1995 28

Table 7.-Average OASDI tax, by age and age-specific pre-OASDI decile
Pre-OASDI dwile
Bottom 2nd 3rd 4th jth 6th T-~------- SGg 9tq Top All ages........ / $14 $335 $353 $696 $1,098 $1,534 $2,040 $2,580 $3,260 $4,417
15-19 T. . . . . . . . . ...’ 0 15 52 91 154 218 288 416 577 1,281 20-24 ,.,..,___. I_. I.1. 45 195 355 513 715 987 1,263 1,593 2,057 3,030 25-29 .......I........i... 126 470 851 1,190 1,572 1,874 2,284 2,675 3,173 4,481 30-34 ,........,” .,.~ 157 639 1,107 1,496 1,822 2,245 2,601 3,013 3,694 5,020 35-39 ,.,..,,.. 207 721 1,232 1,623 2,060 2,432 2,770 3,261 4,015 5,036 4044 “.” 202 739 1,260 1,685 2,133 2,524 2,983 3,402 4,212 5,010 4549 .........ll.ll....l. 179 755 1,262 1,710 2,356 2,580 2,971 3,514 4,266 4,921 50-54.. “.. 112 550 1,041 1,421 1,882 2,294 2,775 3,223 4,055 4,865 55-59 38 285 751 1,075 1,370 1,745 2,196 2,644 3,330 4,302 60-64 ..I. . i.. 2 80 251 407 656 921 1,278 1,868 2,270 3,527 65-69 ._..... 1 6 37 85 158 227 373 527 804 1,857 70-74 ,,,..,....” . . . i. 0 2 12 36 64 104 158 185 352 993 75-79 ,....,_ __.I__ .._.. 0 0 2 7 26 56 54 84 152 546 80 or older.. ..l.l..... 0 0 1 1 4 9 14 31 92 272
Note: Age-specific deciles are given in table 5. “.-UI ages” row is from table 3, using whole population deciles. Also see notes to the tables on page 32.
Table S.-Average OASDI benefit, by age and age-specific pre-OASDI decile
Pre-OASDI decile -Age Bottom 2nd 3rd 4th 5th 6th
-- 7th 8th I----7x
All ages..::. $3,955 $2,765 $2,213 $1,812 $1,229 $881 $606 $417 $544 15-19.. ........... ..... 1,424 193 140 201 187 247 276 214 222 156 20-24 ................... 231 70 16 26 3 13 4 3 10 20 25-29 ................... 476 118 92 40 26 40 16 1 21 19 30-34.. ................. 786 110 89 109 44 79 6 17 19 9 35-39.. ................. 675 399 107 140 91 77 53 51 19 39 40-44.. ................. 1,058 523 174 82 89 97 57 48 30 18 45-49 ................... 1,387 528 269 254 123 94 57 61 48 59 50-54 ................... 2,096 659 424 454 180 120 34 134 95 96 55-59.. ................. 3,025 1,213 1,317 656 638 469 309 234 183 129 60-64 ................... 4,915 4,469 . 3,593 3,688 2,786 2,400 2,069 1,194 1,160 1,055 65-69.. ................. 6,219 6,352 6,611 6,504 6,896 6,856 6,852 5,772 5,471 5,095 70-74 ................... 6,498 6,933 7,073 6,917 7,074 7,129 7,344 7,198 6,513 6,819 75-79.. ................. 7,115 7,086 7,461 7,43 1 7,198 7,484 7,802 8,112 8,025 8,345 80 or older .......... 7,108 7,118 7,153 6,970 7,335 7,436 7,050 7,639 7,766 7,552
Note: Age-specific deciles are given in table 5. “All ages” row is from table 3, using whole population deciles. Aso see notes to the tables on page 32.
Social Security Bulletin Vol. 58, No. 2 Summer 1995l l 29

___
Table 9.--Average OASDI net benefit. bx age and age-specific pre-OASDI decile
Pre-OASDI decile
Sthl Top -.-__--All ages. $3,941 $2,630 $1,860 $1,117 $130 -$653 -$2,163 -$2,890 - -$3,874
15-19 ..“... 1,424 178 88 111 33 30 -12 -202 -355 1,125
20-24. 186 -125 -339 -487 -712 -974 -1,260 -1,590 -2,047 -3,010 25-29 351 -352 -759 -1,150 -1,546 -1,834 -2,268 -2,674 -3,151 4,462
30-34 ,,.. 628 -529 -1,017 -1,387 -1,778 -2,166 -2,595 -2,997 -3,675 -5,011 35-39 ._.. 468 -322 -1,125 -1,484 -1,969 -2,355 -2,717 -3,210 -3,996 -4,998 4044.. 855 -217 -1,086 -1,602 -2,045 -2,427 -2,926 -3,354 -1,182 -4,991 45-49 1,208 -228 -993 -1,456 -2,033 -2,486 -2,914 -3,452 -4,218 -4,862 50-54... .._ 1,984 110 -616 -968 -1,702 -2,173 -2,74 1 -3,089 -3,961 4,769 55-59 ,..,.,,.,,. .._ 2,987 928 566 -419 -732 -1,276 -1,887 -2,410 -3,147 4,172 60-64. ._. 4,913 4,390 3,342 3,281 2,129 1,480 790 -674 -1,110 -2,472
65-69. ._._ 6,218 6,346 6,574 6,419 6,738 6,629 6,478 5,245 4,667 3,237 70-74.. 6,498 6,93 1 7,061 6,881 7,010 7,024 7,186 7,012 6,161 5,825 75-79 ..___.__. 7,115 7,086 7,458 7,424 7,173 7,428 7,748 8,029 7,872 7,799 80 or older.. I. “. “. 7,108 7,118 7,153 6.969 7.331 7,428 7,037 7,608 7,674 7,280
Note: Age-specific deciles are given in table 5. “AI ages” row is from table 3, using whole population drciles.
Also see notes to the tables on page 32.
Table IO.--0ASDI tax as percent of pre-OASDI income, by age and age-specific pre-OASDI income decile -I ~~~~-..--~
Pre-OASDI income decile
Age Bottomi 2ndl irT-?th 5thl --T---7tl,l-- 8+~~~~~?<- bob
All ages~~ -I ~-.- 4.4 5.1 6.2 7.6 8.5 9.1 9.6 9.7 9.6 6.8 15-19 ..,......_ ~ 2.2 6.7 8.3 8.6 9.1 9.1 9.0 9.3 9.2 9.9 20-24 1 7.0 7.7 8.3 8.6 9.3 10.2 10.5 10.6 10.8 10.0 25-29.. 6.1 7.9 9.4 10.0 10.6 10.5 10.9 10.7 10.6 10.0 30-34 ~ 6.2 8.8 9.9 10.3 10.3 10.7 10.6 10.6 10.7 8.6 35-39 .,_ 1 6.8 8.9 9.9 10.0 10.4 10.4 10.2 10.3 10.3 6.8 4044 6.6 8.6 9.4 9.7 10.1 10.1 10.2 10.0 10.1 6.4 4549 ...“. ., 6.7 8.9 9.5 9.6 9.9 10.0 9.8 9.8 9.7 6.0 50-54 .“... ‘: ! 5.8 7.9 9.1 9.1 9.5 9.5 9.7 9.4 9.4 5.5 55-59. __.... i 3.7 5.5 8.1 8.2 8.1 8.4 8.7 8.6 8.5 5.2 60-64.. 1.0 3.3 4.7 4.9 5.7 6.1 6.7 7.5 6.9 4.9 65-69 ._ (1) .9 1.7 2.1 2.6 2.6 3.3 3.4 3.5 3.0 70-74 1 (I) .7 .9 1.3 1.4 1.7 1.8 1.5 1.9 2.3 75-79 ..,. ~ (1) “I .3 .4 .8 1.2 .8 .8 1.0 1.380r.et(‘er:-L1 ~~..~~T--~ .3 .________~ .2 .3 .7ml, :I- ..~ .3 .8.l .4
’ Deciles in which all or most incomes are zero.
Note: Age-specific deales are gix-en in table 5. “Al ages” row is from table 3, using whole population deciles
;\lso set: note: to the tables on page 32.
Social Security Bulktin Vol. 58. No. 2 Sunltner 1995l l 30

Table 11 .-OASDI benefit as percent of pre-OASDI income, by age and age-specific pre-OASDI income decile
Pre-OASDI income decile ~-- -~-~
Age Bottom 2nd 3rd 4th 5th 6th 7thl 8th 9th Top All ages ........ 1,205.l 103.2 38.6 19.9 9.5 5.2 2.8 1.6 1.1 0.8
15-19 .................. (1) 86.7 22.3 19.2 11.0 10.3 8.6 4.8 3.6 1.2 20-24.. ............. “_, 35.9 2.8 .4 .4 .O .I .O .O .I .l 25-29.. ............ .... 23.1 2.0 1.0 .3 .2 .2 .l .O .l .O 30-34.. ................. 30.7 1.5 .8 .7 .2 .4 .O .l .l .O 35-39.. ................. 22.4 4.9 .9 .9 .3 .2 .2 .O .I 4044.. ................. 34.6 6.1 1.3 :i .4 .2 .l .I .O 45-49 .................. 51.7 6.2 2.0 1:: .6 .4 .-7 .2 .I .I 50-54. .................. 109.1 9.5 3.7 2.9 .9 .l .4 .2 .I 55-59.. ................. 297.5 23.3 14.2 5.0 3.8 2:; 1.2 .8 .5 .2 60-64.. ................. (1) 186.4 66.7 44.7 24.1 15.9 10.8 4.8 3.5 1.5 65-69.. ................. (2) 951.2 292.7 157.3 113.0 79.9 59.8 36.9 24.0 8.3 70-74.. ................. (2) (1) 537.2 249.9 158.2 113.0 84.2 57.7 35.9 15.5 75-79.. ................. (2) (1) (1) 448.1 232.0 155.5 113.9 80.5 51.1 19.7 80 or older ............ (2) (2) (1) 833.1 417.6 236.5 141.4 98.0 59.5 21.9
r Deciles in which incomes are so small that the percentage ratio is greater than 1,000. 2 Deciles in which all or most incomes are zero.
Note: Age-specific decides are given in table 5. “All ages” row is from table 3, using whole population deciles. Also see notes to the tables on page 32.
Table 12.-OASDI net benefit as percent of pre-OASDI income, by age and age-specific pre-OASDI decile
Pre-OASDI income decile
Age Bottom / 2ndl 3rdl 4th/ 5th 6thj 7th T---- 9th Top/ I I 1 - /
All ages ........ 1,200.8 98.1 32.5 12.2 1.0 -3.9 -6.7 -8.1 -8.5 -6.0 15-19.. ................. (1) 80.0 14.0 10.5 1.9 1.2 4 -4.5 -5.7 -8.7 20-24. .................. 28.9 -4.9 -7.9 -8.2 -9.3 -10.0 -1015 -10.6 -10.8 -9.9 25-29.. ................. 17.0 -5.9 -8.4 -9.6 -10.4 -10.2 -10.8 -10.7 -10.5 -10.0 30-34 ................... 24.6 -7.3 -9.1 -9.5 -10.0 -10.3 -10.6 -10.5 -10.6 -8.6 35-39.. ................. 15.5 -4.0 -9.0 -9.1 -10.0 -10.1 -10.0 -10.1 -10.2 -6.8 4044.. ................. 28.0 -2.5 -8.1 -9.2 -9.7 -9.7 -10.0 -9.8 -10.0 -6.4 4549.. ................. 45.1 -2.7 -7.4 -8.2 -9.3 -9.6 -9.7 -9.6 -9.6 -5.9 50-54.. ................. 103.3 1.6 , -5.4 -6.2 -8.6 -9.0 -9.6 -9.0 -9.2 -5.4 55-59.. ................. 293.8 17.9 6.1 -3.2 4.3 -6.1 -7.5 -7.9 -8.0 -5.0 60-64.. ................. (1) 183.1 62.0 39.8 18.5 9.8 4.1 -2.7 -3.4 -3.4 65-69 ................... (2) 950.3 291.1 155.2 110.5 77.3 56.6 33.6 20.5 5.3 70-74.. ................. 0) (1) 536.3 248.7 156.8 111.4 82.4 56.2 34.0 13.3 75-79 ................... (2) (1) (1) 447.7 231.2 154.4 113.1 79.7 50.2 18.4 80 or older.. .......... (2) (2) (1) 833.0 417.4 236.1 141.1 97.6 58.8 21.1
’ Deciles in which incomes are so small that the percentage ratio is greater than 1,000.
* Deciles in which all or most incomes are zero.
Note: Age-specific deciles are given in table 5. “All ages” row is from table 3, using whole population deciles Also see notes to the tables on page 32.
l lSocial Security Bulletin Vol. 58, No. 2 Summer 1995 31

sivity of the tax in the bottom deciles. In the upper deciles at younger ages the near absence of benefits causes the net benefit pattern to reflect the approximate proportionality of the tax at those ages in the third through the ninth deciles. Going from the 9th to the 10th decile, the net benefit as a percent of income is, like the tax, regressive. At the older ages, the relative absence of OASDI taxes causes the net benefit pattern to reflect the pattern of benefits at those ages, progressive at all income levels.
OASDI taxes and benefits, then, continue to have a slight progressive effect even within specific age groups, although not as large an effect as when looking at all ages combined. The l-year cross-sectional data cannot be pushed much farther than this; in particular, they cannot be used to answer questions of the progressivity of lifetime OASDI taxes and benefits relative to lifetime income. Such questions can be settled conclu-sively only through detailed studies of lifetime histories of incomes and bene- fits (see the article by Leimer in this issue for an introduction to such studies). The observed progressivity of current OASDI net benefits at each age, however, is suggestive of a progressive relation between lifetime net benefits and life- time incomes.
Summary
The OASDI system of taxes and bene- fits has a substantial redistributive impact on current incomes that is summarized here. OASDI taxes are paid primarily by persons in the upper income deciles. Although specified as a proportional tax on earnings up to the maximum taxable earnings, the OASDI tax is progressive relative to income because an increasing proportion of income is attributable to earnings as income increases. Many per-sons with no earnings in the lower deciles are the retired aged, so that the overall progressivity of the OASDI tax is partly attributable to an age effect: the relatively young workers who pay the tax tend to have higher incomes than the relatively old retirees who receive the benefits and as nonworkers are exempt from the tax. Nevertheless, even among working-
aged persons, the OASDI tax is weakly progressive, except at higher incomes.
OASDI benefits are received pri-marily by persons in the lower income deciles. Again, this is partly an age ef- fect: the old-age beneficiaries, who are the preponderant recipients of benefits, are also preponderantly found in the lower deciles. But there is a marked progressivity found even at specific ages. Among persons of working age,the target populations insured under OASDI-disabled workers, their families, and the families of deceased workers-are much more likely to be found in the lower deciles, so that in the lower deciles aver-age benefits as well as the ratio of benefit to nonbenefit income will be higher. Among persons in the transitional ages between work and retirement, benefits are associated not only with disability or early survivorship but also with earlier retirement, again leading to higher aver-age benefits, and a higher ratio of benefit to nonbenefit income, in the lower in-come deciles. Finally, among retire-ment-aged persons, although there is no longer a decline in average benefits as nonbenefit income rises, there is still a strong decline in benefits as a percent of nonbeneftt income.
References
Board of Trustees, Federal Old-Age and Survivors Insurance and Disability Insur-ance Trust Funds. 1994 Annual Report of the Board of Trustees of the Federal
Old-Age and Survivors Insurance and Disability Insurance Trust Funds. Com-munication to the 103rd Cong., 2nd sess., 1994. H. Dot. 231.
Leimer, Dean R. “A Guide to Social Security Money’s Worth Issues.“Social Security Bulletin, Vol. 58, No. 2 (Summer), pp. 3-20 (this issue).
Pattison, David, and David E. Harrington. 1993. “Proposals to Modify the Taxation of Social Security Benefits.” Social Securi-ty Bulletin, Vol. 56, No. 2 (Summer), pp. 3-21.
Wixon, Bernard, Benjamin Bridges, Jr. , and David Pattison. 1987. Policy Analysis through Microsimulation: The STATS Model.” Social Security Bulletin, Vol. 50, No. 12 (December), pp. 4-12.
Notes to the Tables
Persons and families whose CPS incomes are zero or negative are excluded from the percentile calculations and decile tabulations for tables I, 2, 3: IO, 11, 12 and tables 5, 6, 7, 8, and 9. It is possible, however, to have positive OASDI taxes or benefits and still have a negative CPS income; such families or persons, while excluded from the tabulation by decile, are included in the “total” line in tables I, 2, and 3.
Persons or families with only Social Security income will have a positive CPS income but a pre-OASDI income of zero. Such units are included in the pre-OASDI percentile calculations and decile tabula-tions for tables 2, 3, IO, 11, and 12 and tables 5, 6, 7, 8, and 9, as well as in the “total” line in tables 2 and 3.
A very small number of persons or families have a positive CPS income but a negative pre-OASDI income. These units, unlike the units with a zero pre-OASDI income, are excluded from the pre-OASDI percentile calculations and decile tabula-tions for tables 2, 3, 10, I I, and I2 and tables 5, 6, 7, 8, and 9. They are included in the “total” line in tables 2 and 3.
For the age-specific pre-OASDI person income deciles at ages 70 or older-for which the 10th percentile is zero dollars-some of the persons with pre-OASDI incomes of zero are randomly assigned to the 2nd decile, rather than the I st, in order to arrive more closely at an even division into IO percent of persons in each income decile.
Notes
Acknowledgments: The author would like to thank Ben Bridges, Dean Leimer, and Daniel Radner for their numerous helpful comments.
’ The annual March CPS is a source for official statistics on poverty and on family and person income.
* The simulation of wage and self- employment taxes is done using the Simu- lated Tax and Transfer System (STATS) micro-simulation program (described in Wixon, and others, 1987). The simulation includes a determination, using industry and occupation codes on the CPS, of whether each worker’s earnings are cov- ered, and, if covered, of the OASDI tax applied to the worker’s earnings. For
l lSocial Security Bulletin Vol. 58, No. 2 Summer 1995 32

self-employment earnings, the self-employ- ment tax is calculated; for wage and salary earnings, both the employee and employer portions are calculated.
’ For distributional analysis of the effects of OASDI taxes, it is necessary to allocate the burden of both the employee and employer portions of the OASDI payroll tax. The sim- plest procedure is to assume that each worker bears a burden equal to the combined em-ployee and employer taxes on his or her carn-ings. Some of the burden of the combined portions might not be borne directly through reductions in each worker’s earnings net of tax, but might be borne more indirectly through, for example, higher prices on con-sumption goods, the distributional effects of which often would be harder to estimate. Many economists have concluded, however, that the assumption that the combined burden is borne by the worker is plausibly close to the truth.
’ For various reasons, average and aggre- gate income on the CPS do not exactly match corresponding averages or aggregates calcu-lated from other sources of data. In the data tabulated in this article, adjustments are made to some income components based on com-parisons in past years between average in-comes on Federal income tax returns and average incomes on tax returns simulated on the CPS. These adjustments are described in the appendix to Pattison and Harrington (1993). The adjustments have small effects on the distributions reported in this article, but do not affect the qualitative nature of the results.
In addition, a set of small scaling adjust-ments is made to align the CPS-derived aggre-gate OASDI taxes and benefits with the his- torical aggregates for 1992. The aggregates used for alignment are the calendar year contributions and benefit payments for the combined operations of the OASI and DI Trust Funds, from the 1994 Annual Report of the Board of Trustees. The aggregate amounts were $3 11.1 billion in contributions and $286.0 billion in benefit payments. (The OASDI funds in 1992 received $25 billion more in contributions than was paid out in benefits.) To align the simulation aggregates with the administrative aggregates, two adjust-ments are made. First, all tabulation weights are scaled up by 4.11 percent; this uniform scaling of weights has no effect on averages or on percent distributions. Second, all OASDI taxes are scaled up by 0.78 percent, and all OASDI benefits are scaled down by 0.78 percent; these small adjustments are designed to bring aggregate taxes and benefits into alignment with minimal effect on average
incomes; the adjustments should have only small effects on the distribution of taxes or benefits. The purpose of these adjustments is to improve the net benefit estimates by align- ing the aggregate tax and benefit estimates with reliable aggregate information.
’ For the family income percentile calcula-tions and tabulations by decile, families whose CPS incomes are zero or negative are excluded. For the person income percentile calculations, adult units (single persons or married couples) whose CPS incomes are zero or negative are excluded, as are children under age 15. (If a child under age I5 is receiving OASDI benefits, and there is an adult in the household receiving the benefits on the child’s behalf, the CPS includes the child’s benefit income in the income of that adult.) Families or persons whose CPS in- come is entirely made up of OASDl benefits, and who therefore have a positive CPS in- come but a prc-OASDI income of zero, are included in the pre-OASDJ income percentile calculations and decilc tabulations. but the very small number of families or persons with positive CPS incomes but negative pre-OASDI incomes are excluded from the pre- OASDI income percentile calculations and decile tabulations,
’ The maximum taxable earnings in 1992 was $55,500. This lies within the 9th decile for family income and the 10th decile for person income, no matter which way family or person income is measured-CPS income, pre-OASDI income, or post-OASDI income.
’ The OASDI tax is sometimes called a regressive tax, because the tax as a percent of covered earnings is proportional, or non- progressive, for earnings up to the maximum taxable earnings, and is regressive above it. Distributional analysis, however, measures the ratio of taxes to total income, taxable and nontaxable, rather than the ratio to the tax base used on the nominal tax schedule that defines the tax. A uniform sales tax on food, for example, while nominally defined as a proportional tax on food expenditures, would in the broader sense used in distributional analysis be considered a regressive tax, since the ratio of food expenditures to income falls as income rises.
* For example: If a widow aged 70 with an income of $8,000 lives with her married daughter, whose income together with that of her husband’s is $40,000, the three would be classified under the family definition as one family with an income of$48,000, but under the person definition as three persons with incomes of $8,000. $20,000, and $20.000.
‘) Neither the family nor the person measure of income is fully satisfactory for determining a person’s economic status. When comparing couples with individuals, the person measure will understate the well- being of couples rclativc to individuals, since it does not take into account the economizing that a couple is able to achieve; the family measure, on the other hand, overstates the well-being of couples relative to individuals, The most widely used method of adjusting family incomes for family size, the Census family poverty line, was explicitly tailored to reflect economies of size for individuals and couples living at incomes near poverty and may therefore be inappropriate for use over the whole income distribution. When compar-ing persons who live on their own with per-sons who live with other members of their families. other problems arise. The person measure used here takes into account neither the household economies of living in a larger household nor the possible sharing of income among the subfamilies of the extended family The use of family income, on the other hand. would cause aged persons who are forced to economize by moving in with their children to be considered better off than aged persons who still have sufficient income to live on their own. Person income is used in this article because it allows a straightforward tabulaion of OASDI taxes and benefits by age of person.
“’ To the extent that workers who expect higher than average benefits feel they need to make less than average provision for non-OASDI retirement income, the use of pre- OASDI income in retirement as a measure of income is weakened. It seems unlikely, however, that the tendency for workers with higher earnings to save more for retirement would be overcome by a tendency to compcn- sate for higher OASDI benefits by reducing other savings. Nevertheless, this is one reason why studies of cross-sectional data like this article can only give suggestive indications of the lifetime consequences of OASDI taxes and benefits; definitive conclusions can be reached only through the study of life histories of earnings and savings.
l lSocial Security Bulletin Vol. 58, No. 2 Summer 1995 33