encana reports solid second quarter cash flow and ... · encana reports solid second quarter cash...
TRANSCRIPT

Encana reports solid second quarter cash flow and operating earnings
Calgary, Alberta (July 25, 2012) - Encana Corporation reported cash flow of $794 million or $1.08 per share and $198 million in operating earnings or $0.27 per share for the second quarter 2012. Year-to-date the company generated cash flow of approximately $1.8 billion or $2.47 per share and operating earnings of $438 million or $0.59 per share. The company’s commodity price hedging program contributed to a realized natural gas price of $4.79 per thousand cubic feet (Mcf) during the quarter, keeping Encana’s cash flow on track with the company’s Guidance for the year. Downward pressure continued on natural gas prices in the quarter which averaged $2.22 per million British thermal units (MMBtu) NYMEX, down over $2.00 from the same period in 2011. “We will continue to advance our strategic shift towards achieving a diversified portfolio of production and a more balanced stream of future cash flows by accelerating our development of oil and liquids rich natural gas plays and creating value by investing in our highest return projects,” says Randy Eresman, Encana President & CEO. “We are taking a low risk approach to increasing our production of oil and liquids as we focus on the extraction of more natural gas liquids from existing streams using third party facilities and accelerating the development of new plays targeting light oil.” During the quarter Encana increased its 2012 Guidance for total liquids production by seven percent to 30,000 barrels per day (bbls/d) and announced it is planning to invest an additional $600 million during the second half of the year to take advantage of positive initial results achieved in a number of light oil and liquids rich natural gas plays. With the increased investment, Encana projects average daily liquids production in 2013 to range from 60,000 bbls/d to 70,000 bbls/d, about 40 percent of which is expected to be comprised of light oil and field condensate. “The increased 2012 investment and our initial projections for 2013 capital in the range of $4.0 billion to $5.0 billion are a reflection of the tremendous operational success we’ve had on our oil and liquids rich plays and the confidence we have in our ability to execute divestitures and joint ventures,” adds Eresman. “We will be disciplined in our approach and only spend the projected 2013 capital when we have secured proceeds through cash flow or completed divestitures and joint ventures. It remains a priority for us to maintain balance sheet strength and investment grade credit-ratings.” Encana opened data rooms during the quarter for three investment opportunities with respect to its Alberta Duvernay asset, a group of U.S. liquids rich plays and an approximately ten percent interest in the Cutbank Ridge Partnership. Technical presentations on these assets are underway and there has been strong interest from potential partners. Other activity in the quarter included:
Oil and natural gas liquids (NGL) production volumes averaged about 28,000 bbls/d for the quarter, increasing nearly 4,000 bbls/d from the same period of 2011. The growth in liquids production volumes was primarily due to increased royalty interest volumes received and a successful drilling program in the Peace River Arch. The company estimates that NGL volumes would have been an additional 5,000 bbls/d higher during the quarter; however, the deep cut portion of the third party owned Musreau facility was down during the period.
Second quarter natural gas production volumes were 2.8 billion cubic feet per day (Bcf/d). Volumes were approximately 500 MMcf/d lower due to voluntary capacity reductions, divestitures and natural declines. These declines were partially offset in the Canadian Division by successful drilling programs in Bighorn and the Peace River Arch and in the USA Division by a successful drilling program in the Piceance Basin.

Second quarter net earnings were a loss of $1.5 billion. Under U.S. GAAP full cost accounting, the carrying amount of Encana’s natural gas and oil properties is subject to a ceiling test on a quarterly basis. As a result Encana recorded a $1.7 billion after-tax impairment charge against net earnings in the quarter resulting primarily from the decline in 12-month average trailing natural gas prices. The impairment charge is non-cash in nature, does not affect cash flow or operating earnings and is not reflective of the fair value of the assets. Given the current pricing environment, the company expects that further declines in 12-month average trailing natural gas prices will likely result in the recognition of future ceiling test impairments.
Quarterly dividend of 20 cents per share declared Encana’s Board of Directors has declared a quarterly dividend of 20 cents per share payable on September 28, 2012 to common shareholders as of September 14, 2012.
Second Quarter Highlights
Financial Summary (for the period ended June 30) ($ millions, except per share amounts)
Q2 2012
Q2 2011
Cash flow1 794 1,089 Per share diluted 1.08 1.48Operating earnings1 198 352 Per share diluted 0.27 0.48
Earnings Reconciliation Summary Net earnings (loss) After tax (addition) deduction: Unrealized hedging gain (loss) Impairments Non-operating foreign exchange gain (loss) Estimated annual effective tax rate adjustments
(1,482)
(547) (1,695)
(90) 652
383
18-
44 (31)
Operating earnings1 Per share diluted
198 0.27
3520.48
1 Cash flow and operating earnings are non-GAAP measures as defined in Note 1 on page 3.
Production Summary (for the period ended June 30) (After royalties)
Q2 2012
Q2 2011
%
Natural gas (MMcf/d) 2,802 3,309 -15Liquids (Mbbls/d) 28 24 +17
Second Quarter Natural Gas and Liquids Prices
Q2 2012
Q2 2011
Natural gas NYMEX ($/MMBtu) 2.22 4.31 Encana realized gas price1 ($/Mcf) 4.79 5.09 Oil and NGLs ($/bbl) WTI 93.35 102.34 Encana realized liquids price1 80.32 92.66
1 Realized prices include the impact of financial hedging.
Second quarter report for the period ended June 30, 2012
2 Encana Corporation
Second Quarter Interim Report

Encana Corporation Encana is a leading North American energy producer that is focused on growing its strong portfolio of diverse resource plays producing natural gas, oil and natural gas liquids. By partnering with employees, community organizations and other businesses, Encana contributes to the strength and sustainability of the communities where it operates. Encana common shares trade on the Toronto and New York stock exchanges under the symbol ECA. Important Information Encana reports in U.S. dollars unless otherwise noted. Production, sales and reserves estimates are reported on an after-royalties basis, unless otherwise noted. Per share amounts for cash flow and earnings are on a diluted basis. The term liquids is used to represent oil, NGLs and condensate. The term liquids-rich is used to represent natural gas streams with associated liquids volumes. Unless otherwise specified or the context otherwise requires, reference to Encana or to the company includes reference to subsidiaries of and partnership interests held by Encana Corporation and its subsidiaries. NOTE 1: Non-GAAP measures This news release contains references to non-GAAP measures as follows:
Cash flow is a non-GAAP measure defined as cash from operating activities excluding net change in other assets and liabilities, net change in non-cash working capital and cash tax on sale of assets.
Operating earnings is a non-GAAP measure defined as net earnings excluding non-recurring or non-cash items that management believes reduces the comparability of the company's financial performance between periods. These after-tax items may include, but are not limited to, unrealized hedging gains/losses, impairments, foreign exchange gains/losses, income taxes related to divestitures and adjustments to normalize the effect of income taxes calculated using the estimated annual effective tax rate.
These measures have been described and presented in this news release in order to provide shareholders and potential investors with additional information regarding Encana’s liquidity and its ability to generate funds to finance its operations. ADVISORY REGARDING FORWARD-LOOKING STATEMENTS–In the interests of providing Encana Corporation (“Encana” or the “Company”) shareholders and potential investors with information regarding Encana, including management’s assessment of Encana’s and its subsidiaries’ future plans and operations, certain statements contained in this news release are forward-looking statements or information within the meaning of applicable securities legislation, collectively referred to herein as “forward-looking statements.” Forward-looking statements in this news release include, but are not limited to: achieving a diversified portfolio of production and more balanced cash flow generation by accelerating development of oil and liquids rich natural gas plays and investing in higher return projects; plan to invest additional $600 million in 2012; expected liquids production by year end 2012 and projected average daily liquids production in 2013; projected 2013 capital investment; expectation to attract investments on Alberta Duvernay, U.S. liquids rich plays and an approximately ten percent interest in the Cutbank Ridge Partnership; expected divestiture proceeds for 2012 and 2013; and ability to maintain strong balance sheet and investment grade credit ratings. Readers are cautioned not to place undue reliance on forward-looking statements, as there can be no assurance that the plans, intentions or expectations upon which they are based will occur. By their nature, forward-looking statements involve numerous assumptions, known and unknown risks and uncertainties, both general and specific, that contribute to the possibility that the predictions, forecasts, projections and other forward-looking statements will not occur, which may cause the Company’s actual performance and financial results in future periods to differ materially from any estimates or projections of future performance or results expressed or implied by such forward-looking statements. These assumptions, risks and uncertainties include, among other things: volatility of, and assumptions regarding natural gas and liquids prices, including substantial or extended decline of the same and their adverse effect on the Company’s operations and financial condition and the value and amount of its reserves; assumptions based upon the Company’s current guidance; fluctuations in currency and interest rates; risk that the Company may not conclude divestitures of certain assets or other transactions (including third-party capital investments, farm-outs or partnerships, which Encana may refer to from time to time as “partnerships” or “joint ventures”, regardless of the legal form) as a result of various conditions not being met; product supply and demand; market competition; risks inherent in the Company’s and its subsidiaries’ marketing operations, including credit
for the period ended June 30, 2012
Encana Corporation
Second Quarter Interim Report
Second quarter report
3

risks; imprecision of reserves estimates and estimates of recoverable quantities of natural gas and liquids from resource plays and other sources not currently classified as proved, probable or possible reserves or economic contingent resources, including future net revenue estimates; marketing margins; potential disruption or unexpected technical difficulties in developing new facilities; unexpected cost increases or technical difficulties in constructing or modifying processing facilities; risks associated with technology; the Company’s ability to acquire or find additional reserves; hedging activities resulting in realized and unrealized losses; business interruption and casualty losses; risk of the Company not operating all of its properties and assets; counterparty risk; risk of downgrade in credit rating and its adverse effects; liability for indemnification obligations to third parties; variability of dividends to be paid; its ability to generate sufficient cash flow from operations to meet its current and future obligations; its ability to access external sources of debt and equity capital; the timing and the costs of well and pipeline construction; the Company’s ability to secure adequate product transportation; changes in royalty, tax, environmental, greenhouse gas, carbon, accounting and other laws or regulations or the interpretations of such laws or regulations; political and economic conditions in the countries in which the Company operates; terrorist threats; risks associated with existing and potential future lawsuits and regulatory actions made against the Company; risk arising from price basis differential; risk arising from inability to enter into attractive hedges to protect the Company’s capital program; and other risks and uncertainties described from time to time in the reports and filings made with securities regulatory authorities by Encana. Although Encana believes that the expectations represented by such forward-looking statements are reasonable, there can be no assurance that such expectations will prove to be correct. Readers are cautioned that the foregoing list of important factors is not exhaustive. In addition, assumptions relating to such forward-looking statements generally include Encana’s current expectations and projections made in light of, and generally consistent with, its historical experience and its perception of historical trends, including the conversion of resources into reserves and production as well as expectations regarding rates of advancement and innovation, generally consistent with and informed by its past experience, all of which are subject to the risk factors identified elsewhere in this news release. Assumptions with respect to forward-looking information regarding expanding Encana's oil and NGLs production and extraction volumes are based on existing expansion of natural gas processing facilities in areas where Encana operates and the continued expansion and development of oil and NGL production from existing properties within its asset portfolio. Forward-looking information respecting anticipated 2012 cash flow for Encana is based upon, among other things, achieving average production for 2012 of 3.0 Bcf/d of natural gas and 30,000 bbls/d of liquids, commodity prices for natural gas and liquids based on NYMEX $3.25 per Mcf and WTI of $95 per bbl, an estimated U.S./Canadian dollar foreign exchange rate of $1.00 and a weighted average number of outstanding shares for Encana of approximately 736 million. Forward-looking information respecting anticipated 2013 cash flow for Encana is based upon achieving average production for 2013 of between 2.9 Bcf/d and 3.1 Bcf/d of natural gas and 60,000 bbls/d to 70,000 bbls/d of liquids, commodity prices for natural gas and liquids based on NYMEX $3.50 per Mcf and WTI of $90 per bbl, an estimated U.S./Canadian dollar foreign exchange rate of $1.00 and a weighted average number of outstanding shares for Encana of approximately 736 million. Furthermore, the forward-looking statements contained in this news release are made as of the date hereof and, except as required by law, Encana undertakes no obligation to update publicly or revise any forward-looking statements, whether as a result of new information, future events or otherwise. The forward-looking statements contained in this news release are expressly qualified by this cautionary statement.
Second quarter report for the period ended June 30, 2012
4 Encana Corporation
Second Quarter Interim Report

Management’s Discussion and Analysis
This Management’s Discussion and Analysis (“MD&A”) for Encana Corporation (“Encana” or the “Company”) should be read with the unaudited interim Condensed Consolidated Financial Statements for the period ended June 30, 2012 (“Interim Condensed Consolidated Financial Statements”), as well as the audited United States (“U.S.”) generally accepted accounting principles (“U.S. GAAP”) Consolidated Financial Statements and U.S. GAAP MD&A for the year ended December 31, 2011.
The Interim Condensed Consolidated Financial Statements and comparative information have been prepared in accordance with U.S. GAAP and in U.S. dollars, except where another currency has been indicated. Production volumes are presented on an after royalties basis consistent with U.S. oil and gas reporting standards and the disclosure of U.S. oil and gas companies. The term “liquids” is used to represent oil, natural gas liquids (“NGLs”) and condensate. The term “liquids-rich” is used to represent natural gas streams with associated liquids volumes. This document is dated July 24, 2012.
Certain measures in this document do not have any standardized meaning as prescribed by U.S. GAAP and, therefore, are considered non-GAAP measures. Non-GAAP measures are commonly used in the oil and gas industry and by Encana to provide shareholders and potential investors with additional information regarding the Company’s liquidity and its ability to generate funds to finance its operations. Non-GAAP measures include Cash Flow, Operating Earnings, Debt to Debt Adjusted Cash Flow, Adjusted Earnings Before Interest, Taxes, Depreciation and Amortization (“Adjusted EBITDA”), Debt to Adjusted EBITDA and Debt to Adjusted Capitalization. Further information can be found in the Non-GAAP Measures section of this MD&A, including reconciliations of Cash from Operating Activities to Cash Flow and of Net Earnings to Operating Earnings.
Readers should also read the Advisory section located at the end of this document, which provides information on Forward-Looking Statements, Oil and Gas Information and Currency and References to Encana.
Encana’s Strategic Objectives
Encana Corporation
Prepared using U.S. GAAP in US$
Management's Discussion and Analysis
5
for the period ended June 30, 2012
Second quarter report

Encana’s Business
Canadian Division
USA Division
Market Optimization
Corporate and Other
Encana Corporation
Prepared using U.S. GAAP in US$
Management's Discussion and Analysis
6
Second quarter report for the period ended June 30, 2012

Results Overview
Highlights
Encana Corporation
Prepared using U.S. GAAP in US$
Management's Discussion and Analysis
7
for the period ended June 30, 2012
Second quarter report

Financial Results
2012 2012 Q2
$ 1,815 $ 794 2.47 1.08
438 198 0.59 0.27
(1,470) (1,482) (2.00) (2.01) (2.00) (2.01)
1,917 797 (2,368) (8) 2,530 731
Encana Corporation
Prepared using U.S. GAAP in US$
Management's Discussion and Analysis
8
Second quarter report for the period ended June 30, 2012

Encana Corporation
Prepared using U.S. GAAP in US$
Management's Discussion and Analysis
9
for the period ended June 30, 2012
Second quarter report
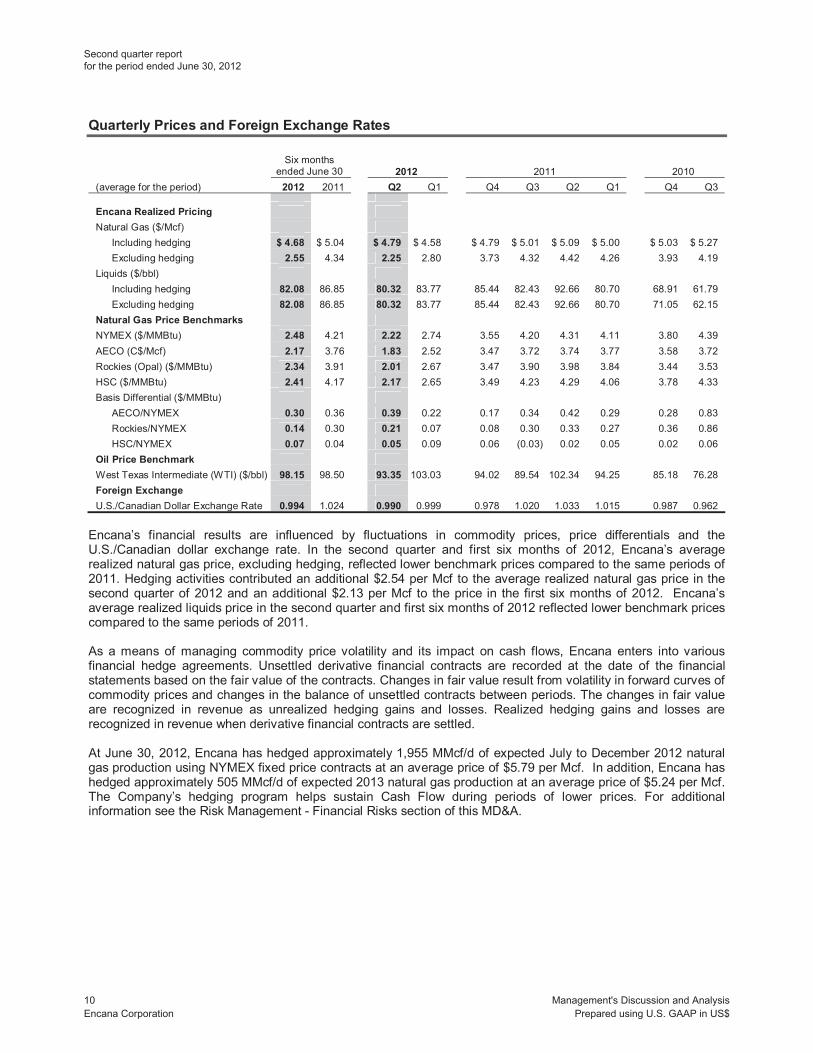
Quarterly Prices and Foreign Exchange Rates
2012 2012 Q2
Encana Realized Pricing
$ 4.68 $ 4.79 2.55 2.25
82.08 80.32 82.08 80.32
Natural Gas Price Benchmarks 2.48 2.22 2.17 1.83 2.34 2.01 2.41 2.17
0.30 0.39 0.14 0.21 0.07 0.05
Oil Price Benchmark 98.15 93.35
Foreign Exchange 0.994 0.990
Encana Corporation
Prepared using U.S. GAAP in US$
Management's Discussion and Analysis
10
Second quarter report for the period ended June 30, 2012

Production and Net Capital Investment
Production Volumes (After Royalties)
2012 2012 Q2
1,365 1,237 1,672 1,565 3,037 2,802
18.1 16.9 10.6 11.3 28.7 28.2
Encana Corporation
Prepared using U.S. GAAP in US$
Management's Discussion and Analysis
11
for the period ended June 30, 2012
Second quarter report

Net Capital Investment
2012 2012
$ 323 $ 838 432 995
1 7 41 77
797 1,917 175 328
(183) (2,696) (8) (2,368)
$ 789 $ (451)
Encana Corporation
Prepared using U.S. GAAP in US$
Management's Discussion and Analysis
12
Second quarter report for the period ended June 30, 2012

Divisional Results
Canadian Division
Operating Cash Flow
Operating Cash Flow Natural Gas Netback Oil & NGLs Netback
2012 2012 2012
$ 350 $ 2.05 $ 76.47 286 2.61 -
3 0.01 1.28 145 1.31 1.18
83 0.71 1.68 $ 405 $ 2.63 $ 72.33
Natural Gas Oil & NGLs
2012 2012 1,237 16.9
Encana Corporation
Prepared using U.S. GAAP in US$
Management's Discussion and Analysis
13
for the period ended June 30, 2012
Second quarter report

Operating Cash Flow Natural Gas Netback Oil & NGLs Netback
2012 2012 2012
$ 845 $ 2.33 $ 78.33 514 2.10 -
6 - 1.85 278 1.12 1.06 180 0.69 1.40
$ 895 $ 2.62 $ 74.02
Natural Gas Oil & NGLs
2012 2012 1,365 18.1
Encana Corporation
Prepared using U.S. GAAP in US$
Management's Discussion and Analysis
14
Second quarter report for the period ended June 30, 2012

Other Divisional Expenses
2012 2012
$ 162 $ 396 748 748
Natural Gas Liquids
12-Month Average Trailing Reserves Pricing (2)
June 30, 2012 2.76 92.20
Encana Corporation
Prepared using U.S. GAAP in US$
Management's Discussion and Analysis
15
for the period ended June 30, 2012
Second quarter report

USA Division
Operating Cash Flow
Operating Cash Flow Natural Gas Netback Oil & NGLs Netback
2012 2012 2012
$ 437 $ 2.41 $ 86.11 355 2.49 -
12 0.03 7.17 148 1.04 0.09
87 0.56 5.52 $ 545 $ 3.27 $ 73.33
Natural Gas Oil & NGLs
2012 2012 1,565 11.3
Encana Corporation
Prepared using U.S. GAAP in US$
Management's Discussion and Analysis
16
Second quarter report for the period ended June 30, 2012

Operating Cash Flow Natural Gas Netback Oil & NGLs Netback
2012 2012 2012
$ 1,013 $ 2.73 $ 88.44 657 2.16 -
33 0.06 7.71 321 1.05 0.14 188 0.59 4.13
$ 1,128 $ 3.19 $ 76.46
Natural Gas Oil & NGLs
2012 2012 1,672 10.6
Encana Corporation
Prepared using U.S. GAAP in US$
Management's Discussion and Analysis
17
for the period ended June 30, 2012
Second quarter report

Other Divisional Expenses
2012 2012
$ 287 $ 617 1,778 1,778
Natural Gas Liquids
12-Month Average Trailing Reserves Pricing (1)
June 30, 2012 3.15 95.67
Market Optimization
2012 2012
$ 97 $ 218
6 16 85 190 3 6
$ 3 $ 6
Encana Corporation
Prepared using U.S. GAAP in US$
Management's Discussion and Analysis
18
Second quarter report for the period ended June 30, 2012

Corporate and Other
2012 2012
$ (794) $ (717)
3 12 20 40
$ (817) $ (769)
Other Operating Results
Expenses
2012 2012
$ 13 $ 27 95 197
135 258 97 (5)
- (2) $ 340 $ 475
Encana Corporation
Prepared using U.S. GAAP in US$
Management's Discussion and Analysis
19
for the period ended June 30, 2012
Second quarter report

Income Tax
2012 2012
$ (43) $ (177) (1,654) (1,107)
$ (1,697) $ (1,284)
Encana Corporation
Prepared using U.S. GAAP in US$
Management's Discussion and Analysis
20
Second quarter report for the period ended June 30, 2012

Liquidity and Capital Resources
2012 2012
$ 631 $ 1,248
(995) 643
(147) (813)
(8) (4)
$ (519) $ 1,074
$ 1,874 $ 1,874
Operating Activities
Investing Activities
Encana Corporation
Prepared using U.S. GAAP in US$
Management's Discussion and Analysis
21
for the period ended June 30, 2012
Second quarter report

Financing Activities
Long-Term Debt
Credit Facilities and Shelf Prospectuses
Dividends
Outstanding Share Data
Encana Corporation
Prepared using U.S. GAAP in US$
Management's Discussion and Analysis
22
Second quarter report for the period ended June 30, 2012

Capital Structure
June 30, 2012
1.8x
1.9x
34%
Commitments and Contingencies
Commitments
Contingencies
Encana Corporation
Prepared using U.S. GAAP in US$
Management's Discussion and Analysis
23
for the period ended June 30, 2012
Second quarter report

Current Investigation
Risk Management
Financial Risks
Encana Corporation
Prepared using U.S. GAAP in US$
Management's Discussion and Analysis
24
Second quarter report for the period ended June 30, 2012

Operational Risks
Safety, Environmental and Regulatory Risks
Encana Corporation
Prepared using U.S. GAAP in US$
Management's Discussion and Analysis
25
for the period ended June 30, 2012
Second quarter report

Accounting Policies and Estimates
Critical Accounting Estimates
Upstream Assets and Reserves
Asset Retirement Obligation
Encana Corporation
Prepared using U.S. GAAP in US$
Management's Discussion and Analysis
26
Second quarter report for the period ended June 30, 2012

Goodwill
Income Taxes
Encana Corporation
Prepared using U.S. GAAP in US$
Management's Discussion and Analysis
27
for the period ended June 30, 2012
Second quarter report

Derivative Financial Instruments
Recent Accounting Pronouncements
Amendments to Achieve Common Fair Value Measurement and Disclosure Requirements in U.S. GAAP and IFRS,
Presentation of Comprehensive Income,
Deferral of the Effective Date for Amendments to the Presentation of Reclassifications of Items Out of Accumulated Other Comprehensive Income in Accounting Standards Update No. 2011-05,
Intangibles - Goodwill and Other,
Intangibles - Goodwill and Other
Encana Corporation
Prepared using U.S. GAAP in US$
Management's Discussion and Analysis
28
Second quarter report for the period ended June 30, 2012

Non-GAAP Measures
Cash Flow
2012 2012 Q2
$ 1,248 $ 631
(46) (26)
(509) (134) (12) (3)
$ 1,815 $ 794
Encana Corporation
Prepared using U.S. GAAP in US$
Management's Discussion and Analysis
29
for the period ended June 30, 2012
Second quarter report

Operating Earnings
2012 2012 Q2
$ (1,470) $ (1,482)
(502)
(547)
(1,695) (1,695)
(4)
(90)
293 652 $ 438 $ 198
Debt to Debt Adjusted Cash Flow
June 30, 2012
$ 7,657
3,979 358
$ 4,337 1.8x
Encana Corporation
Prepared using U.S. GAAP in US$
Management's Discussion and Analysis
30
Second quarter report for the period ended June 30, 2012

Debt to Adjusted EBITDA
June 30, 2012
$ 7,657
(1,487)
483 (1,222) 2,208 3,999
52 318
(251) 20
$ 4,120 1.9x
Debt to Adjusted Capitalization
June 30, 2012
$ 7,657 6,837 7,746
$ 22,240 34%
Encana Corporation
Prepared using U.S. GAAP in US$
Management's Discussion and Analysis
31
for the period ended June 30, 2012
Second quarter report
Advisory Forward-Looking Statements In the interest of providing Encana shareholders and potential investors with information regarding the Company and its subsidiaries, including Management’s assessment of Encana’s and its subsidiaries’ future plans and operations, certain statements contained in this document constitute forward-looking statements or information (collectively referred to herein as “forward-looking statements”) within the meaning of the “safe harbour” provisions of applicable securities legislation. Forward-looking statements are typically identified by words such as “anticipate”, “believe”, “expect”, “plan”, “intend”, “forecast”, “target”, “project”, “objective”, “strategy”, “strives” or similar words suggesting future outcomes or statements regarding an outlook. Forward-looking statements in this document include, but are not limited to, statements with respect to: achieving the Company’s business objectives of growing its portfolio to produce natural gas, oil and NGLs, maintaining financial strength, optimizing capital investments, continuing to pay a stable dividend; long-term strategy of accelerating value recognition of assets; achieving operating efficiencies, lowering cost structures and success of resource play hub model; balancing capital investment to build long-term production growth capacity with near term market uncertainty; planned 2012 capital investment of $3.5 billion, including additional capital investment of $600 million to be funded by cash in order to increase liquids cash flow contribution in 2013; developing a more diversified production and cash flow portfolio; expectation for proceeds from planned divestitures and joint venture transaction to provide additional financial flexibility; expected reduction in capital program for drier natural gas plays while directing greater investment towards oil and liquids-rich development and exploration opportunities; plans to shut-in certain volume of natural gas production from existing wells in 2012; ability to expand natural gas markets in North America and potential development of liquefied natural gas export terminal in British Columbia; amount of additional investments and funding commitment expected from the Company’s joint ventures; projections contained in the 2012 Corporate Guidance (including estimates of cash flow including per share, natural gas, oil and NGLs production, capital investment and its allocation, net divestitures, operating costs, and 2012 estimated sensitivities of cash flow and operating earnings); estimates of reserves and resources; potential joint venture transactions and third party investments and expectation for the same to reduce capital investments and improve project returns; projections relating to the adequacy of the Company’s provision for taxes and legal claims; the flexibility of capital spending plans and the source of funding therefore; the benefits of the Company’s risk management program, including the impact of derivative financial instruments; projections that the Company has access to cash equivalents and a wide range of funding at competitive rates; the Company’s ability to meet payment terms of its suppliers and be in compliance with all financial covenants under its credit facility agreements; expectation to fund 2012 commitments from Cash Flow; the effect of the Company’s risk mitigation policies, systems, processes and insurance program; the Company’s expectations for future Debt to Debt Adjusted Cash Flow, Debt to Adjusted EBITDA and Debt to Adjusted Capitalization ratios; and the expected impact and timing of various accounting pronouncements, rule changes and standards on the Company and its financial statements. Readers are cautioned not to place undue reliance on forward-looking statements, as there can be no assurance that the plans, intentions or expectations upon which they are based will occur. By their nature, forward-looking statements involve numerous assumptions, known and unknown risks and uncertainties, both general and specific, that contribute to the possibility that the predictions, forecasts, projections and other forward-looking statements will not occur, which may cause the Company’s actual performance and financial results in future periods to differ materially from any estimates or projections of future performance or results expressed or implied by such forward-looking statements. These assumptions, risks and uncertainties include, among other things: volatility of, and assumptions regarding natural gas and liquids prices, including substantial or extended decline of the same and their adverse effect on the Company’s operations and financial condition and the value and amount of its reserves; assumptions based upon the Company’s current guidance; fluctuations in currency and interest rates; risk that the Company may not conclude divestitures of certain assets or other transactions (including third-party capital investments, farm-outs or partnerships, which Encana may refer to from time to time as “partnerships” or “joint ventures”, regardless of the legal form) as a result of various conditions not being met; product supply and demand; market competition; risks inherent in the Company’s and its subsidiaries’ marketing operations, including credit risks; imprecision of reserves estimates and estimates of recoverable quantities of natural gas and liquids from resource plays and other sources not currently classified as proved, probable or possible reserves or economic contingent resources, including future net revenue estimates; marketing margins;
Second quarter report for the period ended June 30, 2012
Prepared using U.S. GAAP in US$
Management's Discussion and Analysis
32 Encana Corporation
Oil and Gas Information
Encana Corporation
Prepared using U.S. GAAP in US$
Management's Discussion and Analysis
33
for the period ended June 30, 2012
Second quarter report

Natural Gas, Oil and NGLs Conversions
Resource Play
Currency and References to Encana
Additional Information
Encana Corporation
Prepared using U.S. GAAP in US$
Management's Discussion and Analysis
34
Second quarter report for the period ended June 30, 2012

Condensed Consolidated Statement of Earnings (unaudited)
($ millions, except per share amounts) 2012 2011 2012 2011
Revenues, Net of Royalties (Note 3) $ 731 $ 1,986 $ 2,530 $ 3,653
Expenses (Note 3)
Production and mineral taxes 15 55 39 108
Transportation and processing 293 332 599 616
Operating 179 184 396 424
Purchased product 85 174 190 339
Depreciation, depletion and amortization 472 573 1,059 1,133
Impairments (Note 8) 2,526 - 2,526 776
Accretion of asset retirement obligation (Note 11) 13 12 27 25
Administrative 95 67 197 203
Interest (Note 5) 135 124 258 243
Foreign exchange (gain) loss, net (Note 6) 97 (44) (5) (190)
Other - (1) (2) (1)
3,910 1,476 5,284 3,676
Net Earnings (Loss) Before Income Tax (3,179) 510 (2,754) (23)
Income tax expense (recovery) (Note 7) (1,697) 127 (1,284) (45)
Net Earnings (Loss) $ (1,482) $ 383 $ (1,470) $ 22
Net Earnings (Loss) per Common Share (Note 12)
Basic $ (2.01) $ 0.52 $ (2.00) $ 0.03 Diluted $ (2.01) $ 0.52 $ (2.00) $ 0.03
Condensed Consolidated Statement of Comprehensive Income (unaudited)
($ millions) 2012 2011 2012 2011
Net Earnings (Loss) $ (1,482) $ 383 $ (1,470) $ 22
Other Comprehensive Income (Loss), Net of Tax
Foreign currency translation adjustment (11) 38 13 142
Compensation plans 1 - 5 -
Comprehensive Income (Loss) $ (1,492) $ 421 $ (1,452) $ 164
See accompanying Notes to Condensed Consolidated Financial Statements.
Six Months EndedJune 30,
Six Months EndedJune 30,
Three Months EndedJune 30,
Three Months EndedJune 30,
Encana Corporation
Prepared in accordance with U.S. GAAP in US$
Condensed Consolidated Financial Statements
for the period ended June 30, 2012
Second quarter report
35

Condensed Consolidated Balance Sheet (unaudited)
As at As atJune 30, December 31,
($ millions) 2012 2011
AssetsCurrent Assets
Cash and cash equivalents $ 1,874 $ 800 Accounts receivable and accrued revenues 610 1,075 Risk management (Note 15) 1,182 1,806 Income tax receivable 1,010 686 Deferred income taxes 61 -
4,737 4,367 Property, Plant and Equipment, at cost: (Note 8)
Natural gas & oil properties, based on full cost accountingProved properties 49,927 50,690 Unproved properties 1,624 1,426
Other 3,093 2,748 Property, plant and equipment 54,644 54,864 Less: Accumulated depreciation, depletion and amortization (42,339) (38,807) Property, plant and equipment, net (Note 3) 12,305 16,057
Cash in Reserve 64 469 Other Assets 521 395 Risk Management (Note 15) 139 241 Deferred Income Taxes 612 188 Goodwill (Note 3) 1,695 1,698
(Note 3) $ 20,073 $ 23,415
Liabilities and Shareholders' EquityCurrent Liabilities
Accounts payable and accrued liabilities $ 1,794 $ 2,428 Income tax payable 25 123 Risk management (Note 15) 1 1 Current portion of long-term debt (Note 9) - 492 Deferred income taxes 211 442
2,031 3,486 Long-Term Debt (Note 9) 7,657 7,658 Other Liabilities and Provisions (Note 10) 2,562 2,301 Risk Management (Note 15) 12 6 Asset Retirement Obligation (Note 11) 863 875 Deferred Income Taxes 111 511
13,236 14,837 Commitments and Contingencies (Note 16)
Shareholders' EquityShare capital - authorized unlimited common shares, without par value (Note 12) 2,354 2,354
2012 and 2011 issued and outstanding: 736.3 million sharesPaid in surplus (Note 13) 10 5 Retained earnings 3,879 5,643 Accumulated other comprehensive income 594 576
6,837 8,578 $ 20,073 $ 23,415
See accompanying Notes to Condensed Consolidated Financial Statements.
Total Shareholders' Equity
Encana Corporation
Prepared in accordance with U.S. GAAP in US$
Condensed Consolidated Financial Statements
Second quarter report for the period ended June 30, 2012
36

Condensed Consolidated Statement of Changes in Shareholders' Equity (unaudited)
($ millions) 2012 2011
Share Capital (Note 12)
Balance, Beginning of Year $ 2,354 $ 2,352
Common Shares Issued under Option Plans - 2
Balance, End of Period $ 2,354 $ 2,354
Paid in Surplus (Note 13)
Balance, Beginning of Year $ 5 $ -
Share-Based Compensation 5 6
Balance, End of Period $ 10 $ 6
Retained Earnings
Balance, Beginning of Year $ 5,643 $ 6,226
Net Earnings (Loss) (1,470) 22
Dividends on Common Shares (Note 12) (294) (294)
Balance, End of Period $ 3,879 $ 5,954
Accumulated Other Comprehensive Income
Foreign Currency Translation Adjustment
Balance, beginning of year $ 658 $ 963
Change in foreign currency translation adjustment 13 142
Balance, end of period $ 671 $ 1,105
Compensation Plans
Balance, beginning of year $ (82) $ (48)
Amortization of net actuarial gains and losses,
net of income taxes of $3 million (2011 - nil) (Note 13) 5 -
Balance, end of period $ (77) $ (48)
Total Accumulated Other Comprehensive Income $ 594 $ 1,057
Total Shareholders' Equity $ 6,837 $ 9,371
See accompanying Notes to Condensed Consolidated Financial Statements.
Six Months EndedJune 30,
Encana Corporation
Prepared in accordance with U.S. GAAP in US$
Condensed Consolidated Financial Statements
for the period ended June 30, 2012
Second quarter report
37

Condensed Consolidated Statement of Cash Flows (unaudited)
($ millions) 2012 2011 2012 2011
Operating Activities
Net earnings (loss) $ (1,482) $ 383 $ (1,470) $ 22
Depreciation, depletion and amortization 472 573 1,059 1,133
Impairments (Note 8) 2,526 - 2,526 776
Accretion of asset retirement obligation (Note 11) 13 12 27 25
Deferred income taxes (Note 7) (1,654) 236 (1,107) 131
Unrealized (gain) loss on risk management (Note 15) 795 (29) 732 104
Unrealized foreign exchange (gain) loss (Note 6) 100 (41) 10 (156)
Other 21 (45) 26 17
Net change in other assets and liabilities (26) (75) (46) (104)
Net change in non-cash working capital (134) (34) (509) (311)
Cash From (Used in) Operating Activities 631 980 1,248 1,637
Investing Activities
Capital expenditures (Note 3) (797) (1,122) (1,917) (2,416)
Acquisitions (Note 4) (175) (151) (328) (417)
Proceeds from divestitures (Note 4) 183 43 2,696 440
Cash in reserve (16) 58 405 60
Net change in investments and other (190) (77) (213) (185)
Cash From (Used in) Investing Activities (995) (1,249) 643 (2,518)
Financing Activities
Issuance of revolving long-term debt - 3,419 1,721 6,861
Repayment of revolving long-term debt - (2,962) (1,724) (6,050)
Repayment of long-term debt (Note 9) - - (503) -
Issuance of common shares (Note 12) - - - 2
Dividends on common shares (Note 12) (147) (147) (294) (294)
Capital lease payments - (33) (13) (121)
Cash From (Used in) Financing Activities (147) 277 (813) 398
Foreign Exchange Gain (Loss) on Cash and Cash
Equivalents Held in Foreign Currency (8) - (4) 5
Increase (Decrease) in Cash and Cash Equivalents (519) 8 1,074 (478)
Cash and Cash Equivalents, Beginning of Period 2,393 213 800 699
Cash and Cash Equivalents, End of Period $ 1,874 $ 221 $ 1,874 $ 221
Cash, End of Period $ 110 $ 120 $ 110 $ 120
Cash Equivalents, End of Period 1,764 101 1,764 101
Cash and Cash Equivalents, End of Period $ 1,874 $ 221 $ 1,874 $ 221
See accompanying Notes to Condensed Consolidated Financial Statements.
Three Months EndedJune 30,
Six Months EndedJune 30,
Encana Corporation
Prepared in accordance with U.S. GAAP in US$
Condensed Consolidated Financial Statements
Second quarter report for the period ended June 30, 2012
38
Notes to Condensed Consolidated Financial Statements (unaudited)(All amounts in $ millions unless otherwise specified)
1. Basis of Presentation
2. Changes in Accounting Policies and Practices
Accounting Standards Update 2011-04, "Amendments to Achieve Common Fair Value Measurement and DisclosureRequirements in U.S. GAAP and IFRS", clarifies and changes existing fair value measurement and disclosurerequirements. The amendments have been applied prospectively and have not had a significant impact on the Company'sfair value measurements or disclosures.
Accounting Standards Update 2011-05, "Presentation of Comprehensive Income", requires that net earnings andcomprehensive income be presented either in a single continuous statement or in two separate consecutive statements.As Encana presents its net earnings and comprehensive income in two separate consecutive statements, the amendmentshad no impact on the Company’s financial statement presentation. Accounting Standards Update 2011-12, "Deferral of theEffective Date for Amendments to the Presentation of Reclassifications of Items Out of Accumulated Other ComprehensiveIncome in Accounting Standards Update No. 2011-05", defers the effective date of certain presentation requirements foritems reclassified out of accumulated other comprehensive income to net earnings.
Accounting Standards Update 2011-08, "Intangibles - Goodwill and Other", permits an initial assessment of qualitativefactors to determine whether the two-step goodwill impairment test is required to be performed as described in AccountingStandards Codification Topic 350, "Intangibles - Goodwill and Other". The amendments have been applied prospectively.
Encana Corporation and its subsidiaries ("Encana" or "the Company") are in the business of the exploration for, thedevelopment of, and the production and marketing of natural gas, oil and natural gas liquids ("NGLs"). The term liquids is usedto represent Encana's oil, NGLs and condensate.
The interim Condensed Consolidated Financial Statements include the accounts of Encana and are presented in accordancewith accounting principles generally accepted in the United States ("U.S. GAAP").
On January 1, 2012, Encana adopted the following standards and updates issued by the Financial Accounting StandardsBoard ("FASB"), which have not had a material impact on the Company's interim Condensed Consolidated FinancialStatements:
These unaudited interim Condensed Consolidated Financial Statements reflect, in the opinion of Management, all normal andrecurring adjustments necessary to present fairly the financial position and results of the Company as at and for the periodspresented. Interim condensed consolidated financial results are not necessarily indicative of consolidated financial resultsexpected for the fiscal year.
The interim Condensed Consolidated Financial Statements have been prepared following the same accounting policies andmethods of computation as the annual audited U.S. GAAP Consolidated Financial Statements for the year ended December31, 2011, except as noted below in Note 2. The disclosures provided below are incremental to those included with the annualaudited U.S. GAAP Consolidated Financial Statements. Certain information and disclosures normally required to be includedin the notes to the annual audited U.S. GAAP Consolidated Financial Statements have been condensed or have beendisclosed on an annual basis only. Accordingly, the interim Condensed Consolidated Financial Statements should be read inconjunction with the annual audited U.S. GAAP Consolidated Financial Statements and the notes thereto for the year endedDecember 31, 2011.
Encana Corporation
Prepared in accordance with U.S. GAAP in US$
Notes to Condensed Consolidated Financial Statements
for the period ended June 30, 2012
Second quarter report
39

Notes to Condensed Consolidated Financial Statements (unaudited)(All amounts in $ millions unless otherwise specified)
3. Segmented Information
Encana's reportable segments are determined based on the Company's operations and geographic locations as follows:
Canadian Division includes the exploration for, development of, and production of natural gas, oil and NGLs andother related activities within the Canadian cost centre. Five key resource plays are located in the Division: (i) GreaterSierra in northeast British Columbia, including Horn River; (ii) Peace River Arch in northwest Alberta; (iii) CutbankRidge in northern British Columbia; (iv) Bighorn in west central Alberta; and (v) Coalbed Methane ("CBM") in southernAlberta. The Canadian Division also includes the Deep Panuke natural gas project offshore Nova Scotia.
USA Division includes the exploration for, development of, and production of natural gas, oil and NGLs and otherrelated activities within the U.S. cost centre. Four key resource plays are located in the Division: (i) Jonah insouthwest Wyoming; (ii) Piceance in northwest Colorado; (iii) Haynesville in Louisiana; and (iv) Texas.
The Condensed Consolidated Statement of Earnings for the comparative period ended June 30, 2011 and theaccompanying segmented information disclosed in this note have been updated to present processing costs withtransportation expense. Formerly, these processing costs were presented in operating expenses. Encana has updatedits presentation as a result of the Canadian Division entering into firm gathering and processing agreements associatedwith the divestiture of its two natural gas processing plants during the first quarter of 2012 as disclosed in Note 4. Encanabelieves the nature of processing costs more closely align with transportation expense. As a result, the Company hasreclassified $73 million from operating expense to transportation and processing expense for the three months endedJune 30, 2011 and $130 million for the six months ended June 30, 2011 ($240 million – 12 months ended December 31,2011).
Corporate and Other mainly includes unrealized gains or losses recorded on derivative financial instruments. Onceamounts are settled, the realized gains and losses are recorded in the reporting segment to which the derivativeinstrument relates.
Market Optimization sells substantially all of the Company's upstream production to third-party customers. Transactionsbetween segments are based on market values and are eliminated on consolidation.
Market Optimization is primarily responsible for the sale of the Company's proprietary production. These results areincluded in the Canadian and USA Divisions. Market optimization activities include third-party purchases and sales ofproduct that provide operational flexibility for transportation commitments, product type, delivery points and customerdiversification. These activities are reflected in the Market Optimization segment.
Encana Corporation
Prepared in accordance with U.S. GAAP in US$
Notes to Condensed Consolidated Financial Statements
Second quarter report for the period ended June 30, 2012
40

Notes to Condensed Consolidated Financial Statements (unaudited)(All amounts in $ millions unless otherwise specified)
3. Segmented Information (continued)
Results of Operations (For the three months ended June 30)
Segment and Geographic Information
Canadian Division USA Division Market Optimization2012 2011 2012 2011 2012 2011
Revenues, Net of Royalties $ 636 $ 735 $ 792 $ 1,025 $ 97 $ 190
ExpensesProduction and mineral taxes 3 4 12 51 - -
Transportation and processing 145 137 148 195 - -
Operating 83 80 87 101 6 4
Purchased product - - - - 85 174
405 514 545 678 6 12
Depreciation, depletion and amortization 162 249 287 302 3 3
Impairments 748 - 1,778 - - - $ (505) $ 265 $ (1,520) $ 376 $ 3 $ 9
2012 2011 2012 2011
Revenues, Net of Royalties $ (794) $ 36 $ 731 $ 1,986
ExpensesProduction and mineral taxes - - 15 55
Transportation and processing - - 293 332
Operating 3 (1) 179 184
Purchased product - - 85 174
(797) 37 159 1,241
Depreciation, depletion and amortization 20 19 472 573
Impairments - - 2,526 - $ (817) $ 18 (2,839) 668
Accretion of asset retirement obligation 13 12
Administrative 95 67
Interest 135 124
Foreign exchange (gain) loss, net 97 (44)
Other - (1)
340 158
Net Earnings (Loss) Before Income Tax (3,179) 510
Income tax expense (recovery) (1,697) 127 Net Earnings (Loss) $ (1,482) $ 383
Corporate & Other Consolidated
Encana Corporation
Prepared in accordance with U.S. GAAP in US$
Notes to Condensed Consolidated Financial Statements
for the period ended June 30, 2012
Second quarter report
41

Notes to Condensed Consolidated Financial Statements (unaudited)(All amounts in $ millions unless otherwise specified)
3. Segmented Information (continued)
Results of Operations (For the three months ended June 30)
Product and Divisional Information
Canadian Division Natural Gas Total
2012 2011 2012 2011 2012 2011 2012 2011
Revenues, Net of Royalties $ 509 $ 599 $ 118 $ 125 $ 9 $ 11 $ 636 $ 735
ExpensesProduction and mineral taxes 1 3 2 1 - - 3 4
Transportation and processing 143 134 2 3 - - 145 137
Operating 78 76 3 1 2 3 83 80 Operating Cash Flow $ 287 $ 386 $ 111 $ 120 $ 7 $ 8 $ 405 $ 514
Natural Gas Total2012 2011 2012 2011 2012 2011 2012 2011
Revenues, Net of Royalties $ 698 $ 932 $ 88 $ 81 $ 6 $ 12 $ 792 $ 1,025
ExpensesProduction and mineral taxes 5 43 7 8 - - 12 51
Transportation and processing 148 195 - - - - 148 195
Operating 81 100 6 - - 1 87 101 Operating Cash Flow $ 464 $ 594 $ 75 $ 73 $ 6 $ 11 $ 545 $ 678
Total2012 2011 2012 2011 2012 2011
Revenues, Net of Royalties $ 800 $ 1,710 $ (703) $ (1,520) $ 97 $ 190
ExpensesTransportation and processing 130 126 (130) (126) - -
Operating 22 14 (16) (10) 6 4
Purchased product 643 1,560 (558) (1,386) 85 174 Operating Cash Flow $ 5 $ 10 $ 1 $ 2 $ 6 $ 12
Oil & NGLs Other
USA DivisionOil & NGLs Other
Marketing SalesMarket Optimization
Upstream Eliminations
Encana Corporation
Prepared in accordance with U.S. GAAP in US$
Notes to Condensed Consolidated Financial Statements
Second quarter report for the period ended June 30, 2012
42

Notes to Condensed Consolidated Financial Statements (unaudited)(All amounts in $ millions unless otherwise specified)
3. Segmented Information (continued)
Results of Operations (For the six months ended June 30)
Segment and Geographic Information
Canadian Division USA Division Market Optimization2012 2011 2012 2011 2012 2011
Revenues, Net of Royalties $ 1,359 $ 1,413 $ 1,670 $ 1,986 $ 218 $ 369
ExpensesProduction and mineral taxes 6 8 33 100 - -
Transportation and processing 278 249 321 367 - -
Operating 180 190 188 236 16 17
Purchased product - - - - 190 339
895 966 1,128 1,283 12 13
Depreciation, depletion and amortization 396 487 617 602 6 6
Impairments 748 776 1,778 - - - $ (249) $ (297) $ (1,267) $ 681 $ 6 $ 7
2012 2011 2012 2011
Revenues, Net of Royalties $ (717) $ (115) $ 2,530 $ 3,653
ExpensesProduction and mineral taxes - - 39 108
Transportation and processing - - 599 616
Operating 12 (19) 396 424
Purchased product - - 190 339
(729) (96) 1,306 2,166
Depreciation, depletion and amortization 40 38 1,059 1,133
Impairments - - 2,526 776 $ (769) $ (134) (2,279) 257
Accretion of asset retirement obligation 27 25
Administrative 197 203
Interest 258 243
Foreign exchange (gain) loss, net (5) (190)
Other (2) (1)
475 280
Net Earnings (Loss) Before Income Tax (2,754) (23)
Income tax expense (recovery) (1,284) (45) Net Earnings (Loss) $ (1,470) $ 22
Corporate & Other Consolidated
Encana Corporation
Prepared in accordance with U.S. GAAP in US$
Notes to Condensed Consolidated Financial Statements
for the period ended June 30, 2012
Second quarter report
43

Notes to Condensed Consolidated Financial Statements (unaudited)(All amounts in $ millions unless otherwise specified)
3. Segmented Information (continued)
Results of Operations (For the six months ended June 30)
Product and Divisional Information
Canadian Division Natural Gas Total
2012 2011 2012 2011 2012 2011 2012 2011
Revenues, Net of Royalties $ 1,084 $ 1,166 $ 258 $ 225 $ 17 $ 22 $ 1,359 $ 1,413
ExpensesProduction and mineral taxes - 6 6 2 - - 6 8
Transportation and processing 275 245 3 4 - - 278 249
Operating 170 181 5 3 5 6 180 190 Operating Cash Flow $ 639 $ 734 $ 244 $ 216 $ 12 $ 16 $ 895 $ 966
Natural Gas Total2012 2011 2012 2011 2012 2011 2012 2011
Revenues, Net of Royalties $ 1,486 $ 1,802 $ 171 $ 149 $ 13 $ 35 $ 1,670 $ 1,986
ExpensesProduction and mineral taxes 18 85 15 15 - - 33 100
Transportation and processing 321 367 - - - - 321 367
Operating 179 225 8 - 1 11 188 236 Operating Cash Flow $ 968 $ 1,125 $ 148 $ 134 $ 12 $ 24 $ 1,128 $ 1,283
Total2012 2011 2012 2011 2012 2011
Revenues, Net of Royalties $ 2,005 $ 3,369 $ (1,787) $ (3,000) $ 218 $ 369
ExpensesTransportation and processing 262 242 (262) (242) - -
Operating 44 41 (28) (24) 16 17
Purchased product 1,682 3,063 (1,492) (2,724) 190 339 Operating Cash Flow $ 17 $ 23 $ (5) $ (10) $ 12 $ 13
Marketing SalesMarket Optimization
Upstream Eliminations
Oil & NGLs Other
USA DivisionOil & NGLs Other
Encana Corporation
Prepared in accordance with U.S. GAAP in US$
Notes to Condensed Consolidated Financial Statements
Second quarter report for the period ended June 30, 2012
44
Notes to Condensed Consolidated Financial Statements (unaudited)(All amounts in $ millions unless otherwise specified)
3. Segmented Information (continued)
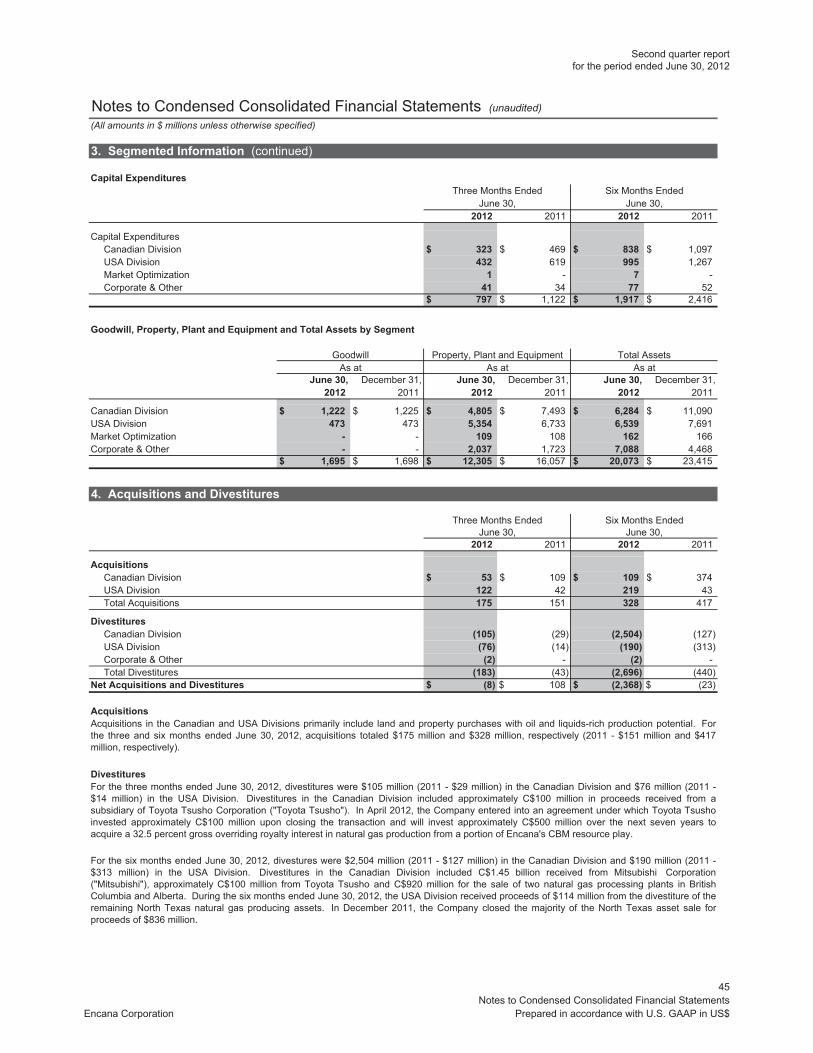
Capital Expenditures
2012 2011 2012 2011
Capital ExpendituresCanadian Division $ 323 $ 469 $ 838 $ 1,097 USA Division 432 619 995 1,267 Market Optimization 1 - 7 - Corporate & Other 41 34 77 52
$ 797 $ 1,122 $ 1,917 $ 2,416
Goodwill, Property, Plant and Equipment and Total Assets by Segment
Goodwill Property, Plant and Equipment Total AssetsAs at As at As at
June 30, December 31, June 30, December 31, June 30, December 31,2012 2011 2012 2011 2012 2011
Canadian Division $ 1,222 $ 1,225 $ 4,805 $ 7,493 $ 6,284 $ 11,090 USA Division 473 473 5,354 6,733 6,539 7,691 Market Optimization - - 109 108 162 166 Corporate & Other - - 2,037 1,723 7,088 4,468
$ 1,695 $ 1,698 $ 12,305 $ 16,057 $ 20,073 $ 23,415
4. Acquisitions and Divestitures
2012 2011 2012 2011
AcquisitionsCanadian Division $ 53 $ 109 $ 109 $ 374 USA Division 122 42 219 43 Total Acquisitions 175 151 328 417
Divestitures Canadian Division (105) (29) (2,504) (127) USA Division (76) (14) (190) (313) Corporate & Other (2) - (2) - Total Divestitures (183) (43) (2,696) (440)
Net Acquisitions and Divestitures $ (8) $ 108 $ (2,368) $ (23)
Acquisitions
DivestituresFor the three months ended June 30, 2012, divestitures were $105 million (2011 - $29 million) in the Canadian Division and $76 million (2011 -$14 million) in the USA Division. Divestitures in the Canadian Division included approximately C$100 million in proceeds received from asubsidiary of Toyota Tsusho Corporation ("Toyota Tsusho"). In April 2012, the Company entered into an agreement under which Toyota Tsushoinvested approximately C$100 million upon closing the transaction and will invest approximately C$500 million over the next seven years toacquire a 32.5 percent gross overriding royalty interest in natural gas production from a portion of Encana's CBM resource play.
June 30,
Acquisitions in the Canadian and USA Divisions primarily include land and property purchases with oil and liquids-rich production potential. Forthe three and six months ended June 30, 2012, acquisitions totaled $175 million and $328 million, respectively (2011 - $151 million and $417million, respectively).
June 30,
For the six months ended June 30, 2012, divestures were $2,504 million (2011 - $127 million) in the Canadian Division and $190 million (2011 -$313 million) in the USA Division. Divestitures in the Canadian Division included C$1.45 billion received from Mitsubishi Corporation("Mitsubishi"), approximately C$100 million from Toyota Tsusho and C$920 million for the sale of two natural gas processing plants in BritishColumbia and Alberta. During the six months ended June 30, 2012, the USA Division received proceeds of $114 million from the divestiture of theremaining North Texas natural gas producing assets. In December 2011, the Company closed the majority of the North Texas asset sale forproceeds of $836 million.
Six Months Ended
Three Months EndedJune 30,
Six Months EndedJune 30,
Three Months Ended
Encana Corporation
Prepared in accordance with U.S. GAAP in US$
Notes to Condensed Consolidated Financial Statements
for the period ended June 30, 2012
Second quarter report
45

Notes to Condensed Consolidated Financial Statements (unaudited)
(All amounts in $ millions unless otherwise specified)
4. Acquisitions and Divestitures (continued)
5. Interest
2012 2011 2012 2011
Interest Expense on:Debt $ 117 $ 122 $ 238 $ 241 Other 18 2 20 2
$ 135 $ 124 $ 258 $ 243
6. Foreign Exchange (Gain) Loss, Net
2012 2011 2012 2011
Unrealized Foreign Exchange (Gain) Loss on:Translation of U.S. dollar debt issued from Canada $ 118 $ (44) $ 12 $ (171) Translation of U.S. dollar risk management contracts issued from Canada (18) 3 (2) 15
100 (41) 10 (156) Foreign Exchange on Intercompany Transactions - (8) (7) (7)
100 (49) 3 (163)
Other Monetary Revaluations and Settlements (3) 5 (8) (27) $ 97 $ (44) $ (5) $ (190)
7. Income Taxes
2012 2011 2012 2011
Current TaxCanada $ (64) $ (126) $ (188) $ (211) United States 3 (4) (23) (4) Other Countries 18 21 34 39
Total Current Tax Expense (Recovery) (43) (109) (177) (176)
Deferred TaxCanada (725) 134 (485) (11) United States (1,038) 105 (848) 145 Other Countries 109 (3) 226 (3)
Total Deferred Tax Expense (Recovery) (1,654) 236 (1,107) 131 $ (1,697) $ 127 $ (1,284) $ (45)
Encana’s interim income tax expense is determined using an estimated annual effective income tax rate applied to year-to-date net earningsbefore income tax. The estimated annual effective income tax rate is impacted by the expected annual earnings along with the tax benefits andexpenses resulting from items including tax on divestitures and related pool adjustments, international financing and the non-taxable portions ofcapital gains or losses.
Six Months Ended
Six Months Ended
June 30,
Three Months EndedJune 30,
Three Months Ended Six Months Ended
June 30,June 30,
During the six months ended June 30, 2011, the USA Division sold its Fort Lupton natural gas processing plant for proceeds of $296 million.Amounts received from these divestitures have been deducted from the Canadian and U.S. full cost pools.
Three Months Ended
In February 2012, Encana entered into a partnership agreement with Mitsubishi for the development of certain Cutbank Ridge lands in BritishColumbia. Under the agreement, Encana owns 60 percent and Mitsubishi owns 40 percent of the partnership. Mitsubishi initially investedapproximately C$1.45 billion on closing and will invest approximately C$1.45 billion, in addition to its 40 percent of the partnership’s future capitalinvestment, for a commitment period which is expected to be about five years, thereby reducing Encana’s capital funding commitments to 30percent of the total expected capital investment over that period. The transaction closed on February 24, 2012 and C$1.45 billion was received.
June 30,
June 30,
Encana Corporation
Prepared in accordance with U.S. GAAP in US$
Notes to Condensed Consolidated Financial Statements
Second quarter report for the period ended June 30, 2012
46

Notes to Condensed Consolidated Financial Statements (unaudited)(All amounts in $ millions unless otherwise specified)
8. Property, Plant and Equipment, Net
As at June 30, 2012 As at December 31, 2011
CostAccumulated
DD&A* Net CostAccumulated
DD&A* Net
Canadian DivisionProved properties 25,665$ (22,013)$ 3,652$ 27,259$ (20,906)$ 6,353$ Unproved properties 983 - 983 968 - 968 Other 170 - 170 172 - 172
26,818 (22,013) 4,805 28,399 (20,906) 7,493
USA DivisionProved properties 24,160 (19,702) 4,458 23,319 (17,294) 6,025 Unproved properties 641 - 641 458 - 458 Other 255 - 255 250 - 250
25,056 (19,702) 5,354 24,027 (17,294) 6,733
Market Optimization 230 (121) 109 223 (115) 108 Corporate & Other 2,540 (503) 2,037 2,215 (492) 1,723
54,644$ (42,339)$ 12,305$ 54,864$ (38,807)$ 16,057$ * Depreciation, depletion and amortization.
Henry Hub AECO WTI Edmonton (1)
($/MMBtu) (C$/MMBtu) ($/bbl) (C$/bbl)12-Month Average Trailing Reserves Pricing
3.15 2.76 95.67 92.20December 31, 2011 4.12 3.76 96.19 96.53June 30, 2011 4.21 3.77 89.86 87.91
(1) Light Sweet.
In 2008, Encana signed a contract for the design and construction of the Production Field Centre ("PFC") for the Deep Panuke project.As at June 30, 2012, Canadian Division property, plant and equipment and total assets include Encana's accrual to date of $612 million($607 million at December 31, 2011) related to this offshore facility as an asset under construction.
In 2007, Encana announced that it had entered into a 25-year lease agreement with a third-party developer for The Bow office project.As at June 30, 2012, Corporate and Other property, plant and equipment and total assets include Encana's accrual to date of $1,574million ($1,309 million at December 31, 2011).
Corresponding liabilities for the PFC and The Bow office project are included in other liabilities and provisions in the CondensedConsolidated Balance Sheet and are disclosed in Note 10. There is no effect on the Company's current net earnings or cash flowsrelated to the capitalization of the PFC or The Bow office project.
The Canadian Division and USA Division property, plant and equipment include internal costs directly related to exploration,development and construction activities of $239 million capitalized during the six months ended June 30, 2012 (2011 - $225 million).Costs classified as indirect administrative costs have not been capitalized as part of the capital expenditures. Included in Corporate andOther are $102 million ($112 million at December 31, 2011) of international property costs, which have been fully impaired.
For the three and six months ended June 30, 2012, the Company recognized ceiling test impairments of $748 million in the Canadiancost centre and $1,778 million in the U.S. cost centre. For the six months ended June 30, 2011, the Company recognized a ceiling testimpairment of $776 million in the Canadian cost centre. There were no ceiling test impairments recognized in the U.S. cost centreduring 2011. The impairments resulted primarily from the decline in the 12-month average trailing natural gas prices which have reducedthe Company's proved reserves volumes and values.
June 30, 2012
Natural Gas Oil & NGLs
The 12-month average trailing prices used in the ceiling test calculations were based on the benchmark prices below. The benchmarkprices were adjusted for basis differentials to determine local reference prices, transportation costs and tariffs, heat content and quality.
Encana Corporation
Prepared in accordance with U.S. GAAP in US$
Notes to Condensed Consolidated Financial Statements
for the period ended June 30, 2012
Second quarter report
47

Notes to Condensed Consolidated Financial Statements (unaudited)(All amounts in $ millions unless otherwise specified)
9. Long-Term Debt
C$ As at As atPrincipal June 30, December 31,Amount 2012 2011
Canadian Dollar Denominated Debt4.30% due March 12, 2012 $ - $ - $ 492 5.80% due January 18, 2018 750 736 737 Canadian Unsecured Notes $ 750 736 1,229
U.S. Dollar Denominated Debt4.75% due October 15, 2013 500 500 5.80% due May 1, 2014 1,000 1,000 5.90% due December 1, 2017 700 700 6.50% due May 15, 2019 500 500 3.90% due November 15, 2021 600 600 8.125% due September 15, 2030 300 300 7.20% due November 1, 2031 350 350 7.375% due November 1, 2031 500 500 6.50% due August 15, 2034 750 750 6.625% due August 15, 2037 500 500 6.50% due February 1, 2038 800 800 5.15% due November 15, 2041 400 400 U.S. Unsecured Notes 6,900 6,900
Total Principal 7,636 8,129
Increase in Value of Debt Acquired 46 46 Debt Discounts (25) (25) Current Portion of Long-Term Debt - (492)
$ 7,657 $ 7,658
10. Other Liabilities and Provisions
As at As atJune 30, December 31,
2012 2011
Asset under Construction - The Bow Office Project (See Note 8) $ 1,574 $ 1,309 Asset under Construction - Production Field Centre (See Note 8) 612 607 Unrecognized Tax Benefits 179 178 Pensions and Other Post-Employment Benefits 170 184 Other 27 23
$ 2,562 $ 2,301
Long-term debt is accounted for at amortized cost using the effective interest method of amortization. At June 30, 2012, long-term debt had a carrying value of $7,657 million and a fair value of $8,472 million (at December 31, 2011 - $8,150 millioncarrying value and a fair value of $9,215 million). The estimated fair value of long-term borrowings is categorized within level 2of the fair value hierarchy, as described in Note 14, and has been determined based on market information or by discountingfuture payments of interest and principal at estimated interest rates expected to be available to the Company at period end.
Encana Corporation
Prepared in accordance with U.S. GAAP in US$
Notes to Condensed Consolidated Financial Statements
Second quarter report for the period ended June 30, 2012
48

Notes to Condensed Consolidated Financial Statements (unaudited)
(All amounts in $ millions unless otherwise specified)
10. Other Liabilities and Provisions (continued)
The Bow Office Project
(undiscounted) 2012 2013 2014 2015 2016 Thereafter Total
Expected future lease payments 20$ 90$ 91$ 92$ 92$ 2,124$ 2,509$ Sublease recoveries (17)$ (45)$ (45)$ (45)$ (46)$ (1,051)$ (1,249)$
Production Field Centre
(undiscounted) 2012 2013 2014 2015 2016 Thereafter Total
Expected future lease payments 22$ 89$ 89$ 89$ 89$ 333$ 711$
11. Asset Retirement Obligation
As at As atJune 30, December 31,
2012 2011
Asset Retirement Obligation, Beginning of Year 921$ 820$ Liabilities Incurred 28 43 Liabilities Settled (21) (49) Liabilities Divested (33) (62) Change in Estimated Future Cash Outflows (9) 132 Accretion Expense 27 50 Foreign Currency Translation and Other (1) (13) Asset Retirement Obligation, End of Period 912$ 921$
Current Portion 49$ 46$ Long-Term Portion 863 875
912$ 921$
As described in Note 8, Encana has recognized The Bow office project as an asset under construction. The construction costshave been recognized as an asset with a corresponding liability. During 2012, Encana will assume occupancy of The Bow officepremises, at which time the Company will commence payments to the third-party developer. Over the 25 year term of theagreement, Encana will depreciate The Bow asset and reduce the accrued liability. At the conclusion of the 25 year term, theremaining asset and corresponding liability are expected to be derecognized. The total undiscounted future payments related toThe Bow office commitment are outlined below. In conjunction with the Split Transaction as described in Note 12, Encana hassubleased part of The Bow office space to Cenovus Energy Inc. ("Cenovus"). Expected sublease recoveries from Cenovus areoutlined below.
As described in Note 8, during the construction phase of the PFC, Encana has recognized an asset under construction with acorresponding liability as disclosed above. Upon commencement of operations in 2012, Encana will recognize the PFC as acapital lease. Encana's total discounted future payments related to the PFC total $564 million. The total undiscounted futurepayments related to the PFC are outlined below.
Encana Corporation
Prepared in accordance with U.S. GAAP in US$
Notes to Condensed Consolidated Financial Statements
for the period ended June 30, 2012
Second quarter report
49

Notes to Condensed Consolidated Financial Statements (unaudited)(All amounts in $ millions unless otherwise specified)
12. Share Capital
Authorized
Issued and Outstanding
(millions) Number Amount Number Amount
Common Shares Outstanding, Beginning of Year 736.3 2,354$ 736.3 2,352$ Common Shares Issued under Option Plans - - - 2 Common Shares Outstanding, End of Period 736.3 2,354$ 736.3 2,354$
Earnings Per Common Share
The following table presents the computation of net earnings per common share:
(millions, except per share amounts) 2012 2011 2012 2011
Net Earnings (Loss) (1,482)$ 383$ (1,470)$ 22$
Number of Common Shares:Weighted average common shares outstanding - basic 736.3 736.3 736.3 736.3 Effect of dilutive securities - 1.3 - 1.0 Weighted average common shares outstanding - diluted 736.3 737.6 736.3 737.3
Net Earnings (Loss) per Common ShareBasic (2.01)$ 0.52$ (2.00)$ 0.03$ Diluted (2.01)$ 0.52$ (2.00)$ 0.03$
Dividends
Encana Stock Option Plan
June 30, June 30,
During the three months ended June 30, 2012, Encana paid dividends of $0.20 per common share totaling $147 million (2011 -$0.20 per common share totaling $147 million). During the six months ended June 30, 2012, Encana paid dividends of $0.40 percommon share totaling $294 million (2011 - $0.40 per common share totaling $294 million).
Encana has stock-based compensation plans that allow employees to purchase common shares of the Company. Option exerciseprices are not less than the market value of the common shares on the date the options were granted. Options granted areexercisable at 30 percent of the number granted after one year, an additional 30 percent of the number granted after two years, arefully exercisable after three years and expire five years after the date granted.
All options outstanding as at June 30, 2012 have associated Tandem Stock Appreciation Rights ("TSARs") attached. In lieu ofexercising the option, the associated TSARs give the option holder the right to receive a cash payment equal to the excess of themarket price of Encana's common shares at the time of the exercise over the original grant price. In addition, certain stock optionsgranted are performance-based. The Performance TSARs vest and expire under the same terms and conditions as the underlyingoption. Vesting is also subject to Encana attaining prescribed performance relative to predetermined key measures. Historically,most holders of options with TSARs have elected to exercise their stock options as a Stock Appreciation Right ("SAR") in exchangefor a cash payment. See Note 13 for further information on Encana's outstanding and exercisable TSARs and Performance TSARs.
The Company is authorized to issue an unlimited number of no par value common shares, an unlimited number of first preferredshares and an unlimited number of second preferred shares.
As at As atJune 30, 2012 December 31, 2011
Three Months Ended Six Months Ended
Encana Corporation
Prepared in accordance with U.S. GAAP in US$
Notes to Condensed Consolidated Financial Statements
Second quarter report for the period ended June 30, 2012
50

Notes to Condensed Consolidated Financial Statements (unaudited)(All amounts in $ millions unless otherwise specified)
12. Share Capital (continued)
Encana Restricted Share Units ("RSUs")
Encana Share Units Held by Cenovus Employees
Canadian Dollar Denominated (C$)Number (millions)
Weighted Average Exercise
Price
Encana TSARs held by Cenovus employeesOutstanding 3.4 33.10 Exercisable 3.3 33.12
Encana Performance TSARs held by Cenovus employeesOutstanding 4.7 32.37 Exercisable 4.7 32.37
13. Compensation Plans
Encana has a number of compensation arrangements that form the Company’s long-term incentive plan awarded to eligibleemployees. They include TSARs, Performance TSARs, SARs, Performance SARs, Performance Share Units (“PSUs”), DeferredShare Units (“DSUs”), RSUs and a Restricted Cash Plan. The majority of these compensation arrangements are share-based.
Encana accounts for TSARs, Performance TSARs, SARs, Performance SARs and RSUs held by Encana employees as cash-settledshare-based payment transactions and accordingly, accrues compensation costs over the vesting period based on the fair value ofthe rights determined using the Black-Scholes-Merton model. TSARs, Performance TSARs, SARs and Performance SARs grantedare exercisable at 30 percent of the number granted after one year, an additional 30 percent of the number granted after two years,are fully exercisable after three years and expire five years after the date granted. RSUs vest three years from the date of grant,provided the employee remains actively employed with Encana on the vesting date.
Encana has a stock-based compensation plan whereby eligible employees are granted RSUs. An RSU is a conditional grant toreceive an Encana common share, or the cash equivalent, as determined by Encana, and in accordance with the terms of the RSUPlan and Grant Agreement. The value of one RSU is notionally equivalent to one Encana common share. RSUs vest three yearsfrom the date granted, provided the employee remains actively employed with Encana on the vesting date. The Company intends tosettle vested RSUs in cash on the vesting date. See Note 13 for further information on Encana's outstanding RSUs.
Cenovus employees may exercise Encana TSARs and Encana Performance TSARs in exchange for Encana common shares. Thefollowing table summarizes the Encana TSARs and Performance TSARs held by Cenovus employees as at June 30, 2012:
On November 30, 2009, Encana completed a corporate reorganization to split into two independent publicly traded energy companies- Encana Corporation and Cenovus Energy Inc. (the "Split Transaction"). In conjunction with the Split Transaction, each holder ofEncana share units disposed of their right in exchange for the grant of new Encana share units and Cenovus share units. Share unitsinclude TSARs, Performance TSARs, SARs, and Performance SARs. The terms and conditions of the share units are similar to theterms and conditions of the original share units.
With respect to the Encana share units held by Cenovus employees and the Cenovus share units held by Encana employees, bothEncana and Cenovus have agreed to reimburse each other for share units exercised for cash by their respective employees.Accordingly, for Encana share units held by Cenovus employees, Encana has recorded a payable to Cenovus employees and areceivable due from Cenovus. The payable to Cenovus employees and the receivable due from Cenovus is based on the fair valueof the Encana share units determined using the Black-Scholes-Merton model (See Notes 13 and 14). There is no impact onEncana's net earnings for the share units held by Cenovus employees. TSARs and Performance TSARs held by Cenovusemployees will expire by December 2014. No further Encana share units will be granted to Cenovus employees.
Encana Corporation
Prepared in accordance with U.S. GAAP in US$
Notes to Condensed Consolidated Financial Statements
for the period ended June 30, 2012
Second quarter report
51

Notes to Condensed Consolidated Financial Statements (unaudited)(All amounts in $ millions unless otherwise specified)
13. Compensation Plans (continued)
The amounts recognized for share-based payment transactions are as follows:
2012 2011 2012 2011Compensation Costs of Cash-Settled Transactions 7$ (87)$ 45$ 86$ Compensation Costs of Equity-Settled Transactions 3 4 5 6 Total Compensation Costs 10 (83) 50 92 Less: Total Compensation Costs Capitalized (1) 40 (15) (26) Total Compensation Expense 9$ (43)$ 35$ 66$
A) Tandem Stock Appreciation Rights
Encana TSARs Cenovus TSARs
Canadian Dollar Denominated (C$) Outstanding
Weighted Average Exercise
Price Outstanding
Weighted Average Exercise
Price
Outstanding, Beginning of Year 19,390,425 28.79 3,935,007 29.49 Granted 1,401,767 20.95 - - Exercised - SARs - - (1,430,729) 29.09 Exercised - Options - - (8,090) 26.63 Forfeited (1,054,548) 30.16 (58,393) 28.31 Expired (1,709,359) 29.93 (25,585) 28.36 Outstanding, End of Period 18,028,285 27.99 2,412,210 29.78 Exercisable, End of Period 6,967,798 32.76 2,400,910 29.79
For the six months ended June 30, 2012, Encana recorded compensation costs of $13 million related to the Encana TSARs and nocompensation costs related to the Cenovus TSARs (2011 - compensation costs of $11 million related to the Encana TSARs andcompensation costs of $13 million related to the Cenovus TSARs).
As at June 30, 2012, the fair value of the Encana share units held by Encana employees was estimated using the following weightedaverage assumptions: risk free rate of 0.97 percent, dividend yield of 3.80 percent, volatility of 35.51 percent, expected term of 1.9years and an Encana market share price of C$21.20. As at June 30, 2012, the fair value of the Cenovus share units held by Encanaemployees was estimated using the following weighted average assumptions: risk free rate of 0.97 percent, dividend yield of 2.72percent, volatility of 33.44 percent, expected term of 0.8 years and a Cenovus market share price of C$32.37. For both Encana andCenovus share units held by Encana employees, volatility was estimated using historical volatility rates.
All options to purchase common shares issued under the Encana Stock Option Plan have associated TSARs attached. In lieu ofexercising the option, the associated TSARs give the option holder the right to receive a cash payment equal to the excess of themarket price of Encana's common shares at the time of exercise over the exercise price. The TSARs vest and expire under the sameterms and conditions as the underlying option.
The following table summarizes information related to the Encana and Cenovus TSARs held by Encana employees as at June 30,2012:
Six months endedJune 30,
Of the total compensation expense recorded for the three months ended June 30, 2012, $3 million (2011 - $20 million recovery) wasincluded in operating costs and $6 million (2011 - $23 million recovery) was included in administrative expenses.
Three months endedJune 30,
Of the total compensation expense recorded for the six months ended June 30, 2012, $13 million (2011 - $30 million) was included inoperating costs and $22 million (2011 - $36 million) was included in administrative expenses.
Encana Corporation
Prepared in accordance with U.S. GAAP in US$
Notes to Condensed Consolidated Financial Statements
Second quarter report for the period ended June 30, 2012
52

Notes to Condensed Consolidated Financial Statements (unaudited)
(All amounts in $ millions unless otherwise specified)
13. Compensation Plans (continued)
B) Performance Tandem Stock Appreciation Rights
Encana Performance TSARs
Cenovus Performance TSARs
Canadian Dollar Denominated (C$) Outstanding
Weighted Average Exercise
Price Outstanding
Weighted Average Exercise
Price
Outstanding, Beginning of Year 7,879,130 31.50 5,751,358 28.60 Exercised - SARs - - (1,880,174) 28.16 Exercised - Options - - (11,452) 26.64 Forfeited (619,810) 31.31 (300,463) 26.47 Expired (2,221,132) 29.45 (31,789) 26.64 Outstanding, End of Period 5,038,188 32.43 3,527,480 29.04 Exercisable, End of Period 5,038,044 32.43 3,527,480 29.04
C) Stock Appreciation Rights
Encana SARs Cenovus SARs
Canadian Dollar Denominated (C$) Outstanding
Weighted Average Exercise
Price Outstanding
Weighted Average Exercise
Price
Outstanding, Beginning of Year 1,972,651 33.81 1,640,575 30.73 Exercised - - (419,380) 29.74 Forfeited (44,662) 33.35 (13,291) 32.61 Outstanding, End of Period 1,927,989 33.82 1,207,904 31.06 Exercisable, End of Period 1,918,390 33.84 1,203,556 31.06
During 2008 and 2009, Canadian dollar denominated SARs were granted to employees, which entitle the employee to receivea cash payment equal to the excess of the market price of Encana's common shares at the time of exercise over the exerciseprice of the right.
The following table summarizes information related to the Encana and Cenovus SARs held by Encana employees as at June30, 2012:
From 2007 to 2009, Encana granted Performance TSARs. In lieu of exercising the option, the option holder has the right toreceive a cash payment equal to the excess of the market price of Encana's common shares at the time of exercise over theexercise price. The Performance TSARs vest and expire under the same terms and conditions as the underlying option.Vesting is also subject to Encana attaining prescribed performance relative to an internal recycle ratio and predetermined keymeasures. Performance TSARs that do not vest when eligible are forfeited.
The following table summarizes information related to the Encana and Cenovus Performance TSARs held by Encanaemployees as at June 30, 2012:
For the six months ended June 30, 2012, Encana recorded compensation costs of $1 million related to the EncanaPerformance TSARs and a recovery of compensation costs of $1 million related to the Cenovus Performance TSARs (2011 -compensation costs of $2 million related to the Encana Performance TSARs and compensation costs of $23 million related tothe Cenovus Performance TSARs).
Encana Corporation
Prepared in accordance with U.S. GAAP in US$
Notes to Condensed Consolidated Financial Statements
for the period ended June 30, 2012
Second quarter report
53

Notes to Condensed Consolidated Financial Statements (unaudited)
(All amounts in $ millions unless otherwise specified)
13. Compensation Plans (continued)
C) Stock Appreciation Rights (continued)
Encana SARs
U.S. Dollar Denominated (US$) Outstanding
Weighted Average Exercise
Price
Outstanding, Beginning of Year 12,645,469 26.78 Granted 391,332 20.32 Forfeited (383,865) 28.11 Outstanding, End of Period 12,652,936 26.54 Exercisable, End of Period 3,200,939 30.90
D) Performance Stock Appreciation Rights
Encana Performance SARs
Cenovus Performance SARs
Canadian Dollar Denominated (C$) Outstanding
Weighted Average Exercise
Price Outstanding
Weighted Average Exercise
Price
Outstanding, Beginning of Year 2,710,057 32.07 2,282,061 28.88 Exercised - - (593,593) 29.22 Forfeited (164,165) 30.06 (122,394) 26.44 Outstanding, End of Period 2,545,892 32.20 1,566,074 28.95 Exercisable, End of Period 2,545,214 32.20 1,566,074 28.95
For the six months ended June 30, 2012, Encana recorded compensation costs of $1 million related to the EncanaPerformance SARs and no compensation costs related to the Cenovus Performance SARs (2011 - compensationcosts of $1 million related to the Encana Performance SARs and compensation costs of $8 million related to theCenovus Performance SARs).
Since 2010, U.S. dollar denominated SARs have been granted to eligible employees. The terms and conditions aresimilar to the Canadian dollar denominated SARs. The following table summarizes information related to U.S. dollardenominated Encana SARs held by Encana employees as at June 30, 2012:
For the six months ended June 30, 2012, Encana recorded compensation costs of $13 million related to the EncanaSARs and a recovery of compensation costs of $1 million related to the Cenovus SARs (2011 - compensation costsof $7 million related to the Encana SARs and compensation costs of $5 million related to the Cenovus SARs).
During 2008 and 2009, Encana granted Performance SARs to certain employees which entitle the employee toreceive a cash payment equal to the excess of the market price of Encana's common shares at the time of exerciseover the grant price. Performance SARs are subject to Encana attaining prescribed performance relative to aninternal recycle ratio and predetermined key measures. Performance SARs that do not vest when eligible areforfeited.
The following table summarizes information related to the Encana and Cenovus Performance SARs held by Encanaemployees as at June 30, 2012:
Encana Corporation
Prepared in accordance with U.S. GAAP in US$
Notes to Condensed Consolidated Financial Statements
Second quarter report for the period ended June 30, 2012
54

Notes to Condensed Consolidated Financial Statements (unaudited)
(All amounts in $ millions unless otherwise specified)
13. Compensation Plans (continued)
E) Performance Share Units
Canadian Dollar Denominated Outstanding
PSUs
U.S. Dollar Denominated Outstanding
PSUs
Outstanding, Beginning of Year 1,238,391 1,088,667 Granted 212,602 26,803 Deemed Eligible to Vest (427,003) (393,036) Units, in Lieu of Dividends 19,054 14,105 Forfeited (79,250) (34,540) Outstanding, End of Period 963,794 701,999
F) Deferred Share Units
Canadian Dollar DenominatedOutstanding
DSUs
Outstanding, Beginning of Year 904,853 Granted 104,517 Converted from HPR awards 38,077 Units, in Lieu of Dividends 20,189 Redeemed (60,000) Outstanding, End of Period 1,007,636
Since 2010, PSUs have been granted to eligible employees which entitle the employee to receive, upon vesting, a cashpayment equal to the value of one common share of Encana for each PSU held, depending upon the terms of the PSUplan. PSUs vest three years from the date of grant, provided the employee remains actively employed with Encana on thevesting date.
The ultimate value of the PSUs will depend upon Encana’s performance measured over the three-year period. Each year,Encana’s performance will be assessed by the Board of Directors (the "Board") to determine whether the performancecriteria have been met. Based on this assessment, up to a maximum of two times the original PSU grant may be awardedin respect of the year being measured. The respective proportion of the original PSU grant deemed eligible to vest foreach year will be valued and the notional cash value deposited to a PSU account, with payout deferred to the final vestingdate.
The following table summarizes information related to the PSUs as at June 30, 2012:
The following table summarizes information related to the DSUs as at June 30, 2012:
For the six months ended June 30, 2012, Encana recorded compensation costs of $5 million related to the outstandingDSUs (2011 - compensation costs of $4 million).
For the six months ended June 30, 2012, Encana recorded compensation costs of $4 million related to the outstandingPSUs (2011 - compensation costs of $13 million).
The Company has in place a program whereby Directors and certain key employees are issued DSUs, which vestimmediately, are equivalent in value to a common share of the Company and are settled in cash. DSUs can be redeemedin accordance with the terms of the agreement and expire on December 15th of the year following the Director’sresignation or employee’s departure.
Employees have the option to convert either 25 or 50 percent of their annual High Performance Results (“HPR”) awardinto DSUs. The number of DSUs is based on the value of the award divided by the closing value of Encana’s share priceat the end of the performance period of the HPR award.
Encana Corporation
Prepared in accordance with U.S. GAAP in US$
Notes to Condensed Consolidated Financial Statements
for the period ended June 30, 2012
Second quarter report
55

Notes to Condensed Consolidated Financial Statements (unaudited)(All amounts in $ millions unless otherwise specified)
13. Compensation Plans (continued)
G) Restricted Share Units
Canadian Dollar Denominated Outstanding
RSUs
U.S. Dollar Denominated Outstanding
RSUs
Outstanding, Beginning of Year 1,751,167 1,573,571 Granted 279,403 56,783 Units, in Lieu of Dividends 38,987 32,094 Forfeited (93,730) (59,862) Outstanding, End of Period 1,975,827 1,602,586
H) Restricted Cash Plan
I) Pensions and Other Post-Employment Benefits
2012 2011 2012 2011
Current service costs 3$ 6$ 7$ 6$ Interest cost 7 8 2 2 Expected return on plan assets (8) (8) - - Amortization of net actuarial gains and losses 8 - - - Total Defined Benefit Plan Expense 10$ 6$ 9$ 8$
2012 2011 2012 2011
Defined Benefit Plan Expense 10$ 6$ 9$ 8$ Defined Contribution Plan Expense 21 18 - - Total Benefit Plans Expense 31$ 24$ 9$ 8$
Encana's net benefit plan expense for the three months ended June 30, 2012 was $20 million (2011 - $16 million) and for the six monthsended June 30, 2012 was $40 million (2011 - $32 million). Encana's contribution to the defined benefit pension plans for the six monthsended June 30, 2012 was $23 million (2011 - $18 million). Encana's contribution to the defined contribution pension plans for the sixmonths ended June 30, 2012 was $21 million (2011 - $21 million).
OPEBPension Benefits
Since 2011, RSUs have been granted to eligible employees. An RSU is a conditional grant to receive an Encana common share, or thecash equivalent, as determined by Encana, and in accordance with the terms of the RSU Plan and Grant Agreement. The value of oneRSU is notionally equivalent to one Encana common share. RSUs vest three years from the date granted, provided the employeeremains actively employed with Encana on the vesting date. As at June 30, 2012, Encana plans to settle the RSUs in cash on thevesting date.
The following table summarizes information related to the RSUs as at June 30, 2012:
For the six months ended June 30, 2012, Encana recorded compensation costs of $15 million related to the outstanding RSUs (2011 -compensation costs of $6 million). The paid in surplus balance as at June 30, 2012 and December 31, 2011 relates to the RSUs.
In October 2011, Encana's Board approved the use of a Restricted Cash Plan as a component of the long-term incentive grant toeligible employees. The Restricted Cash Plan is a time-based conditional grant to receive cash which, in accordance with thecorresponding grant agreement, requires that the employee remain actively employed with Encana on the vesting date. The RestrictedCash Plan vests over three years with one third payable after each anniversary of the grant date. For the six months ended June 30,2012, Encana recorded compensation costs of $10 million (2011 - compensations costs of nil) relating to the Restricted Cash Plangrant.
Pension Benefits OPEB
The periodic pension and other post-employment benefits ("OPEB") expense for the six months ended June 30 is as follows:
Encana Corporation
Prepared in accordance with U.S. GAAP in US$
Notes to Condensed Consolidated Financial Statements
Second quarter report for the period ended June 30, 2012
56

Notes to Condensed Consolidated Financial Statements (unaudited)
(All amounts in $ millions unless otherwise specified)
14. Fair Value Measurements
A) Fair Value
B) Fair Value Hierarchy
Fair value is defined as the price that would be received to sell an asset or the price paid to transfer a liability in anorderly transaction between market participants at the measurement date. Valuation techniques include the market,income, and cost approach. Market approach uses information generated by market transactions involving identical orcomparable assets or liabilities; income approach converts estimated future amounts to a present value; and costapproach is based on the amount that currently would be required to replace an asset.
Recurring fair-value measurements are performed for risk management assets and liabilities and for share unitsresulting from the Split Transaction, which are discussed further in Notes 15 and 12, respectively. These items arecarried at fair value in the Condensed Consolidated Balance Sheet and are classified within the three levels of the fairvalue hierarchy in the tables below. There have been no transfers between the hierarchy levels during the period.
Inputs used in determining fair value are characterized according to a hierarchy that prioritizes those inputs based onthe degree to which they are observable. The three input levels of the fair value hierarchy are as follows:
The fair values of cash and cash equivalents, accounts receivable and accrued revenues, and accounts payable andaccrued liabilities approximate their carrying amount due to the short-term maturity of those instruments except for theamounts associated with share units issued as part of the Split Transaction, as disclosed below. The fair value of cashin reserve approximates its carrying amount due to the nature of the instrument held.
Level 1 - Inputs represent quoted prices in active markets for identical assets or liabilities, such as exchange-tradedcommodity derivatives.
Level 2 - Inputs other than quoted prices included within Level 1 that are observable for the asset or liability, eitherdirectly or indirectly, such as quoted market prices for similar assets or liabilities in active markets or other marketcorroborated inputs.
Level 3 - Inputs that are not observable from objective sources, such as forward prices supported by little or nomarket activity or internally developed estimates of future cash flows used in a present value model.
In determining fair value, the Company utilizes the most observable inputs available. If a fair value measurementreflects inputs at multiple levels within the hierarchy, the fair value measurement is characterized based on the lowestlevel of input that is significant to the fair value measurement.
Encana Corporation
Prepared in accordance with U.S. GAAP in US$
Notes to Condensed Consolidated Financial Statements
for the period ended June 30, 2012
Second quarter report
57

Notes to Condensed Consolidated Financial Statements (unaudited)
(All amounts in $ millions unless otherwise specified)
14. Fair Value Measurements (continued)
As at June 30, 2012
Level 1 Quoted
Prices in Active
Markets
Level 2 Other
Observable Inputs
Level 3 Significant
Unobservable Inputs
Total Fair Value Netting (5)
Carrying Amount
Risk ManagementRisk Management Assets (1) -$ 1,367$ 5$ 1,372$ (51)$ 1,321$ Risk Management Liabilities (1) - 64 - 64 (51) 13
Share units resulting from the Split TransactionEncana Share Units Held by Cenovus Employees
Accounts receivable and accrued revenues (2) -$ -$ 3$ 3$ -$ 3$ Accounts payable and accrued liabilities (3) - - 3 3 - 3
Cenovus Share Units Held by Encana EmployeesAccounts payable and accrued liabilities (4) - - 42 42 - 42
As at December 31, 2011
Risk ManagementRisk Management Assets (1) 1$ 2,124$ 18$ 2,143$ (96)$ 2,047$ Risk Management Liabilities (1) - 103 - 103 (96) 7
Share units resulting from the Split TransactionEncana Share Units Held by Cenovus Employees
Accounts receivable and accrued revenues (2) -$ -$ 1$ 1$ -$ 1$ Accounts payable and accrued liabilities (3) - - 1 1 - 1
Cenovus Share Units Held by Encana EmployeesAccounts payable and accrued liabilities (4) - - 83 83 - 83
(1)
(2)
(3)
(4)
(5)
C) Level 3 Fair Value Measurements
Including current portion.Receivable from Cenovus.Payable to Cenovus employees.Payable to Cenovus.
The Company’s Level 3 risk management assets and liabilities consist of natural gas options and power purchase contracts and with terms to2013 and 2017, respectively. The fair values of both the natural gas options and the power purchase contracts are based on an incomeapproach and are modeled internally using observable and unobservable inputs such as natural gas price volatilities and forward power pricesin less active markets. The unobservable inputs are obtained from third parties whenever possible and reviewed by the Company forreasonableness.
Amounts related to risk management assets and liabilities are recognized in revenues and operating costs according to their purpose.Amounts related to share units resulting from the Split Transaction are recognized in operating costs, administrative expenses and capitalizedwithin property, plant and equipment as described in Note 13.
The Company's Level 1 and Level 2 risk management assets and liabilities consist of commodity fixed price contracts and basis swaps withterms to 2015. The fair values of these contracts are based on a market approach and are estimated using quoted market prices which areeither directly or indirectly observable at the reporting date, such as broker quotes, observable trading activity and other prices published oninformation platforms and exchanges.
Netting to offset derivative assets and liabilities with the same counterparty, which are presented within the fair value hierarchy on a gross basis, even where the legalright of offset exists.
Encana Corporation
Prepared in accordance with U.S. GAAP in US$
Notes to Condensed Consolidated Financial Statements
Second quarter report for the period ended June 30, 2012
58

Notes to Condensed Consolidated Financial Statements (unaudited)(All amounts in $ millions unless otherwise specified)
14. Fair Value Measurements (continued)
C) Level 3 Fair Value Measurements (continued)
2012 2011 2012 2011
Balance, Beginning of Year 18$ (7)$ (83)$ $ (120) Total gains (losses) (19) 14 4 (57) Purchases, issuances and settlements:
Purchases - - - - Settlements 6 3 37 59
Transfers in and out of Level 3 - - - - Balance, End of Period 5$ 10$ (42)$ $ (118) Change in unrealized gains (losses) related to
assets and liabilities held at end of period (9)$ 15$ 14$ $ 34
As at June 30,
2012
As at December 31,
2011
Risk Management - Natural Gas Options Option Model 33.5% - 47.7% -
Risk Management - PowerDiscounted Cash Flow $ 64.75 - $77.13 $71.50 - $77.55
Share units resulting from the Split Transaction Option Model 33.44% 32.48%
15. Financial Instruments and Risk Management
A) Financial Instruments
B) Risk Management Assets and Liabilities
Unrealized Risk Management Position As at As atJune 30, December 31,
2012 2011
Risk ManagementCurrent asset 1,182$ $ 1,806 Long-term asset 139 241
1,321 2,047
Risk ManagementCurrent liability 1 1 Long-term liability 12 6
13 7 Net Risk Management Asset 1,308$ $ 2,040
Share Units Resulting from Split TransactionRisk Management
A summary of changes in Level 3 fair value measurements for the six months ended June 30 is presented below:
Quantitative information about unobservable inputs used in Level 3 fair value measurements is presented below:
Valuation Technique Unobservable Input
Forward prices ($/Megawatt Hour)
Encana's financial assets and liabilities are recognized in cash and cash equivalents, accounts receivable and accrued revenues, cash inreserve, accounts payable and accrued liabilities, risk management assets and liabilities and long-term debt.
Risk management assets and liabilities arise from the use of derivative financial instruments and are measured at fair value. See Note 14 for adiscussion of fair value measurements.
Price Volatility
Cenovus share unit volatility
A five percent increase or decrease in natural gas price volatility would cause a corresponding $1 million (nil at December 31, 2011) decrease orincrease to net risk management assets. A 10 percent increase or decrease in estimated forward power prices would cause a corresponding $5million ($6 million at December 31, 2011) increase or decrease to net risk management assets. A five percent increase or decrease in Cenovusshare unit estimated volatility would cause a corresponding $4 million ($6 million at December 31, 2011) increase or decrease to accountspayable and accrued liabilities.
Encana Corporation
Prepared in accordance with U.S. GAAP in US$
Notes to Condensed Consolidated Financial Statements
for the period ended June 30, 2012
Second quarter report
59

Notes to Condensed Consolidated Financial Statements (unaudited)
(All amounts in $ millions unless otherwise specified)
15. Financial Instruments and Risk Management (continued)
B) Risk Management Assets and Liabilities (continued)
Summary of Unrealized Risk Management Positions - By Product
As at June 30, 2012 As at December 31, 2011Risk Management Risk Management
Asset Liability Net Asset Liability Net
Commodity PricesNatural gas 1,313$ 9$ 1,304$ 2,032$ 7$ 2,025$ Crude Oil - 4 (4) - - - Power 8 - 8 15 - 15
Total Fair Value 1,321$ 13$ 1,308$ 2,047$ 7$ 2,040$
Commodity Price Positions as at June 30, 2012
Term Average Price Fair Value
Natural Gas ContractsFixed Price Contracts
NYMEX Fixed Price 1,955 MMcf/d 2012 5.79 US$/Mcf 1,011$ NYMEX Fixed Price 505 MMcf/d 2013 5.24 US$/Mcf 301
Options 2012-2013 (3)
Basis Contracts (1)
Canada 2012 12 United States 2012 (4) Canada and United States 2013-2015 (13)
Natural Gas Fair Value Position 1,304 Crude Oil ContractsBasis Positions (4)
Power Purchase ContractsFair Value Position 8 Total Fair Value 1,308$ (1)
Earnings Impact of Realized and Unrealized Gains (Losses) on Risk Management Positions
2012 2011 2012 2011
Revenues, Net of Royalties 640$ 200$ 1,169$ 404$ Operating Expenses and Other (4) (4) (6) (3) Gain on Risk Management 636$ 196$ 1,163$ 401$
2012 2011 2012 2011
Revenues, Net of Royalties (795)$ 27$ (725)$ (124)$ Operating Expenses and Other - 2 (7) 20 Gain (Loss) on Risk Management (795)$ 29$ (732)$ (104)$
Notional Volumes
Encana has entered into swaps to protect against widening natural gas price differentials between production areas, including Canada, the U.S. Rockies and Texas, andvarious sales points. These basis swaps are priced using both fixed price differentials and differentials determined as a percentage of NYMEX.
Realized Gain (Loss) Realized Gain (Loss)Three Months Ended Six Months Ended
June 30, June 30,
June 30, June 30,
Unrealized Gain (Loss) Unrealized Gain (Loss)Three Months Ended Six Months Ended
Encana Corporation
Prepared in accordance with U.S. GAAP in US$
Notes to Condensed Consolidated Financial Statements
Second quarter report for the period ended June 30, 2012
60

Notes to Condensed Consolidated Financial Statements (unaudited)(All amounts in $ millions unless otherwise specified)
15. Financial Instruments and Risk Management (continued)
B) Risk Management Assets and Liabilities (continued)
Reconciliation of Unrealized Risk Management Positions from January 1 to June 30
2011
Fair Value
Total Unrealized
Gain (Loss)
Total Unrealized
Gain (Loss)
Fair Value of Contracts, Beginning of Year 2,040$ Change in Fair Value of Contracts in Place at Beginning of Year
and Contracts Entered into During the Period 431 431$ 297$ Fair Value of Contracts Realized During the Period (1,163) (1,163) (401) Fair Value of Contracts, End of Period 1,308$ (732)$ (104)$
C) Risks Associated with Financial Assets and Liabilities
Commodity Price Risk
10% Price Increase
10% Price Decrease
10% Price Increase
10% Price Decrease
Natural gas price (190)$ 190$ (571)$ 571$ Crude oil price 7 (7) - - Power price 5 (5) 5 (5)
Credit Risk
20112012
Crude Oil - To help protect against widening crude oil price differentials between North American and world prices, Encana has entered intobasis swaps.
2012
The Company is exposed to financial risks arising from its financial assets and liabilities. Financial risks include market risks (such ascommodity prices, foreign exchange and interest rates), credit risk and liquidity risk. The fair value or future cash flows of financial assets orliabilities may fluctuate due to movement in market prices and the exposure to credit and liquidity risks.
As at June 30, 2012, cash equivalents include high-grade, short-term securities, placed primarily with financial institutions and companieswith strong investment grade ratings. Any foreign currency agreements entered into are with major financial institutions in Canada and theU.S. or with counterparties having investment grade credit ratings.
Commodity price risk arises from the effect that fluctuations of future commodity prices may have on the fair value or future cash flows offinancial assets and liabilities. To partially mitigate exposure to commodity price risk, the Company has entered into various derivativefinancial instruments. The use of these derivative instruments is governed under formal policies and is subject to limits established by theBoard. The Company's policy is to not use derivative financial instruments for speculative purposes.
Natural Gas - To partially mitigate the natural gas commodity price risk, the Company uses NYMEX swaps and options. To help protectagainst widening natural gas price differentials in various production areas, Encana has entered into basis swaps to manage the pricedifferentials between these production areas and various sales points.
Power - The Company has entered into Canadian dollar denominated derivative contracts to manage its electricity consumption costs.
Credit risk arises from the potential that the Company may incur a loss if a counterparty to a financial instrument fails to meet its obligation inaccordance with agreed terms. This credit risk exposure is mitigated through the use of Board-approved credit policies governing theCompany's credit portfolio including credit practices that limit transactions according to counterparties' credit quality. Mitigation strategiesmay include master netting arrangements, requesting collateral and/or transacting credit derivatives. The Company executes commodityderivative financial instruments under master agreements that have netting provisions that provide for offsetting payables againstreceivables. As at June 30, 2012, the Company had no significant collateral balances posted and there were no credit derivatives in place.
The table below summarizes the sensitivity of the fair value of the Company's risk management positions to fluctuations in commodityprices, with all other variables held constant. The Company has used a 10 percent variability to assess the potential impact of commodityprice changes. Fluctuations in commodity prices could have resulted in unrealized gains (losses) impacting pre-tax net earnings as at June30 as follows:
Encana Corporation
Prepared in accordance with U.S. GAAP in US$
Notes to Condensed Consolidated Financial Statements
for the period ended June 30, 2012
Second quarter report
61

Notes to Condensed Consolidated Financial Statements (unaudited)(All amounts in $ millions unless otherwise specified)
15. Financial Instruments and Risk Management (continued)
C) Risks Associated with Financial Assets and Liabilities (continued)
Credit Risk (continued)
Liquidity Risk
Less Than 1 Year 1 - 3 Years 4 - 5 Years 6 - 9 Years Thereafter Total
Accounts Payable and Accrued Liabilities 1,794$ -$ -$ -$ -$ 1,794$ Risk Management Liabilities 1 9 2 1 - 13 Long-Term Debt (1) 463 2,331 761 3,122 7,606 14,283 (1) Principal and interest.
Foreign Exchange Risk
Foreign exchange risk arises from changes in foreign exchange rates that may affect the fair value or future cash flows of theCompany’s financial assets or liabilities. As Encana operates primarily in North America, fluctuations in the exchange rate between theU.S. and Canadian dollars can have a significant effect on the Company's reported results. Encana's functional currency is Canadiandollars; however, the Company reports its results in U.S. dollars as most of its revenue is closely tied to the U.S. dollar and to facilitate amore direct comparison to other North American oil and gas companies. As the effects of foreign exchange fluctuations are embeddedin the Company's results, the total effect of foreign exchange fluctuations is not separately identifiable.
A substantial portion of the Company’s accounts receivable are with customers in the oil and gas industry and are subject to normalindustry credit risks. As at June 30, 2012, approximately 94 percent (95 percent at December 31, 2011) of Encana's accountsreceivable and financial derivative credit exposures are with investment grade counterparties.
As at June 30, 2012, Encana has four counterparties (2011 - three counterparties) whose net settlement position individually account formore than 10 percent of the fair value of the outstanding in-the-money net risk management contracts by counterparty. As at June 30,2012, these counterparties accounted for 25 percent, 15 percent, 14 percent and 12 percent of the fair value of the outstanding in-the-money net risk management contracts.
The Company has access to cash equivalents and a wide range of funding alternatives at competitive rates through commercial paper,committed revolving bank credit facilities and debt capital markets. As at June 30, 2012, Encana had available unused committedrevolving bank credit facilities totaling $4.9 billion which include C$4.0 billion ($3.9 billion) on a revolving bank credit facility for Encanaand $999 million on a revolving bank credit facility for a U.S. subsidiary that remains committed through October 2015.
Liquidity risk is the risk the Company will encounter difficulties in meeting a demand to fund its financial liabilities as they come due. TheCompany manages liquidity risk using cash and debt management programs.
Encana also had unused capacity under two shelf prospectuses for up to $6.0 billion, the availability of which is dependent on marketconditions, to issue up to C$2.0 billion ($2.0 billion) of debt securities in Canada and up to $4.0 billion in the U.S. These shelfprospectuses expire in June 2013 and June 2014, respectively. The Company believes it has sufficient funding through the use ofthese facilities to meet foreseeable borrowing requirements.
The timing of cash outflows relating to financial liabilities are outlined in the table below:
Encana's long-term debt obligations were $14.3 billion at June 30, 2012. Further information on long-term debt is contained in Note 9.
The Company minimizes its liquidity risk by managing its capital structure. The Company’s capital structure consists of shareholders’equity plus long-term debt, including the current portion. The Company’s objectives when managing its capital structure are to maintainfinancial flexibility to preserve Encana’s access to capital markets and its ability to meet financial obligations and finance internallygenerated growth, as well as potential acquisitions. To manage the capital structure, the Company may adjust capital spending, adjustdividends paid to shareholders, purchase shares for cancellation pursuant to normal course issuer bids, issue new shares, issue newdebt or repay existing debt.
Encana Corporation
Prepared in accordance with U.S. GAAP in US$
Notes to Condensed Consolidated Financial Statements
Second quarter report for the period ended June 30, 2012
62

Notes to Condensed Consolidated Financial Statements (unaudited)
(All amounts in $ millions unless otherwise specified)
15. Financial Instruments and Risk Management (continued)
C) Risks Associated with Financial Assets and Liabilities (continued)
Foreign Exchange Risk (continued)
Interest Rate Risk
16. Commitments and Contingencies
Commitments
The following table outlines the Company's commitments as at June 30, 2012:
(undiscounted) 2012 2013 2014 2015 2016 Thereafter Total
Transportation and Processing 430$ 876$ 922$ 922$ 818$ 5,552$ 9,520$ Drilling and Field Services 300 198 118 85 54 71 826 Operating Leases 28 50 47 43 37 102 307 Capital Commitments 85 34 7 7 8 80 221 Total 843$ 1,158$ 1,094$ 1,057$ 917$ 5,805$ 10,874$
Contingencies
The Company is involved in various legal claims and actions arising in the ordinary course of operations. Although the outcome of theseclaims cannot be predicted with certainty, the Company does not expect these matters to have a material adverse effect on Encana’s financialposition, cash flows or results of operations. If an unfavorable outcome were to occur, there exists the possibility of a material adverse impacton the Company's consolidated net earnings or loss in the period in which the outcome is determined. Accruals for litigation and claims arerecognized if the Company determines that the loss is probable and the amount can be reasonably estimated. The Company believes it hasmade adequate provision for such legal claims.
Contractual obligations arising from long-term debt, asset retirement obligations, The Bow office project and the PFC are recognized on theCompany’s Condensed Consolidated Balance Sheet. Further information related to these items can be found in Notes 9, 10 and 11.
In addition to the commitments disclosed above, Encana has made commitments related to its risk management program and the Company’sobligation to fund its defined benefit pension and other post-employment benefit plans. Further information related to the Company's riskmanagement program can be found in Note 15.
To mitigate the exposure to the fluctuating U.S./Canadian dollar exchange rate, Encana maintains a mix of both U.S. dollar and Canadiandollar debt and may also enter into foreign exchange derivatives. At June 30, 2012, Encana had $5.9 billion in U.S. dollar debt issued fromCanada that was subject to foreign exchange exposure ($5.9 billion at December 31, 2011) and $1.7 billion in debt that was not subject toforeign exchange exposure ($2.2 billion at December 31, 2011). There were no foreign exchange derivatives outstanding as at June 30,2012.
Interest rate risk arises from changes in market interest rates that may affect the fair value or future cash flows from the Company’s financialassets or liabilities. The Company may partially mitigate its exposure to interest rate changes by holding a mix of both fixed and floating ratedebt and may also enter into interest rate derivatives to partially mitigate effects of fluctuations in market interest rates. There were no interestrate derivatives outstanding as at June 30, 2012.
At June 30, 2012, the Company had no floating rate debt. Accordingly, the sensitivity in net earnings for each one percent change in interestrates on floating rate debt was nil (2011 - $6 million).
Encana's foreign exchange (gain) loss primarily includes unrealized foreign exchange gains and losses on the translation of U.S. dollardenominated debt issued from Canada, unrealized foreign exchange gains and losses on the translation of U.S. dollar denominated riskmanagement assets and liabilities held in Canada and foreign exchange gains and losses on U.S. dollar denominated cash and short-terminvestments held in Canada. A $0.01 change in the U.S. to Canadian dollar exchange rate would have resulted in a $50 million change inforeign exchange (gain) loss at June 30, 2012 (2011 - $53 million). The Company may enter into forward sales or purchases of U.S. orCanadian dollars to mitigate foreign exchange risk. There were no forward sales or purchases outstanding as at June 30, 2012.
Expected Future Payments
Encana Corporation
Prepared in accordance with U.S. GAAP in US$
Notes to Condensed Consolidated Financial Statements
for the period ended June 30, 2012
Second quarter report
63

(unaudited)
Financial Results($ millions, except per share amounts)
Year-to-date Q2
1,815 794 2.47 1.08
438 198 0.59 0.27
(1,470) (1,482) (2.00) (2.01)
46.6%25.0%
(US$ per C$1)0.994 0.990 0.981 0.981
Cash Flow Summary
1,248 631
(46) (26) (509) (134)
(12) (3) 1,815 794
Operating Earnings Summary
(1,470) (1,482)
(502) (547) (1,695) (1,695)
(4) (90) 293 652 438 198
Year-to-date Q2
736.3 736.3736.3 736.3
(millions)
2012
2012
Encana Corporation
Supplemental Information (prepared in US$)
Second quarter report for the period ended June 30, 2012
64

(unaudited)
Financial Metrics 2012 Year-to-
date
1.8x
1.9x
34%
Net Capital Investment
($ millions) Year-to-
date Q2
838 323 995 432
1,833 755 7 1
77 41 1,917 797
109 53 219 122
(2,504) (105) (190) (76)
(2) (2) (2,368) (8)
(451) 789
Production Volumes - After Royalties
(average daily) Year-to-
date Q2
(MMcf/d)1,365 1,237 1,672 1,565 3,037 2,802
(Mbbls/d)18.1 16.9 10.6 11.3 28.7 28.2
2012
2012
Encana Corporation
Supplemental Information (prepared in US$)
for the period ended June 30, 2012
65
Second quarter report

(unaudited)
Operating Statistics - After RoyaltiesPer-unit Results, Excluding the Impact of Realized Financial Hedging
Year-to-date Q2
($/Mcf)
2.33 2.05 - 0.01
1.12 1.31 0.69 0.71 0.52 0.02
($/Mcf)
2.73 2.41 0.06 0.03 1.05 1.04 0.59 0.56 1.03 0.78
($/Mcf)
2.55 2.25 0.03 0.02 1.09 1.16 0.64 0.63 0.79 0.44
($/bbl)
78.33 76.47 1.85 1.28 1.06 1.18 1.40 1.68
74.02 72.33 ($/bbl)
88.44 86.11 7.71 7.17 0.14 0.09 4.13 5.52
76.46 73.33 ($/bbl)
82.08 80.32 4.03 3.63 0.72 0.75 2.41 3.21
74.92 72.73
Impact of Realized Financial Hedging
Year-to-date Q2
($/Mcf)
2.10 2.61 2.16 2.49 2.13 2.54
2012
2012
Encana Corporation
Supplemental Information (prepared in US$)
Second quarter report for the period ended June 30, 2012
66

(unaudited)
Operating Statistics - After Royalties Per-unit Results, Including the Impact of Realized Financial Hedging
Year-to-date Q2
($/Mcf)4.43 4.66 4.89 4.90 4.68 4.79
($/Mcf)2.62 2.63 3.19 3.27 2.92 2.98
($/bbl) 78.33 76.47 88.44 86.11 82.08 80.32
($/bbl)74.02 72.33 76.46 73.33 74.92 72.73
2012
Encana Corporation
Supplemental Information (prepared in US$)
for the period ended June 30, 2012
67
Second quarter report

(unaudited)
Results by Key Area
2012 2012 2012 2012
142 0.3 47 - 377 1.5 35 7
99 2.5 52 7 263 3.4 63 9 353 9.0 14 -
1,234 16.7 211 23 3 0.2 112 2
1,237 16.9 323 25
426 4.0 25 7470 2.0 112 35158 - 16 - 418 0.1 90 4
1,472 6.1 243 4693 5.2 189 14
1,565 11.3 432 60
2012 2012 2012 2012
187 0.5 91 6 426 1.3 115 14 109 2.6 109 13 245 4.5 185 20 397 9.1 77 83
1,364 18.0 577 136 1 0.1 261 3
1,365 18.1 838 139
437 4.1 74 21479 1.8 218 74179 0.1 45 3481 0.1 275 16
1,576 6.1 612 11496 4.5 383 39
1,672 10.6 995 153
(MMcf/d) (Mbbls/d) ($ millions) (net wells drilled)
Three months ended June 30
Six months ended June 30 Natural Gas Production
Oil & NGLs Production Capital Drilling Activity
Natural Gas Production
Oil & NGLs Production Capital
(MMcf/d) (Mbbls/d) ($ millions) Drilling Activity (net wells drilled)
Encana Corporation
Supplemental Information (prepared in US$)
Second quarter report for the period ended June 30, 2012
68


Encana Corporation FOR FURTHER INFORMATION:
Investor contact:
Ryder McRitchie Lorna Klose Vice-President, Investor Relations Manager, Investor Relations (403) 645-2007 (403) 645-6977
Media contact:
Jay Averill Manager, Media Relations (403) 645-4747
Encana Corporation 1800, 855 – 2nd Street SW P.O. Box 2850 Calgary, Alberta, Canada T2P 2S5 Phone: (403) 645-2000 Fax: (403) 645-3400 www.encana.com